Crypto_shark
3064ចូលចិត្ត (Like)0ភាគហ៊ុន149អ្នកគាំទ្រ157តាមដាន
$GOLD BELIEVER $SOL MAN BETTER DAYS AHEAD
$GOLD BELIEVER $SOL MAN BETTER DAYS AHEAD
: Gold Is Bouncing Hard
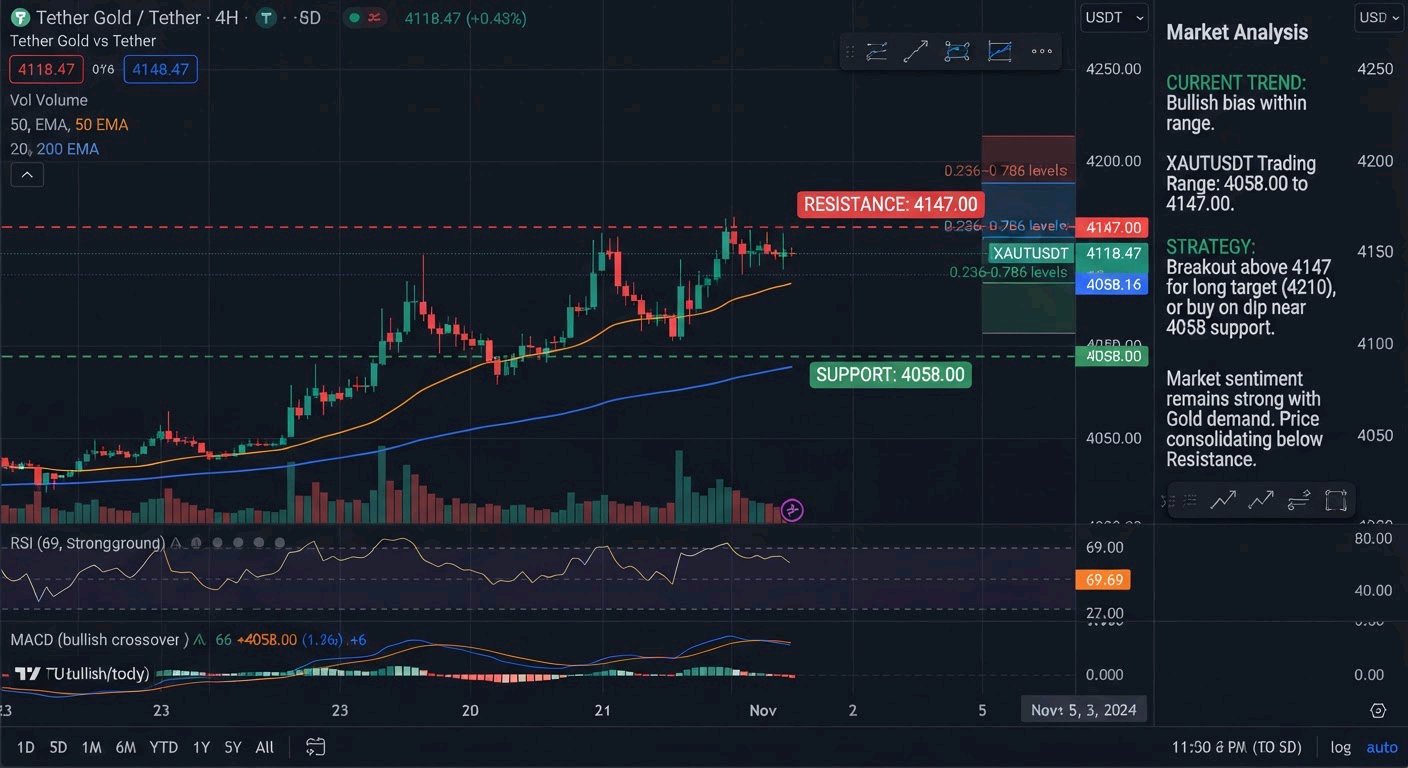
$XAUTUSDT : , But I'm Not Chasing This Move. I've been watching XAUT, and after today's jump I don't think this is the moment to FOMO in. Here's why. Gold had a strong session on a weaker dollar and falling yields after the US midterms. A move like that feels great, but a one-day rally is not a trend change. Price is still sitting inside a broader range, and the recent downtrend from the January highs hasn't been invalidated. The levels I'm keeping on my screen (based on spot gold, which XAUT tracks closely): $4,058: Immediate support. Buyers need to defend this. $4,000: Key psychological level and the next major support. $4,147: First resistance to reclaim (today's high). $4,217: Stronger recovery level above that. What would change my view? First, I want to see buyers hold support on a pullback instead of just riding the spike. Then I want a higher low on the H1, followed by a clean close above $4,147 with volume. If price loses $4,058 and can't reclaim it, I'm not rushing into a long. $4,000 becomes the area where buyers have to prove themselves. One more thing: tomorrow's Nonfarm Payrolls could move the dollar and yields fast, and a possible Fed hike in December is still a risk for gold. Volatility is coming, so I'd rather wait than guess. My plan is simple: no confirmation, no trade. I'd rather miss the first part of the move than buy the top and become exit liquidity. What are you watching here: a breakout above $4,147, or a retest of support first? #ByXIMPACT $XAUTUSDT#ByXIMPACT
SOLUSDT
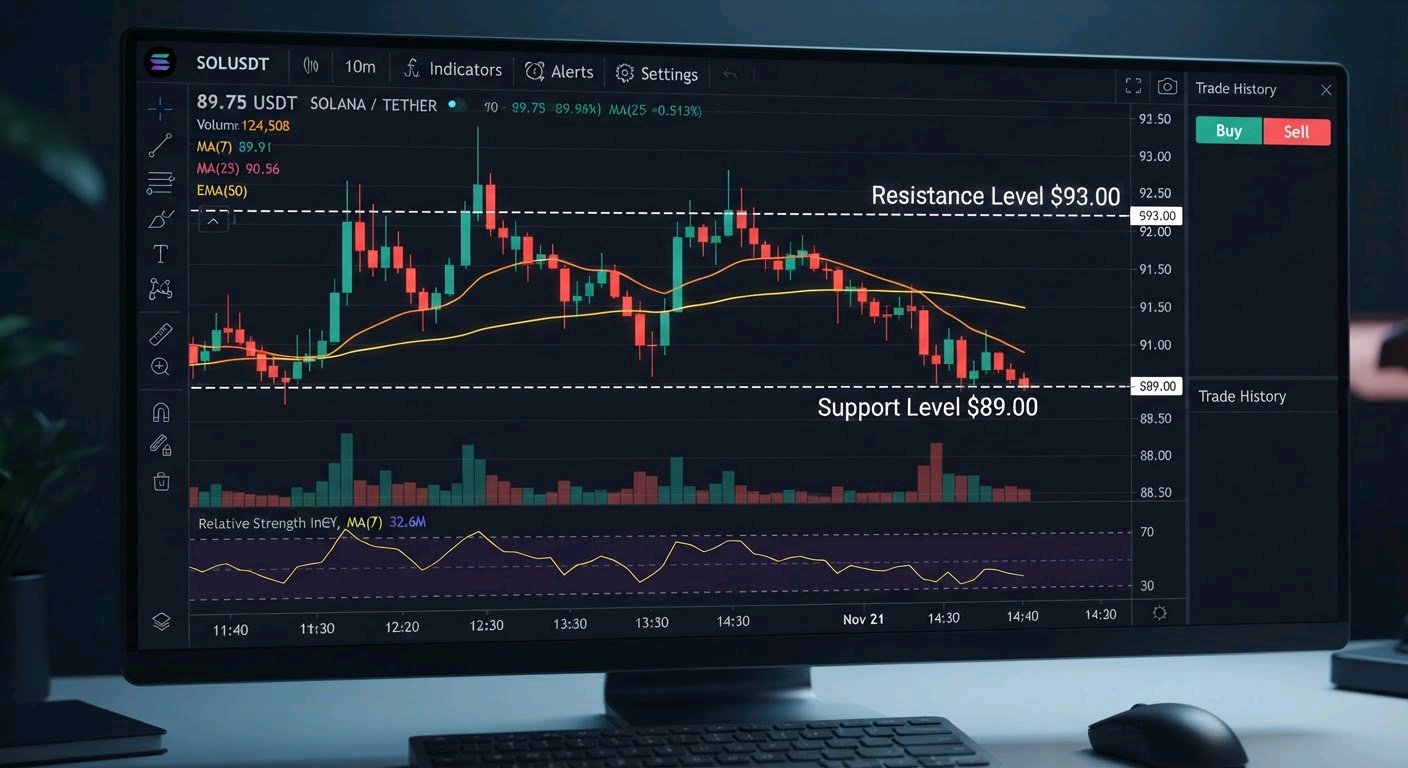
| Solana Price is trading around the $89–$91 region following a sharp decline, with sellers maintaining control of the short-term market structure. Despite oversold momentum, buyers have yet to confirm a meaningful trend reversal. 📊 Market Structure: The daily chart continues to show lower highs and lower lows, reflecting persistent selling pressure. RSI is hovering around 30, suggesting weakened momentum and the possibility of a short-term relief bounce. 🎯 Key Levels to Watch: Support 1: $89 Support 2: $86 Support 3: $81 Resistance 1: $93 Resistance 2: $98 Resistance 3: $100 🧭 Potential Market Setup: Direction: WAIT Entry: Confirmation needed TP1: Unclear TP2: Unclear SL / Invalidation: Unclear ⚠️ Confirmation: A sustained move above $93 could indicate improving buying pressure, while reclaiming $98 would provide stronger evidence of recovery. However, a decisive break below $89 could expose SOL to further downside toward $86 and potentially $81. ❌ Invalidation: A strong daily recovery above $98 would challenge the current bearish structure. 🧠 Market Takeaway: Solana is approaching an important decision zone. Oversold conditions may create opportunities for a relief bounce, but confirmation is still needed before calling a trend reversal. Patience is key. Watch the levels, follow price action, and avoid reacting emotionally to volatility. $SOLUSDT #Solana #CryptoAnalysis#ByXIMPACT
BTCUSDT
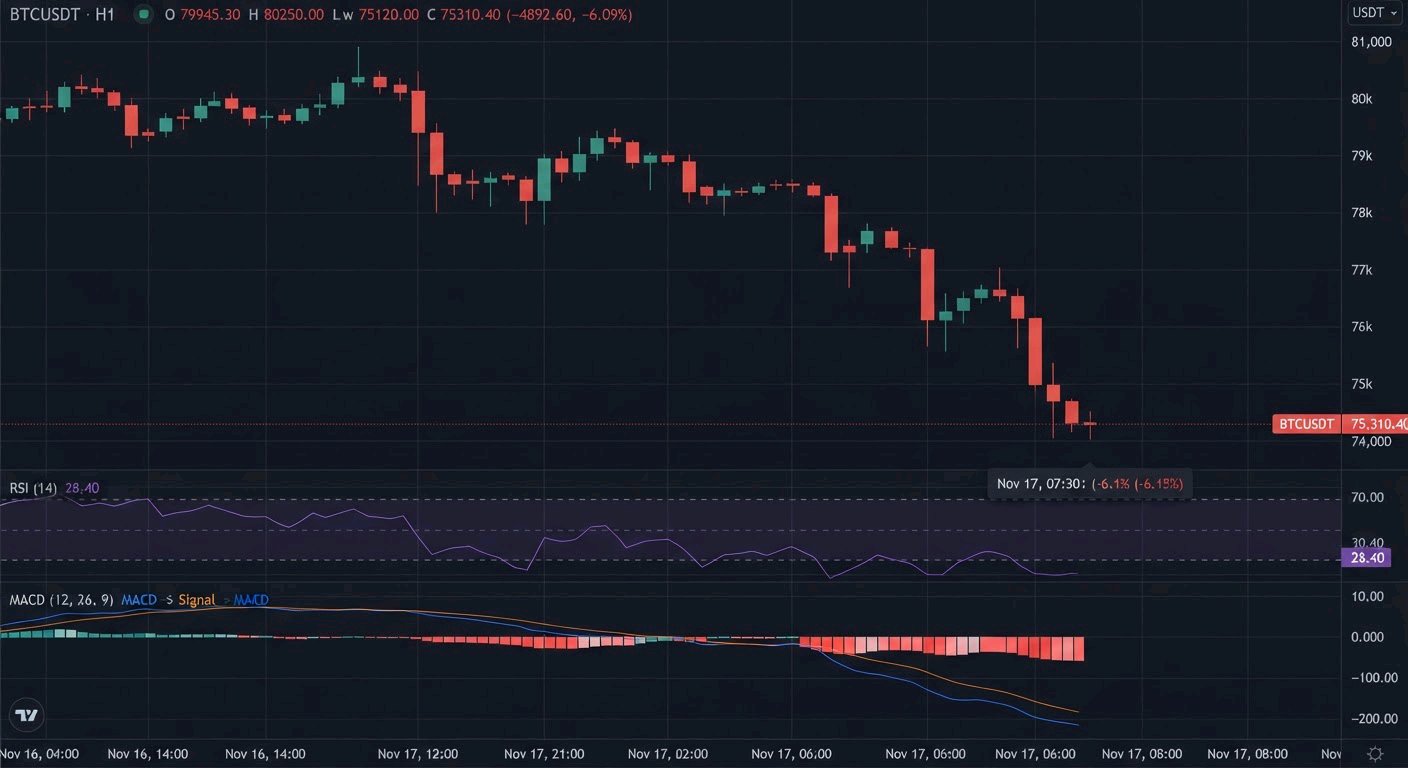
📉 Bearish $BTCUSDT BTC dumped hard from the $80.9k area, now sitting around $75.8k–$76k after a clean -5%+ day. Key levels I’m watching: • Support: $75.5k–$75.2k (today’s low zone) • Next major: $73.5k if it breaks RSI still weak, MACD bearish on higher timeframes. Bounce attempts keep getting sold. No clear catalyst for a strong reversal yet — just watching for volume and whether $75.5k holds. NFA. DYOR. $BTCUSDT #ByXIMPACT#IMPACTbyTrade
Fundamental Analysis🔍 Market Overview
ZAMAUSDT | Market Watch Zama is building around one of blockchain's biggest challenges: privacy. Its Fully Homomorphic Encryption (FHE) technology allows smart contracts to process encrypted data without exposing sensitive information. 📊 What’s Worth Watching? Fundamentals: Growing interest in confidential DeFi. Adoption: Zama's ecosystem continues expanding, including its Zerion Wallet integration. TVL: Approximately $118.63M as of November 5. Market Sentiment: ZAMA remains an interesting project to watch as privacy-focused blockchain infrastructure gains attention. Key Things to Watch Whether buyers can regain market momentum. Trading volume and price reaction around important support and resistance zones. Whether ecosystem growth translates into stronger market demand. 💡 My Take ZAMA has an interesting narrative beyond short-term price movements. Privacy, confidential transactions, and institutional DeFi could become important themes in the blockchain space. The big question is whether market demand will catch up with its growing ecosystem. 👀 Are you bullish or bearish on ZAMAUSDT? Drop your thoughts below!$ZAMAUSDT #IMPACTbyTrade

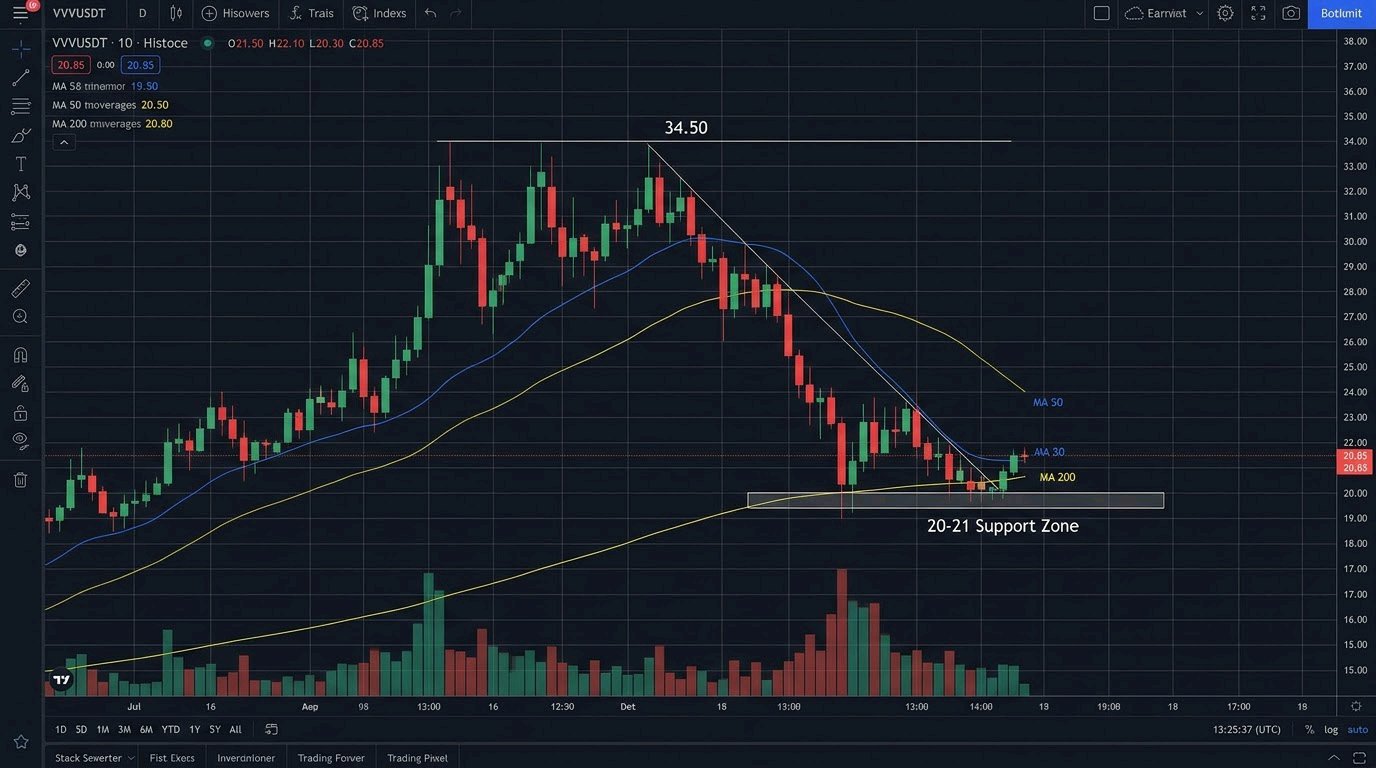
VVV is correcting
after a strong run, but the derivatives market and fundamentals present a more nuanced picture. Price has pulled back sharply while open interest remains elevated and funding has flipped around neutral-to-mildly positive. The bigger question is whether the recent decline is healthy digestion of the September highs or early signs that leveraged positioning and slowing momentum are catching up with real usage growth. VVV recently traded near the $20.50–$21.50 area (roughly $20.6 on some perp venues), with market capitalization around $1.01B–$1.05B and 24-hour trading volume in the $45M–$85M range across trackers. The latest 24-hour range has spanned approximately $19.9–$23.9, while the seven-day move is down around 9–17% and the 30-day decline sits near 23–28%. Immediate support sits in the $20.00–$20.50 zone, with stronger support lower near the $19.50–$20.00 area. Resistance begins around $22.00–$23.00, followed by the $24–$25 zone and the September all-time high near $34.53. Venice.ai is a privacy-first generative AI platform (text, image, code inference) built on Base by ShapeShift founder Erik Voorhees. Users and agents stake VVV for proportional access to compute capacity (measured in Venice Compute Units / Diem credits) without per-request fees, while the platform generates revenue from subscriptions and API credits. A portion of that revenue funds programmatic and discretionary buy-and-burn activity. October saw record monthly buyback-and-burn volume exceeding $1M, and the project has already permanently removed a large share of original supply (reports cite roughly 40%+ in earlier large burns plus ongoing activity). Annual emissions have been cut stepwise and now sit at a much lower rate (around 2M VVV per year). Staking also provides access to Venice Pro tiers. The usage and revenue picture is more constructive than many pure narrative AI tokens. Founder comments and on-chain trackers point to annualized revenue above $150M, with visible subscription and credit burns feeding token demand. Staked VVV represents a meaningful share of market cap in some snapshots. However, new issuance still exceeds current burn rates in absolute terms, so net deflation remains a forward goal rather than a present reality. Token utility is real (access + yield + burns), but value accrual depends on sustained growth in paid usage outpacing emissions and any future unlocks. Derivatives remain the near-term risk factor. Aggregate perpetual open interest has hovered in the $100M–$190M range (Hyperliquid often the largest venue), with 24-hour OI changes sometimes positive even as price fell. Funding rates have been mixed—mildly positive on several major venues (longs paying shorts at low single-digit annualized rates) and occasionally negative on others. Liquidations have been modest relative to OI in recent sessions, but elevated positioning after a multi-month advance leaves room for sharper moves if spot demand weakens. Supply dynamics: circulating supply is approximately 49M VVV against a total supply near 81M (no hard max). Fully diluted valuation sits around $1.7B. The gap between circulating market cap and FDV, combined with residual vesting and emissions, means future supply overhang remains a consideration even with aggressive burns. Key figures $20.50–$21.50 — Recent price area $22.00–$23.00 — Immediate resistance $20.00–$20.50 — First support zone ~$19.90 — Recent 24H low area $24–$25 / $34.53 — Next upside / ATH resistance ~$1.01B–$1.05B — Market capitalization $45M–$85M — Reported 24H trading volume ~$100M–$190M — Perpetual open interest Mildly positive / mixed — Recent funding ~49M / ~81M — Circulating / total supply Bullish confirmation: Reclaim and hold above $22.00–$23.00 with rising spot volume and continued strength in on-chain burn/revenue metrics. That would reopen the path toward $24–$25 and eventually a retest of the September highs if real demand accelerates. Bearish confirmation: Lose the $20.00–$20.50 zone and fail to recover it quickly. That would open $19.50 and potentially lower levels if leveraged longs unwind while broader risk appetite softens. Venice has real product-market fit in privacy-focused AI inference, transparent revenue-to-burn mechanics, and a credible founder. The recent pullback is occurring against still-elevated derivatives positioning. The decisive signal will be whether spot demand and ongoing burns can stabilize price above the $20–$21 area while open interest cools and paid usage continues to scale. $VVVUSDT #IMPACTbyTrade#IMPACTbyTrade
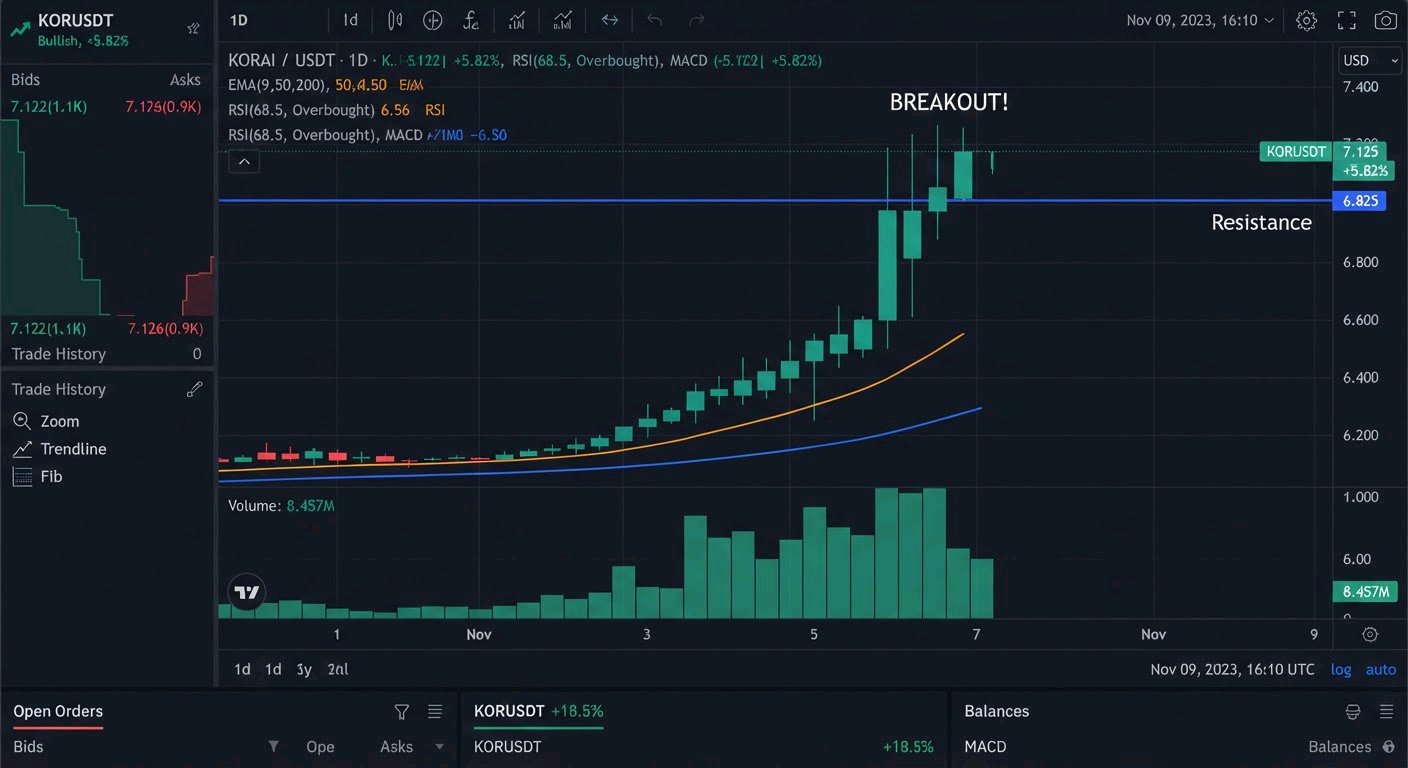
KOR BIG MOVE COMING
$KORUSDT is attracting attention as market momentum increases. Recent market snapshots show significant price volatility, making this a pair worth watching closely. 📈 Technical Outlook: Bulls are watching for sustained buying pressure. Trading volume will be important for confirming momentum. A confirmed breakout could strengthen the bullish outlook. Failure to hold support could trigger a pullback. 🎯 What to Watch: A strong move backed by increasing volume could signal further upside potential. However, volatility remains a major factor. ⚠️ Don't confuse momentum with confirmation. Watch the price action carefully. 👀 Can KORUSDT surprise the market with another major move? Drop your thoughts below! 👇#WSOT2026
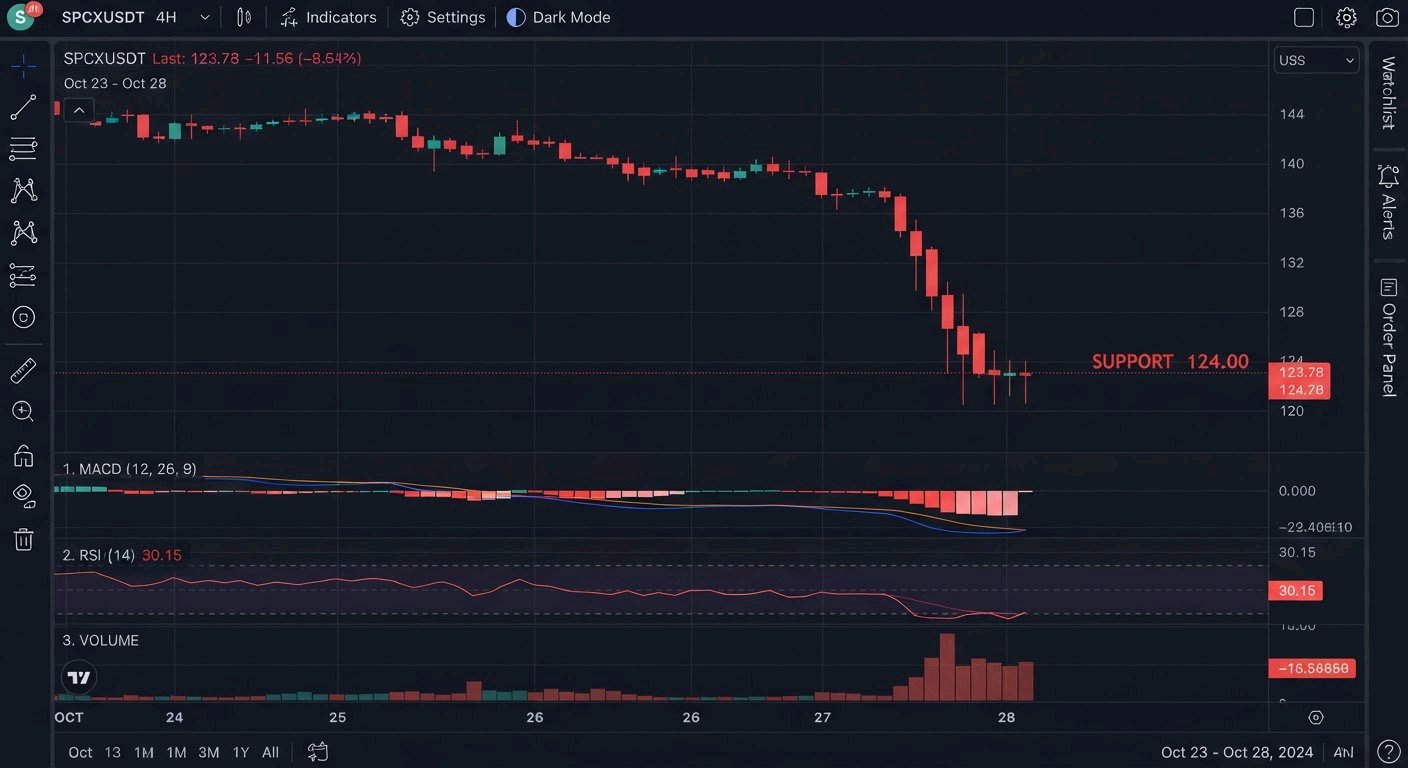
$SPCXXUSDT is sitting right on the edge of its recent swing low after a sharp flush, and the next few candles will decide whether this is a base or the start of a deeper breakdown 👀 SPCX pushed up toward the 140.74 area, got rejected hard, and has been grinding lower ever since. The bounce attempts have been weak, dying around the 0.5–0.618 Fibonacci zone, with every high since the rejection lower than the last. Price is now hovering around 124–132 (depending on the exact print), down hard on the day and pressing the recent lows near 123.76–131.59. This is the classic spot where the crowd gets emotional. Buyers see “cheap” after the drop and try to catch a knife, sellers see continued weakness and keep pressing. I would rather let the chart show who is actually winning. Here is what the 1H chart shows: Support: The recent swing low around 123.76–124 is the only real floor left on this move. Buyers defended nearby levels earlier, but a clean break here leaves very little structure underneath until deeper Fib levels. Momentum: MACD remains bearish below zero with no bullish crossover in sight. Sellers still control the short-term flow. RSI: Deep in oversold territory on higher timeframes (daily RSI around mid-30s, shorter frames also depressed). That can invite a relief bounce, but in a clear downtrend RSI can stay low for a long time — I don’t treat it as a buy signal on its own. Volume: Elevated activity near the lows. Could be a final flush or the start of acceleration lower. Candle still developing, so no guessing. Ceiling: First level buyers must reclaim is the 0.786 / recent intraday supply around 132–134. Above that sits the 0.618 near 131.8–133 and the heavier 0.5 Fib / prior rejection zone around 140. So the structure is basically: 140.74 → Swing high / rejection ~140.3 → 0.5 Fib ~131.8 → 0.618 Fib ~132–134 → First resistance / reclaim level ~124–132 → Current price zone ~123.76 → Swing low, the line that matters right now My plan: Bounce trigger: 1H close above ~132–134 with expanding volume Reaction zone: 123.76–125 area, only with a clear rejection candle and real buyers stepping in Invalidation: 1H close below 123.76 TP1: 132–134 TP2: ~140 TP3: Higher structure / EMA cluster if the recovery actually builds I am not buying a chart just because it dropped a lot. A cheap price is not a reason to enter. A confirmed level is. Below 123.76 there is not much to lean on in the near term, and a break can move fast toward the next Fib pocket and the 120–119 zone. That is why the invalidation is fixed before anything else. Right now 123.76–124 matters more than any target above it. If it holds with real volume and SPCX reclaims the first resistance, the recovery gets its first structure. If it breaks, the base idea is dead and the chart needs a fresh look from lower.#IMPACTbyTrade
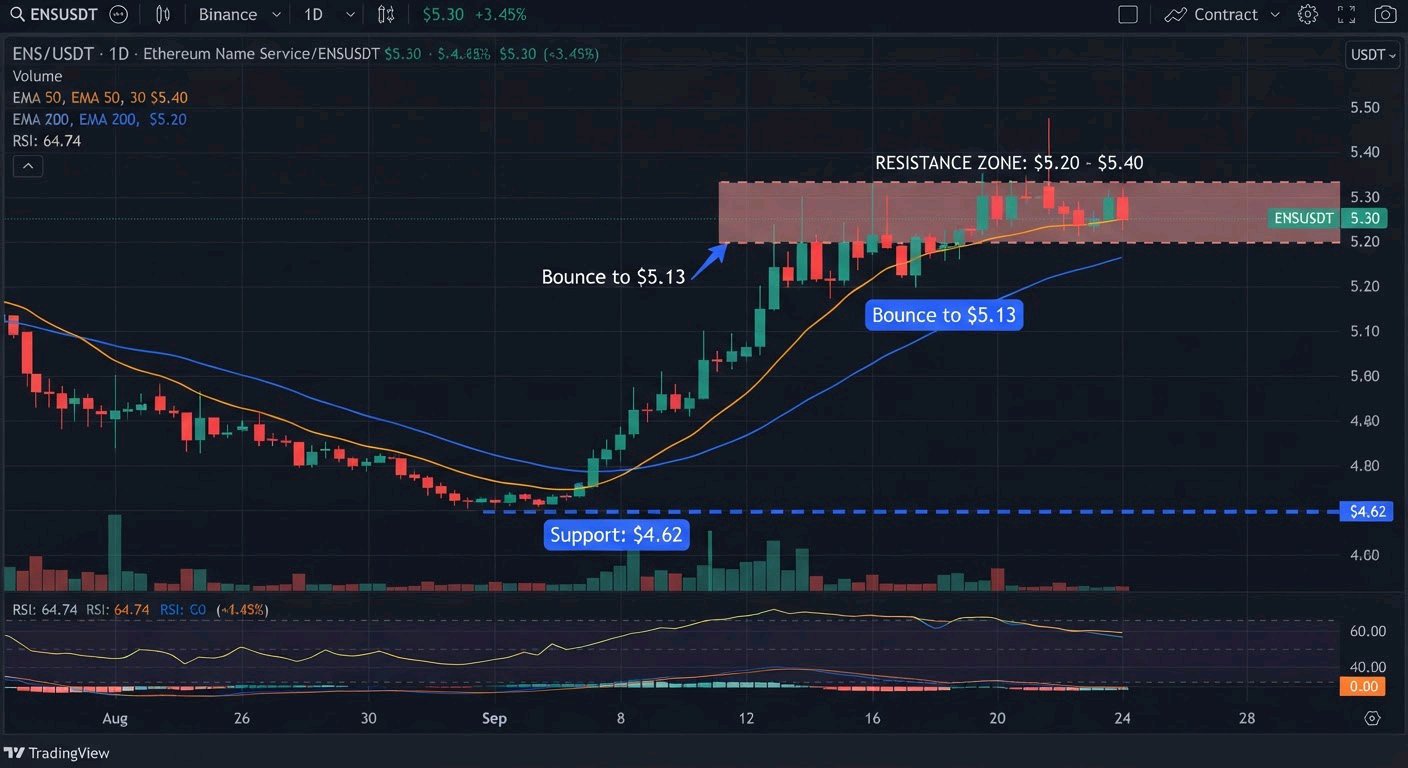
$ENSUSDT — ENS has dropped roughly 30% in a month, and buyers are now defending a level worth watching: $4.62. That's the recent 7-day low, and it held while price bounced toward $5.13–$5.17 before fading back near $4.77. I'm interested in that reaction, but the daily candle is still open. A defended low is encouraging; it doesn't mean the downtrend is over. The area above matters just as much. The $5.13–$5.22 zone is where ENS traded a week ago, and the 7-day high sits at $5.40. Former support can become resistance, and anyone who bought higher may use a recovery to exit, creating selling pressure. That's why I see two different bullish developments: A daily close above $5.20 would show buyers gaining short-term strength. Reclaiming and holding $5.40 would be more significant. It would weaken the recent bearish structure and make a move back toward the $6+ region more realistic. Until then, this is a reaction from support, not a confirmed reversal. The $4.60–$4.80 region needs to keep holding. If ENS repeatedly fails below $5.20 and slips back under $4.62, another test of the lows becomes possible. A sustained daily close below roughly $4.60 would invalidate my current support-defense thesis. I haven't marked a specific entry or stop-loss, so there is no honest R:R figure to calculate. Any trade here needs its own entry confirmation, protective exit and position sizing. For now, I'm watching whether sellers can push ENS back under $4.77 after this bounce. That reaction will tell me more about the next move than today's percentage change. #ENS #ENSUSDT #WSOT2026#IMPACTbyTrade
LITUSDT
Bullish $LITUSDT CFTC FILING THIS MONTH — THIS COULD BE THE REAL CATALYST Lighter is targeting November CFTC applications for both Designated Contract Market (DCM) and Derivatives Clearing Organization (DCO) status. If they pull this off, they become the first on-chain perpetual futures DEX with a clear path to full U.S. regulatory approval. That’s huge. The team has already been in talks with regulators for nearly a year. Founder Vladimir Novakovski confirmed the timeline on the latest call. Application is expected before month-end. Meanwhile the product is already printing serious numbers: • $72.9B+ trading volume in October • Strong fee generation • Active buybacks & burns funded by protocol revenue • Deep Robinhood Chain integration (50/50 revenue share + double points incentives) LIT has been one of the stronger performers recently while the broader market chopped. Price is holding the $3.40–$3.50 zone with improving structure on the higher timeframes. Open interest is building, funding stays reasonable, and smart money looks net long on several venues. This isn’t just another “listing hype” play. This is a real regulatory + distribution narrative: On-chain perps that actually work Robinhood distribution already live Potential U.S. institutional access if CFTC green-lights Risk is still there — filings can get delayed, rejected, or take months. But the asymmetry looks interesting if they actually submit this month and the market starts pricing in even a small chance of approval. I’m watching the $3.50 break and any official confirmation of the filing closely. Who else is tracking LITUSDT into this November catalyst? #LITUSDT #Lighter #ByX#IMPACTbyTrade
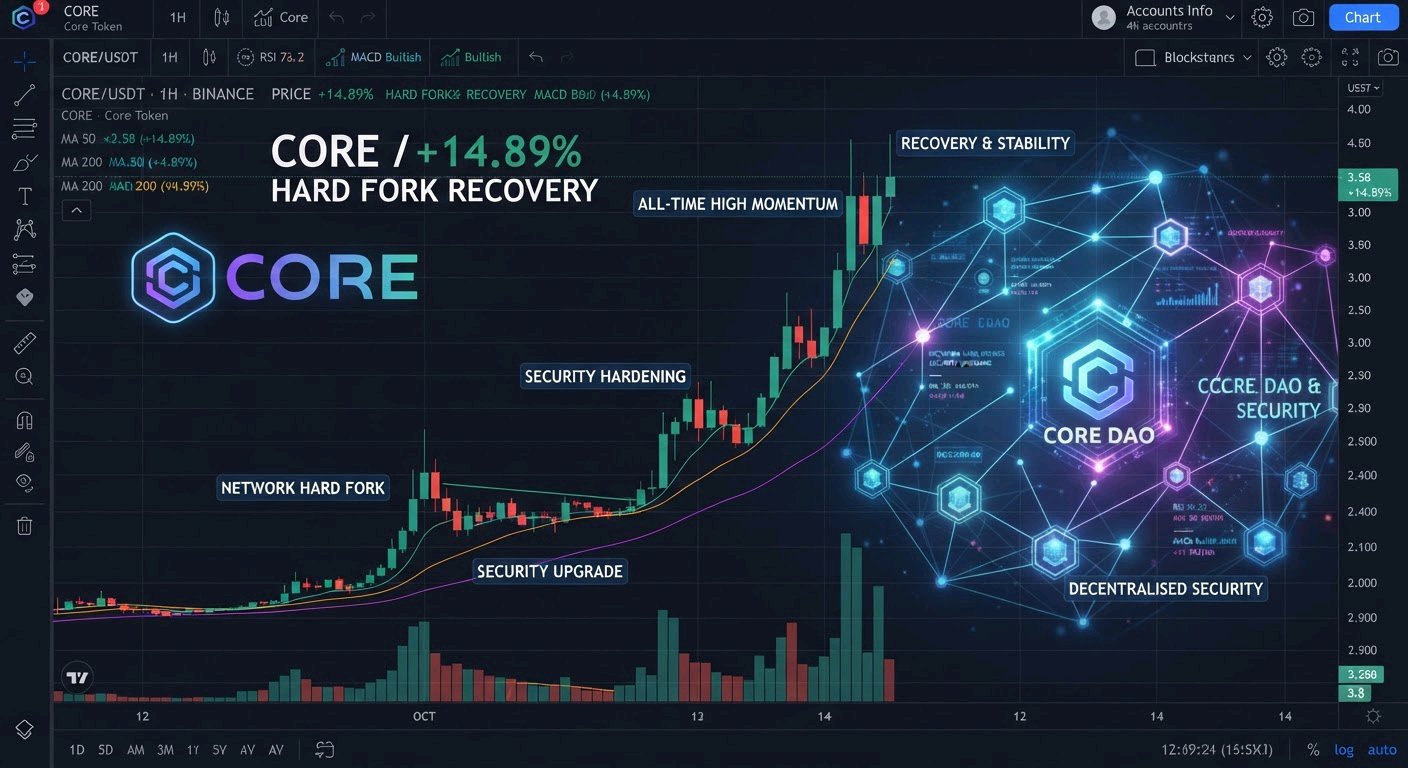
CORE’s latest move has an unusual catalyst: a network hard fork recovered approximately 68.15 million CORE (~70% of the ~97 million tokens affected in the late-October incident) directly from attacker-controlled addresses. That one-time state adjustment prevented further outflow and created a temporary supply overhang resolution. The rally has been modest so far, and the key question is whether the recovery plus ongoing decentralization can support a sustained move, or whether the market has already largely priced in the event.0b5c24 Tokenpost CORE is trading near $0.0130, up roughly 8% over 24 hours, with a market capitalization around $19.5M and daily trading volume near $3.4M. The reported 24-hour range is approximately $0.0119–$0.0131. Seven-day performance remains deeply negative amid the broader downtrend. Immediate resistance sits near $0.0135–$0.0140, while $0.0118–$0.0120 is the first important support zone. The recent lows around $0.0117–$0.0118 remain a major reference point.778fd8 Coinmarketcap The recovery deserves closer attention. On November 2 the network executed a hard fork that moved 68,146,177 CORE from three attacker addresses via a one-time on-chain state adjustment. The operation did not roll back transactions, mint new tokens, or alter the total supply. The recovered tokens have not yet been distributed to affected users, and no official claims process is open. Related exchange-frozen funds also remain unresolved. This was an exceptional security response rather than recurring buybacks or organic demand growth. The distinction matters: a one-time recovery cannot by itself guarantee sustained price appreciation.db4fcb Tokenpost Beyond the immediate event, Core continues its decentralization path. Early contributors including Rich Rines and Brendon Sedo have stepped back from DAO roles as independent validators assume block production under the Satoshi Plus consensus (combining delegated CORE, Bitcoin hash power, and self-custodial BTC staking). The network reported zero downtime during the transition. Community operators are expected to take on more ecosystem development, growth initiatives, and stewardship, though no firm timetable was provided. Dual staking remains a core value driver, offering higher yields when CORE is paired with Bitcoin.2eab08 Tokenpost Tokenomics stay structurally constrained. Maximum supply is fixed at 2.1 billion CORE (100× Bitcoin’s 21 million). Circulating supply sits near 1.5 billion. Emissions are scheduled over 81 years with a gradual 3.61% annual reduction in block rewards. A portion of fees and rewards has historically been burned (or is being redirected toward network operations and ecosystem funding). There are limited near-term dated unlocks remaining, with contributor vesting largely completing by the end of 2026. CORE is used for gas, staking, governance, and dual-staking yield boosts. Long-term value depends on whether actual Bitcoin staking activity, DeFi usage, and network transactions create recurring demand.9680d1 docs.coredao Derivatives activity remains relatively thin. Tracked perpetual open interest sits in the low-to-mid single-digit millions of dollars across venues, with funding rates fluctuating around neutral to slightly positive or negative depending on the snapshot. Speculative leverage is present but not extreme, reducing the risk of a crowded long squeeze while also limiting fuel for a sharp squeeze higher. Key figures $0.0130 — Current price area $0.0135–$0.0140 — Immediate resistance $0.0118–$0.0120 — Near-term support $0.0117–$0.0118 — Recent lows ~$19.5M — Market capitalization ~$3.4M — 24H trading volume 68.15M CORE — Tokens recovered via hard fork ~97M CORE — Tokens affected in the October incident 1.5B — Circulating supply (approx.) 2.1B — Maximum supply 81 years — Emission schedule with 3.61% annual reduction Bullish confirmation: CORE reclaims and holds above $0.0135–$0.0140 with stronger spot volume. That would open room toward $0.015–$0.016 and potentially higher structural levels. Bearish confirmation: Rejection below $0.0130 followed by a clean break under $0.0118. That would expose the $0.0105–$0.0110 area and suggest the recovery catalyst is fading. CORE has benefited from a genuine security-response event and is advancing its decentralization roadmap, while dual staking continues to tie its utility to Bitcoin. But the permanent recovery of tokens should be separated from sustainable demand. The decisive signal is whether Bitcoin staking growth, network activity, and genuine spot buying can support the price after the one-time hard-fork catalyst fades. The supply overhang has been partially addressed; now the market needs to prove that demand has changed too $COREUSDT #IMPACTbyTrade#IMPACTbyTrade
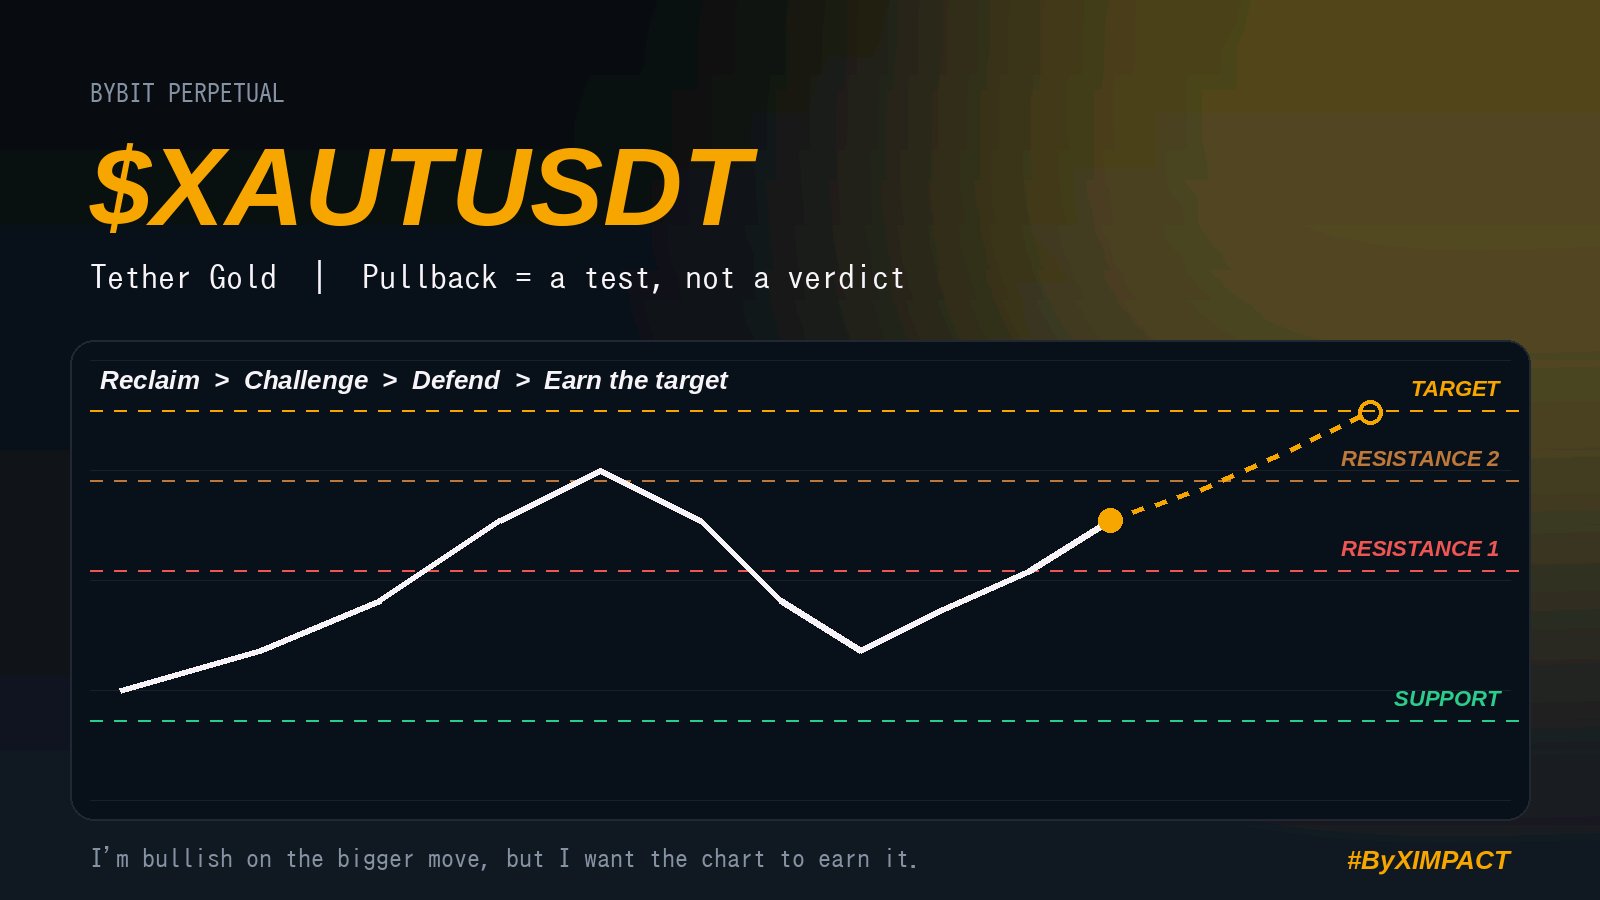
I'm assuming you mean XAUTUSDT (Tether Gold). The search results gave me conflicting and stale prices, so I didn't invent live numbers. Fill in the brackets from your Bybit chart, and I can finalize it once you send the figures. $XAUTUSDT: I'm still watching [target level]. This pullback hasn't changed my view. 👀 XAUT moved from the [support] area toward [high], then pulled back to around [current price]. I see this as a test of buyers' strength, not proof the bigger bullish move is over. Bybit market picture from November 5 ([time] UTC): Perpetual price: around [price] 24H change: approximately [x%] 7D change: approximately [x%] 30D change: approximately [x%] Open interest: approximately [$xM] Funding rate: [x%] per 8 hours Positive funding means longs are paying shorts. Falling open interest suggests positions are being reduced rather than fresh leverage building. That isn't necessarily bearish, but it shows no strong derivatives-driven expansion yet. OI alone can't reveal which side is closing. What I'm watching on the chart [Resistance 1] needs to be reclaimed first. If buyers hold above it, [Resistance 2] becomes the next challenge. Beyond that, [prior spike zone] is where sellers may appear again before XAUT can attempt [target]. Gold-backed assets also respond to broader macro moves, so I want momentum to improve before I turn more aggressive. Risk Management The lower edge of my zone, around [support 1], is the first area buyers need to defend. If it fails, [major support] becomes the key level. A sustained daily close below it would make me reassess my bullish view. I'm not adding blindly during a pullback. Any new entry needs a defined stop and position size. Without an actual entry and stop-loss, an exact risk-to-reward ratio can't be calculated. My [target] remains, but first I want to see [Resistance 1] reclaimed and buyers prove they can defend the pullback. I'm bullish on the bigger move, but I want the chart to earn it. $XAUTUSDT #ByXIMPACT $BTCUSDT#ByXIMPACT
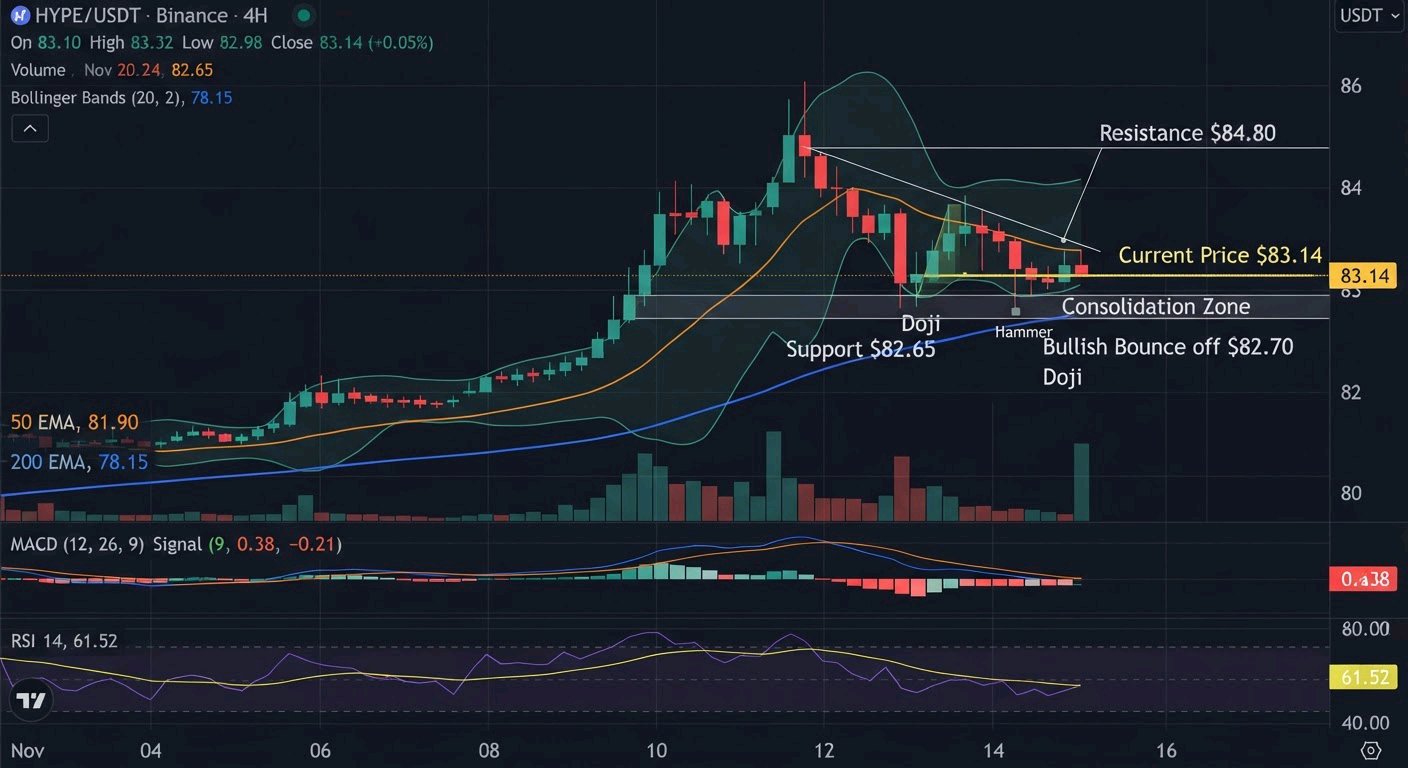
comprehensive technical analysis of the HYPEUSDT
$HYPEUSDT Price Action & Trend Overview Current Price: $83.45 USDT 24-Hour Performance: Down -1.45%, showing mild bearish pressure after testing higher levels. 24-Hour Range: High: $88.90 Low: $82.76 Recent Structure: After a sharp rejection near the $88.50–$88.90 zone, price has pulled back into a consolidation range around $83–$85. The structure remains range-bound with a slight bearish bias on the 4H, following the failure to sustain the recent highs. Moving Averages (EMA 7, 14, 28) EMA 7: $84.12 EMA 14: $84.68 EMA 28: $85.05 Analysis: Price is currently trading below all three short-term EMAs, which are flattening after a prior upward slope. This alignment (price < EMA 7 < EMA 14 < EMA 28) reflects short-term bearish pressure and a loss of immediate upward momentum. Momentum Indicators MACD (12, 26, 9): DIF: -0.42 DEA: -0.28 MACD Histogram: -0.14 Analysis: The MACD remains below the zero line with a negative histogram, indicating fading bullish momentum. Histogram bars are mildly contracting, suggesting the selling pressure is not accelerating aggressively yet. Volume: 24h Turnover: ~$1.1B USDT Volume has moderated after the earlier spike that accompanied the move toward $88.90. Current volume is below the recent average, consistent with consolidation rather than strong directional conviction. Order Book Sentiment Buy vs. Sell Pressure: 48% Buyers vs. 52% Sellers Analysis: Slightly skewed toward sellers, reflecting mild bearish bias in immediate order book depth. Key Levels to Watch Immediate Resistance: $84.80 – $85.20 (EMA cluster and prior pivot). A decisive break and hold above this zone would improve the short-term outlook. Immediate Support: $82.80 – $83.20 (24h low area and recent demand zone). Major Support: $80.50 – $81.50 (deeper structural level). Summary & Outlook HYPE/USDT is consolidating after a rejection from the $88.90 region. Short-term structure on the 4H leans mildly bearish while price sits below the EMA stack, but the broader daily picture remains more neutral. As long as price holds above $82.80, the range can continue; a clean break either side will likely set the next directional move. Disclaimer: Cryptocurrency trading carries a high level of risk. This technical breakdown is for informational purposes only and does not constitute financial advice. To determine the next directional move on this HYPE/USDT 4-hour chart, you can look for specific technical triggers that confirm either a continuation of the upside or a deeper correction. Bullish Confirmation Signals For the bulls to regain control: Breakout Above $85.20: A strong 4H close above the EMA cluster with expanding volume would signal renewed buying interest. EMA Reclaim + Bounce: Price reclaiming and holding above EMA 7/14 while forming higher lows. MACD Histogram Turning Positive: A shift from negative to expanding positive bars would confirm improving momentum. Bearish Confirmation Signals For bears to push lower: Breakdown Below $82.80: A 4H close under the recent low with increased volume would open the path toward $80.50. MACD Bearish Expansion: Further widening of the negative histogram and DIF staying below DEA. Lower High Formation: Failure to reclaim $85 followed by a break of the range low. What specific timeframe or indicator setup are you tracking alongside this chart to gauge your entry? #ByXIMPACT $HYPEUSDT#ByXIMPACT #USPayrollsAndRateDecisionsDriveMacroWeek #BitcoinSlidesBelow$80K #BlockchainSecurity #WSOT2026
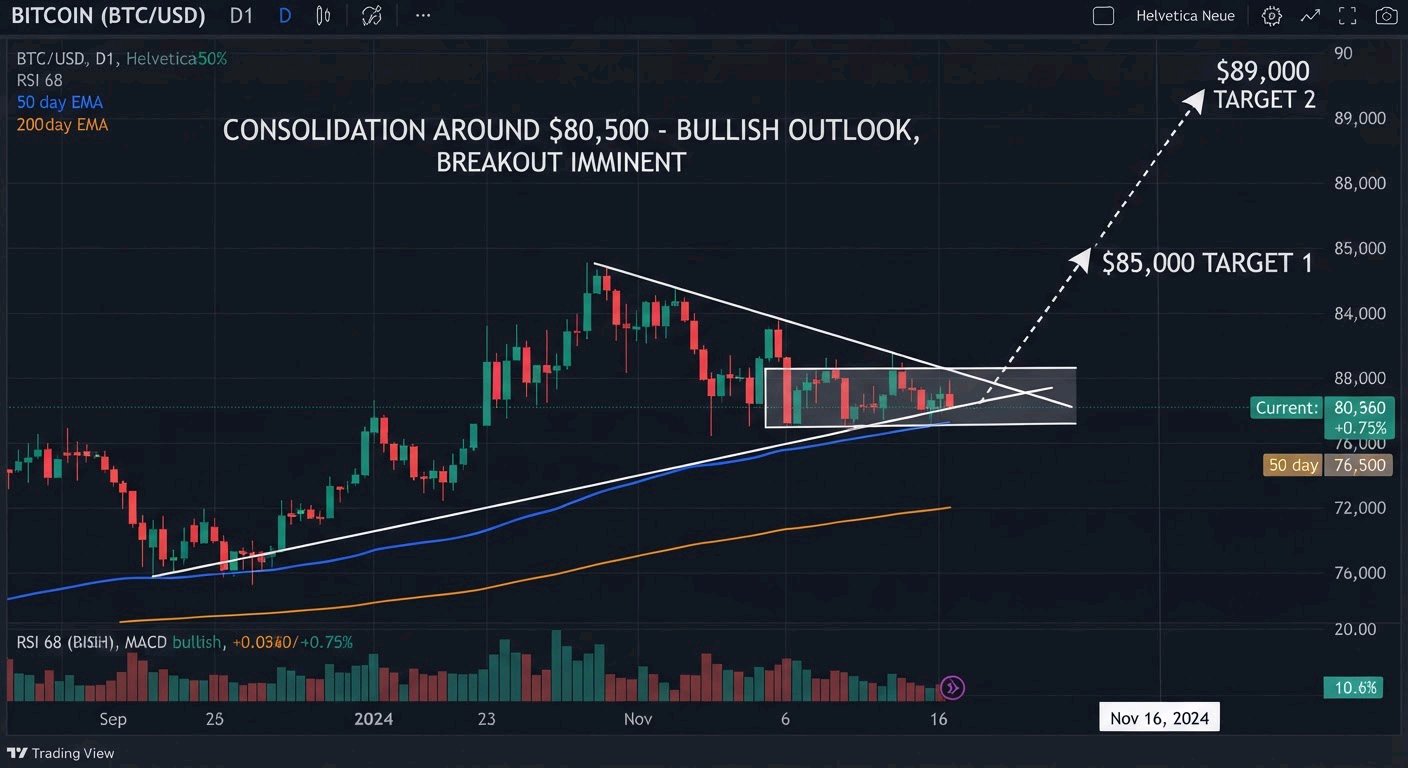
$BTCUSDT Holding the range, still targeting higher. BTC is trading around $80,500 after reclaiming the short-term structure. The move from the $75.7k–$76.2k lows has been clean, and price is now consolidating above the 200-day MA near $78.5k. This looks like a healthy pause, not a rejection of the bullish case. Here’s what I’m watching: $81,200 – $82,000 needs to be reclaimed and held. That’s the near-term bull/bear line. Clear acceptance above $82k opens the path toward $85k, then the previous local highs around $89k–$90k. I’m still constructive on the bigger picture. Strong rallies often dig in and retest before the next leg higher. Risk Management The first area buyers need to defend is $79,700 – $78,500 (recent structure + 200-day MA). A sustained daily close below $78,500 would force a reassess of the short-term bias and put $75k–$73.5k back in play. No blind averaging. Any new position needs a defined invalidation and proper size. Without an actual entry and stop, risk-to-reward stays theoretical. Higher targets remain on the table. Now I want the chart to earn them. #ByXIMPACT#ByXIMPACT #USPayrollsAndRateDecisionsDriveMacroWeek #BitcoinSlidesBelow$80K #BlockchainSecurity #PiecesOf8
BTCUSDT | ETHUSDT | HYPEUSDT | XAUUSDT
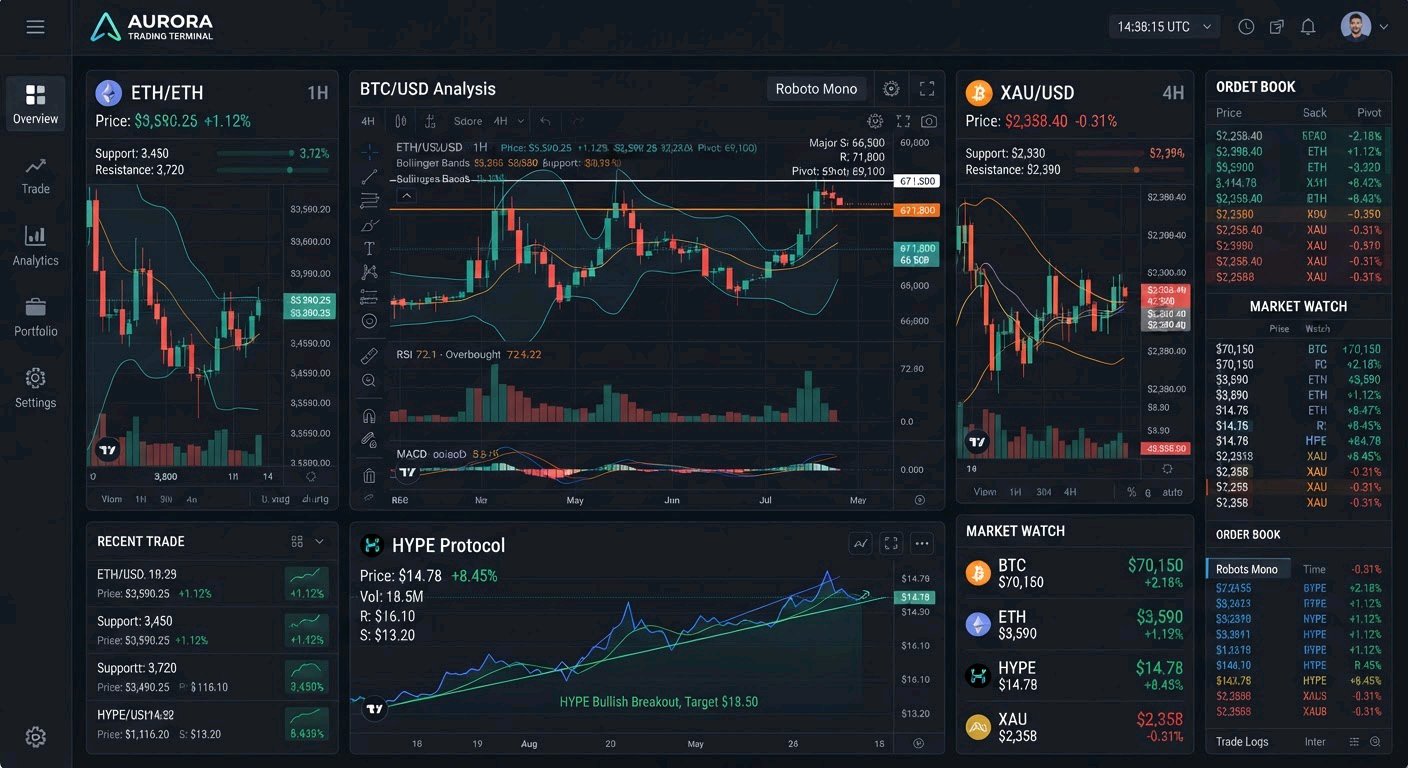
$BTCUSDT $ETHUSDT The market is showing interesting moves, and these four assets deserve attention. Here's my quick breakdown. 👇 ₿ BTCUSDT: Bitcoin is showing a recovery attempt, but the broader trend still needs confirmation. Watch the $81K resistance area and $79K support. A decisive breakout could strengthen bullish momentum. ♦ ETHUSDT: Ethereum is showing strong short-term momentum. The $2,440–$2,450 zone is the key resistance to watch, while $2,310–$2,320 remains an important support area. 🔥 HYPEUSDT: HYPE is showing positive short-term momentum, but consolidation remains possible. Watch $87 resistance and $83 support. A confirmed breakout could signal renewed strength. 🥇 XAUUSDT (GOLD): Gold is recovering strongly after recent weakness. The $4,050–$4,080 region is an important resistance zone, while $4,030 is a key level to watch. FINAL THOUGHT All four markets are presenting interesting opportunities for analysis, but confirmation matters more than speculation. 💬 Which asset do you think will show the strongest momentum next: BTC, ETH, HYPE, or GOLD? Drop your opinion below! 👇 #BTC #ETH #HYPE #XAUUSD #CryptoMarket #Bybit #MarketAnalysis#ByXIMPACT
GOLD IS BACK ON THE SPOTLIGHT
$XAUTUSDT GOLD IS MAKING MOVES! 👀🔥 Gold is attracting attention again as XAUUSDT records a strong recovery, putting the precious metal back in focus across the financial markets. 📊 MARKET BREAKDOWN Asset: Gold (XAUUSDT) Market: Gold Perpetual 24H Change: +3.40% Reference Price: $4,071 24H Trading Volume: $242.89M Open Interest: $76.66M 🔍 WHAT'S HAPPENING? Gold's recent strength highlights renewed market activity. Traders are watching whether the bullish momentum can continue or whether the market will experience a temporary pullback. 👀 WHAT SHOULD WE WATCH NEXT? 🟢 Sustained strength could keep bullish sentiment alive. 🔴 A loss of momentum could bring consolidation. ⚡ Trading volume and open interest wil No chasing moves. Stay patient, stay informed, and respect market risk. 🔥 WHAT'S YOUR VIEW ON GOLD? Are you watching XAUUSDT for more upside or expecting a pullback? Drop your thoughts below! 👇#ByXIMPACT #BitcoinSlidesBelow$80K #BlockchainSecurity #PiecesOf8 #Oracle20BFundingPlanTestsTheAITrade $ETHUSDT

AVAXUSDT
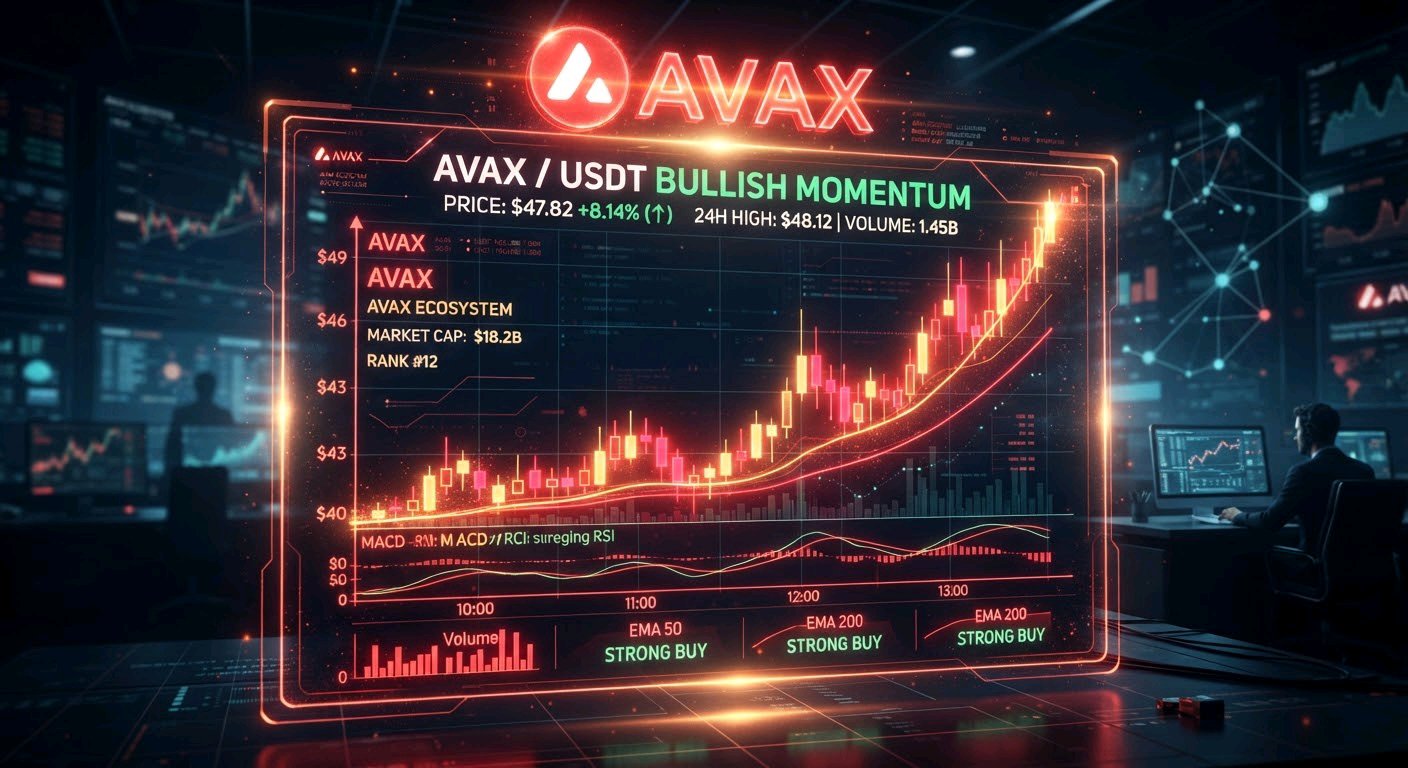
$AVAXUSDT : IS AVALANCHE PREPARING FOR ITS NEXT BIG MOVE? The crypto market is full of opportunities, but some projects deserve more attention than others. One name that keeps coming up is $AVAX. Built around the Avalanche network, AVAX is more than just another Layer 1 token. Its focus on custom blockchains and real-world asset tokenization makes it an interesting project to watch as the market evolves. 🔥 WHY I'M KEEPING AN EYE ON AVAX 🔹 Strong Ecosystem: Avalanche lets projects launch their own custom L1 chains, which has attracted gaming, finance and enterprise builders. 🔹 Real-World Assets: Tokenization keeps growing on Avalanche, with institutions and big brands testing the network. 🔹 Institutional Interest: Partnerships and treasury activity show AVAX is still on the radar of larger players. 🔹 Long-Term Potential: Network upgrades, developer growth and on-chain activity could all play a role in its future performance. 📊 WHAT SHOULD TRADERS WATCH? Rather than chasing every green candle, watch how AVAX behaves around important support and resistance levels on the daily chart. A strong breakout backed by rising volume could signal renewed bullish momentum, while a rejection at resistance may set up a pullback. After a big drawdown, patience matters more than speed. ⚠️ Remember: No token moves upward forever. Risk management is just as important as finding opportunities. 💬 LET'S TALK! Do you believe $AVAX has what it takes to lead the next wave of tokenization and L1 growth? Are you: 🚀 BULLISH on AVAX 🐻 BEARISH on AVAX 👀 WAITING for a better entry? Drop your thoughts below. Let's discuss! 👇#ByXIMPACT #BitcoinSlidesBelow$80K #BlockchainSecurity #Oracle20BFundingPlanTestsTheAITrade #WSOTPicktoEarn10U
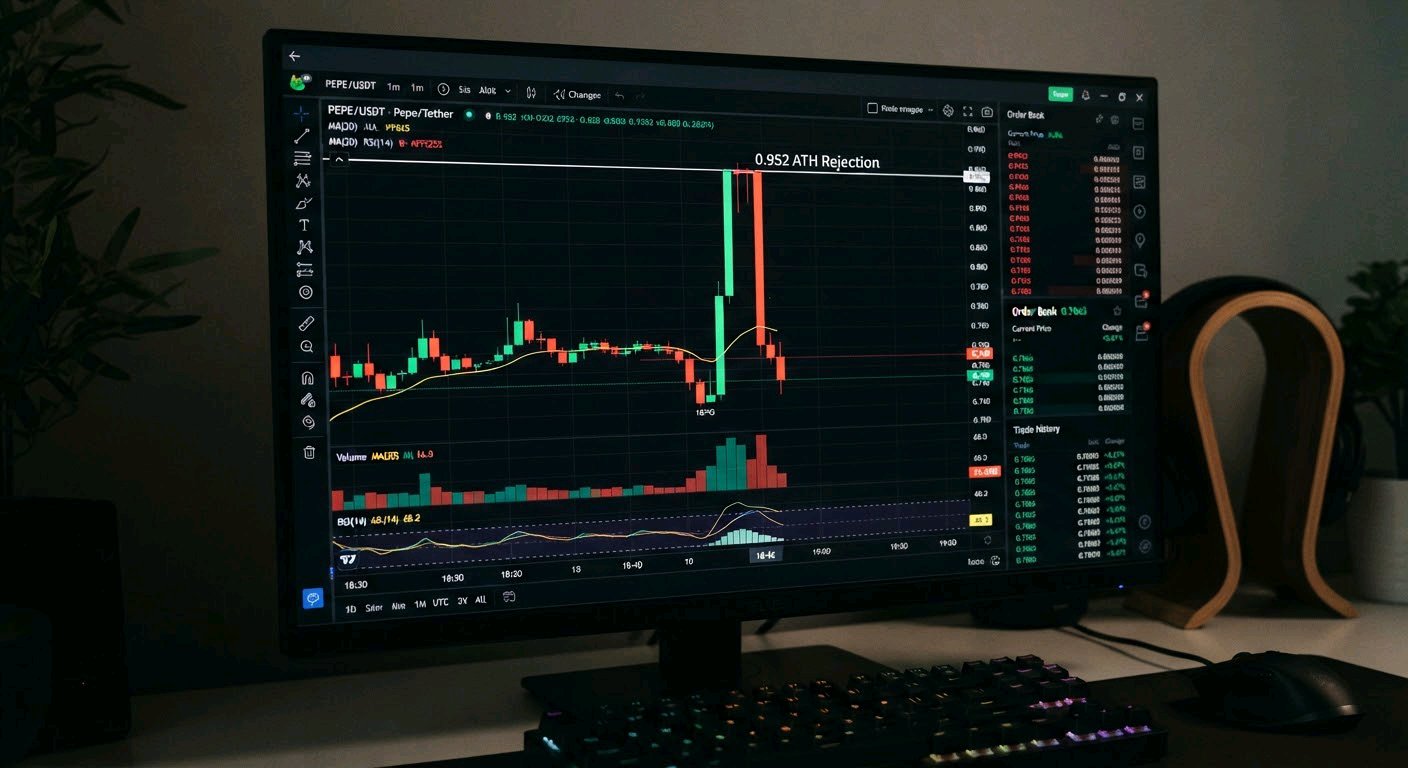
$SUIUSDT pump to ~0.952 was a textbook liquidity grab. Price spiked hard, took out the recent highs, and immediately got rejected with a fat red wick. Volume on that top candle was the tell — pure stop-hunt energy. Market makers fed the FOMO, then dumped into the chase. Classic. We’re sitting around 0.924 right now. Structure is still mixed on the higher timeframes, but the short-term bounce is looking soft. The play is to watch for a weak reclaim attempt toward 0.935–0.940. If bulls can’t hold that zone with real volume, it’s a clean short setup. Target is a return to the 0.90–0.905 area to test whether any real demand is left. Invalidation: strong 15m close back above 0.955. If that happens, they might try one more leg higher. Same lesson as always: never chase the green candle into a resistance wall. Who got chopped up on that 0.95 wick?#ByXIMPACT
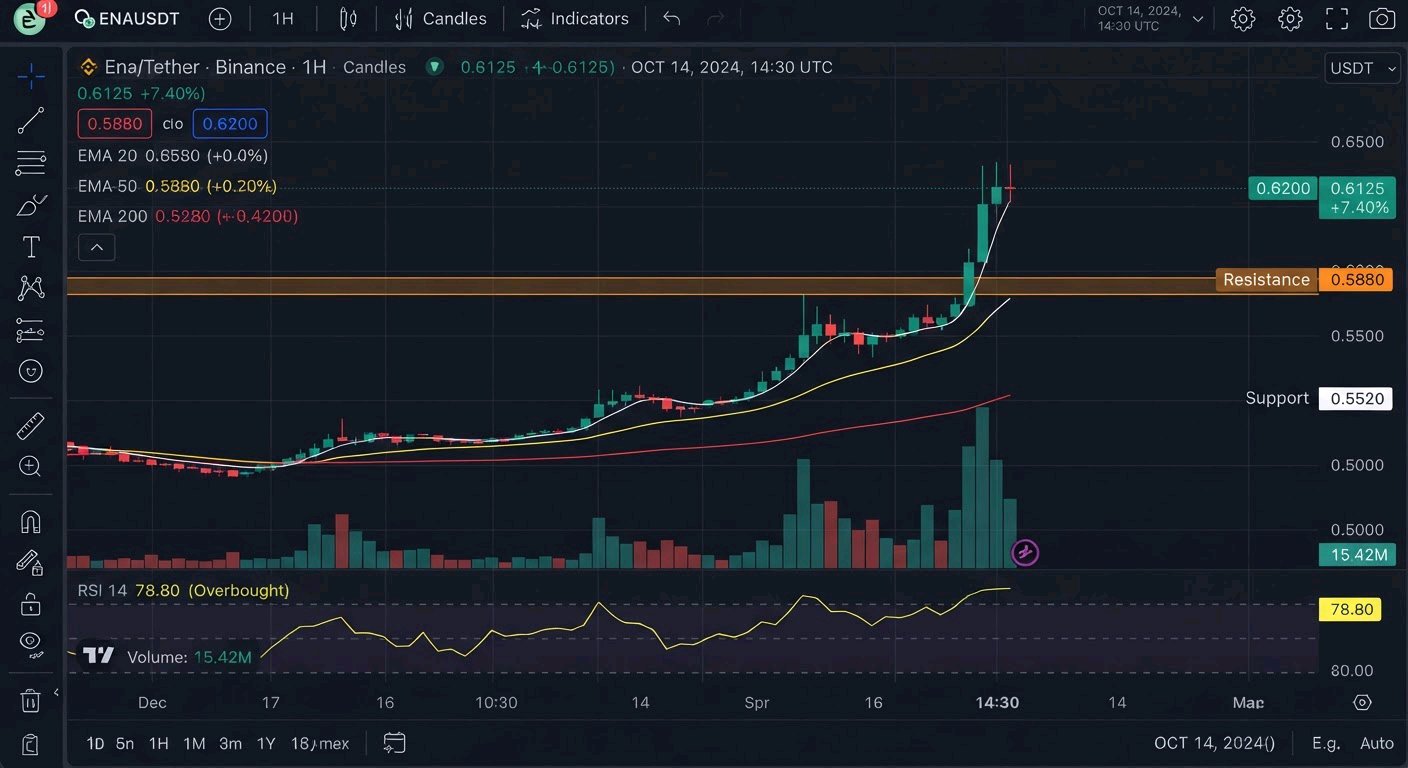
$ENAUSDT is trading around 0.0925, sitting in a tight range just above the 0.0900 round number. Price is coiling between support in the 0.0855-0.0900 area and resistance near 0.0950-0.1000, and until one side breaks on a daily close, it's a range, not a trend. Buyers keep defending the 0.09 zone, but every push toward 0.095 has met selling, so the bounce still looks unconfirmed. Volume is the tell: a break needs a clear step-up above the recent average, and without it moves tend to fade back into the range. Levels to watch: Support: 0.0900, 0.0855, 0.0838, then roughly 0.0770. Resistance: 0.0950, 0.1000, 0.1100, then roughly 0.1220. Plan, on daily closes: Support-hold long: a pullback into 0.0900-0.0910 that holds on the daily close. Entry 0.0905, stop under 0.0850, which is 0.0055 of risk. 0.0950 is about 0.8R, 0.1000 about 1.7R and 0.1100 about 3.5R. Breakout long: a daily close above 0.0950 on rising volume, then a retest that holds. Entry 0.0965, stop under 0.0925, which is 0.0040 of risk. 0.1000 is about 0.9R, 0.1100 about 3.4R and 0.1220 about 6.4R. Breakdown (short or exit): a daily close under 0.0900, then a failed retest. Entry 0.0895, stop above 0.0935, which is 0.0040 of risk. 0.0855 is about 1R and 0.0770 about 3.1R. Invalidation: a daily close under 0.0838 kills the bounce idea, and a daily close above 0.1000 says the downtrend has turned. Risk note: range breaks can be fast and fake out both ways, so use limit orders and keep size small. That's my read of the chart, not advice #ByXIMPACT $ENAUSDT#ByXIMPACT #PiecesOf8 #BitcoinSlidesBelow$80K #BlockchainSecurity
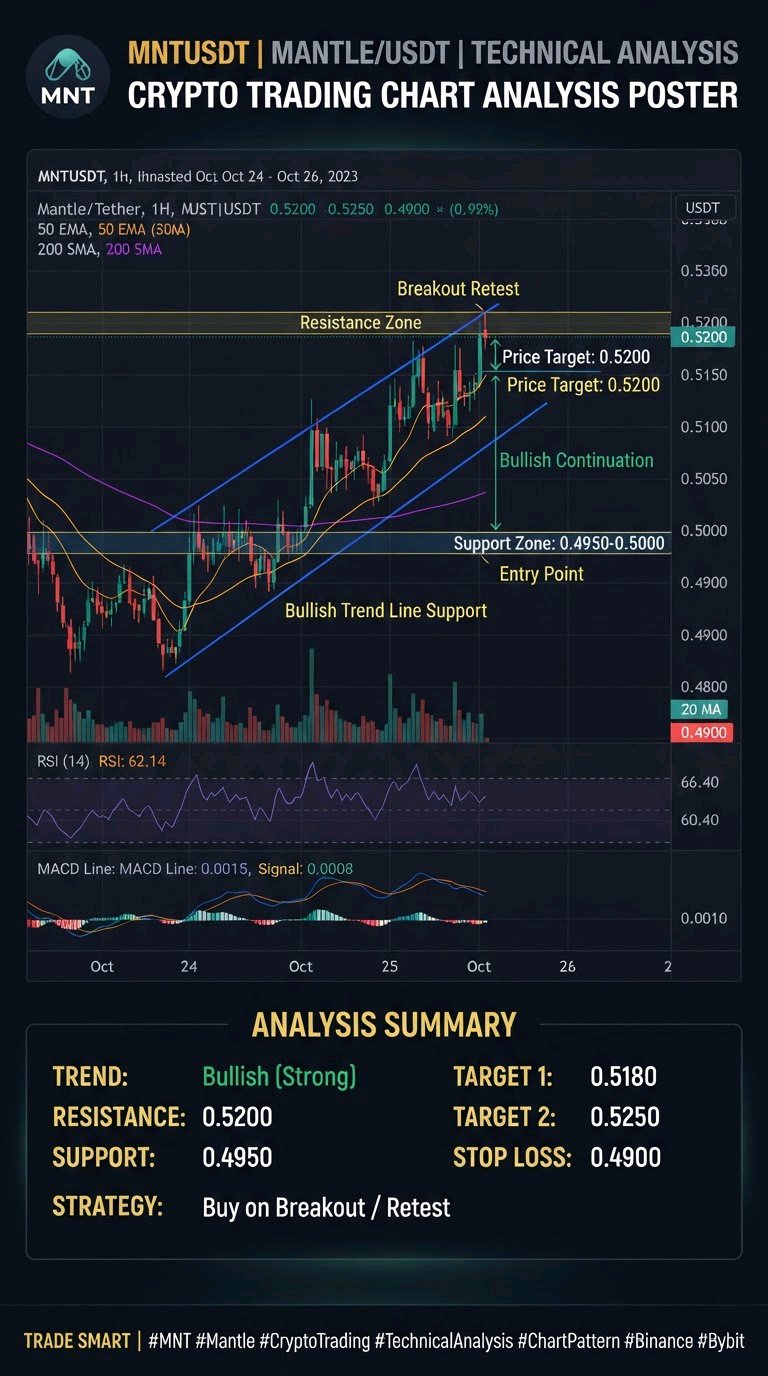
$MNTUSDT is testing a key technical structure, and the next few 4h candles will determine its next major directional move. Where we are: MNTUSDT has been consolidating within a defined channel, currently pressing near a pivotal midline resistance. Key Levels: Support: Lower channel boundary and immediate reaction zone. Resistance: Channel midline and upper boundary targets. Potential Scenarios: Breakout: A sustained 4h close above resistance opens the path toward higher upper-rail targets. Rejection: A stall at the midline could prompt a pullback toward the lower support rail for a better entry. Breakdown: A loss of key support invalidates the bullish structure and exposes deeper downside levels. Trading Plan: Entry: Look for disciplined entries on dips toward support rather than chasing mid-range prices. Risk Management: Maintain clear stop-losses below invalidation levels and keep position sizes controlled.#ByXIMPACT #WSOTPicktoEarn10U #PiecesOf8 #BitcoinSlidesBelow$80K #BlockchainSecurity
$AAVEUSDT is currently trading around 130.25 USDT, with a positive 24-hour performance. Current price: $130.25 24H change: +2.17% 24H high: $137.03 24H low: $123.28 The recovery indicates improving short-term sentiment, although the broader monthly trend remains under pressure. 📈 2. Technical Structure AAVE has experienced significant volatility recently, but buyers are attempting to establish a stronger base. Key levels to monitor: Support zone: 123–126 USDT Immediate resistance: 137–139 USDT Major resistance: 146 USDT sustained move above resistance could strengthen the recovery narrative. However, rejection around these levels could lead to another consolidation phase. 🐂 3. Bullish Scenario If buyers maintain control and AAVE successfully breaks above the 137–139 USDT resistance area, bullish momentum could strengthen. A sustained breakout, supported by increasing trading volume, would provide stronger evidence of a potential trend reversal. 🐻 4. Bearish Scenario If AAVE fails to maintain its recovery and loses the 123–126 USDT support region, sellers could regain control. This would weaken the bullish structure and potentially expose the market to further downside pressure. 🔍 5. What I'm Watching Three important things deserve attention: Whether buyers can defend the 123–126 support region. Whether trading volume increases during upward movements. Whether AAVE can establish acceptance above 137–139 resistance. 🎯 Final Thoughts AAVEUSDT is showing encouraging recovery signals, but confirmation is still needed. The coming sessions could be important in determining whether this is the beginning of a stronger bullish reversal or simply a temporary relief rally. Patience, confirmation, and proper risk awareness remain essential in volatile markets. What's your outlook on AAVE? 🐂 Bullish recovery or 🐻 another bearish move? #BitcoinSlidesBelow$80K #BlockchainSecurity #ByXIMPACT