ZIV OREN
1466ចូលចិត្ត (Like)0ភាគហ៊ុន154អ្នកគាំទ្រ250តាមដាន
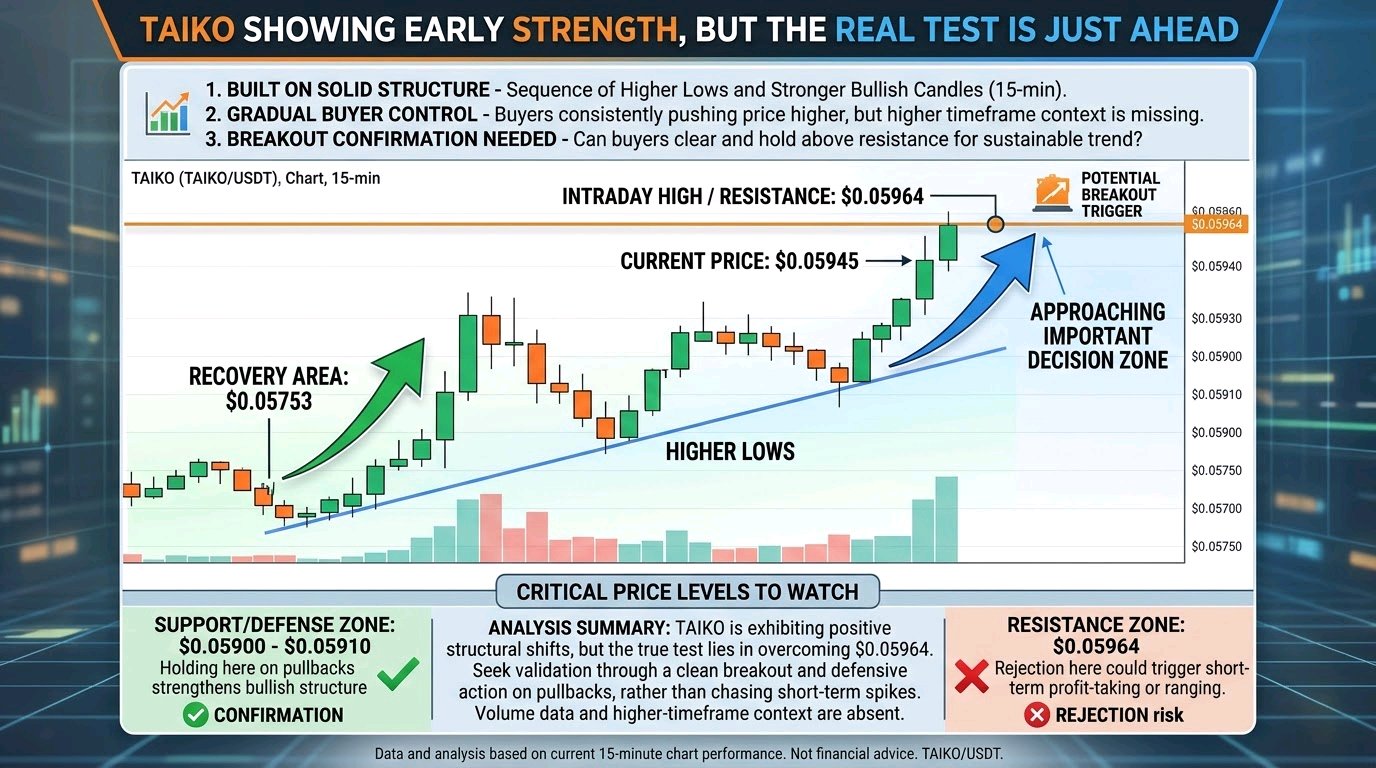
$TAIKOUSDT Is Showing Early Strength, But the Real Test Is Just Ahead. I'm watching TAIKO closely after its latest recovery from the $0.05753 area. What stands out to me isn't simply the 3.27% price increase, but the structure behind the move. Buyers have gradually pushed price higher, creating a sequence of higher lows and stronger bullish candles on the 15-minute chart. TAIKO is now trading around $0.05945, approaching the $0.05964 intraday high. This is an important decision zone. A clean breakout followed by acceptance above resistance could attract momentum traders and create room for another upward extension. However, I don't want to mistake short-term momentum for a confirmed trend reversal. The market has already moved considerably from its recent low, and buyers need to demonstrate that they can defend reclaimed levels rather than simply chase the breakout. I'm particularly interested in how price reacts around $0.05900–$0.05910. Holding this area during a pullback would strengthen the bullish structure. Rejection near $0.05964, on the other hand, could bring short-term profit-taking. My interpretation: TAIKO is showing improving buyer control, but the next breakout attempt matters more than the current green candles. I want to see confirmation, not just excitement. #WSOT2026
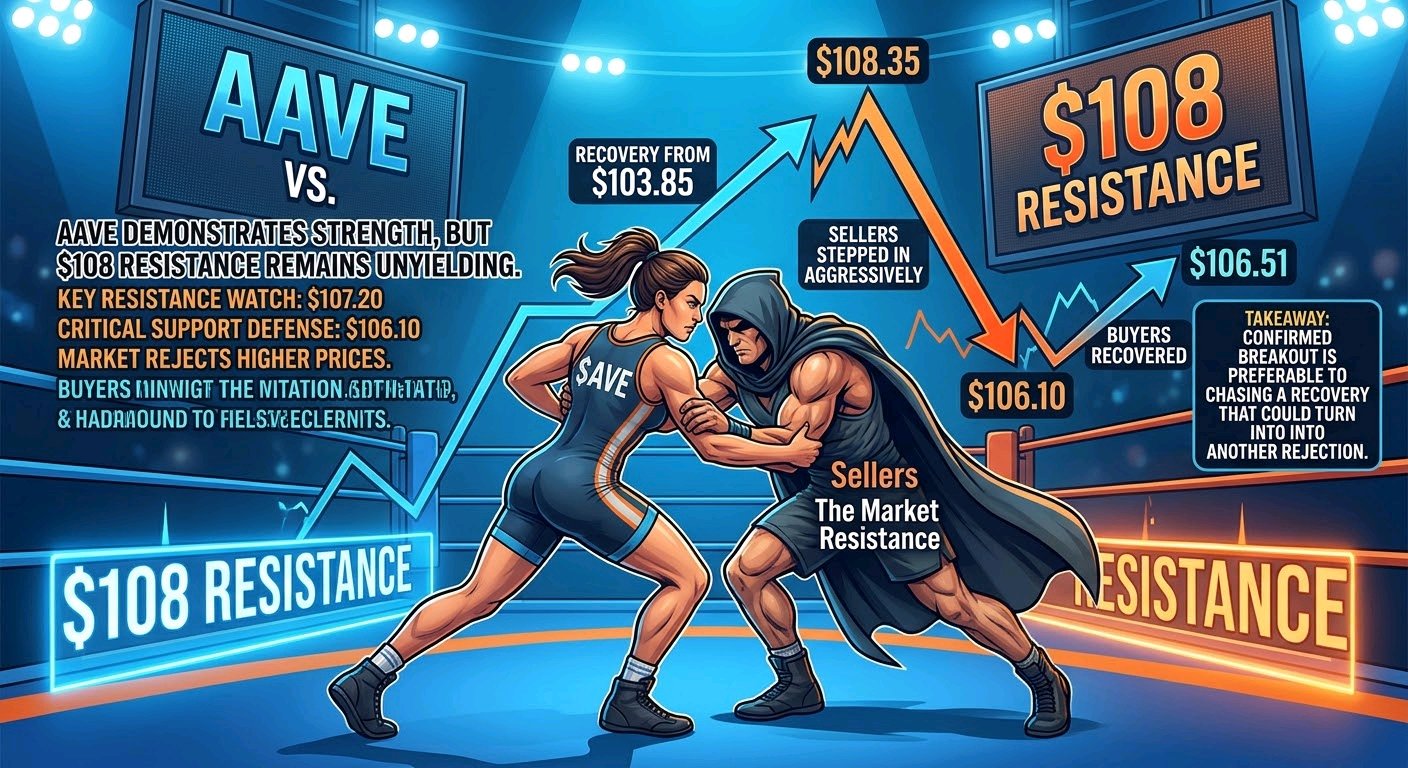
$AAVEUSDT IS SHOWING STRENGTH, BUT THE $108 RESISTANCE IS NOT READY TO GIVE UP. AAVE has delivered a strong recovery from $103.85, pushing as high as $108.35 before sellers stepped in aggressively. What caught my attention isn't just the rally, but how quickly the market rejected higher prices. On the 15-minute chart, buyers managed to recover from the sharp sell-off toward $106.10, bringing price back to $106.51. However, this rebound still needs confirmation. The structure suggests that short-term momentum has cooled after the initial upside expansion. I'm watching $107.20 as the first important resistance area. A convincing move above it could bring another attempt toward $108.35. On the downside, $106.10 is the immediate support to defend. Losing that level could expose $104.97, with $103.85 remaining the broader swing-low reference. My biggest takeaway: AAVE has demonstrated buying interest, but the market hasn't yet proven that buyers can absorb the supply sitting above $107–$108. I would rather see a confirmed breakout than chase a recovery that could turn into another rejection. The next move matters more than the previous rally. Technical analysis based on the supplied 15-minute chart, not a confirmed prediction. #WSOT2026
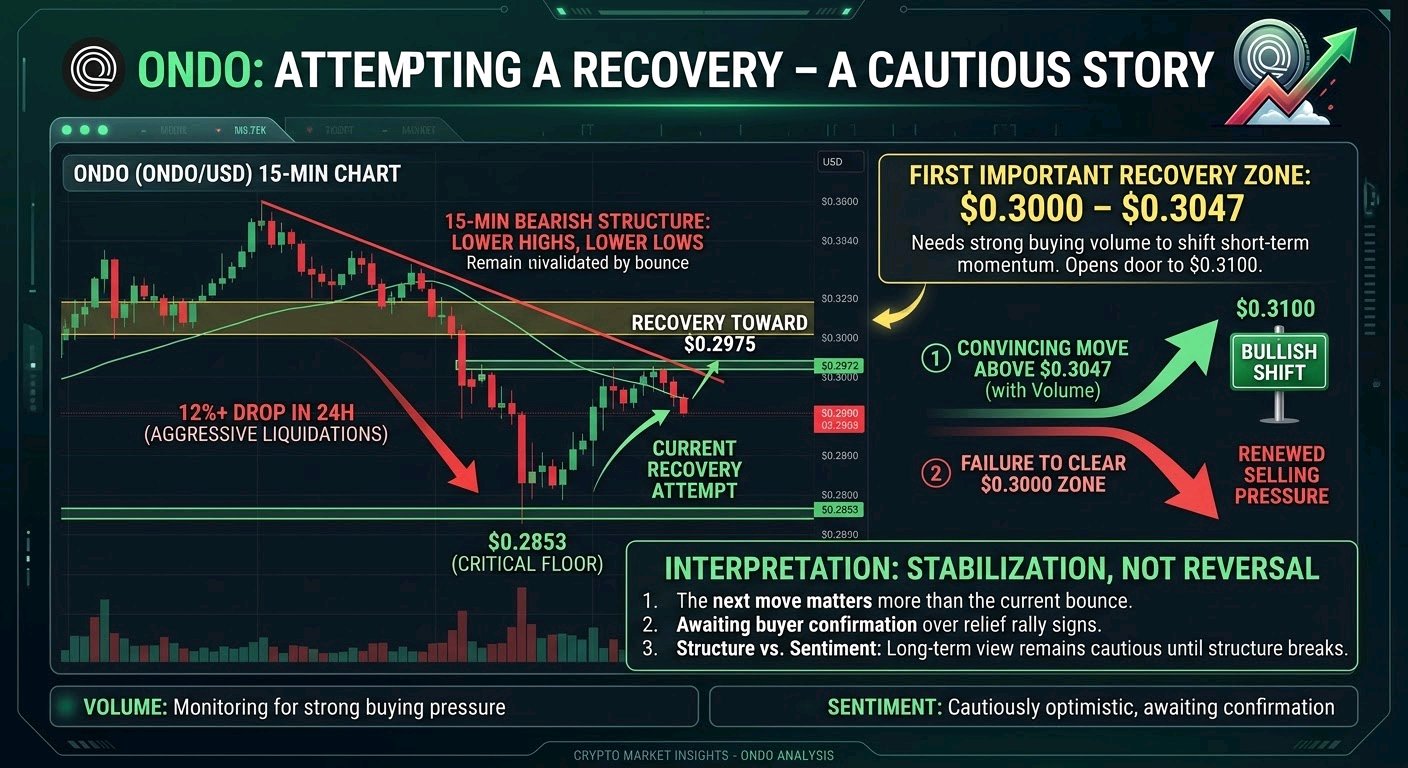
$ONDOUSDT is attempting a recovery, but the structure still tells a cautious story. After losing more than 12% in 24 hours, ONDO dropped to $0.2853 before attracting buyers and recovering toward $0.2975. What interests me here is not simply the green candles appearing after the sell-off, but whether this rebound represents genuine demand or merely short-covering after an aggressive liquidation of positions. The 15-minute structure remains bearish, with a clear sequence of lower highs and lower lows. The recent bounce is encouraging, but it has not yet invalidated that broader intraday weakness. I'm watching $0.3000–$0.3047 as the first important recovery zone. A convincing move above this area, supported by stronger buying volume, could shift short-term momentum and open the door toward $0.3100. On the downside, $0.2853 is the critical reference. Losing that low would suggest sellers still control the market and that the current recovery has failed to establish a sustainable floor. My interpretation: ONDO is showing its first signs of stabilization, not a confirmed reversal. The next move matters more than the current bounce. I would rather see buyers prove their strength than mistake a relief rally for a trend change. #WSOT2026
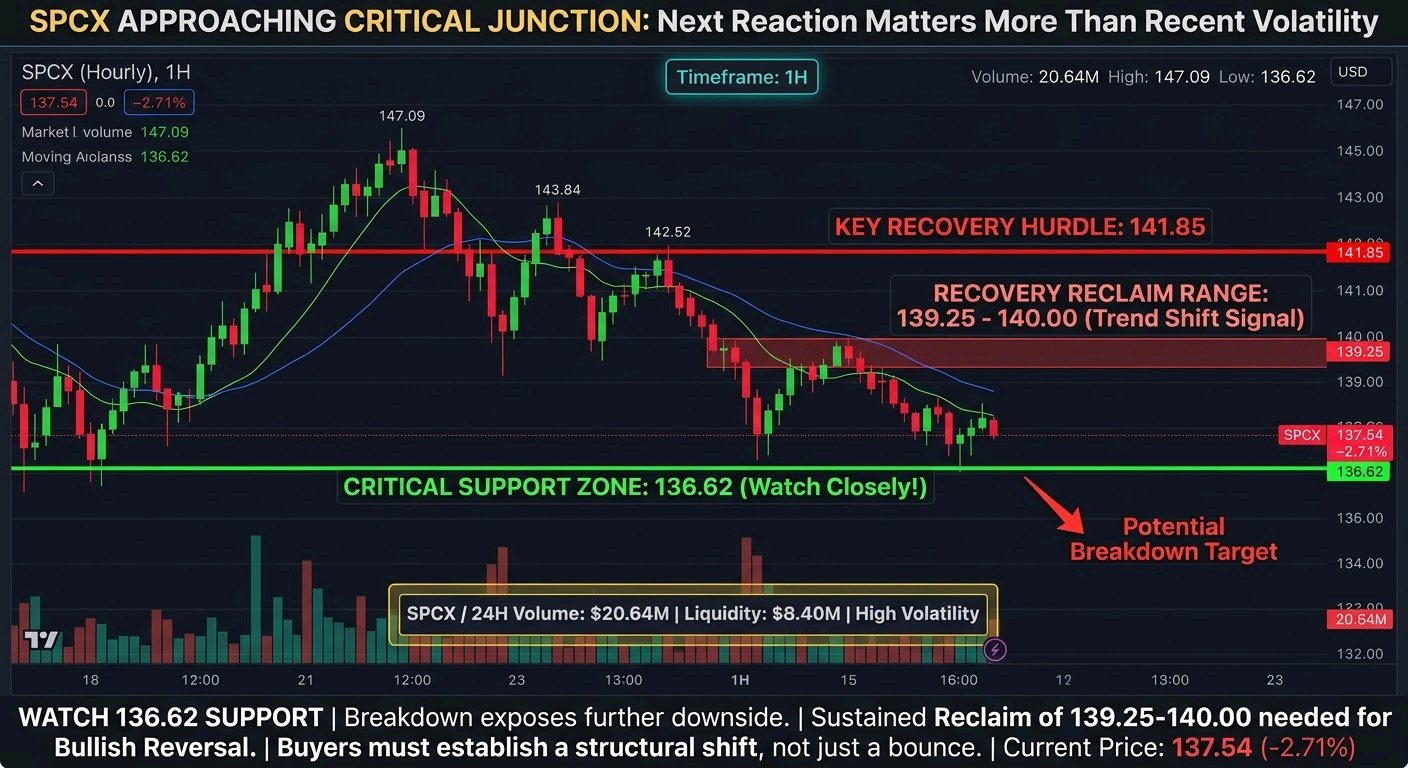
$SPCXXUSDT is approaching a level where the next reaction matters more than the recent volatility. Trading at 137.54, SPCX has fallen 2.71%, retreating from its 147.09 hourly high toward support near 136.62. What stands out is the structure of the decline: repeated recovery attempts have failed to establish a higher high, while the latest sell-off has brought price back toward the bottom of its recent range. The reported $20.64M in 24-hour volume against an $8.40M liquidity figure suggests substantial trading activity relative to available liquidity, although these metrics alone cannot establish whether demand is sustainable or predominantly speculative. I would watch 136.62 closely. A decisive breakdown could expose SPCX to further downside, while a sustained reclaim of 139.25–140.00 would be an early sign that buyers are regaining control. The 141.85 region remains an important recovery hurdle. The critical question is not whether SPCX can bounce from support, but whether buyers can turn that bounce into a structural reversal. Until price confirms that shift, a recovery remains an attempt—not a trend change. #WSOT2026
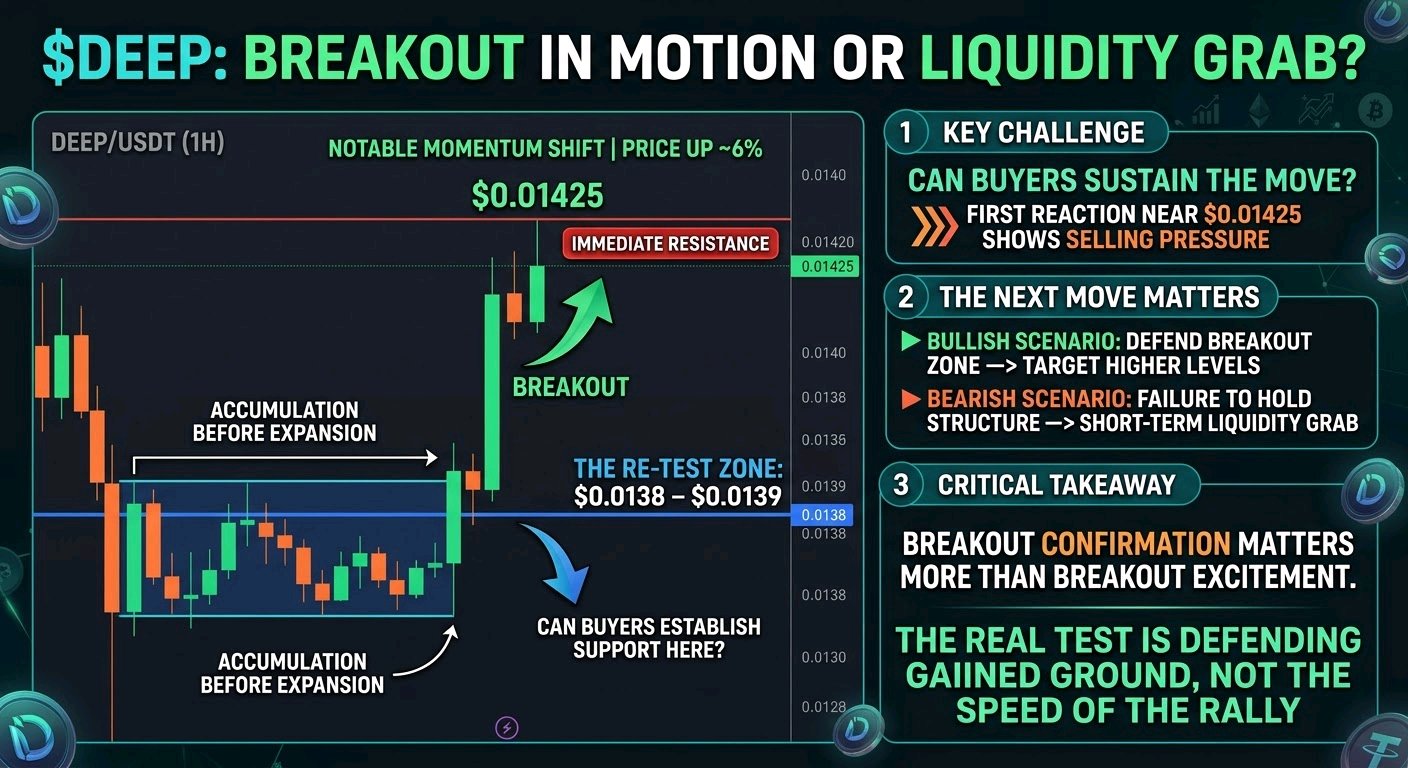
$DEEPUSDT : A Breakout Is Taking Shape, But Can Buyers Sustain It? DEEP/USDT is showing a notable shift in short-term momentum. Price has climbed nearly 6%, breaking out of its previous consolidation and reaching $0.01425. What catches my attention isn't simply the sharp green candle, but the accumulation of higher prices before the expansion. However, the first reaction near $0.01425 has introduced some selling pressure. This is where the next move becomes important. If buyers defend the breakout zone and establish support, another attempt toward higher levels becomes increasingly plausible. Failure to hold that structure could turn this impulse into a short-term liquidity grab. I'm watching $0.01425 as the immediate resistance and the $0.0138–$0.0139 region as a potential retest area. The real test isn't how quickly DEEP rallies. It's whether buyers can defend the ground they've just gained. Breakout confirmation matters more than breakout excitement. #WSOT2026
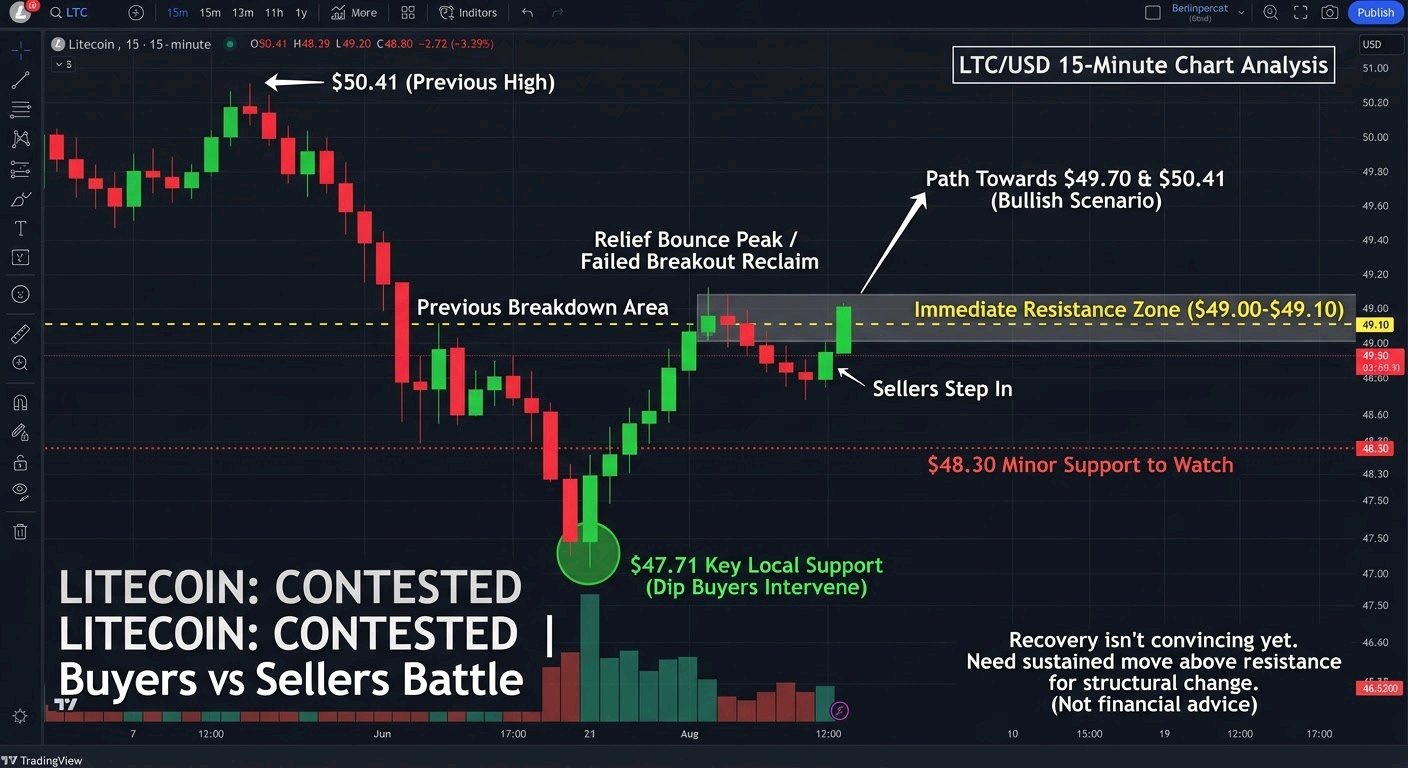
Litecoin is showing an interesting battle between dip buyers and sellers, but the recovery isn't convincing yet. On the 15-minute chart, $LTCUSDT dropped sharply from $50.41 to $47.71 before attracting buyers. The rebound pushed price back toward $49.10, but sellers quickly stepped in again, bringing it down to $48.80. What stands out to me is that buyers managed to recover from the lows, but couldn't reclaim the previous breakdown area. That's an important distinction: a relief bounce doesn't necessarily mean the short-term trend has reversed. I'm watching $49.00–$49.10 as the immediate resistance zone. A sustained move above it could reopen the path toward $49.70 and eventually $50.41. On the downside, $48.30 is worth watching, while $47.71 remains the key local support. The bigger question isn't whether LTC can bounce. It's whether buyers have enough strength to turn that bounce into a genuine change in market structure. For now, I'd rather see confirmation than chase the recovery. #AnthropicIPOTestsTheAIBoom
$INITUSDT : A 20% Drop Has Changed the Market Structure. Is the Selling Finally Exhausted? INIT is showing the kind of price action that demands patience rather than an aggressive entry. After falling from the $0.1300 area, the token has lost more than 20% in 24 hours, recently testing $0.10414 before attempting to stabilize around $0.1070. What I find interesting is that the selling pressure has slowed near the lows, but buyers haven't demonstrated enough strength to establish a genuine reversal. The recent rebounds are relatively small, and the repeated rejection around $0.1090–$0.1110 suggests sellers are still active. The important distinction here is between a market that has stopped falling and one that is actually recovering. Those are two very different things. For now, $0.1041 is the immediate level to defend. A sustained recovery above $0.1105 could improve the short-term structure, with $0.1170 becoming the next meaningful resistance. However, losing $0.1041 would expose INIT to another potential downside leg. I'm more interested in seeing buyers reclaim resistance with convincing volume than trying to catch a falling knife. The next move matters, but the quality of the buying pressure matters even more. #NovUSCPIWatch

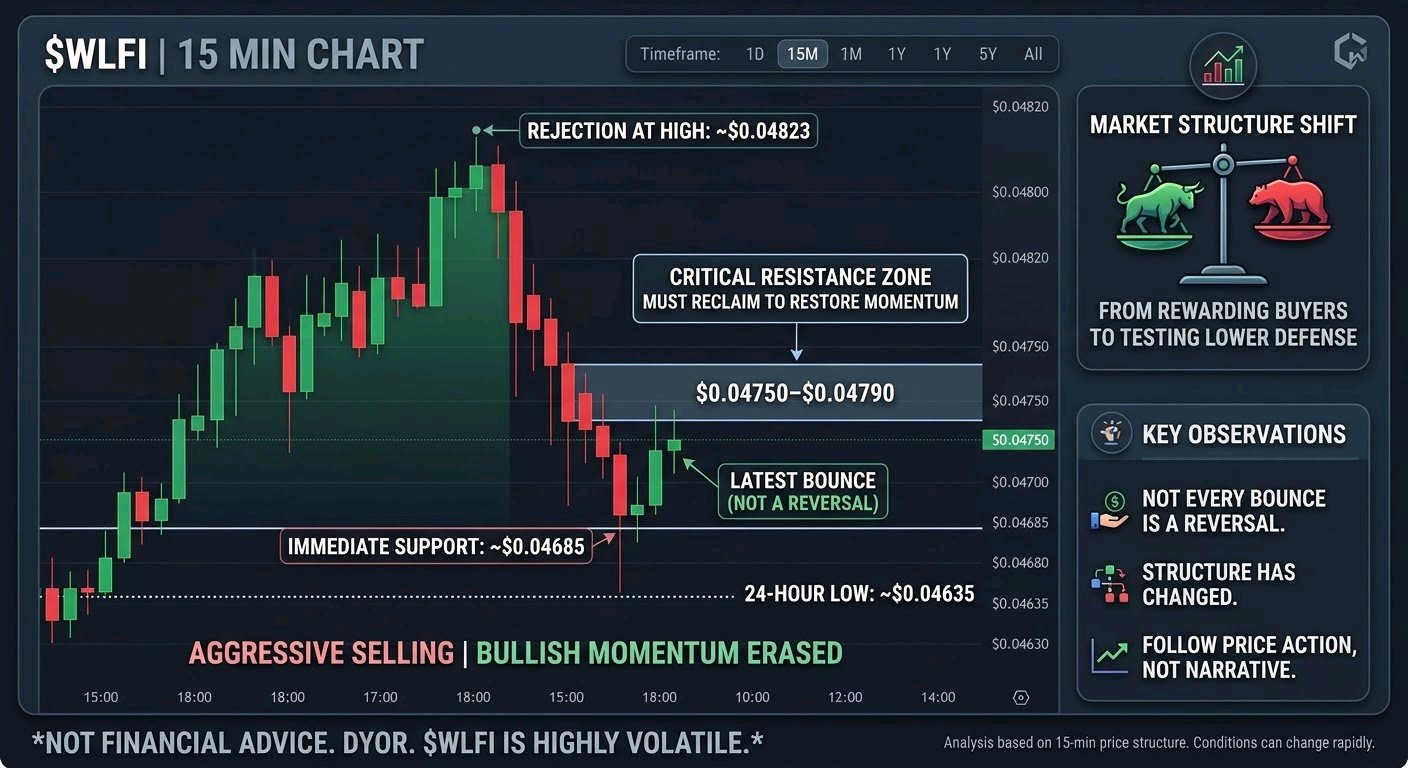
$WLFIUSDT : The Rebound Looks Interesting, But the Structure Has Changed. What stands out on the 15-minute chart is not the initial rally, but how aggressively sellers erased it. climbed toward $0.04823 before facing a sharp rejection. The subsequent sell-off pushed price down to approximately $0.04685, exposing how quickly bullish momentum can disappear when buyers fail to defend higher levels. The latest green candle shows some buying interest, but I wouldn't interpret one rebound as a confirmed reversal. For now, this looks more like a reaction after aggressive selling than evidence of a fresh bullish trend. The important area to watch is $0.04750–$0.04790. Reclaiming this region could help restore short-term momentum. On the downside, $0.04685 is the immediate support to monitor, followed by the 24-hour low around $0.04635. My biggest observation: the market has shifted from rewarding buyers on the way up to testing whether they are willing to defend lower prices. The next move matters less than how price behaves around these levels. A sustained recovery would challenge the bearish structure, while another rejection could leave sellers in control. Not every bounce is a reversal, and not every breakdown guarantees continuation. Follow the price action, not the narrative. Not financial advice. DYOR. #WSOT2026
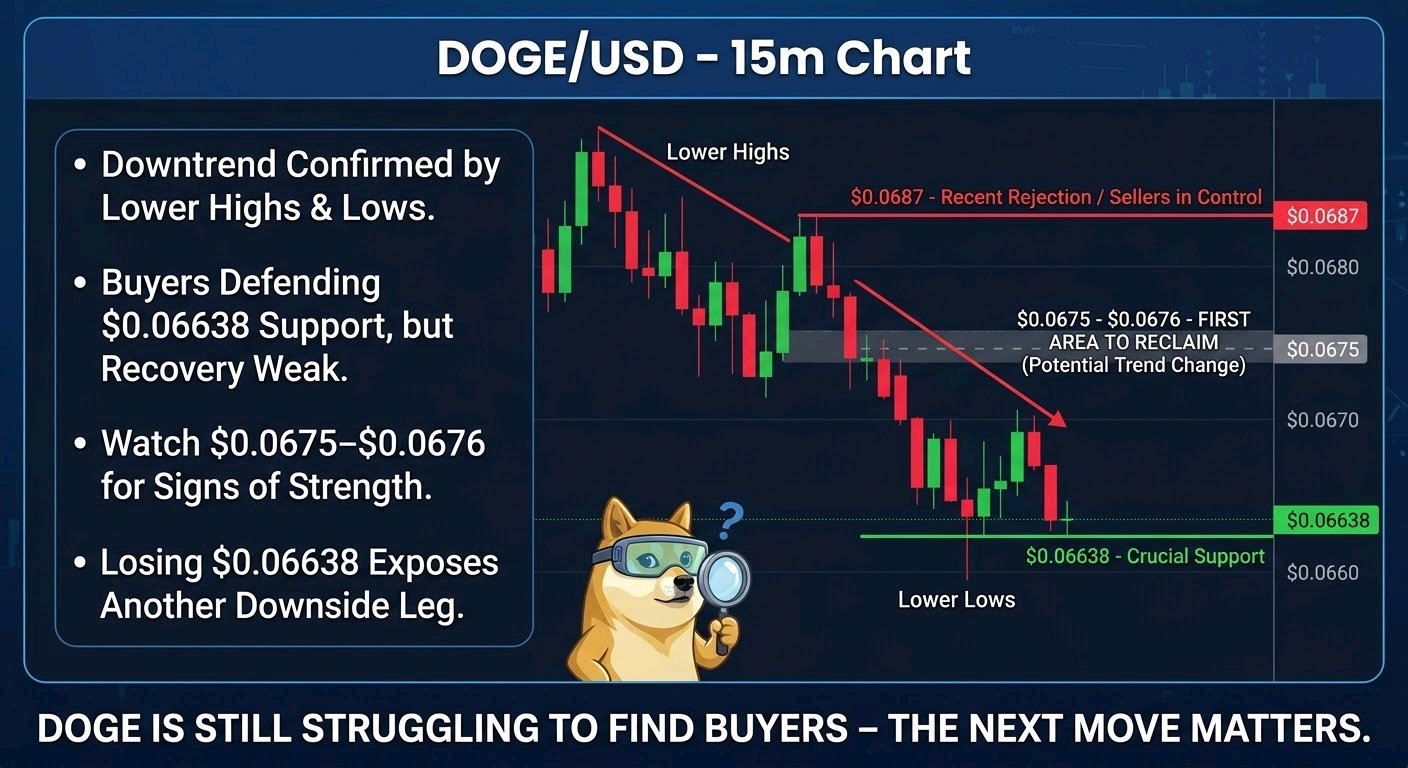
$DOGEUSDT Is Still Struggling to Find Buyers — The Next Move Matters. I'm watching DOGE closely on the 15-minute chart. The price has been printing lower highs and lower lows after rejection near $0.0687, suggesting sellers still have control of the short-term structure. What interests me is the reaction around $0.06638. Buyers have stepped in several times, but the recovery remains relatively weak. This is an important distinction: defending support is not the same as reversing a downtrend. For me, $0.0675–$0.0676 is the first area bulls need to reclaim. A sustained move above it could open the door toward $0.0680 and potentially higher. However, losing $0.06638 would expose DOGE to another downside leg. I'm not convinced this is a reversal yet. I want to see stronger buying pressure and a clear break in the lower-high structure before changing my short-term outlook. The real question is whether buyers are accumulating here or simply delaying another move lower. #BitcoinHitsTwoMonthLowAfterUSMidterms
$SUIUSDT is struggling to turn its latest bounce into a genuine reversal. What stands out to me is the sequence of lower highs and lower lows on the 15-minute chart. The recovery from $0.8097 showed some buying interest, but sellers quickly regained control near the $0.8250–$0.8270 region. At $0.8186, SUI is approaching an important short-term decision zone. The $0.8097 low is the key support to watch. A breakdown could extend the bearish structure, while reclaiming $0.8260–$0.8320 would be an early indication that buyers are regaining momentum. I wouldn't call this a reversal yet. The more interesting question is whether buyers can defend the recent low or whether this bounce was simply an opportunity for sellers to re-enter. For now, SUI needs confirmation, not speculation. #BybitAIEvolving

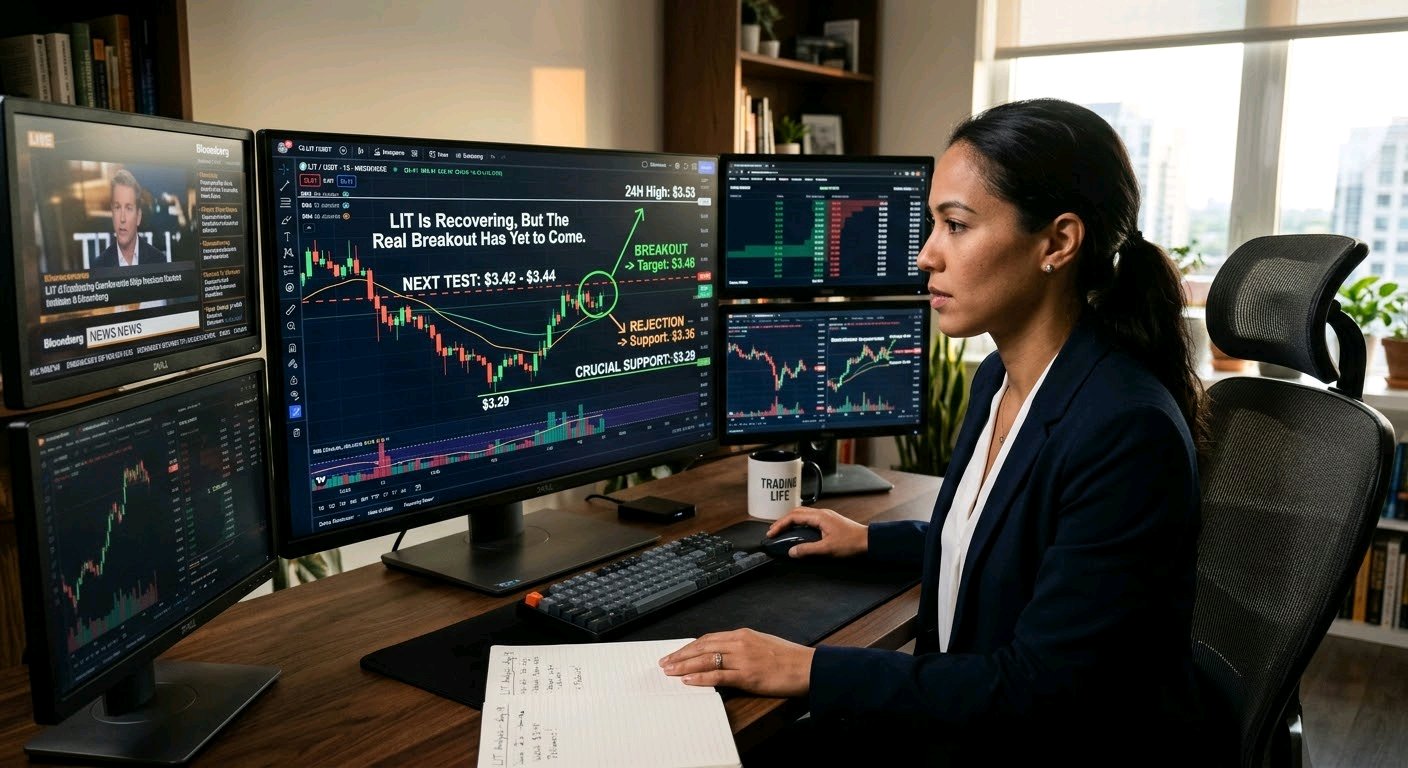
$LITUSDT Is Recovering, But the Real Breakout Has Yet to Come. LIT is showing renewed buying interest after recovering from the intraday low near $3.29. Price is now around $3.41, but what interests me more is the structure behind this move: buyers have defended the lower range, yet they still haven't established control above the previous rejection zone. The immediate test sits around $3.42–$3.44. A sustained move above this area could open the door toward $3.48, followed by the 24H high near $3.53. However, another rejection could send price back toward $3.36, with $3.29 remaining the more important downside reference. I wouldn't confuse a strong 15-minute recovery candle with a confirmed trend reversal. The next few candles need to show whether buyers can maintain momentum rather than simply push price higher temporarily. My view: LIT is showing an interesting recovery setup, but confirmation matters more than chasing the green candle. I'm watching how price reacts around $3.44 before drawing a stronger conclusion. #BybitAIEvolving
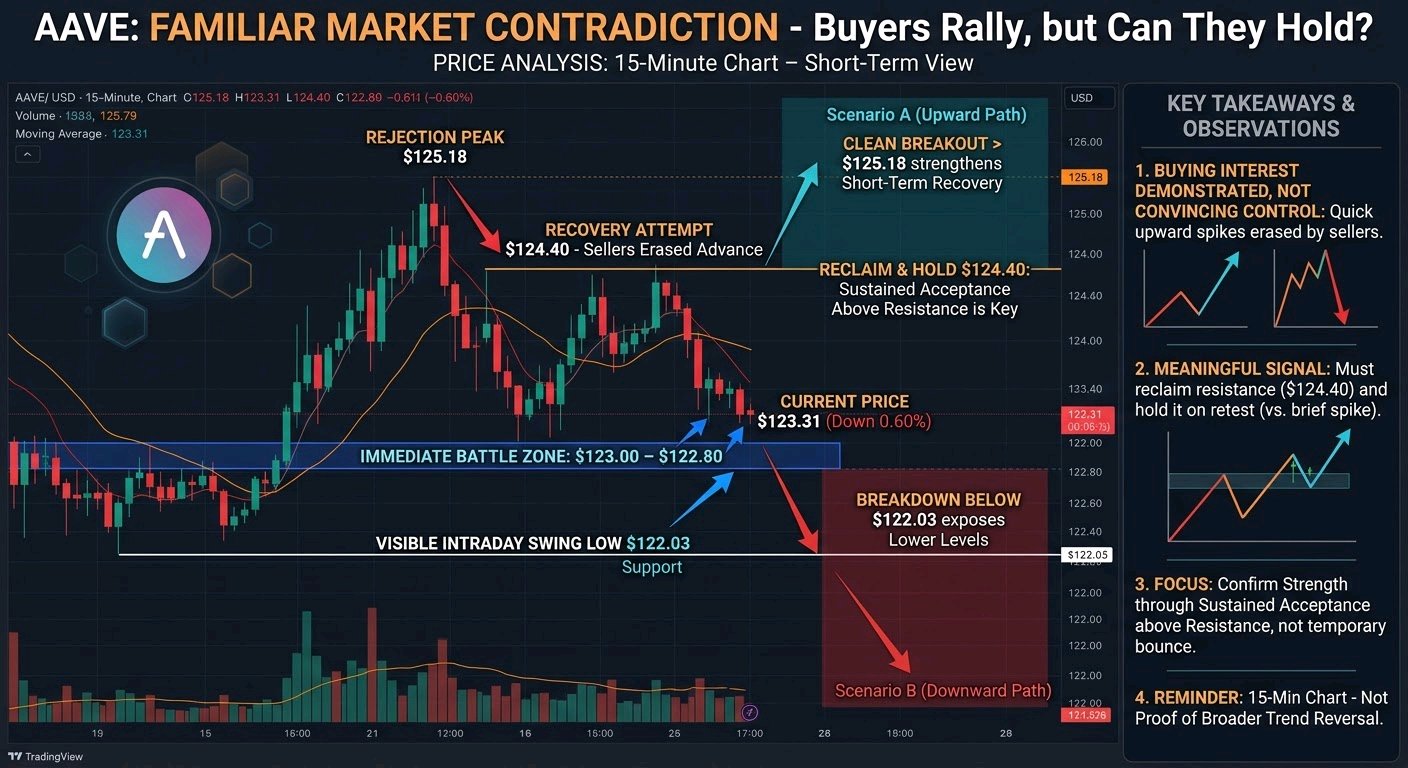
$AAVEUSDT Is Showing a Familiar Market Contradiction: Buyers Can Rally Price, but Can They Hold It? AAVE is trading near $123.31, down 0.60%, after a sharp rejection from $125.18 on the 15-minute chart. What stands out to me is not the pullback itself, but the inability to sustain the latest recovery toward $124.40. Buyers pushed price higher, yet sellers quickly erased much of that advance. The immediate battle is around $123.00–$122.80, with $122.03 marking the visible intraday swing low. Holding this area could give buyers another opportunity to challenge $124.40 and $125.18. A clean breakout above $125.18 would strengthen the short-term recovery, while a breakdown below support would expose the market to another test of lower levels. My main observation is that AAVE has demonstrated buying interest, but not yet convincing control. The next meaningful signal will be whether buyers can reclaim resistance and hold it on a retest, rather than simply producing another brief upward spike. This is a short-term chart, not proof of a broader trend reversal. I would rather see price confirm strength through sustained acceptance above resistance than mistake a temporary bounce for renewed demand. #BybitAIEvolving
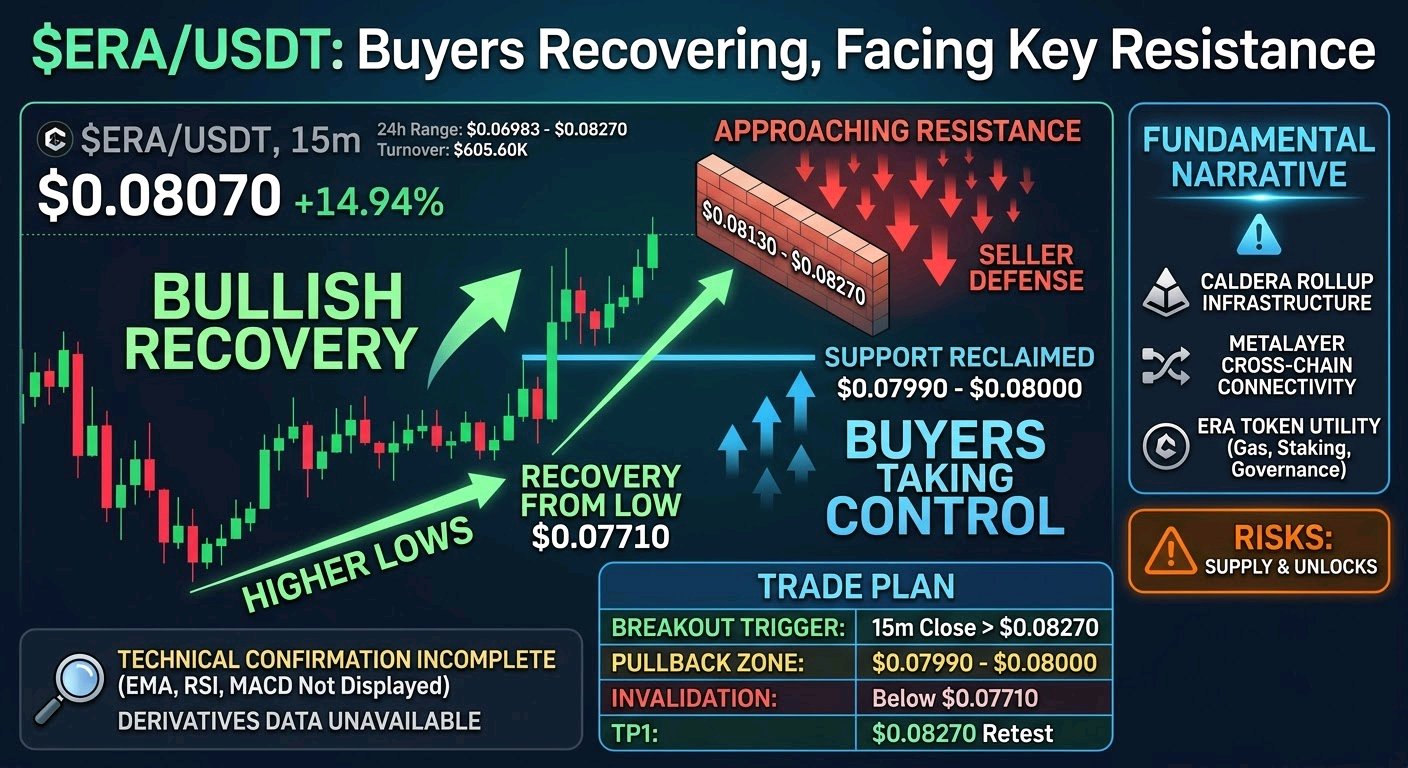
$ERAUSDT : Buyers Are Taking Control, But Resistance Is Approaching is showing strong bullish momentum on the 15-minute chart, trading at $0.08070, up 14.94%. The important signal is its recovery from the $0.07710 chart low, followed by a series of higher lows and a push toward $0.08270. The 24-hour range stands at $0.06983–$0.08270, with turnover around $605.60K. Price has reclaimed the $0.07990 area and is attempting to maintain its recovery above $0.08000. However, the recent rejection near $0.08130–$0.08270 deserves attention. Strong price action is bullish, but resistance is still attracting sellers. This is the first major contradiction traders should monitor. The fundamental narrative remains relevant: Caldera is building rollup infrastructure and its Metalayer connects blockchain ecosystems. ERA has utility linked to cross-rollup gas, staking and governance. Binance +1 However, token supply and unlocks remain important risks. Technical confirmation: EMA200, RSI, MACD, Fibonacci and volume MA5/MA10 are not displayed, so trend confirmation remains incomplete. Derivatives positioning and liquidation data are also unavailable. Trade Plan: * Breakout trigger: 15m close above $0.08270. * Pullback zone: $0.07990–$0.08000. * Invalidation: Below $0.07710. * TP1: $0.08270 retest. * TP2/TP3: Require higher-timeframe resistance data. My outlook is cautiously bullish while price holds above $0.07990. A confirmed breakout with stronger volume could support continuation, while rejection and a loss of support would weaken the recovery thesis. What matters next: Can buyers turn $0.08270 into support, or will sellers defend this resistance again? #BybitAIEvolving
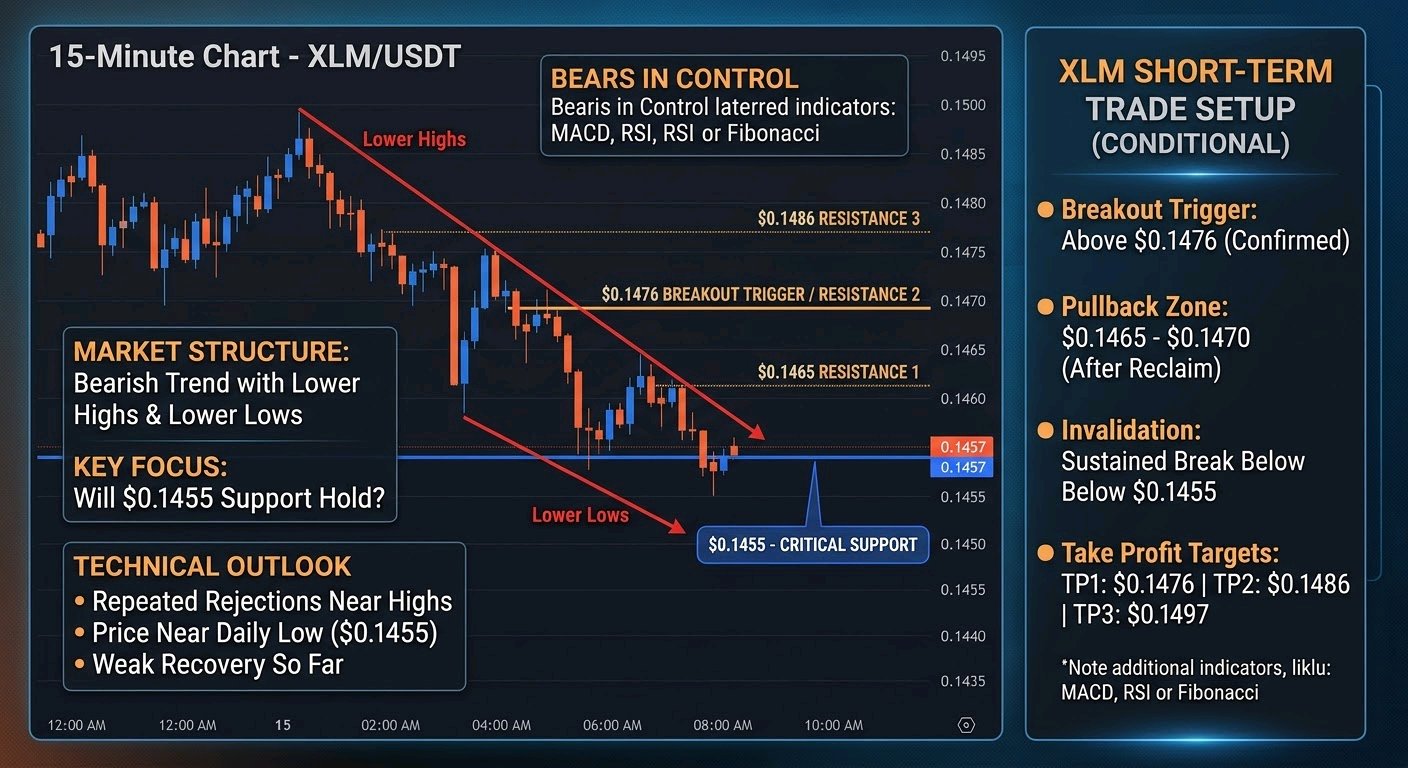
$XLMUSDT : Bears Are in Control — But Will $0.1455 Hold? Stellar Lumens ($XLM) is facing renewed selling pressure, and the key signal traders should not ignore is its repeated formation of lower highs and lower lows on the 15-minute chart. Price is currently at $0.1457, down 1.35%, hovering just above critical support. Market Structure: XLM reached a 24-hour high of $0.1501 and a low of $0.1455. After climbing toward $0.1497, price reversed sharply, losing several intraday support levels. The latest candles show only a modest recovery, not a confirmed reversal. The EMA200 position cannot be verified from the screenshot. Key Levels: Immediate support sits at $0.1455. A breakdown could expose further downside, while resistance appears around $0.1465, $0.1476, and $0.1486. Reclaiming these levels would be necessary to improve the short-term structure. Technical Outlook: MACD, RSI, Fibonacci levels, and volume comparisons cannot be confirmed because their readings are not displayed. The chart's bearish price action contrasts with the small rebound near support. Additionally, proximity to the daily low creates a potential bounce opportunity but also increases breakdown risk. Fundamental Context: Stellar's payment-focused blockchain and cross-border transfer utility support its long-term narrative, but fundamentals alone cannot reverse immediate selling pressure. Conditional Setup: Breakout trigger: Above $0.1476 with confirmation. Pullback zone: $0.1465–$0.1470 after reclaim. Invalidation: Sustained breakdown below $0.1455. TP1: $0.1476 | TP2: $0.1486 | TP3: $0.1497. A confirmed support break would weaken the recovery thesis. Will XLM defend $0.1455 or break lower? Share your view. #BybitAIEvolving
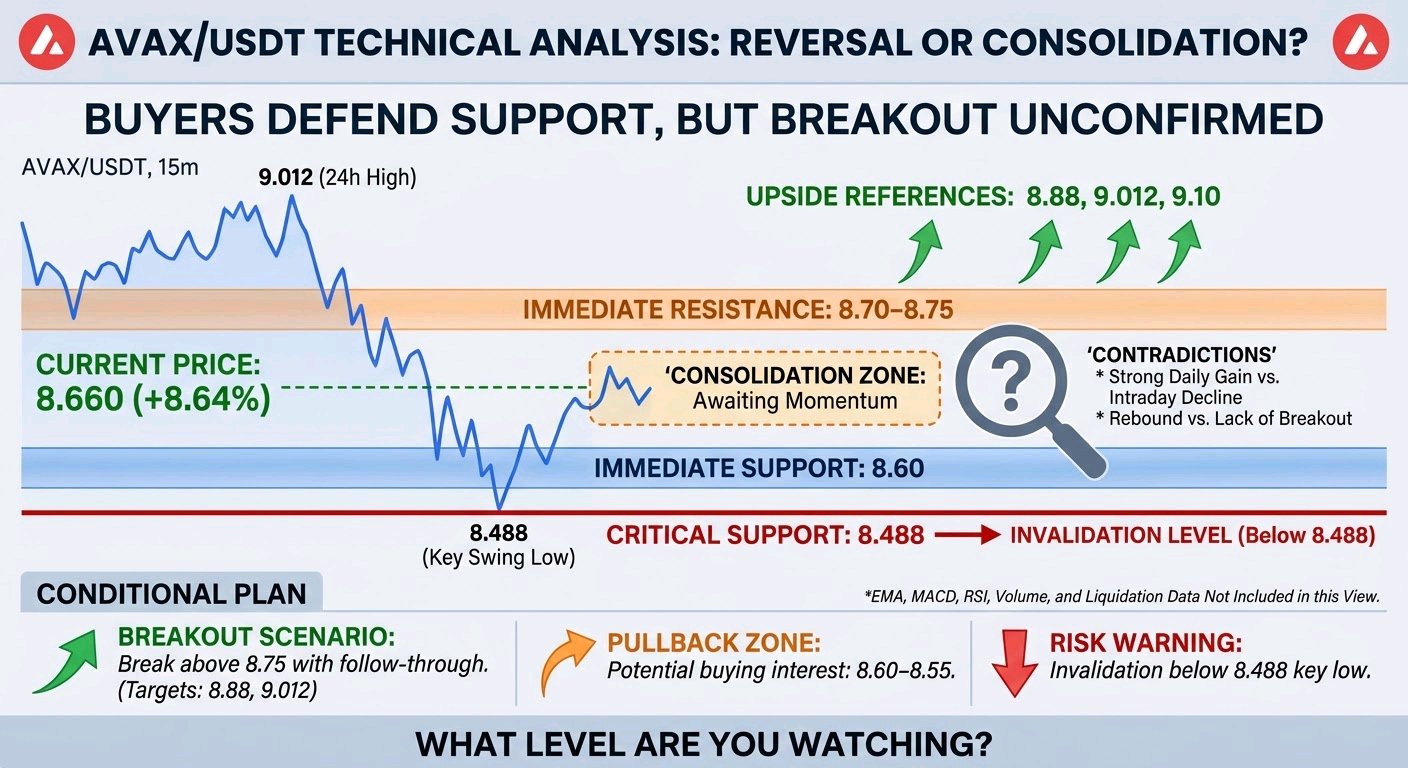
$AVAXUSDT : Buyers Are Defending Support, But Is a Reversal Coming? AVAX/USDT is trying to stabilize after a sharp intraday selloff, but the 15-minute chart has not confirmed a trend reversal. The key signal is the rebound from 8.488 followed by sideways trading around 8.660: buyers defended the low, yet upside continuation remains unproven. AVAX is quoted at 8.660, up 8.64%, with a 24-hour high of 9.012, low of 7.816 and turnover of 8.43M. The visible structure shows a decline from 9.012 to 8.488, followed by recovery. Near-term resistance sits around 8.70–8.75, while 8.60 is immediate support and 8.488 the key swing low. Two contradictions stand out: the strong daily gain contrasts with the preceding decline, and the rebound has become consolidation rather than a decisive breakout. Chasing price here carries risk. EMA200, MACD, RSI, volume averages and Fibonacci levels are not displayed, so momentum and trend strength remain unconfirmed. Avalanche’s platform utility is relevant context, but this chart shows no fresh fundamental catalyst. **Conditional plan:** Breakout above 8.75 with follow-through; pullback zone 8.60–8.55; invalidation below 8.488. Upside references are 8.88, 9.012 and 9.10, only if momentum expands. Monitor liquidity and leverage; liquidation data is unavailable. Holding above resistance would improve the short-term bullish case materially. What level are you watching? #BybitAIEvolving
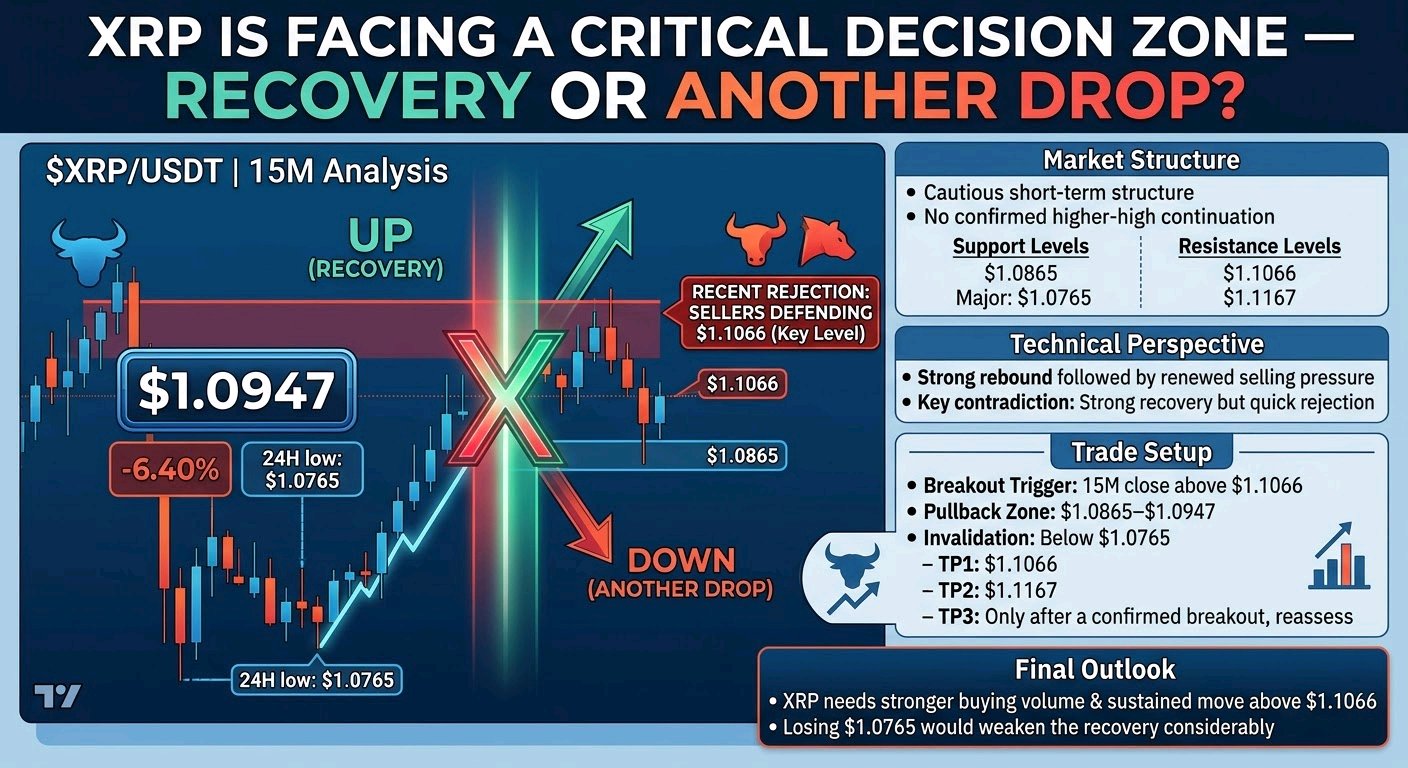
$XRPUSDT IS FACING A CRITICAL DECISION ZONE — RECOVERY OR ANOTHER DROP? $XRP/USDT | 15M Analysis XRP is trading at $1.0947, down 6.40%, after a sharp recovery from its 24H low of $1.0765. However, the recent rejection near $1.1066 shows that sellers are still defending higher prices. This is an important level traders should not ignore. Market Structure The short-term structure remains cautious. XRP has recovered from $1.0765 but has not established a confirmed higher-high continuation. Immediate resistance sits at $1.1066, followed by $1.1167. Support is around $1.0865, with major support at $1.0765. Technical Perspective The chart shows a strong rebound followed by renewed selling pressure. EMA200, MACD, RSI, volume averages, and Fibonacci levels are not displayed, so their signals cannot be confirmed. The key contradiction is that buyers produced a strong recovery, yet sellers quickly rejected the move. Trade Setup - Breakout Trigger: 15M close above $1.1066. - Pullback Zone: $1.0865–$1.0947. - Invalidation: Below $1.0765. - TP1: $1.1066 - TP2: $1.1167 - TP3: Only after a confirmed breakout, reassess higher resistance. Final Outlook XRP needs stronger buying volume and a sustained move above $1.1066 to improve its short-term outlook. Losing $1.0765 would weaken the recovery considerably. Is this a recovery worth watching, or just another relief bounce? #WSOT2026
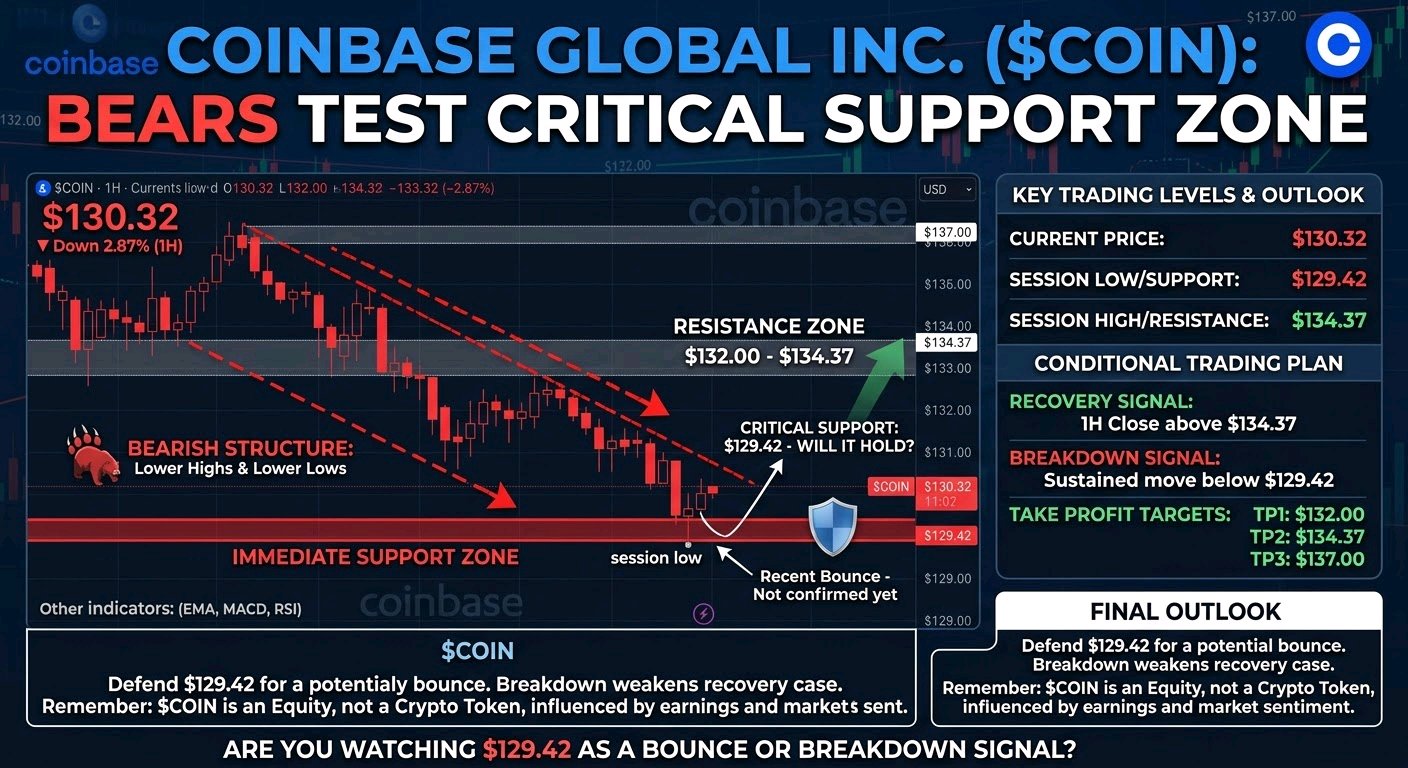
$COINXUSDT : Bears Are Testing a Critical Support Zone — Will $129.42 Hold? Coinbase Global Inc. ($COIN) is under clear selling pressure, trading at $130.32, down 2.87% on the 1-hour chart. The key signal traders should not ignore is the persistent sequence of lower highs and lower lows, suggesting sellers remain in control. Key Market Levels - Current price: $130.32 - Session high: $134.37 - Session low: $129.42 - Immediate support: $129.42 - Initial resistance: $132.00–$134.37 Price has declined steadily from the $138–$139 region, with only brief recovery attempts. The latest bounce near $129.42 is not yet sufficient to confirm a reversal. A sustained move above $134.37 would provide an initial recovery signal, while a breakdown below $129.42 could expose further downside. Technical Perspective The chart shows bearish short-term momentum, but EMA200, MACD, RSI, trading volume, and Fibonacci readings are not displayed. Therefore, a broader trend confirmation remains unavailable. Conditional Trading Plan Breakout trigger: 1H close above $134.37 with stronger volume. Pullback zone: $129.42–$130.00, only if support holds. Invalidation: Sustained breakdown below $129.42. TP1: $132.00 TP2: $134.37 TP3: $137.00, conditional on renewed momentum. Final Outlook COIN needs to defend $129.42 and reclaim resistance to challenge the bearish structure. A decisive breakdown would weaken the recovery case. Remember, COIN is an equity, not a cryptocurrency token, and its price can respond to Coinbase earnings, crypto-market sentiment, and broader equity conditions. Are you watching $129.42 as a potential bounce zone or a breakdown signal? #BybitAIEvolving
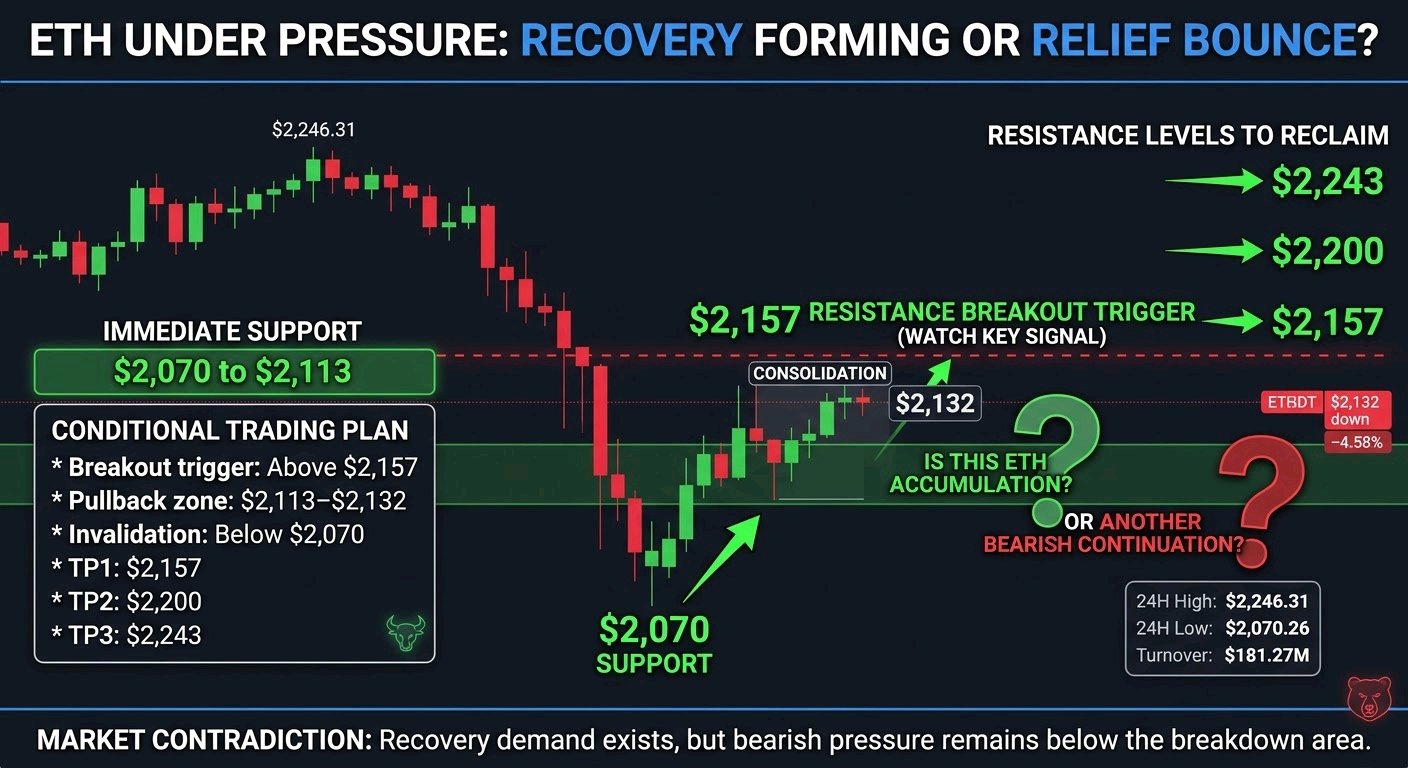
$ETHUSDT IS UNDER PRESSURE AFTER A SHARP SELLOFF — IS A RECOVERY FORMING OR JUST A RELIEF BOUNCE? Ethereum is trading around $2,132.62, down 4.58%, and the 15-minute chart shows a significant bearish impulse followed by a short-term recovery. The key signal traders should watch is whether buyers can reclaim the $2,157 resistance. Market Structure ETH recorded a 24H high of $2,246.31 and a low of $2,070.26, with $181.27M in turnover. After the aggressive selloff, price bounced from $2,070 but is now consolidating around $2,132. Immediate support sits near $2,113, followed by the major low at $2,070. Resistance stands at $2,157, $2,200 and $2,243. Technical Perspective The recovery is encouraging, but the chart does not yet confirm a bullish reversal. EMA200, RSI, MACD, Fibonacci levels and volume averages are not displayed, so their signals cannot be verified. Market Contradiction Buyers defended the $2,070 low, yet price remains below the previous breakdown area. This suggests recovery demand exists, but bearish pressure has not clearly disappeared. Conditional Trading Plan * Breakout trigger: Above $2,157 * Pullback zone: $2,113–$2,132 * Invalidation: Below $2,070 * TP1: $2,157 * TP2: $2,200 * TP3: $2,243 Ethereum's ecosystem utility remains a long-term strength, but short-term price action needs confirmation. Are we witnessing ETH accumulation or another bearish continuation? #BybitAIEvolving
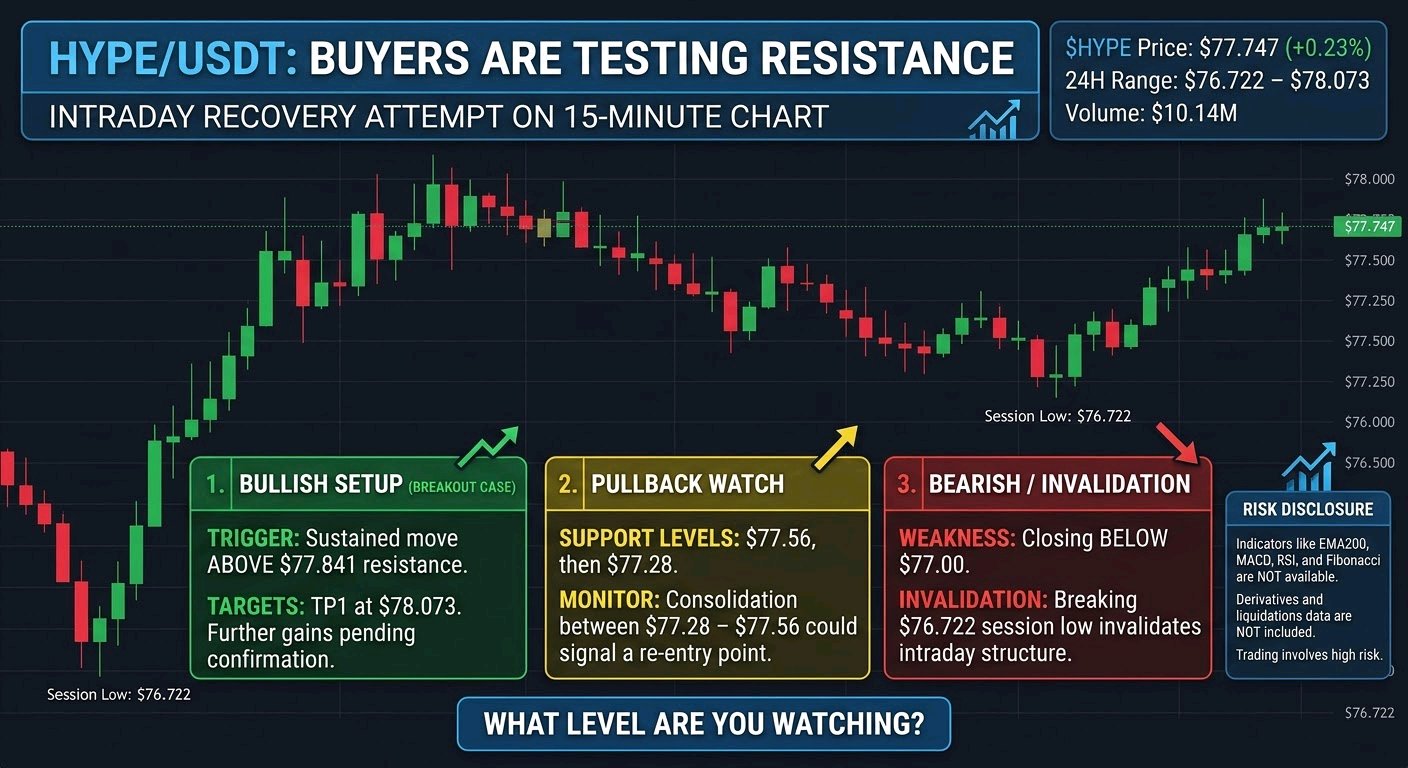
$HYPEUSDT : Buyers Are Testing Resistance HYPE is attempting a recovery on the 15-minute chart, with price at $77.747, up 0.23%. The key signal is the rebound from the session low: buyers have reclaimed nearby levels, but resistance still needs confirmation. The displayed 24-hour range is $76.722–$78.073, with turnover at $10.14M. Price rebounded from $76.722, reclaimed roughly $77.56, and is approaching $77.841. A sustained move above $77.841 would strengthen the breakout case; $78.073 is the next visible hurdle. Failure above resistance could return price to the recent intraday range. Support sits around $77.56, then $77.28 and $77.00. Losing $77.00 would weaken the recovery; a break below $76.722 would invalidate this intraday bullish structure. EMA200, MACD, RSI, volume averages and Fibonacci levels are not visible, so they cannot be responsibly assessed. Derivatives positioning and liquidation levels are also unavailable. Hyperliquid’s relevance is tied to its on-chain perpetuals and trading ecosystem, but this screenshot cannot establish fresh adoption or institutional flows. The contradiction: strong rebound candles are meeting nearby resistance, while confirmation indicators remain unavailable. Conditional setup: breakout above $77.841; pullback watch $77.56–$77.28; invalidation below $77.00; TP1 $78.073. Further targets require a fresh chart and confirmed resistance levels. What level are you watching? #BybitAIEvolving
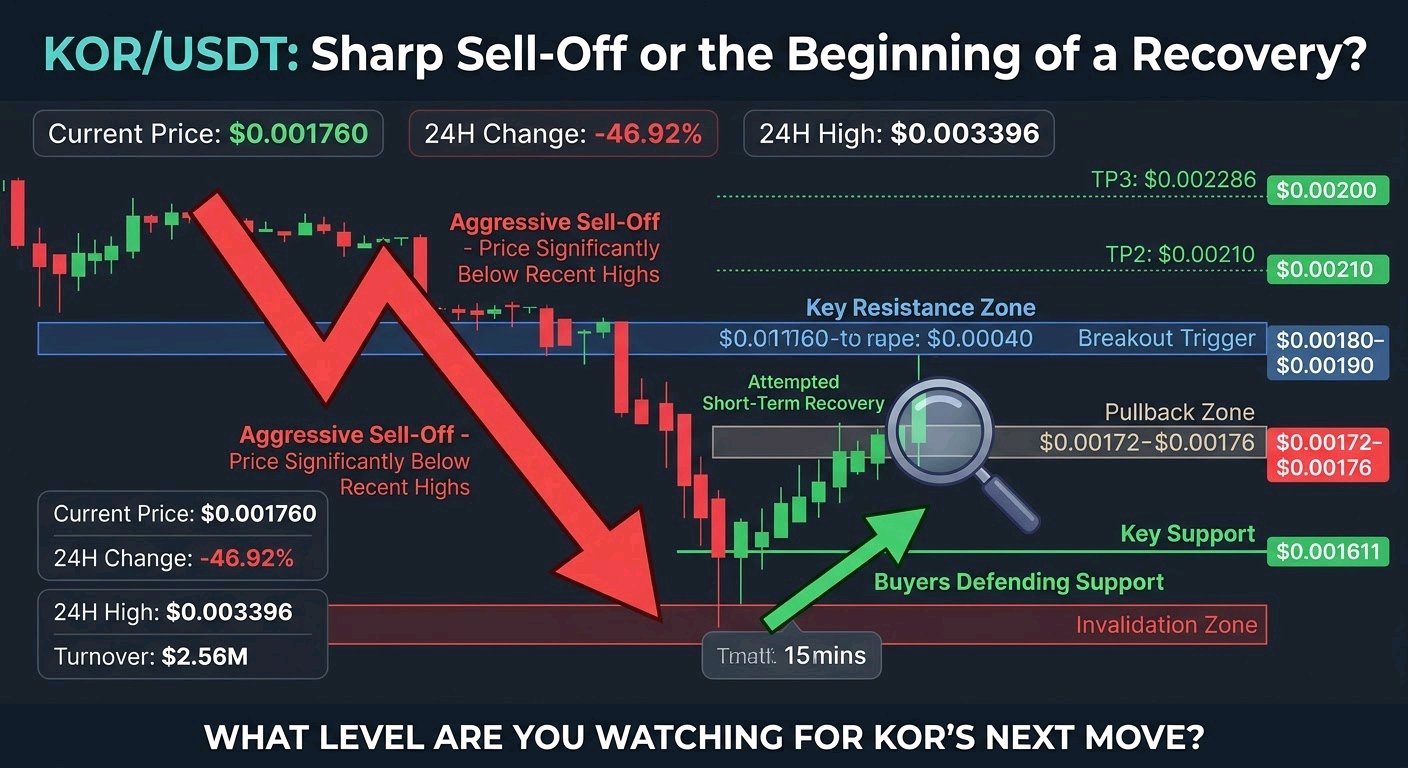
$KORUSDT : Sharp Sell-Off or the Beginning of a Recovery? KOR is attempting a short-term recovery after an aggressive sell-off, but one important signal deserves attention: price remains significantly below its recent highs, meaning buyers have yet to establish a confirmed reversal. Market Structure: KOR currently trades at $0.001760, down 46.92%. The 24H high stands at $0.003396, while the low is $0.001611, with $2.56M in turnover. The 15-minute chart shows a sharp rally toward $0.002286, followed by declining highs and renewed selling pressure. Recent candles suggest buyers are defending the $0.00165–$0.00170 area. Technical Perspective: Immediate resistance sits around $0.00180–$0.00190. A sustained reclaim could open the way toward $0.00200 and $0.002286. However, the chart does not provide EMA200, MACD, RSI, Fibonacci, or volume-average readings, so momentum confirmation remains incomplete. Market Contradiction: Price is showing a modest rebound, but the broader short-term structure remains weak. Buyers are defending support without yet reclaiming meaningful resistance. Key Trading Levels: - Breakout trigger: $0.00190 - Pullback zone: $0.00172–$0.00176 - Key support: $0.001611 - TP1: $0.00200 - TP2: $0.00210 - TP3: $0.002286 - Invalidation: Sustained breakdown below $0.001611. Final Outlook: KOR needs a convincing breakout with stronger buying volume to confirm recovery. Until then, this remains a potential relief bounce rather than an established trend reversal. What level are you watching for KOR's next move? #BybitAIEvolving