Hamii
75ចូលចិត្ត (Like)0ភាគហ៊ុន5អ្នកគាំទ្រ2តាមដាន
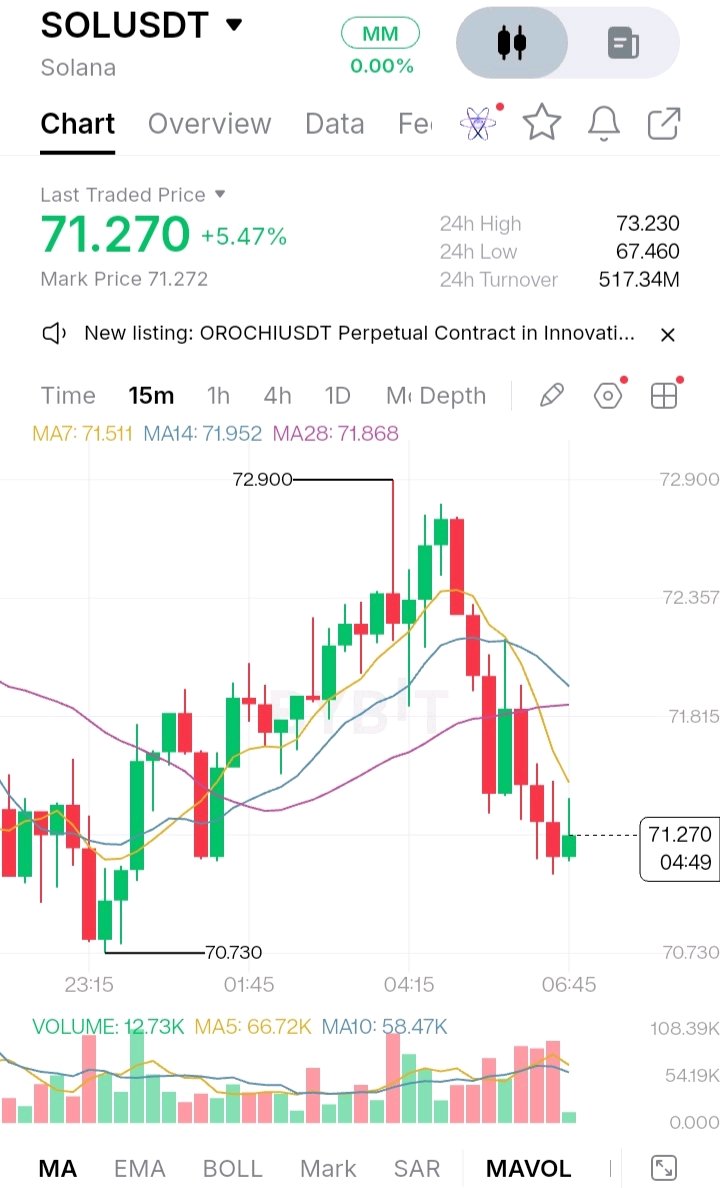
Solana is testing trader nerves right at a make or break intraday pivot after a sharp rejection near $72.900. Despite holding onto a solid 5.47% gain on the day with over 517.34M in 24h turnover the 15-minute SOLUSDT chart shows momentum hitting a clear wall. After climbing steadily off the 70.730 local low and pushing toward the 24h high of 73.230 sellers stepped in aggressively just under 72.900. That rejection triggered a swift pullback right through the short-term moving averages. Price is now trading at 71.270 sitting below the MA7 (71.511), MA14 (71.952) and MA28 (71.868), turning previous intraday support into immediate overhead resistance. For bulls, defending the 71.000 to 70.730 zone is now critical to keep the broader upward structure intact. If buyers can absorb this selling pressure and reclaim the 71.950 cluster, another run at the 73.230 high comes right back into play. Lose 70.730, however and the door opens for a deeper flush toward the 67.460 24h low. Watch how price reacts around 71.270 over the next few candles this level will decide whether the dip gets bought or turns into a full trend reversal. $SOLUSDT #ByXIMPACT
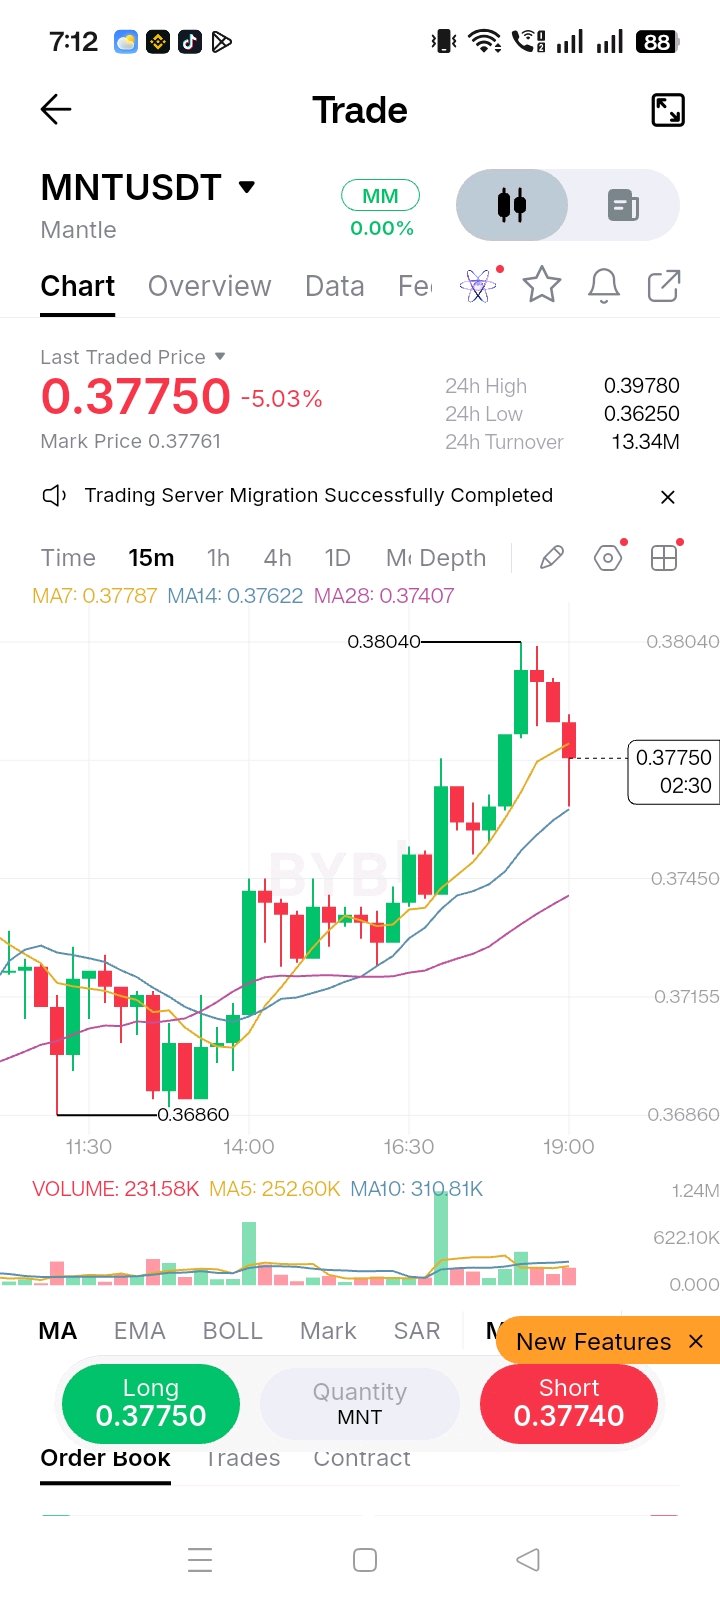
MNT Is Pulling Back After esting $0.3804. Is This Just a Pause or a Sign of Weakening Momentum?Mantle ($MNT) has made an interesting recovery on the 15-minute timeframe, but buyers are now facing a level they haven't managed to overcome.MNT recently climbed from around $0.36860 to $0.38040, showing a decent recovery. However, sellers stepped in near the local high pushing the price back toward $0.37750.One thing worth watching is that MNT is still holding above its MA14 at $0.37622 and MA28 at $0.37407. That suggests the short-term recovery has not completely broken down yet.But there is a weakness too. Price has slipped slightly below MA7 and the latest candles show some selling pressure after the rejection near $0.38040.Key Levels I'm Watching:Resistance: $0.38040First Support: $0.37620Next Support: $0.37400Major Recent Low: $0.36250My Market View:I would not rush into a LONG at the current level. If buyers defend $0.37620 and push the price back above $0.38040, the recovery could gain another opportunity.On the other hand losing $0.37620 could bring more pressure toward $0.37400.MNT is still down around 5.03% over 24 hours, so this recovery needs stronger buying confirmation before I consider it a meaningful shift in momentum.For now I am watching how price reacts around $0.37620. The next move from this area could tell us whether buyers still have control or sellers are preparing another push lower. $MNTUSDT #ByXIMPACT
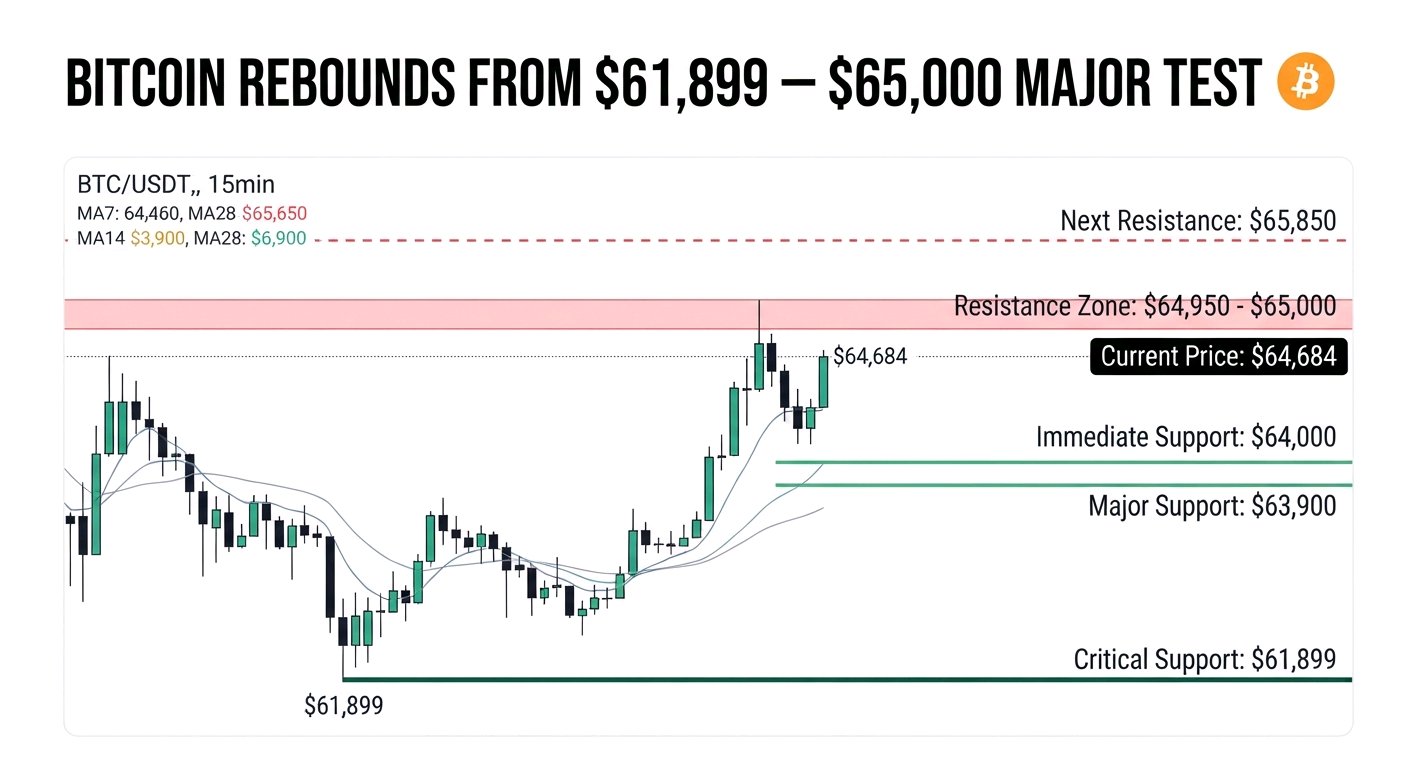
Bitcoin Rebounds From $61,899, But the $65,000 Level Is Becoming a Major Test Bitcoin has recovered strongly from its recent low, but the latest 15-minute movement suggests buyers are starting to lose some momentum. BTCUSDT is trading around $64,684, after dropping to $61,899 and then staging a sharp recovery toward $65,000. That rebound is important. Buyers managed to recover a significant portion of the previous decline, but they still haven't established strong control above the $65,000 area. Key Levels I'm Watching: Resistance: $64,950 to $65,000 Next Resistance: $65,850 Immediate Support: $64,000 Major Support: $63,900 Critical Support: $61,899 The moving averages also provide an intriguing picture. MA7 is around $64,914, while MA14 and MA28 are near $64,010. Price is currently below the short-term MA7 but remains above the other two averages. This suggests the recovery is still alive, although short-term momentum needs to improve. My Market View: I wouldn't rush into a LONG position at this level. Bitcoin needs to reclaim $65,000 with convincing buying pressure to strengthen the bullish case. If buyers fail to recover that level and BTC loses $64,000, another move toward lower support becomes possible. For now, the market is at an important decision point. The next move around $64,000 to $65,000 could tell us whether this recovery has enough strength to continue or whether sellers are preparing another push lower. Bitcoin's bounce is encouraging, but confirmation matters more than excitement. $BTCUSDT #BitcoinHitsTwoMonthLowAfterUSMidterms
ETH Is Struggling to Bounce Back. $1,875 Could Be the Next Big Test Ethereum is still looking weak after its recent drop. Buyers tried to push the price higher, but so far, the recovery hasn't been strong enough to change the short-term picture. ETH is trading around $1,883.80 down 2.75%. Earlier, it fell from nearly $1,955 and touched $1,875.78 before making a small recovery. I am paying close attention to the moving averages because ETH is still trading below all three: 🔴 MA7: $1,897.11 🔴 MA14: $1,909.75 🔴 MA28: $1,918.01 As long as price stays below these levels, sellers have the upper hand. Levels I'm Keeping an Eye On: • $1,875.78: Support that needs to hold • $1,895.76: First level ETH needs to recover • $1,915.74: Stronger resistance • $1,935.72: Next hurdle for buyers One thing I noticed was the increase in volume during the sharp drop. Selling activity picked up, but the small bounce afterward doesn't tell us much yet. My View: Right now, I have a SHORT bias on ETH. Still, I don't think chasing the price after such a big drop is a good idea. If ETH loses $1,875 and sellers remain active, we could see more downside. But if buyers manage to reclaim $1,897 and hold above it I would start looking at the recovery differently. I'm not rushing into either side here. I'd rather wait for ETH to show its next move than enter a trade based on guesswork. For now, $1,875 is the level I am watching most closely. The reaction around this area could tell us a lot about what comes next. $ETHUSDT #BYXIMPACT
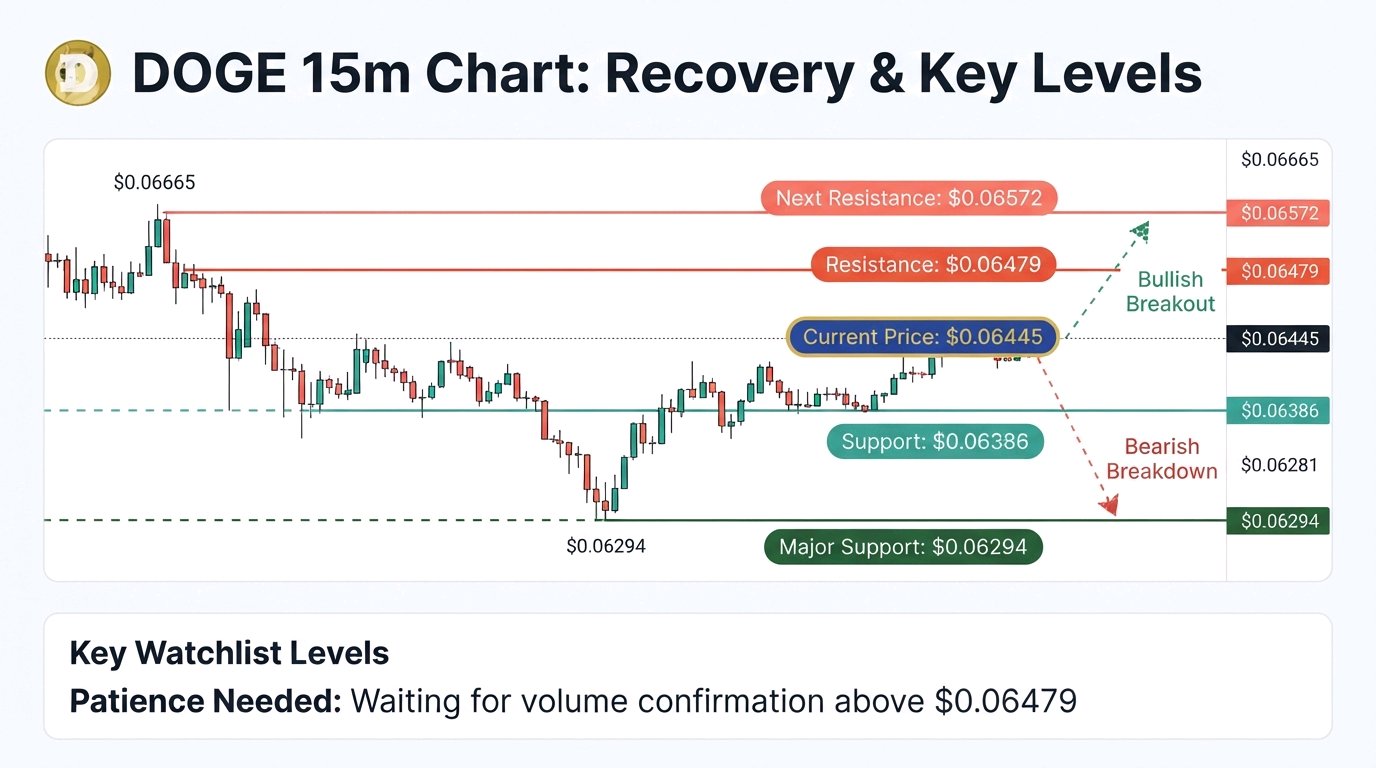
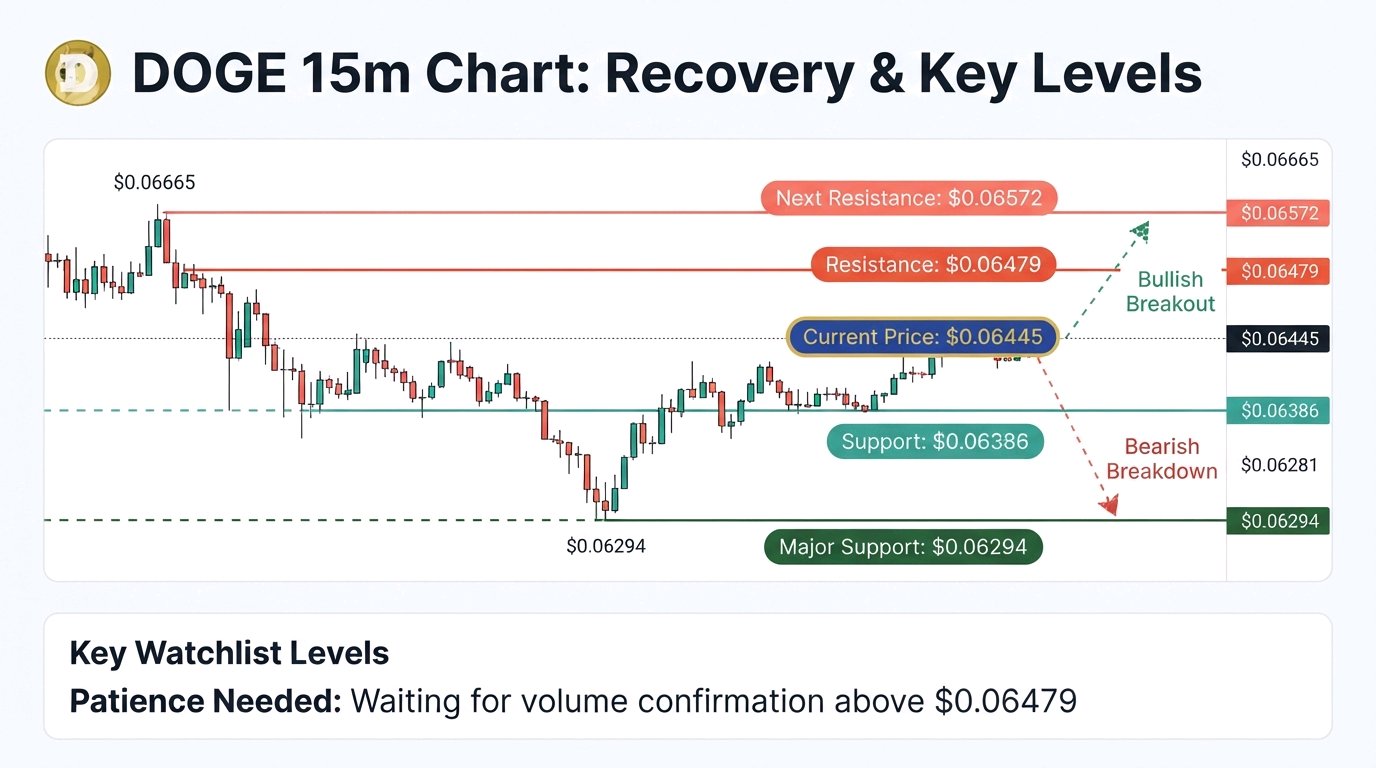
DOGE Has Recovered From $0.06294, But Is This Bounce Strong Enough? DOGE has managed to climb back after a sharp drop, but I'm not ready to call it a reversal yet. Looking at the 15m chart, price fell from around $0.06665 to $0.06294 before buyers started stepping in. It has now recovered to around $0.06445. That's a decent bounce, but buyers still need to prove they can push higher. Key Levels on My Watchlist: Resistance: $0.06479 Next Resistance: $0.06572 Support: $0.06386 Major Support: $0.06294 What I'm Watching Now If DOGE gets above $0.06479 and holds that level with decent buying volume, I think a move toward $0.06572 is possible. But if it slips below $0.06386 the recovery could lose strength quickly. Losing $0.06294 would be an even bigger warning sign. For now, I am staying patient. After such a sharp drop and recovery, there is no reason to rush into a trade without confirmation. DOGE has bounced, but I want to see buyers follow through before getting too bullish. $DOGEUSDT #WSOT2026
SUI/USDC Update 📉 SUI is trading around 1.1514, down about 1.37% on the 15M chart. Price was rejected near 1.1760 and is now testing the 1.1460 area. Short term momentum looks weak, with price sitting below the moving averages. I’m watching 1.1460 support and 1.1600 resistance for the next move. Not financial advice. DYOR. $SUIUSDC $SUIUSDT #MakeYourMove #NewFinancialPlatform
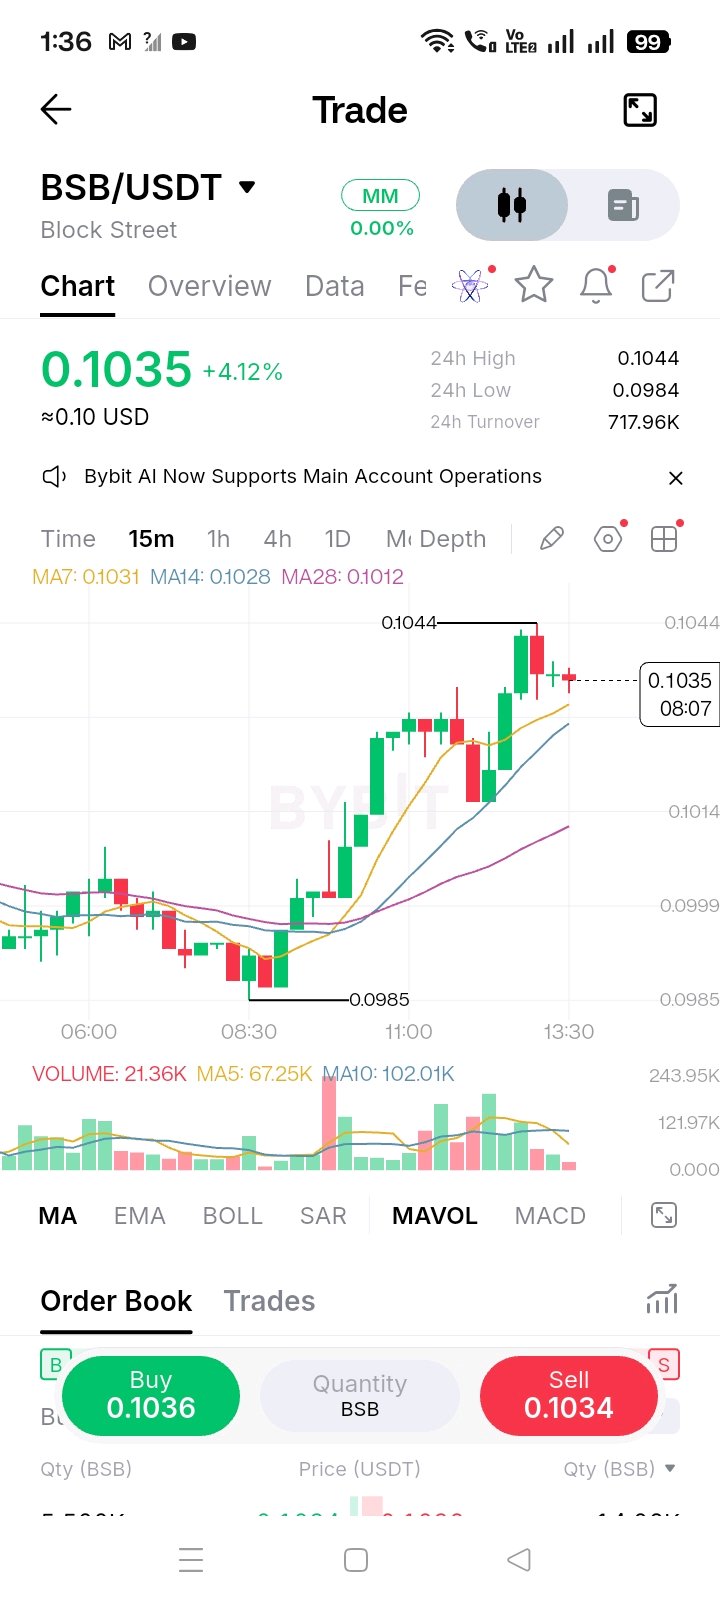
$BSB is showing strong momentum on the 15M chart. Price is around 0.1035, up 4.12%, after pushing to 0.1044. Buyers are still holding above the short term moving averages, but the recent rejection near 0.1044 is worth watching. A clean break above 0.1044 could show further strength, while losing 0.1030 may bring a short pullback. Watching the next move closely. 👀 #ByXIMPACT