BitRase
35324ចូលចិត្ត (Like)12ភាគហ៊ុន812អ្នកគាំទ្រ525តាមដាន
Crypto Enthusiast | #BTC since 2017 | NFTs, Exch anges and Blockchain Analysis
Crypto Enthusiast | #BTC since 2017 | NFTs, Exch anges and Blockchain Analysis
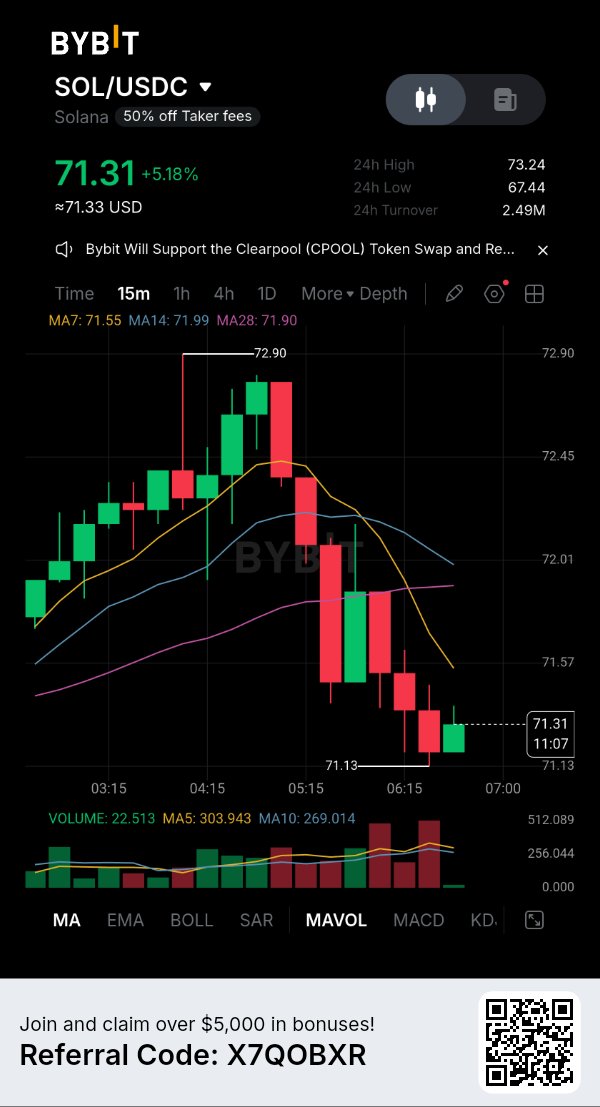
Solana is showing an interesting divergence: network activity remains substantial, but SOL has lost more than 16% in seven days. Spot ETF inflows have started returning after a series of withdrawals, while derivatives positioning has undergone a major reset. The important question is whether institutional demand can absorb the selling pressure or whether the latest bounce is simply another temporary recovery. SOL is trading near $72.13, with a market capitalization around $42.85B and 24-hour trading volume near $3.6B. Price is up approximately 2.38% over 24 hours but remains down 16.66% over seven days. The latest 24-hour range is $67.35–$73.22. Buyers have recovered from the recent low, but $73.22 remains the immediate resistance. A sustained move above $77 would provide stronger evidence that the recovery is gaining momentum. The institutional picture is beginning to improve. U.S. spot Solana ETFs recorded approximately $1.69M in net inflows on November 12, ending a five-session outflow streak. Cumulative net inflows remain around $1.414B. This is important because institutional products provide another source of regulated exposure to SOL. However, one positive session does not establish a sustained return of institutional demand. Consistent inflows will matter more than a single recovery in ETF activity. Network fundamentals provide another important signal. DeFiLlama reports approximately $4.805B in Solana DeFi TVL, with stablecoin supply around $13.96B. The network processed approximately 104M transactions over 24 hours and generated around $448,750 in chain fees. Daily DEX volume reached approximately $1.386B, although weekly DEX activity declined 19.11%. This shows that Solana continues to support substantial financial activity, but the weekly slowdown suggests ecosystem demand is not immune to broader market weakness. There is also a longer-term institutional development worth watching. DTCC's tokenization initiative has identified Solana among the blockchain networks being considered for future integration of its tokenization services. This could strengthen Solana's position in traditional financial infrastructure. However, the planned expansion is a future development, not current institutional capital flowing directly into SOL. The actual impact will depend on implementation and measurable usage. Derivatives show that speculative exposure has been reduced significantly. Aggregate perpetual open interest is approximately $4.13B, while funding is negative near -0.0102% per eight hours. Approximately $23.24M in positions were liquidated over 24 hours, with around $14.63M coming from longs. Historical positioning data also shows that open interest has fallen sharply from approximately $558M on November 4 to $327M on November 14 on one tracked venue. This leverage reduction could make the market less vulnerable to crowded long positions, but negative funding alone does not confirm a bullish reversal. Key figures $72.13 — Current price area $42.85B — Market capitalization $3.6B — 24H trading volume $67.35–$73.22 — 24H range -16.66% — Seven-day performance 591.63M SOL — Circulating supply $4.805B — DeFi TVL $13.96B — Stablecoin supply $1.386B — 24H DEX volume 104M — 24H network transactions $1.414B — Cumulative spot ETF net inflows $4.13B — Aggregate perpetual open interest -0.0102% — Weighted funding per eight hours $23.24M — 24H liquidations Bullish confirmation: SOL needs to reclaim $73.22 and establish acceptance above $77 with stronger spot buying. That could open the way toward $80–$83, followed by the $86 area if institutional inflows continue improving. Bearish confirmation: Losing $67.35 and failing to recover it would weaken the current stabilization attempt and expose the $65 psychological support, followed by the $60 area if selling accelerates. Solana still has substantial network liquidity, active DeFi infrastructure and an established institutional investment channel. But the market is highlighting an important distinction between network activity and immediate token demand. I'm watching whether ETF inflows become consistent while spot buyers reclaim resistance. The derivatives reset has reduced some leverage risk, but without stronger spot participation, this recovery remains unconfirmed. $SOLUSDT #ByXIMPACT
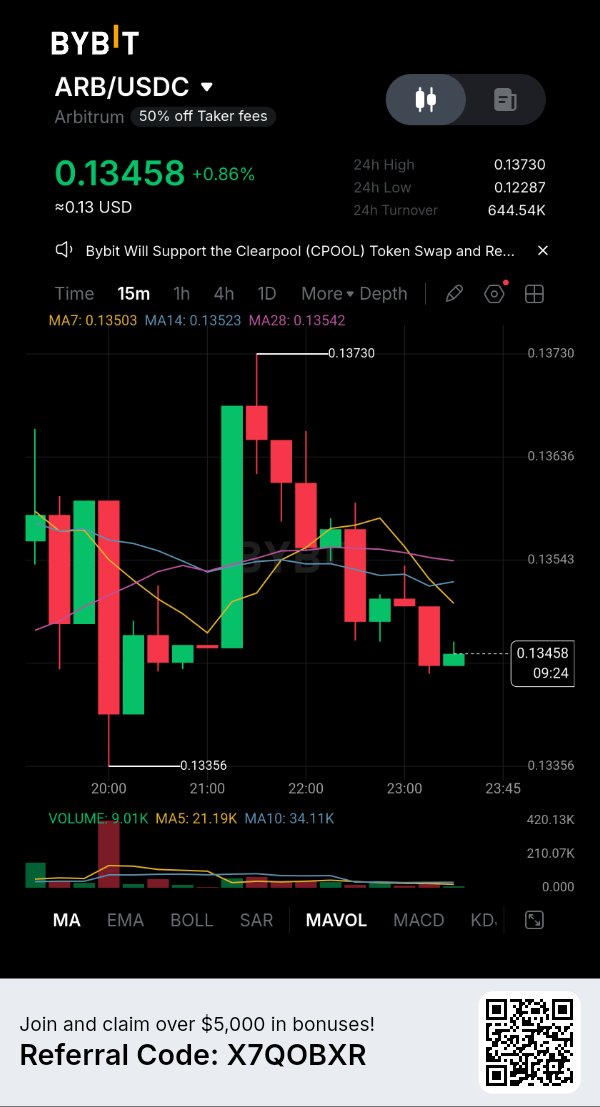
ARB is approaching a major supply event while Arbitrum is dealing with an important governance decision involving 74.56M frozen tokens. The interesting tension is that network liquidity is expanding, stablecoin supply is growing and real-world asset activity remains substantial, yet ARB has lost nearly 22% in seven days. The question is whether ecosystem growth can support the token while another unlock adds selling pressure. ARB is trading near $0.1359, with a market capitalization around $936.8M and 24-hour trading volume near $158.5M. Price is down approximately 2.24% over 24 hours and 21.99% over seven days. The latest 24-hour range is $0.1245–$0.1417, while the 30-day decline stands near 32.57%. Buyers have recovered from the recent low, but $0.1417 remains the immediate resistance. A sustained move above $0.1450 would provide stronger evidence that the recovery is gaining momentum. The strongest fundamental development is Arbitrum's expanding financial infrastructure. DeFiLlama reports approximately $1.306B in DeFi TVL, while stablecoin supply has reached $3.804B, increasing 8.64% over seven days. Tokenized real-world asset value stands near $1.013B. This is important because Arbitrum is attracting capital beyond traditional DeFi activity. However, ecosystem growth does not automatically translate into direct ARB demand. The token's primary function remains governance, so increased network usage must be distinguished from actual token value capture. Governance is creating another important catalyst. ArbitrumDAO is considering a proposal to release 74.56M ARB and approximately 8,426 ETH frozen after the October 29 Binance hot-wallet exploit. The proposal seeks to return the recovered assets to Binance, subject to legal safeguards and the required governance process. Voting is scheduled to end on November 16. This is not a newly created token supply event, but the decision is significant for Arbitrum's security framework, governance authority and ability to coordinate emergency recovery actions. Supply pressure is the immediate concern. Approximately 92.65M ARB is scheduled to unlock on November 16, representing around 1.34% of circulating supply. The allocation includes approximately 56.13M ARB for team members and contributors and 36.52M ARB for investors. At the current price, the release is worth approximately $12.6M. An unlock does not guarantee immediate selling, but the timing is challenging because ARB is already trading near its recent lows. Derivatives show that speculative positioning has become cautious. Aggregate perpetual open interest is approximately $9.7M, while funding remains positive near 7.09% annualized. Around $1.9M in positions were liquidated over the latest reported 24-hour period, with approximately 92% coming from longs. This suggests leveraged bullish positions have absorbed significant pressure. Meanwhile, Arbitrum's underlying network recorded approximately $1.439B in perpetual trading volume over 24 hours, showing that the ecosystem remains active even as the token struggles. Key figures $0.1359 — Current price area $936.8M — Market capitalization $158.5M — 24H trading volume $0.1245–$0.1417 — 24H range -21.99% — Seven-day performance -32.57% — 30-day performance $1.306B — DeFi TVL $3.804B — Stablecoin supply +8.64% — Seven-day stablecoin growth $1.013B — RWA active AUM 92.65M ARB — November 16 unlock $12.6M — Estimated unlock value 74.56M ARB — Tokens involved in recovery proposal $9.7M — Perpetual open interest +7.09% — Annualized funding Bullish confirmation: ARB needs to reclaim $0.1417 and establish acceptance above $0.1450 with stronger spot buying. That could open the way toward $0.1500–$0.1550, followed by the $0.1600 area if momentum improves. Bearish confirmation: Losing $0.1245 and failing to recover it would weaken the current stabilization attempt and expose the $0.1200 psychological support, followed by $0.1150 if selling accelerates. Arbitrum has a substantial DeFi ecosystem, growing stablecoin liquidity and more than $1B in tokenized real-world assets. But the market is highlighting a gap between network adoption and ARB token demand. The upcoming unlock and governance decision create two separate tests for the project. I'm watching whether spot buyers can absorb the additional supply while the ecosystem continues attracting capital. Until ARB reclaims resistance, strong network fundamentals alone are not enough to confirm a price reversal. $ARBUSDT #ByXIMPACT
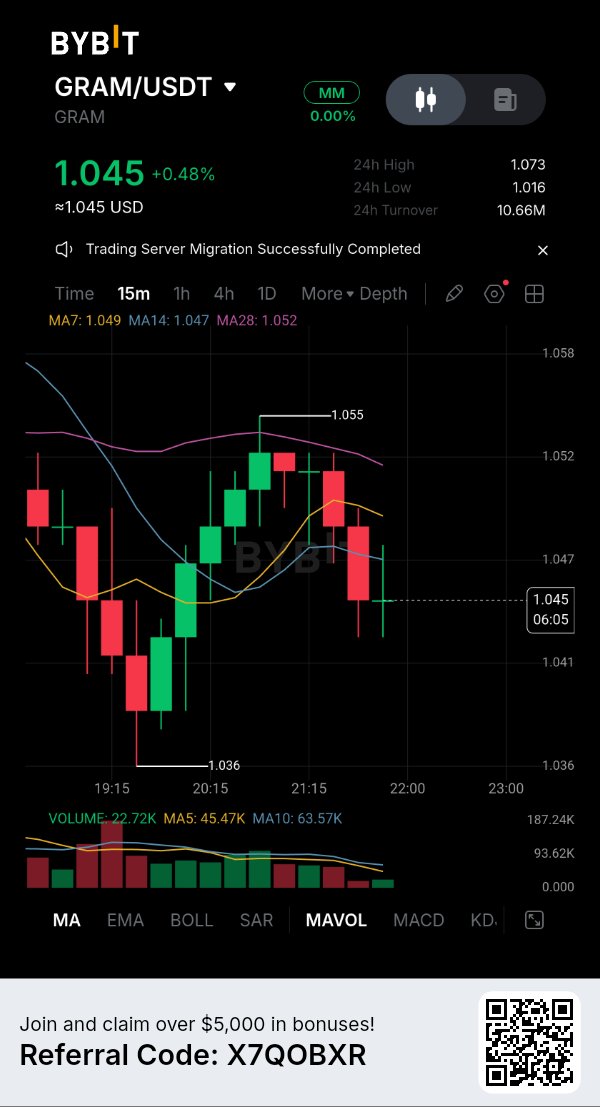
GRAM is showing a different kind of strength while much of the altcoin market remains under pressure. A recent public comment from Pavel Durov describing GRAM as “ridiculously undervalued” has brought fresh attention to the asset, but the more important question is whether this renewed interest can translate into sustained buying demand before the next scheduled token unlock. GRAM is trading near $1.06, with a market capitalization around $3.03B and 24-hour trading volume near $64.8M. Its latest 24-hour range is $1.02–$1.11, while the seven-day performance is approximately +3.6% and the 30-day gain is around 25.6%. Price is attempting to maintain its recovery, but $1.11 remains the immediate resistance. A sustained breakout above that level would provide stronger evidence that buyers are regaining control. The strongest fundamental catalyst is Telegram's expanding native Gram Wallet. On November 9, Pavel Durov reported more than 700,000 new self-custodial wallets created within 48 hours. The automatic activation feature allows users to receive GRAM without manually setting up a wallet first. This is an important distribution advantage because Telegram provides access to more than one billion users. However, wallet registrations are not equivalent to active users, transactions or actual token purchases. The real test is whether these new wallets generate recurring blockchain activity. Network activity provides additional evidence. TON's official dashboard reports approximately 3.3M monthly active wallets, 4.1M transactions over 24 hours and more than 191M smart contracts. Telegram's native wallet rollout also creates new opportunities for payments, transfers and mini-app activity. The important distinction is that greater blockchain adoption does not automatically translate into proportional GRAM price appreciation. Sustained transaction demand and token utility must follow. Institutional participation is another developing factor. TON Strategy reported holding approximately 235.1M GRAM at September-end, with around 232.9M deployed in staking. The company generated approximately 9.4M GRAM in staking rewards during Q3, equivalent to an annualized gross staking yield of approximately 16%. This demonstrates institutional exposure to the network, although staking rewards also represent additional token supply entering circulation. Supply pressure deserves attention. CoinGecko reports approximately 2.857B GRAM circulating against 5.284B total supply. The next scheduled unlock is December 6, releasing approximately 36.59M GRAM for the TON Believers Fund, worth around $39M at the current price. That represents approximately 0.69% of total supply. The unlock does not guarantee immediate selling, but it creates an additional supply consideration while the market is attempting to establish a stronger recovery. Derivatives are showing a cautious positioning picture. Aggregate perpetual open interest is approximately $108.19M, down 2.16% over 24 hours, while weighted funding is negative near -0.0149% per eight hours. Futures volume reached approximately $105.77M against $38.31M in spot volume. Around $2.34M in positions were liquidated over 24 hours, with approximately $2.32M coming from longs. This suggests leveraged bullish positions have faced significant pressure. Negative funding creates potential short-squeeze conditions, but stronger spot buying is still required to confirm a sustainable reversal. Key figures $1.06 — Current price area $3.03B — Market capitalization $64.8M — 24H trading volume $1.02–$1.11 — 24H range +3.6% — Seven-day performance +25.6% — 30-day performance 2.857B — Circulating GRAM 5.284B — Total supply 3.3M — Monthly active wallets 4.1M — 24H network transactions 700,000+ — Wallets created in 48 hours 235.1M GRAM — TON Strategy holdings 36.59M GRAM — December 6 unlock $108.19M — Aggregate perpetual open interest -0.0149% — Weighted funding per eight hours $2.34M — 24H liquidations Bullish confirmation: GRAM needs to reclaim $1.11 and establish acceptance above it with stronger spot volume. That could open the way toward $1.16–$1.20, followed by the $1.25 area if momentum continues. Bearish confirmation: Losing $1.02 and failing to recover it would weaken the current recovery attempt and expose the $1.00 psychological support, followed by the $0.95 area if selling accelerates. GRAM has a significant distribution advantage through Telegram, expanding wallet adoption and growing institutional staking participation. But the market needs to distinguish wallet creation from genuine economic activity. I'm watching whether new Telegram wallets translate into recurring transactions and whether spot demand can absorb the upcoming unlock. If adoption begins producing measurable token demand, GRAM could justify a stronger valuation. Until then, the fundamentals are developing, but price confirmation remains essential. $GRAMUSDT #ByXIMPACT
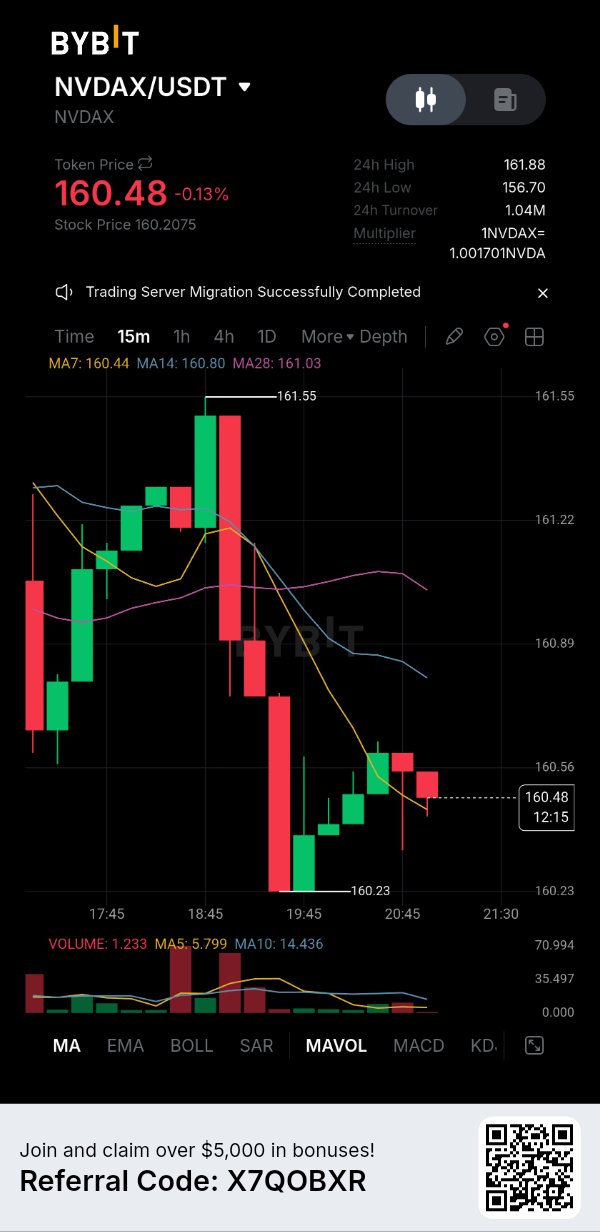
NVDAX is approaching a major catalyst at a time when NVIDIA is facing an unexpected leadership transition. The token has fallen more than 10% in seven days, and the resignation of Jensen Huang has introduced uncertainty just two days before the company's next earnings report. The important question is whether strong AI demand can reassure investors or whether leadership uncertainty will continue weighing on the underlying stock. NVDAX is trading near $160.59, with a market capitalization around $93.98M and 24-hour spot volume near $1.41M. Price is down approximately 1.12% over 24 hours and 10.75% over seven days. The latest 24-hour range is $155.33–$162.64, while the 30-day decline stands near 24.99%. Buyers are attempting to defend the $155 area, but $162.64 remains the immediate recovery resistance. A sustained move above $165.75 would provide stronger evidence that the recovery is gaining momentum. The biggest development is NVIDIA's leadership change. On November 12, NVIDIA officially announced that Jensen Huang had resigned as CEO and board member, effective immediately. CFO Colette Kress has taken over as interim CEO while the board searches for a permanent successor. This is significant because Huang has led NVIDIA for 33 years and played a central role in its AI strategy. Although the company says its operations, customer commitments and product roadmap will continue without interruption, investors must now assess whether the new leadership can maintain the company's execution and strategic direction. The next major catalyst is NVIDIA's Q3 fiscal 2027 earnings report, scheduled for November 17. In its previous quarterly results, NVIDIA reported $96.2B in revenue, including $89B from its Data Center business. Its previous guidance projected approximately $108B in Q3 revenue, plus or minus 2%. The market will be watching whether AI infrastructure demand remains strong enough to support that outlook despite the leadership transition. Strong results could restore confidence, but the earnings reaction will matter more than the headline numbers alone. There is an important distinction for NVDAX holders. NVIDIA xStock is a tokenized tracker certificate designed to follow NVIDIA's underlying share price. It is not the same as directly owning NVIDIA shares or receiving shareholder voting rights. Consequently, the underlying stock drives its fundamental valuation, while NVDAX has separate blockchain liquidity, trading spreads and counterparty considerations. A positive earnings surprise does not guarantee an identical percentage move in every NVDAX market. Derivatives are showing a bearish positioning reset. Aggregate perpetual open interest is approximately $3.50M, down 11.52% over 24 hours, while weighted funding is deeply negative near -0.0759% per eight hours. Futures volume is around $20.69M against $1.41M in spot volume, approximately 14.7 times higher. This indicates that speculative derivatives activity is dominating spot participation. Negative funding means shorts are paying longs, creating potential squeeze conditions, but declining open interest suggests traders are also reducing exposure. A sustainable recovery still requires stronger spot demand. Key figures $160.59 — Current price area $93.98M — Market capitalization $1.41M — 24H spot volume $155.33–$162.64 — 24H range -10.75% — Seven-day performance -24.99% — 30-day performance $242.89 — All-time high 584.69K — Circulating NVDAX 1.49M — Total token supply $3.50M — Aggregate perpetual open interest -0.0759% — Weighted funding per eight hours $20.69M / $1.41M — Futures / spot volume November 17 — NVIDIA Q3 FY2027 earnings Bullish confirmation: NVDAX needs to reclaim $162.64 and establish acceptance above $165.75 with stronger spot buying. That could open the way toward $170, followed by the $180 area if NVIDIA's earnings restore confidence. Bearish confirmation: Losing $155.33 and failing to recover it would weaken the stabilization attempt and expose the $150 area. A deeper breakdown could bring the previous $148.80 reference level into focus. NVDAX is facing two competing forces: NVIDIA's enormous AI business and the uncertainty created by an unexpected leadership transition. The upcoming earnings report could become the first major test of investor confidence under interim leadership. I'm watching revenue guidance, Data Center demand and the underlying NVIDIA share reaction more closely than short-term derivatives positioning. Strong earnings could support a recovery, but until NVDAX reclaims resistance, the market remains cautious. $NVDAXUSDT #ByXIMPACT
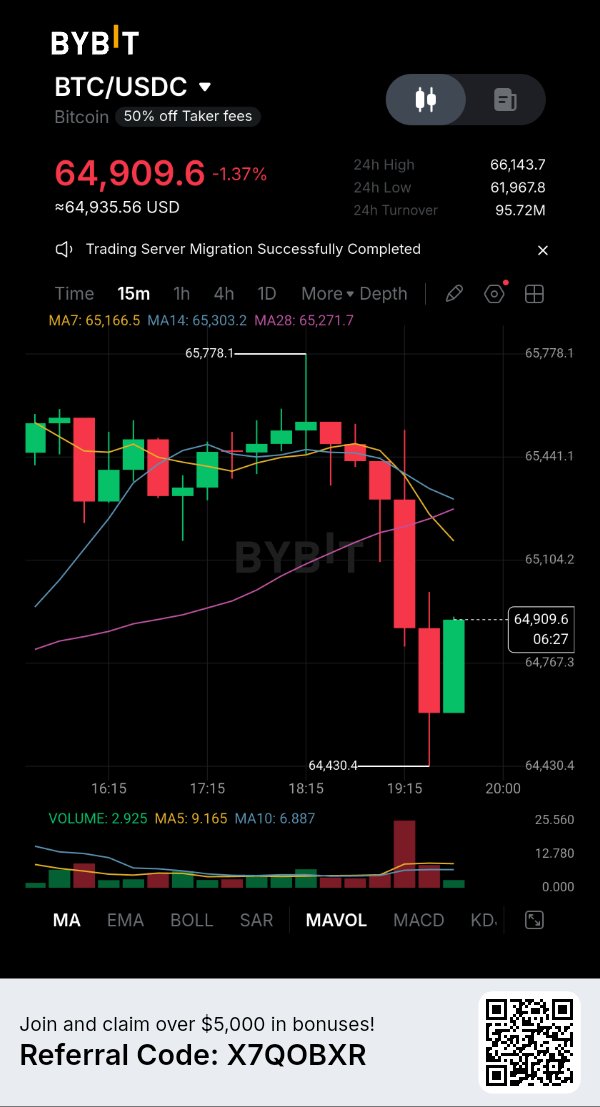
Bitcoin has recovered from $61,956, but the institutional picture is getting worse. U.S. spot Bitcoin ETFs have recorded seven consecutive trading days of outflows, totaling approximately $1.91B. The interesting question is whether buyers can absorb this institutional selling or whether the latest bounce is simply a temporary pause in a broader correction. BTC is trading near $65,304, with a market capitalization around $1.31T and 24-hour spot volume near $10.57B. Price is down approximately 1.86% over 24 hours and 12.44% over seven days. The latest 24-hour range is $61,956–$66,345, while the 30-day decline stands near 19.87%. Buyers have recovered from the weekend low, but $66,345–$68,400 remains the immediate resistance zone. A sustained move above $68,400 would provide stronger evidence that the recovery is gaining momentum. The biggest concern is institutional demand. U.S. spot Bitcoin ETFs recorded approximately $185.4M in net outflows on November 13, extending the withdrawal streak to seven consecutive trading sessions. Total outflows reached approximately $1.065B during November 9–13 alone. This matters because ETF demand has been an important source of spot buying pressure. When institutional redemptions continue while price is falling, the market needs stronger independent demand to absorb the available supply. Liquidity conditions are creating another problem. Stablecoin supply declined approximately $4.44B over seven days to $287.42B on November 14. This does not mean the same amount of money has directly left crypto exchanges, but it indicates that the broader on-chain dollar liquidity pool is contracting. ETF redemptions and declining stablecoin supply are therefore pointing toward the same concern: fresh capital is not replenishing market demand at the same pace as selling pressure. Derivatives show that substantial leverage has already been flushed out. Aggregate Bitcoin futures open interest is approximately $42.19B, down 7.51% over 24 hours. Funding remains slightly positive near 0.0011% per eight hours, while futures volume reached approximately $115.13B against $10.57B in spot volume. Around $781.94M in positions were liquidated over 24 hours, with approximately $579.2M coming from longs. This indicates that leveraged bullish positions have absorbed most of the damage. However, declining open interest does not automatically mean selling pressure has disappeared. Macro conditions are adding further pressure. Expectations of higher U.S. interest rates, a stronger dollar and weakness in technology stocks have reduced appetite for risk assets. Bitcoin is therefore facing pressure from both crypto-specific capital outflows and the broader financial environment. The next inflation and Federal Reserve signals could become important catalysts for the direction of the recovery. Key figures $65,304 — Current price area $1.31T — Market capitalization $10.57B — 24H spot volume $61,956–$66,345 — 24H range -12.44% — Seven-day performance -19.87% — 30-day performance 20.11M BTC — Circulating supply 21M BTC — Maximum supply $1.91B — ETF outflows over seven consecutive sessions $4.44B — Seven-day stablecoin supply contraction $42.19B — Aggregate futures open interest +0.0011% — Weighted funding per eight hours $115.13B / $10.57B — Futures / spot volume $781.94M — 24H liquidations Bullish confirmation: BTC needs to reclaim $66,345 and establish acceptance above $68,400 with stronger spot buying. That could open the way toward $70,000–$72,000, particularly if ETF outflows begin reversing. Bearish confirmation: Losing $61,956 and failing to recover it would weaken the current stabilization attempt and expose the $60,000 psychological support, followed by the $58,000 area if selling accelerates. Bitcoin has already experienced a significant leverage flush, but the more important problem is that institutional demand and stablecoin liquidity are both weakening. I'm watching ETF flows and spot buying more closely than the short-term bounce. If fresh capital returns while BTC reclaims resistance, the recovery becomes more credible. Until then, this remains a relief attempt inside a weak market structure, not a confirmed reversal. $BTCUSDT #ByXIMPACT
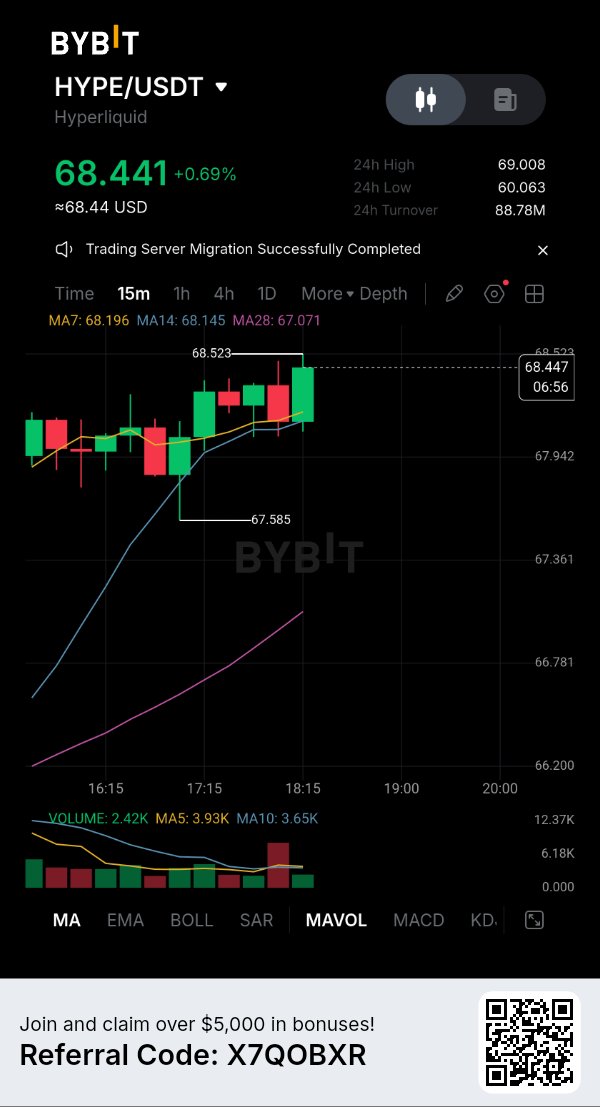
HYPE is facing an important test: Hyperliquid continues generating substantial trading revenue and executing daily token buybacks, yet HYPE has fallen more than 8% in seven days. The interesting question is whether protocol-driven demand can absorb the next contributor unlock or whether weakening market sentiment will continue to outweigh the buyback mechanism. HYPE is trading near $67.95, with a market capitalization around $17.21B and 24-hour spot volume near $468.9M. Price is down approximately 1.94% over 24 hours and 8.54% over seven days. The latest 24-hour range is $60.01–$69.42, while the 30-day decline stands near 15.29%. Buyers have recovered from the $60 area, but $69.42 remains the immediate resistance. A sustained breakout above $70 would provide stronger evidence that the recovery is gaining momentum. The strongest fundamental development is Hyperliquid's revenue generation. Its Q3 2026 report recorded approximately $190.9M in revenue, increasing 21.7% quarter-over-quarter and marking its strongest quarter of 2026. Trading and network revenue contributed approximately $173.6M. However, revenue remained 36.5% below the same quarter last year. This distinction matters: the protocol is growing sequentially, but its recovery has not yet returned to previous annual revenue levels. The Assistance Fund creates an important connection between protocol activity and HYPE demand. Approximately 98% of protocol revenue is directed toward open-market HYPE purchases through the fund. Over the latest 30-day period, approximately $59M was spent acquiring 860,000 HYPE. On November 14, the fund purchased another 50,039 HYPE. These purchases create recurring market demand, and governance has recognized the acquired tokens as permanently removed from circulation. However, buybacks are not guaranteed to prevent price declines when broader selling pressure increases. Supply pressure is approaching. Approximately 9.92M HYPE is scheduled to unlock for core contributors on December 6. At the current price, that represents roughly $674M in potential token supply, although an unlock does not mean the entire allocation will immediately enter the market. The next few weeks will therefore test whether recurring Assistance Fund purchases can offset the additional available supply. Derivatives are showing significant leverage exposure. Aggregate perpetual open interest is approximately $2.98B, down 4.07% over 24 hours, while weighted funding is positive near 0.0081% per eight hours. Futures volume reached approximately $4.71B against $468.9M in spot volume. Around $87.34M in positions were liquidated over 24 hours, with approximately 97% coming from longs. This suggests leveraged bullish positions are being flushed out. The decline in open interest alongside price weakness indicates traders are reducing exposure rather than aggressively adding new positions. Key figures $67.95 — Current price area $17.21B — Market capitalization $468.9M — 24H spot volume $60.01–$69.42 — 24H range -8.54% — Seven-day performance $190.9M — Q3 2026 protocol revenue $173.6M — Q3 trading and network revenue $59M — 30-day Assistance Fund purchases 860,000 HYPE — Tokens purchased over 30 days 9.92M HYPE — December 6 contributor unlock $2.98B — Aggregate perpetual open interest +0.0081% — Weighted funding per eight hours $87.34M — 24H liquidations Bullish confirmation: HYPE needs to reclaim $69.42 and establish acceptance above $70 with stronger spot buying. That could open the way toward $74–$76, followed by the $80 area if momentum continues. Bearish confirmation: Another rejection below $69.42 followed by a clean break under $60 would weaken the recovery attempt and expose the $57–$58 area. Hyperliquid has something many tokens lack: measurable protocol revenue directly connected to recurring token purchases. But declining annual revenue, heavy long liquidations and the upcoming contributor unlock create a genuine challenge. I'm watching whether Assistance Fund demand can absorb selling pressure while spot volume improves. If that happens, HYPE could establish a stronger recovery. Until then, the buyback mechanism is constructive, but the chart still needs confirmation. $HYPEUSDT #ByXIMPACT
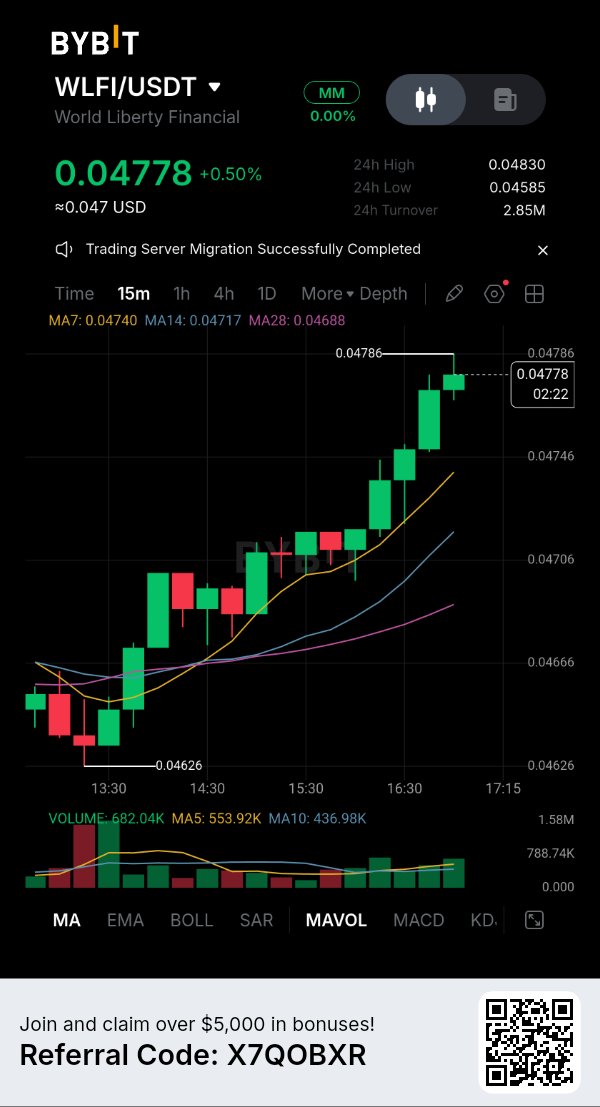
WLFI has finally moved from announcing buybacks to executing them, but the first $1 million purchase raises a bigger question: can the program generate enough consistent demand to offset weakening USD1 adoption and growing scrutiny around the project? The initial execution is encouraging, but the economic impact remains unproven. WLFI is trading near $0.04771, with a market capitalization around $1.51B and 24-hour spot volume near $18.6M. Price is up approximately 0.38% over 24 hours and 3.31% over seven days, but remains down around 16.2% over 30 days. The latest 24-hour range is $0.04579–$0.04826. Buyers are attempting to establish support above $0.0458, while $0.0483 remains the immediate resistance. A sustained move above $0.0500 would provide stronger evidence of recovery. The biggest development is the execution of WLFI's first buyback. On November 12, World Liberty confirmed that approximately $1M in purchases had been completed in less than 72 hours through Aster. On-chain tracking indicated approximately 21 million WLFI tokens were acquired. This is an important difference from the November 6 announcement: actual purchases have now taken place. However, the project has not disclosed a fixed buyback budget, recurring purchase schedule or confirmed whether acquired tokens will eventually be burned. Buybacks can support demand, but without clarity on token handling, they do not automatically reduce circulating supply. The USD1 situation creates another important tension. DeFiLlama reports approximately $3.12B in USD1 circulation, down 11.5% over seven days and 24.76% over 30 days. This matters because reserve income from USD1 has been identified as one potential source of buyback funding. A shrinking stablecoin supply could limit the revenue base available for future purchases. The first $1M buyback is a positive execution signal, but sustainable funding will depend on USD1 adoption and actual reserve income. Reputational risk is also increasing. On November 13, an investigation by Coffeezilla and researcher Molly White examined the reported $500M UAE-linked investment for a 49% stake in World Liberty and the separate use of USD1 in MGX's $2B investment in Binance. The report raised questions about disclosure and potential conflicts of interest. These are allegations, not established findings, and World Liberty has denied wrongdoing or improper government influence. Nevertheless, the renewed scrutiny could affect institutional confidence and the project's ability to expand USD1 distribution. Supply dynamics remain relevant. Approximately 31.78B WLFI are circulating against a maximum supply of 100B. Around 70.8% of the maximum supply remains locked under the tracked vesting model, with no major cliff unlock scheduled over the next 12 months. This reduces immediate cliff-related supply risk, but the large remaining allocation creates a longer-term dilution consideration as tokens become eligible for release. Derivatives show a market that is still heavily exposed to leveraged trading. Aggregate perpetual open interest is approximately $287.93M, while 24-hour futures volume is around $82.32M against $18.6M in spot volume. Weighted funding is negative near -0.0012% per eight hours, meaning shorts are marginally paying longs. Approximately $183K in positions were liquidated over 24 hours, with 97% coming from longs. Spot net flows are also negative near $1.3M. This suggests that the recovery has yet to establish strong spot demand despite the buyback catalyst. Key figures $0.04771 — Current price area $1.51B — Market capitalization $18.6M — 24H spot volume $0.04579–$0.04826 — 24H range +3.31% — Seven-day performance -16.22% — 30-day performance $3.12B — USD1 circulating supply -24.76% — USD1 supply change over 30 days $1M — First reported buyback execution ~21M WLFI — Estimated tokens purchased 31.78B / 100B — Circulating / maximum supply $287.93M — Aggregate perpetual open interest -0.0012% — Weighted funding per eight hours $183.17K — 24H liquidations Bullish confirmation: WLFI needs to reclaim $0.0483 and establish acceptance above $0.0500 with stronger spot volume. That could open the way toward $0.0520–$0.0550, particularly if further buyback transactions appear on-chain and USD1 supply stabilizes. Bearish confirmation: Losing $0.0458 and failing to recover it would weaken the current stabilization attempt and expose the $0.0437 area, followed by $0.0400 if selling accelerates. WLFI now has something it previously lacked: evidence that its buyback announcement has translated into actual purchases. But the first $1M is small relative to its $1.51B market capitalization, and USD1 supply contraction creates questions about the program's long-term funding capacity. I'm watching recurring buyback execution, stablecoin adoption and spot demand rather than treating one purchase as a confirmed reversal. The next phase needs measurable execution, not another announcement. $WLFIUSDT #ByXIMPACT
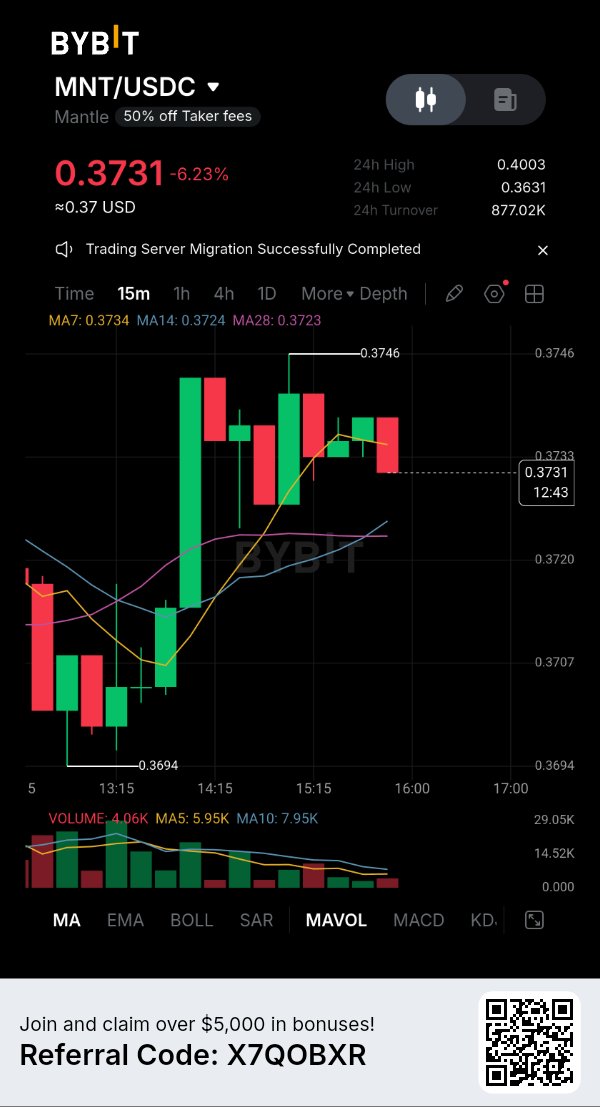
MNT is falling despite Mantle's growing institutional footprint, and that disconnect deserves attention. The ecosystem is reporting more than $700M in real-world capital, over 1 million active users and expanding tokenized asset infrastructure. Yet the token is down nearly 16% in seven days. The important question is whether this ecosystem growth can translate into sustainable MNT demand or whether market-wide selling will continue to dominate. MNT is trading near $0.3725, with a market capitalization around $1.24B and 24-hour spot volume near $16.89M. Price is down approximately 6.4% over 24 hours and 15.8% over seven days. The latest 24-hour range is $0.3625–$0.4005, while the 30-day decline stands near 30.6%. Buyers are attempting to defend the $0.3625 area, but $0.3900–$0.4005 remains the immediate recovery resistance. The strongest fundamental development is Mantle's growing position in tokenized real-world assets. Its official treasury dashboard reports approximately $706M in combined stablecoin and RWA market capitalization, more than 710 RWA assets and over 1 million active users. This is important because Mantle is positioning itself as financial infrastructure rather than simply another Ethereum Layer 2. However, institutional capital operating within the ecosystem does not automatically create direct demand for MNT. Network activity, gas usage and token utility remain the real measures to watch. Governance is providing another catalyst. MIP-36 proposes recognizing Halo Prime as a strategic tokenized-asset issuer partner, with voting scheduled from November 9 to November 16. The proposal includes a strategic cooperation agreement, but it is non-exclusive and does not authorize new funding or treasury commitments. This distinction matters: the partnership could strengthen Mantle's institutional distribution, but it should not be treated as guaranteed capital inflow. There is also measurable ecosystem activity. Mantle recently reported that weekly DEX volume increased 87%, rising from $15M to $28M. Its KORProtocol launch also crossed $2M in trading volume on Fluxion on its first day. These developments suggest that ecosystem liquidity is expanding, although sustained growth in protocol fees and MNT demand still needs confirmation. Treasury composition deserves attention too. Mantle's official dashboard reported approximately $1.755B in treasury assets on November 14, including around $1.22B in MNT. That represents approximately 69.5% of the reported treasury value. The treasury provides substantial ecosystem resources, but its concentration in MNT also means its dollar valuation is exposed to the same token-price weakness affecting holders. Derivatives show that speculative exposure is declining. Aggregate perpetual open interest is approximately $33.73M, down 11.36% over 24 hours, while funding remains positive near 0.0100% per eight hours. Futures volume is around $24.76M against $16.89M in spot volume. Approximately $1.20M in positions were liquidated over 24 hours, with virtually all reported liquidations coming from longs. Falling price alongside declining open interest suggests leveraged positions are being closed rather than fresh conviction entering the market. Key figures $0.3725 — Current price area $1.24B — Market capitalization $16.89M — 24H spot volume $0.3625–$0.4005 — 24H range -15.78% — Seven-day performance $706M — Stablecoin and RWA market capitalization 710+ — Reported RWA assets 1M+ — Active users $28M — Weekly DEX volume $1.755B — Reported treasury value $1.22B — Treasury MNT holdings $33.73M — Aggregate perpetual open interest +0.0100% — Funding per eight hours $1.20M — 24H liquidations Bullish confirmation: MNT needs to reclaim $0.3900 and establish acceptance above $0.4005 with stronger spot volume. That could open the way toward $0.4200, followed by the $0.4500 area if momentum improves. Bearish confirmation: Losing $0.3625 and failing to recover it would weaken the current stabilization attempt and expose the $0.3500 area, followed by $0.3300 if broader market pressure continues. Mantle has a substantial treasury, growing RWA distribution and measurable ecosystem activity. But the market is highlighting an important distinction between institutional adoption and token demand. The decisive signal is whether expanding on-chain capital markets generate sustained network activity and stronger spot buying. Until MNT reclaims resistance, the fundamental expansion remains constructive while the price structure stays vulnerable. $MNTUSDT #ByXIMPACT
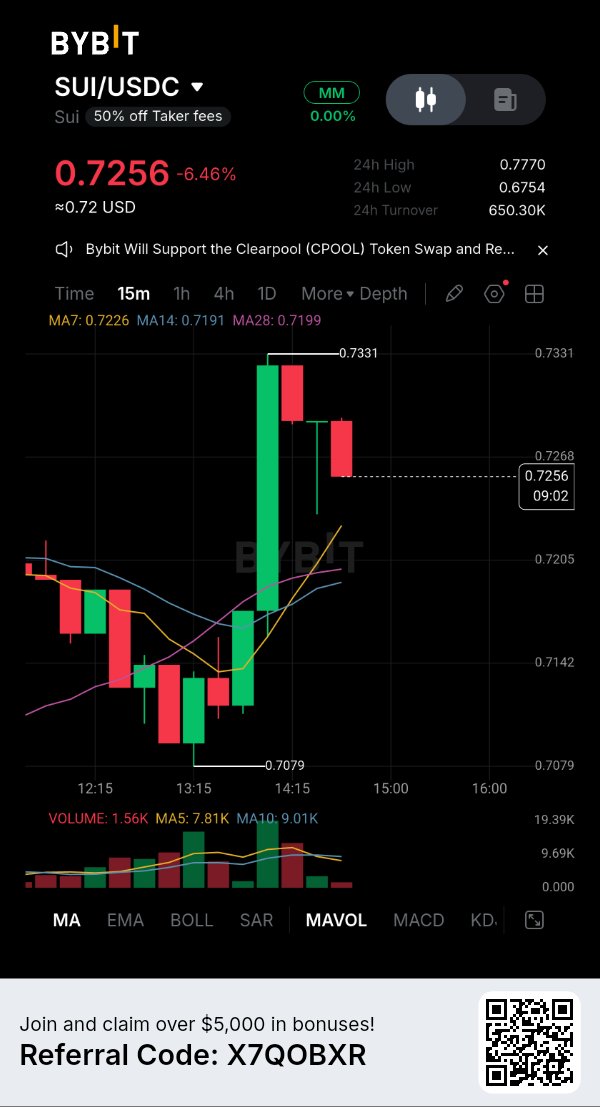
SUI is facing a difficult test: its ecosystem is attracting fresh attention through Google Cloud's AI infrastructure collaboration, and stablecoin liquidity is expanding, yet the token has fallen nearly 12% in seven days. The important question is whether growing network utility can translate into actual SUI demand while leveraged traders are being forced out of the market. SUI is trading near $0.7210, with a market capitalization around $2.99B and 24-hour spot volume near $161.5M. Price is down approximately 7.4% over 24 hours and 12% over seven days. The latest 24-hour range is $0.6737–$0.7851. Buyers are attempting to stabilize after a sharp decline, but $0.7776–$0.7851 remains the immediate recovery resistance. Losing the recent low would expose the market to another downside test. The strongest recent development is Sui's expansion into enterprise AI infrastructure. On November 14, Sui highlighted its Verifiable Agent Arbiter initiative developed with Google Cloud. The system is designed to help businesses verify whether AI agents operate within their assigned permissions. Walrus stores cryptographic proofs, while Sui coordinates verification. This is an interesting use case because it connects blockchain infrastructure with enterprise AI security. However, the announcement does not yet establish measurable adoption or recurring transaction demand for SUI. Stablecoin activity provides another constructive signal. DeFiLlama reports approximately $544.1M in stablecoin supply on Sui, up 3.81% over seven days, while DeFi TVL stands near $362.8M. Daily DEX volume is approximately $38.6M. This suggests liquidity is still developing despite weakness across the broader market. But there is an important distinction: growing stablecoin balances and ecosystem activity do not automatically create proportional demand for SUI. Network fees and actual token usage remain important measures of value capture. Supply pressure is another factor. Approximately 4.14B SUI are circulating against a maximum supply of 10B. The next scheduled unlock on December 1 releases approximately 12.97M SUI, worth around $9.3M at current prices. This represents roughly 0.31% of circulating supply. The unlock is relatively modest, but recurring vesting remains a structural consideration while price is struggling to recover. Derivatives show that speculative positioning is being reset. Aggregate perpetual open interest is approximately $407.2M, down 11.3% over 24 hours, while weighted funding is negative near -0.0172% per eight hours. Futures volume is around $809.3M against $161.5M in spot volume. Approximately $11.8M in positions were liquidated over 24 hours, with 97% coming from longs. This indicates significant long-side pressure. Negative funding could create conditions for a short squeeze, but only if spot demand returns. Key figures $0.7210 — Current price area $2.99B — Market capitalization $161.5M — 24H spot volume $0.6737–$0.7851 — 24H range -11.98% — Seven-day performance $362.8M — DeFi TVL $544.1M — Stablecoin supply $38.6M — 24H DEX volume 4.14B / 10B — Circulating / maximum supply 12.97M SUI — December 1 unlock $407.2M — Aggregate perpetual open interest -0.0172% — Weighted funding per eight hours $11.8M — 24H liquidations Bullish confirmation: SUI needs to reclaim $0.7776–$0.7851 and establish acceptance above this zone with stronger spot buying. That could put $0.80–$0.82 in focus, followed by a broader recovery toward $0.85. Bearish confirmation: Losing $0.6737 and failing to recover it would weaken the stabilization attempt and expose the $0.65 area, followed by $0.62 if selling accelerates. Sui has a developing enterprise AI use case, expanding stablecoin liquidity and an active DeFi ecosystem. But the market is highlighting an important gap between network development and token performance. I'm watching whether spot demand returns as leveraged positions unwind. If ecosystem growth begins translating into stronger liquidity and sustained buying, SUI could establish a recovery. Until then, the next unlock and weak price structure remain the immediate challenges. $SUIUSDT #ByXIMPACT
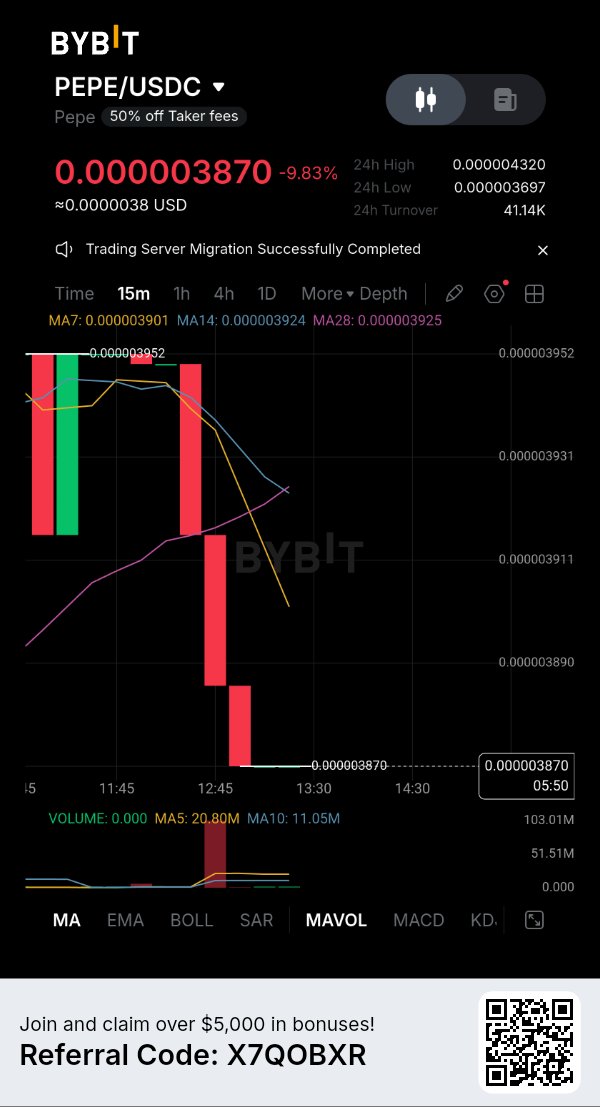
PEPE is down nearly 20% in seven days, but an interesting divergence is developing beneath the sell-off. Futures positioning is unwinding, funding has turned negative, and a major holder has reportedly withdrawn 11.8 trillion PEPE from trading platforms since October 17. The question is whether this is the beginning of accumulation or simply a pause in a broader distribution phase. PEPE is trading near $0.000003883, with a market capitalization around $1.60B and 24-hour spot volume near $143.7M. Price is down approximately 11.8% over 24 hours and 20% over seven days. The latest 24-hour range is $0.000003688–$0.000004444. Buyers are attempting to defend the recent low, but the $0.0000043–$0.00000444 area remains the immediate recovery resistance. The most interesting development is whale positioning. According to recent on-chain tracking, Justin Sun has withdrawn approximately 11.8T PEPE, worth around $48.76M, from trading platforms since October 17. His reported average acquisition price is approximately $0.000004114. These withdrawals could reduce immediately available exchange supply, but they do not automatically prove fresh accumulation or guarantee that the tokens will remain off exchanges. The important question is whether other large holders are showing similar behavior. There is also a potential institutional catalyst. Canary Capital has amended its proposed spot PEPE ETF filing, outlining a fund designed to hold PEPE directly and seek a Cboe BZX listing. However, SEC approval and a confirmed launch date remain outstanding. This could eventually broaden access to PEPE, but an amended filing should not be confused with actual institutional demand. Supply dynamics are relatively straightforward. Approximately 413.77T PEPE are circulating against a maximum supply of 414T. That means nearly the entire supply is already in circulation, with limited remaining issuance. Unlike tokens facing substantial future unlocks, PEPE's immediate supply risk is more closely connected to existing holder distribution and changes in market demand. Derivatives are showing signs of leverage reduction. Aggregate perpetual open interest is approximately $229.2M, down 16.6% over 24 hours, while weighted funding is negative near -0.0134% per eight hours. Futures volume is around $469.8M against $143.7M in spot volume. Approximately $2.4M in positions were liquidated over 24 hours, with longs accounting for nearly 90%. This suggests leveraged bullish positions have taken significant pressure, although negative funding alone does not confirm a reversal. Key figures $0.000003883 — Current price area $1.60B — Market capitalization $143.7M — 24H spot volume $0.000003688–$0.000004444 — 24H range -20.04% — Seven-day performance 413.77T — Circulating supply 414T — Maximum supply $229.2M — Aggregate perpetual open interest -0.0134% — Weighted funding per eight hours $469.8M / $143.7M — Futures / spot volume $2.4M — 24H liquidations 11.8T PEPE — Reported withdrawals from trading platforms since October 17 Bullish confirmation: PEPE needs to reclaim $0.00000430–$0.00000444 and hold above this zone with stronger spot buying. That could open the way toward $0.0000050, followed by the $0.0000056 area. Bearish confirmation: Losing $0.000003688 would weaken the stabilization attempt and expose the $0.0000035 area, followed by $0.0000032 if selling accelerates. PEPE has a potential supply-side support signal through large-holder withdrawals, while its proposed ETF could eventually expand institutional access. But neither development has yet reversed the current selling pressure. I'm watching whether spot buyers return as leveraged positions reset. If that happens, PEPE could build a recovery; otherwise, negative funding may simply reflect a market that is still searching for a bottom. $PEPEUSDT #ByXIMPACT
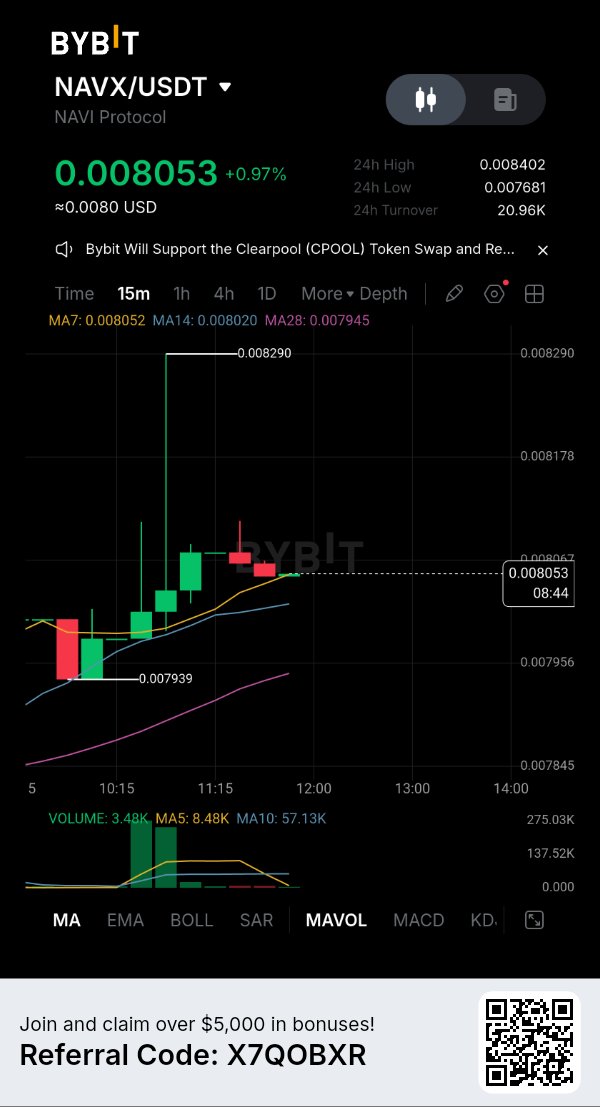
NAVX is showing an interesting contradiction: its lending protocol continues generating meaningful revenue, but the token is trading close to its historical lows. The market is questioning whether protocol growth can translate into lasting token demand. NAVI Protocol is trading near $0.0080, with market capitalization around $6.5M. The latest 24-hour range is $0.00772–$0.00833, while the seven-day range extends to $0.00955. Price remains approximately 98% below its $0.4171 all-time high. The immediate challenge is reclaiming $0.00833; without that, the current bounce remains fragile. The fundamental picture deserves attention. NAVI is one of the major liquidity and lending protocols on Sui, offering borrowing, lending and collateral management. Its latest reported TVL is approximately $101.64M, with $57.05M in active loans. Over the last 30 days, the protocol generated around $437K in fees and $138K in protocol revenue. These are real operating figures, but reported holder revenue remains zero. Protocol revenue should not automatically be interpreted as direct value distributed to NAVX holders. There is also a serious historical risk. NAVI recorded a security incident on April 21, 2026, involving approximately $3.5M and classified as a key compromise. The protocol's ability to maintain liquidity and rebuild confidence after that event matters as much as its lending growth. Supply is another important factor. Approximately 816.17M NAVX are circulating against a 1B maximum supply. Around 96.5% has been released, but continuous ecosystem distributions remain. Approximately 2.93M NAVX are released weekly under the ecosystem and airdrop allocation. This is not a single large cliff, but recurring supply can still weigh on a small market. Key figures Price: ~$0.0080 Market cap: ~$6.53M 24H range: $0.00772–$0.00833 7D range: $0.00772–$0.00955 TVL: ~$101.64M Active loans: ~$57.05M 30D fees: ~$437K 30D protocol revenue: ~$138K Circulating supply: ~816.17M NAVX Maximum supply: 1B NAVX Weekly ecosystem distribution: ~2.93M NAVX Bullish confirmation: A sustained reclaim above $0.00833 would be the first sign of stabilization. A move through $0.00955, supported by recovering TVL and stronger spot volume, would improve the reversal case. Bearish confirmation: Losing $0.00772 would expose the historical low near $0.00629. Continued TVL contraction, recurring supply pressure and weak token demand could keep NAVX under pressure. NAVI has a functioning lending business and measurable revenue, but the token still needs stronger value capture and renewed market confidence. I would watch the $0.00772 support and whether protocol deposits stabilize before calling this a genuine recovery. $NAVXUSDT #ByXIMPACT
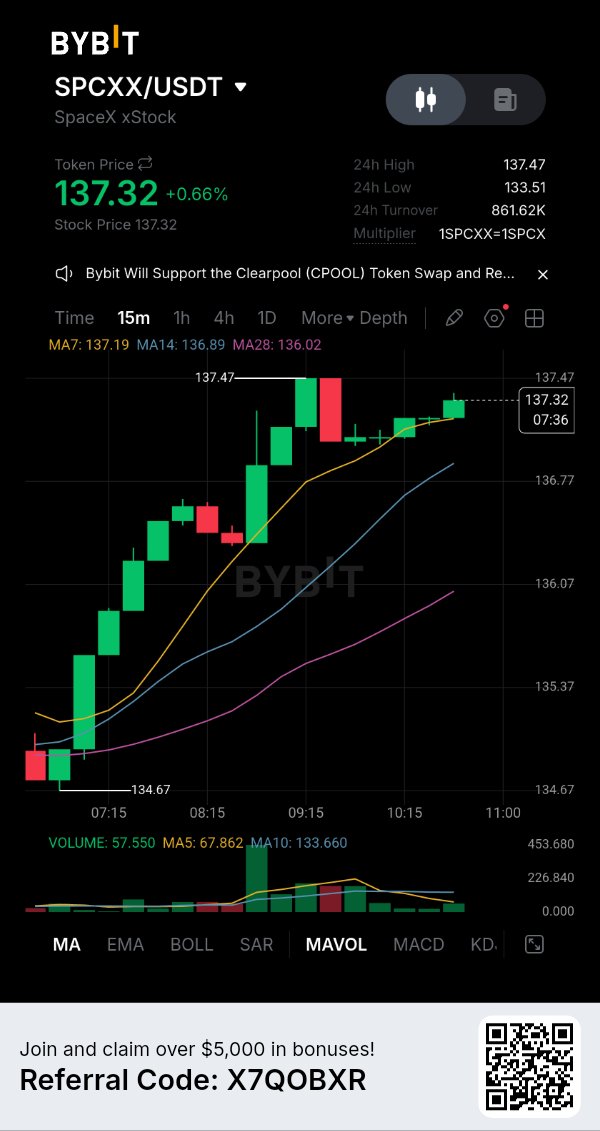
SpaceX exposure is attracting attention, but SPCXX has a risk that ordinary stock investors rarely face: token supply concentration and the gap between 24/7 trading and the underlying equity market. SpaceX xStock is trading near $134.77, up approximately 1.2% over 24 hours and 0.3% over seven days. The latest daily range is $133.54–$136.53, while the weekly range extends to $148.17. Price remains around 40% below its $225.31 all-time high. The immediate challenge is reclaiming $136.53 before buyers can seriously target the $140 area. The fundamental narrative is SpaceX's exposure through a tokenized equity product. SPCXX is designed to track SpaceX shares on a 1:1 basis, with underlying shares held in regulated custody through the xStocks framework. Its mint-and-burn structure links token issuance to deposited shares. This provides economic price exposure, but it is not the same as holding ordinary shares directly: token holders do not receive normal shareholder voting rights or dividends. The market is showing meaningful interest. SPCXX has approximately $79M in market capitalization and around $5.86M in 24-hour trading volume. It is available across multiple chains, including Solana, Ethereum, Mantle and BNB Chain. However, only about 586K tokens are reported as circulating against approximately 1.71M total supply. That puts circulating supply near 34% of the reported total, leaving a substantial gap that investors should monitor. There is another risk worth watching: ownership concentration. One tracker reports that the top 10 addresses hold 100% of tracked supply, although this figure needs on-chain verification and may reflect custody or issuer wallets rather than independent investors. It is not enough to assume that all those tokens are available for immediate sale, but concentration can affect liquidity and market stability. Key figures Price: ~$134.77 Market cap: ~$79M 24H change: +1.2% 7D change: +0.3% 24H range: $133.54–$136.53 7D range: $133.30–$148.17 24H volume: ~$5.86M Circulating supply: ~586K SPCXX Total supply: ~1.71M SPCXX Distance from ATH: ~40% Bullish confirmation: A sustained break above $136.53 would strengthen the recovery structure. Reclaiming $140 and then $148.17 would indicate buyers are regaining control. Bearish confirmation: Losing $133.54 would weaken the current consolidation and expose the $133.30 weekly low. Wider weakness in SpaceX shares, reduced liquidity or uncertainty around token backing could deepen the correction. SPCXX offers an interesting bridge between traditional equity exposure and on-chain markets, but the token's value ultimately depends on SpaceX's underlying share price and the integrity of its backing structure. I would watch the $136.53 breakout and supply transparency before treating this as a strong directional setup. $SPCXXUSDT #ByXIMPACT
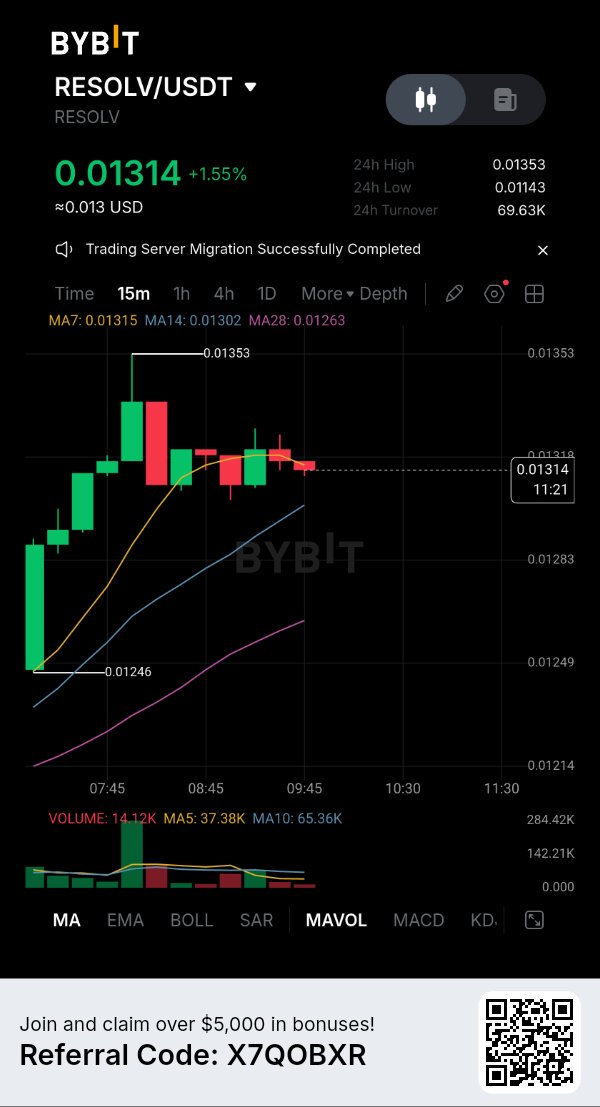
RESOLV is attempting a rebound, but the protocol still has something much harder to recover than price: market confidence. Its March security breach remains the central risk investors cannot ignore. RESOLV is trading near $0.0123, down approximately 7% over 24 hours and 14% over seven days. The latest daily range is $0.01219–$0.01346, putting price close to its recent low. It is now roughly 97% below its $0.4085 all-time high. Buyers need to reclaim $0.01346 before this starts looking like more than a temporary bounce. Resolv's core product is USR, a dollar-pegged stablecoin designed around delta-neutral collateral strategies, with RLP serving as an insurance layer. The model aims to generate yield without relying solely on directional crypto exposure. But the March 21 exploit exposed a critical weakness: a compromised infrastructure key enabled the minting of 80M unbacked USR, resulting in approximately $24.5M in losses and a depeg. The incident was not simply a market correction; it was a failure of operational security. The protocol has since described recovery measures and expanded safeguards, including stronger oracle checks and RWA vault infrastructure. DeFiLlama currently tracks approximately $13.09M in TVL, $36.38M in cumulative fees and $2.1M in cumulative protocol revenue. However, cumulative fees are not current earnings, and TVL alone does not prove that user confidence has fully returned. Supply is another pressure point. Around 515M RESOLV are circulating against a 1B maximum supply. The next major scheduled unlock is approximately 18.24M tokens on November 26, equal to around 3.54% of circulating supply. Continuous ecosystem and community releases add roughly 1.23M tokens weekly. That is meaningful dilution for a token with a market cap of only about $6.3M. Derivatives add another layer of caution. Tracked perpetual open interest is around $4.3M, approximately 68% of market capitalization, while funding is positive near 0.005% per eight hours. Futures volume is nearly 24 times spot volume in the latest tracker snapshot. This imbalance means leveraged positioning can move price sharply without equivalent spot demand. Key figures Price: ~$0.0123 Market cap: ~$6.3M 24H range: $0.01219–$0.01346 7D performance: ~-14% TVL: ~$13.09M Cumulative protocol fees: ~$36.38M Cumulative protocol revenue: ~$2.1M Circulating supply: ~515M RESOLV Next major unlock: 18.24M RESOLV, November 26 Bullish confirmation: Reclaiming $0.01346 and holding above it would be the first recovery signal. Improving TVL, stable USR demand and evidence of stronger security controls would make the rebound more credible. Bearish confirmation: Losing $0.01219 would expose the risk of a fresh low. Further stablecoin confidence issues, weak liquidity or selling ahead of the November 26 unlock could deepen the decline. RESOLV has a real DeFi product and a recovery plan, but the market needs proof that the system is safer and users are willing to return. Until price reclaims resistance and protocol confidence improves, this remains a high-risk recovery attempt. $RESOLVUSDT #ByXIMPACT
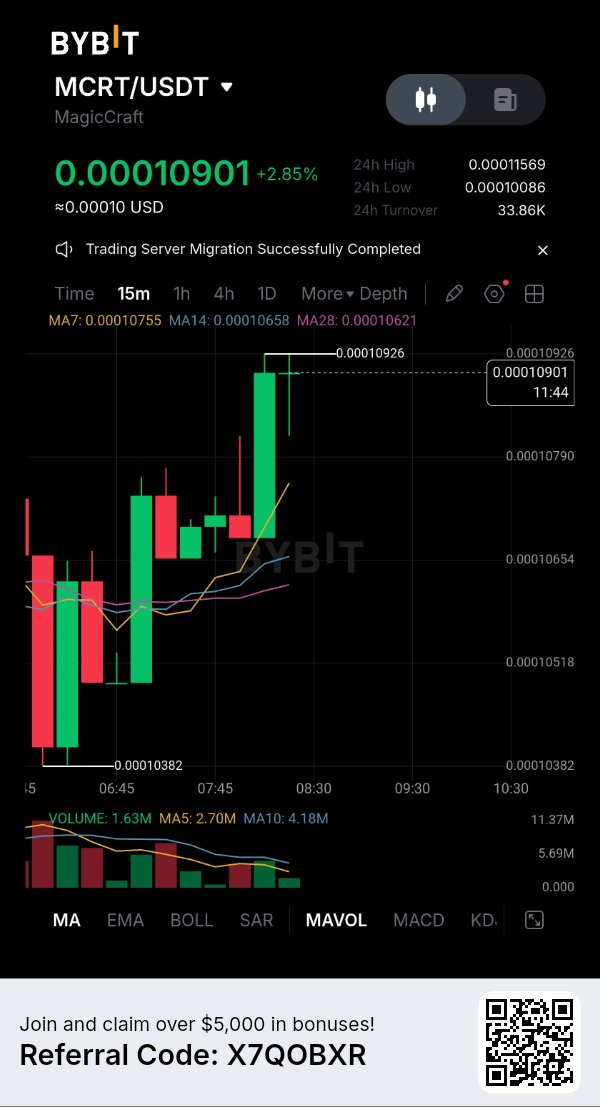
MCRT is showing a sharp rebound, but one strong trading session does not erase the weakness behind this token. The next move needs to prove that buyers are returning for more than a speculative bounce. MagicCraft is trading near $0.000106, with market capitalization around $534K and reported 24-hour volume near $70.8K. The latest daily range is $0.0001013–$0.0001193, while the weekly range extends to $0.0001867. Price remains more than 99% below its historical peak, and the recent volatility shows how quickly a relatively small amount of capital can move this market. The fundamental story is that MagicCraft is positioning itself as a live gaming and product ecosystem rather than only a play-to-earn token. Its official website reports 145.83M MCRT recorded across game lobbies and highlights its PvP and PvE modes. The free-to-play game can be accessed without a wallet, while MCRT supports optional Web3 features, eligible lobbies, marketplace activity and selected ecosystem payments. That distinction matters: game users do not automatically become MCRT buyers. The key question is conversion. Can the game turn active players into recurring Web3 participants who actually use MCRT? The lobby figure is an encouraging activity signal, but it is not the same as verified daily active users, paying customers or sustained token demand. Supply remains a major concern. Market trackers report approximately 5.04B MCRT circulating, against a 10B maximum supply. The next scheduled unlock is 20M MCRT on November 21, allocated to the community. It represents only around 0.4% of reported circulating supply, but liquidity is thin enough that even modest selling can matter. The official documentation also states that MCRT has no automatic burn mechanism. Key figures Price: ~$0.000106 Market cap: ~$534K 24H volume: ~$70.8K 24H range: $0.0001013–$0.0001193 7D range: $0.00008957–$0.0001867 Circulating supply: ~5.04B MCRT Maximum supply: 10B MCRT Next unlock: 20M MCRT, November 21 Reported game-lobby activity: 145.83M MCRT recorded Bullish confirmation: A sustained break above $0.0001193 with stronger spot volume would improve the recovery structure. Holding above that level and moving toward $0.00013 would suggest buyers are gaining control. Bearish confirmation: Losing $0.0001013 would weaken the rebound and expose the $0.0000896 area. Thin liquidity, weak game-to-token conversion and continued selling could quickly reverse the recovery. MCRT has a live game and several optional token utilities, but the market needs evidence of recurring users and real token demand. Until volume and price confirm each other, this remains a speculative recovery rather than a confirmed trend change. $MCRTUSDT #ByXIMPACT
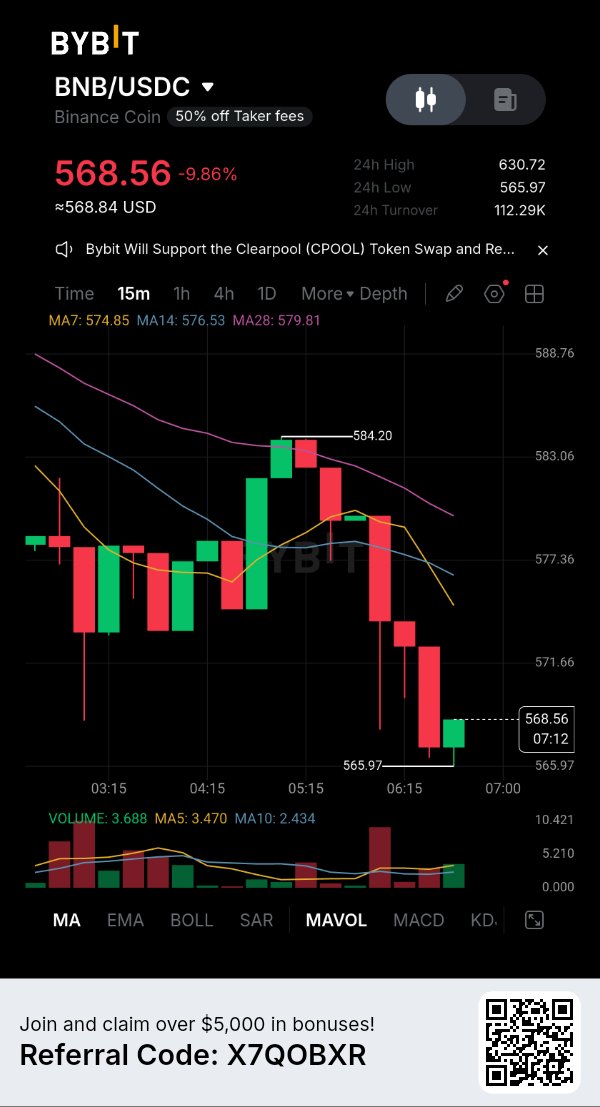
BNB is showing a clear disconnect: the network is still processing millions of transactions, but the token is experiencing one of its strongest selling sessions. That gap is what makes the next support test important. BNB is trading near $581, down approximately 8.6% over 24 hours and 16.4% over seven days. The latest daily range is $577.21–$636.27. Price is now around 57.6% below its October 2025 all-time high near $1,370. The $577 area is the immediate level buyers need to defend; $600 is the first psychological recovery hurdle. The fundamental picture is mixed rather than entirely bearish. BNB Chain recorded approximately 12.3 million smart-contract deployments in Q3, nearly 173% above Q2, while network revenue increased 54% to $54.2M. Tokenized-equity trading also reached $25.6B. However, average daily active addresses declined 14% to 2.1 million. More contracts and financial activity are encouraging, but they do not automatically translate into stronger demand for BNB. On-chain data shows the network remains active, with approximately 17.5 million daily transactions and nearly 698 BNB in network fees on November 13. Stablecoin supply was around $11.96B. Yet broader DeFi deposits are estimated near $4.54B, down 10.7% over seven days. This suggests the ecosystem has activity, but capital confidence is weakening. Supply reduction remains a long-term support mechanism. The 37th quarterly Auto-Burn on October 19 permanently removed 1.646 million BNB, worth approximately $1.197B at the time. Total remaining supply was around 131.51M BNB, with the long-term burn target set at 100M. But a shrinking supply cannot create an immediate price floor when market-wide selling dominates. Derivatives confirm the pressure. Aggregate futures open interest is around $952M, down 7.65% in 24 hours. Approximately $15.65M in positions were liquidated, with $15.55M coming from longs. Funding is slightly positive at 0.0009%, while futures volume is roughly six times spot volume. Leverage is being reduced, but futures still dominate price discovery. Key figures Price: ~$581 Market cap: ~$76.62B 24H change: -8.58% 7D change: -16.43% 24H range: $577.21–$636.27 Futures open interest: ~$952M 24H liquidations: ~$15.65M 37th quarterly burn: 1.646M BNB BNB Chain Q3 revenue: ~$54.2M Daily transactions: ~17.5M Bullish confirmation: Defending $577 and reclaiming $600 would be the first stabilization signal. A move above $636, supported by stronger spot demand and recovering DeFi deposits, would make a broader reversal more credible. Bearish confirmation: A decisive breakdown below $577 would indicate that sellers still control the market. Continued long liquidations, declining TVL and weak spot participation could extend the correction. BNB still has real network utility, a substantial stablecoin ecosystem and a measurable burn mechanism. But the market is currently prioritizing liquidity over fundamentals. I would wait for $600 to be reclaimed before treating this decline as a recovery. $BNBUSDT #ByXIMPACT
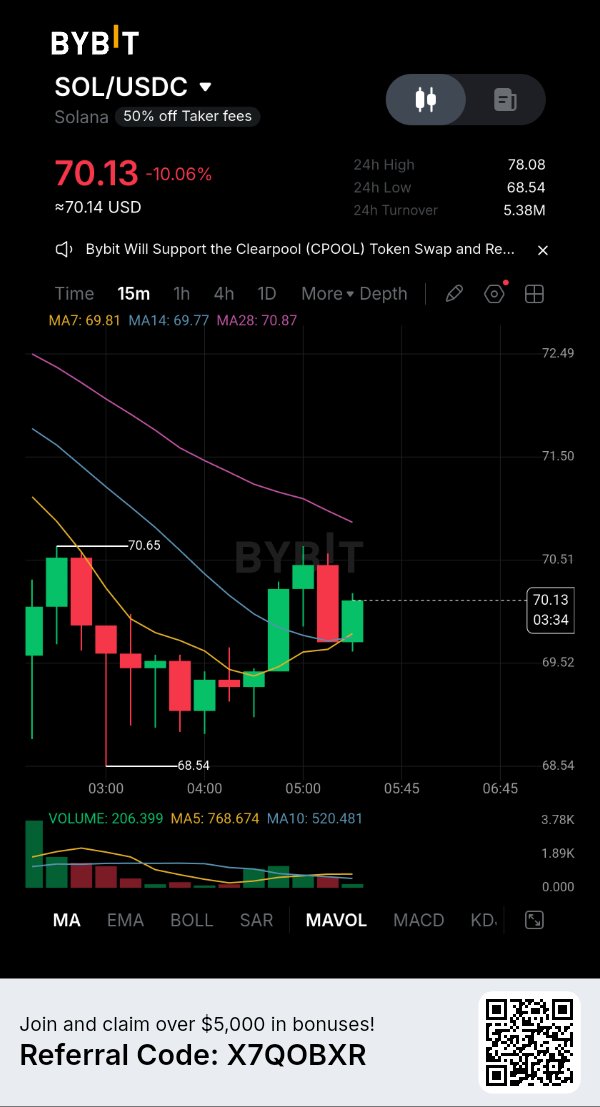
Solana has lost the $70 level, and this sell-off is becoming more than a routine altcoin correction. The leverage reset is accelerating, while institutional flows have yet to provide a convincing floor. SOL is trading near $69.56, down approximately 11.66% over 24 hours and 22.43% over seven days. The latest daily range is $68.75–$78.63, putting price close to its session low. SOL is now roughly 76% below its January 2025 all-time high of $294.33. The immediate test is whether buyers can defend the $68.75 area. ETF demand is another concern. US spot Solana ETFs recorded seven consecutive sessions of outflows through November 13, losing approximately $58.31M over that period. There was a partial daily inflow reversal earlier in the week, but it was not enough to change the broader flow picture. Meanwhile, DTCC's plan to connect its tokenization service to Solana in the second half of 2027 offers a longer-term institutional narrative, not an immediate source of token demand. Derivatives show how aggressively the market has been reset. Futures open interest stands near $4.08B, down 12.15% in 24 hours. Approximately $99.2M in SOL liquidations were recorded, with around 97% coming from long positions. Funding has turned negative at roughly -0.0102%, while futures volume is more than eight times spot volume. This suggests leveraged longs have been flushed, but sustained spot buying is still needed to establish a durable bottom. Key figures Price: ~$69.56 Market cap: ~$41.33B 24H change: -11.66% 7D change: -22.43% 24H range: $68.75–$78.63 Futures open interest: ~$4.08B 24H liquidations: ~$99.2M Funding rate: -0.0102% Circulating supply: ~591.57M SOL Spot ETF flows: ~$58.31M outflows over seven sessions Bullish confirmation: Defending $68.75 and reclaiming $78.63 would be the first meaningful recovery signal. Improving spot inflows and a stabilization in open interest would make a move back toward $80 more credible. Bearish confirmation: A decisive break below $68.75 would leave the market vulnerable to another downside leg. Continued ETF withdrawals and spot selling would weaken the case for an immediate reversal. Solana still has a significant institutional and application-development narrative, but long-term potential cannot override short-term liquidity. I want to see buyers reclaim resistance and spot demand return before treating this decline as a confirmed bottom. $SOLUSDT #ByXIMPACT
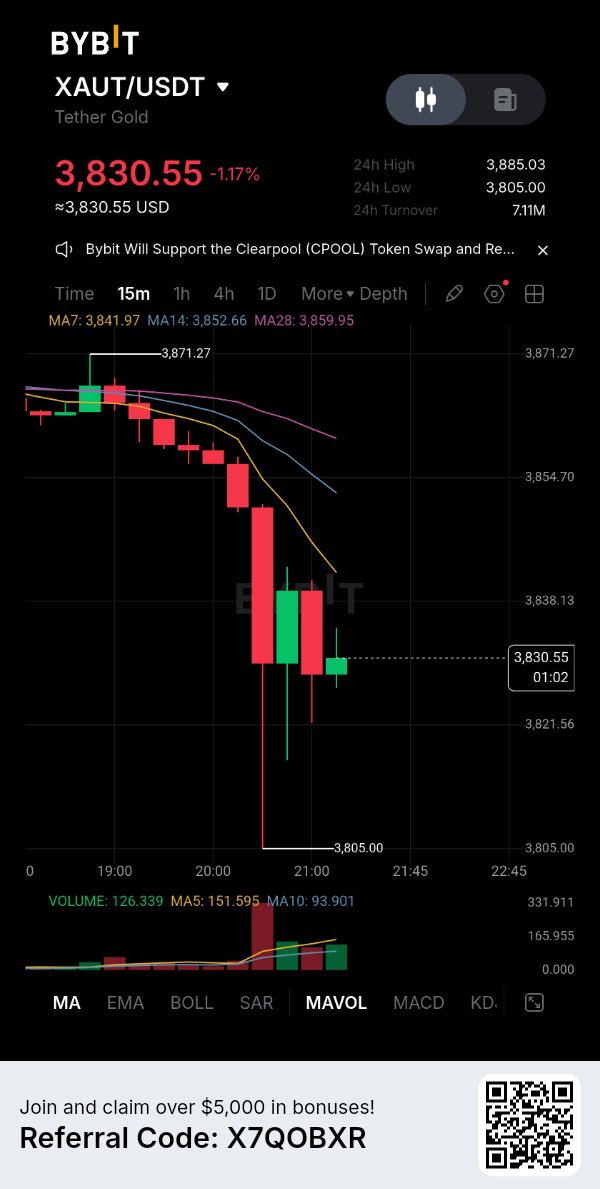
Gold safe-haven reputation is being tested by rising yields. XAUT is tracking that pressure, but the bigger question is whether physical-gold demand can absorb the current correction. XAUT is trading near $3,864, down approximately 0.54% over 24 hours and 4.76% over seven days. The latest daily range is $3,857–$3,895. The $3,857 area is the immediate support to defend, while $3,895 is the first recovery barrier. This is a significant pullback from the January peak near $5,597. The main pressure is macroeconomic. Stronger US inflation data, rising Treasury yields and a firmer dollar have revived expectations of further Federal Reserve tightening. Gold lost more than 4% during the week, struggling to reclaim $4,000. Since bullion pays no interest, higher yields increase the opportunity cost of holding it. Friday's softer producer-price reading offered some relief, but it has not yet reversed the broader trend. There is an important fundamental counterpoint. Tether reported that its physical gold reserves reached 827,417.63 fine troy ounces at September 30, exactly matching the reported 827,417.63 XAUT tokens in circulation at that reporting date. The reserves were valued at approximately $3.44B, with gold stored in Switzerland. Separately, KPMG issued an unqualified opinion on the issuer's 2025 financial statements after physically inspecting the backing gold bars. This strengthens the reserve-verification story, although it does not protect XAUT from a fall in gold's market price. Derivatives deserve attention too. Tracked futures open interest is around $789.7M, approximately 27% of reported market capitalization, while funding is positive near 0.0128%. Spot and futures net flows are both negative in the latest tracker snapshot. That combination suggests leveraged exposure remains substantial even as capital flows weaken. Key figures Price: ~$3,864 Market cap: ~$2.89B 24H change: -0.54% 7D change: -4.76% 24H range: $3,857–$3,895 Futures open interest: ~$789.7M Funding rate: +0.0128% Q3 2026 gold reserves: 827,417.63 oz Q3 reserve value: ~$3.44B Bullish confirmation: Reclaiming $3,895 and then $3,900 would be the first sign of stabilization. A sustained move back above $4,000, supported by softer yields and renewed gold demand, would improve the recovery case. Bearish confirmation: A decisive break below $3,857 would expose the next downside zone around $3,823–$3,852. Continued dollar strength and rising yields could keep gold under pressure. XAUT's backing is a strength, but it cannot remove the volatility of the asset it represents. The reserve story remains intact; the chart still needs gold to find its footing. $XAUTUSDT #ByXIMPACT

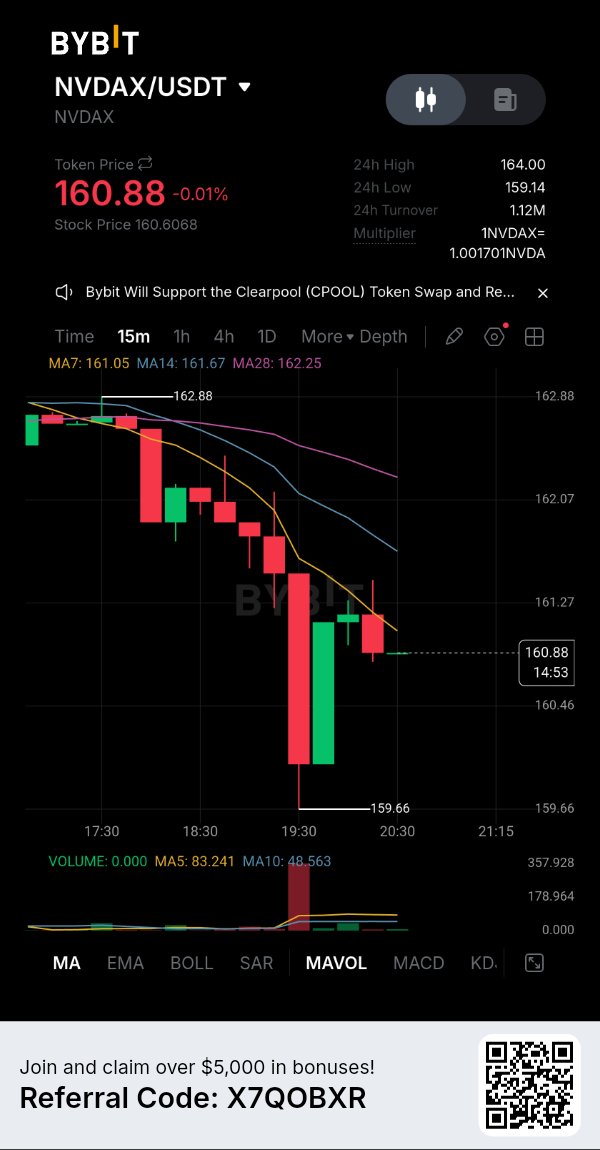
NVDAX is facing a rare combination: a sharp repricing in NVIDIA shares, a leadership shock and a major earnings event just days away. This is no longer simply an AI-sector momentum trade. NVDAX is trading near $162, down approximately 3.2% over 24 hours and 13.9% over seven days. It has fallen around 33% from its October high of $242.89. The latest daily range is $158.67–$171.80. Buyers are defending the lower end, but the recovery remains unconfirmed while price stays below $171.80. The biggest catalyst is NVIDIA's official November 12 announcement: Jensen Huang resigned as CEO and CFO Colette Kress became interim CEO. This is a significant leadership transition at the center of the AI industry. NVIDIA says its operations, customer commitments and product roadmap are expected to continue without interruption, but investors still need evidence that execution remains stable. The next major test arrives November 17, when NVIDIA reports fiscal Q3 2027 results. Revenue growth, data-center demand, forward guidance and management commentary will matter more than headline earnings alone. Strong results could restore confidence, but any weakness in guidance may reinforce the current repricing. There is also an important distinction with NVDAX itself. It is a tokenized tracker certificate designed to provide economic exposure to NVIDIA shares, backed 1:1 by the underlying security according to its issuer. It does not provide ordinary shareholder voting rights. It can trade around the clock, while the underlying US stock market has fixed trading hours, creating potential price gaps and liquidity differences outside those hours. Derivatives show elevated positioning: futures open interest is around $3.89M, with funding near +0.1608%. Futures volume is approximately 2.5 times spot volume. That unusually positive funding suggests leveraged longs are paying heavily to maintain positions, leaving the market vulnerable if the underlying stock weakens further. Key figures Price: ~$162 Market cap: ~$94M 24H change: -3.2% 7D change: -13.9% 24H range: $158.67–$171.80 Distance from ATH: ~33% Futures open interest: ~$3.89M Funding rate: +0.1608% Next NVIDIA earnings: November 17 Bullish confirmation: Reclaiming $171.80 and holding above it would be the first meaningful recovery signal. Strong earnings, resilient data-center guidance and stabilizing NVIDIA shares could support a move toward $180. Bearish confirmation: A decisive break below $158.67 would expose the risk of another leg lower. Weak earnings guidance or continued leadership uncertainty could keep sellers in control. NVDAX ultimately follows NVIDIA's underlying business, not an independent crypto narrative. The November 17 results are the next major catalyst. Until then, a rebound without confirmation from the underlying shares is not enough. $NVDAXUSDT #ByXIMPACT
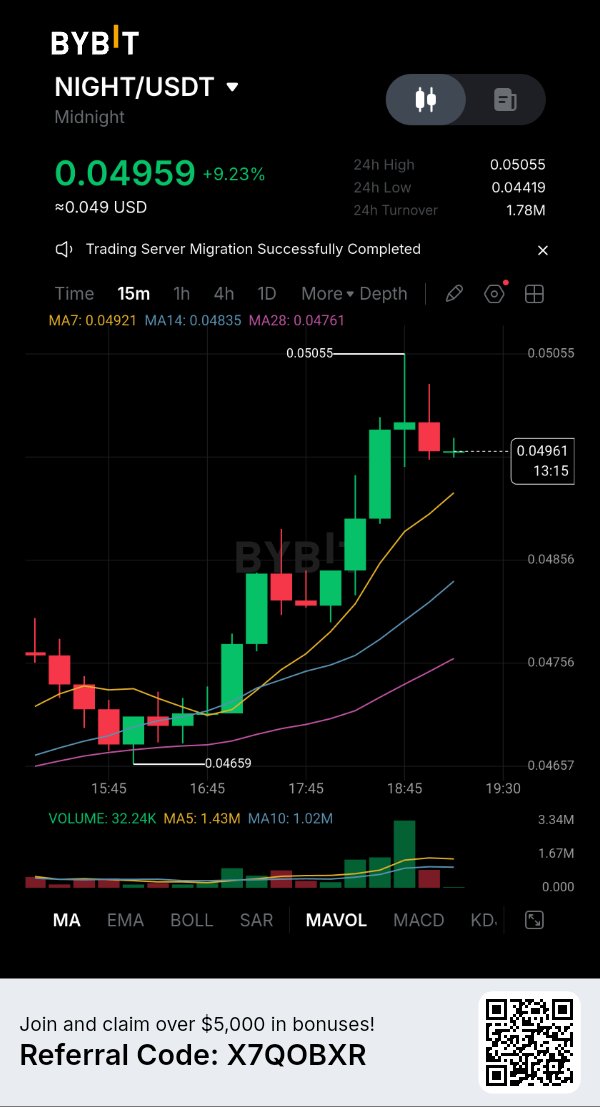
NIGHT is recovering, but the derivatives market is sending a warning that spot buyers should not ignore: the price is rising while funding remains deeply negative. Midnight is trading around $0.0469, up approximately 7.2% over 24 hours and 16.8% over seven days. The latest daily range is $0.04355–$0.04794. Buyers have regained momentum after the November 13 pullback, but the $0.048 area is now the immediate resistance. NIGHT remains roughly 60% below its December 2025 high near $0.119. The bigger story is Midnight's privacy-focused blockchain architecture. Its design aims to support selective disclosure, allowing users and institutions to protect sensitive information while proving specific facts when required. This is a meaningful positioning in the market for compliant privacy infrastructure. However, the long-term opportunity still depends on developer adoption, real applications and sustained network activity, not just the privacy narrative. The current positioning is particularly interesting. Aggregate futures open interest is approximately $26.5M, up 11.1% in 24 hours, while funding is around -0.0323%. Futures volume is roughly 3.5 times spot volume. Negative funding alongside rising price can indicate short positioning against a recovering market, creating squeeze potential. But it also means leverage is building, and a failed breakout could quickly reverse sentiment. Supply is another factor. Approximately 16.61B NIGHT are circulating against a maximum supply of 24B, leaving around 7.39B outside reported circulation. That is roughly 30.8% of maximum supply, so future distribution and demand absorption remain important. Key figures Price: ~$0.0469 Market cap: ~$780M 24H change: +7.2% 7D change: +16.8% 24H range: $0.04355–$0.04794 Futures open interest: ~$26.5M Funding rate: -0.0323% 24H futures volume: ~$48.9M 24H spot volume: ~$14M Circulating supply: ~16.61B NIGHT Maximum supply: 24B NIGHT Bullish confirmation: A decisive break above $0.04794 followed by sustained acceptance above $0.048 would strengthen the recovery. Rising spot volume and continued price strength despite negative funding could force crowded shorts to cover. Bearish confirmation: Rejection around $0.048 and a loss of $0.04355 would weaken the structure. If open interest keeps rising while spot demand fades, the downside could accelerate. NIGHT has momentum and a potentially powerful privacy narrative, but the next move needs spot confirmation. I would watch whether buyers can turn this rebound into a sustained breakout rather than chase a leveraged squeeze. $NIGHTUSDT #ByXIMPACT
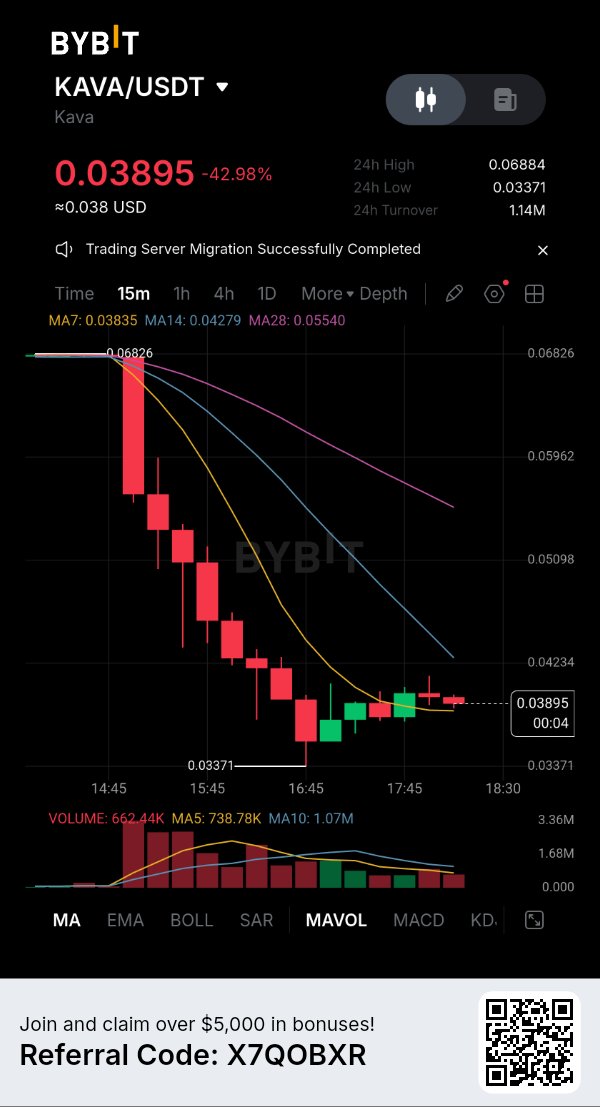
KAVA is facing a confidence crisis, not just a technical breakdown. The security incident has changed the trading setup, and the market is now pricing in uncertainty around the network itself. After the incident surfaced on November 14, KAVA fell sharply. Global exchange quotes were around $0.052–$0.054, with some Korean markets showing losses above 20%. Earlier price trackers still displayed roughly $0.068, so those snapshots should not be mistaken for the post-incident market. The immediate priority is whether price can stabilize after the shock. Kava's team has clarified that abnormal cross-chain transfers and selling involved KAVA moving to BNB Chain, and that the impact was isolated to Kava Lend. It also denied that the event involved unlimited token minting and said the situation was under control. That clarification matters, but it does not mean the full technical investigation is complete. Exchange reactions show how serious the confidence issue has become. Upbit placed KAVA on its trading-watch list and suspended deposits and withdrawals. Bithumb and Coinone also announced temporary transfer suspensions. Trading availability and withdrawal access are separate risks: even if market trading continues, users may not be able to move tokens freely between platforms and wallets. The wider ecosystem already had weaknesses. Kava's DeFi TVL was around $18.4M, while stablecoin market capitalization had fallen approximately 20.9% over seven days. Daily DEX volume was only around $21K. The incident therefore arrives when on-chain activity is not especially strong. Key figures Post-incident global price quotes: ~$0.052–$0.054 Pre-incident reference price: ~$0.068 Market cap reference before repricing: ~$74M Kava DeFi TVL: ~$18.4M Stablecoin market cap: ~$36.9M 7D stablecoin change: -20.9% Circulating supply: ~1.08B KAVA Reported maximum supply: No fixed cap Security incident: Impact reported as isolated to Kava Lend Bullish confirmation: A full technical explanation, verified remediation, restored exchange transfers and a sustained reclaim of the pre-incident $0.068 area would help rebuild confidence. Recovery in stablecoin liquidity and DeFi activity would add evidence. Bearish confirmation: Further exploit-related disclosures, continued transfer restrictions or failure to stabilize around current post-incident prices could trigger another wave of selling. A delisting decision would add another layer of risk. Kava has denied an unlimited mint, but the market needs more than reassurance. Until the investigation is transparent and exchange services normalize, this is a high-risk recovery attempt rather than a confirmed buying opportunity. $KAVAUSDT #ByXIMPACT