CryptoSquard
103Like ပေးရန်0ရှယ်ယာများ23ဖန်များ2Follow လုပ်ရန်
📊 Global Markets at a Crossroads: Inflation Surprises & Asian Market Surges The financial landscape is buzzing with major macroeconomic developments this week, creating both unique challenges and massive opportunities for crypto and traditional asset traders alike! Let’s break down the key narratives dominating the markets right now: 1️⃣ US October CPI Beats Forecasts: Is the Fed Turning Hawkish? The Numbers: The latest US Consumer Price Index (CPI) rose 0.4% MoM (above the 0.3% expected), while core CPI climbed 0.3%, also beating forecasts. The Market Impact: Persistent inflation pressures complicate the Federal Reserve's path forward. Will sticky inflation force the Fed to adopt a more hawkish stance and keep interest rates higher for longer? Crypto Implication: Higher-for-longer rates traditionally pressure risk-on assets, but crypto's evolving narrative as an inflation hedge and institutional vehicle keeps the volatility window wide open. How are you positioning your portfolio? 2️⃣ Korean Stocks Jump Over 5%: A Massive Regional Rally! The Surge: In sharp contrast to lingering macro anxiety elsewhere, Korean equities made headlines with a massive rally jumping over 5%, signaling strong regional capital inflows and renewed investor confidence. The Ripple Effect: Strong performances in traditional Asian tech and manufacturing markets often bleed into broader liquidity trends, sparking high-beta momentum across global digital asset markets. 💬 What's Your Take? Do you think sticky US inflation will cause a market correction, or is the crypto bull market resilient enough to shrug it off? How are you adjusting your trading strategy this week? Drop your thoughts in the comments below! 👇 #USInflationRunsHotAndRateHikeBetsRise #WSOT2026 $BTCUSDT $SUIUSDT

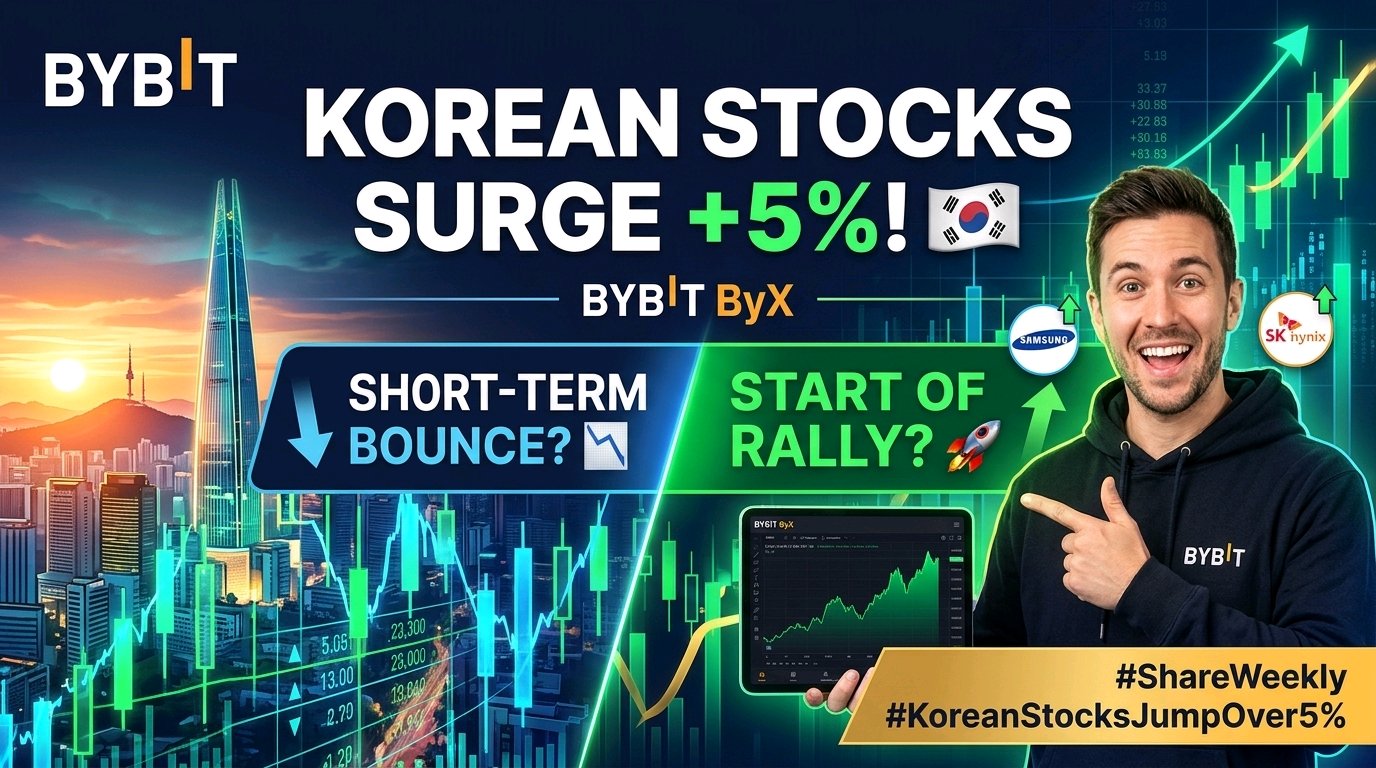
🚨 Today's Hot Topic | Korean Stocks Rebound: A Paradigm Shift or a Fleeting Bounce? The financial markets are buzzing as the KOSPI surged over 5% intraday, spearheaded powerhouse market leaders like Samsung Electronics and SK Hynix! Such a dramatic, high-volume upward movement has naturally ignited a fierce debate across global trading desks: Is this explosive move merely a short-term relief bounce, or is it the definitive kickoff of a major new structural rally? 📊 Deconstructing the Rally: Key Drivers Tech & Semiconductor Momentum: Samsung Electronics and SK Hynix are at the epicenter of global memory and AI-driven hardware demand. When these giants move violently to the upside, it acts as a massive liquidity wave lifting the entire index. Macro Sentiment & Institutional Flows: The sharp intraday reversal signals aggressive institutional accumulation. Are foreign capital flows returning to Asian equities, or are short-sellers aggressively unwinding positions? The Crypto & Tokenized Asset Correlation: In today's interconnected macro ecosystem, explosive liquidity in traditional equities often spills over into risk-on crypto assets, bridging traditional finance (TradFi) and decentralized finance (DeFi) sentiment. 🔍 Market Outlook: Short-Term Trap vs. Structural Bull Run The Bearish Case (Short-Term Bounce): Macro headwinds, fluctuating currency dynamics, and global liquidity tightening suggest this could be a classic "dead cat bounce" or liquidity sweep before another consolidation phase. Prudent traders are watching key resistance levels closely. The Bullish Case (New Rally Start): If this 5%+ surge breaks multi-week resistance structures with sustained volume, we could be witnessing the bottoming process and the early accumulation phase of a prolonged multi-month trend. 💬 Where Do You See the Best Opportunities ? How are you positioning your portfolio amidst this volatility? Are you scaling into tech majors, hedging your downside, or rotating capital into high-beta altcoins tracking the broader risk-on sentiment? Drop your trading strategies, analysis, and price targets in the comments below! 👇 #WSOT2026 #MidtermsMarketWatch $BTCUSDT $ETHUSDT
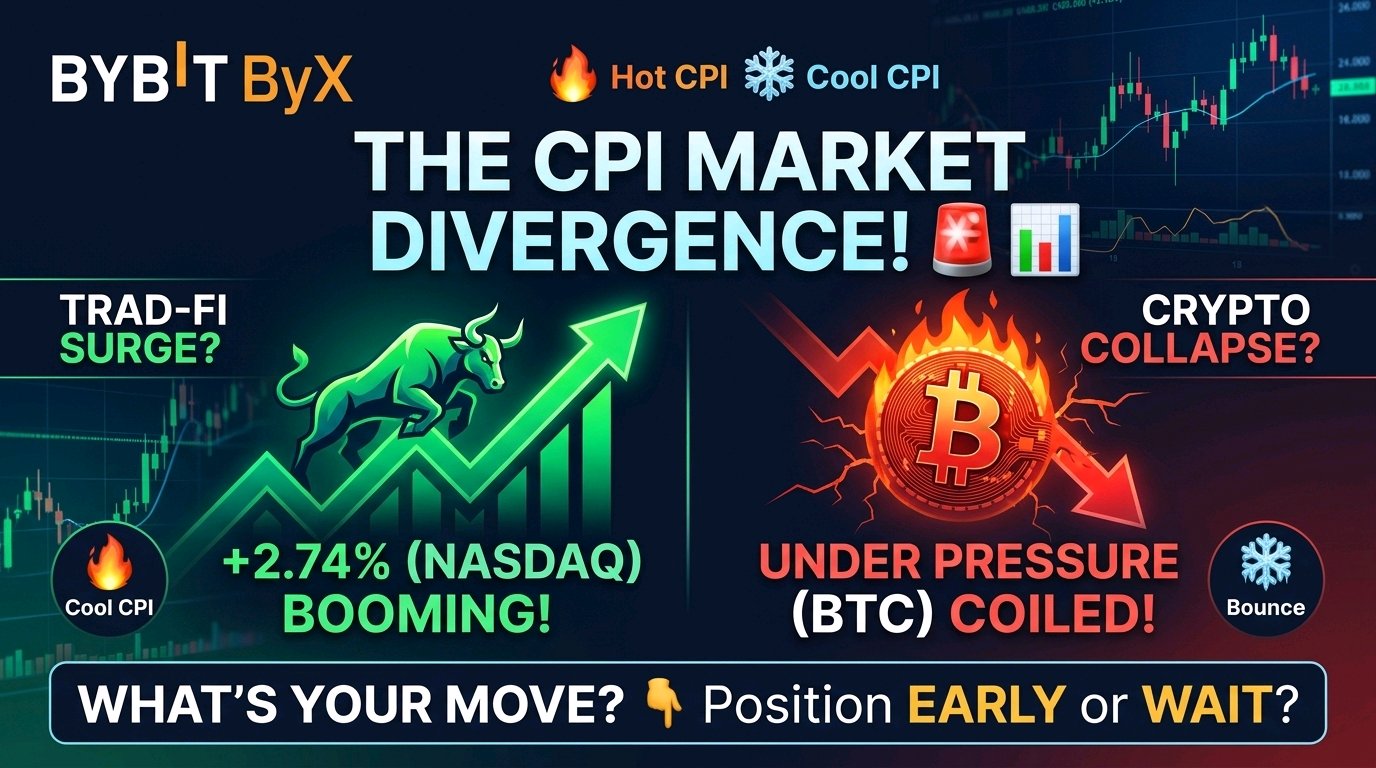
🚨 Macro Watch: The CPI Showdown & Crypto Divergence! The financial markets are on high alert today as macro forces collide. While the Nasdaq surged +2.74% in the previous session, Bitcoin (BTC) remains tightly coiled and under noticeable pressure. All eyes are now locked on the upcoming US CPI (Consumer Price Index) data dropping at 8:30 AM ET. This report could well dictate the short-term liquidity trajectory for both traditional equities and digital assets. 📊 Today's Core Debate: CPI — Hot or Cool? 🔥 If the CPI comes in HOT: Expect increased fears of persistent inflation, higher yields, and renewed downward pressure on BTC and risk-on stocks. 🧊 If the CPI comes in COOL: Relief could flood the markets, triggering a swift liquidity bounce and a strong recovery rally across the crypto ecosystem. 💡 Strategy Corner: How are you playing this volatility? ⚡ The Aggressive Trader: Taking a calculated position ahead of the print to capture maximum momentum. 🛡️ The Patient Analyst: Staying flat, letting the initial 8:30 AM ET volatility spike clear, and trading the confirmed trend. 👇 Drop your game plan below! Are you positioning early or waiting for the data to drop? #NovUSCPIWatch #USPayrollsAndRateDecisionsDriveMacroWeek $BTCUSDT $XAUTUSDT

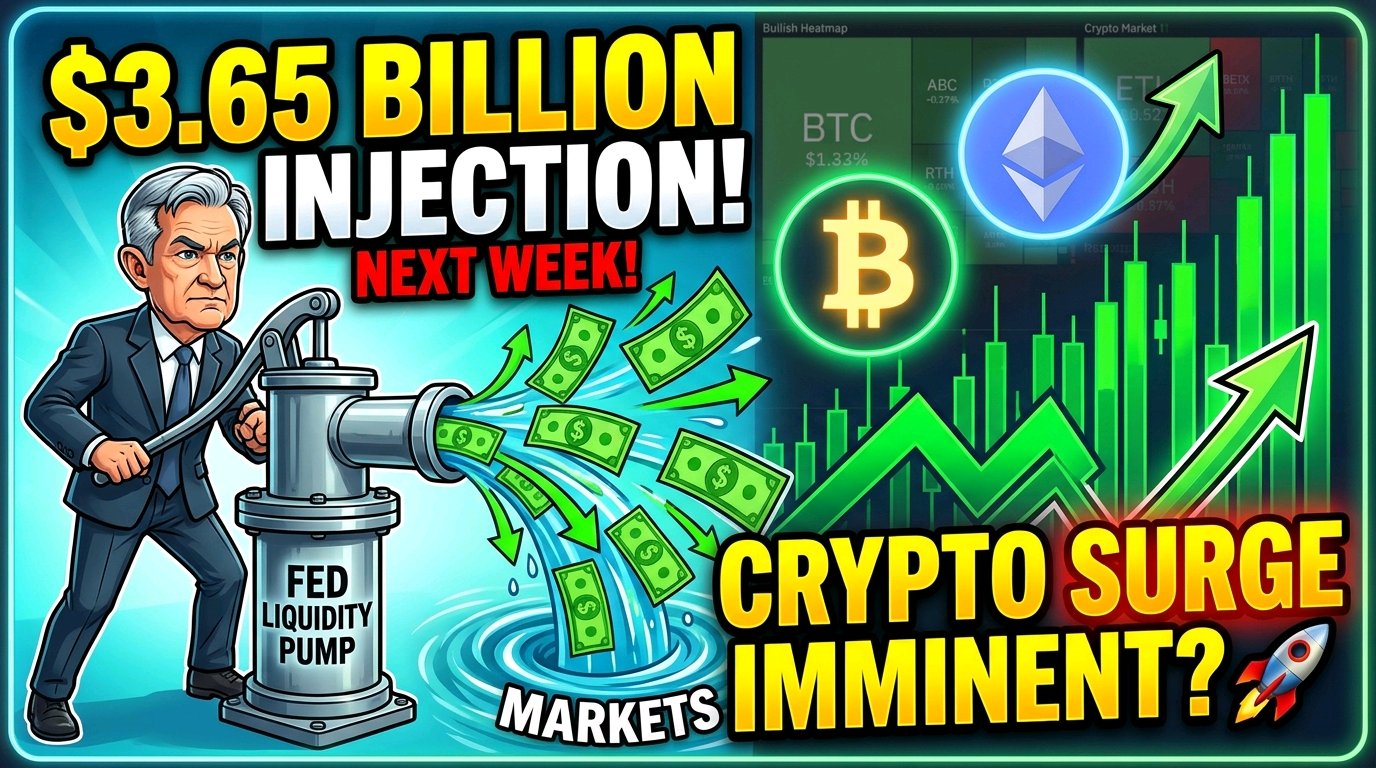
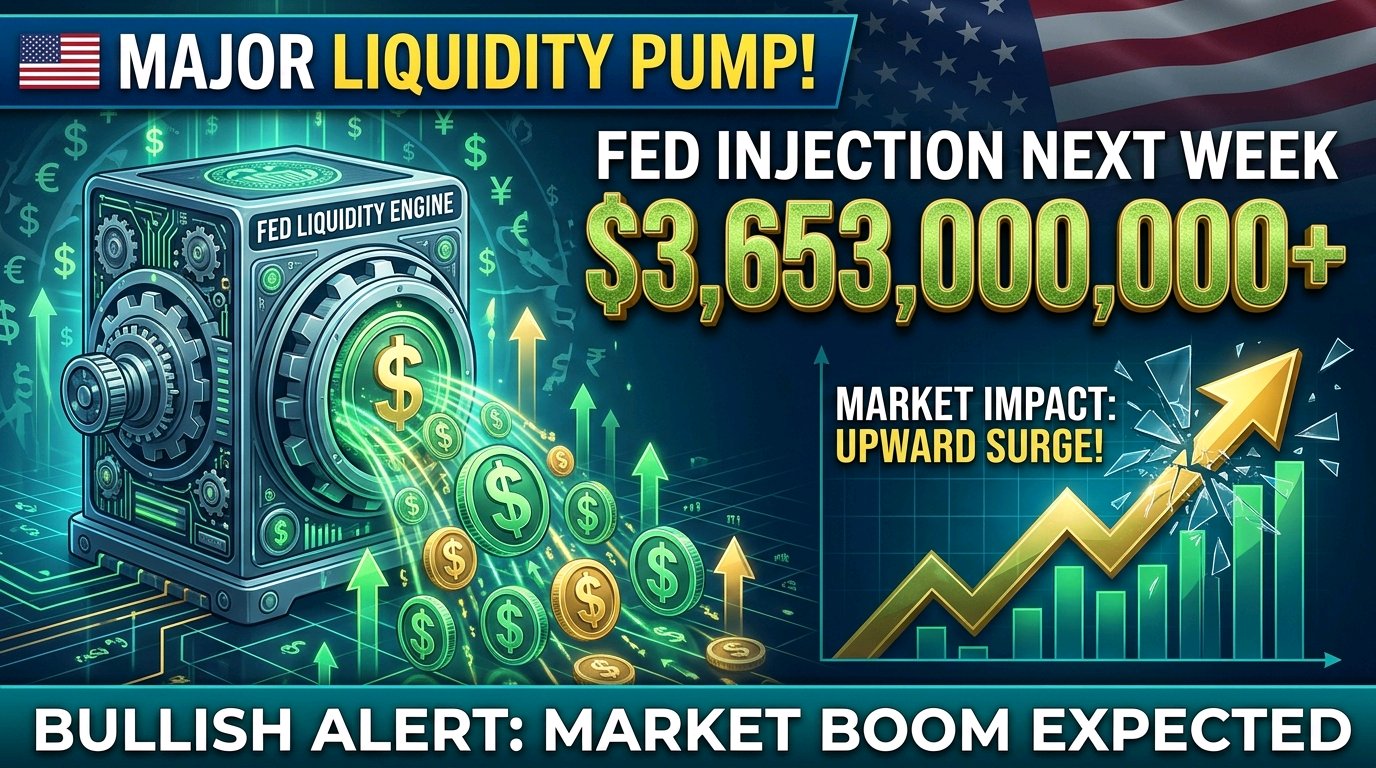
🚨 FED LIQUIDITY UPDATE: ~$3.65B Injection & Market Impact Analysis 🌊 The headline numbers are turning heads across crypto and macro circles: The Federal Reserve is slated to pump ~$3.65 billion in net liquidity into the banking and financial system. Before jumping to conclusions, it is critical to break down what this capital injection actually means, where the funds originate, and how it will ripple across high-risk asset classes like Bitcoin, altcoins, and equities. 1. Where Is the $3.65 Billion Coming From? 💡 A multi-billion liquidity pulse from the Fed typically stems from three core operational channels: Standing Repo Facility (SRF) & Term Repos: Primary dealers exchange short-term Treasuries/Agency debt for cash reserve balances to keep overnight lending markets smooth. Balance Sheet Adjustments & T-Bill Purchases: Shift toward short-term Treasury purchasing to sustain bank reserve adequacy without triggering inflation spikes. Treasury General Account (TGA) Drawdowns: When the U.S. Treasury releases funds back into commercial bank balance sheets, net system liquidity expands organically. 2. Immediate Impact on Financial Markets 📈 🪙 Crypto & Risk Assets (BTC, ETH, Altcoins) High-Beta Sensitivity: Crypto markets act as a real-time gauge for global USD liquidity. Even modest net liquidity increases reduce borrowing costs for market makers and institutional desks. Short-Term Price Action: Fresh liquidity lowers yield pressures on short-term debt, driving capital down the risk curve into Bitcoin and liquid layer-1 tokens. 🌐 Macro & Traditional Markets (S&P 500, Nasdaq, DXY) Dollar Index (DXY) Pressures: Added USD supply typically cools down dollar strength, giving risk assets room to break key resistance levels. Yield Curve Stabilization: System injections keep overnight rates within the Fed's target range, easing systemic stress across money markets. 3. Key Takeaway & Strategic Outlook ⚖️ While $3.65 billion is relatively localized compared to major Quantitative Easing (QE) cycles, directional liquidity shifts matter most. Transitioning from liquidity contraction to net expansion provides a favorable macroeconomic backdrop for digital assets. 🔍 Actionable Monitor: 1:DXY Dynamics: Watch if the Dollar Index breaks below immediate support. 2:BTC Dominance: Check whether new capital flows strictly into Bitcoin or spills over into top-cap altcoins. 3:Weekly Fed H.4.1 Balance Sheet Data: Confirm if repo demand remains elevated throughout the week. What’s your strategy for the week ahead—accumulating $BTC & Crypto Stocks or waiting for confirmation on altcoins? Share your setup below! 💬 Disclaimer: This analysis is for educational and informational purposes only and does not constitute financial or investment advice. Always manage your risk carefully. #MidtermsMarketWatch #WSOT2026 $BTCUSDT $XAUTUSDT
📉 The Epic U.S. Stock Sell-Off: Short-Term Flush or Deeper AI Correction? Markets experienced an intense wave of volatility when U.S. stocks faced heavy selling on Thursday, with the Nasdaq plunging and closing down over 5%. High-flying AI and chip stocks—including major market drivers like NVDA and AMD—took a severe hit, tumbling across the board. This dramatic market movement sparks a critical debate for traders and investors alike: Is this sharp downturn merely a short-term deleveraging event to clear out excess margin, or is the monumental AI trade entering a much deeper, structural correction? 🔍 Key Market Considerations: The Deleveraging Thesis: Rapid liquidations often trigger exaggerated sell-offs, meaning strong tech fundamentals could experience a swift, aggressive rebound. The Structural Correction Thesis: Valuations may have run too hot too fast, requiring an extended cooling-off period before the sector finds a stable bottom. 🧭 Where is the Smart Money Moving Next? As we navigate this macro turbulence, portfolios require careful strategic positioning. Which direction are you leaning toward for your next allocation? Chip Stocks: Doubling down on hardware leaders while prices are heavily discounted. Tech Giants: Sticking to mega-cap stability with robust cash flows and resilient business models. Defensive Sectors: Rotating out of high-growth tech entirely to shelter capital in traditional safer havens. What is your macro outlook for the upcoming sessions? Are you buying the dip or moving to safety? Let's discuss in the comments below! 👇 #MidtermsMarketWatch $NVDAXUSDT


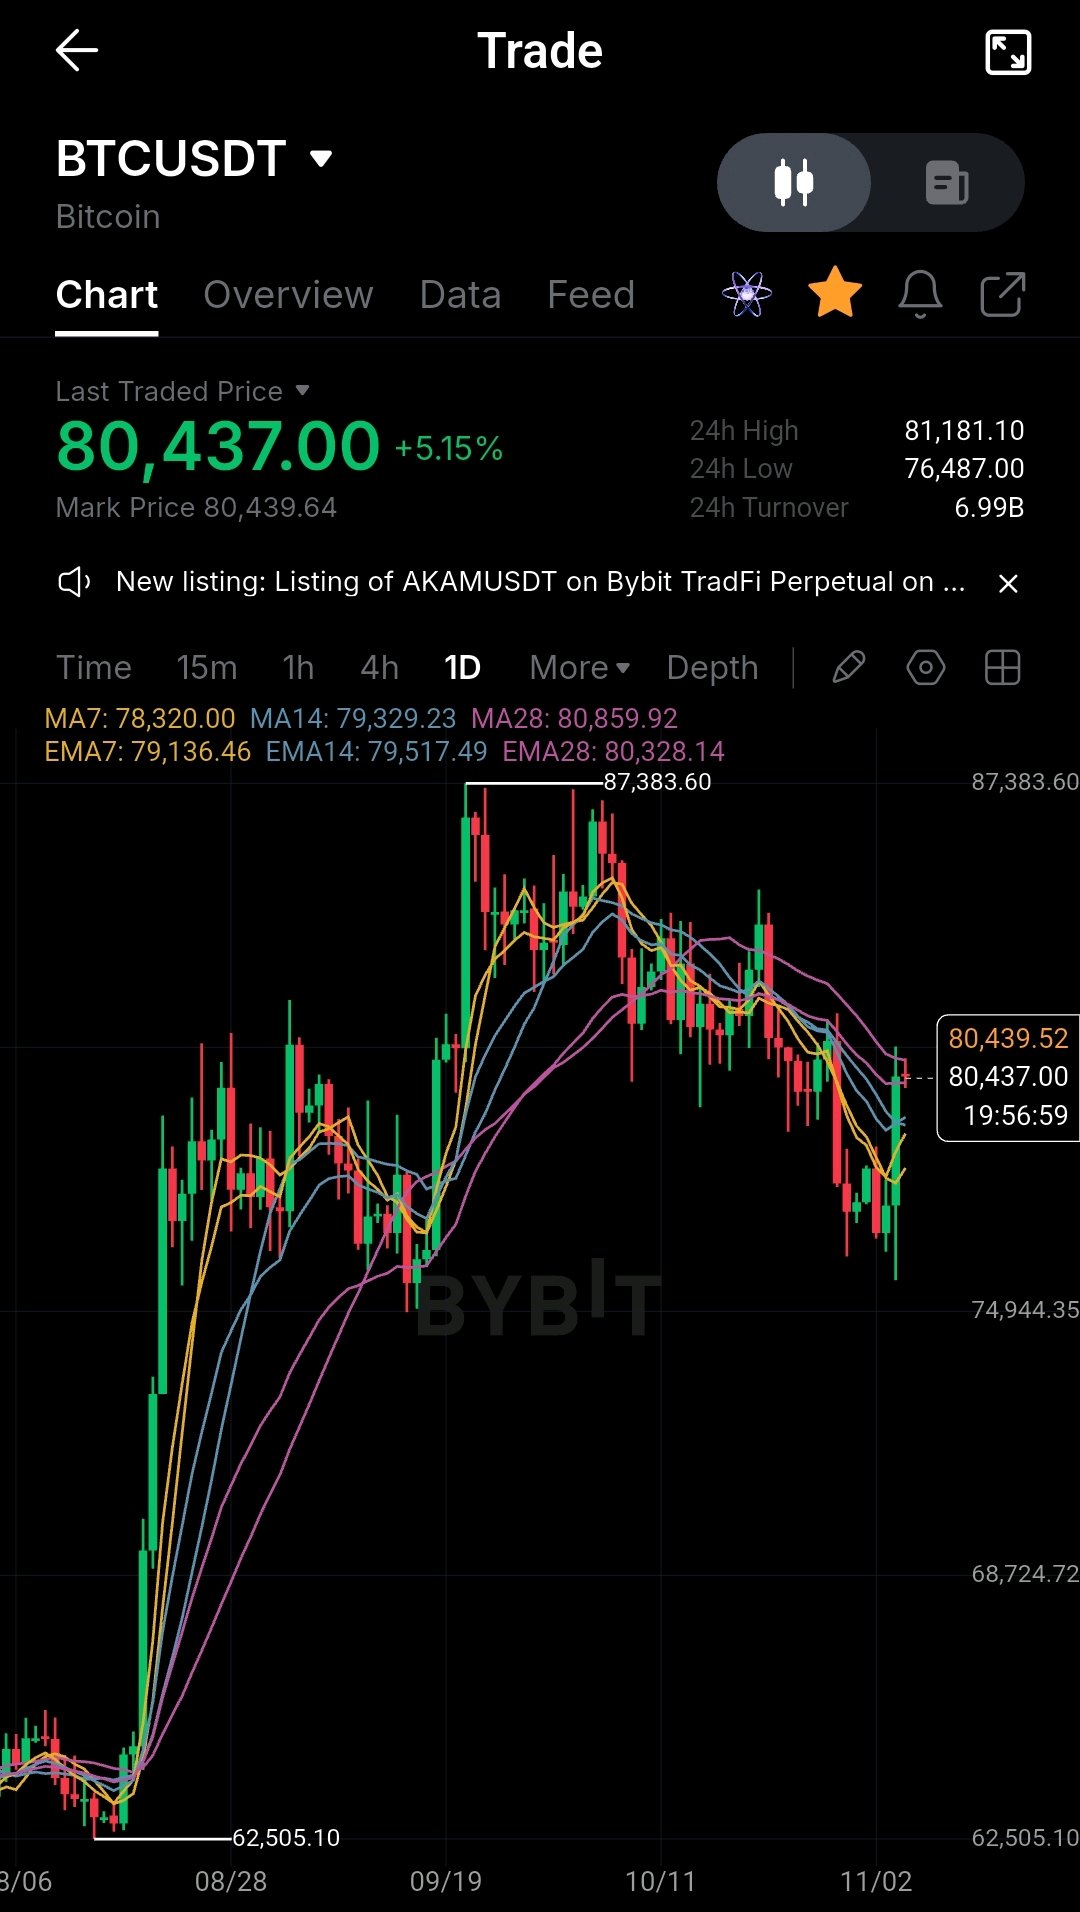
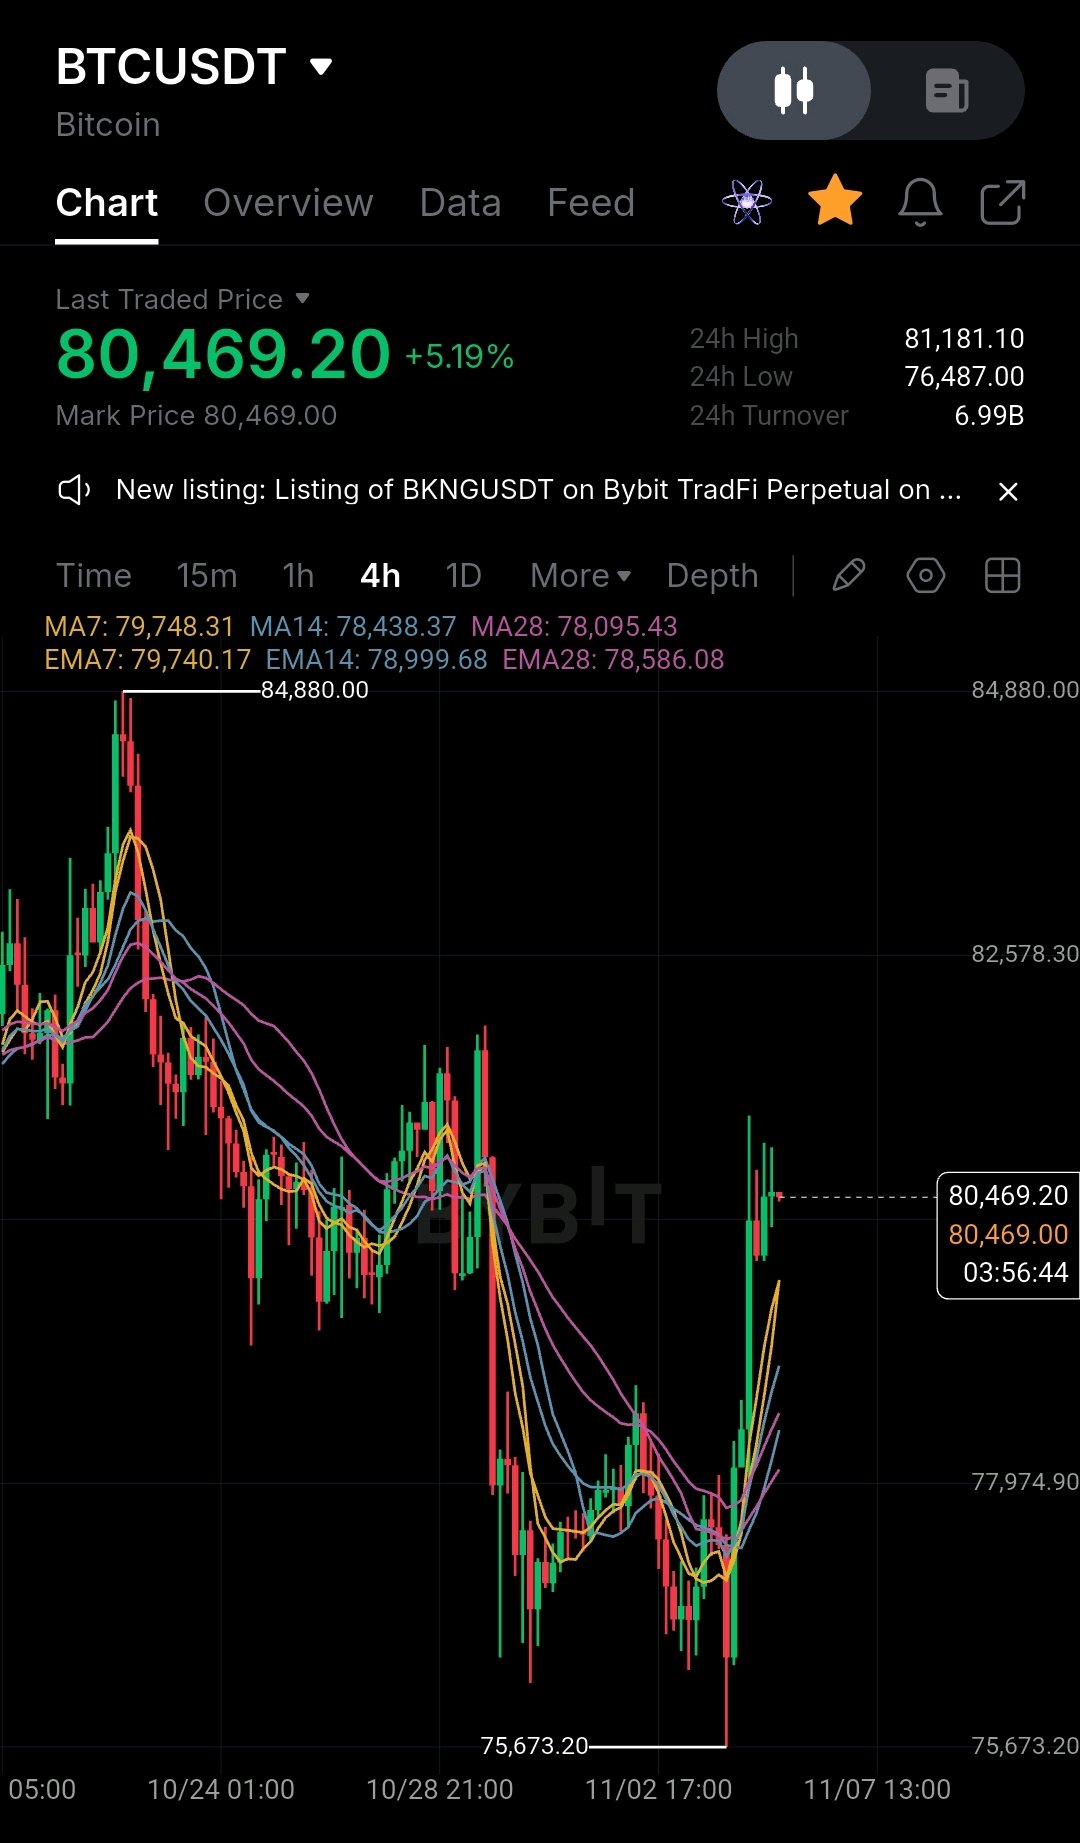
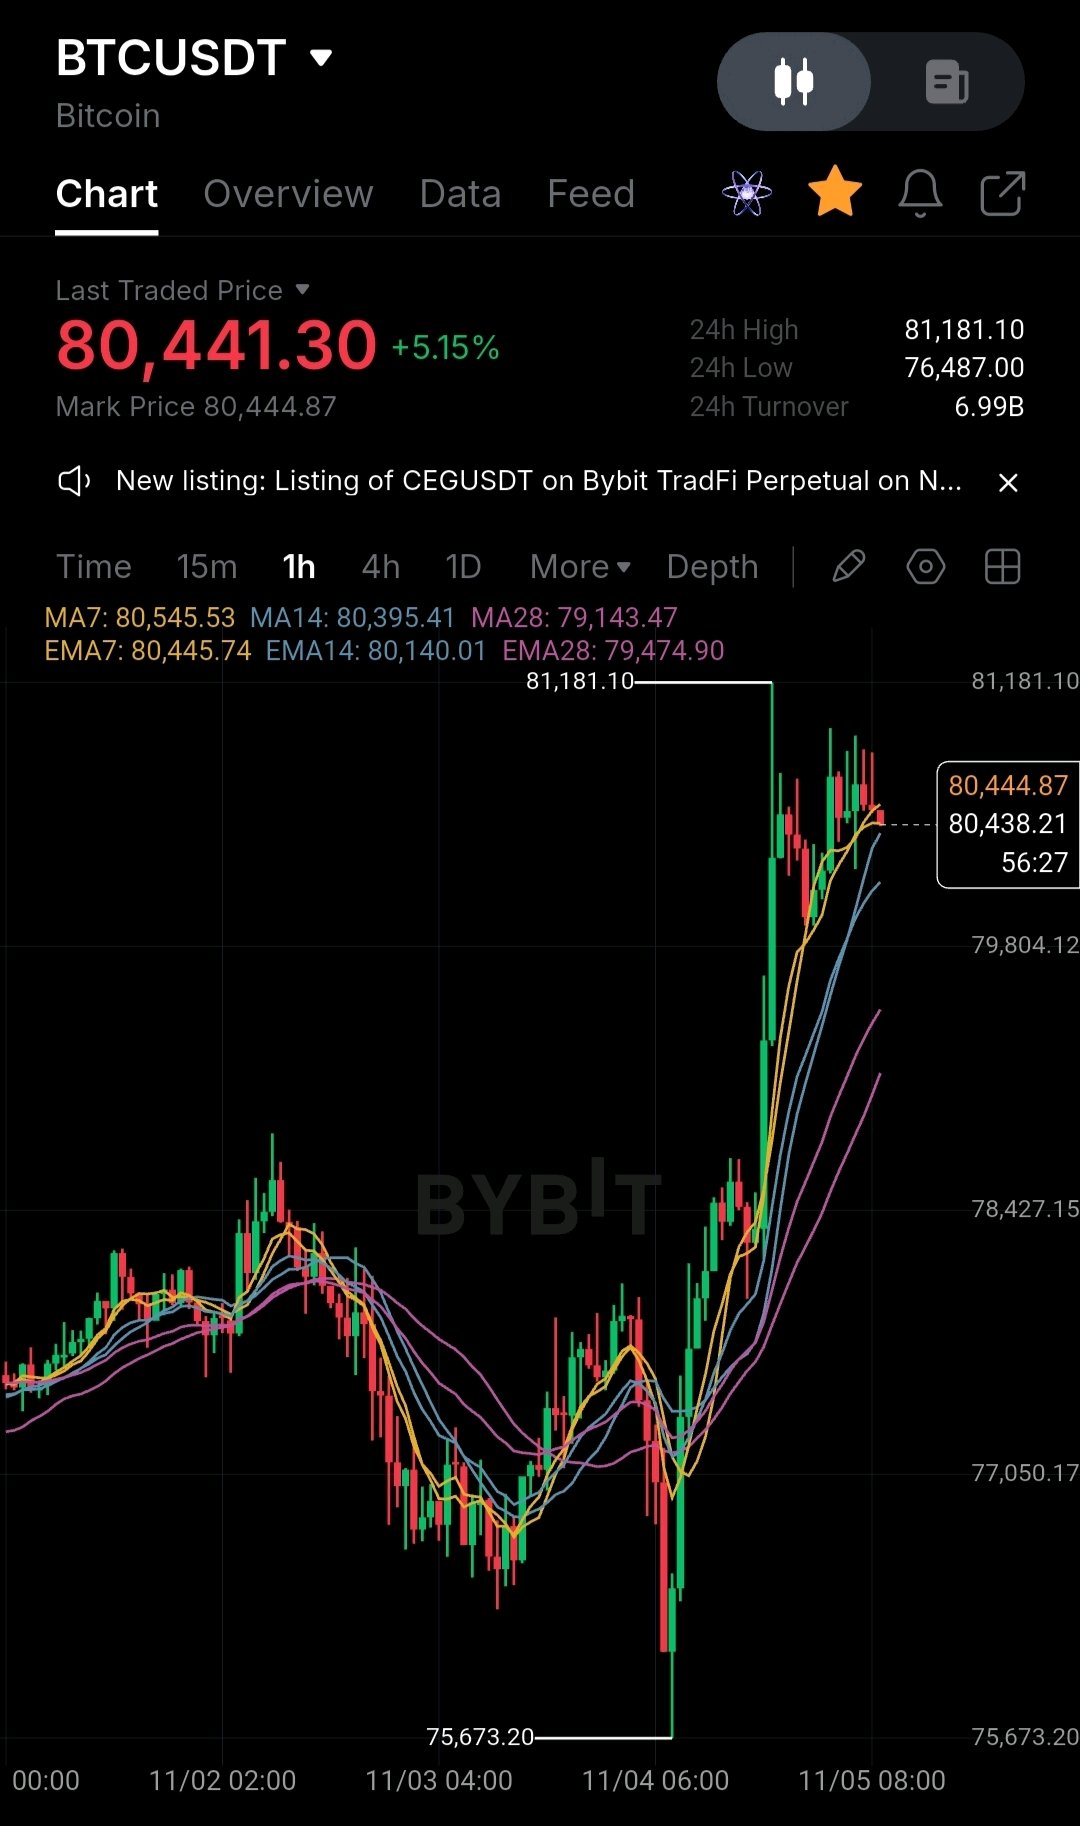
🚀 BTC/USDT Multi-Timeframe Masterclass: Bulls Defend the $80K Milestone! 📈 The crypto market is showing fierce momentum as Bitcoin (BTC) makes a decisive push, currently trading around $80,440 (+5.15% 24h) after testing a 24-hour high of $81,181 and a solid swing low of $76,487 with a robust 24-hour turnover of 6.99B. Let’s dive into a comprehensive multi-timeframe technical breakdown to map out the next major execution zones. 📊 Multi-Timeframe Technical Analysis 1. 1-Hour Chart (Short-Term Momentum & Re-accumulation) Price Action: Following a sharp impulsive recovery from recent local dips, price is consolidating right near the $80,440 level. Moving Average Confluence: The MA7 ($80,545) and EMA7 ($80,445) are acting as immediate dynamic resistance/support pivot zones. Support Cluster: Holding firmly above the MA28 ($79,143) and EMA28 ($79,474) confirms that short-term buyers maintain absolute control of the intraday trend. 2. 4-Hour Chart (Mid-Term Trend Expansion) Price Action: A textbook V-shaped recovery off the $75,673 structural low has propelled BTC back above key moving average bands. Trend Structure: Short-term MAs (MA7 at $79,748, MA14 at $78,438) have completed a bullish upward cross over longer-term bands, signaling continuation strength. Outlook: Sustaining candles above the $80,000 psychological threshold opens up a clean pathway to retest and break the upper daily resistance boundaries. 3. Daily (1D) Chart (Macro Structure & Trend Reclaim) Price Action: The macro trend is stabilizing strongly after bouncing off the major support shelf near the $62.5K–$75K region, now compressing tightly against the MA28 ($80,859) resistance band. Indicator Confluence: MA7 ($78,320) and EMA7 ($79,136) are curving upward, providing a rising structural floor for the broader macro advance. Key Level to Watch: A daily close confirmation above $80,850 – $81,200 will invalidate local overhead resistance and clear the runway for a swift march toward higher price discovery zones. 🎯 Actionable Trading Strategy & Execution Zones Bullish Continuation Entry: Look for a clean retest and hold above $80,200 – $80,450 with volume expansion on the 1H timeframe for a scalp/swing continuation toward $81,800 and $83,000. Pullback / Support Zone: If a minor liquidity sweep occurs, watch the $79,100 – $79,500 region (confluence of daily and 4H moving averages) as a high-probability bounce and re-accumulation zone. Risk Management: Maintain strict invalidation stops below $77,800 to protect capital against sudden volatility spikes. 🔥 What is your target for BTC this week? Are we locking in a new all-time high soon, or expecting a retest of lower liquidity first? Drop your thoughts below! b #WSOT2026 #BitcoinSlidesBelow$80K $BTCUSDT
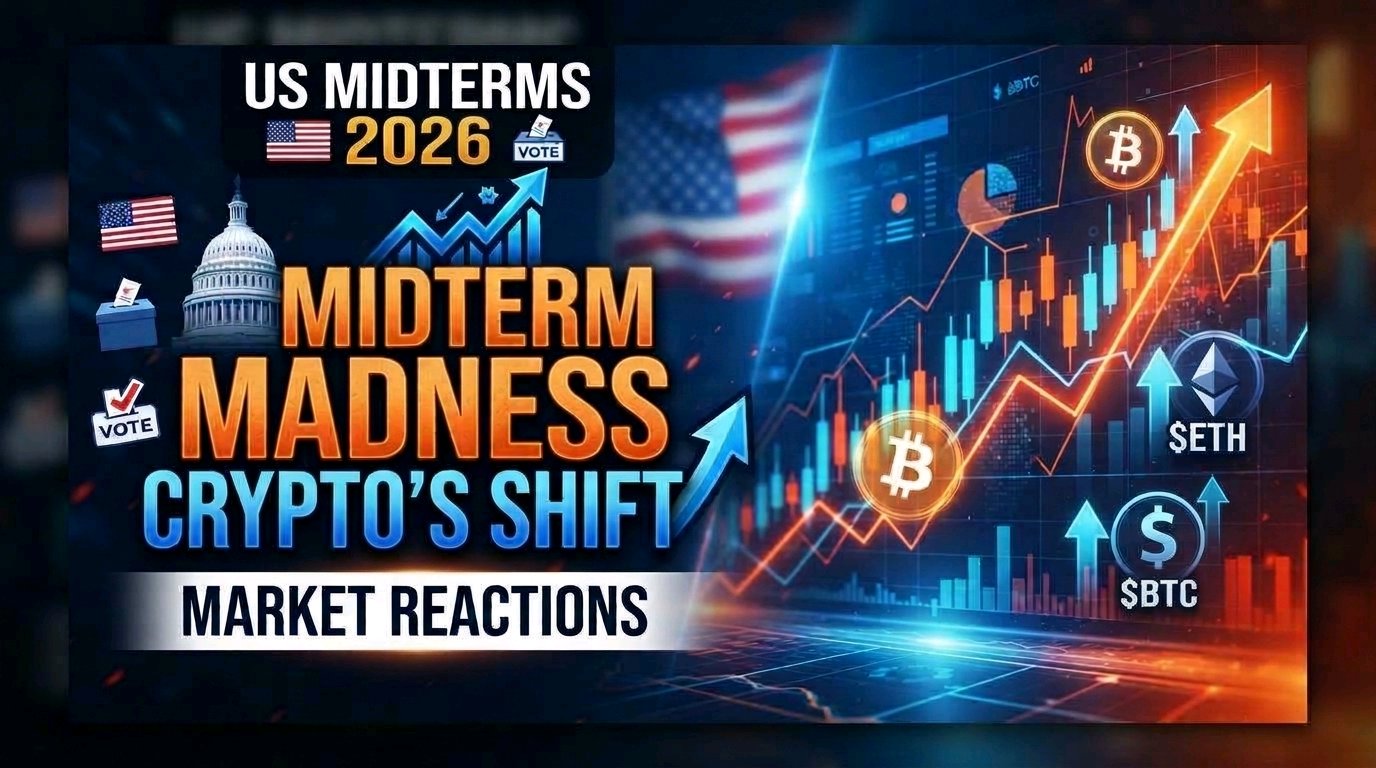
US Midterms & Market Reactions: Which Sectors Will Move First? 🗳️⚡ As the US midterm elections enter their final stretch, political momentum is shifting, and Wall Street and crypto markets are on high alert. A shift in the balance of power in Congress could radically alter the trajectory of fiscal spending, international trade/tariffs, and digital asset regulation. If control of Congress flips, here is how different asset classes and markets are likely to react first: 1. 🪙 Crypto Policy & Digital Assets (The Immediate React) Regulatory Clarity vs. Gridlock: A shift in congressional leadership could fast-track or stall crucial crypto market structure bills (such as stablecoin legislation or market oversight frameworks). Market Reaction: Expect swift volatility in the crypto sector. Decentralized finance (DeFi), layer-1 tokens, and compliant crypto-linked equities tend to react instantaneously to shifts in regulatory sentiment—rallying on expectations of a pro-innovation legislative climate or experiencing short-term pressure if policy uncertainty deepens. 2. 🏛️ Fiscal Policy & Government Spending Gridlock as a Market Stabilizer: If power becomes divided between the legislative and executive branches, large-scale federal spending packages often grind to a halt. Market Reaction: Bond markets and Treasury yields usually react first here. Reduced odds of massive deficit spending can ease pressure on long-term yields, which in turn provides breathing room for growth-oriented sectors like tech and crypto. 3. 🌐 Trade & Tariffs Shifting Trade Dynamics: Changes in congressional committees directly influence trade policy, import/export rules, and tariff enforcement. Market Reaction: Multinational corporations, supply-chain heavyweights, and commodities react rapidly to any anticipated rollbacks or escalations in trade tariffs, impacting sector-specific equities almost immediately. 4. 📈 Traditional Markets: Stocks & Gold Equities: Sectors heavily reliant on government policy—such as traditional energy, green tech, healthcare, and defense—will see immediate re-pricing depending on which party gains influence over key House and Senate committees. Gold & Safe Havens: Macroeconomic uncertainty tied to political shifts frequently drives short-term capital inflows into safe-haven assets like gold as a hedge against policy gridlock or fiscal instability. 💬 What’s Your Take? If control of Congress shifts, which market do you think will react the fastest—crypto, stocks, or forex? Drop your analysis and predictions in the comments below! 👇 #MidtermsMarketWatch $BTCUSDT $XAUTUSDT

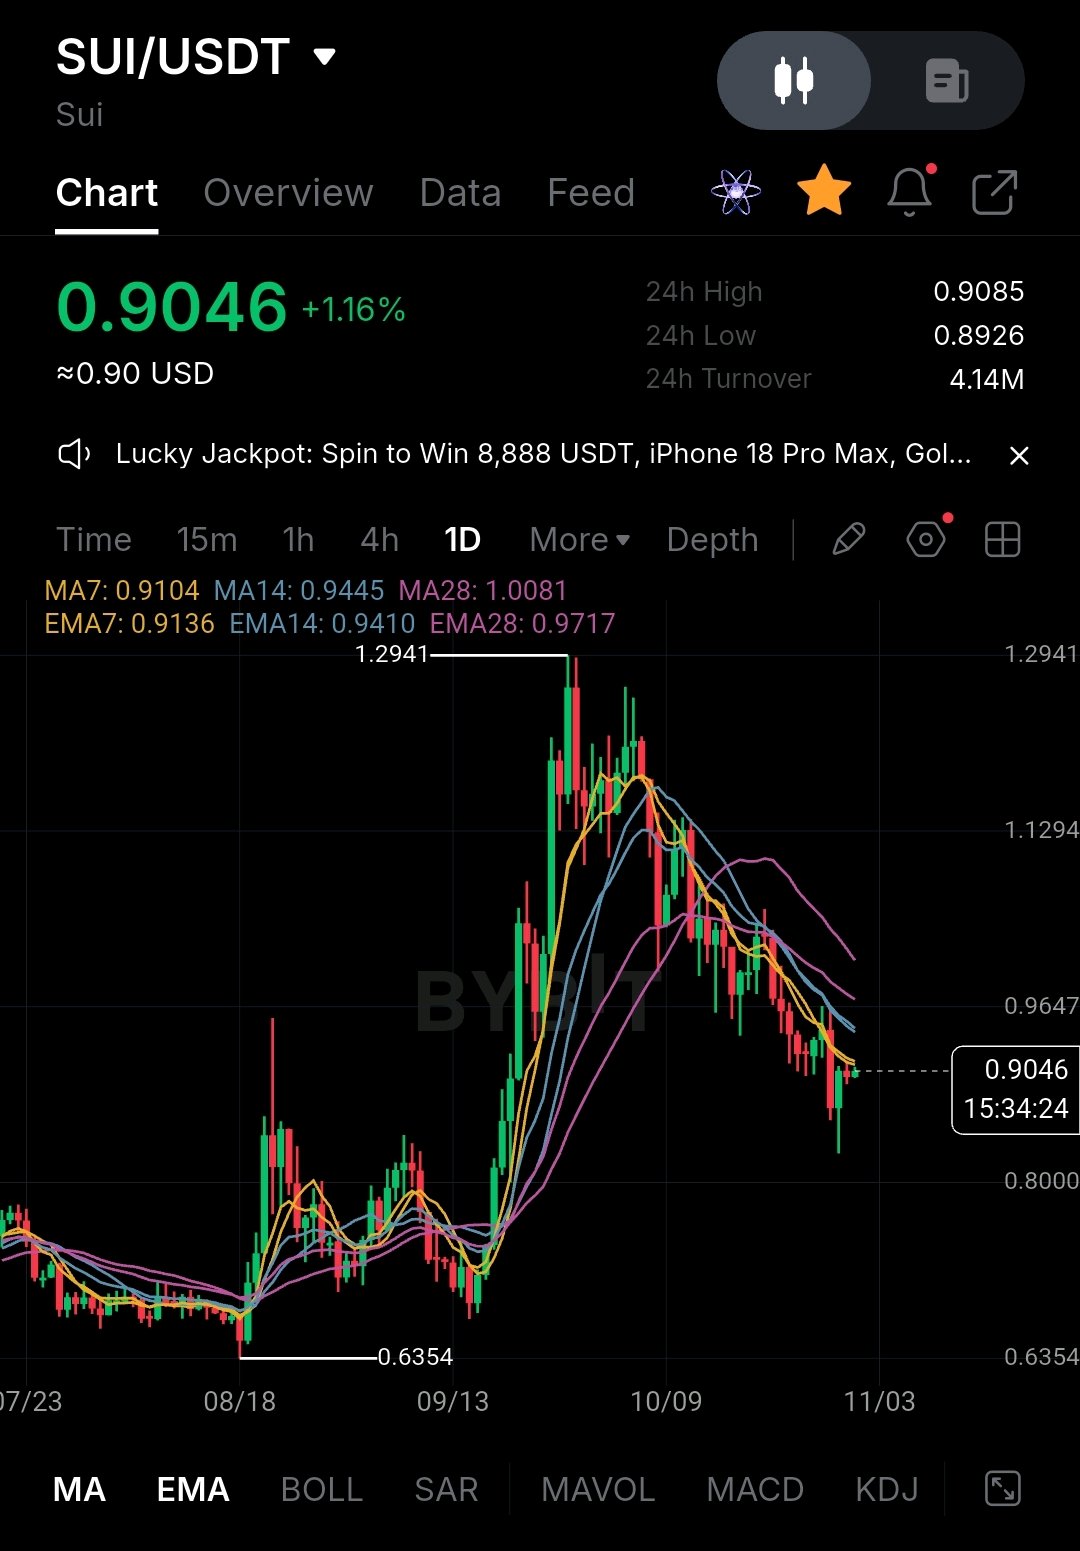
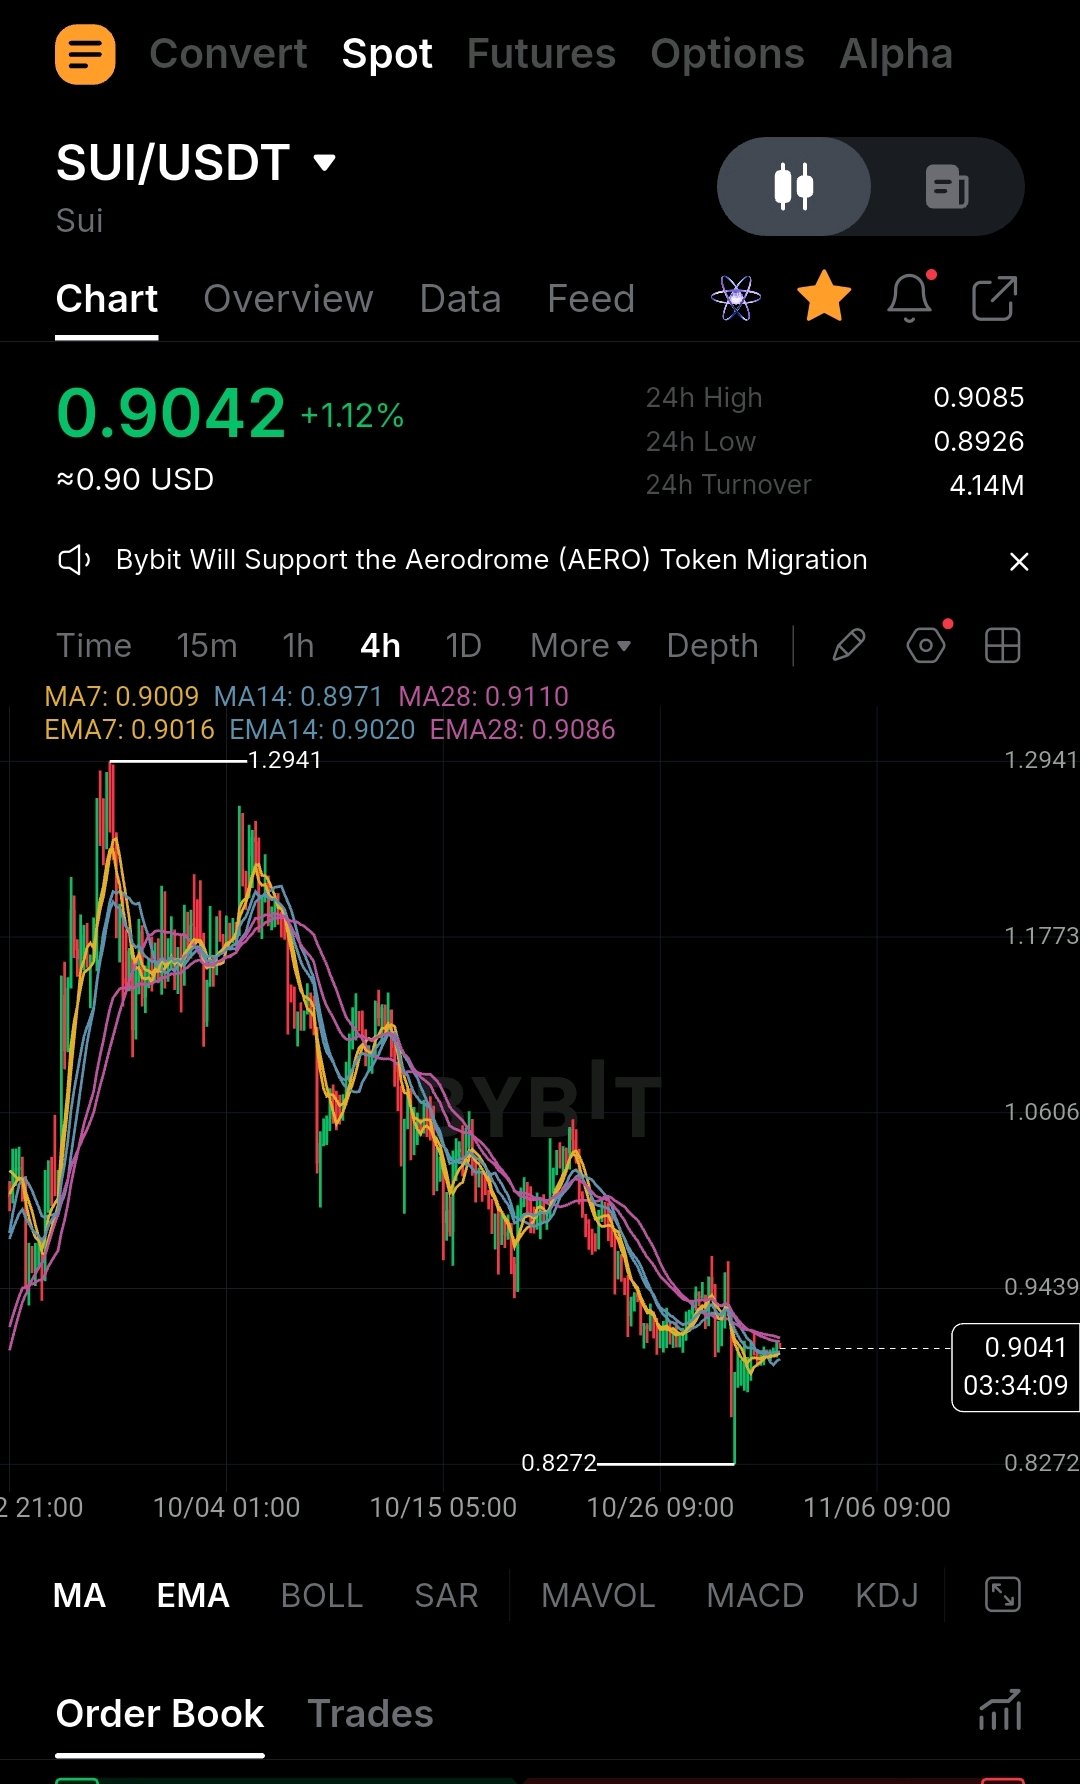
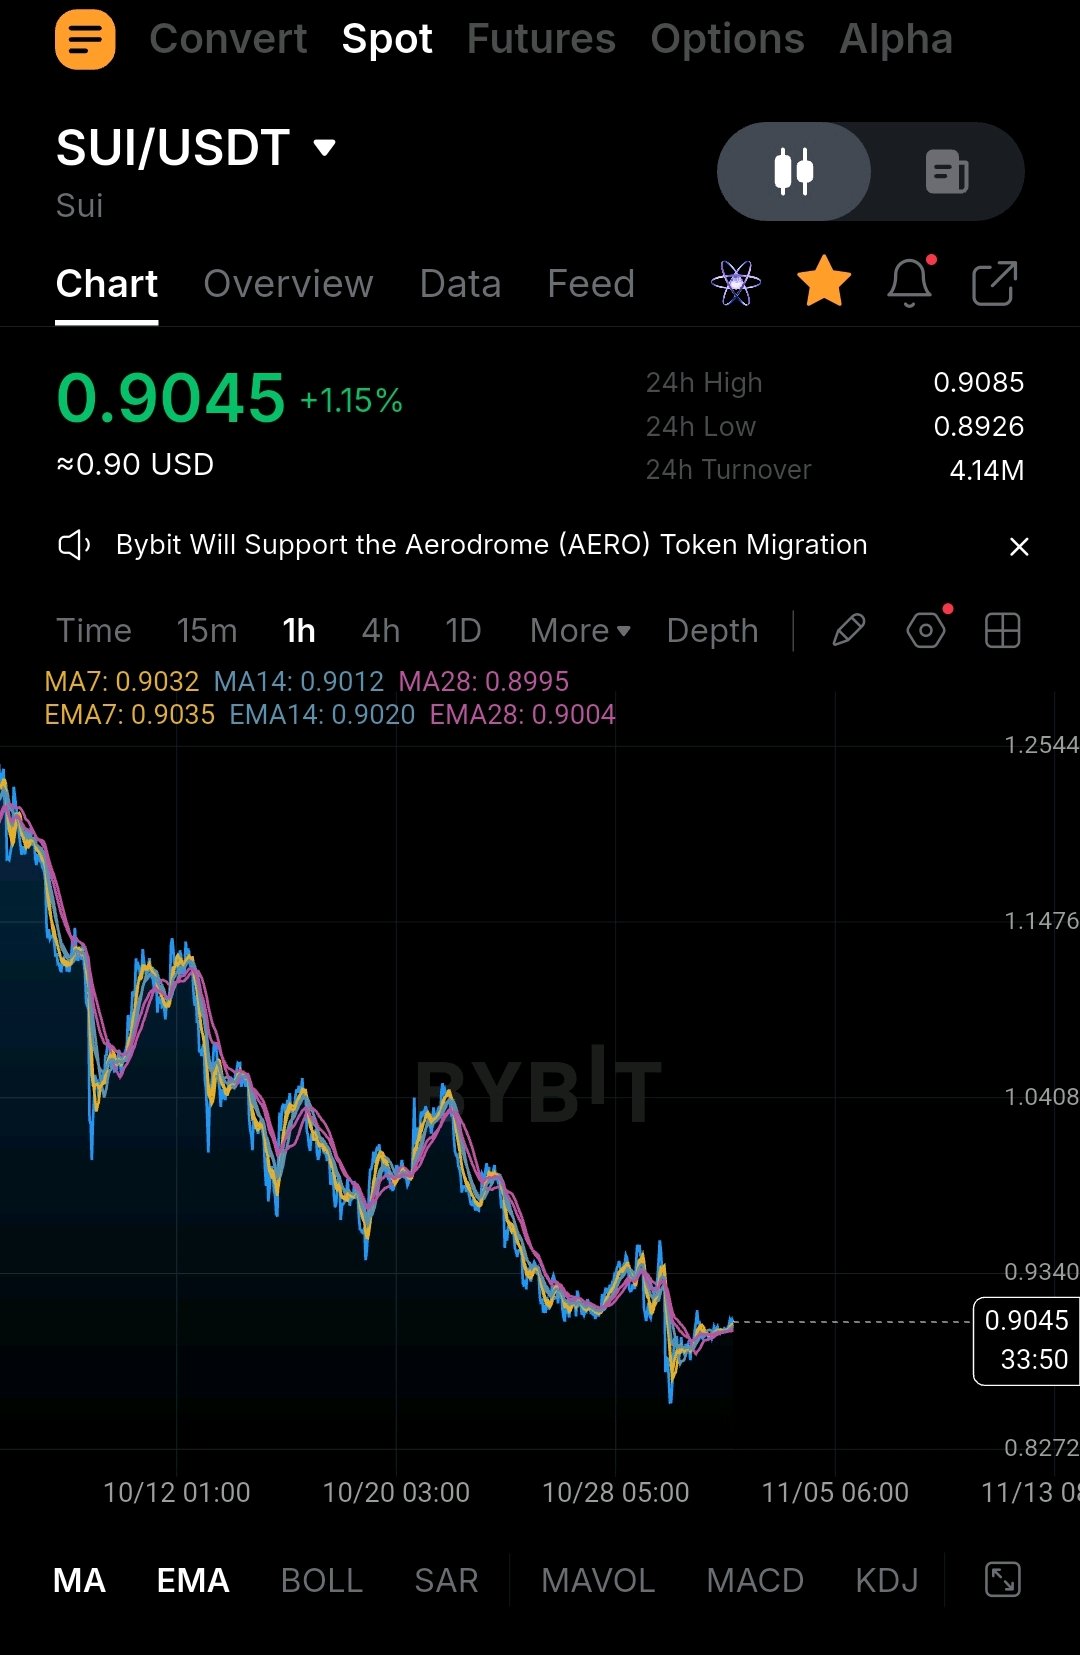
SUI/USDT Multi-Timeframe Technical Breakdown: Testing Critical Support Zones 📊 The broader crypto market is currently experiencing a fascinating phase of consolidation, and SUI is sitting right at a major inflection point. Let’s dive into the multi-timeframe structure to map out the next high-probability moves. 1. Macro Daily (1D) Structure: Cooling Off After Expansion The Trend: Looking at the daily chart, SUI experienced a strong impulsive expansion topping out near the $1.2941 resistance zone before entering a controlled macro correction. Moving Averages: Price is currently trading below the key daily MA lines (MA7 at $0.9104, MA14 at $0.9445, and MA28 at $1.0081), signaling that medium-term momentum has favored the bears over the past few weeks. The Silver Lining: The daily RSI and price action are approaching structural support around the $0.8272 – $0.9000 demand region, where previous accumulation phases sparked major upside rallies. 2. Mid-Range 4H & Intraday 1H Dynamics: Compression & Rebound Attempts Current Price Action: SUI is stabilizing around $0.9045 (+1.15%), showing minor relief bounces after tagging local lows near $0.8926 (24-hour low) within a 24-hour turnover of $4.14M. EMA/MA Convergence: On the 1-hour and 4-hour timeframes, the short-term Moving Averages (MA7/EMA7) are tightly wrapping around the current price ($0.903–$0.905), indicating a squeeze. Expect an explosive volatility expansion once a definitive breakout or breakdown occurs from this tight consolidation channel. Immediate Levels to Watch: Immediate Overhead Resistance: $0.9250 – $0.9400 (confluence of short-term EMAs). Critical Support Floor: $0.8800 – $0.8920. Holding this zone is vital for bulls to prevent a deeper slide toward the $0.8270 multi-week swing low. 💡 Trader's Playbook:Bullish Scenario: Look for a confirmed 4-hour candle close above $0.9250 backed by rising volume to target a retest of the psychological $1.00 psychological barrier and MA28. Bearish Scenario: Loss of the $0.8850 local support could trigger cascading liquidations, opening doors for a sweep down to liquidity pools near $0.8270. What are your targets for SUI this week? Are you accumulating spot here or waiting for confirmation? Let’s discuss below! 👇 DYOR! #WSOT2026 #IMPACTbyTrade $SUIUSDT $SUIUSDC
Backing Excellence: Why Mark’s Team is Built to Dominate WSOT 🏆 When the competition heats up in the World Series of Trading (WSOT), success isn't just about throwing capital at the charts—it demands razor-sharp execution, deep market psychology, and elite leadership. That is precisely why I am fully backing Mark’s Team as my premier pick for this campaign. Here is a breakdown of why this squad has the winning edge: 📊 What Defines Their Trading DNA & Best Assets? Mark’s Team operates on a foundation of disciplined technical analysis and rigorous risk management. Rather than chasing random pumps, the squad specializes in high-conviction perpetual contract setups across major liquid pairs ($BTC,$ETH). Their trading DNA merges multi-timeframe trend analysis with strict invalidation levels, capturing clean directional momentum while protecting capital during choppy market phases. 🧠 What Makes Captain Mark Stand Out? A great captain doesn't just trade well; they guide an entire community through high-pressure volatility. Captain Mark stands out because of his exceptional macro composure, transparent trade setups, and ability to read whale distribution and order-book depth in real-time. His tactical foresight sets a masterclass standard for the entire roster, keeping members aligned with high-probability market turns. 🚀 Why Do I Believe They Can Win? With over 222 focused traders united under the banner of "Trade World", Mark’s Team possesses a rare blend of collective synergy and competitive hunger. In a tournament where endurance and consistency separate the winners from the pack, this squad’s unified structure and relentless drive give them a massive mathematical and psychological advantage on the leaderboard. Ready to see how elite execution wins championships? Check out the squad and join the movement here: 👉 https://i.bybit.com/1J8xabuj?share_to=link #WSOTPicktoEarn10U $BTCUSDT $XAUTUSDT


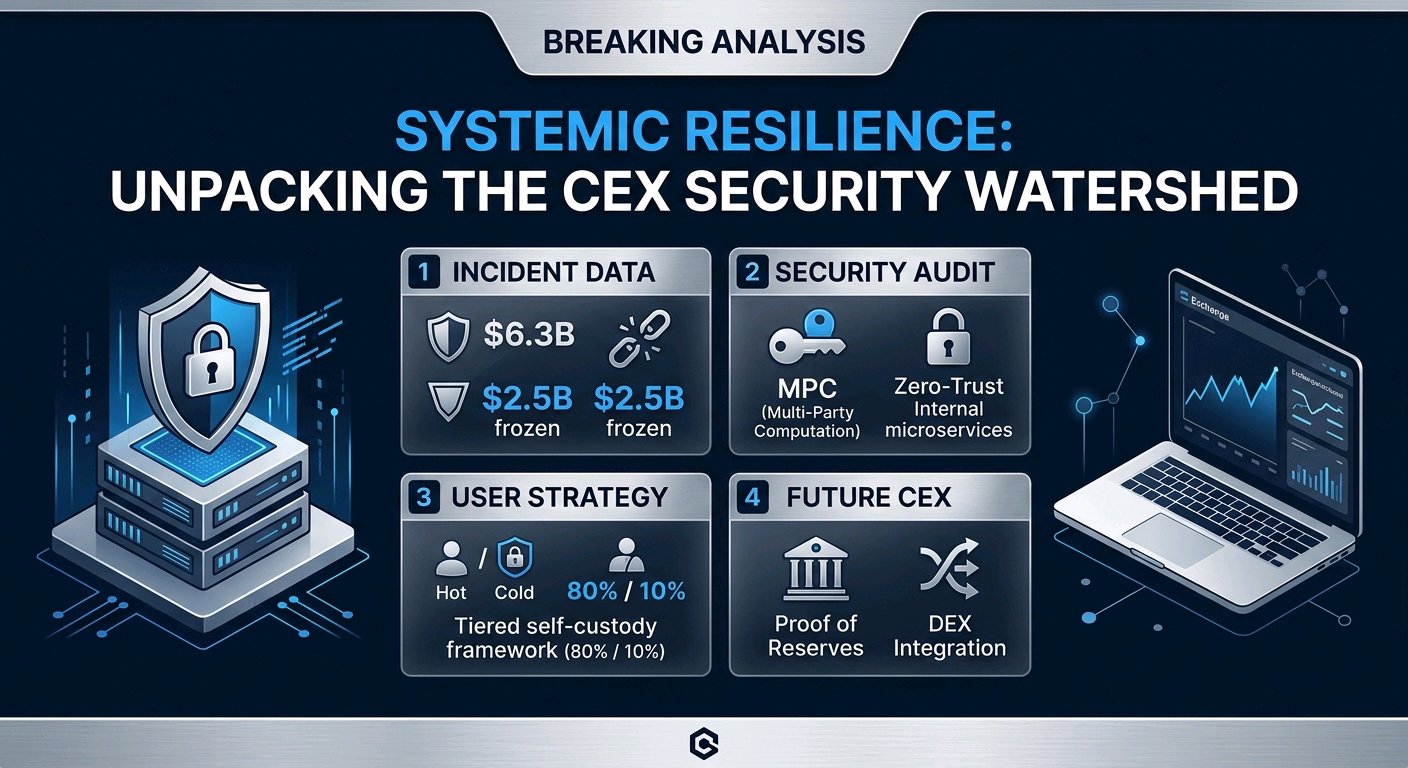
🚨 Breaking Down the $6.3B Binance Incident: Systemic Security Lessons & Market Resilience The crypto market faced a major security event following a $6.3 billion breach on Binance. As traders and builders, analyzing the underlying mechanics, institutional risk mitigation, and long-term implications for Centralized Exchanges (CEXs) is critical for navigating market volatility. (Al Jazeera) $6.3B Binance Security Incident – Breakdown (Text Format)Official Figures Total Impact: ~$6.3 Billion (Binance estimate) On-chain Estimate: ~$6.36 Billion (TRM Labs) Frozen so far: ~$2.7B – $3 Billion Still mobile / unfrozen: ~$3.3 Billion+Binance will cover all losses via SAFU + company funds. User funds are safe. Breakdown by BlockchainEthereum: ~$3.79 Billion • 200,630 ETH + 185 other tokens • Includes ~1.875B USDT, 823M USDC, 88.5M RLUSDBitcoin: ~$1.47 Billion • 18,270 BTCTron: ~$628 Million • 612.7M USDT + 46.4M TRXXRP Ledger: ~$296 Million • 233.46M XRPSolana: ~$96 Million • 970,500 SOLArbitrum / Optimism / Base: ~$39 Million • Includes 74.6M ARBAvalanche: ~$28 MillionPolygon: ~$10 Million Major Asset Categories Stablecoins: USDT, USDC, RLUSD, USD1 (largest portion) ETH & derivatives: ~200k+ ETH + wBETH Bitcoin: 18,270 BTC Altcoins: UNI, ENA, PEPE, LINK, AAVE, ARB, SOL, XRP + 150+ smaller tokens 1. Key Facts & Operational Breakdown Total Assets Impacted: Approximately $6.3 billion. (Al Jazeera) Immediate Mitigation: Binance halted deposits and withdrawals while successfully freezing over $2.5 billion in transit. (Al Jazeera) User Protection Mechanism: Coverage pledged via the Secure Asset Fund for Users (SAFU) and internal treasury reserves to offset user losses. Ynetnews 2. Security Analysis: CEX Vulnerabilities & Best Practices Attack Vectors: Exploitation of cross-chain bridges and hot-wallet key management infrastructures remains the primary target for sophisticated threat actors. Cold vs. Hot Wallet Distribution: Highlights the necessity for exchanges to enforce stricter threshold signatures (MPC) and reduced hot-wallet exposure ratios. Institutional Real-Time Monitoring: Fast freezing responses demonstrate the increasing role of cross-platform chain-analysis and exchange cooperation in neutralizing exploiters mid-flight. 3. Strategic Advice for Traders Self-Custody Balance: Maintain operational trading funds on secure, compliant exchanges while holding long-term reserves in cold storage or hardware wallets. Risk Diversification: Spread spot exposure across top-tier CEX platforms with proven Proof-of-Reserves (PoR). Automate Risk Limits: Utilize stop-loss orders and monitor liquidity depth during high-volatility news windows to prevent slippage. 4. Long-Term Market Sentiment While short-term market sentiment experiences natural sell-pressure, structural responses—such as real-time multi-exchange asset freezes—demonstrate the maturing security infrastructure across major CEX environments. Current Market Stance: ⚖️ Cautious Neutral / Risk-Managed What are your thoughts on exchange security and hot-wallet mitigation strategies? Drop your perspective in the comments below! 👇 🚨 $6.3B Binance Security Incident – Educational Breakdown This post is for educational purposes only. Always DYOR. Market conditions can change rapidly. Not financial advice. $BTCUSDT $ETHUSDT

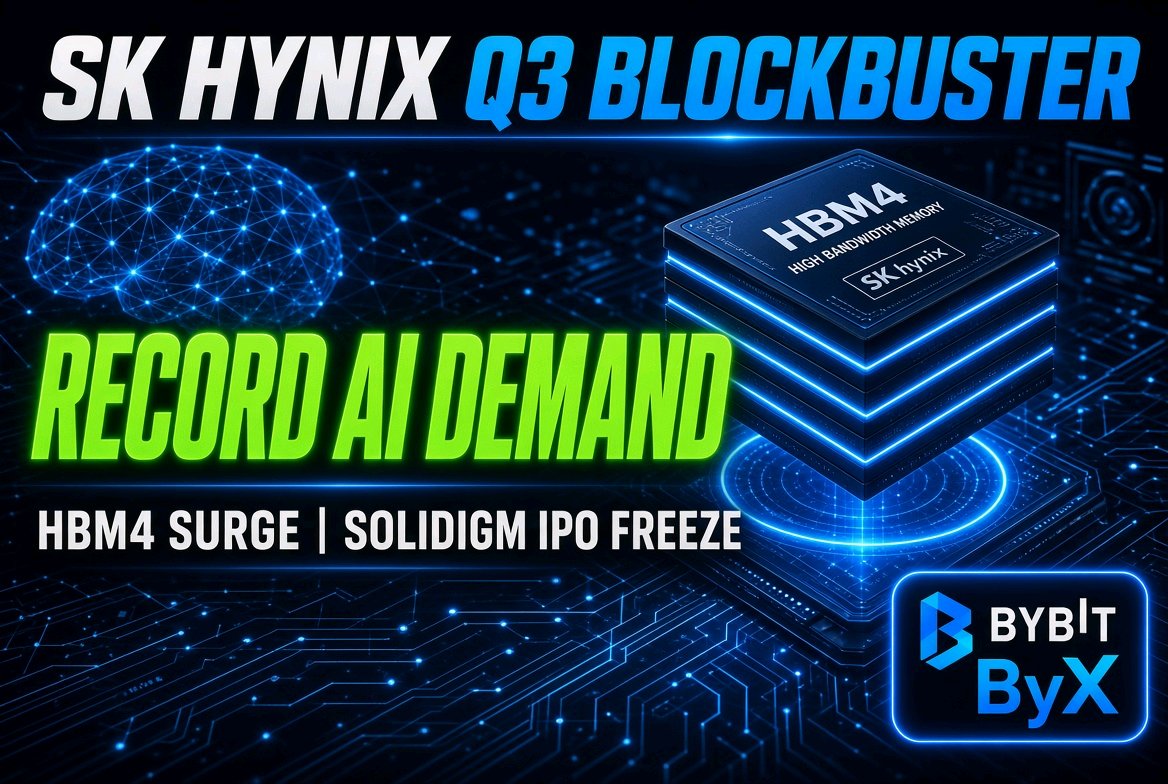
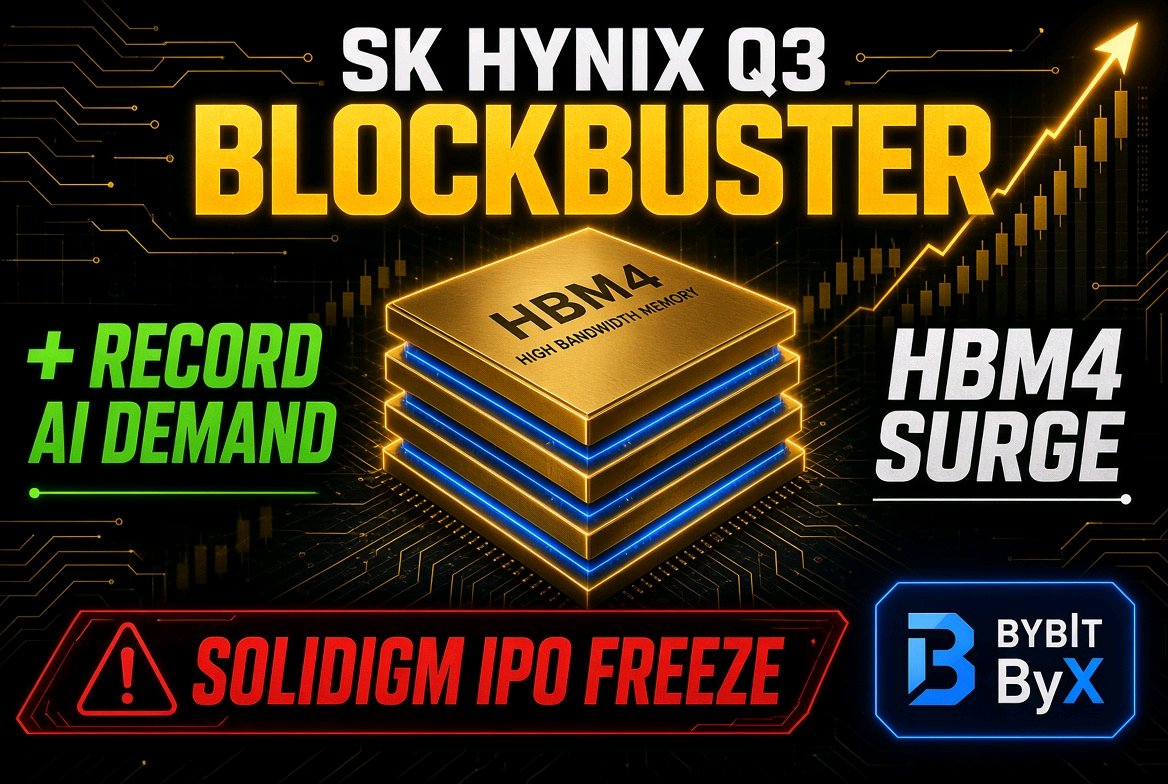
SK Hynix Q3 Blockbuster: Record AI Demand Meets Strategic Restructuring SK Hynix has delivered an extraordinary third-quarter performance, driven by hyper-scaling AI workloads and unprecedented demand for advanced memory infrastructure. However, amid record-shattering figures, a major strategic pivot has caught the market's attention. Key Financial & Operational Highlights Revenue: KRW 104.62T Operating Profit: KRW 83.33T Primary Growth Catalyst: Explosive adoption of HBM4 shipments and surging enterprise-grade AI memory demand. The Strategic Twist: Solidigm IPO Freeze Despite the stellar core numbers, SK Hynix has officially halted its review of pre-financing and a potential US public listing for its subsidiary, Solidigm, previously valued at approximately $10B. Why the contrast? While traditional memory and AI-adjacent semiconductor divisions are printing historic margins, management appears to be re-evaluating capital allocation, subsidiary valuations, and macro liquidity conditions before spinning off major assets in overseas markets. What’s Your Play? How are you positioning your portfolio around these macroeconomic tech shifts? Accumulate on Pullbacks: Buying into market-leading semiconductor infrastructure plays. Hold Steady: Waiting for clearer macro direction before scaling exposure. Lock In Gains: Trimming positions following record earnings beats. Drop your macro outlook and trading strategy in the comments below! 👇 #SKHynixEarningsBeat
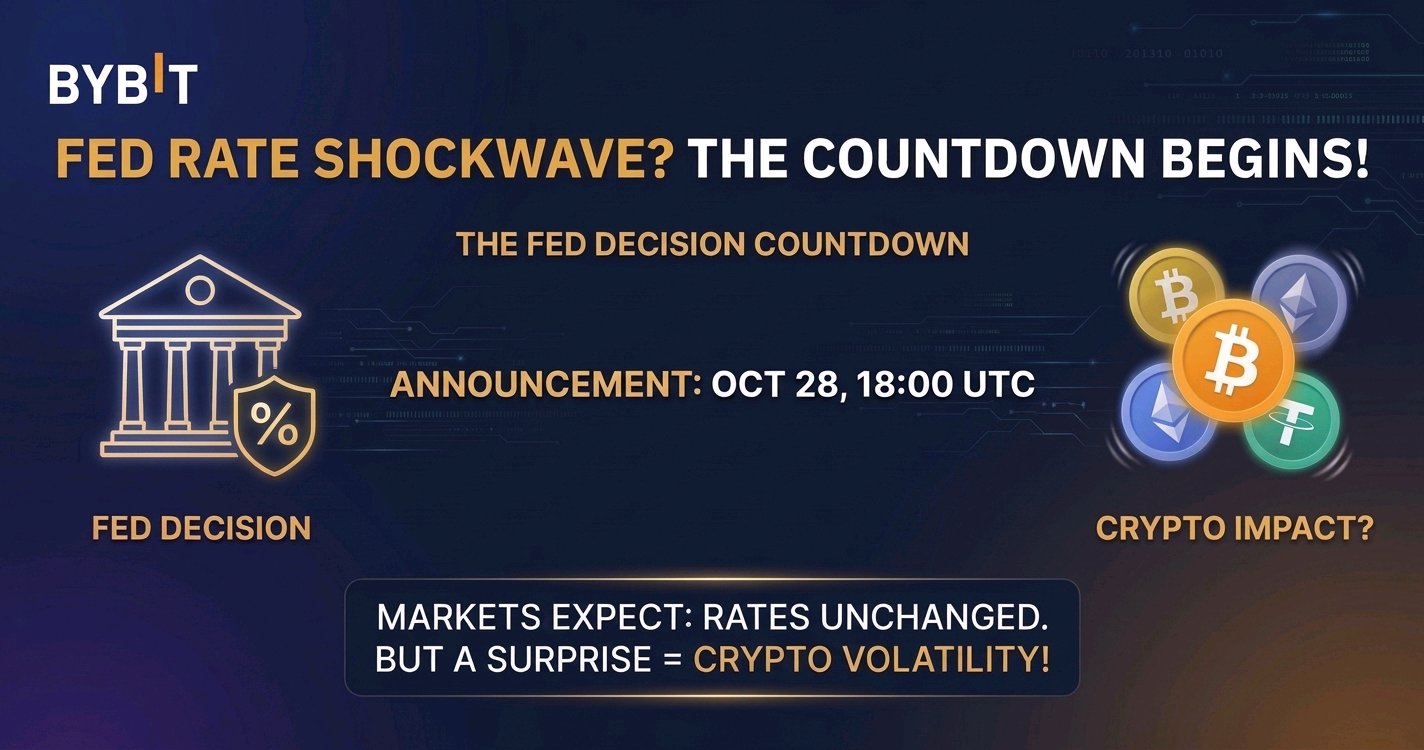
🚨 Macro Update: The Fed Decision Countdown & Crypto Impact Analysis The macro clock is ticking. Today at 18:00 PM UTC on October 28, the U.S. Federal Reserve will announce its latest interest rate decision. Current market consensus heavily leans toward rates remaining unchanged, but as seasoned traders know, the real volatility often lies in the fine print of the accompanying statement and Powell's forward guidance. Could this decision shake up the crypto markets? Let’s break down the technical and sentiment angles. 📊 Key Factors to Watch The Rate Pause vs. Pricing: While an unchanged rate is largely priced in, any subtle shifts in tone regarding future easing or quantitative tightening can trigger immediate algorithmic reactions across Bitcoin ($BTC), Ethereum ($ETH), and major altcoins. Liquidity Flows & Risk-On Assets: Macro liquidity is the lifeblood of crypto cycles. A hawkish surprise could trigger a sharp flush and long liquidations, whereas a dovish tilt might fuel fresh capital inflows into spot and perpetual markets. Derivatives Positioning: Funding rates and open interest across major exchanges are currently flashing high alertness. Expect high-leverage shakeouts around the release window—risk management is paramount. 💡 Trading & Strategy Outlook Guard Your Margins: Avoid over-leveraging into the 18:00 UTC window. Whipsaws in both directions are common as market makers hunt liquidity pools. Watch Key Levels: Monitor immediate support and resistance bands on major pairs rather than reacting blindly to initial headline spikes. Let the market establish a clear trend confirmation. Spot Accumulation: Volatility-induced dips often present strategic accumulation zones for high-conviction assets if broader macro trends remain intact. How are you positioning your portfolio for today’s Fed announcement? Are you locking in profits or waiting for the dip? Let's discuss in the comments below! 👇 #FOMCRateDecision #MidtermsMarketWatch $BTCUSDT $XAUTUSDT
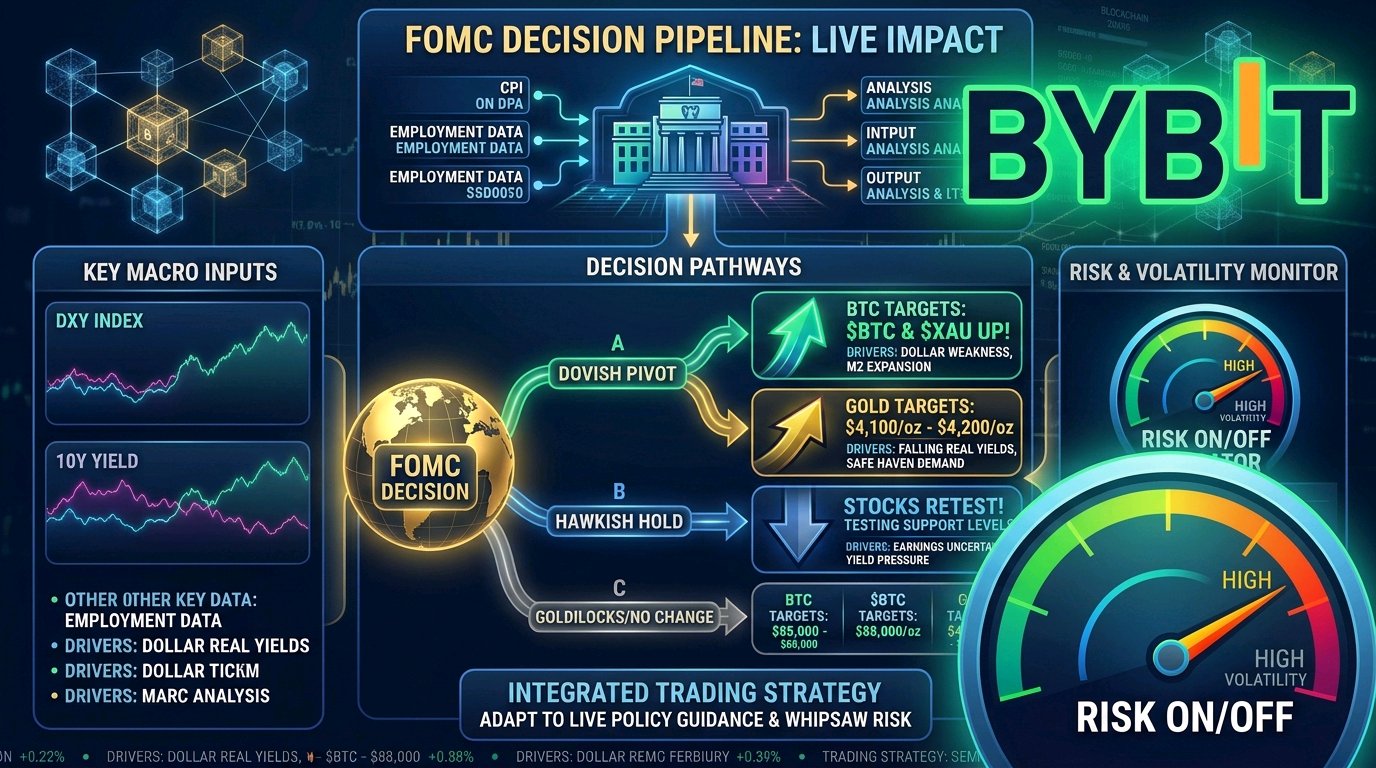
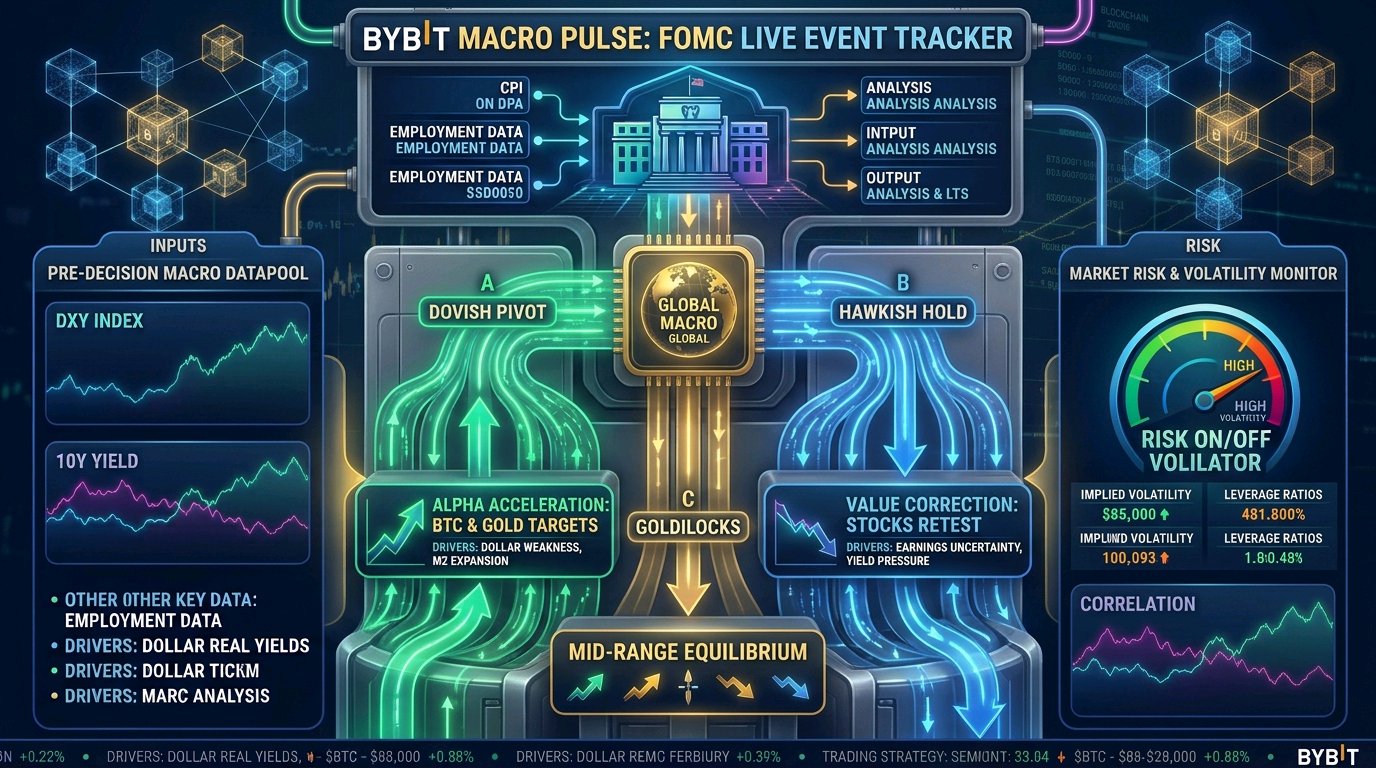
KeyMacroWeekAhead | FOMC Countdown: How Rate Path & Policy Guidance Could Shift BTC, Equities & Gold As the Federal Open Market Committee (FOMC) rate decision approaches, global markets are at a critical macro junction. With high bond yields exerting pressure on risk assets and precious metals alike, investors are closely scrutinizing whether the Fed will signal a dovish easing cycle or maintain a hawkish stance to curb inflation risks. Here is an analysis of how tomorrow’s rate decision and Chairman Jerome Powell’s policy guidance could impact Bitcoin ($BTC), U.S. Stocks, and Gold ($XAU). 📊 Macro Backdrop: Pre-FOMC Asset Positioning Bitcoin ($BTC): Trading near $80,000–$81,700, experiencing short-term volatility as leveraged positions deleverage ahead of the rate announcement. Gold ($XAU): Stabilization around $4,010/oz following recent pullbacks, sensitive to shifts in the U.S. Dollar Index (DXY ~101.6) and real yields. U.S. Equities (S&P 500 / Nasdaq): Consolidation near key technical levels, awaiting clear guidance on the terminal interest rate and economic growth outlook. 🔍 Scenario Analysis & Market Reaction Matrix Scenario 1: Dovish Pivot / Aggressive Rate-Cut Guidance (Fed delivers a rate cut or explicitly signals an accelerated easing path in upcoming quarters) 🟠 Bitcoin ($BTC): High Bullish Volatility Mechanics: Lower interest rates weaken the USD and reduce cash/bond yield attractiveness, expanding global M2 liquidity. Price Projection: A dovish outcome could ignite a rapid relief rally toward $85,000–$88,000, with altcoins outperforming as risk appetite returns. 🟢 U.S. Stocks: Upward Expansion Mechanics: Lower discount rates boost equity valuations, particularly growth and tech sectors. Price Projection: S&P 500 gains momentum to push toward previous resistance levels, lifting broader equity indices. 🟡 Gold ($XAU): Direct Structural Upside Mechanics: Falling U.S. Treasury yields and a weaker dollar significantly decrease the opportunity cost of holding non-yielding precious metals. Price Projection: Gold could retest high resistance levels above $4,100/oz. Scenario 2: Hawkish Hold / Higher-for-Longer Guidance (Rates held steady with cautious commentary emphasizing persistent inflation or resilient yields) 🟠 Bitcoin ($BTC): Downside Liquidity Test Mechanics: Prolonged tight liquidity and firm 10-year Treasury yields (~4.97%) reduce demand for speculative risk assets. Price Projection: Increased risk of testing major support around $75,000–$78,000 as short-term traders deleverage. 🟢 U.S. Stocks: Moderate Pullback Mechanics: Higher borrowing costs weigh on corporate earnings expectations and valuations. Price Projection: Equity markets could undergo a 2%–4% short-term correction, testing key exponential moving averages. 🟡 Gold ($XAU): Short-Term Pressure Mechanics: Firm real yields drive capital back into high-yielding U.S. debt instruments. Price Projection: Potential pullbacks toward the $3,920–$3,950/oz range before finding longer-term structural support. 📈 Summary Comparison Asset Dovish Outcome (Rate Cut / Easy Guidance) Hawkish Outcome (Hold / Tight Guidance) Key Technical Levels Bitcoin ($BTC) 🚀 Strong Bullish Rally 📉 Retest Support Support: $75,000 | Resistance: $85,000 U.S. Equities 📈 Valuation Expansion 📉 Short-term Correction S&P 500 Watch Range: 7,100 – 8,000 Gold ($XAU) 🚀 Sharp Upside 📉 Yield-Driven Drag Support: $3,920 | Resistance: $4,100 💡 Key Risk Management Takeaways for Traders Watch the Dot Plot & Statement Wording: The rate decision itself is only half the story; Powell’s press conference and guidance on inflation targets will drive the secondary market wave. Beware of Whipsaw Volatility: Derivatives funding rates and futures open interest indicate significant leverage in $BTC contracts. Expect sudden spikes in both directions surrounding the release. Cross-Asset Correlation: Track the U.S. Dollar Index (DXY) and 10-Year Treasury Yields. Sustained drops in yields serve as the primary green light for risk assets and gold. Disclaimer: This analysis is for educational and market tracking purposes only and does not constitute financial advice. Always perform your own research and manage risk responsibly. 💬 Community Discussion: How is your portfolio positioned ahead of this FOMC decision? Are you expecting a dovish push toward $85K for $BTC, or are you hedging for a hawkish pause? Let us know your trades and targets in the comments below! #FOMCRateDecision #IMPACTbyTrade $BTCUSDT $XAUTUSDT
BTC Market Update: The Battle for the $80K
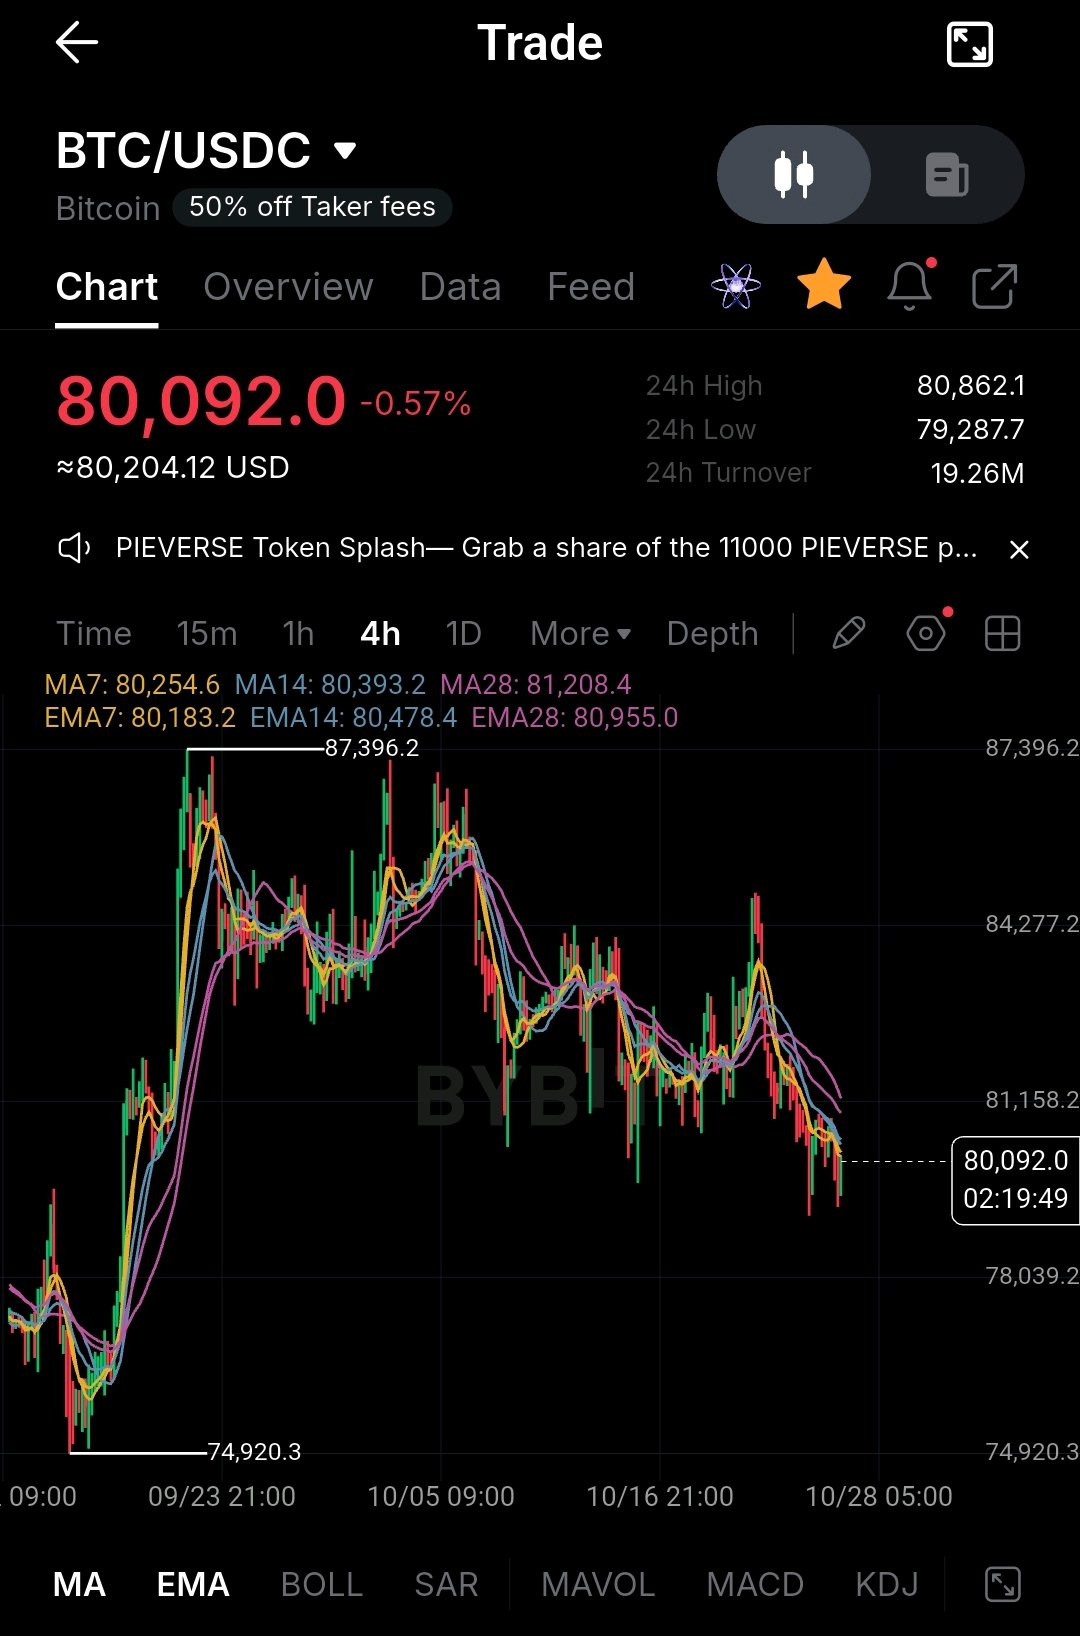
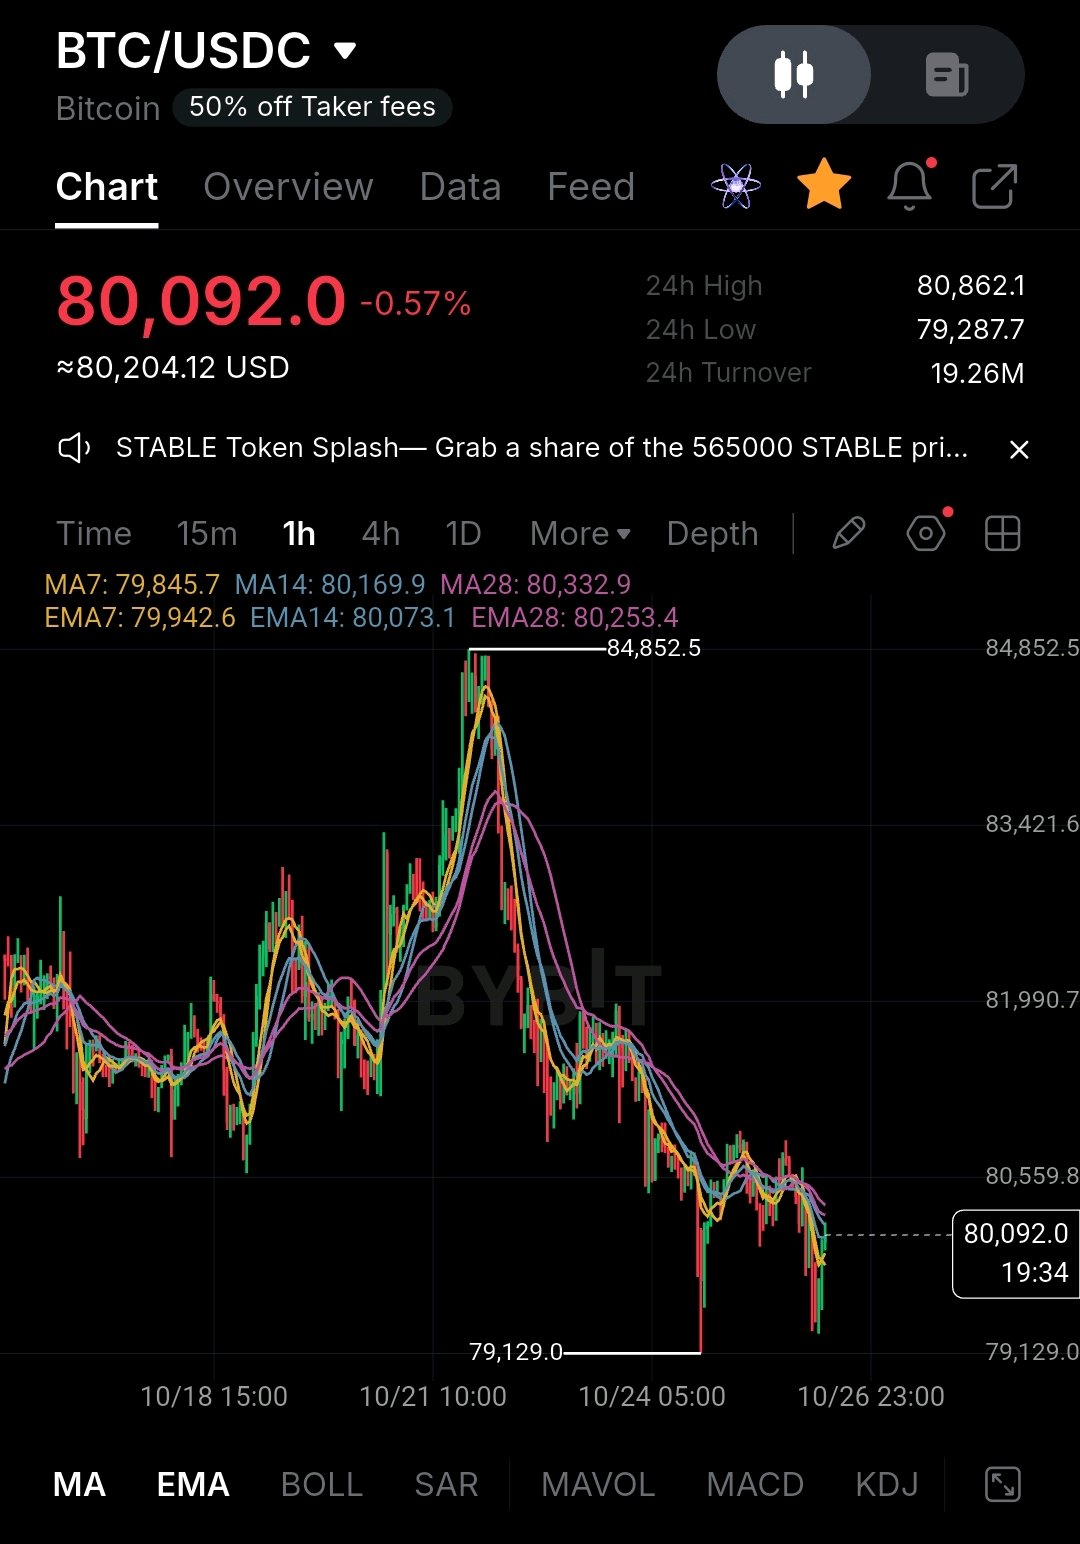
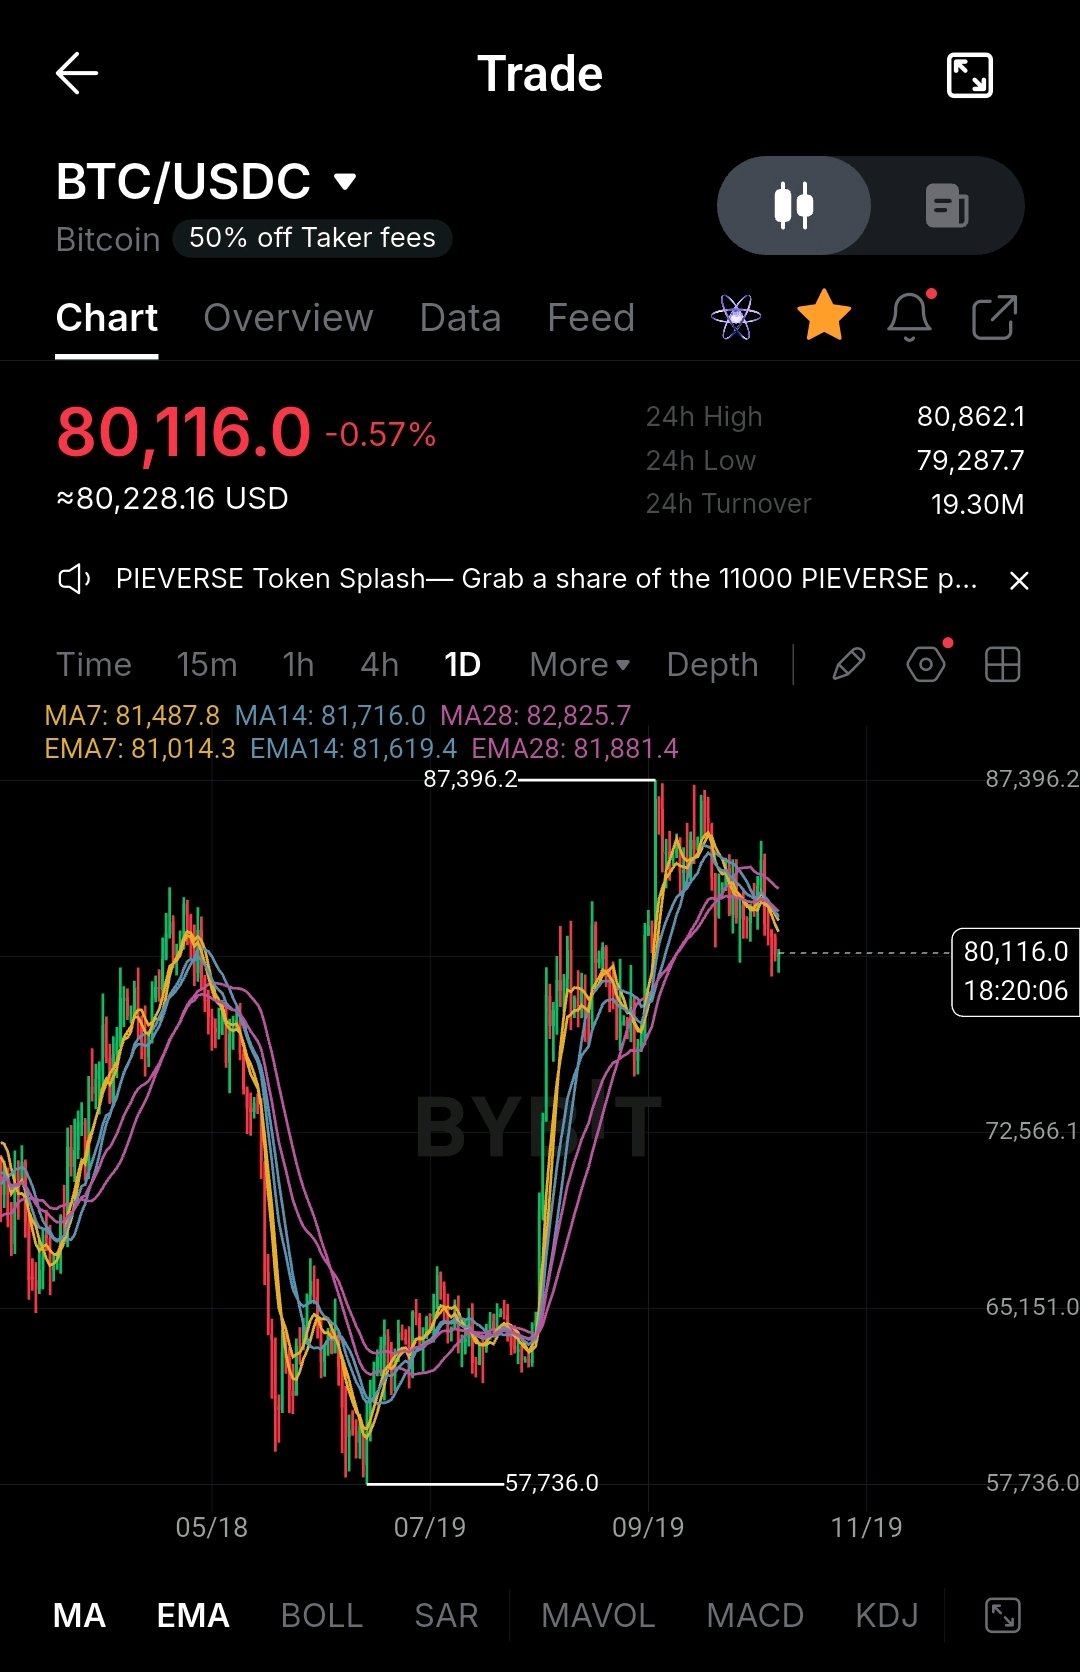
🚀 BTC Market Update: The Battle for the $80K Psychological & Technical Fortress Bitcoin ($BTC) is currently locked in a high-stakes battle around the critical $80,000 threshold. As traders weigh short-term momentum against macro trends, all eyes are on whether the bulls can successfully defend and reclaim this pivotal zone. 📊 Current Market Snapshot Current Price: ~$80,100 (hovering near the crucial pivot line) 24H Range: $79,287.7 – $80,862.1 JPG Market Sentiment: Cautiously optimistic with heightened volatility across 1H, 4H, and 1D timeframes. 🔍 Technical Breakdown Support & Resistance: Immediate downside support is firmly established near the $79,200 – $79,300 zone (tested successfully in recent 24-hour sessions). JPG Overhead resistance sits stubbornly in the $81,000 – $84,850 region, where moving averages (MA/EMA clusters) are converging. Indicator Confluence: On the lower timeframes (1H/4H), moving averages are tightening, signaling an impending breakout or breakdown. A decisive 4-hour candle close above the short-term EMA clusters will be vital for confirming structural continuation. ⚖️ Bullish vs. Bearish Scenarios The Bullish Case (Reclamation & Rally): If buyers manage to flip $80,500 into solid support with rising volume, expect a swift retest of the $82,500 – $84,000 resistance band. The Bearish Case (Correction Risk): Failure to hold the $79,000 floor could invite deeper profit-taking, opening the door for a retest of lower liquidity pools down toward the mid-$77,000s. 💡 Key Takeaway: The $80K level isn't just a number—it’s a psychological battleground for market dominance. Risk management is paramount in this tight consolidation range. 💬 What's your play? Are you longing the dip at $80K or waiting for a confirmed breakout above resistance? Let’s discuss in the comments below! #BTC #CryptoTrading #Bybit #MyByXTake #TechnicalAnalysis #CryptoMarket $BTCUSDT