Samii
3901Like ပေးရန်0ရှယ်ယာများ66ဖန်များ9Follow လုပ်ရန်
I'm Crypto Content Creator | Trader 📊 Sharing charts, market insights & my trading journey. Real observations. Simple analysis. DYOR.
I'm Crypto Content Creator | Trader 📊 Sharing charts, market insights & my trading journey. Real observations. Simple analysis. DYOR.
Hello Bybit Team, I am one of the top BYX creators, and honestly, I feel really disappointed and heartbroken today. Almost everyone received a reward or a special gift, but unfortunately, I received nothing. I have put in countless hours of hard work, dedication, and effort, day and night, to contribute to this platform. Despite all my efforts, I feel completely overlooked and unappreciated. I ranked 13th overall, and even among the newcomers, I secured 1st place. I genuinely believe my hard work deserved some recognition. I'm not asking for anything unfair. I just want my efforts to be acknowledged and treated fairly. It's really discouraging when you give your best and still feel forgotten. I sincerely hope you will review my performance and consider my contribution. ❤️ #ByXIMPACT @BybitX @WeseR009 @MASAB

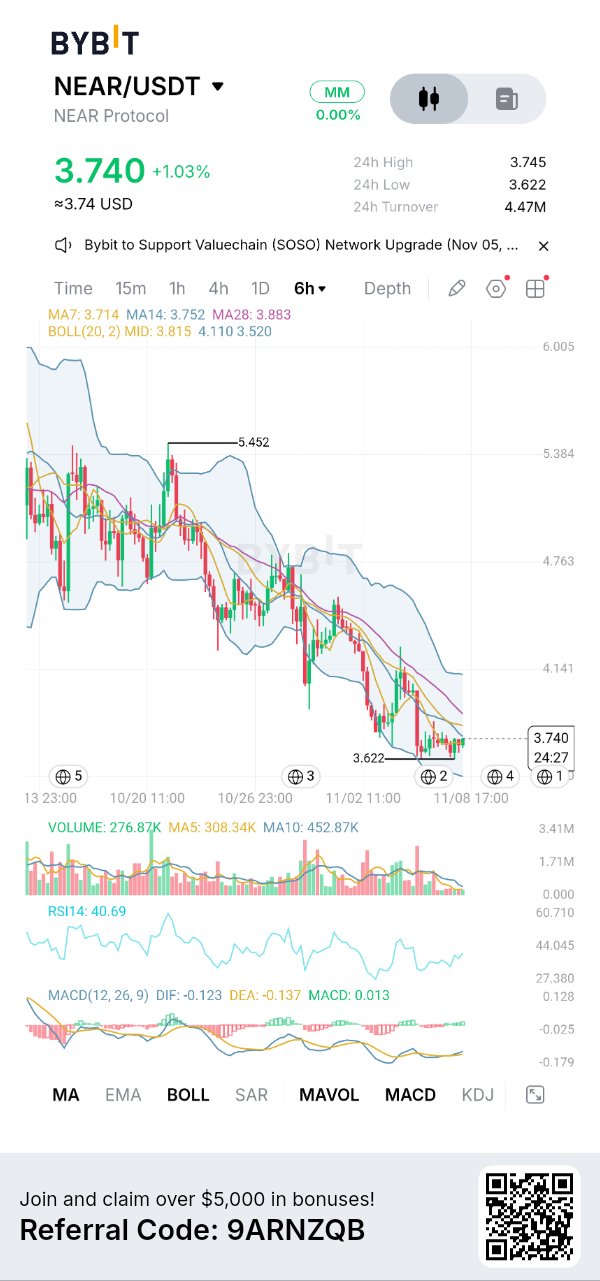
$NEARUSDT is still trading inside a broader declining structure, and the interesting part is that its latest bounce has brought price back above the 7-period moving average without reclaiming the more important resistance cluster. I wouldn't call this a trend reversal yet. Buyers are showing some short-term activity near $3.62, but the chart still needs stronger confirmation before the market structure can change. WHAT I'M SEEING ON THE CHART : The uploaded Bybit chart is on the 6-hour timeframe. NEAR/USDT is trading at $3.740, up 1.03%. The visible 24-hour high is $3.745, the low is $3.622, and turnover is $4.47M. The marked chart high is $5.452. MA7 is $3.714, MA14 is $3.752 and MA28 is $3.883. Bollinger Bands show a middle line at $3.815, upper band at $4.110 and lower band at $3.520. RSI is 40.69. MACD shows DIF -0.123, DEA -0.137 and histogram +0.013. Volume is 276.87K, below both displayed volume averages. CURRENT MARKET DATA: At the time of checking on November 8, external market trackers place NEAR around $3.70–$3.71, slightly below the screenshot's $3.740. CoinGecko reports a market cap near $4.87B, approximately $255M in 24-hour volume and 1.311B circulating tokens. Its seven-day performance is around -15.7%, showing that selling pressure extends beyond the latest six-hour candles. FUNDAMENTALS: NEAR is a Layer-1 proof-of-stake blockchain designed for scalable applications, with sharding helping it handle network activity. Its broader direction now includes NEAR Intents, cross-chain transactions, Chain Signatures and private AI applications. An interesting recent development is the October upgrade allowing Chain Signatures operations to run inside trusted execution environments. This strengthens its cross-chain infrastructure, although product progress does not automatically translate into token price appreciation. TOKENOMICS: NEAR has approximately 1.311B tokens circulating, with essentially all reported supply unlocked. Its February 2026 tokenomics update introduced halved inflation, a live Intents fee mechanism and revenue-directed buybacks. This creates a potential connection between ecosystem usage and token demand, but actual revenue, buyback activity and ongoing issuance still matter. MACRO + MARKET: Bitcoin is around $75,850 and Ethereum around $2,237 in the available November 8 market snapshot. Both have weakened over the past week. That broader weakness matters because NEAR is an altcoin and may struggle to sustain a bounce while overall market sentiment remains cautious. NearStats +1 CHART + INDICATORS: The six-hour structure remains bearish, with lower highs and lower lows from the marked $5.452 high. Price is slightly above MA7 but remains below MA14, MA28 and the Bollinger middle line. RSI at 40.69 shows weak momentum, not an oversold condition. MACD's positive histogram of 0.013 suggests improving short-term momentum, but both main lines remain negative. Volume is also below its averages, so the bounce lacks convincing participation. TRADING SCENARIOS: For a bullish setup, I would wait for a six-hour close above $3.815 and a successful retest. Potential entry: $3.80–$3.85, SL: $3.70, TP1: $3.883, TP2: $4.110. Losing $3.70 would weaken this setup. For a bearish setup, a confirmed break below $3.622 followed by a failed retest could offer an entry around $3.60–$3.62. SL: $3.75, TP1: $3.520, TP2: $3.40. A reclaim of $3.75 would invalidate this short idea. These are conditional plans, not confirmed signals. MY TRADING PLAN: I wouldn't chase the current bounce. My first priority is watching whether $3.622 holds and whether buyers can reclaim $3.815 with stronger volume. Without either confirmation, staying out is a reasonable decision. What makes this setup interesting is the difference between NEAR's developing ecosystem and its weak price structure. The project is making progress, but the chart has not reflected that strength yet. I want to see buyers prove themselves before taking a position. $NEARUSDT #ByXIMPACT

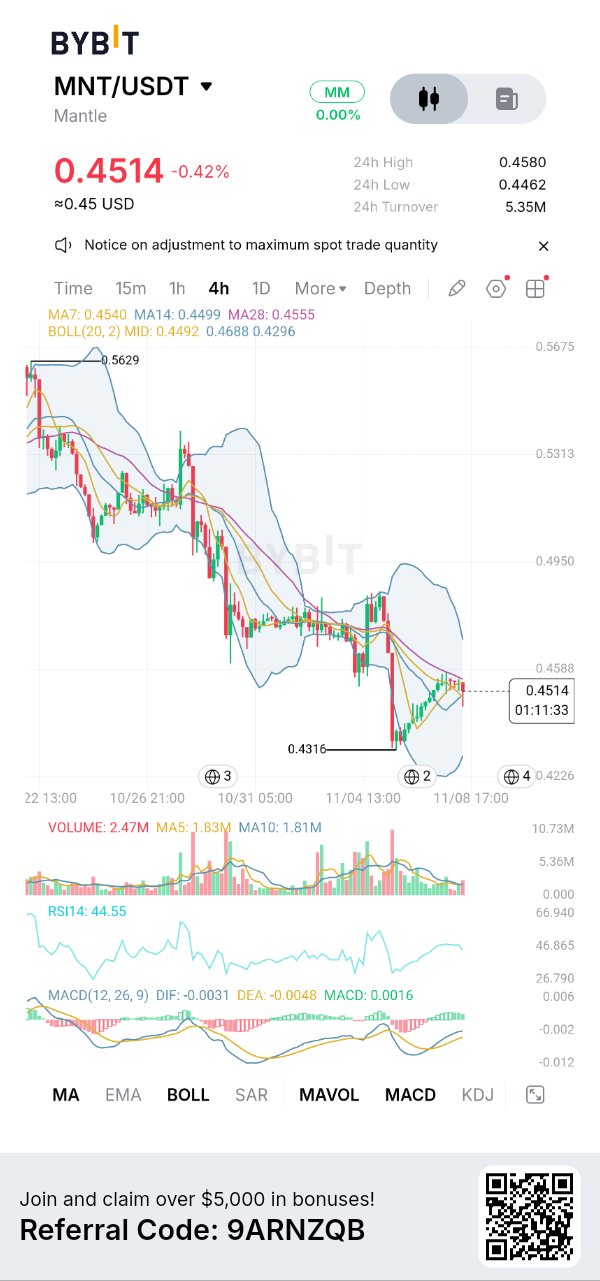
$MNTUSDT Mantle: Momentum Is Improving, but the Downtrend Still Needs to Be Challenged. What catches my attention on MNT is the difference between its short-term momentum and its broader price structure. Buyers have stepped in after the drop towards $0.4316, and momentum indicators are starting to improve. However, price has not yet established a convincing reversal. There is a bounce taking shape, but I don't see enough evidence to call it a trend change. WHAT I'M SEEING ON THE CHART The uploaded Bybit 4H chart shows MNT trading at $0.4514, down 0.42%. The visible 24-hour high is $0.4580 and the low is $0.4462. The chart also marks $0.4316 as the recent swing low. MA7 is $0.4540, MA14 is $0.4499 and MA28 is $0.4555. The Bollinger middle line is $0.4492, with upper and lower bands at $0.4688 and $0.4296. Current Market Data The latest available aggregated figures from the previous market check place MNT around $0.4518, with approximately $1.49B market capitalisation, $12.2M in 24-hour volume and 3.302B circulating tokens. These figures are separate from the exchange snapshot and may change with market conditions. Fundamentals Mantle is an Ethereum Layer-2 ecosystem focused on improving transaction scalability and supporting decentralised applications. Its ecosystem includes DeFi infrastructure, liquidity products and mETH-related services. What matters to me is whether this development produces consistent network activity, growing liquidity and genuine demand for MNT rather than attention alone. Tokenomics MNT has a maximum supply of approximately 6.219B tokens, with around 3.302B circulating. The remaining supply and treasury allocations deserve attention because future distributions can influence market supply. Ecosystem funding can support development, but I also want to see measurable adoption alongside token distribution. Network growth and token price appreciation are not automatically the same thing. Macro + Market Context Bitcoin and Ethereum remain important drivers of altcoin sentiment. The latest available readings placed BTC around $75,800 and ETH around $2,230. With broader market conditions still uncertain, I would be careful about treating an individual altcoin bounce as an independent bullish signal. Liquidity and overall risk appetite matter here. Chart & Indicator Analysis The 4H structure is still weak, with lower highs and lower lows dominating the broader visible move. RSI sits at 44.55, showing that momentum has improved but remains below the neutral 50 level. MACD histogram is positive at 0.0016, while DIF and DEA remain negative. This suggests an early momentum improvement rather than established bullish control. The $0.4555–$0.4588 area is the immediate resistance zone. A sustained move above it would improve the short-term picture. Below price, $0.4462 is the first important level, followed by $0.4316. Bullish Scenario I would consider a long only after a convincing 4H close above $0.4588 and a successful retest. The potential entry zone would be $0.4555–$0.4588, with a stop around $0.4490. My initial targets would be $0.4688 and then $0.4950. Failure to hold the reclaimed area would invalidate this idea. Bearish Scenario If MNT gets rejected around $0.4555–$0.4588 and subsequently loses $0.4462, sellers could regain control. A confirmed breakdown and failed retest could offer an entry around $0.4440–$0.4460, with a stop near $0.4590. The downside reference levels would be $0.4316 and $0.4296. My Personal Interpretation Why This Setup Matters I'm watching whether buyers can turn this bounce into a meaningful structural change. I don't want to enter simply because MACD has improved or because price has moved away from its recent low. I need confirmation through price, volume and a successful resistance reclaim. What makes this setup interesting is the disagreement between momentum and trend. If buyers manage to reclaim resistance, the short-term structure could improve. If they fail, this bounce may turn out to be temporary. For now, I prefer waiting for confirmation rather than taking a position in the middle of uncertainty. $MNTUSDT #ByXIMPACT

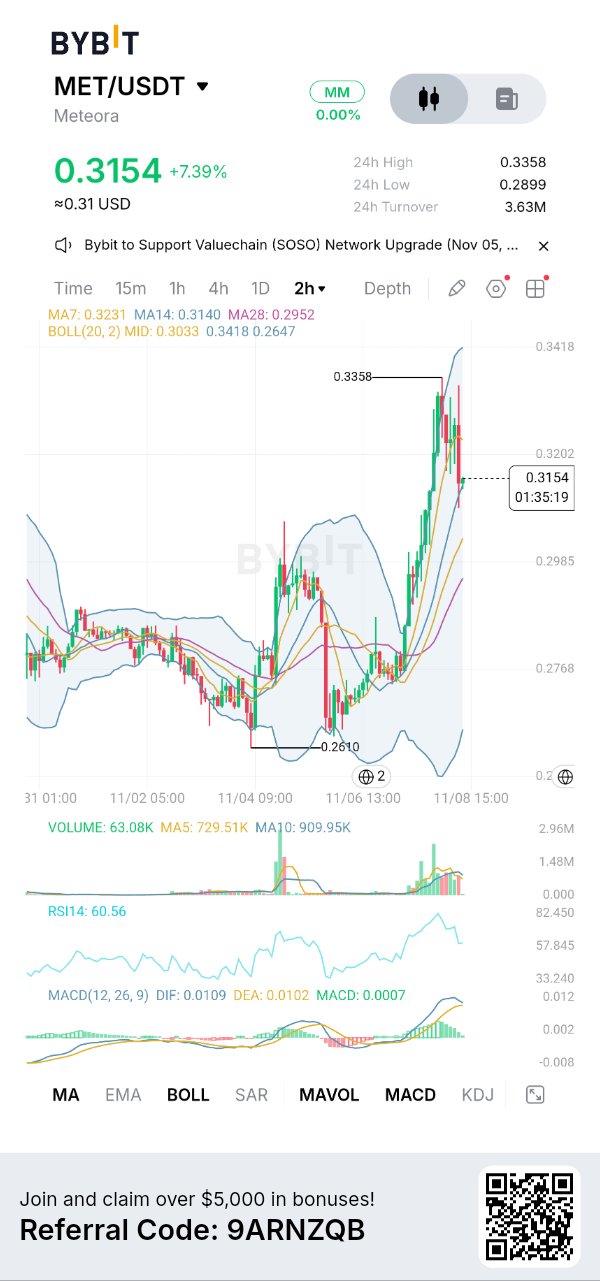
The interesting part is that MET has made a sharp move towards $0.3358, but the latest candles are pulling back from that high. The broader short-term structure remains positive, yet immediate momentum has cooled. This is where I would distinguish between a normal pullback and a deeper correction. The uploaded Bybit chart shows $METUSDT at $0.3154, up 7.39%. The 24-hour high is $0.3358 and low is $0.2899. On the 2-hour timeframe, MA7 is $0.3231, MA14 is $0.3140 and MA28 is $0.2952. Bollinger levels are $0.3418 upper, $0.3033 middle and $0.2647 lower.RSI(14) reads 60.56. MACD shows DIF 0.0109, DEA 0.0102 and histogram 0.0007. Volume is 63.08K, below MA5 of 729.51K and MA10 of 909.95K. CURRENT MARKET DATA The latest market snapshot available on November 8 shows MET around $0.3292, with approximately $183.56M market cap, $68.03M 24-hour volume and 557.58M circulating tokens. CoinGecko reports a 14.9% seven-day gain. The live market price differs from the screenshot's $0.3154, so these are not simultaneous readings. FUNDAMENTALS Meteora is a Solana-based liquidity infrastructure protocol. Its DLMM pools allow liquidity providers to concentrate capital around selected price ranges, while DAMM pools and Dynamic Bonding Curve products support different trading and liquidity needs. There is measurable activity behind the project. DefiLlama reports approximately $248.96M TVL, $3.7B in 30-day DEX volume and $2.69M in 30-day protocol revenue. However, TVL has fallen around 18% over the past month. That decline deserves attention despite substantial trading activity. TOKENOMICS MET has a maximum supply of 1 billion tokens. Around 56.5% is circulating, leaving meaningful future supply. The next scheduled unlock is November 23, involving approximately 7.22M MET. The allocation includes ecosystem reserves and team tokens. This is not an automatic sell signal, but it creates a supply factor worth monitoring. Meteora also reports revenue directed towards MET holders through staking-related rewards and buybacks funded by protocol revenue. Actual distributions and their consistency matter more than simply having these mechanisms. MACRO + MARKET CONTEXT Bitcoin is around $75,800 and has lost approximately 2.9% over seven days, while ETH is near $2,235 and down around 1.5% weekly. BTC dominance near 59% suggests altcoins are not receiving broad market leadership. MET's strength is notable, but it must prove buyers can sustain it independently. CHART OBSERVATION The 2-hour chart shows a recovery from the visible $0.2610 low, followed by a strong move towards $0.3358. Higher lows developed during the advance, improving the short-term structure. However, the latest candles show rejection near the upper range. At the screenshot reading of $0.3154, price is below MA7 ($0.3231), but remains marginally above MA14 ($0.3140). MA28 at $0.2952 remains lower, keeping the broader short-term structure constructive. The immediate question is whether $0.3140 can hold. Below that, $0.3033 is an important middle Bollinger reference, followed by $0.2952. On the upside, $0.3231 is the first reclaim level, while $0.3358 is the previous high. INDICATORs RSI at 60.56 is positive but has cooled from its recent peak. MACD remains above zero, with DIF 0.0109 above DEA 0.0102. However, the small positive histogram suggests momentum is weakening. Bollinger expansion reflects increased volatility. I would not interpret these readings as confirmation of another immediate breakout. BULLISH SCENARIO Trigger: A confirmed 2-hour close above $0.3231. Entry: $0.3200–$0.3230 after a successful retest. SL: $0.3130. TP1: $0.3358. TP2: $0.3418. A sustained reclaim would show buyers have regained the short-term average and are challenging the previous rejection area. A close below $0.3130 weakens this setup. BEARISH SCENARIO Trigger: A 2-hour close below $0.3140, followed by rejection on a retest. Entry: $0.3110–$0.3140. SL: $0.3235. TP1: $0.3033. TP2: $0.2952. These targets correspond to the middle Bollinger level and MA28. A sustained reclaim above $0.3231 would invalidate this bearish idea. PERSONAL INTERPRETATION What stands out to me is the difference between Meteora's protocol activity and its token supply situation. The project has meaningful trading volume and revenue, but declining TVL and upcoming unlocks could limit sustained demand. I wouldn't chase the initial move. My preference would be to wait for $0.3231 to be reclaimed with convincing volume, or see whether $0.3140 fails and price moves towards lower support. The key question is whether MET can maintain its relative strength while the broader market remains weak. $METUSDT #ByXIMPACT

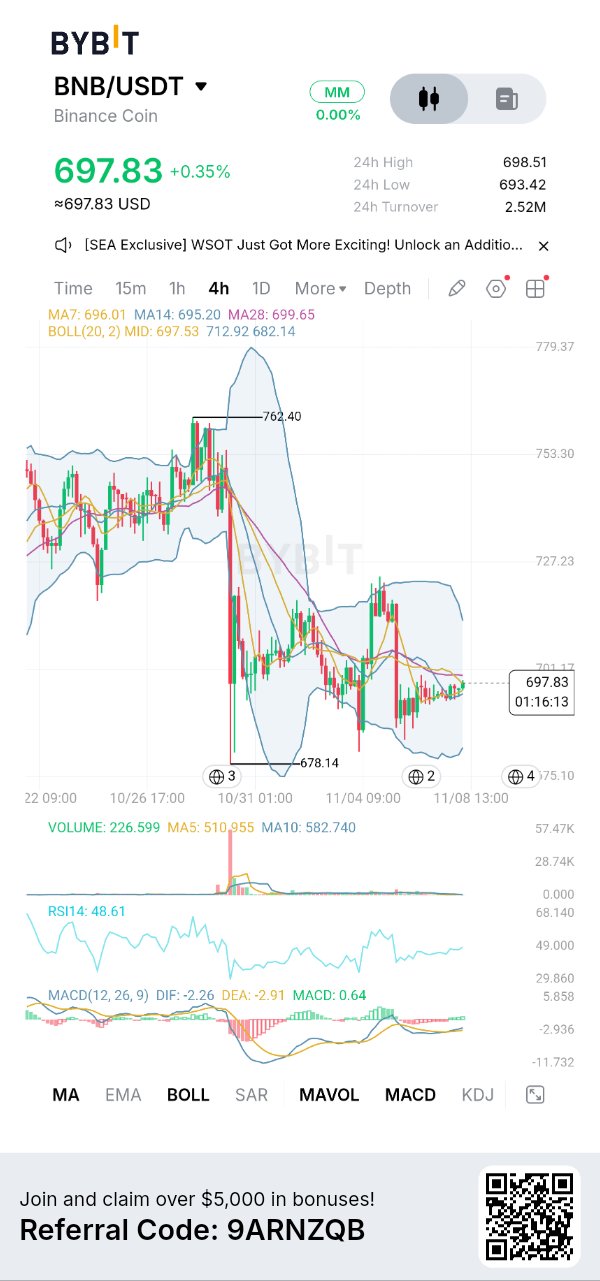
The interesting contradiction in $BNBUSDT 4H chart is that momentum is starting to improve while the overall price structure remains weak. RSI is near neutral at 48.61 and MACD histogram has turned positive, yet BNB is still struggling around $698–701 after failing to hold its bounce towards $720. Buyers are showing some interest, but they haven't proved they can take control. The next 4H move around $701 could reveal whether this is genuine buying strength or just another temporary pause in the downtrend. FACT The Bybit chart shows BNB at $697.83, up 0.35%, on the 4-hour timeframe. The visible 24-hour high is $698.51 and low is $693.42. The chart also shows a previous sharp sell-off from the $750 area, followed by a wick down to approximately $678.14. Since then, BNB has traded unevenly, with a bounce towards $720 that failed to hold. Price is now moving sideways around $697–698. This is consolidation after a major decline, not yet a confirmed trend reversal. CURRENT MARKET DATA As of November 8, current market feeds place BNB around $694–696, with a market capitalisation near $91.4 billion and circulating supply around 131.51 million BNB. Reported 24-hour volume varies between roughly $579 million and $1.19 billion across providers, so the source matters. Recent performance is mixed, with approximately 1% weekly weakness on CoinGecko. The current quote is slightly below the screenshot price. FUNDAMENTALS BNB is more than an exchange-related token. It powers BNB Smart Chain transactions, supports opBNB and Greenfield, and is used for network fees and governance. Ecosystem development remains relevant: BNB Chain's October updates included AI-agent infrastructure and payment integrations, while its November 3 node release schedules the Jenner upgrade for December 8. These developments matter if they translate into actual network usage, not simply announcements. TOKENOMICS BNB began with a 200 million supply and uses quarterly Auto-Burns alongside real-time gas-fee burns. Circulating supply is now around 131.51 million, with the long-term burn target of 100 million. This creates a gradual supply-reduction mechanism, although burns alone cannot guarantee price appreciation. Network demand remains important. MACRO + MARKET CONTEXT Bitcoin is around $75,730 and Ethereum near $2,236 in current market reporting, while overall sentiment remains fearful. The Fed maintained rates at 3.75–4% on October 28 and noted that inflation remains elevated. This is not an especially supportive backdrop for aggressive altcoin positions. CHART OBSERVATION 4H The important detail is the failed attempt near $720. Buyers managed to lift price, but sellers rejected that move and pushed BNB back into the $690–700 area. The visible $701.17 region is the first important overhead level. MA7 at $696.01 and MA14 at $695.20 are close to price, while MA28 at $698.65 remains slightly above it. This is a compressed structure, not a strong bullish trend. INDICATORS RSI14 is 48.61, showing neutral momentum. MACD DIF is -2.26, DEA -2.91 and histogram +0.64. The positive histogram suggests improving short-term momentum, but MACD remains below zero. Volume is 226.599K against MA5 of 510.955K and MA10 of 582.740K. Participation is relatively weak. Bollinger midline is $697.53, upper band $712.92 and lower band $682.14. KDJ is not visible. BULLISH SCENARIO Trigger: 4H close above $701.17. Entry: $699–702 after a successful retest. SL: $693. TP1: $712.92, TP2: $720. Invalidation: failure to hold the reclaimed $701 area. The retest matters because it would show buyers defending former resistance. BEARISH SCENARIO Trigger: 4H close below $693.42. Entry: $690–693 on a failed reclaim. SL: $701.50. TP1: $682.14, TP2: $678.14. Invalidation: price regaining $701.17 and holding above it. These downside levels matter because they represent the lower Bollinger region and the previous selling wick. PERSONAL INTERPRETATION My read is that BNB is trying to stabilise after a substantial decline, but the chart has not earned a bullish reversal label yet. I wouldn't chase the current price. I'm watching $701 first and $693 below. A convincing reclaim with stronger volume would make me consider a long; a breakdown would make me avoid buying too early. The interesting part is whether this tight range develops into genuine demand or simply becomes another pause before selling resumes. WHY THIS SETUP MATTERS BNB is at a decision point where a confirmed reclaim of $701 could improve short-term structure, while losing $693 may expose the previous lows. The next 4H candles and volume will matter more than a small price bounce. Educational analysis only not financial advice. $BNBUSDT #ByXIMPACT

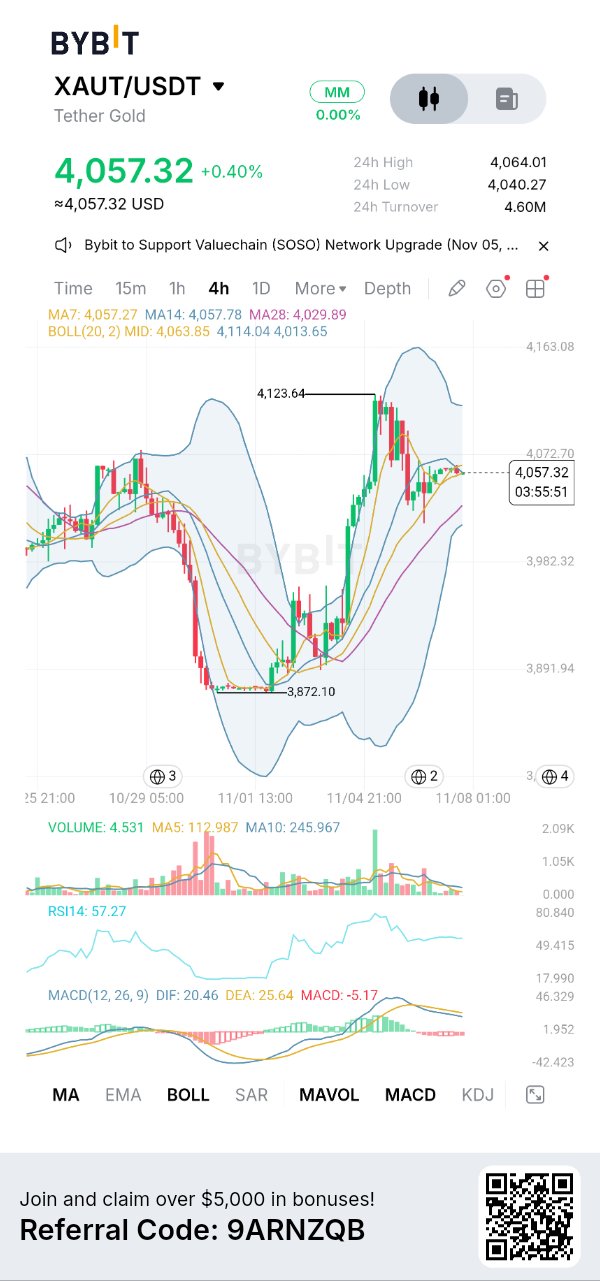
$XAUTUSDT 4H Analysis: Strong Rally, Rejection at $4,123 and a Market That Hasn't Chosen Its Next Direction. What stands out to me is the contradiction between price structure and momentum. XAUT has made a substantial move upward from its $3,872 low, but the rejection near $4,123 has cooled short-term momentum. Price is now holding above its longer moving average, yet it has not convincingly reclaimed the Bollinger middle band. This is not a confirmed fresh breakout, and I wouldn't treat the recent bounce as proof that the next upward leg has started. FACT : The uploaded Bybit screenshot shows XAUT/USDT on the 4-hour timeframe at $4,057.32. The visible 24-hour high is $4,064.01 and low is $4,040.27, with $4.60M turnover. The chart marks a swing low at $3,872.10 and a later high at $4,123.64. MA7 is $4,057.27, MA14 is $4,057.78 and MA28 is $4,029.89. Bollinger middle, upper and lower bands are $4,063.85, $4,114.04 and $4,013.65 respectively. RSI(14) reads 57.27. MACD shows DIF 20.46, DEA 25.64 and histogram -5.17. CURRENT MARKET DATA: At the time of research, CoinGecko quotes XAUT around $4,058.52, with approximately $3.28B market cap and $135.6M in 24-hour volume. Its reported seven-day performance is +4.7%. Circulating supply is listed around 809K and total supply around 827.4K. Supply figures differ across data providers, so they should not be treated as identical accounting definitions. The screenshot price of $4,057.32 is slightly below the current quotes. CoinGecko +2 FUNDAMENTALS & TOKENOMICS: XAUT is different from a conventional crypto project. Each token represents ownership of one fine troy ounce of physical gold stored in Swiss vaults. Its purpose is to make gold transferable and tradable through blockchain infrastructure. Tether's November 4 report states that reserves reached 827,417.63 ounces, approximately 25.7 tonnes, with 1:1 backing. This is meaningful growth in tokenized-gold adoption. There is no conventional staking yield or mining emission; supply expands alongside gold issuance and demand. Purchase, redemption and delivery conditions also matter. MACRO + CHART OBSERVATION: Gold remains the main driver here, rather than ordinary altcoin rotation. The latest available market briefing places gold near $4,075, BTC around $75,954 and ETH around $2,242. Gold's direction, real yields and dollar strength deserve more attention than altcoin sentiment when assessing XAUT. On the four-hour chart, the move from $3,872.10 to $4,123.64 was strong, but the rejection at the upper level changed the immediate picture. Price is now consolidating around $4,057. MA7 and MA14 are almost flat near current price, while MA28 at $4,029.89 remains underneath. The Bollinger middle band at $4,063.85 is immediate resistance. The $4,013.65 lower band is an important downside reference. INDICATORS: RSI at 57.27 is above neutral, but MACD histogram at -5.17, with DIF below DEA, shows cooling momentum. Volume is also relatively quiet compared with the earlier expansion. This suggests consolidation, not a confirmed breakout. BULLISH SCENARIO: Trigger: four-hour close above $4,064. Entry: $4,064–$4,080 after a successful retest. SL: $4,028. TP1: $4,114. TP2: $4,123.64. Invalidation: sustained rejection below $4,064. BEARISH SCENARIO: Trigger: four-hour close below $4,029. Entry: $4,015–$4,029 on a failed retest. SL: $4,065. TP1: $3,982. TP2: $3,892–$3,872. Invalidation: reclaim of $4,064. MY PERSONAL INTERPRETATION: I'm not interested in chasing XAUT in the middle of this range. I want to see whether buyers can reclaim $4,064 and build momentum toward $4,114, or whether sellers push price below $4,029. The interesting part is the difference between strong underlying gold demand and weakening short-term chart momentum. That is what makes this level worth watching. I would rather wait for confirmation than enter simply because the previous rally looked impressive. $XAUTUSDT #ByXIMPACT

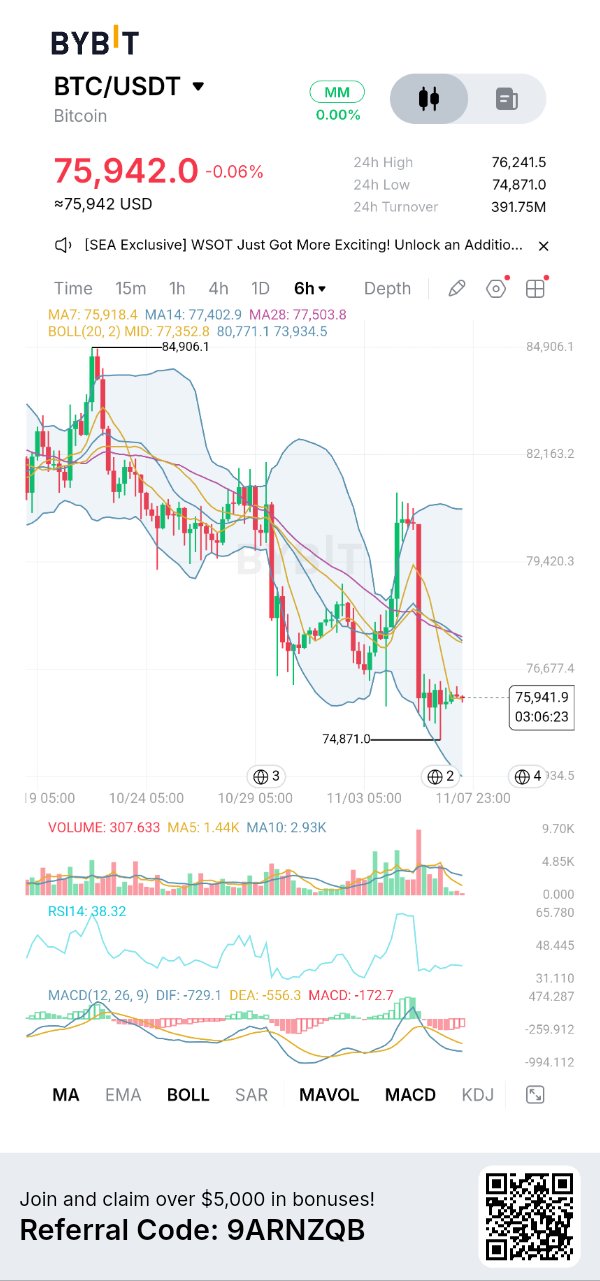
$BTCUSDT The $75K Support Test After a Failed Breakout. Bitcoin's six-hour chart shows a sharp rejection from the $80K region, followed by a move toward $75K. Price has stabilized near the lows, but the broader structure still favors sellers. The important question is whether $74,871 can hold through another test. WHAT I'M SEEING ON THE CHART : Bybit shows BTC at $75,942, with a $76,241 daily high and $74,871 low. The 6H chart shows lower highs, a failed upward move near $80K, and price below MA7 ($75,918), MA14 ($77,403) and MA28 ($77,504), although it is marginally above MA7 at the captured moment. RSI sits at 38.32, while MACD remains negative, with DIF at -729.1 and DEA at -556.3. The latest candles are small, suggesting hesitation rather than confirmed buying strength. CURRENT MARKET DATA: CoinGecko's latest checked quote is approximately $75,939, close to the screenshot. Market capitalization stands near $1.527 trillion, 24-hour trading volume around $21.82 billion, and circulating supply approximately 20.109 million BTC. Bitcoin is down roughly 1.8% over seven days. These figures are live-market snapshots and can change. FUNDAMENTALS & TOKENOMICS: Bitcoin remains a decentralized settlement network secured through proof-of-work mining. Its investment case centers on limited supply, censorship-resistant transfers and growing institutional access. Supply is capped at 21 million BTC, with new issuance currently around 3.125 BTC per block. There are no scheduled investor-token unlocks or discretionary treasury emissions. Mining rewards and holder selling remain relevant sources of market supply. MACRO & MARKET CONTEXT: ETF flows and interest-rate expectations remain important. CoinGecko highlights recent ETF outflows alongside weaker technology-sector sentiment. The Fed's September target range was 3.75–4.00%, although that is not confirmation of its latest November stance. CoinGecko +1 Higher yields and tighter liquidity could keep BTC under pressure. CHART & INDICATORS: The $77,350–$77,500 area is the first meaningful reclaim zone, where the middle Bollinger Band and longer moving averages converge. The upper band sits near $80,771, while the lower band is near $73,934. RSI below 50 and negative MACD momentum suggest sellers retain control. Recent selling-volume spikes also make the small sideways candles less convincing as evidence of a reversal. BULLISH SCENARIO: I would watch for a confirmed 6H close above $76,700, followed by a successful retest. An entry around $76,700–$76,900, stop below $75,800, TP1 at $77,350 and TP2 near $79,400 would be conditional on improving volume. Losing $75,800 after entry would invalidate that setup. BEARISH SCENARIO: A 6H close below $74,871, followed by a failed retest around $74,850–$75,000, would favor further downside. A stop above $75,600, TP1 near $73,934 and TP2 around $72,800 would frame that trade. A sustained reclaim above $75,600 would invalidate the breakdown idea. PERSONAL INTERPRETATION: My read is that BTC is compressing near support after a forceful rejection, not establishing a confirmed reversal. I wouldn't chase the first green candle. I'm watching whether buyers can reclaim the moving-average cluster or whether another support test produces stronger selling. The interesting part is the contrast between relatively stable current pricing and a still-weak six-hour structure. Confirmation matters more than anticipating the next move. $BTCUSDT #ByXIMPACT
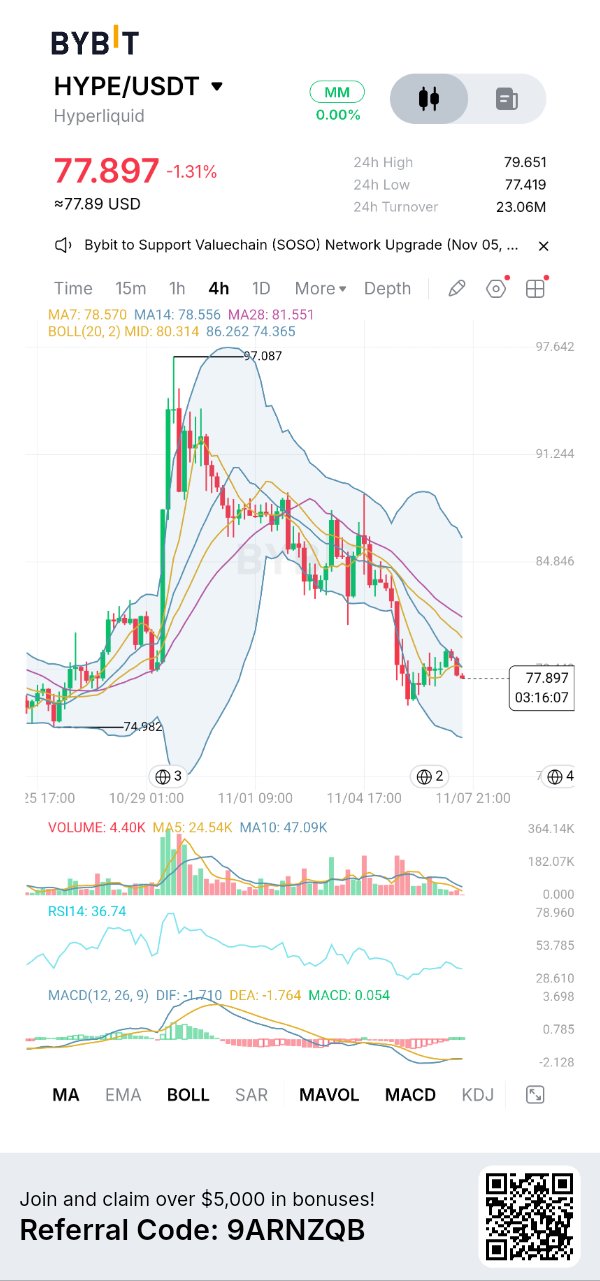
The most important thing on this chart is that $HYPEUSDT is attempting a small bounce after a sharp sell-off, but the broader 4-hour structure remains bearish. Price has moved away from its recent low, yet it is still trading below all three displayed moving averages. I would not treat this bounce as a confirmed trend reversal. WHAT I'M SEEING ON THE CHART The Bybit chart shows $HYPEUSDT at $77.897, down 1.31%, on the 4-hour timeframe. The visible 24-hour high is $79.651 and low is $77.419. The chart marks a previous high around $97.087 and a low around $74.982. The chart moving averages are MA7 at $78.570, MA14 at $78.556 and MA28 at $81.551. Price is below all three. Bollinger Bands show a middle line of $80.314, upper band of $86.262 and lower band of $74.365. RSI(14) reads 36.74, indicating weak momentum. MACD shows DIF -1.710, DEA -1.764 and histogram 0.054. Displayed volume is 4.40K, below MA5 at 24.54K and MA10 at 47.09K. CURRENT MARKET DATA On November 7, market sources place HYPE around $78–79, with market capitalization near $19B and 24-hour trading volume around $800M. Circulating supply is approximately 239.4M, against a 1B maximum supply. The reported seven-day performance is around -10.5%. These live figures differ from the screenshot's $77.897 price. FUNDAMENTALS Hyperliquid is an on-chain trading platform offering perpetual futures, spot markets and its own Layer-1 infrastructure. Its HIP-3 framework allows independent builders to launch markets, including commodities and equity-related contracts. Reported HIP-3 activity has reached roughly 30% of platform trading volume, showing that the ecosystem is expanding beyond crypto-native markets. TOKENOMICS HYPE has a maximum supply of 1B. Protocol trading fees flow toward community mechanisms, including the Assistance Fund, which automatically purchases HYPE and burns it. Staking also provides validator participation and trading-fee benefits. However, scheduled token releases remain a supply consideration, with another unlock listed for November 29. MACRO + CHART Bitcoin recently fell below $75,000 before recovering, while weekly BTC and ETH performance remained negative. That environment makes sustained altcoin strength harder to establish. On the 4H chart, the important issue is the sequence of lower highs following rejection near $97.087. The sharp decline toward $75 was followed by a modest bounce, but price remains below MA7, MA14 and MA28. The $80.314 Bollinger midpoint is another resistance reference. RSI at 36.74 shows weak momentum. MACD histogram has turned slightly positive, but this alone does not confirm a reversal. Volume remains below both displayed averages, so buying participation needs improvement. BULLISH SCENARIO Trigger: 4H close above $78.56. Entry: $78.60–79.20 after a successful retest. SL: $76.80. TP1: $80.31. TP2: $81.55. Reclaiming the moving averages would be the first evidence of improving structure. A move back below $76.80 invalidates this setup. BEARISH SCENARIO Trigger: Rejection around $78.55–80.31 followed by a break below $77.41. Entry: $77.20–77.60 on a failed retest. SL: $80.50. TP1: $75.00. TP2: $74.36. Losing the recent low would expose the lower Bollinger region. A sustained reclaim above $80.31 weakens this scenario. PERSONAL INTERPRETATION I am not interested in chasing this bounce. The interesting part is whether HYPE can turn its strong ecosystem activity into sustained market demand while dealing with weak technical momentum and future supply releases. I would rather wait for a convincing reclaim of $80.31 than enter simply because RSI is approaching oversold territory. If $77.41 breaks, I would reassess rather than defend a bullish view. Why This Setup Matters: HYPE is at a key decision zone where buyers need to reclaim $78.55–$80.31 to improve the 4H structure. Otherwise, continued rejection could bring another test of $77.41 and $75. The next move depends on whether buyers can overcome this resistance or sellers maintain control. $HYPEUSDT #ByXIMPACT

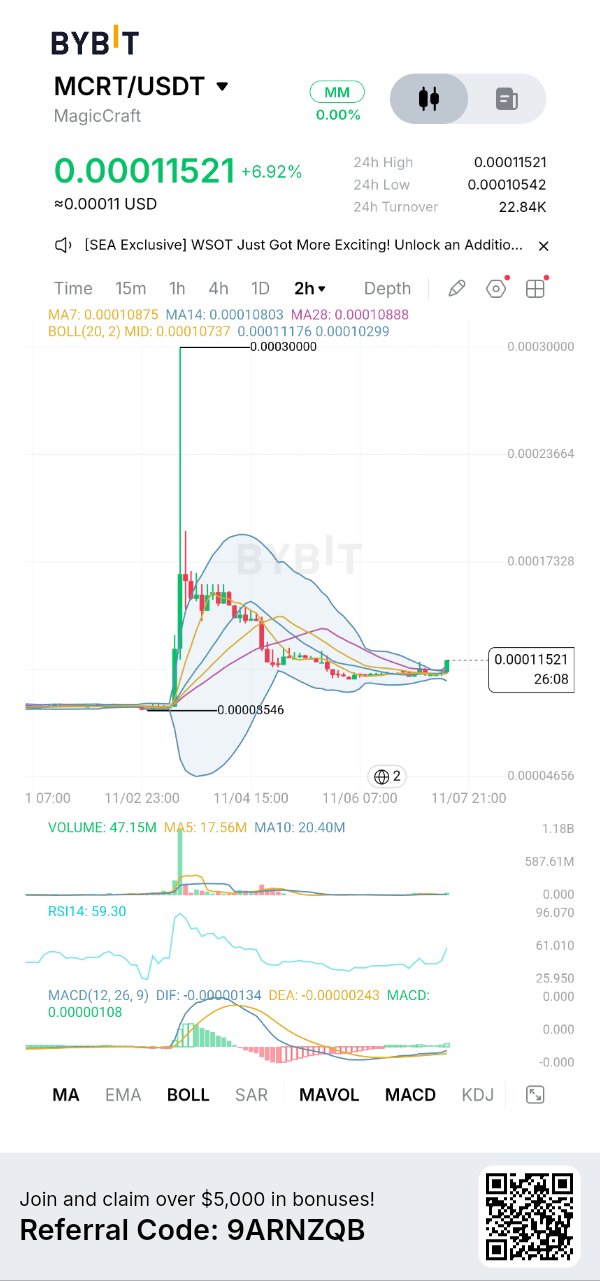
$MCRTUSDT A Sharp Move After Prolonged Weak Price Action. What makes this chart interesting is that MCRT spent several sessions trading in a narrow range after its initial listing spike, and now a fresh green candle has pushed price above the recent consolidation area. However, one strong 2-hour candle is not enough to establish a sustained uptrend. The important question is whether buyers can hold this move or whether price will fall back into its previous range. WHAT I'M SEEING ON THE CHART The uploaded Bybit chart shows $MCRTUSDT at $0.00011521, up 6.92%, on the 2-hour timeframe. The displayed 24-hour high is $0.00011521, the low is $0.00010542, and turnover is 22.84K. The chart shows an initial sharp spike toward $0.00030000, followed by a prolonged decline and consolidation. The marked chart low is $0.00008546. The latest candle is green and has moved above the recent tight trading range. Visible moving averages are MA7 at $0.00010875, MA14 at $0.00010803 and MA28 at $0.00010888. Bollinger middle is $0.00010737, upper band $0.00011176 and lower band $0.00010299. RSI(14) reads 59.30. MACD shows DIF -0.00000134, DEA -0.00000243 and a positive histogram of 0.00000108. Volume is 47.15M, above MA5 of 17.56M and MA10 of 20.40M. CURRENT MARKET DATA Current market listings show MCRT around $0.0001065, with approximately $536,940 market capitalization and $116,480 in 24-hour volume. CoinMarketCap reports 5.03B circulating tokens, 7.19B total supply and 10B maximum supply. These figures differ from the screenshot price of $0.00011521. There is also a supply-reporting discrepancy MagicCraft own website estimated 8.4B circulating on October 2. I would not treat these supply figures as interchangeable. FUNDAMENTALS MagicCraft is a blockchain gaming project focused on multiplayer MOBA gameplay. Its product includes competitive PvP battles and a PvE adventure system introduced in May 2026, with quests, bosses and cooperative gameplay. The relevant question is whether these products can attract and retain actual players. Gaming activity, player retention and token utility matter more than announcements alone. TOKENOMICS MCRT has a stated maximum supply of 10B, with allocations for gaming ecosystem growth, team, staking rewards, private investors and reserves. Official documentation states there is no token-burning mechanism. A third-party unlock tracker reports another 20M MCRT scheduled for November 21, followed by a final scheduled release in December. These releases are relatively small individually, but circulating-supply discrepancies make independent verification important. MACRO + MARKET CONTEXT Bitcoin has been trading around $75,000–$76,000, while Ethereum is around $2,240. Recent weekly performance has been weak across both assets. That matters because small gaming tokens can struggle to maintain breakouts when broader crypto liquidity is defensive. CHART & INDICATORS: On the 2H chart, MCRT has moved above its prolonged consolidation range with a fresh green candle. Price at $0.00011521 is above MA7 ($0.00010875), MA14 ($0.00010803) and MA28 ($0.00010888). RSI at 59.30 shows improving momentum, while MACD histogram has turned positive. Volume at 47.15M is also above its MA5 and MA10. However, the earlier spike toward $0.00030000 and subsequent decline show that this is still a fragile structure, not a confirmed long-term reversal. TRADING SCENARIOS Bullish setup: Trigger: A confirmed 2H close above $0.00011521, followed by a successful retest. Entry: $0.00011176–$0.00011521. SL: $0.00010542. TP1: $0.000130–$0.000140. TP2: $0.000160–$0.000173. The targets are approximate resistance zones inferred from the visible chart structure, not confirmed orders. A failed retest invalidates the setup. Bearish setup: Trigger: A 2H close below $0.00010542. Entry: $0.000105–$0.000108 on a failed reclaim. SL: $0.00011550. TP1: $0.00010299. TP2: $0.00008546. Losing the recent range would suggest the latest buying attempt has failed. PERSONAL INTERPRETATION I wouldn't chase this green candle. RSI at 59.30 and the positive MACD histogram show improving short-term momentum, while volume is notably higher than its averages. That is worth watching, but the token's earlier price spike also shows how quickly this market can move in both directions. I'm watching whether $0.00011176 becomes support and whether buyers can defend $0.00010542. If price holds above these levels, I would consider a confirmed breakout entry. If it falls back into consolidation, I would rather stay out. The part I find interesting is the difference between a genuine increase in gaming adoption and a short-lived exchange-driven price move. MCRT needs both sustained product activity and stronger market participation. Until the chart confirms that demand, I see this as a developing short-term setup, not an established trend. Educational analysis only not financial advice. $MCRTUSDT #ByXIMPACT

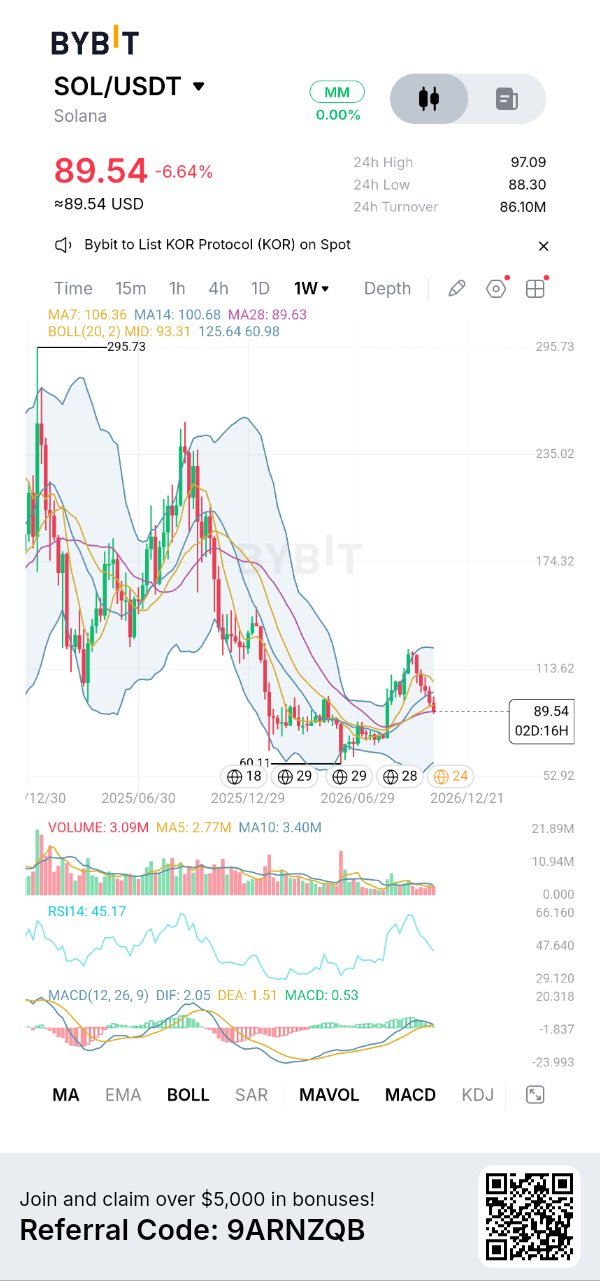
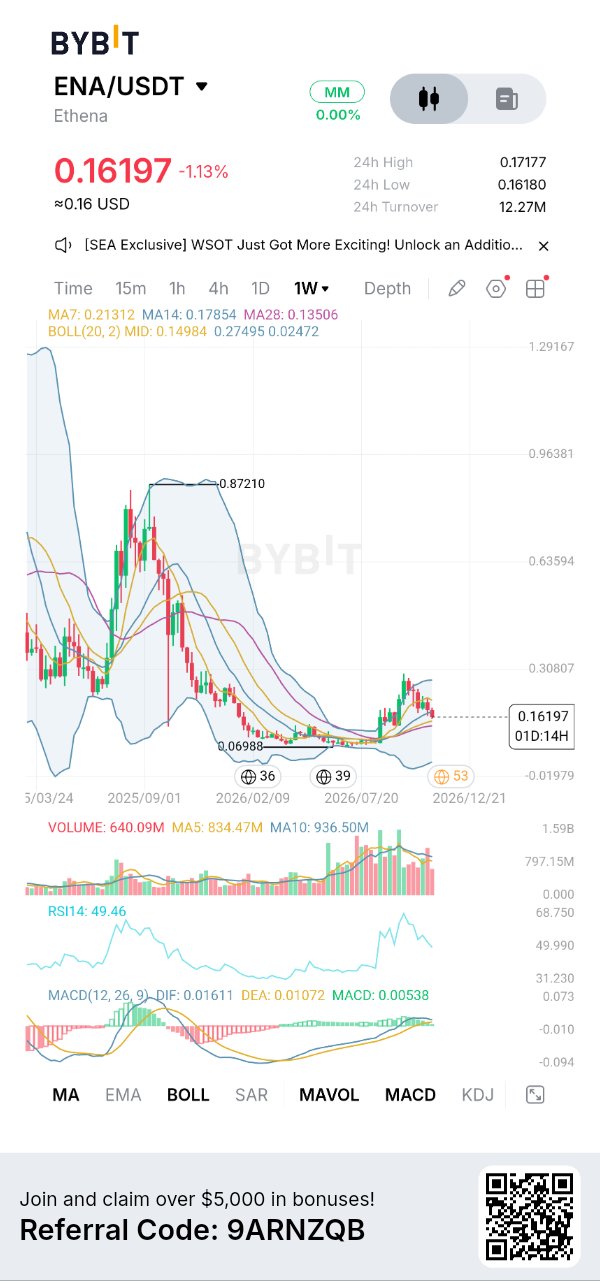
The interesting contradiction is that ENA has moved above its long-term base, but the weekly chart is not showing a confirmed bullish trend yet. Price is trading above the 28-week moving average, while remaining below the 7-week and 14-week averages. That leaves the market in a mixed structure rather than a confirmed reversal. The uploaded Bybit Chart shows $ENAUSDT at $0.16197, down 1.13%, on the 1W timeframe. The visible 24-hour high is $0.17177 and low is $0.16180. The weekly chart shows a major historical decline from the marked $0.87210 peak to the $0.06988 low, followed by a prolonged base and a recent upward move. Visible indicators show MA7 at $0.21312, MA14 at $0.17854 and MA28 at $0.13056. RSI(14) is 49.46. MACD shows DIF 0.01611, DEA 0.01072 and histogram 0.00538. Bollinger Bands show a middle line at $0.14984, upper band at $0.27495 and lower band at $0.02472. Visible volume is 640.09M, below its MA5 of 834.47M and MA10 of 936.50M. CURRENT MARKET DATA Today ENA is around $0.1644, with approximately $2.22B market capitalization, $288.52M 24-hour volume and 13.5B circulating tokens out of 15B. Recent performance remains weak: one market source reports a 14.69% seven-day decline and 27.19% monthly decline. The live quote differs slightly from the screenshot's $0.16197. CoinMarketCap +1 FUNDAMENTALS Ethena is a DeFi protocol built around USDe, a synthetic dollar designed to maintain its peg through crypto collateral and offsetting derivatives positions. Its ecosystem also includes sUSDe and integrations with lending platforms. Recent developments include Ethena Pay, Aave V4 integrations and broader USDe distribution. These developments matter because actual stablecoin usage and protocol revenue are more meaningful than attention alone. TOKENOMICS ENA has a maximum supply of 15B. Around 90% is reported circulating, so dilution remains relevant. The important development is the approved fee-switch proposal, which can direct up to 95% of net protocol revenue toward ENA buybacks after specified USDe supply milestones. This creates a potential value-accrual mechanism, but it should not be confused with guaranteed buy pressure. CoinMarketCap +1 MACRO + MARKET CONTEXT The wider market is not providing a strong tailwind. Bitcoin recently dropped below $76,000, while Ethereum also faced selling pressure. Spot crypto ETF outflows and broader risk reduction have affected sentiment. The Fed maintained its target rate at 3.75–4.00% on October 28. This environment makes it harder for smaller DeFi tokens to sustain rallies without independent demand. CHART + INDICATORS My read of the weekly structure is that ENA is still recovering from a prolonged decline, but has not established a confirmed higher-timeframe uptrend. The recent rally toward the $0.27 area faced rejection, and price has pulled back toward $0.16. The $0.1498 Bollinger middle line is an important nearby reference. Below it, $0.1306 MA28 becomes important. On the upside, $0.1785 MA14 and $0.2131 MA7 are the first major obstacles. RSI at 49.46 is neutral, not strong bullish momentum. MACD remains positive, with DIF above DEA, but the histogram is relatively small. Volume is also below both displayed volume averages. This suggests buying momentum needs confirmation. BULLISH SCENARIO Trigger: Weekly close above $0.1785. Entry: $0.178–0.185 on a successful retest. SL: $0.159. TP1: $0.213. TP2: $0.275. The moving-average reclaim would provide evidence that buyers are regaining control. A rejection below the entry zone invalidates this setup. BEARISH SCENARIO Trigger: Weekly close below $0.1498. Entry: $0.145–0.150 on a failed reclaim. SL: $0.163. TP1: $0.1305. TP2: $0.10. A breakdown would expose the lower trading range. A sustained reclaim above $0.163 weakens this bearish setup. PERSONAL INTERPRETATION What stands out to me is the difference between Ethena's expanding product ecosystem and ENA's still-unsettled chart structure. I find that interesting because protocol adoption and token demand are not automatically the same thing. I wouldn't chase ENA at current levels. I'm watching whether $0.1498 holds and whether buyers can reclaim $0.1785 with stronger volume. Until then, patience makes more sense than assuming the recent bounce will continue. The next meaningful move should come from confirmation, not expectation. $ENAUSDT #ByXIMPACT

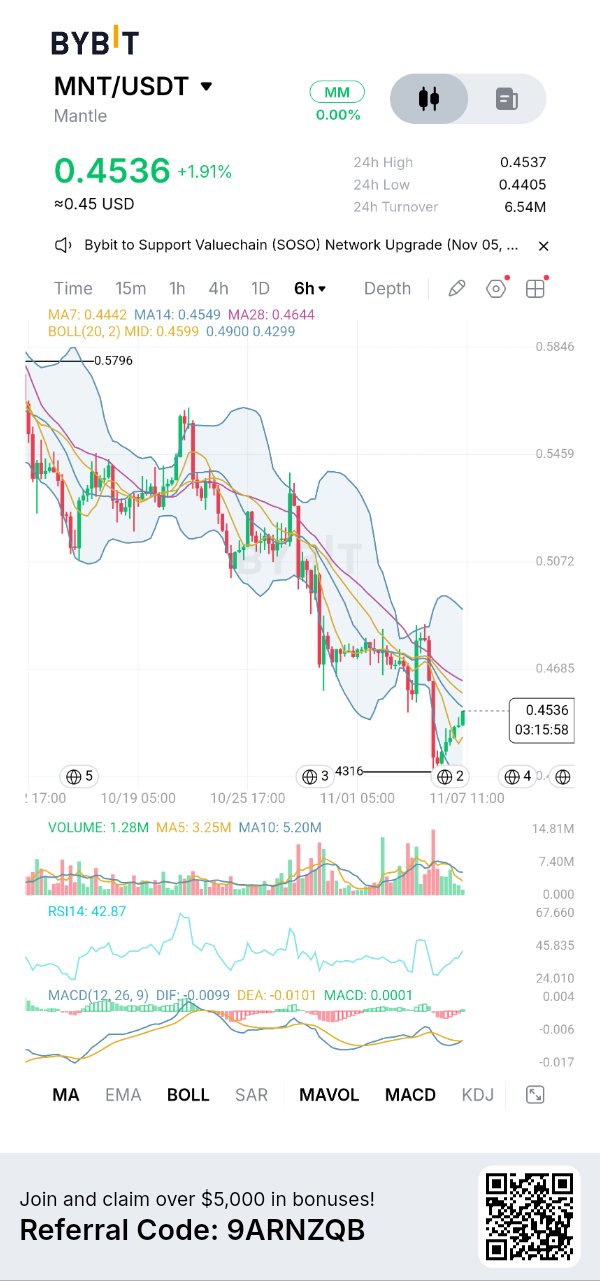
$MNTUSDT The Important Test Is Whether Buyers Can Regain the Lost Price Zone. MNT is trading at $0.4536 on the 6H chart. What deserves attention is how price has moved below its previous trading range and is now struggling to regain the area where several moving averages are positioned. The chart shows a decline from $0.5796, followed by a sharp sell-off towards $0.4316. The latest candles are moving upward, but the larger structure still shows lower highs. The chart records MA7 at $0.4442, MA14 at $0.4549 and MA28 at $0.4644. Bollinger middle band is $0.4599, with upper and lower bands at $0.4900 and $0.4299. RSI reads 42.87. MACD histogram is 0.0001, with DIF at -0.0099 and DEA at -0.0101. Volume is 1.28M, below MA5 of 3.25M and MA10 of 5.20M. CURRENT MARKET DATA On November 7, MNT trades around $0.4483, with a market cap near $1.48B, 24-hour volume around $18.7M–$20.5M and circulating supply of 3.30B against 6.22B maximum supply. The live quote is slightly below the screenshot price. FUNDAMENTALS Mantle is developing beyond a conventional Ethereum Layer-2 network. Its focus now includes tokenized equities, institutional investment products, stablecoins and DeFi. Its Q3 report recorded approximately 67,500 daily transactions, alongside expansion of Mantle Vault, OpenStock and USDG integration. nansen.ai +1 TOKENOMICS MNT provides network gas, governance and ecosystem utility. Around 53% of maximum supply is circulating. The remaining allocation makes treasury management and future distributions important supply factors. No upcoming cliff unlock is currently listed, although treasury movements still deserve attention. MACRO CONTEXT The October US employment report showed 165,000 new jobs, above expectations, while Treasury yields increased. This can make speculative assets more sensitive to liquidity conditions. CHART OBSERVATION The immediate test is $0.455–$0.465, where MA14, MA28 and the Bollinger middle band create resistance. Above that, $0.4685 becomes the next important area. On the downside, $0.4405 is nearby support, followed by $0.4316. Until price reclaims the moving-average cluster, the broader structure remains weak. INDICATORS RSI at 42.87 remains below 50. MACD histogram is barely positive, but both main lines remain negative. Below-average volume also limits confidence in the latest upward movement. TRADING SCENARIOS Bullish: Trigger: 6H close above $0.4644 with stronger volume. Entry: $0.460–$0.464 after retest. SL: $0.453. TP1: $0.4685. TP2: $0.4900. The first target tests previous price resistance, while the second approaches the upper Bollinger Band. Invalidation: failure to hold above $0.453. Bearish: Trigger: rejection around $0.460–$0.464 followed by a break below $0.4405. Entry: $0.440–$0.444 after a failed retest. SL: $0.455. TP1: $0.4316. TP2: $0.4299. Invalidation: sustained reclaim above $0.4644. PERSONAL INTERPRETATION I am not interested in buying simply because price has moved away from its recent low. My attention is on the $0.4644 level. If MNT can reclaim it with meaningful volume, I would consider a long position after confirmation. If it continues failing below this zone, I prefer to preserve capital rather than anticipate a reversal. WHY THIS SETUP MATTERS Mantle's expansion into tokenized financial products gives it a different growth opportunity, but ecosystem development must eventually translate into meaningful network usage and demand for MNT. The current chart is testing whether buyers can defend the recent selling area and regain control. That distinction matters more than the current percentage gain. $MNTUSDT #ByXIMPACT

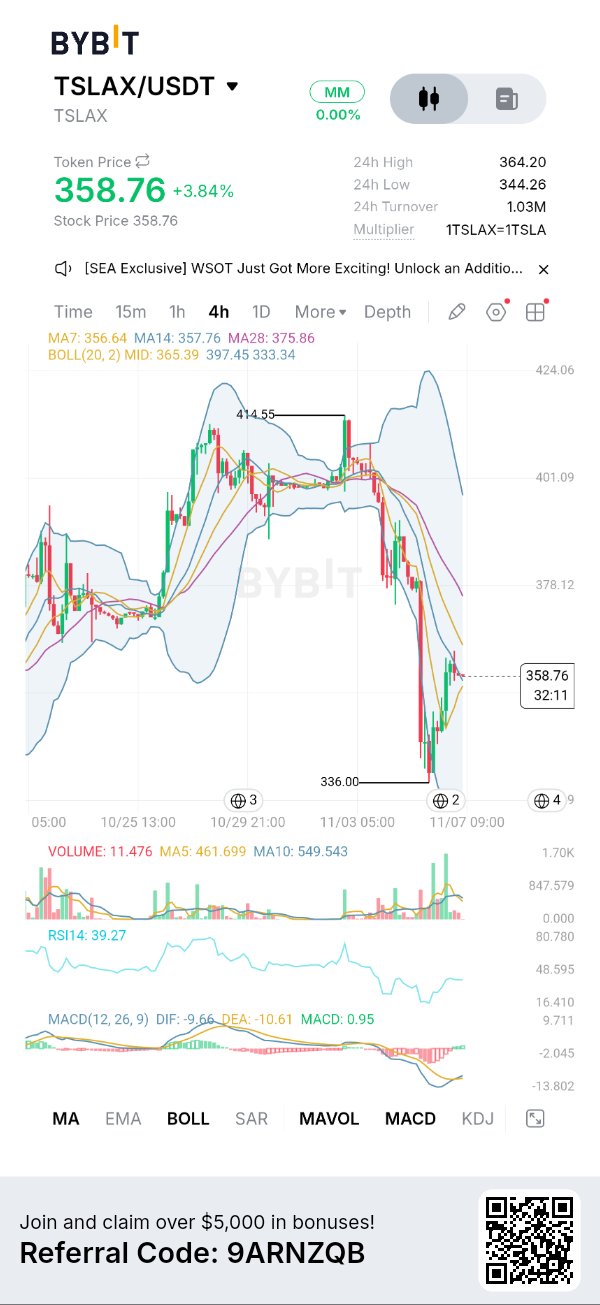
$TSLAxUSDT A Sharp Sell-Off, Followed by a Bounce That Still Needs Confirmation. One thing that deserves attention is the gap between the latest bounce and the damage already done to the 4-hour structure. TSLAx is trading at 358.76 (+3.84%), after falling from the marked 414.55 high to 336.00. Buyers have stepped in near the lows, but price has not yet recovered the important moving-average and Bollinger resistance areas. This is currently a rebound inside a declining structure, not a confirmed trend reversal. The chart shows a 24-hour high of 364.20 and low of 344.26, with turnover of 1.03M. MA7 is 356.64, MA14 is 357.76 and MA28 is 375.86. Bollinger levels are 365.39 (middle), 397.45 (upper) and 333.34 (lower). RSI reads 39.27. MACD shows DIF -9.66, DEA -10.61 and histogram +0.95. CURRENT MARKET DATA As of November 7, Bybit reports TSLAX around $359.03, versus $358.76 in the screenshot. Market cap is approximately $66.29M, 24-hour volume $11.47M and circulating supply 184.64K tokens. Reported total supply is 584.33K, with no fixed maximum supply listed. The underlying Tesla share closed at $358.22 on November 6. Small differences are expected because tokenized shares can trade outside regular stock-market hours. FUNDAMENTALS TSLAx is not a conventional crypto project. It is a tokenized representation of Tesla stock, issued by Backed Assets (JE) Limited. Each token is designed to be backed 1:1 by the underlying share, allowing eligible holders to access Tesla price exposure through blockchain networks. Tesla's Q3 2026 deliveries reached 486,532 vehicles, while energy storage deployments reached 13.7 GWh. However, quarterly revenue was $28B and operating income declined 56% year over year. TOKENOMICS There is no traditional mining, staking reward or native token-burning mechanism here. Supply changes through issuance and redemption against underlying shares. The issuer describes 1:1 collateralization and segregated custody. Holders receive economic exposure, not Tesla shareholder voting rights. Issuance and redemption fees can reach 0.50%, while a management fee of up to 0.25% annually may be introduced. MACRO CONTEXT The latest US employment report showed 165,000 new jobs, strengthening expectations of tighter Fed policy. The dollar also strengthened and Treasury yields rose. For TSLAx, US equity sentiment and Tesla's own performance matter more directly than BTC or ETH movements. CHART OBSERVATION (4H) The chart shows a sharp breakdown from $414.55 to $336, followed by a bounce. Price remains below MA28 at $375.86 and the Bollinger middle band at $365.39. The immediate resistance zone is $364–$366, followed by $378.12. Support is around $344.26, then $336. INDICATORS RSI at 39.27 remains below neutral 50. MACD histogram has turned positive at 0.95, although DIF (-9.66) and DEA (-10.61) remain negative. This suggests selling momentum is easing, but bullish confirmation is missing. Price is also below the upper Bollinger resistance at $397.45. Treading scencerio Bullish scenario: The first condition I want to see is a convincing 4H candle close above $365–$366, preferably supported by stronger buying volume. An entry around $364–$366 would only make sense after a successful retest, rather than buying the first upward spike. Initial SL would be $356, below the short-term moving-average area. TP1 is $375.86, where MA28 creates an important resistance test. If buyers reclaim that level and maintain momentum, TP2 becomes $397.45, near the upper Bollinger Band. Invalidation comes from a failed reclaim followed by a sustained move below $356. I would not treat a brief move above $366 as sufficient confirmation. Bearish scenario: If price gets rejected around $364–$366 and subsequently loses $356, selling pressure could return. A failed retest around $354–$356 would offer a possible entry area, with SL around $366. TP1 is $344.26, the visible 24-hour low, while TP2 is $336, the previous swing low. These levels matter because a breakdown would suggest that buyers have failed to defend the recent bounce. Invalidation would be a sustained reclaim above $366 with stronger volume. If price remains between $356 and $366, I would rather wait than force either direction. PERSONAL INTERPRETATION I wouldn't chase this bounce. I want to see whether buyers can reclaim $365 and eventually challenge $375.86. Without that, the broader selling structure remains relevant. WHY THIS SETUP MATTERSThis is interesting because the token combines Tesla's traditional equity performance with blockchain-based trading access. The next move will show whether buyers are willing to absorb the previous selling pressure or whether this bounce is simply temporary relief. I'm more interested in confirmation than trying to catch the exact bottom. $TSLAXUSDT #ByXIMPACT

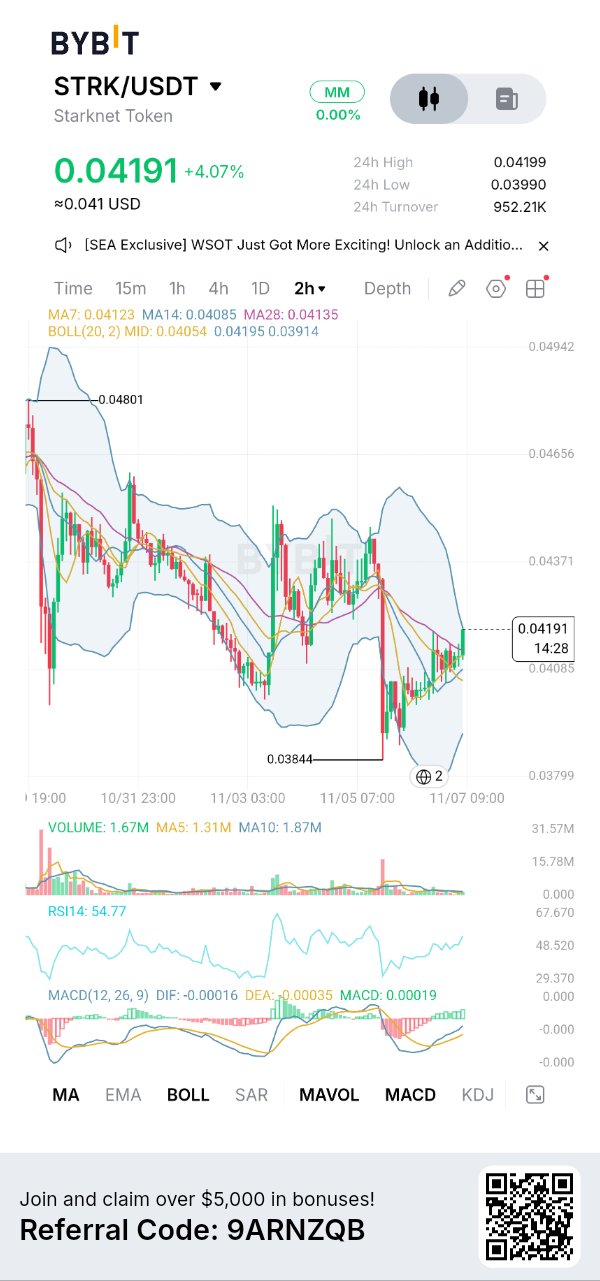
$STRKUSDT Buyers Are Regaining Short-Term Momentum, But the Bigger Trend Has Not Fully Turned. The interesting part of this chart is that STRK is showing improving short-term momentum after a sharp drop, but it is still trading inside a broader declining structure. On the 2-hour timeframe, price is $0.04191, up 4.07%, after reaching the marked low of $0.03844. The bounce is real, but it has not yet established a higher-timeframe trend reversal. WHAT I'M SEEING ON THE CHART The visible moving averages are MA7 at $0.04123, MA14 at $0.04085 and MA28 at $0.04135. Price is currently above all three, which supports the short-term buying case. Bollinger middle band is $0.04054, with the upper band at $0.04195 and lower band at $0.03914. RSI is 54.77, showing moderate positive momentum. MACD histogram is positive at 0.00019, while DIF remains below zero. Volume is 1.67M, above MA5 of 1.31M but below MA10 of 1.87M. This is improving momentum, not yet overwhelming buying pressure. CURRENT MARKET DATA The latest November 7 market snapshot puts STRK near $0.0412, with approximately $316M market cap and $27.2M 24-hour volume. Circulating supply is around 7.66B, against reported total supply of 10.18B. Price is up roughly 1.9% over 24 hours but down 7.3% over seven days and 16.7% over 30 days. The latest quote is below the screenshot's $0.04191. FUNDAMENTALS Starknet is an Ethereum Layer-2 scaling network using STARK-based zero-knowledge proofs. Its newer developments include STRK20 privacy features, private USDC transfers and strkBTC, bringing Bitcoin into Starknet DeFi. However, adoption still needs to translate into sustained economic activity. Current TVL is around $35.7M, stablecoins $35.1M and daily network fees approximately $1,783. TOKENOMICS AND MACRO: STRK supports network fees, governance and staking. Validators need 20,000 STRK, while delegators have no minimum. Staking rewards involve newly minted tokens, so supply expansion matters. There is also an upcoming unlock, but providers disagree: CoinGecko lists November 15 at 127M STRK, while another tracker lists November 20 at 175.4M. I would verify the official schedule before trading around it. Macro conditions remain difficult for altcoins. Bitcoin has traded near $75,800 amid ETF outflows, while stronger US employment data pushed Treasury yields higher. That creates a less supportive environment for speculative positions. CHART OBSERVATION (2H) STRK is showing a short-term bounce from $0.03844, but the broader structure still carries lower highs and previous selling pressure. Price at $0.04191 is above MA7 ($0.04123), MA14 ($0.04085) and MA28 ($0.04135), indicating improving short-term structure. However, $0.0420 is immediate resistance. A rejection could bring price back towards $0.04054, while a stronger breakout could open the way towards $0.0437. The next major resistance is around $0.0465. INDICATORS RSI at 54.77 shows moderate bullish momentum, not an overbought condition. MACD histogram is positive at 0.00019, suggesting improving momentum, although DIF remains slightly negative. Volume is 1.67M, above MA5 (1.31M) but below MA10 (1.87M), meaning buying activity is improving but confirmation is still limited. Bollinger Bands place price close to the upper band at $0.04195, making resistance important here. TRADING SCENARIOS: Bullish: Trigger: 2H close above $0.0420 with stronger volume. Entry: $0.0418–$0.0421 after retest. SL: $0.0405. TP1: $0.0437. TP2: $0.0465. Invalidation: failure to hold the breakout. Bearish: Trigger: rejection near $0.0420 followed by a break below $0.0405. Entry: $0.0404–$0.0406 on failed retest. SL: $0.0420. TP1: $0.03914. TP2: $0.03844. Invalidation: sustained reclaim above $0.0420. PERSONAL INTERPRETATION I'm interested in whether buyers can turn this short-term improvement into a sustained move. I wouldn't chase directly into $0.0420 because that is already a nearby resistance area. I want confirmation through a strong candle close and a successful retest. WHY THIS SETUP MATTERS The bigger question is whether STRK can build demand while its ecosystem develops and additional tokens enter circulation. A breakout would suggest buyers are absorbing supply despite the broader market pressure. A rejection would show that short-term momentum alone is not enough to change market structure. That's the distinction I'm watching before committing to a trade. $STRKUSDT #ByXIMPACT

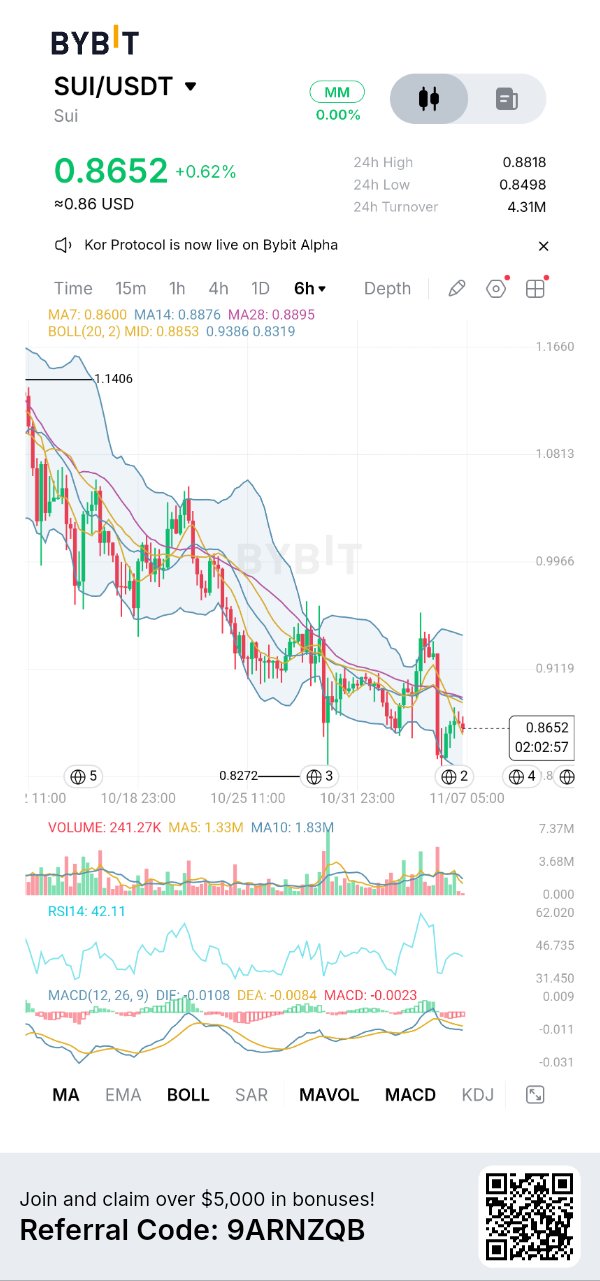
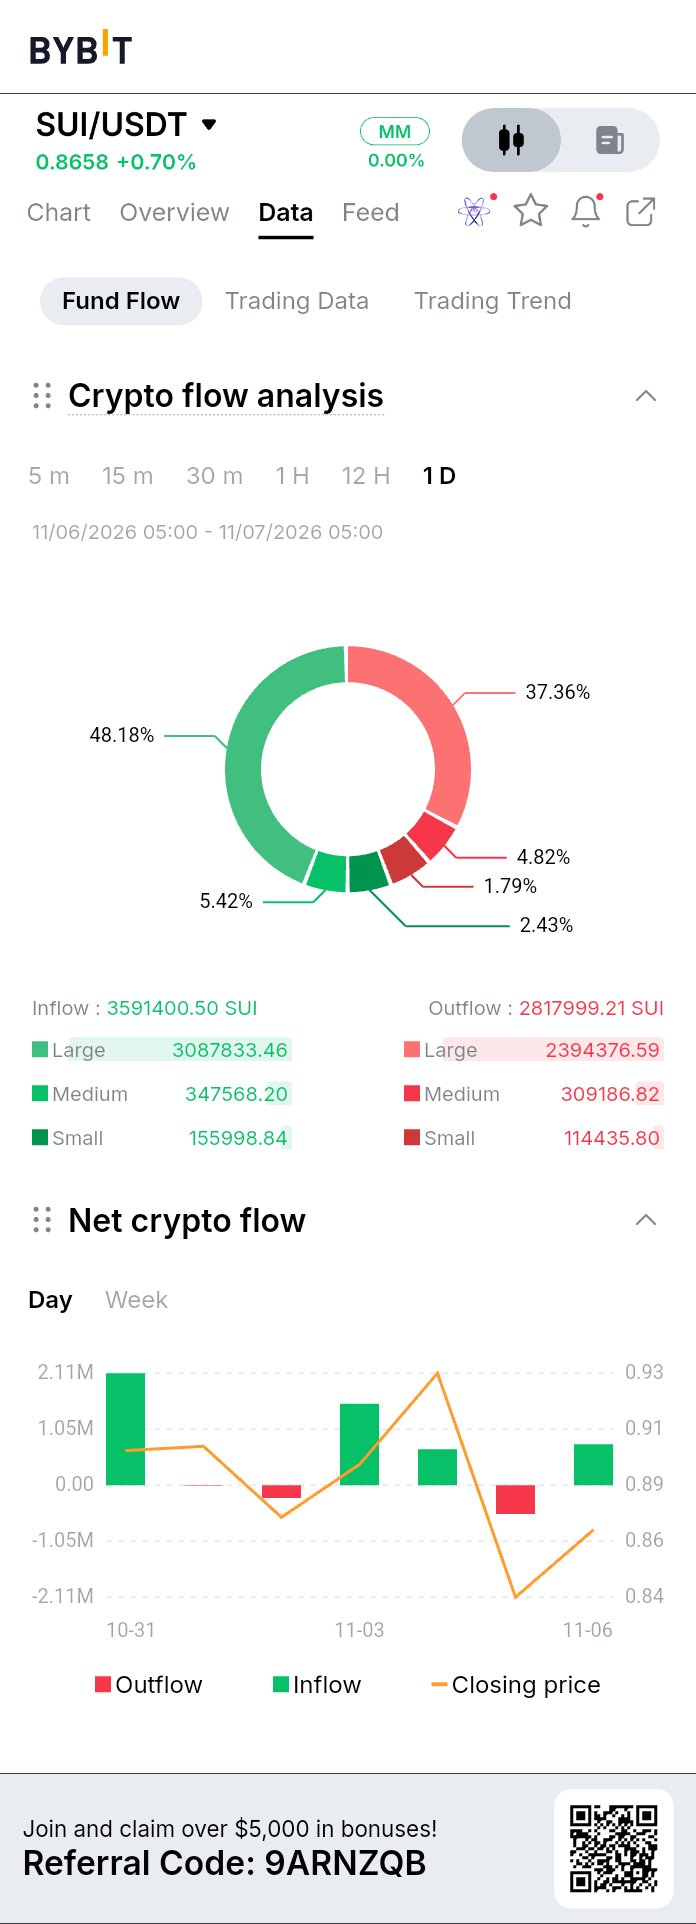
$SUIUSDT The Downtrend Is Still Intact Despite the Bounce. The first thing I notice is the contradiction between SUI recent bounce and its broader 6-hour structure. Price is trading at $0.8652, but the chart still shows a sequence of lower highs and lower lows after falling from approximately $1.14. The marked low is $0.8272. The recent move towards the $0.93 area was rejected, and price has moved back down. This is not confirmed trend reversal; sellers still have an advantage. WHAT I'M SEEING ON THE CHART The chart shows MA7 at $0.8600, MA14 at $0.8876 and MA28 at $0.8895. Bollinger Bands show a middle line at $0.8853, upper band at $0.9386 and lower band at $0.8319. RSI is 42.11, while MACD is slightly negative. The displayed volume is 241.27K. These readings suggest weak momentum rather than a confirmed bullish shift. CURRENT MARKET DATA As of November 7, SUI trades around $0.87, compared with $0.8652 in the screenshot. Market cap is approximately $3.6B, 24-hour volume around $280–295M and circulating supply about 4.14B out of 10B. Daily performance is slightly positive, but the weekly trend remains negative at roughly 3.5–4%. The difference between the screenshot and live quote is normal market movement, not a change in the chart's historical reading. FUNDAMENTALS Sui is a Layer-1 blockchain built around the Move programming language and an object-based data model, designed for efficient transactions and parallel execution. Its relevance comes from payments, DeFi, gaming and tokenized assets. Recent developments include Samsung Wallet's USDC integration, targeting 82 million US Galaxy devices, and expansion of institutional and real-world asset infrastructure. These are meaningful adoption opportunities, although partnerships alone do not guarantee demand for SUI. TOKENOMICS AND MACRO SUI has a fixed 10B maximum supply. It is used for gas, staking, liquidity and governance. Only around 41.4% is circulating, so future scheduled releases remain an important supply consideration. Staking can reduce freely available supply, but does not eliminate dilution from unlocks. The wider market is also not particularly supportive. Bitcoin recently faced ETF outflows and leveraged liquidations. Strong US employment data pushed Treasury yields and the dollar higher, increasing expectations of tighter Fed policy. That environment can restrict speculative buying in altcoins. Current network data shows approximately $441M in DeFi TVL and $507M in stablecoins, with stablecoin value up around 18% over seven days. That is encouraging for ecosystem activity, although TVL remains far below its previous peak CHART & INDICATORS The important resistance is $0.885–$0.890, where the moving averages and Bollinger middle band converge. Price remains below this area. RSI at 42.11 is below neutral 50, and the negative MACD histogram confirms that momentum has not turned convincingly bullish. Volume at 241.27K is also below the displayed volume averages. Support sits around $0.8498, followed by $0.832 and the marked swing low at $0.8272. TRADING PLAN Bullish scenario: Trigger: 6H candle closes above $0.890 with stronger volume. Entry: $0.885–$0.890 on a successful retest. SL: $0.865. TP1: $0.912. TP2: $0.938. Invalidation: price loses the reclaimed zone and closes back below $0.865. Bearish scenario: Trigger: rejection around $0.885 or a 6H breakdown below $0.8498. Entry: $0.849–$0.858 after a failed retest. SL: $0.890. TP1: $0.832. TP2: $0.8272. Invalidation: a sustained reclaim above $0.890. PERSONAL INTERPRETATION My read is that SUI has an interesting ecosystem story, but its chart has not caught up with that potential. I'm watching whether buyers can reclaim $0.89 rather than trying to predict a bottom. I wouldn't chase the current bounce. A confirmed reclaim with volume would make me consider a long position; losing $0.8498 would make me step aside and reassess. WHY THIS SETUP MATTERS What makes this SUI setup interesting is the gap between its developing ecosystem and its still-weak price structure. Network activity and stablecoin growth provide a fundamental reason to keep watching the project, but the token price has yet to show convincing buying strength. At the same time, price is approaching an important decision area between $0.849 and $0.890. A successful reclaim could indicate that buyers are finally absorbing selling pressure, while a breakdown could expose the $0.832–$0.827 support region again. This is not simply a question of whether SUI can bounce. It is about whether actual demand can begin changing the existing market structure. That confirmation, or failure to deliver it, is what makes this setup worth monitoring. $SUIUSDT #ByXIMPACT

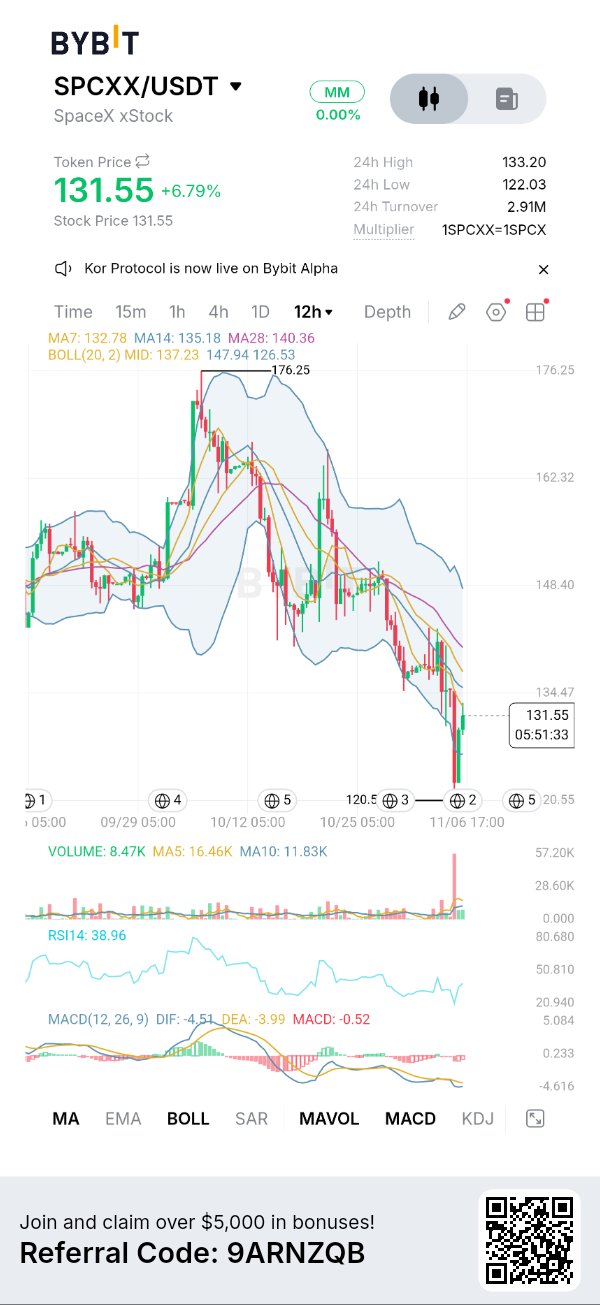
$SPCXXUSDT is showing a decent recovery after falling towards 120.50, but the price is still struggling to get back above its short-term moving averages. That makes the current move worth watching rather than treating it as a confirmed trend reversal. There is a difference between a temporary bounce and buyers actually taking control of the market. WHAT I'M SEEING ON THE CHART The uploaded Bybit Chart shows $SPCXXUSDT at 131.55, up 6.79%, with a 24-hour high of 133.20, low of 122.03 and turnover of 2.91M. The selected timeframe is 12 hours. The visible indicators show MA7 at 132.78, MA14 at 135.18 and MA28 at 140.36. Bollinger Bands show a middle line of 137.23, upper band of 147.94 and lower band of 126.53. RSI(14) is 38.96, while MACD reads DIF -4.51, DEA -3.99 and histogram -0.52. CURRENT MARKET DATA The latest available Bybit snapshot on November 6 shows SPCXX around $128.63, with a market capitalization of $77.72M and 24-hour volume of $15.98M. Circulating supply is approximately 604,180 tokens, while total supply is reported around 1.63M. The seven-day performance is approximately -6.4%. The live price is lower than the screenshot's 131.55 reading. Bybit +2 FUNDAMENTALS SpaceX is not simply a rocket company anymore. Its business includes reusable launch technology, Starlink satellite internet and expanding computing infrastructure. Its Q3 2026 results reported $14.6B revenue, up 161% year over year. This growth gives the underlying company an important business foundation beyond market speculation. TOKENOMICS SPCXX is issued by Backed Assets as a tokenized tracker certificate designed to provide 1:1 exposure to SpaceX shares. It is not direct share ownership and does not provide ordinary shareholder voting rights. There is no conventional staking reward or burn mechanism. Issuance and redemption can affect circulating supply, while fees can reach 0.50%. MACRO + MARKET CONTEXT Bitcoin recently traded around $75,960 and Ethereum around $2,238. Risk sentiment remains sensitive to technology-stock weakness and interest-rate expectations. The US 10-year yield was reported near 4.84%. This matters because SPCXX can be affected by both SpaceX's valuation and wider market liquidity. CHART AND INDICATORS On the 12-hour chart, the sequence of lower highs and lower lows remains a concern. MA7, MA14 and MA28 are all above price, showing that sellers still have the technical advantage. RSI at 38.96 reflects weak momentum, while negative MACD confirms that recovery strength is not yet established. The important resistance area is 133–137, followed by 140–140.5. Support is around 126.5, then 122–120.5. The large volume candle near the latest low deserves attention, but one spike alone cannot confirm accumulation. TRADING SCENARIOS Bullish setup: Trigger: 12H close above 137. Entry: 135–137 on retest. SL: 129. TP1: 140.5. TP2: 147–148. Invalidation: loss of 126.5. Bearish setup: Trigger: rejection around 133–137. Entry: 132–135 after confirmation. SL: 140.5. TP1: 126.5. TP2: 122–120.5. Invalidation: sustained acceptance above 140.5. MY TRADING PLAN I'm waiting for a 12H reclaim of 137 before considering a long position, ideally with a successful retest and stronger volume. My upside targets are 140.5 and 147–148, with invalidation below 126.5. If price gets rejected around 133–137, I'll avoid buying and watch 126.5 and 122 as downside levels. No confirmed breakout, no rushed entry. PERSONAL INTERPRETATION I'm keeping SPCXX on my watchlist, but I wouldn't rush into a position here. I want buyers to recover 137 and show that they can hold it. Without that confirmation, another move towards 126 or 122 remains possible. The reason I'm following this asset is the combination of SpaceX's expanding business and the difference between its underlying performance and the token's market behaviour. For now, patience makes more sense than forcing an entry. I'd rather miss the first part of a recovery than enter before the market gives a clearer signal. Educational analysis only not financial advice. $SPCXXUSDT #ByXIMPACT

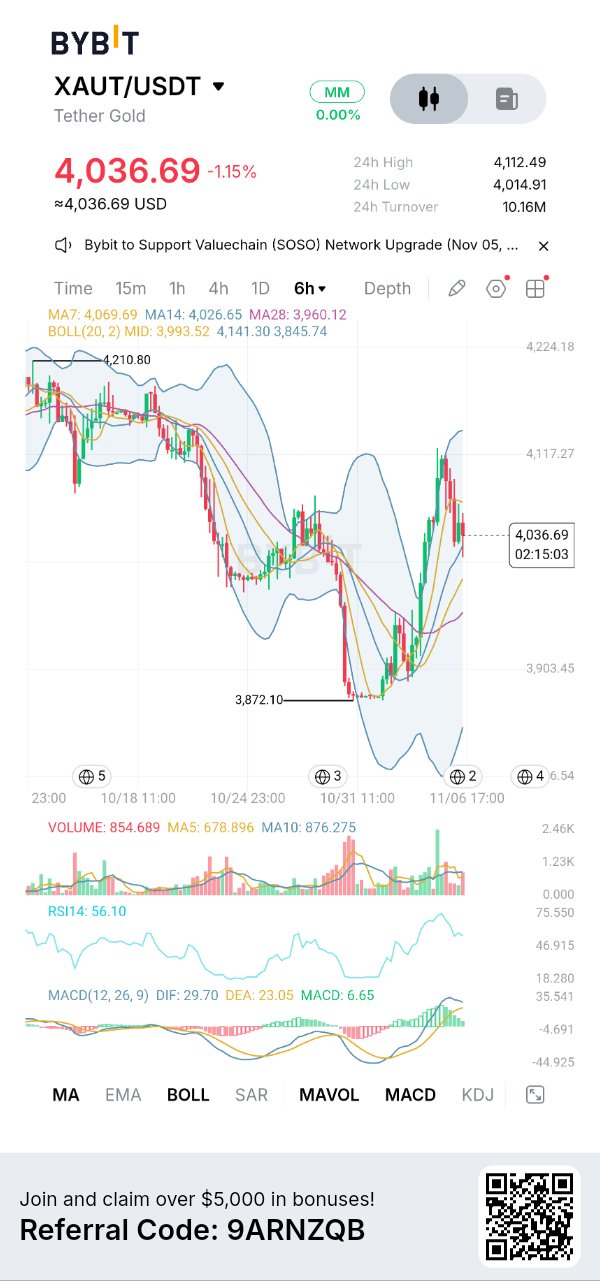
The interesting part of $XAUTUSDT is that the market has already delivered a strong recovery from $3,872.10, but the latest candles show sellers pushing back near $4,117. This creates an important contradiction: the recovery structure is improving, yet buyers haven't proved they can hold the higher prices. On the uploaded Bybit 6H chart, $XAUTUSDT is trading at $4,036.69, down 1.15%. The visible 24-hour high is $4,112.49, low $4,014.91 and turnover 10.16M. The chart marks a previous high around $4,210.80 and a major swing low at $3,872.10. The displayed MA values are MA7 $4,069.69, MA14 $4,026.65 and MA28 $3,960.12. Bollinger values are middle $3,993.52, upper $4,141.30 and lower $3,845.74. RSI14 reads 56.10. MACD shows DIF 29.70, DEA 23.05 and histogram 6.65. Visible volume is 854.689, against MA5 678.896 and MA10 876.275. The latest market snapshot is different from the Bybit screenshot: CoinGecko reports approximately $4,031.91, a $3.26B market cap, roughly $331.9M in 24-hour volume and 808,994 circulating XAUT, against 827,417 total supply. These are aggregator figures, not Bybit-specific turnover. CoinGecko +1 The small price difference reflects different exchange feeds and timestamps. XAUT is Tether Gold rather than a conventional speculative utility coin. Each token represents ownership of one fine troy ounce of physical gold held in Swiss vaults. Its appeal is combining gold exposure with blockchain transfers, divisibility and exchange liquidity. Demand is therefore linked more directly to gold ownership and tokenized real-world assets than to typical DeFi speculation. Its economics are unusual: there is no fixed maximum supply or conventional halving schedule. Tokens are minted when additional gold is deposited and burned when gold is redeemed. The circulating and total supply difference matters because treasury-held tokens are not necessarily active market supply. CoinGecko currently reports 808,994 circulating against 827,417 total. The macro picture is mixed. On November 6, stronger US employment data pushed the dollar higher and increased expectations of tighter Federal Reserve policy, putting pressure on non-yielding gold. Reuters reported spot gold near $4,047.10, down around 1% that day, despite a strong weekly recovery. Reuters +1 This matters more to XAUT than ordinary BTC-led crypto sentiment. Technically, the recovery from $3,872.10 has shifted the short-term structure upward. Price reclaimed the Bollinger midpoint and MA28, but is now below MA7. The $4,026–$3,993 area is the first important support cluster. Below that, $3,960 and $3,903 become important, followed by $3,872. On the upside, $4,070, $4,112–$4,117 and $4,141 are the resistance areas to watch. A break above them could open a move toward $4,210. RSI at 56.10 shows positive but not overheated momentum. MACD remains bullish, with DIF above DEA, although the histogram suggests momentum needs monitoring. Volume at 854.689 is above its five-period average but below its ten-period average. Bollinger Bands show room in both directions. KDJ values are not visible, so I won't assign them. My bullish scenario is a 6H close above $4,070 followed by a successful retest: entry $4,055–$4,075, SL $4,020, TP1 $4,117, TP2 $4,141. Invalidation is a failed reclaim followed by a decisive loss of $4,020. Bearish scenario: a 6H close below $3,993 and failed retest; entry $3,985–$3,995, SL $4,035, TP1 $3,960, TP2 $3,903. These are conditional setups, not active signals. My plan is to wait for confirmation rather than chase the recent rebound. I'd risk no more than 0.5–1% of trading capital on a setup, size the position around the stop distance and take partial profits at the first target. Tether's March 2026 reserve report confirms the physical-gold backing structure, while redemption, issuer and custody risks remain important. What makes this setup interesting is the connection between gold's macro-driven volatility and XAUT improving six-hour structure. I'm watching whether buyers defend $3,993 and reclaim $4,070. If they do, the recovery has room to develop; if support fails, the recent bounce could become another lower high. That's the confirmation that will decide my next move. $XAUTUSDT #ByXIMPACT

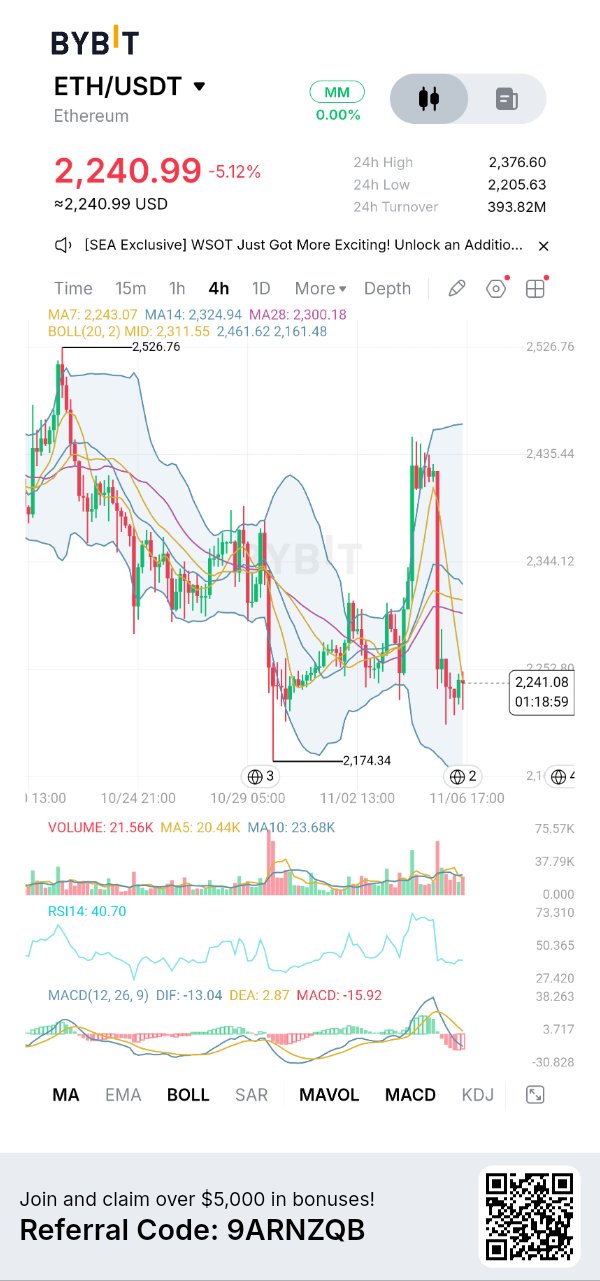
$ETHUSDT The $2,174 Support Is Becoming the Most Important Level to Watch.Ethereum is showing a clear difference between buying interest at lower prices and an actual market recovery. The rebound from $2,174.34 attracted buyers, but ETH remains below its short-term averages and Bollinger middle band. A genuine recovery requires higher lows, stronger momentum and a reclaim of resistance. Bybit's 4H chart records $ETHUSDT at $2,240.99, down 5.12%. The 24-hour high is $2,376.60, low $2,205.63 and turnover $393.82M. MA7 stands at $2,243.07, MA14 at $2,324.94 and MA28 at $2,300.18. Bollinger Bands show a middle line of $2,311.55, upper band $2,461.62 and lower band $2,161.48. The swing low is $2,174.34. RSI14 reads 40.70, while MACD shows DIF -13.04, DEA 2.87 and histogram -15.92. These are screenshot readings, not live figures. Market data on November 6 places ETH around $2,221–$2,227, with a market cap of $271–272B, 24-hour volume of $17.5–19.2B and circulating supply near 122.19M ETH. The daily decline is approximately 8%. Ethereum powers DeFi, stablecoins, smart contracts, tokenization and thousands of applications. Its upcoming Glamsterdam upgrade aims to improve Layer-1 efficiency through parallel processing, block-level access lists and enshrined proposer-builder separation. However, Hoodi testnet activation was postponed on October 22, making its timeline worth monitoring. ETH has no predetermined maximum supply. New tokens enter circulation through staking rewards, while EIP-1559 burns part of transaction fees. Network activity influences this balance: higher usage can increase burning, while quieter periods may leave issuance above burns. Staking locks substantial ETH, but withdrawals remain possible. Ethereum also has no conventional corporate treasury or scheduled venture-style token unlock calendar. Broader market pressure is adding risk. Bitcoin retreated toward $75,200 following the technology-stock selloff, while over $1B in leveraged crypto positions were liquidated, predominantly longs. US employment data showed 165,000 additional jobs and 4.1% unemployment. Markets increased expectations of a December Fed rate hike, making speculative assets more sensitive to liquidity and sentiment. On the 4H chart, ETH has struggled to establish higher highs after rejection near $2,435. The $2,205–$2,174 region is immediate support. A breakdown exposes the lower Bollinger boundary near $2,161. Upside resistance begins at $2,253, followed by $2,300–$2,325. Reclaiming this entire region would offer stronger evidence of recovery. RSI at 40.70 remains below neutral, while MACD's -15.92 histogram confirms bearish momentum. Volume at 21.56K is below its MA10 of 23.68K. Price also remains below the Bollinger midpoint. KDJ is not selected, so no values are assumed. TRADING SCENARIOS Bullish setup: A confirmed 4H close above $2,325 could create a recovery opportunity. Consider entry around $2,300–$2,325 after a successful retest. SL: $2,252 | TP1: $2,376 | TP2: $2,435. Bearish setup: A confirmed breakdown below $2,205, followed by a failed retest around $2,205–$2,220, could offer a short opportunity. SL: $2,253 | TP1: $2,174 | TP2: $2,161. A sustained reclaim of $2,253 invalidates the immediate bearish setup. MY TRADING PLAN Capital protection comes first. I'd risk only 0.5–1% per trade, calculate position size using the actual stop distance and wait for a confirmed 4H breakout or breakdown. Partial profits at TP1 would reduce exposure, while the remaining position could target TP2. If the reward doesn't justify the risk, there's no reason to force an entry. PERSONAL INTERPRETATION The next few 4H candles are critical. I want to see buyers defend $2,200 and gradually recover $2,300. Stronger volume alongside improving RSI and MACD would make the recovery more convincing. Without confirmation, staying on the sidelines is reasonable. Ethereum ecosystem continues developing while its price struggles under broader financial pressure. This highlights the difference between long-term network strength and short-term speculative demand. Reclaiming resistance could improve the technical picture, but losing $2,174 would expose further weakness. $ETHUSDT #ByXIMPACT

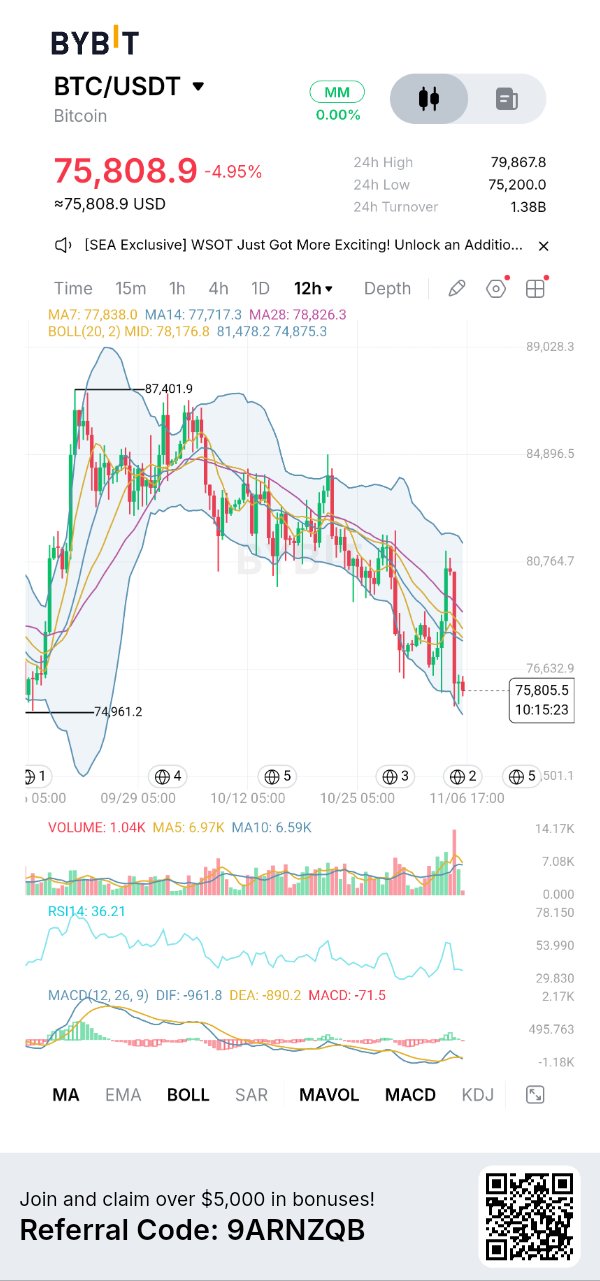
Bitcoin ( $BTCUSDT ) Is $75K Becoming a Recovery Zone or the Next Breakdown Point? What stands out to me is that Bitcoin is approaching an important support area while momentum remains weak. The interesting part is that price is near the lower Bollinger Band, but there is still no confirmed reversal. This is where patience matters more than prediction. WHAT I'M SEEING ON THE CHART The uploaded Bybit screenshot shows $BTCUSDT at $75,808.9, down 4.95%, on the 12H timeframe. The visible 24H high is $79,867.8 and low is $75,200, with turnover of 1.38B USDT. MA7 is 77,838, MA14 is 77,417.3 and MA28 is 78,826.3. Bollinger levels are 78,176.8 (middle), 81,472.8 (upper) and 74,875.3 (lower). RSI14 reads 36.21, while MACD is negative. CURRENT MARKET DATA Latest market feeds on November 6 show BTC around $75,500–$76,000, with approximately $1.52T market capitalization, $42–49B 24H volume and 20.105 million BTC circulating. The live price differs slightly from the screenshot because market prices update continuously. BTC remains significantly below its October 2025 all-time high. FUNDAMENTALS Bitcoin is a decentralized peer-to-peer monetary network secured through proof-of-work. Its importance comes from censorship-resistant settlement, limited issuance and growing institutional access. However, strong long-term fundamentals do not automatically prevent short-term corrections. TOKENOMICS Bitcoin has a maximum supply of 21 million. Approximately 95.7% has already been issued. Mining currently rewards 3.125 BTC per block, following the April 2024 halving. The next scheduled halving is expected around 2028. There is no conventional vesting unlock schedule or centralized treasury. MACRO + MARKET CONTEXT The current weakness is connected to broader risk-off sentiment. US technology stocks sold off sharply, while spot Bitcoin ETFs recorded $430.2M in net outflows. More than $1B in leveraged crypto positions were liquidated. The Fed's latest target range is 3.75–4.00%, making liquidity expectations relevant. CHART OBSERVATION The 12H structure remains bearish, with lower highs and lower lows. Price is below all three moving averages, showing sellers still control the trend. The $74,960–$74,875 region is the immediate support area. A recovery toward $77,400–$78,200 is needed before the structure starts improving. The $80,765 region is the next major resistance. INDICATORS RSI at 36.21 indicates weak momentum, but not a confirmed oversold reversal. MACD shows DIF at -961.8, DEA at -890.2 and histogram at -71.5, reflecting bearish momentum. Price is close to the lower Bollinger Band, which can attract buyers, but a band touch alone is not a buy signal. TRADING SCENARIO Bullish: Trigger: 12H reclaim and hold above $77,400–$78,200. Entry: $77,400–$78,000 after confirmation. SL: $75,800. TP1: $80,765. TP2: $84,900. Invalidation: rejection followed by a fresh breakdown below support. Bearish: Trigger: 12H close below $74,875. Entry: failed retest around $74,900–$75,200. SL: $76,650. TP1: $72,000. TP2: $70,500. Invalidation: strong reclaim of $77,400. MY TRADING PLAN I would avoid entering blindly at current levels. I'd wait for a confirmed support reaction or a failed retest before considering a position. Position size should remain small during this volatility, with predefined risk and partial profit-taking. PERSONAL INTERPRETATION My read is that Bitcoin is at an interesting decision point, not an obvious buying opportunity. I'm watching whether buyers can defend $75K and reclaim the moving-average cluster. I wouldn't chase a bounce without confirmation. WHY THIS SETUP MATTERS This is a test of whether Bitcoin can establish a floor after a broader risk-off move. A successful reclaim could create a meaningful recovery opportunity, while a confirmed breakdown could extend the correction. The next 12H closes matter more than guessing the bottom. $BTCUSDT #ByXIMPACT

What makes $LAVAUSDT interesting right now is the difference between its strong recovery structure and the momentum beginning to slow near the recent highs. Price has climbed considerably from its October low, but the latest candles are consolidating around $0.015 rather than pushing decisively higher. I find this more interesting than the small 0.13% gain because the next move could show whether buyers are still accumulating or early buyers are starting to take profits. WHAT I'M SEEING ON THE CHART The Bybit 4H chart shows LAVA at $0.01502, up 0.13%, with a 24-hour high of $0.01518 and low of $0.01470. Bollinger Bands are 0.01533 (upper), 0.01467 (middle) and 0.01400 (lower). RSI is 66, MACD DIF is 0.00028 and DEA is 0.00029, with a nearly flat, slightly negative histogram. Volume is 3.13M. The previous major low is around $0.01086. CURRENT MARKET DATA: The screenshot is a point-in-time snapshot. Retrieved market feeds place LAVA around $0.01494–$0.01500. DefiLlama reports approximately $9.36M market cap, $14.14M FDV, 632.96M circulating tokens and $437K 24-hour volume. CoinGecko shows +6.8% over seven days and +16.9% over 30 days. Supply figures vary between providers. FUNDAMENTALS: Lava Network focuses on blockchain data access through a decentralized RPC network connecting applications, wallets and developers with node providers. It aims to improve response speed, reliability and availability. Providers stake LAVA and earn rewards for delivering services. Real network usage and paid demand will be important for long-term growth. TOKENOMICS: LAVA has a maximum supply of 1 billion tokens. Allocation includes 31% for R&D and ecosystem growth, 27% for core contributors, 17% for early backers, 15% for future initiatives, 6.6% for provider drops and 3.4% for validator rewards. One tracker lists approximately 21.4M LAVA unlocking on November 30, around 2.1% of maximum supply. I would monitor circulating supply and exchange deposits. MACRO + MARKET CONTEXT: BTC and ETH weakness, inflation concerns and borrowing costs can affect altcoin liquidity. Even a strong small-cap recovery may struggle when broader market sentiment weakens. CHART OBSERVATION: The 4H structure remains bullish, with higher highs and higher lows since $0.01086. MA7 at $0.01491 and MA14 at $0.01482 remain above MA28 at $0.01444. However, resistance around $0.01518–$0.01533 needs to be reclaimed. INDICATORS: RSI at 66 shows positive momentum. MACD is nearly flat, with DIF slightly below DEA. Price is approaching the upper Bollinger Band, while volume at 3.13M has not confirmed a strong breakout. This suggests consolidation rather than clear acceleration. TRADING SCENARIOS: For a bullish setup, I want a 4H close above $0.01533 followed by a successful retest. Entry: $0.01520–$0.01535. SL: $0.01465. TP1: $0.01580. TP2: $0.01619. For a bearish setup, a 4H close below $0.01467 would weaken the recovery. Entry: $0.01450–$0.01465 after a failed retest. SL: $0.01520. TP1: $0.01400. TP2: $0.01321. These remain conditional scenarios, not confirmed signals. PERSONAL INTERPRETATION My plan is to wait rather than chase LAVA around $0.015. I want to see buyers defend $0.01467 and reclaim $0.01533 with stronger volume. If momentum continues fading, I would rather stay out and wait for the next support reaction. What makes this setup interesting is that the recovery is technically healthy, but MACD momentum, overhead resistance and upcoming supply releases create reasons to remain selective. I want confirmation from both price and volume before committing capital. WHY THIS SETUP MATTERS: This is an important test of whether LAVA's recovery has enough buying strength to continue beyond its current resistance. The reaction around $0.01467 and $0.01533 could help establish whether the next move is a continuation or a deeper pullback. $LAVAUSDT #ByXIMPACT
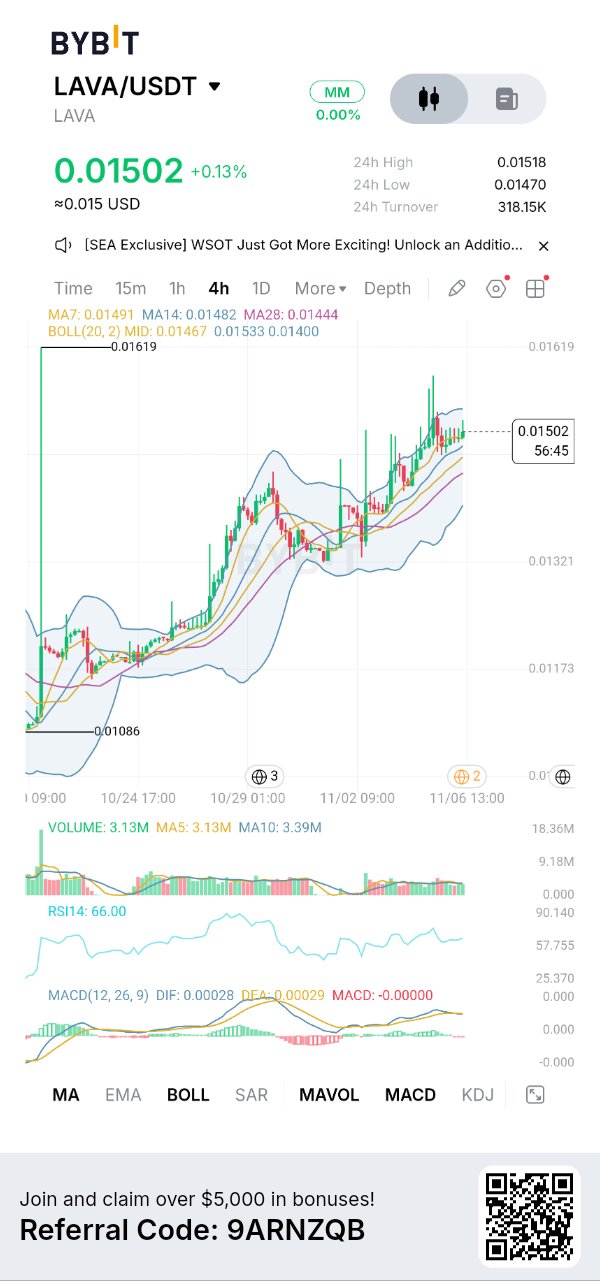

SOL is showing an interesting change in its weekly structure. After recovering from the $60.11 low and climbing towards $113, price has started pulling back to $89.54. The previous recovery brought SOL above its longer-term moving averages, but the latest candles are testing that strength again. RSI has cooled to 45.17, while MACD remains slightly positive. To me, this is an important test of whether the recovery can hold or sellers will take control. The Data Behind This Move The Bybit chart shows $SOLUSDT at $89.54, down 6.64%, with a 24H high of $97.09, low of $88.30 and turnover of 86.10M. The selected timeframe is 1W. The chart marks a previous high of $295.73 and a low of $60.11. MA7 is $106.36, MA14 is $100.68 and MA28 is $89.63. Bollinger middle, upper and lower bands are $93.31, $125.64 and $60.98. CURRENT MARKET DATA As of November 6, SOL is around $89.5–$90, with market capitalization near $52.9B, 24H volume around $4.6B and circulating supply of approximately 590.28M SOL. Total supply is around 637.07M, with no fixed maximum supply. SOL is down approximately 7.9% over seven days and 26% over the last month. These figures differ from the Bybit screenshot. FUNDAMENTALS Solana is a high-performance blockchain designed for fast transactions and low fees. It supports DeFi, NFTs, gaming, payments and tokenized real-world assets. In Q2 2026, Solana recorded $3.6B in RWA value and $16.3B in stablecoin supply, while tokenized equity trading volume reached $8.8B. This shows ecosystem activity, although activity alone does not guarantee SOL price growth. TOKENOMICS SOL has an inflation-based supply model. Its initial annual inflation rate was 8%, declining by 15% yearly until reaching a long-term rate of 1.5%. Staking helps secure the network and rewards participants. Also, 50% of base transaction fees are burned, while priority fees go to validators. Ongoing token issuance still needs to be considered. MACRO + MARKET Bitcoin has fallen towards $75K–$76K, while Ethereum is around $2,200–$2,250. Weakness in US technology stocks has also affected crypto sentiment. The Fed's latest policy target remains 3.75%–4.00%, while the US 10-year Treasury yield is around 4.90%. This environment makes recovery harder for altcoins without broader market support. CHART + INDICATORS On the weekly chart, SOL has fallen considerably from its $295.73 high. After finding support around $60.11, buyers recovered price towards $113, but the latest candles show another pullback. Price is below MA7 at $106.36 and MA14 at $100.68, while MA28 at $89.63 is almost equal to current price. The Bollinger middle band at $93.31 is an important recovery level. RSI14 is 45.17, showing weakening momentum but not oversold conditions. MACD remains slightly positive, with DIF at 2.05, DEA at 1.51 and histogram at 0.53. Weekly volume is 3.09M, above MA5 at 2.77M but below MA10 at 3.40M. The recovery has lost strength, although momentum has not completely turned negative. BULLISH SCENARIO I want SOL to defend $88–$90 and reclaim $93.31 with stronger volume. Trigger: Weekly recovery above $93.31. Entry: $93–$96 after confirmation. SL: $87. TP1: $100.68. TP2: $106.36. Reclaiming the moving averages would show buyers returning. BEARISH SCENARIO If SOL breaks below $88 and fails to recover, further weakness could develop. Trigger: Confirmed breakdown below $88. Entry: $86–$88 after a failed retest. SL: $93.50. TP1: $80. TP2: $70. These are projected targets, not confirmed support levels. A sustained recovery above $93.31 would weaken this setup. MY TRADING PLAN I'm watching $88–$90 because it is near weekly MA28. I don't want to enter just because SOL has fallen. I want to see buyers defend this area and price recover above $93.31. If support fails, I'll wait for a retest rather than rush into a position. MY INTERPRETATION The part I find interesting is that MACD is still positive while RSI has dropped below 50 and price is trading below the shorter moving averages. This shows that the previous recovery has lost momentum, but the weekly indicators have not completely confirmed a bearish reversal. WHY THIS SETUP MATTERS For me, $88–$90 is the area that deserves attention. Holding it could give SOL an opportunity to rebuild its weekly structure, while losing it would make the previous recovery look weaker. I'm more interested in seeing how buyers react around this level than trying to predict the next big move. $SOLUSDT #ByXIMPACT