QUICK
1351Like0Shares44Fans68Follow
🚀 Crypto Market Analyst | 📊 Technical Analysis | 🔥 Bullish & Bearish Signals | 📈 Spotting Opportunities | Knowledge • Discipline • Consistency.
🚀 Crypto Market Analyst | 📊 Technical Analysis | 🔥 Bullish & Bearish Signals | 📈 Spotting Opportunities | Knowledge • Discipline • Consistency.
xmlmusdt
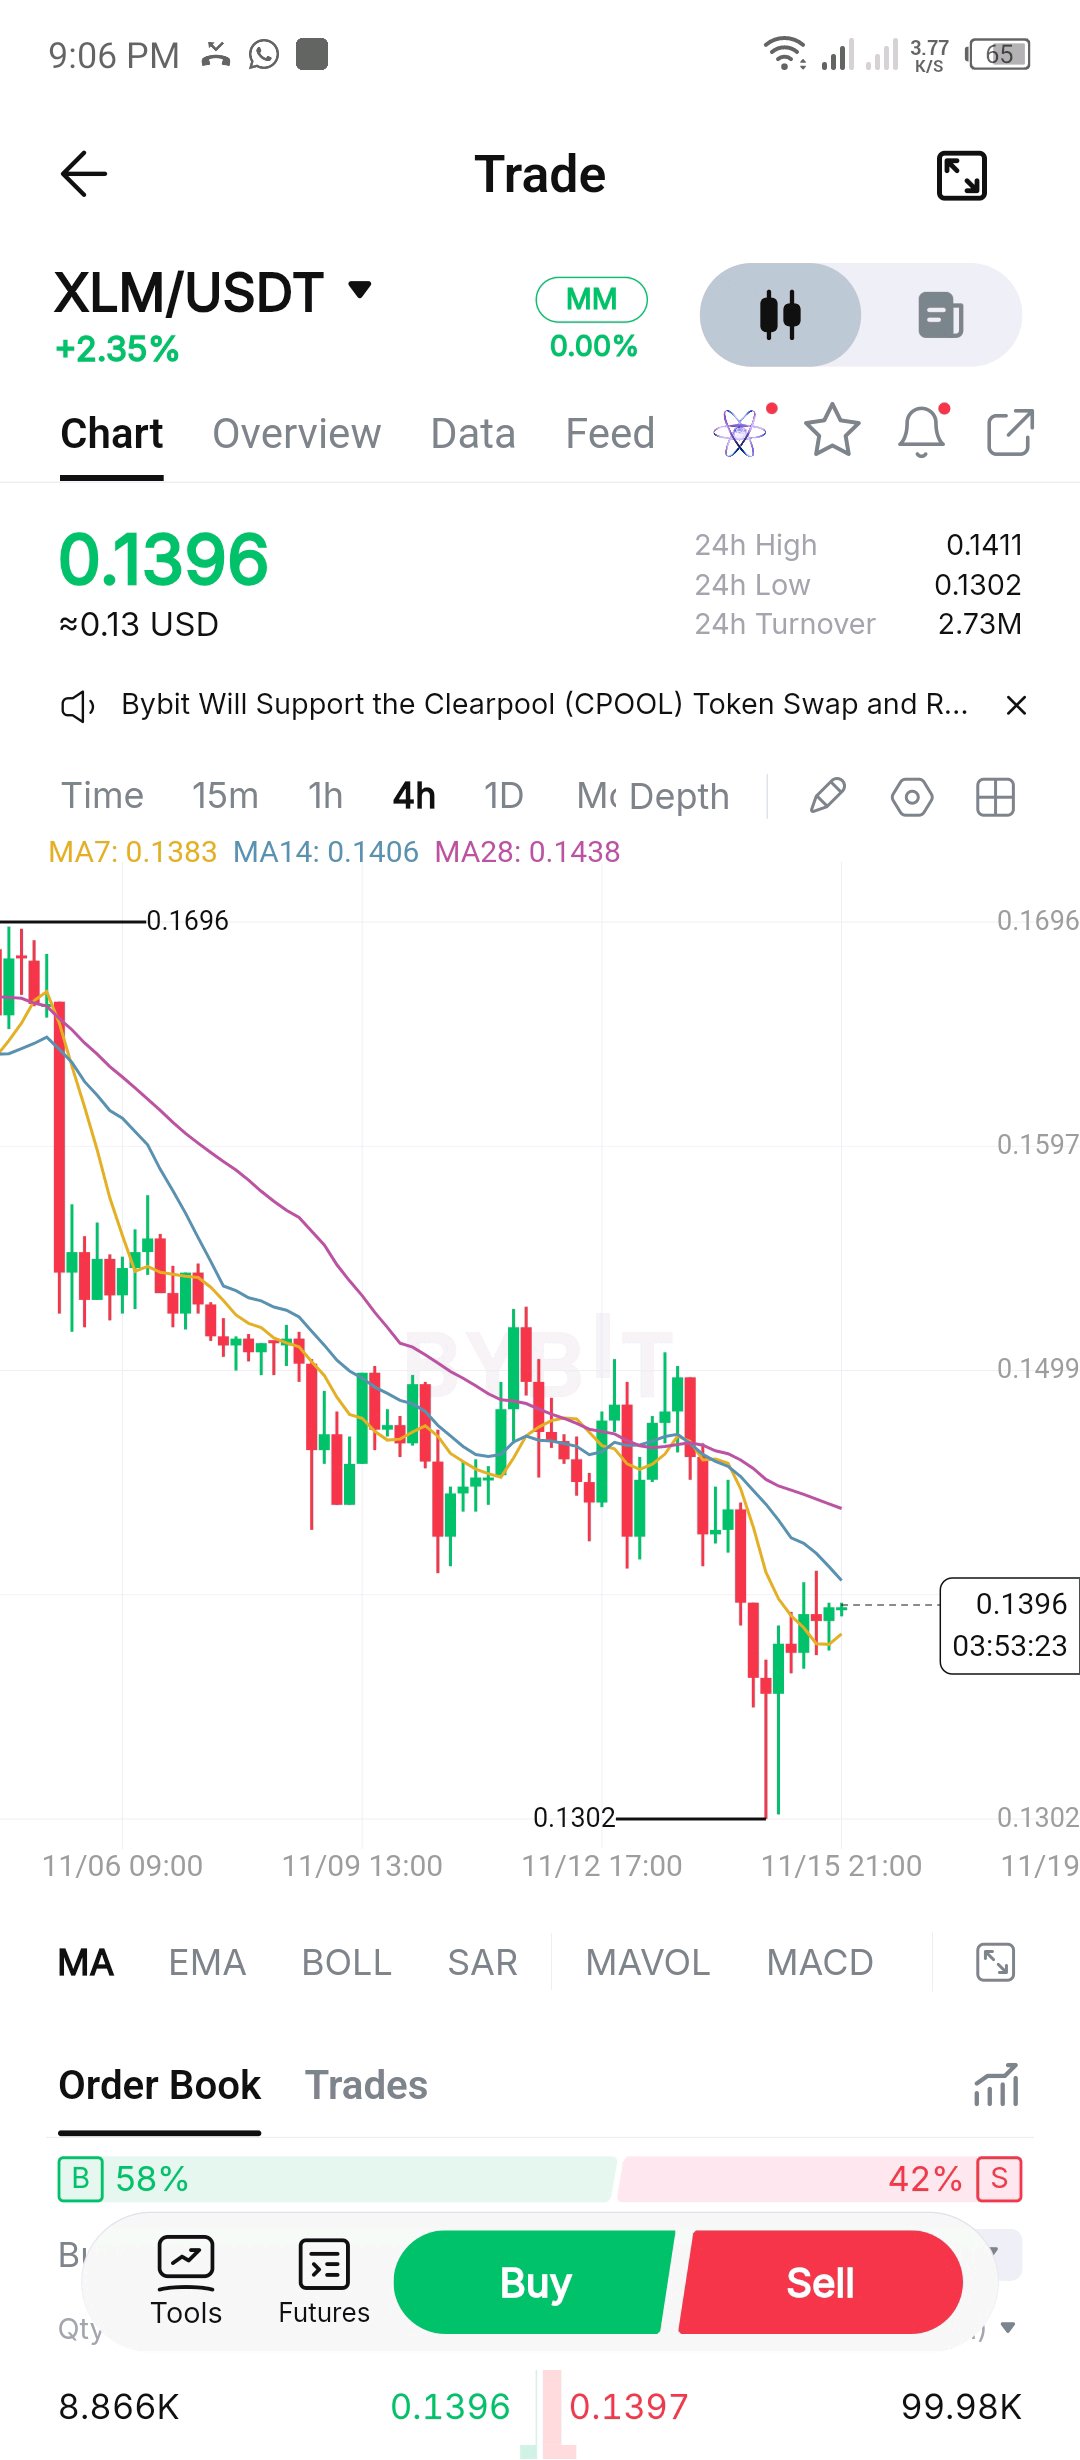
$XLMUSDT $XLMUSDT Technical Analysis Timeframe: 4H Current Price: $0.1396 24H Change: +2.35% 1. Market Trend The overall trend is still BEARISH (DOWN). MA7: 0.1383 MA14: 0.1406 MA28: 0.1438 The price is above MA7 but below MA14 and MA28. This suggests a short-term recovery inside a larger downtrend. 2. Support Levels $0.1380 – Immediate support $0.1350 – Secondary support $0.1302 – Major support 3. Resistance Levels $0.1406 – First resistance $0.1438 – Strong resistance $0.1499 – Major resistance 4. Possible Market Direction Bullish scenario: If XLM breaks and closes a 4H candle above $0.1406, it could move towards $0.1438. Bearish scenario: If price gets rejected around $0.1406, it could fall towards $0.1380 and $0.1350. 5. My Trading Bias SHORT-TERM: Slightly bullish recovery. OVERALL: Bearish. My preference is to wait for confirmation before entering a trade. Avoid rushing into BUY or SELL. A breakout confirmation is important. Verdict: DOWN bias until XLM breaks above $0.1438 convincingly. #IMPACTbyTrade
dogeusdt
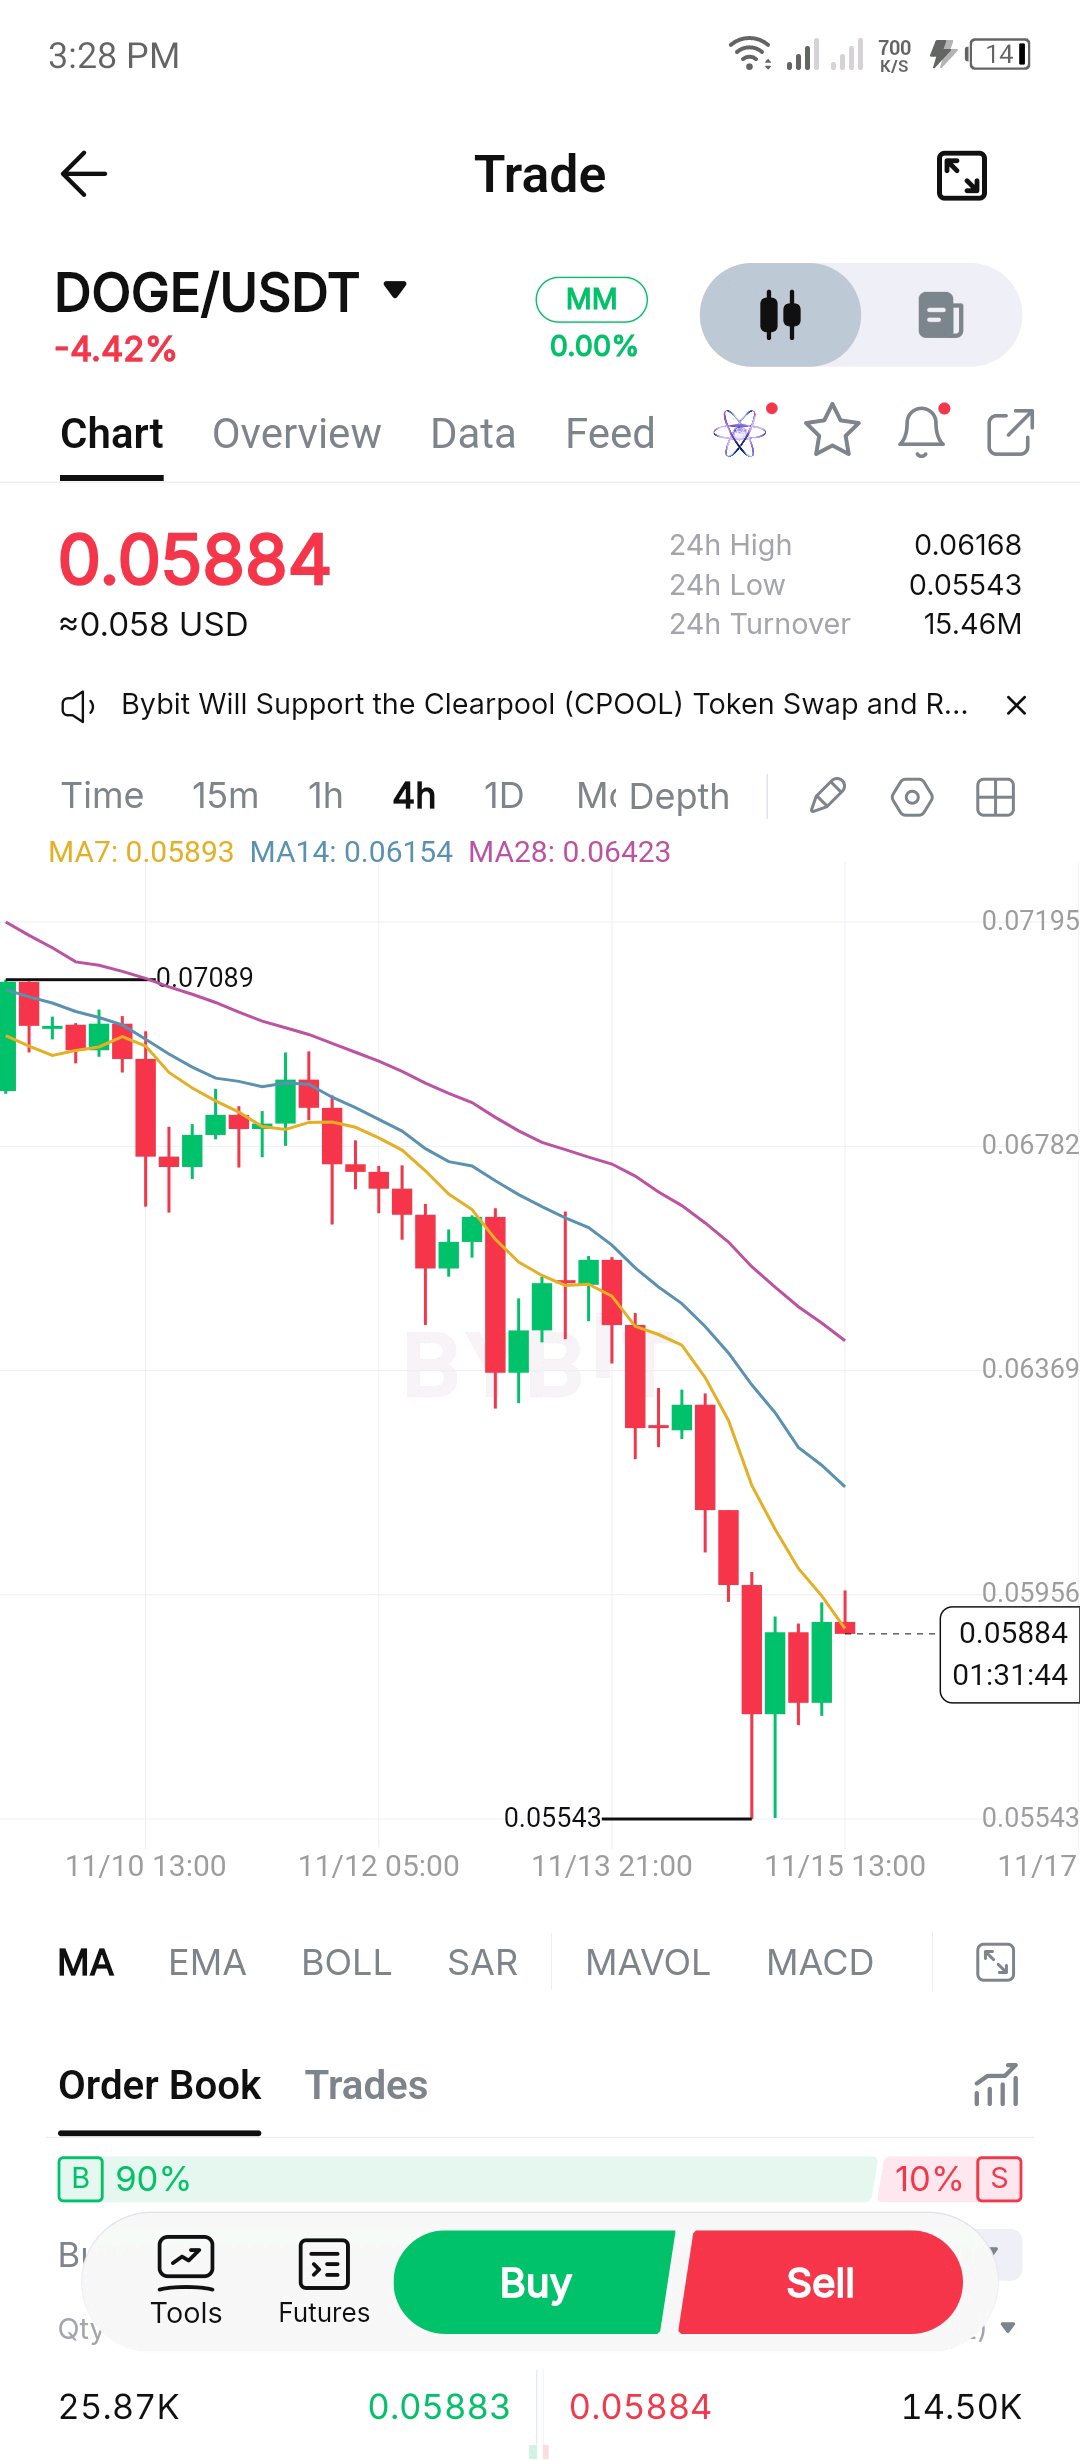
$DOGEUSDT – Detailed Technical Analysis Timeframe: 4H (4-hour chart) 1. Market Structure DOGE/USDT is currently in a strong bearish trend. The chart shows a sequence of lower highs and lower lows. The price has fallen from approximately 0.07089 to 0.05543, indicating significant selling pressure. Currently, DOGE is trading around 0.05884, following a small bullish recovery. 2. Moving Average Analysis Your chart shows: Indicator Value MA7 0.05893 MA14 0.06154 MA28 0.06423 Interpretation: MA7 is below MA14. MA14 is below MA28. Price is below all three moving averages. This is a bearish moving-average alignment. It suggests sellers are still controlling the market. 3. Support Levels These are important price levels to watch: Support Price Support 1 0.05700 Support 2 0.05543 Support 3 0.05350 If sellers break 0.05543 convincingly, further downside may follow. 4. Resistance Levels Resistance Price Resistance 1 0.05950 Resistance 2 0.06154 Resistance 3 0.06423 The 0.05950 area is particularly important because it is close to the MA7. A strong 4H candle closing above this level could indicate improving bullish momentum. 5. Bullish Scenario DOGE could start recovering if: Buyers defend 0.05700. Price breaks 0.05950. A 4H candle closes above resistance. Buying volume increases. Possible upside targets: 0.06150 0.06300 0.06420 6. Bearish Scenario DOGE could continue falling if: Price fails to break 0.05950. Sellers regain control. Price breaks below 0.05700. Possible downside targets: 0.05543 0.05350 7. Trading Decision Trading Direction My View BUY / LONG Wait for confirmation SELL / SHORT More favourable technically Overall Trend Bearish Short-term Movement Small bullish recovery Medium-term Trend Bearish 8. Final Verdict My current bias is SHORT (DOWN) The overall 4H structure remains bearish despite the recent recovery. However, I would not recommend entering a SHORT position blindly at 0.05884. Wait for rejection around 0.05950 or a confirmed breakdown below 0.05700. #IMPACTbyTrade
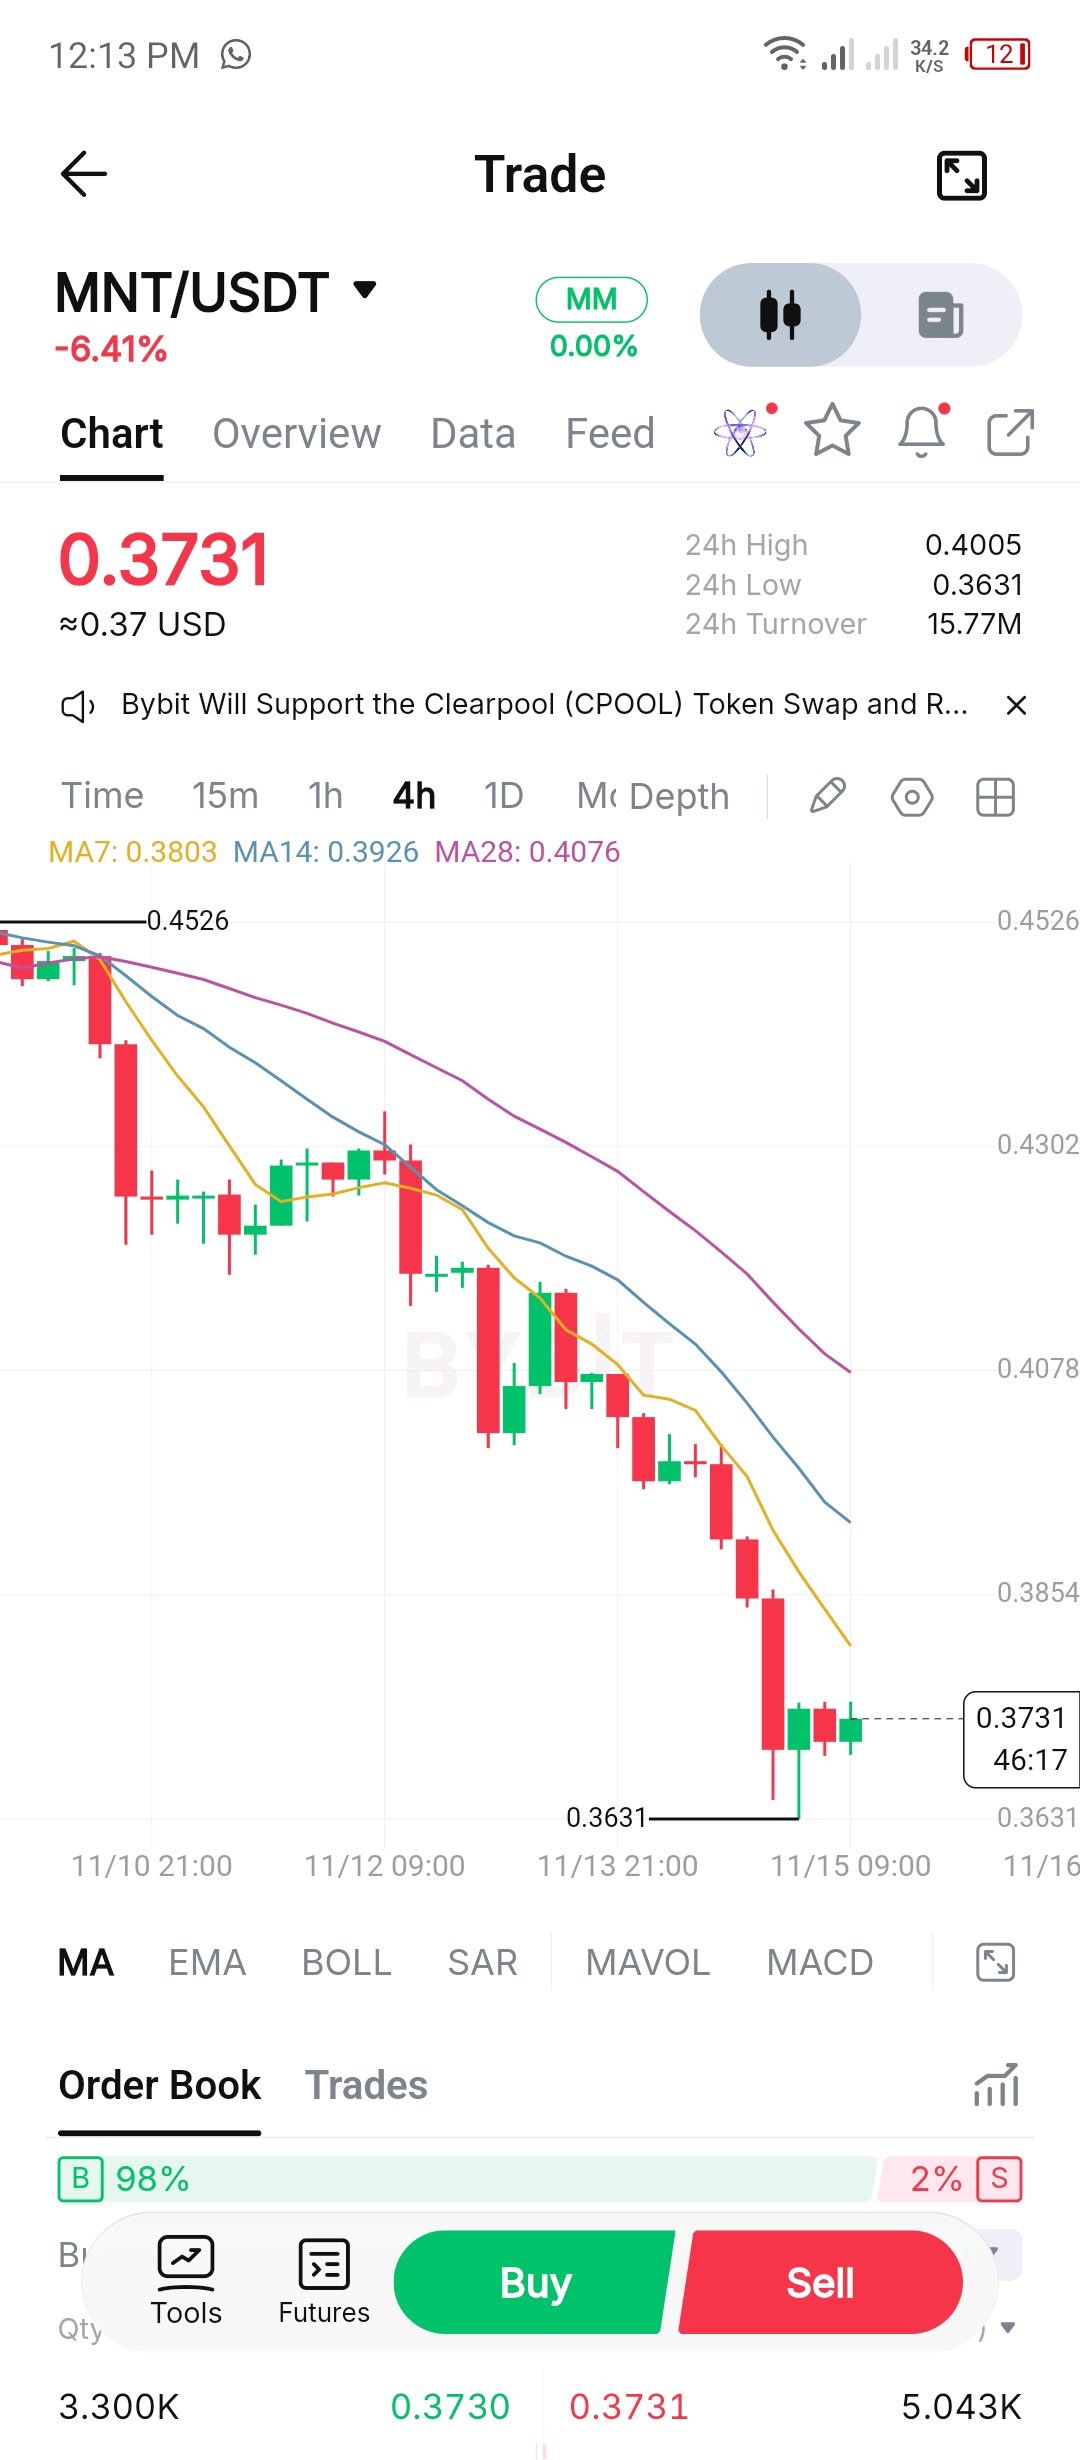
mntusdt
$MNTUSDT Technical Analysis (4H) **Current price:** 0.3731 **Market direction:** BEARISH (Downtrend) # 1. Trend Analysis - MA7: 0.3803 - MA14: 0.3926 - MA28: 0.4076 All three moving averages are above the current price. This indicates strong selling pressure. ## 2. Key Levels **Support:** - 0.3631 – Major support. - 0.3600 – Possible next support if 0.3631 breaks. **Resistance:** - 0.3800 – First resistance. - 0.3926 – Second resistance. - 0.4076 – Stronger resistance. ## 3. Trading Signal **SELL:** Bearish trend remains dominant. **BUY:** Wait for a strong bullish candle and confirmation above 0.3800. ## My Prediction - **Short-term:** DOWN - **Possible bounce:** YES, around 0.3631. - **Trend reversal:** Not confirmed. **My advice:** Don't rush into BUY yet. Wait for confirmation. A break below 0.3631 could trigger another downward move. This is a chart-based analysis, not a guaranteed prediction. I can also help you check the MNT/USDT trend again tomorrow. Check MNT/USDT trend tomorrow Tap to set up #IMPACTbyTrade
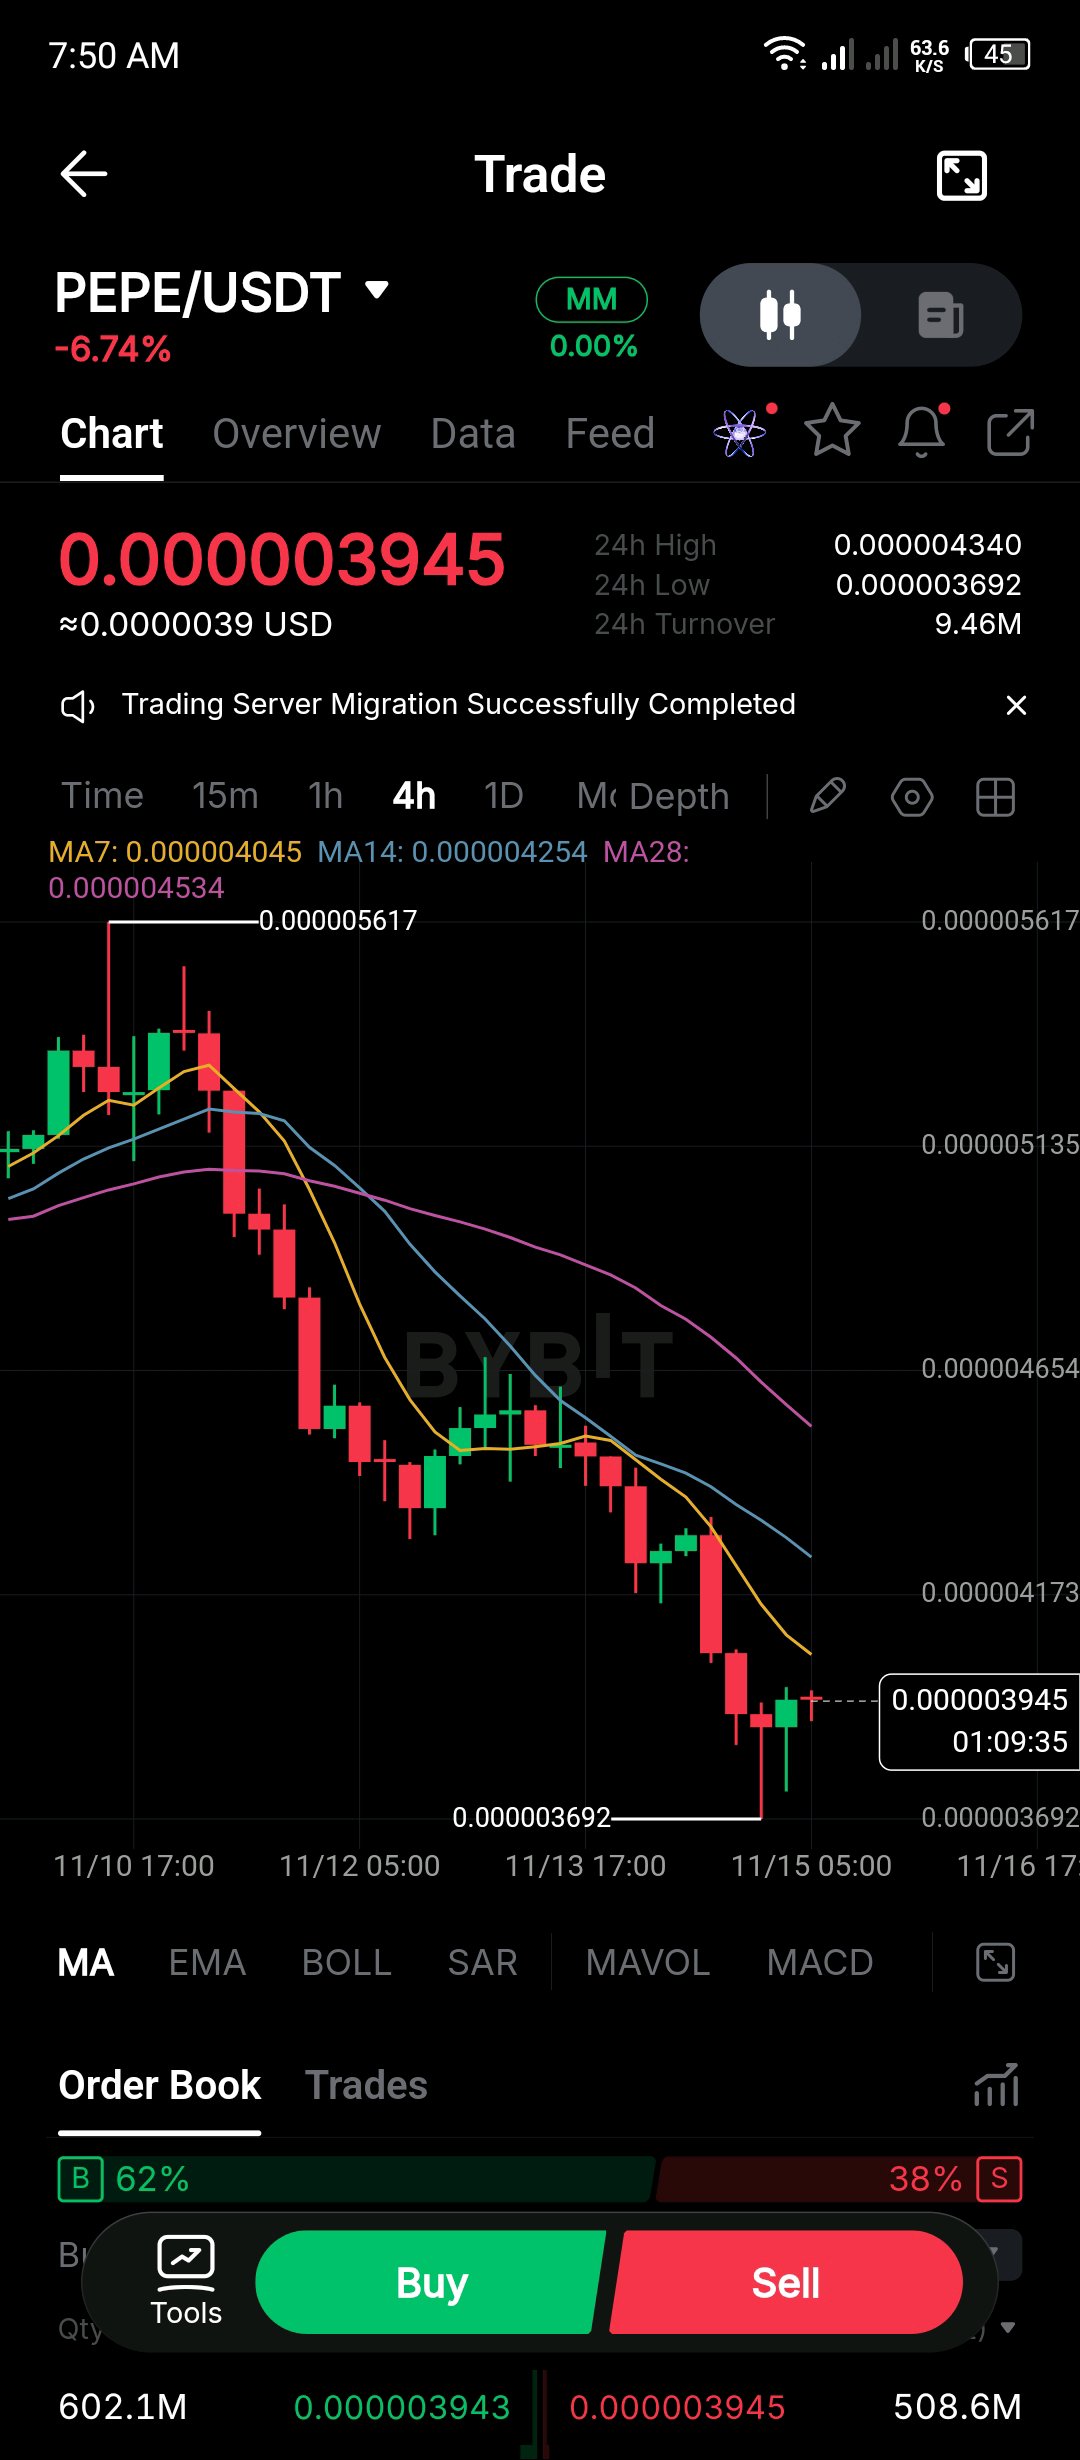
pepe usdt
$PEPEUSDT Technical Analysis **Timeframe: 4H** Current price: **0.000003945** 24H change: **-6.74%** # 1. Market Trend PEPE is currently in a **strong bearish trend**. From your chart: - Price is making lower highs and lower lows. - MA7: 0.000004045 - MA14: 0.000004254 - MA28: 0.000004534 The price is below all three moving averages. This indicates that sellers are still controlling the market. # 2. Support Levels Watch these important levels: - **S1:** 0.000003900 - **S2:** 0.000003692 (major support) - A breakdown below 0.000003692 could trigger another bearish move.# 3. Resistance Levels - **R1:** 0.000004045 - **R2:** 0.000004254 - **R3:** 0.000004534 PEPE needs to break these resistance levels to show signs of recovery. ## 4. Buy or Sell? **SELL SCENARIO 🔴** If price breaks below 0.000003692 with a strong 4H candle close, further downside is possible. **BUY SCENARIO 🟢** If price holds above 0.000003692 and breaks 0.000004045, a short-term recovery could develop. ## 5. Order Book - Buyers: 62% - Sellers: 38% Buyers currently have a higher displayed order-book share, but this alone does not confirm a bullish reversal. ## My Trading Verdict 🔴 **BEARISH — WAIT FOR CONFIRMATION.** I would avoid rushing into a BUY position while the price remains below the moving averages. **My advice:** Watch 0.000003692 closely. It is the most important support on your chart. Monitor PEPE/USDT support and resistance daily Tap to set up #IMPACTbyTrade
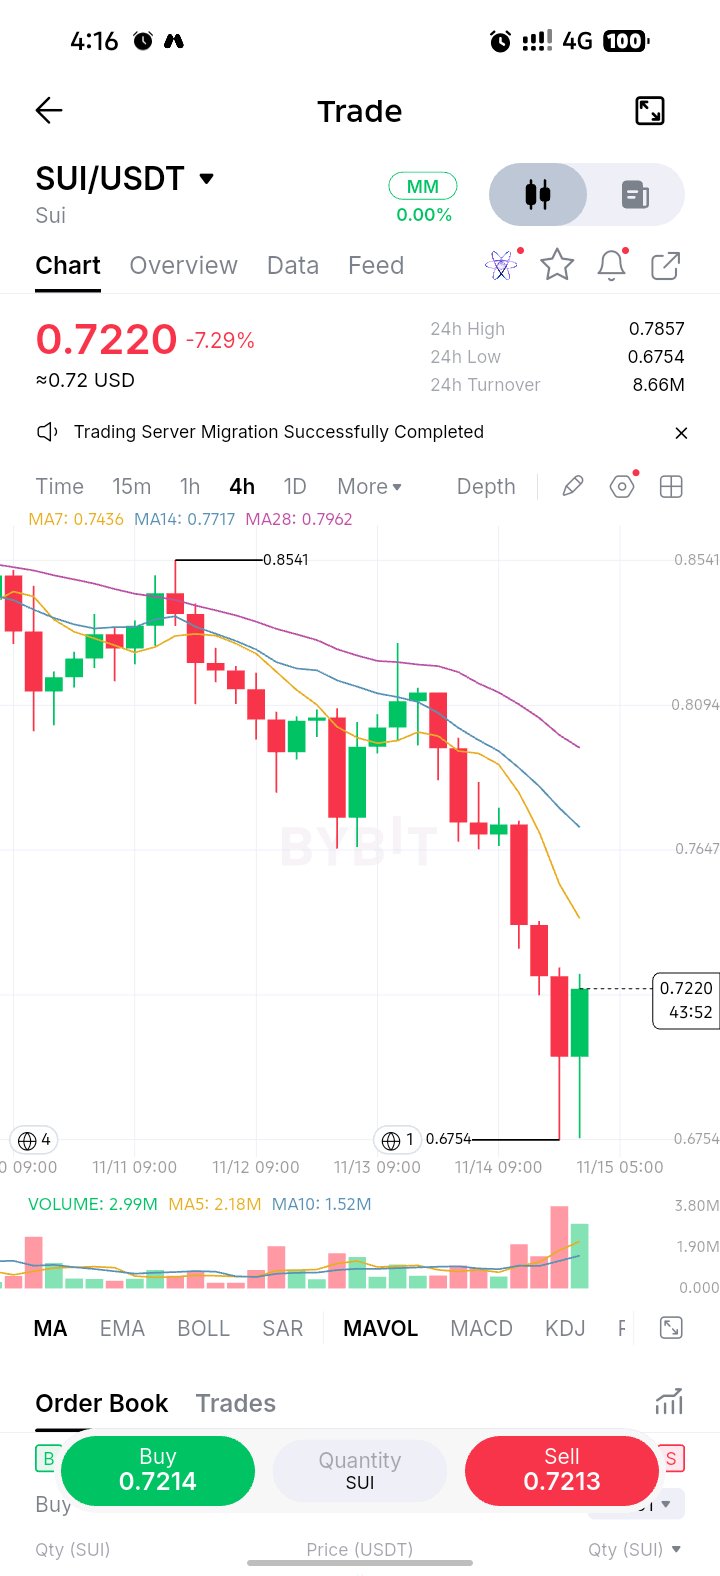
$SUIUSDT – 4H Technical Analysis Market Trend: BEARISH 📉 SUI is currently trading around $0.7220, down approximately 7.29%. The 4-hour chart shows strong selling pressure, with the market continuing to form lower highs and lower lows. 1. Market Structure The overall structure remains bearish. Sellers are still controlling the market, and the price is trading below all three moving averages: MA7: 0.7436 MA14: 0.7717 MA28: 0.7962 This indicates that bearish momentum remains strong. 2. Support Levels $0.6754 – Major support. A breakdown below this level could trigger further downside. 3. Resistance Levels $0.7436 – First resistance. $0.7647 – Second resistance. $0.7717 – Stronger resistance. 4. Possible Market Direction Bearish Scenario 📉 If sellers maintain control and the price breaks below $0.6754, SUI could experience another downward move. Bullish Scenario 📈 The latest green candle shows a possible recovery from support. However, buyers need to push the price above $0.7436 and sustain the move to suggest a stronger reversal. SUI remains bearish on the 4H timeframe. A temporary bounce is possible, but there is not yet enough confirmation of a bullish reversal. Wait for confirmation before entering a trade. Manage risk carefully. --- My advice: SHORT bias for now, but don't enter blindly. Wait for confirmation. #IMPACTbyTrade
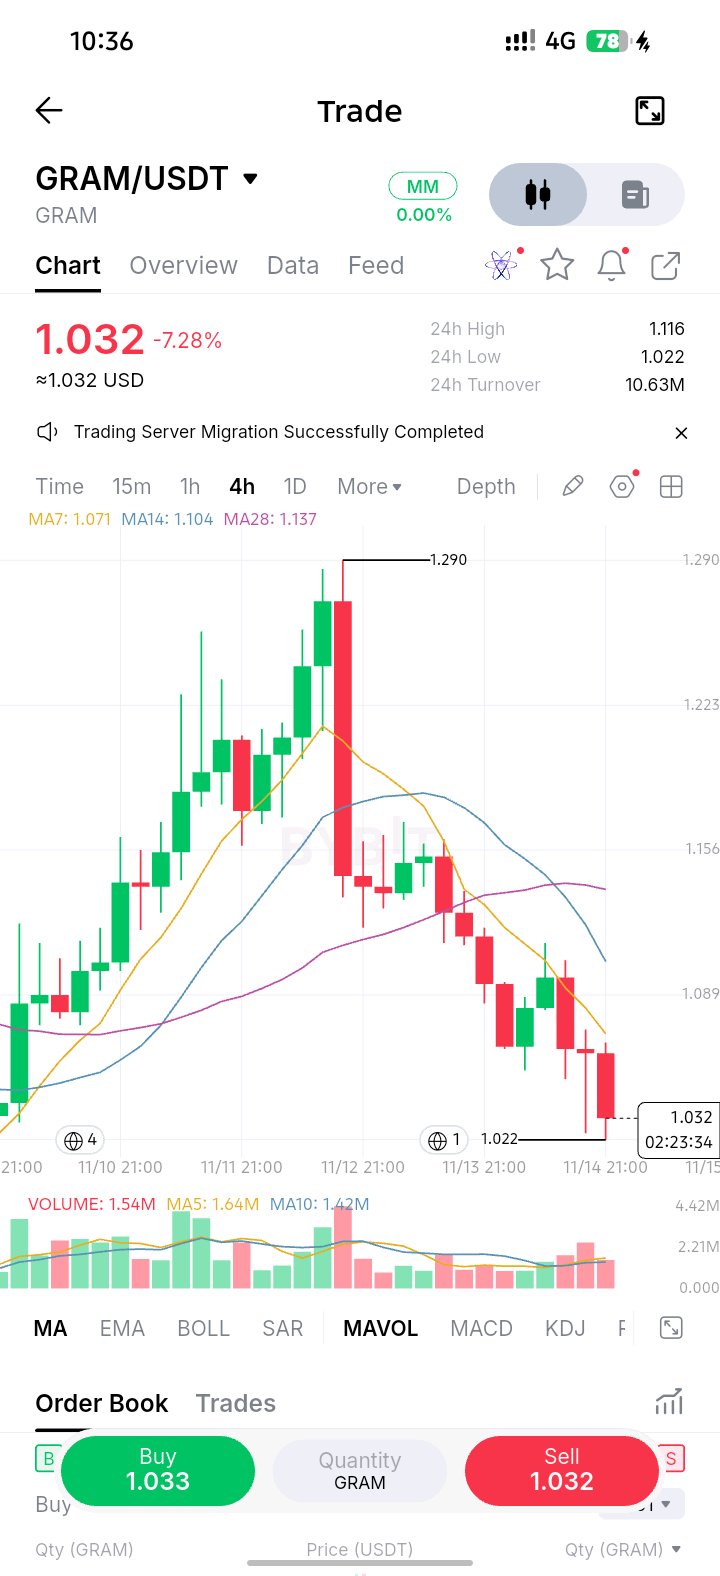
GRAMUSDT
$GRAMUSDT – The market is approaching a critical decision zone, and I am watching how buyers and sellers respond rather than assuming the current price is the bottom. The 4-hour chart shows GRAM trading around $1.032, following a significant decline from the previous high near $1.290. What stands out is the consistent bearish structure that has developed since that rejection. The market has continued forming lower highs and lower lows, suggesting that sellers still have control of the broader short-term direction. One important detail is that GRAM is currently trading below its major moving averages. MA7 is around $1.071, MA14 is around $1.104, and MA28 is around $1.137. This alignment tells me that the market has not yet demonstrated enough strength to confirm a meaningful trend reversal. However, the current price is approaching an important support area around $1.022. This is where I believe the next major decision could develop. I am not treating $1.022 as a guaranteed bottom. Instead, I want to observe whether buyers can defend this level and begin building a stronger recovery structure. A successful defence could create an opportunity for GRAM to recover toward $1.070 and potentially $1.104. The first meaningful bullish evidence would be a strong recovery above $1.070, followed by a sustained move through $1.104. That would suggest buyers are gradually regaining control. On the other hand, if GRAM loses the $1.022 support with strong selling pressure, the market could extend its decline toward the psychological $1.000 level and potentially $0.950. For now, my focus is on market behaviour, volume, and confirmation. I do not want to confuse a temporary bounce with a genuine reversal. My overall view: GRAM remains bearish on the 4H timeframe, but the $1.022 support area deserves close attention. The next confirmed move could provide a clearer indication of the market's direction. The market does not need my prediction. It needs to show its direction through price action. #IMPACTbyTrade
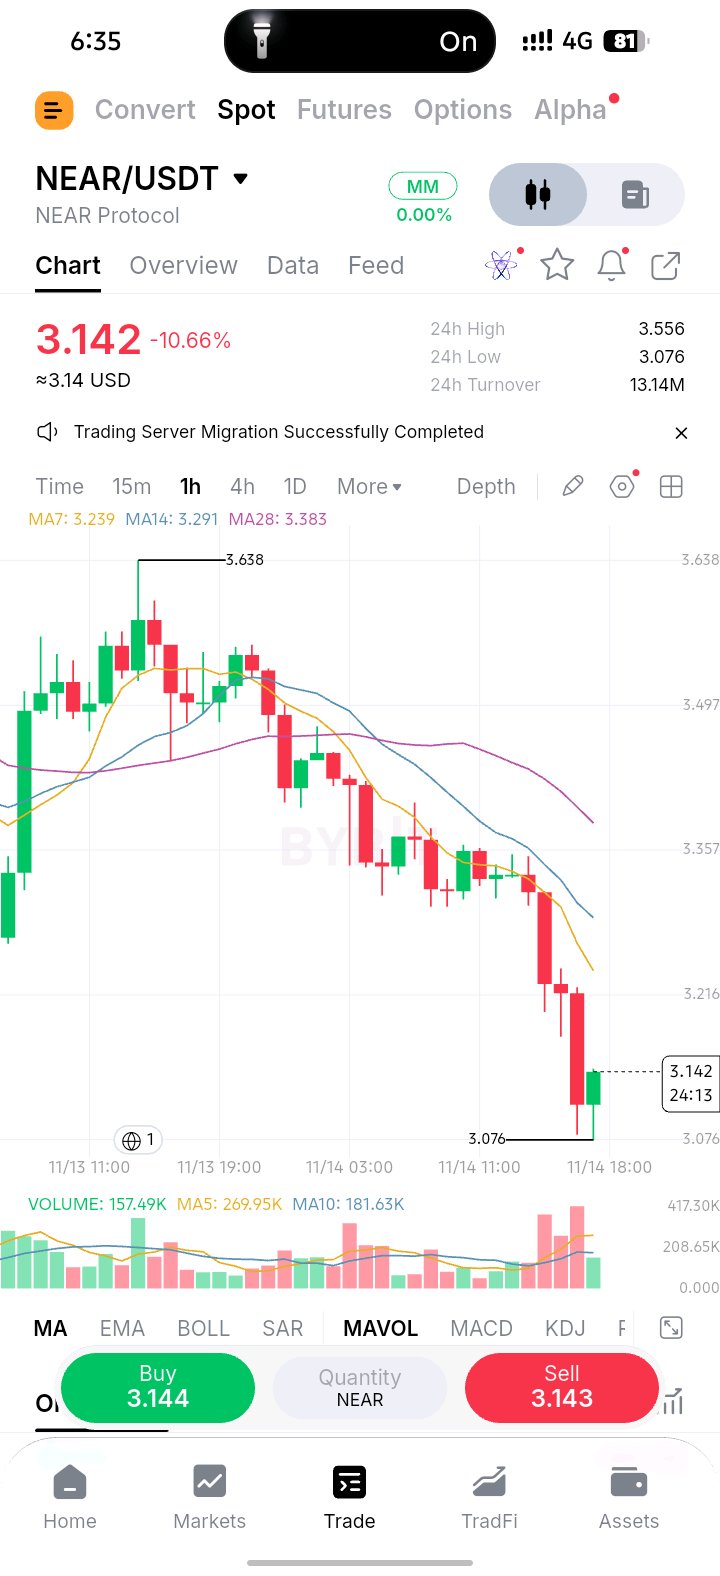
$NEARUSDT – I am not looking at NEAR simply because the price has dropped more than 10%. I am interested in understanding whether the current selling pressure is reaching an important decision zone or whether sellers still have enough strength to push the market lower. The 1-hour chart shows NEAR trading around $3.142 after an extended bearish movement. What stands out to me is the structure behind this decline. The market has continued producing lower highs and lower lows, showing that sellers have maintained control over the short-term direction. Another important observation is the position of the moving averages. MA7 is around $3.239, MA14 around $3.291, and MA28 around $3.383. Price is currently trading below all three averages, which tells me that the overall short-term momentum remains weak. However, I am paying particular attention to the $3.076 area. This is the recent low visible on my chart, and it represents an important support zone where buyers have started showing some reaction. My approach here is based on confirmation, not prediction. I am not assuming that NEAR has already reached its bottom simply because it has experienced a significant decline. I want to see whether buyers can defend the $3.076 region and gradually establish stronger price action. For a meaningful bullish recovery, the first important level I want to see reclaimed is around $3.200, followed by the MA7 region near $3.239. A sustained move above these levels would be an early indication that buying pressure may be returning. On the other hand, if NEAR fails to hold the $3.076 support and breaks below it with strong selling volume, the market could open the door to another downward move, with the psychological $3.00 region becoming an important area to watch. My current position is cautious and bearish. I would rather wait for the market to demonstrate a clear change in behaviour than enter a position simply because the price appears oversold. For now, sellers remain in control, but the reaction around $3.076 could provide important information about what comes next. The next major decision for NEAR will be whether buyers can build a sustainable recovery or whether sellers will continue extending the current downtrend. The key is not guessing the bottom. It is waiting for the market to confirm its next direction. #IMPACTbyTrade
BTCUSDT
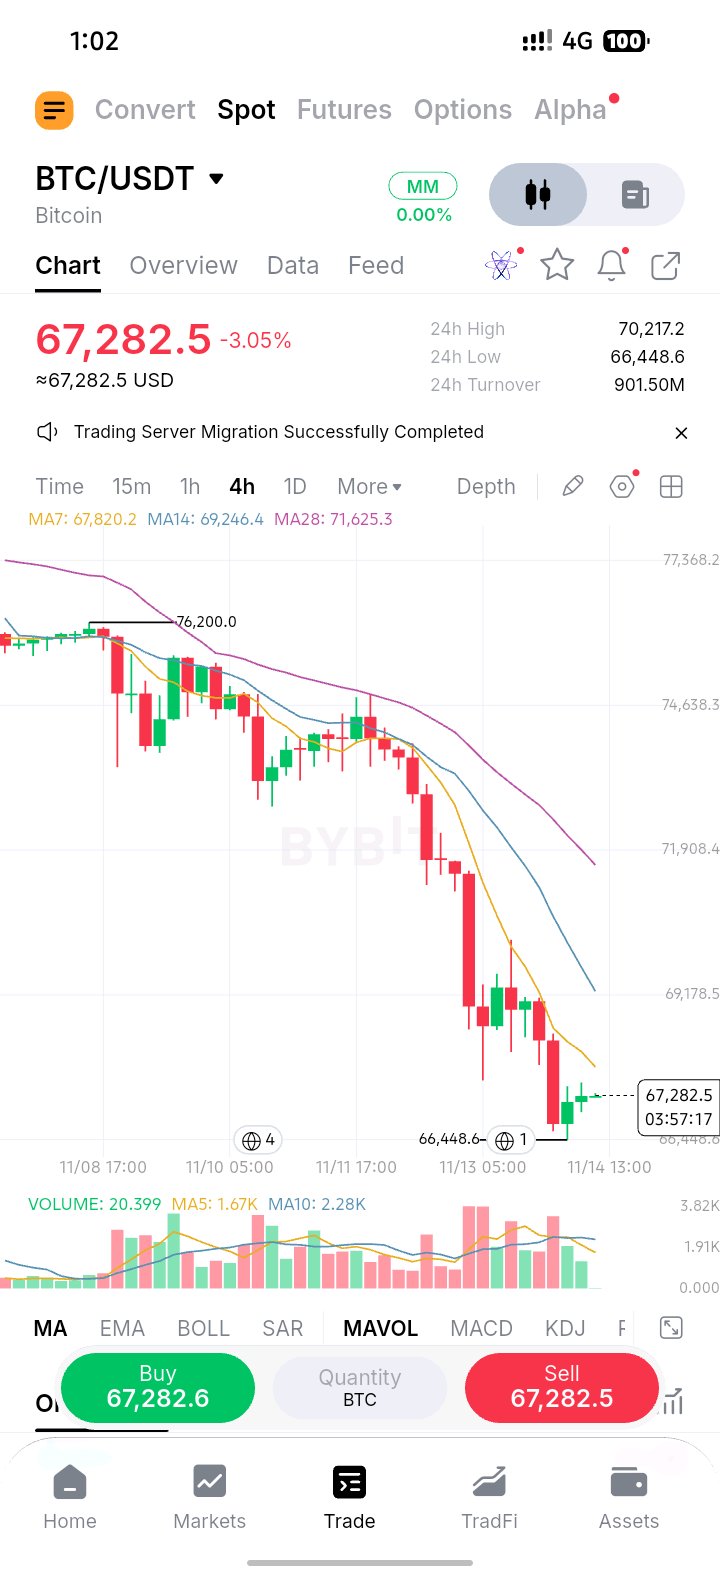
$BTCUSDT – I am not looking at Bitcoin simply because the price has dropped significantly. What interests me is that BTC has returned to an important support region where the next major market decision could begin to develop. The 4-hour chart shows Bitcoin trading around $67,282 after an extended bearish movement. What stands out is the strength of the selling pressure that pushed the price down from the $76,200 region toward the current support area around $66,448. The market structure remains weak. Bitcoin continues to form lower highs and lower lows, which tells me that sellers are still controlling the broader short-term direction. The moving averages also support this observation, with MA7 around $67,820, MA14 around $69,246, and MA28 around $71,625. Price is currently trading below all three averages. However, I am paying close attention to the reaction around $66,448. This level is important because buyers have recently shown some interest in defending the area. The small recovery visible on the latest candles suggests that selling pressure may be slowing temporarily, but I do not consider this enough evidence to confirm a bullish reversal. My focus now is on market behaviour rather than trying to predict the exact bottom. If Bitcoin manages to hold above the $66,448 support and gradually builds stronger buying momentum, I would first watch the $67,820 region. A successful recovery above that level could open the door toward $69,246, where stronger resistance may appear. On the other hand, if BTC loses the $66,448 support with a strong bearish candle and increasing selling volume, the market could experience another downward move toward the $66,000 and $65,000 regions. For me, the most important signal would be a change in market structure. I want to see Bitcoin stop producing weak recoveries, establish a higher low, and eventually reclaim important resistance levels. Until that happens, I will continue treating the current movement as a possible relief bounce inside a broader downtrend rather than assuming that the market has already found its bottom. My current outlook: Bitcoin remains bearish on the 4-hour timeframe, but the $66,448 support deserves close attention. The next confirmed move around this level could provide a clearer indication of whether buyers are preparing a recovery or sellers are getting ready for another leg down. I believe patience is more important than rushing into a position. The market will eventually reveal its direction through price action and volume. $BTCUSDC #IMPACTbyTrade
XRPUSDT
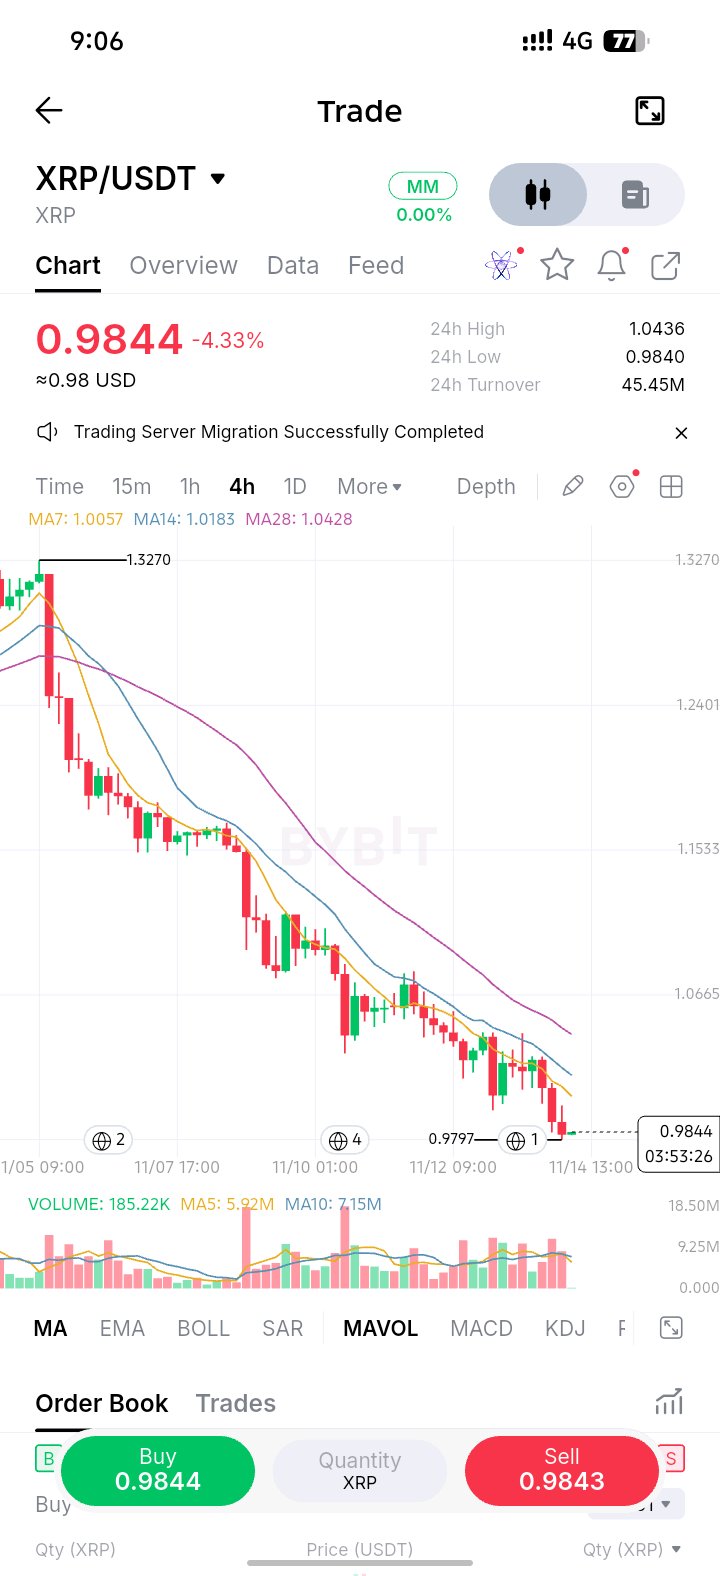
$XRPUSDT – The market is approaching an important decision zone, and I believe the next reaction around support could reveal where XRP is heading next. The 4-hour chart shows XRP trading around $0.9844, down approximately 4.33%. What interests me most is not simply the recent decline, but the consistency of the selling pressure and the way price continues to form lower highs and lower lows. XRP has experienced a prolonged bearish movement from the $1.32 region. Throughout this decline, buyers have made several attempts to recover, but those recovery attempts have struggled to establish a sustainable upward structure. This tells me that the market has not yet demonstrated convincing evidence of a trend reversal. The Moving Average Structure One important detail on the chart is the position of the moving averages. MA7 is currently around $1.0057, MA14 is around $1.0183, and MA28 is around $1.0428. Price is trading below all three moving averages, while the averages themselves remain positioned in a bearish structure. This suggests that sellers continue to control the broader 4-hour trend. Any short-term recovery should therefore be treated carefully until XRP begins reclaiming these important levels. The Support Zone That Matters The immediate area I am watching is around $0.9797. This level represents an important short-term support area because price is currently trading very close to it. If buyers manage to defend this region, XRP could attempt a relief recovery toward $1.0057, followed by the $1.0183 area. However, I would not automatically interpret a bounce from support as a confirmed bullish reversal. I want to see stronger buying pressure, improved candle structure, and the ability to hold higher levels. What Happens If Support Breaks? The bearish scenario becomes more important if XRP loses the $0.9797 support with a strong 4-hour candle close below it. Such a breakdown could expose lower price regions, with $0.9500 becoming an area worth monitoring. If selling pressure continues beyond that region, the market could experience another leg lower. For now, confirmation is more important than prediction. My Trading Perspective I am not interested in assuming that XRP has reached its bottom simply because the price has declined significantly. A falling market can remain bearish longer than many traders expect. What I want to observe is whether buyers can finally interrupt the sequence of lower highs and lower lows. A meaningful recovery above $1.0057 would be an early sign of improving momentum. Reclaiming $1.0183 would provide additional evidence that buyers are becoming more active. Until then, the bearish structure remains dominant. Final Market Outlook XRP is currently at an important technical area where the next reaction could influence its short-term direction. The $0.9797 support deserves close attention. A successful defence could create room for a recovery, while a confirmed breakdown could increase downside pressure. My approach is to remain patient, monitor price behaviour, and wait for confirmation rather than trying to predict the exact bottom. Current Bias: BEARISH The market does not reward impatience. Sometimes the best trading decision is simply waiting for the right confirmation. #IMPACTbyTrade
BERAUSDT
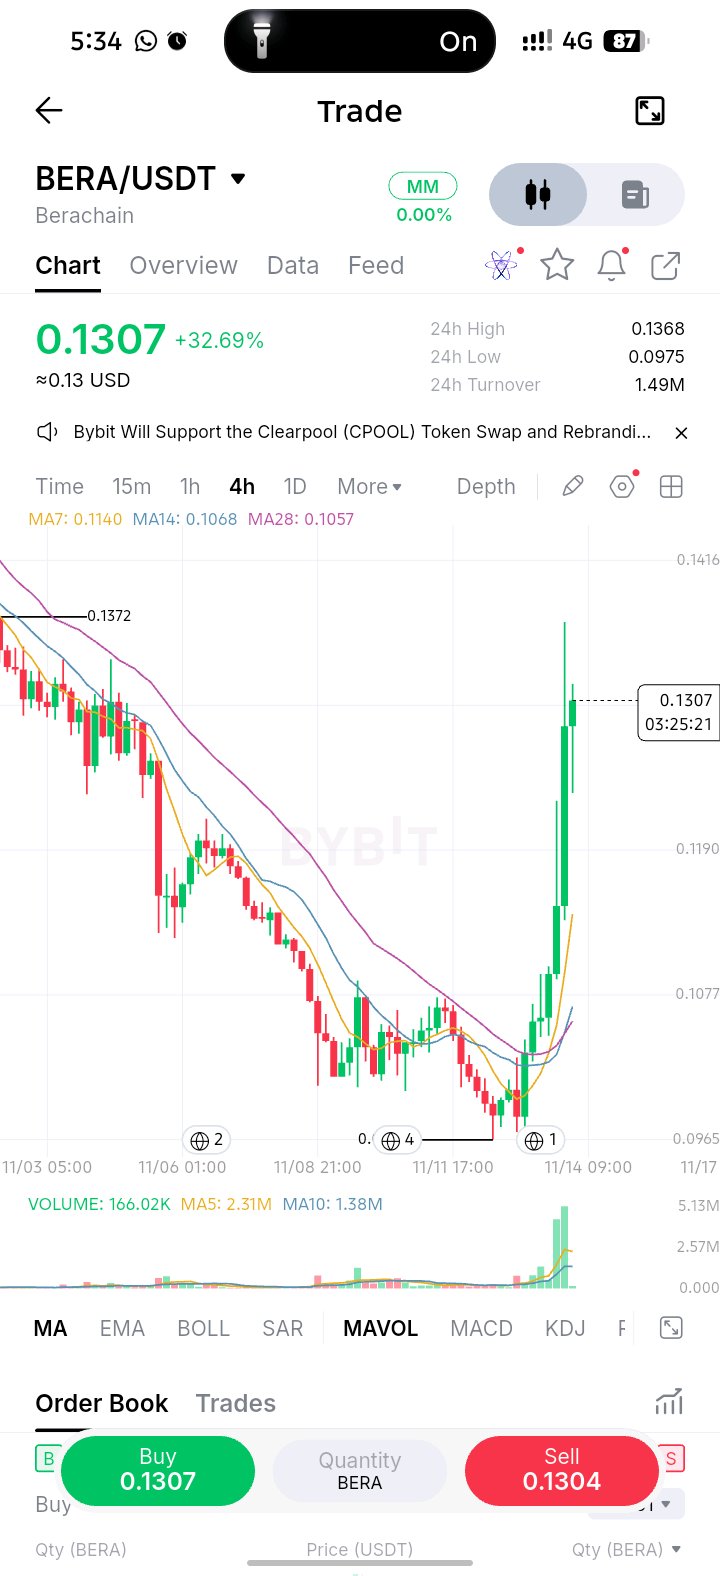
$BERAUSDT – I am not looking at BERA simply because it has gained more than 32% in a single day. What interests me is the change in market behaviour after an extended period of downward pressure. The important question now is whether this move represents the beginning of a larger recovery or simply a temporary bullish reaction. The 4-hour chart shows BERA trading around $0.1307 after recovering strongly from the $0.0975 area. What stands out is the sequence behind this movement: a prolonged decline, a period of consolidation near the lows, and then a powerful upward move accompanied by a noticeable increase in trading volume. This is an important development because the price has now moved above the MA7, MA14 and MA28. It suggests that buyers have gained short-term control of the market. However, I would not automatically interpret this as confirmation of a long-term trend reversal. The next important area is around $0.1368–$0.1372. This is where I want to see how the market behaves. A strong 4-hour candle close above this resistance, supported by sustained buying volume, would provide better evidence that the recovery has room to continue. My approach here is based on market behaviour rather than prediction. I am more interested in seeing whether BERA can maintain its recent gains and establish higher support levels instead of immediately chasing the current bullish candles. After such a sharp increase, a temporary pullback would not necessarily invalidate the recovery. In fact, a controlled correction followed by renewed buying pressure could provide a healthier structure. The first important support area is around $0.1190. If buyers successfully defend this level, the market may have an opportunity to challenge the recent high again. Below that, the $0.1077 region becomes another important area to watch. A deeper correction toward this zone would suggest that the market is losing some of its recent bullish momentum. On the upside, a confirmed breakout above $0.1372 could bring the $0.1450 region into focus, followed by $0.1550 if buying pressure remains strong. However, if BERA fails to hold above its recent breakout area and begins producing lower highs, I would become more cautious about the strength of this recovery. For now, BERA is showing encouraging bullish behaviour, but I am not treating one powerful upward move as proof that the entire market structure has changed. My key focus is simple: Can BERA hold higher levels, defend its new support zones, and successfully break through resistance? That is the behaviour I want to see before becoming more confident about the next major move. The market does not need to move upward every hour to remain bullish. Sometimes, the quality of the correction tells us more than the strength of the initial breakout. Key Levels to Watch: Support 1: $0.1190 Support 2: $0.1077 Major Support: $0.0975 Resistance 1: $0.1368–$0.1372 Resistance 2: $0.1450 Next Target: $0.1550 Overall Outlook: Bullish recovery, but breakout confirmation is still important. $BERAUSDT #ByXIMPACT
DOGEUSDT Technical analyst
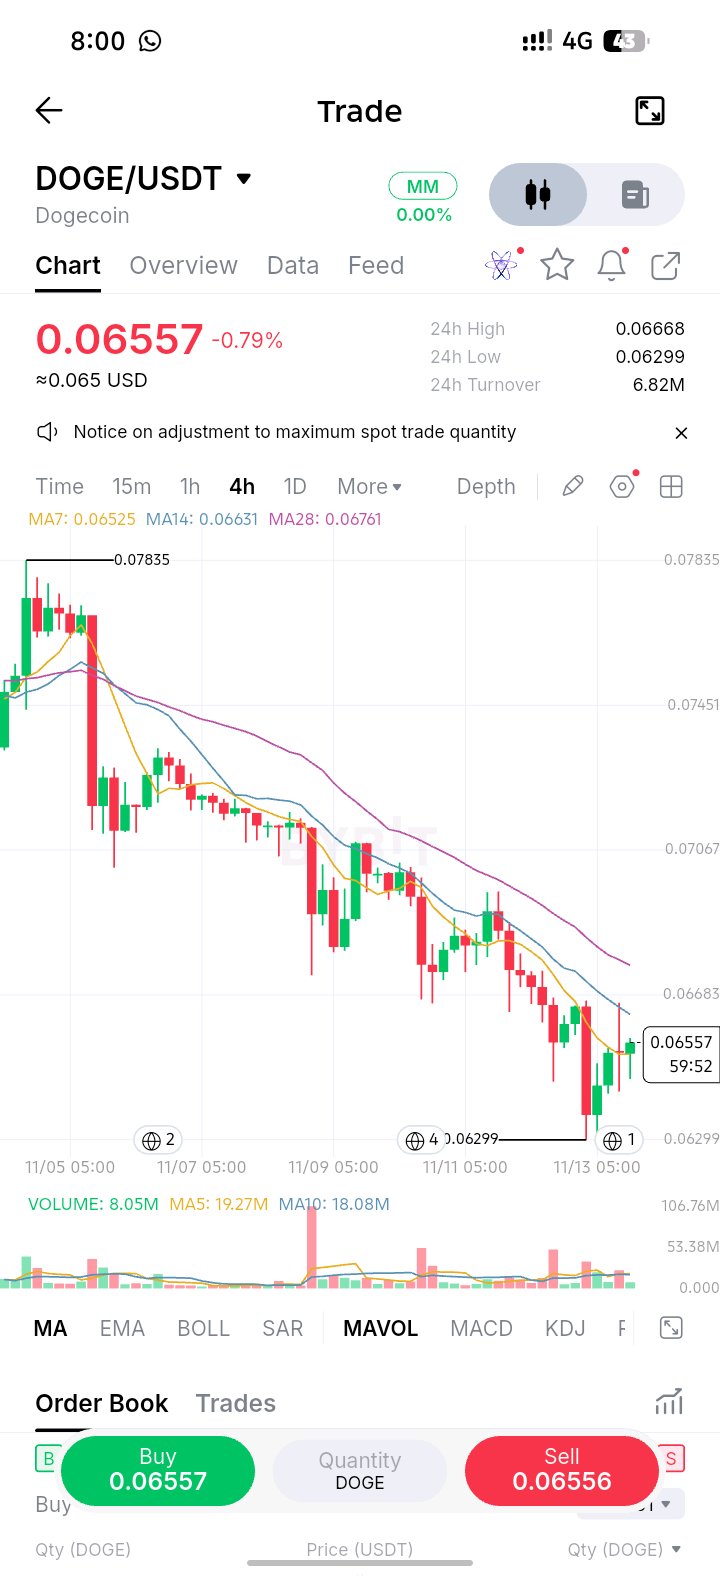
$DOGEUSDT — The Recovery Attempt That Needs Confirmation The setup I am watching on DOGE is not simply the small green candles appearing after the recent drop. What matters most is whether buyers can turn this recovery into a genuine change in market structure. On the 4H chart, DOGE has been moving through a clear bearish structure, declining from approximately $0.07835 and recently reaching a low around $0.06299. That is a significant move to the downside, and the overall structure still shows sellers having the advantage. At the time of this screenshot, DOGE is trading around $0.06557. There is an interesting development here. Price has bounced from the $0.06299 region and is now trading slightly above the MA7, currently around $0.06525. However, it remains below the MA14 near $0.06631 and the MA28 around $0.06761. This tells me that short-term buyers are attempting a recovery, but the broader 4H trend has not yet confirmed a bullish reversal. So, what am I watching next? The first important resistance area is around $0.06630–$0.06680. If buyers can reclaim this region and establish support above it, the next area I would watch is around $0.06760. A stronger move above that level could improve the bullish outlook and open the possibility of a recovery toward $0.07000. However, there is another side to this setup. If DOGE fails to reclaim the nearby resistance and selling pressure returns, the recovery could turn into another lower high. In that situation, $0.06400 becomes an important area to monitor, followed by the recent low around $0.06299. A clean break below $0.06299 would weaken the recovery structure and suggest that sellers may still be in control. My current perspective: I am cautiously watching DOGE rather than calling an immediate bullish reversal. The first evidence I want to see is a successful reclaim of $0.06630, followed by stronger buying volume and a higher low on the 4H timeframe. Until that happens, the possibility of another downward move remains open. Key Levels to Watch: Immediate Support: $0.06400 Major Support: $0.06299 First Resistance: $0.06630–$0.06680 Second Resistance: $0.06760 Major Recovery Target: $0.07000 Final Thought: DOGE is showing its first signs of recovery after a prolonged decline, but a bounce is not the same as a trend reversal. I want confirmation from price action before becoming confident in the bullish side. Patience is important here. Let the market show its direction before making a decision. #DOGE #DOGEUSDT #TechnicalAnalysis #CryptoTrading #Bybit #ByXIMPACT
sol usdt technical analyst
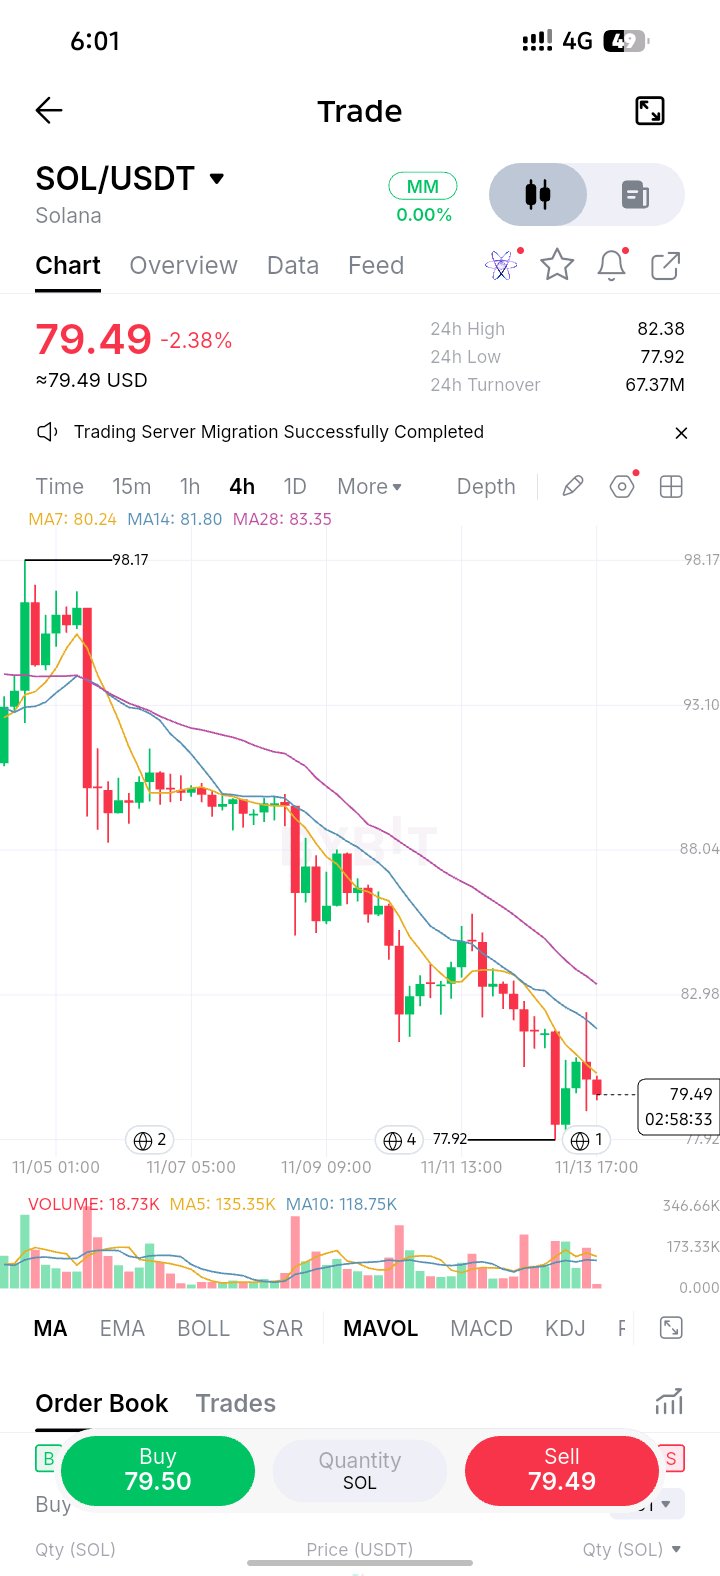
$SOLUSDT Technical Analysis Timeframe: 4 Hours (4H) Current Price: $79.49 24H Change: -2.38% 24H High: $82.38 24H Low: $77.92 1. Market Trend SOL is currently showing a strong BEARISH TREND. The chart shows: Lower highs and lower lows. Sellers are controlling the market. Price is trading below MA7, MA14 and MA28. The moving averages are pointing downward. This indicates that bearish momentum is still dominant. 2. Moving Average Analysis MA7: $80.24 MA14: $81.80 MA28: $83.35 All three moving averages are above the current price. This suggests that SOL may face resistance if it attempts to move higher. 3. Important Support Levels Watch these levels: $77.92: Major immediate support. $77.00: Potential next support. $75.00: Further downside target. If SOL breaks below $77.92 with strong selling volume, further downside could follow. 4. Important Resistance Levels $80.24: First resistance. $81.80: Second resistance. $83.35: Stronger resistance. A successful breakout above $81.80 could indicate a possible bullish recovery. 5. Possible Market Scenarios BEARISH SCENARIO If SOL fails to break above $80.24 and selling pressure increases, the price could retest $77.92. A confirmed breakdown could expose $77.00 and $75.00. BULLISH SCENARIO If buyers defend $77.92 and push the price above $80.24, SOL could attempt to reach $81.80. A strong 4H candle close above $81.80 would provide a better bullish confirmation. 6. Final Market Prediction SHORT-TERM BIAS: BEARISH SOL remains under bearish pressure, although a temporary recovery is possible. My key levels to watch: Support: $77.92 Resistance: $80.24 Bullish confirmation: $81.80 Bearish confirmation: Break below $77.92. Avoid entering a trade based on price direction alone. Wait for candle confirmation and volume. --- BYBIT FEED POST SOLANA (SOL) TECHNICAL ANALYSIS SOL is currently facing bearish pressure on the 4H timeframe. The price is trading below all three major moving averages, suggesting that sellers remain in control. Key support sits at $77.92, while resistance is located around $80.24 and $81.80. A breakdown below support could trigger another bearish move, while a strong breakout above resistance may signal a recovery. Market Sentiment: BEARISH #SOL #Solana #CryptoAnalysis #TechnicalAnalysis #BYBIT #ByXIMPACT
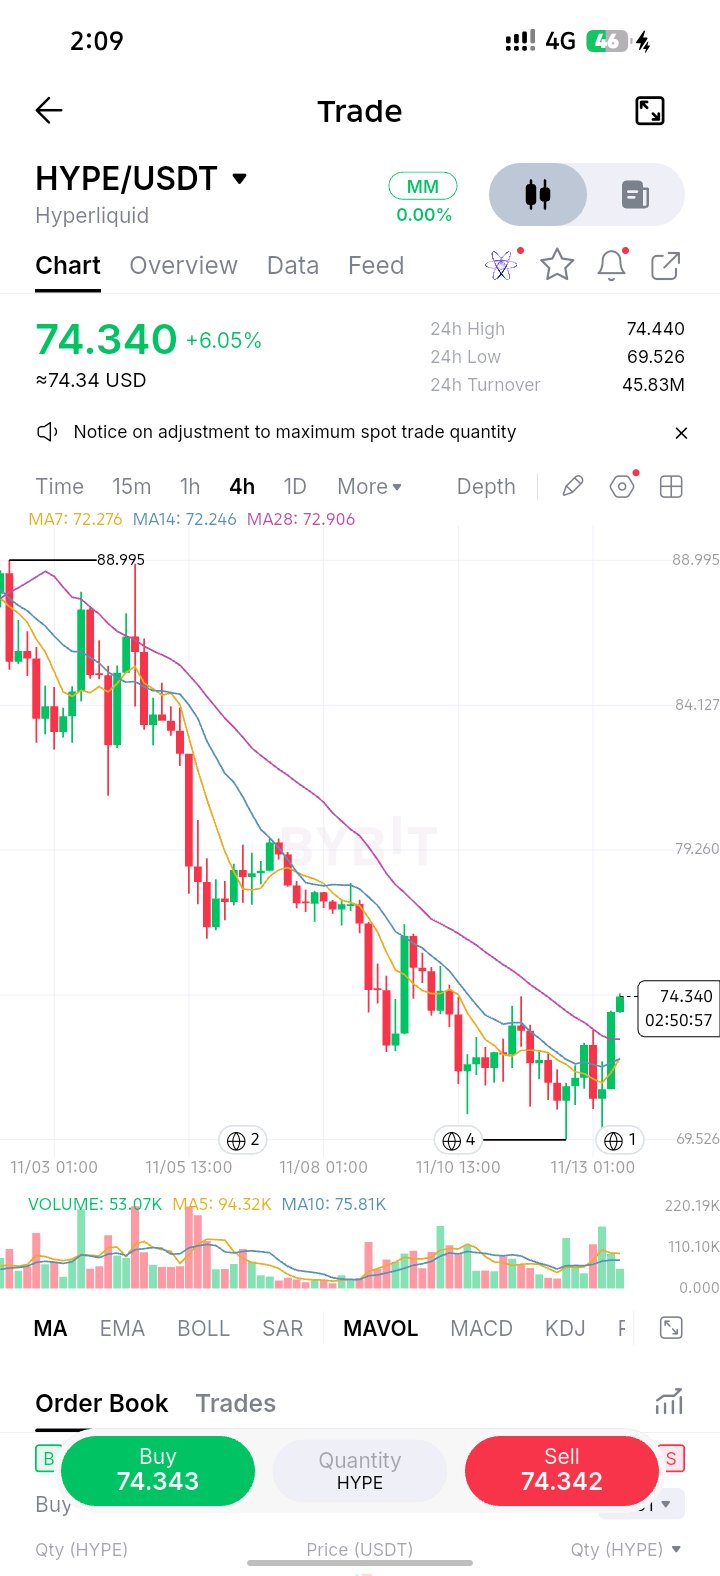
$HYPEUSDT Technical Analysis **Timeframe: 4 Hours (4H)** **Current Price: $74.340** **24H Change: +6.05%** # 1. Market Trend HYPE is showing signs of a bullish recovery after a prolonged bearish trend. The chart shows: - Buyers are becoming more active. - Several green candles have appeared. - Price has moved above MA7, MA14 and MA28. - Short-term momentum is turning bullish. However, the overall 4H trend is not yet fully bullish. # 2. Moving Average Analysis - MA7: $72.276 - MA14: $72.246 - MA28: $72.906 The price is currently above all three moving averages. This is a positive sign for buyers.# 3. Important Support Levels These are the important levels to watch: - **$72.00:** First support. - **$70.50:** Second support. - **$69.50:** Major support. If sellers push the price below $72, a deeper correction could follow. # 4. Resistance Levels Watch these resistance zones: - **$74.44:** Immediate resistance. - **$76.00:** Second resistance. - **$79.00:** Major resistance. A strong 4H candle close above $74.44 could open the door for further upside. # 5. Volume Analysis The current volume is approximately 53.07K. Volume is below its MA5 and MA10 averages. This means buyers need stronger volume to confirm the bullish move. # 6. Bullish Scenario If HYPE breaks above $74.44 with strong buying volume: - Target 1: $76.00 - Target 2: $77.50 - Target 3: $79.00 # 7. Bearish Scenario If HYPE fails to break $74.44 and sellers take control: - Target 1: $72.00 - Target 2: $70.50 - Target 3: $69.50 # 8. Final Market Prediction **Short-term outlook: BULLISH RECOVERY ** HYPE is showing positive momentum, but confirmation above $74.44 is important. I would avoid chasing the current green candle. Waiting for a breakout and successful retest would provide a more reliable setup. --- Conclusion HYPE/USDT is attempting a bullish reversal after a significant decline. Buyers currently have short-term momentum, but the market must break resistance to confirm further upside. **Key level to watch: $74.44.** *This is technical analysis, not a guaranteed price prediction or financial advice.* #ByXIMPACT
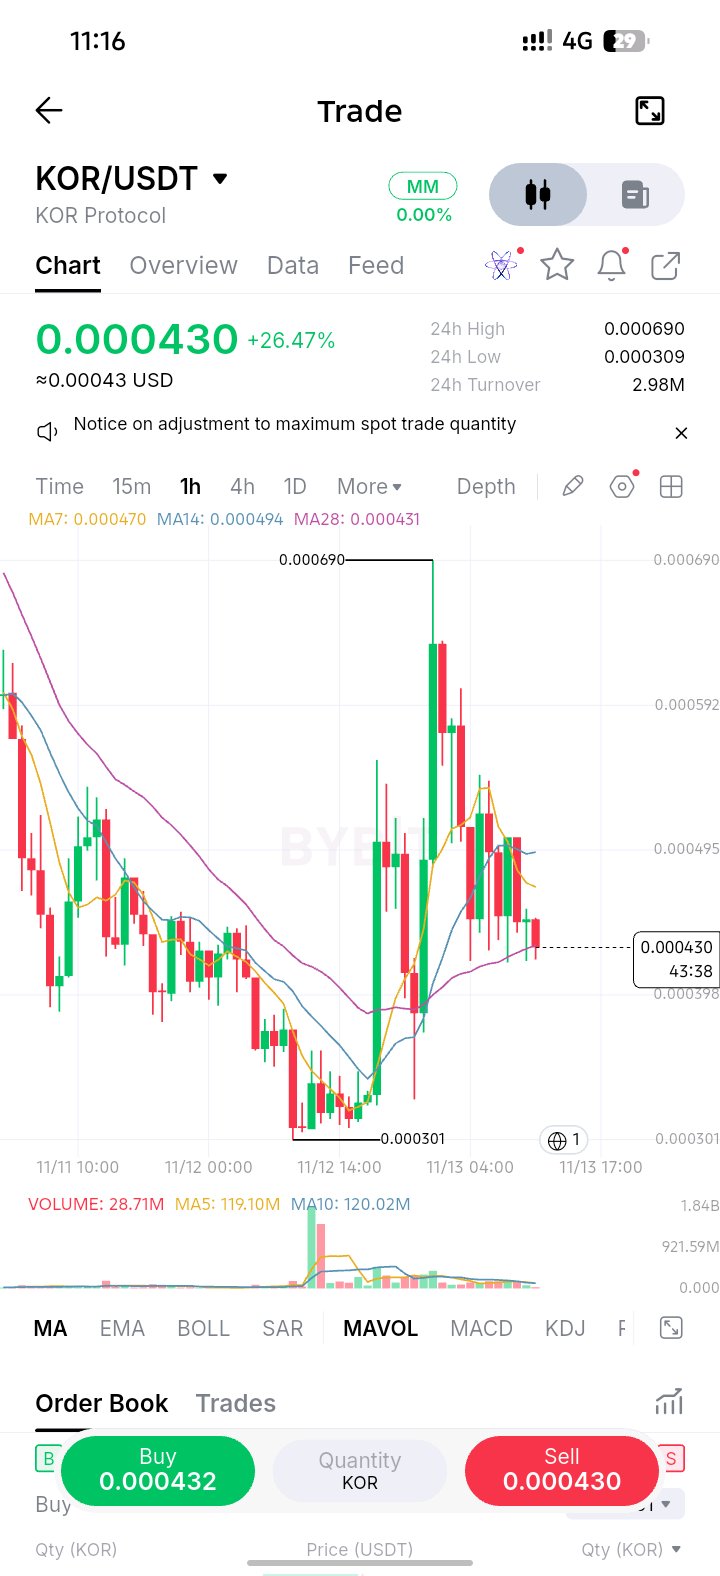
$KORUSDT – Technical Analysis Timeframe: 1H (1-Hour Chart) Current Price: 0.000430 USDT 24H Change: +26.47% 24H High: 0.000690 USDT 24H Low: 0.000309 USDT 1. Market Overview KOR/USDT has experienced a strong bullish movement, climbing from approximately 0.000301 to a high of 0.000690. However, after reaching this peak, the price faced strong selling pressure and entered a correction phase. Currently, KOR is trading around 0.000430, showing signs of consolidation after the sharp upward movement. 2. Moving Average Analysis The current moving averages are: MA7: 0.000470 MA14: 0.000494 MA28: 0.000431 The price is currently below MA7 and MA14, indicating short-term bearish pressure. However, it is trading very close to MA28, which could act as an important support area. 3. Important Support Levels 0.000410: Immediate support. 0.000398: Important support zone. 0.000350: Additional downside support. 0.000301: Previous major low. 4. Important Resistance Levels 0.000470: First resistance. 0.000494: Strong resistance. 0.000550: Next bullish target. 0.000592: Major resistance. 0.000690: Previous high. 5. Market Prediction Bullish Scenario If buyers defend the 0.000410–0.000398 support zone and push the price above 0.000470, KOR could attempt to reach 0.000494. A successful breakout above 0.000494 could open the door toward 0.000550 and potentially 0.000592. Bearish Scenario If sellers maintain control and the price breaks below 0.000398, further downside movement toward 0.000350 could follow. A stronger breakdown could bring the previous low of 0.000301 into focus. 6. Volume Analysis Trading volume increased significantly during the initial bullish rally. However, volume has declined during the subsequent correction. This suggests that buying momentum has weakened. A fresh increase in buying volume would help confirm another potential upward movement. 7. Final Conclusion KOR/USDT is currently showing short-term bearish pressure following a significant bullish rally. The market is approaching an important support zone around 0.000410–0.000398. My outlook: NEUTRAL TO BEARISH in the short term. A recovery above 0.000470 would strengthen the bullish outlook, while a breakdown below 0.000398 could increase selling pressure. Trading Strategy: Watch the support zone carefully and wait for confirmation before entering a position. Avoid chasing sudden price movements. This analysis is based on the 1-hour chart and is not financial advice. --- Suggested BYBIT Post Title: KOR/USDT: Bullish Rally Faces Correction – Will Buyers Regain Control? #ByXIMPACT
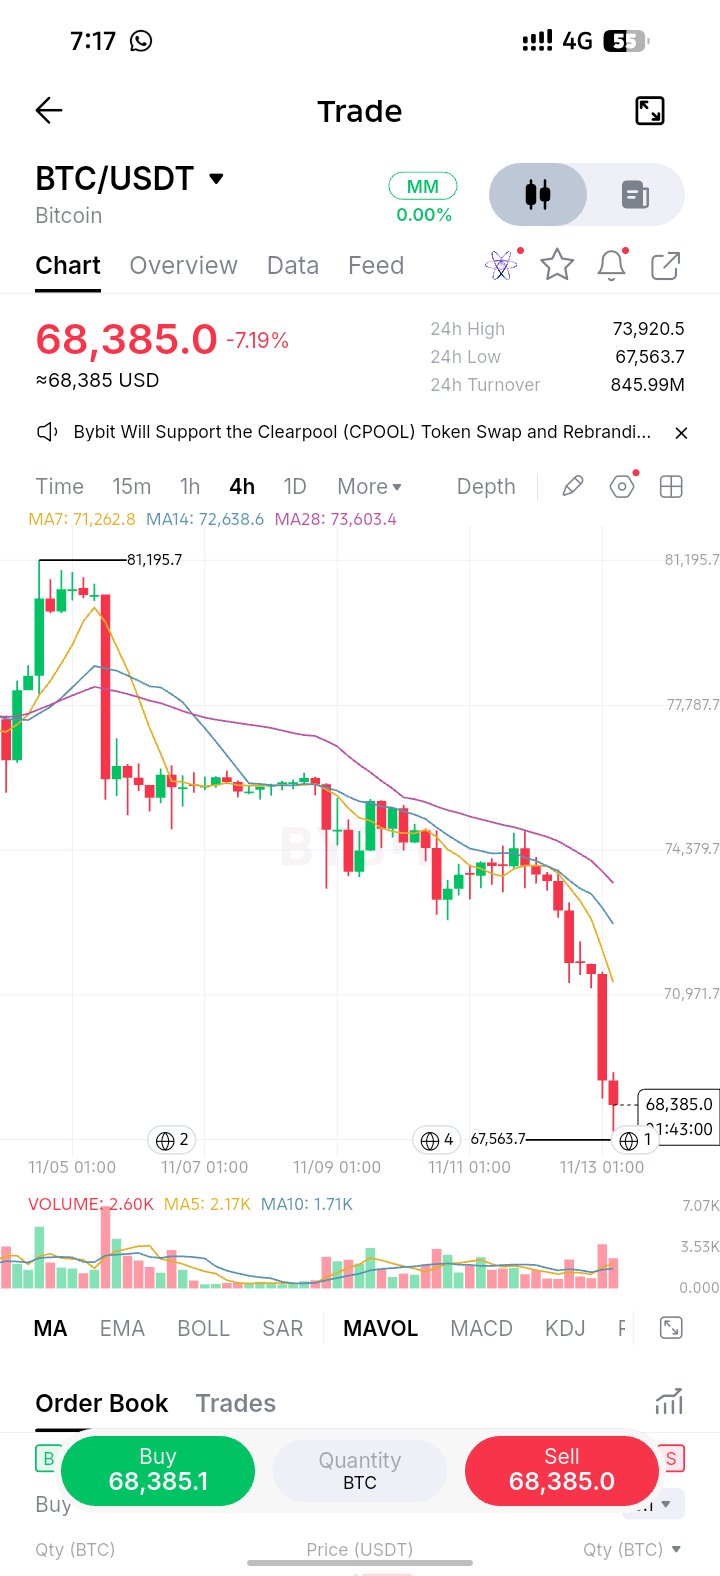
$BTCUSDT TECHNICAL ANALYSIS Timeframe: 4H Current Price: $68,385 24H Change: -7.19% MARKET OVERVIEW Bitcoin is currently showing strong bearish momentum on the 4-hour timeframe. The market has experienced significant selling pressure, resulting in a sharp decline from the $81,195 region. BTC is currently trading below the MA7, MA14, and MA28 moving averages. This indicates that sellers are maintaining control of the market, while buyers are struggling to regain momentum. TECHNICAL INDICATORS Moving Averages (MA): - MA7: $71,262.8 - MA14: $72,638.6 - MA28: $73,603.4 All three moving averages are above the current price, confirming the bearish market structure. Volume Analysis: Recent selling candles show increased trading activity. This suggests strong participation from sellers. However, volume confirmation will be important before expecting another major downward move. KEY SUPPORT LEVELS - $67,563 – Immediate support. - $67,000 – Psychological support. - $66,000 – Next potential support. - $65,000 – Major downside area to watch. KEY RESISTANCE LEVELS - $69,500 – First resistance. - $70,970 – Important resistance. - $71,262 – MA7 resistance. - $72,638 – MA14 resistance. - $73,603 – MA28 resistance. BEARISH SCENARIO If BTC breaks below $67,563 with strong selling volume and confirms the breakout, the price could move towards $67,000 and potentially $66,000. BULLISH SCENARIO If buyers defend the $67,563 support zone and BTC forms a strong bullish reversal candle, we could see a short-term recovery towards $69,500 and $70,970. TRADING STRATEGY Traders should avoid entering positions based on emotions. Wait for candle confirmation, monitor trading volume, and watch how BTC reacts around the key support and resistance zones. FINAL MARKET OUTLOOK BTC/USDT remains BEARISH on the 4H timeframe. Sellers currently have the advantage, but a strong reaction around the $67,563 support could change the short-term market direction. Always use proper risk management and set a stop-loss before entering any trade. 💬 What do you think? Will BTC break below $67,563 or will buyers push the price back up? #BitcoinHitsTwoMonthLowAfterUSMidterms #ByXIMPACT
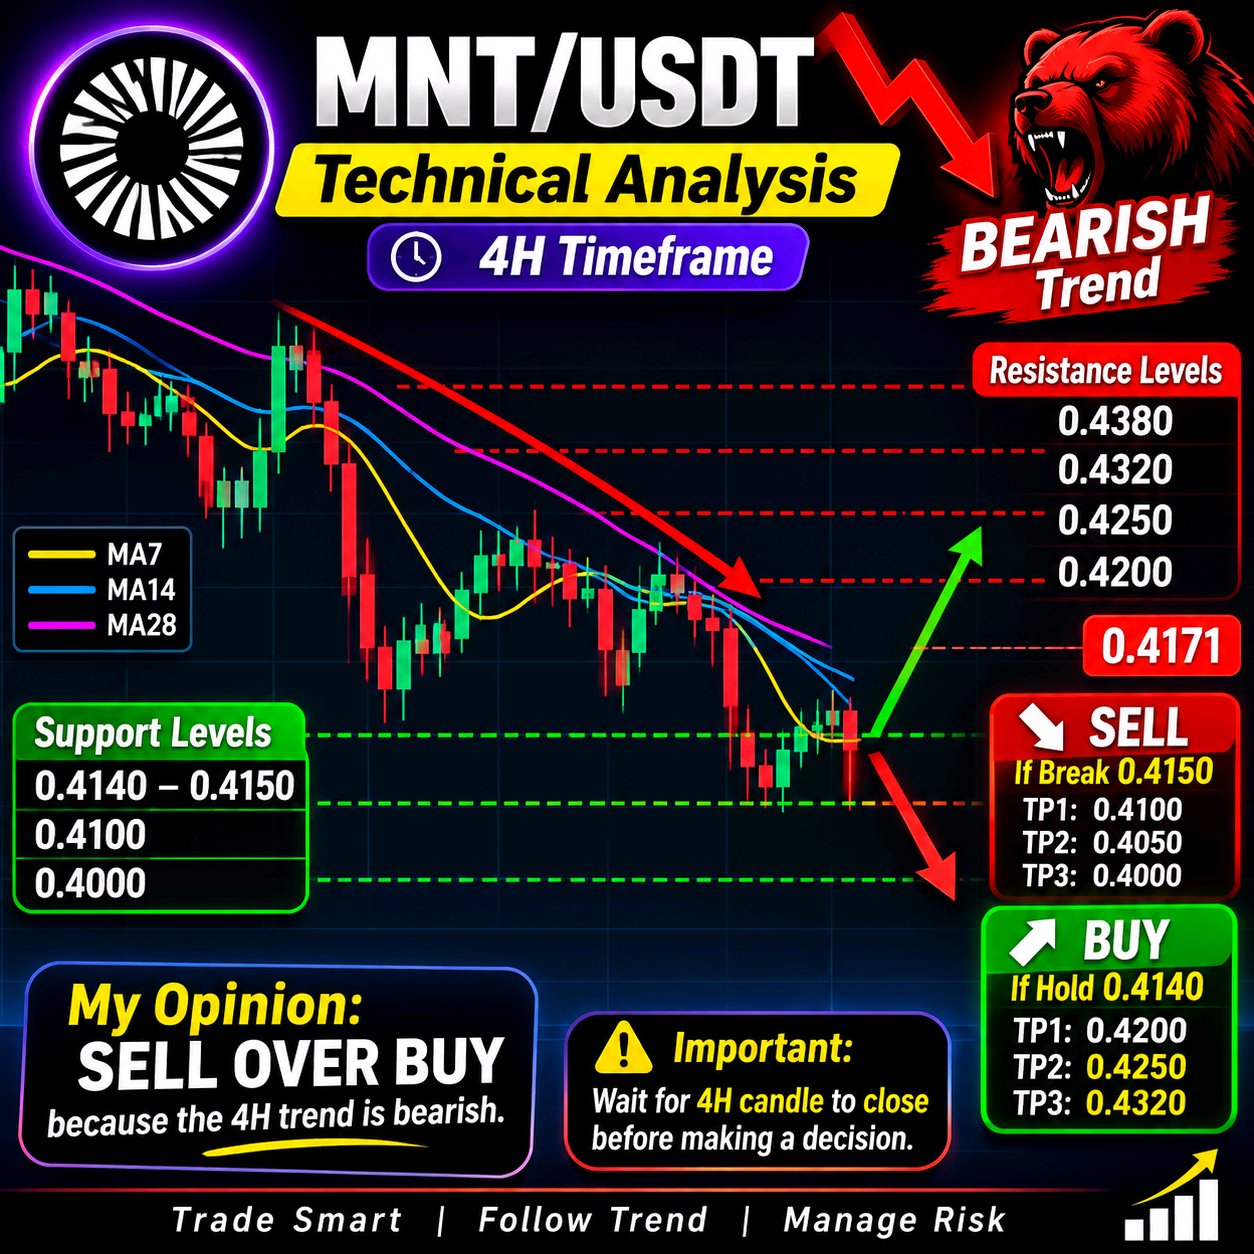
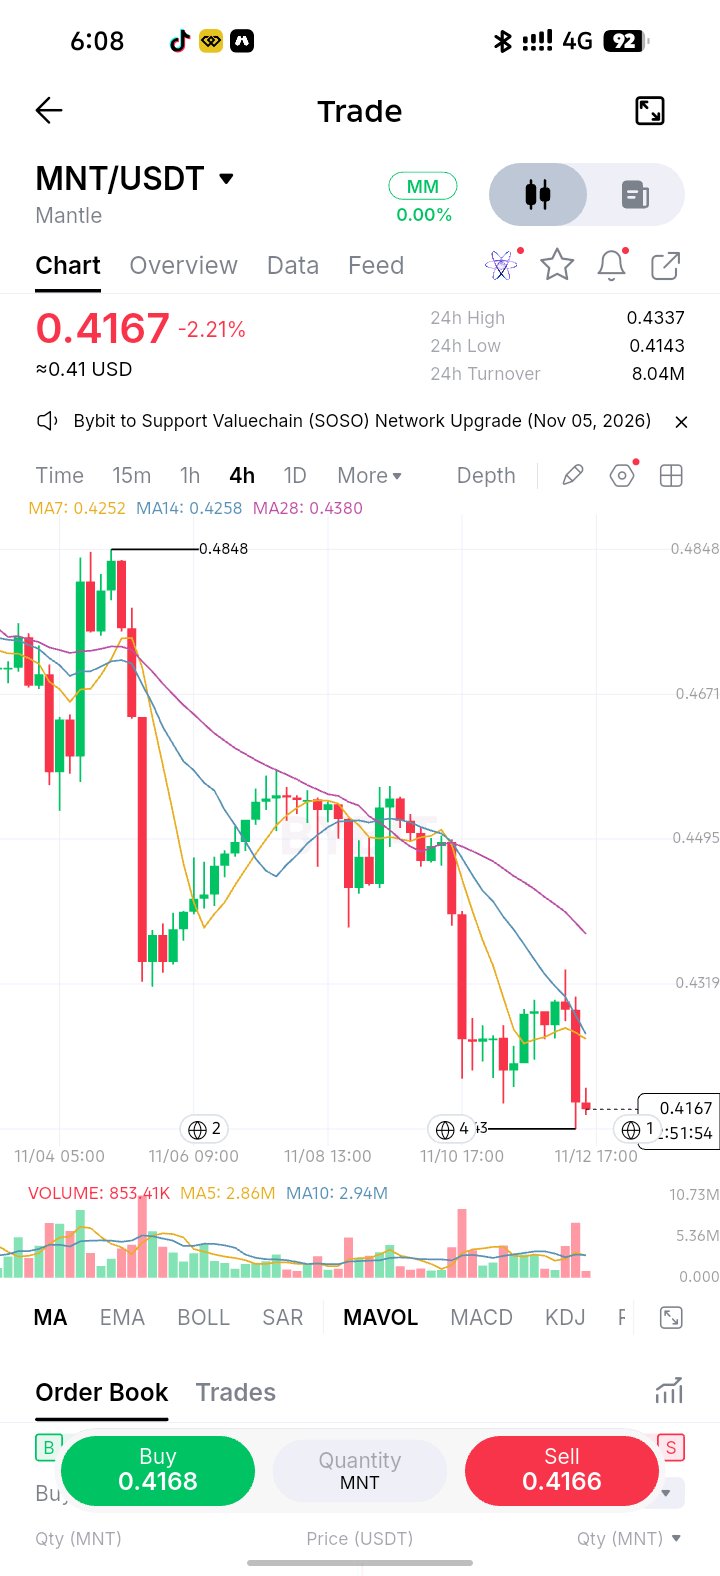
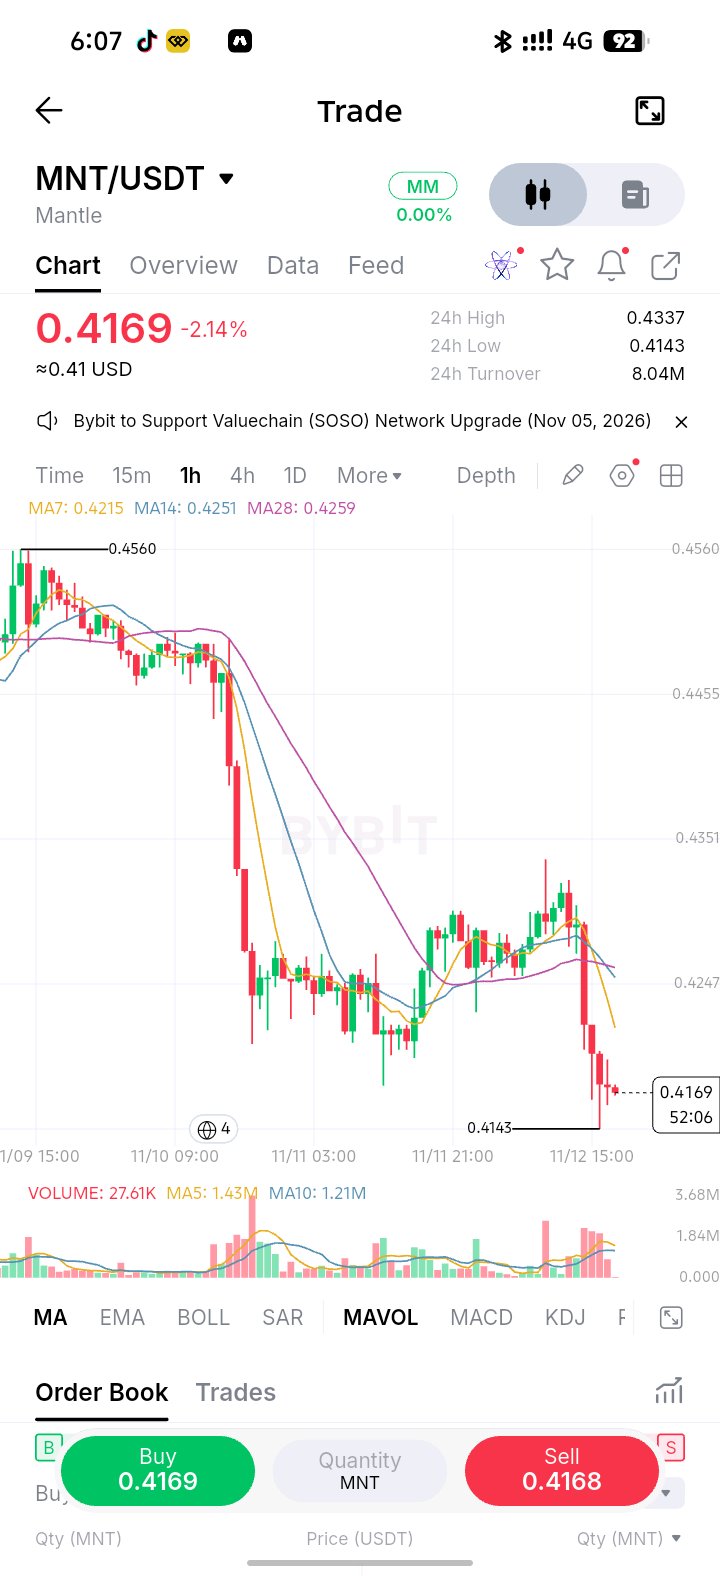
$MNTUSDT Technical Analysis Timeframe: 4H (4 Hours) Current Price: 0.4171 USDT 24H Change: -2.09% Market Trend: BEARISH 1. Market Structure MNT is currently in a strong downtrend. Price is making lower highs and lower lows. Sellers are controlling the market. The price is trading below MA7, MA14 and MA28. All three moving averages are pointing downward. This indicates bearish momentum. 2. Support Levels Watch these important levels: 0.4140 – 0.4150: Immediate support. 0.4100: Next possible support. 0.4000: Major psychological support. 3. Resistance Levels 0.4200: Immediate resistance. 0.4250: Stronger resistance. 0.4320: Major resistance. 0.4380: Additional resistance. 4. Trading Signals SELL Scenario If MNT breaks below 0.4140 with strong selling volume, the next possible targets are: TP1: 0.4100 TP2: 0.4050 TP3: 0.4000 BUY Scenario If MNT holds 0.4140 and produces a strong bullish reversal candle, watch for a recovery towards: TP1: 0.4200 TP2: 0.4250 TP3: 0.4320 5. My Professional Opinion BEARISH BIAS I currently favour SELL over BUY because the 4H trend is bearish. However, don't enter SELL without confirmation of a support breakdown. The price is already close to support. Important: Wait for the 4H candle to close before making a decision. --- Let me test your technical analysis knowledge. If MNT breaks below 0.4140, what do you expect? A. Market will go UP B. Market will go DOWN #ByXIMPACT @PERROUQ_LTC @Crypto BOSS @RoYoK @BlockchainMaster @RichardWyckoff
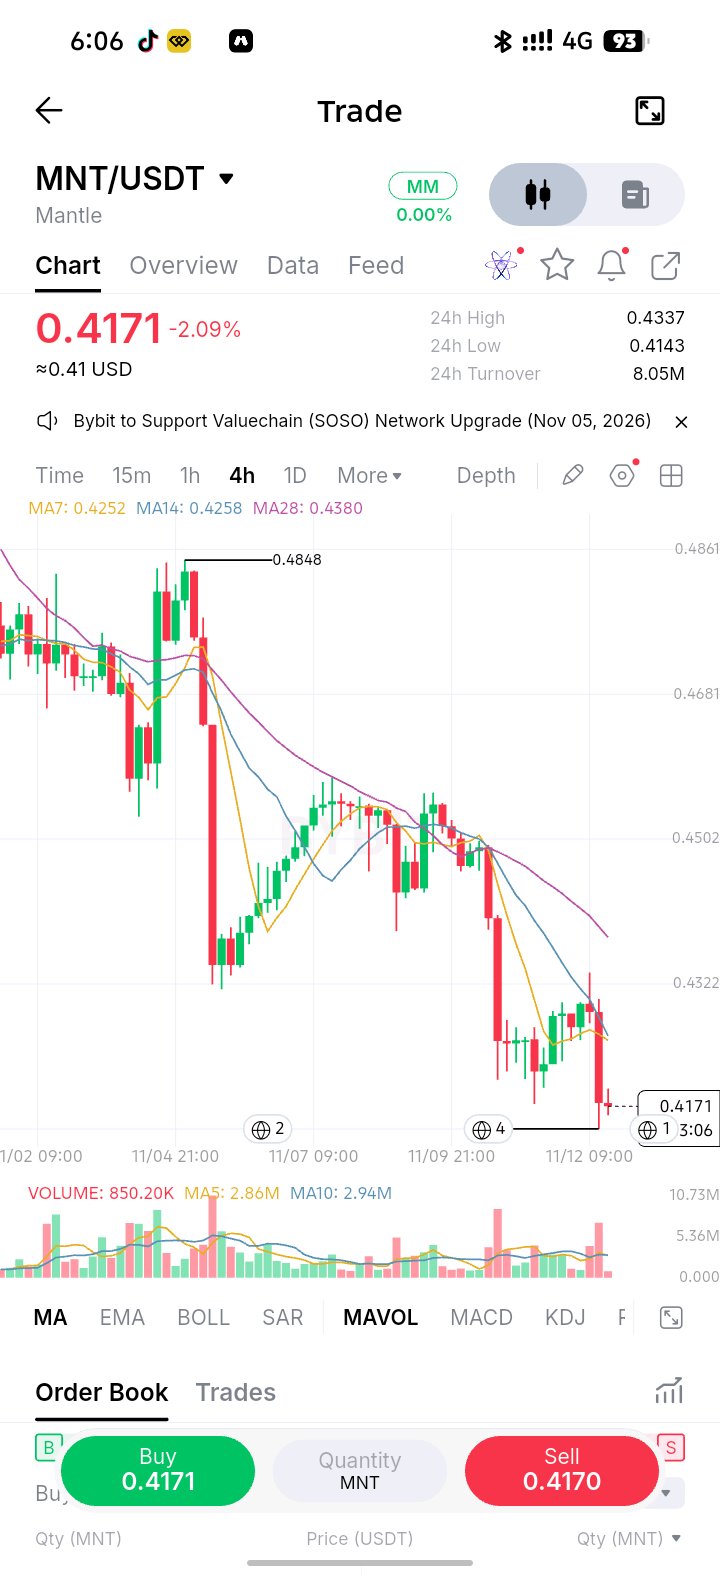
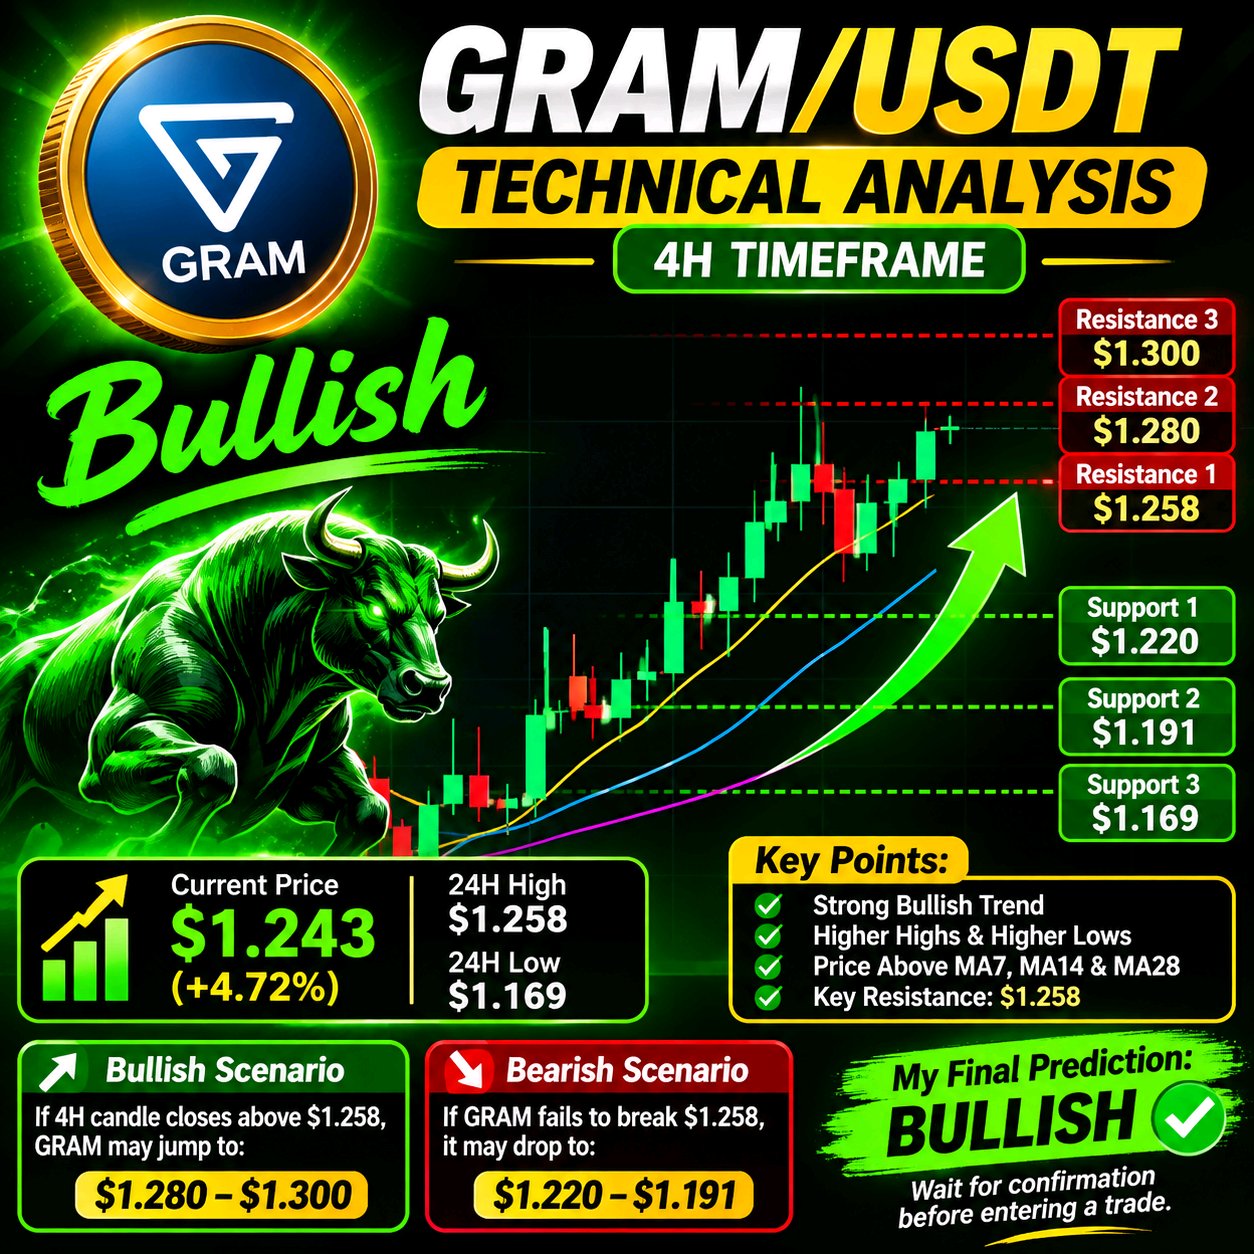
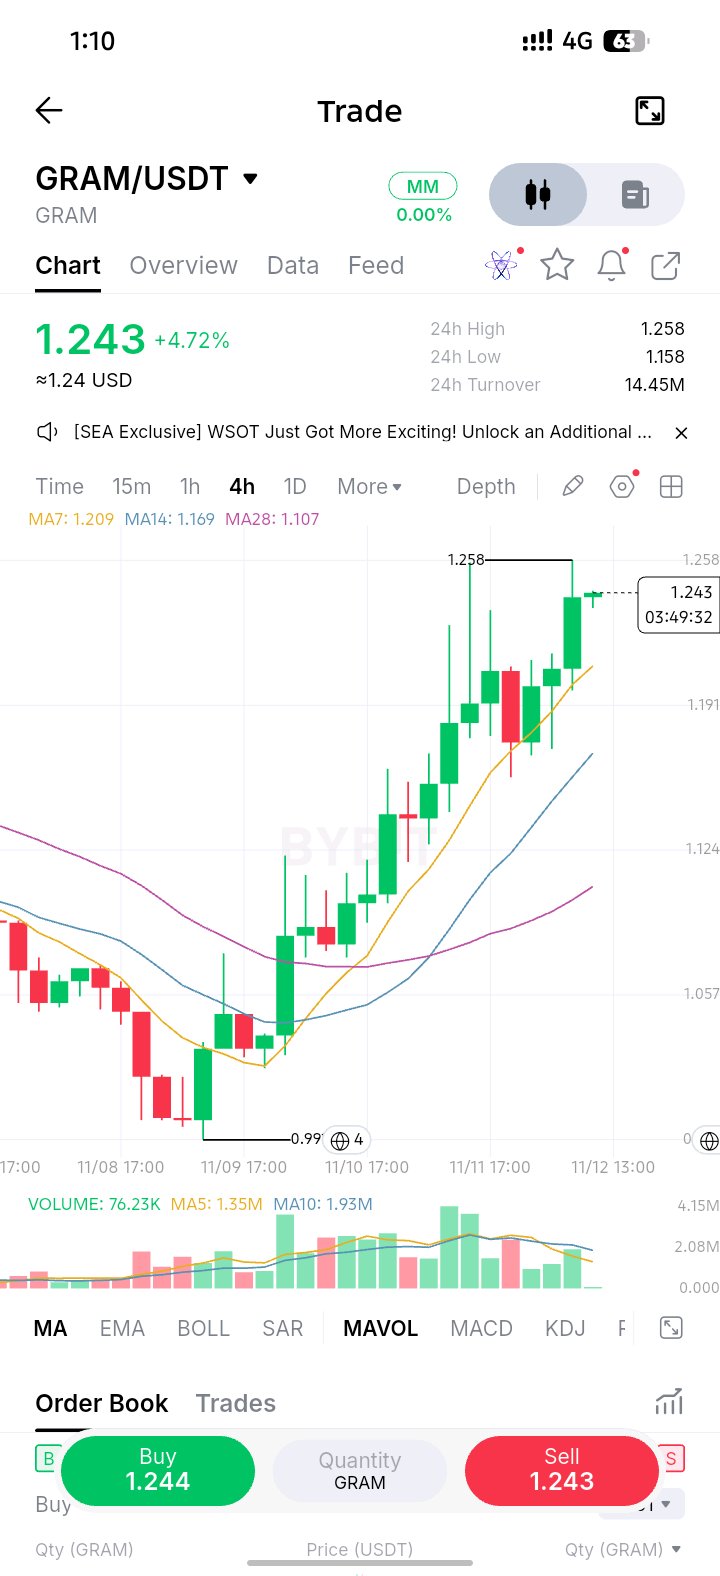
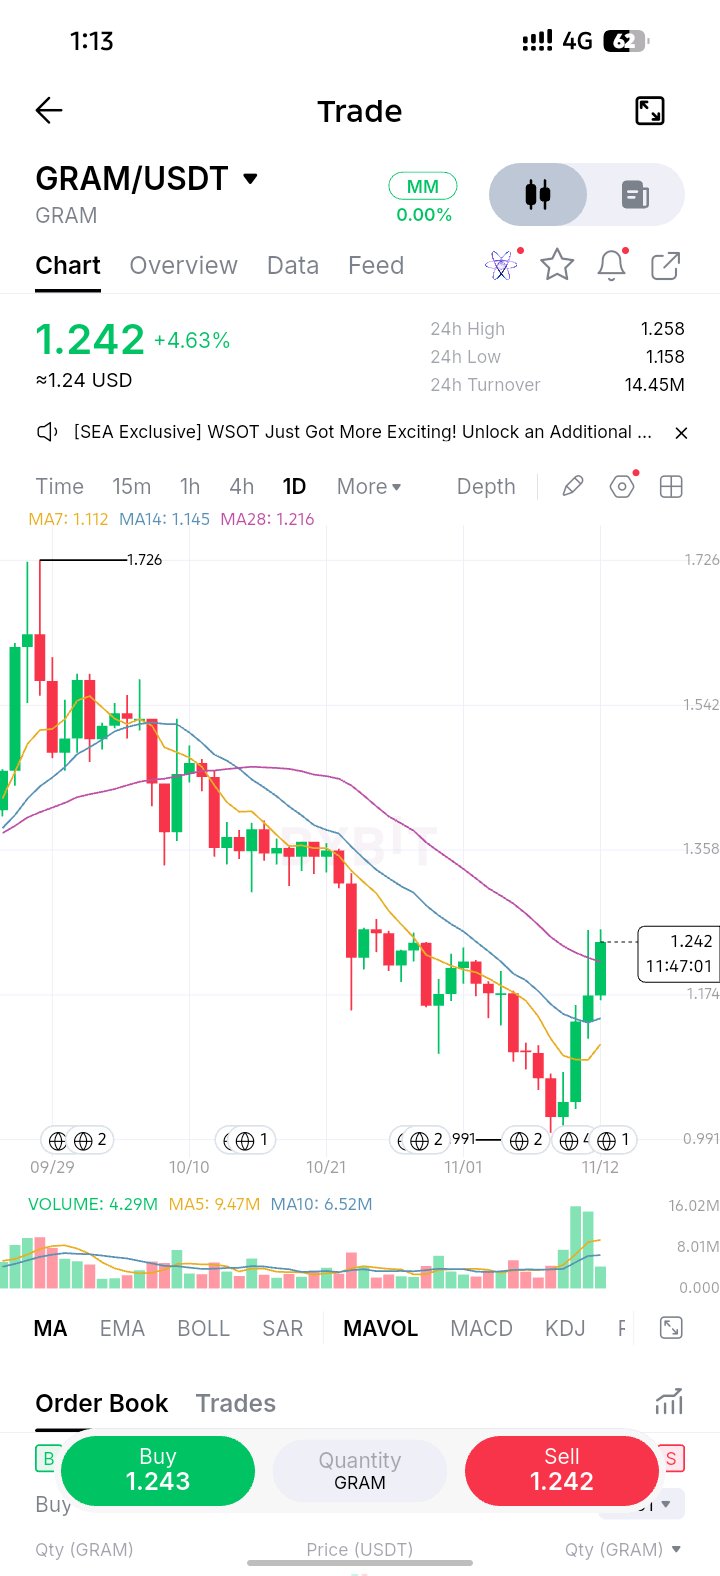
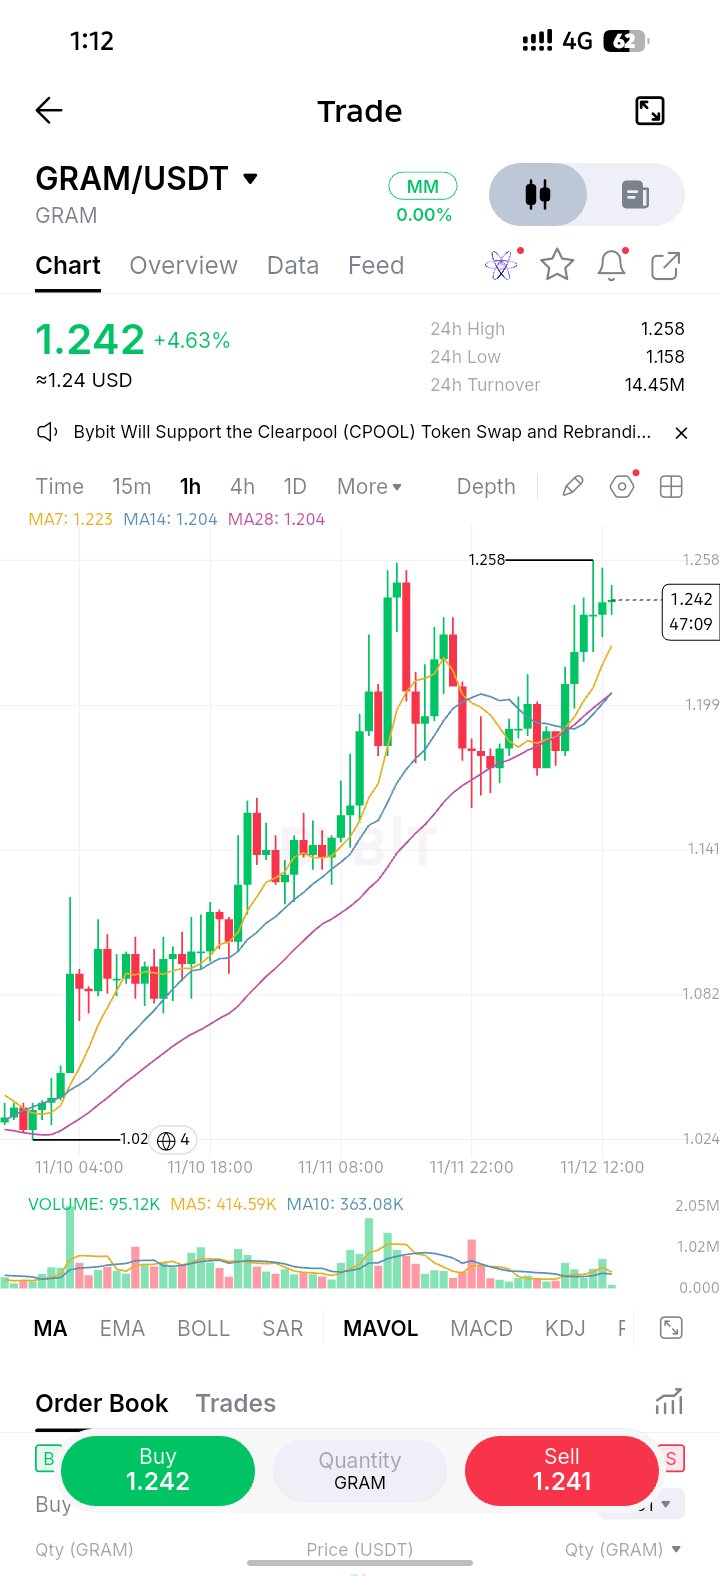
$GRAMUSDT Technical Analysis **Timeframe: 4 Hours (4H)** **Current Price:** $1.243 **24H Change:** +4.72% **24H High:** $1.258 **Market Trend:** BULLISH # 1. Market Structure GRAM is currently in a strong bullish trend. - Higher highs and higher lows are forming. - Buyers are controlling the market. - Price is trading above MA7, MA14 and MA28. - Moving averages are showing bullish alignment. ## 2. Support and Resistance | Level | Price | |---|---:| | Resistance 1 | $1.258 | | Resistance 2 | $1.280 | | Resistance 3 | $1.300 | | Support 1 | $1.220 | | Support 2 | $1.191 | | Support 3 | $1.169 | # 3. What Happens Next? **Bullish Scenario** If a 4H candle closes above $1.258 with strong volume, GRAM could continue towards: - $1.280 - $1.300 **Bearish Scenario** If GRAM fails to break $1.258, sellers may push the price down towards: - $1.220 - $1.191 # 4. Trading Strategy - Avoid chasing the price at resistance. - Wait for a confirmed breakout. - Alternatively, wait for a pullback towards support. - Watch volume before entering a trade. My Final Prediction **BULLISH GRAM has a strong bullish structure, but $1.258 is the key resistance to watch. **Important:** Wait for confirmation before opening a position. This is a chart-based analysis, not a guaranteed prediction. #ByXIMPACT
BNBUSDT analysis
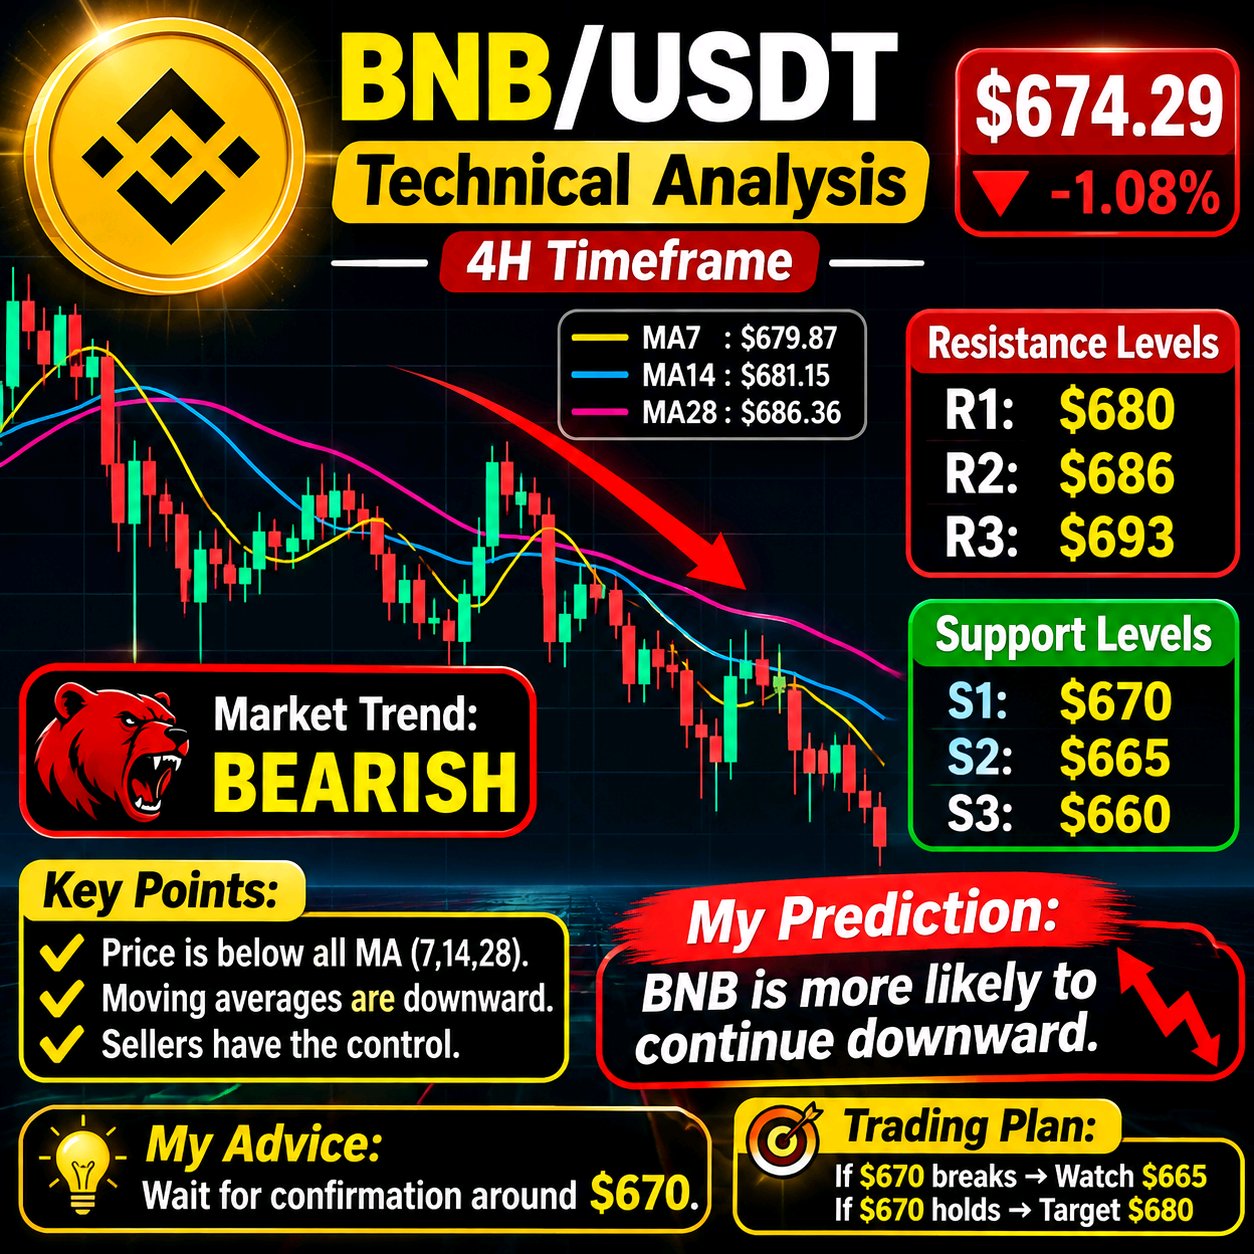
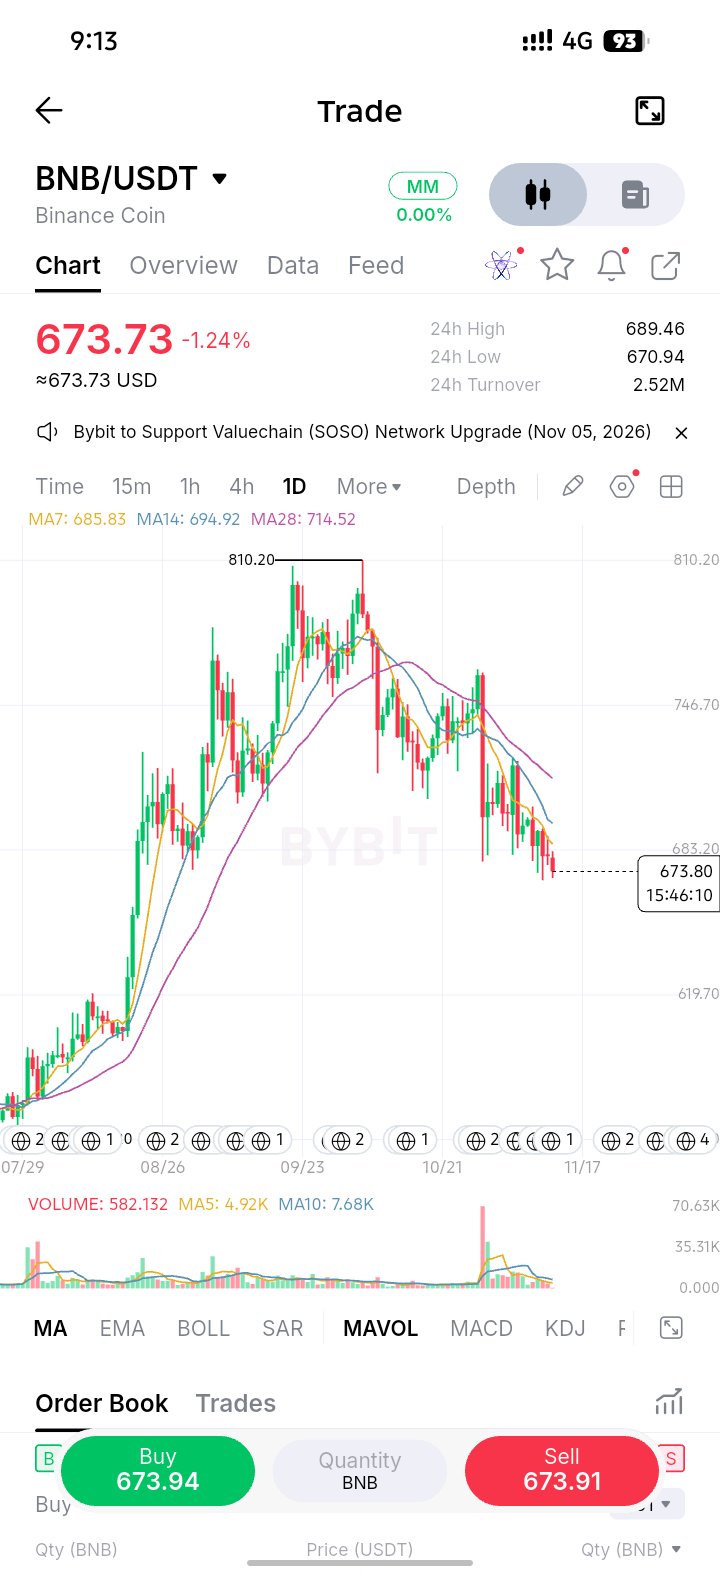
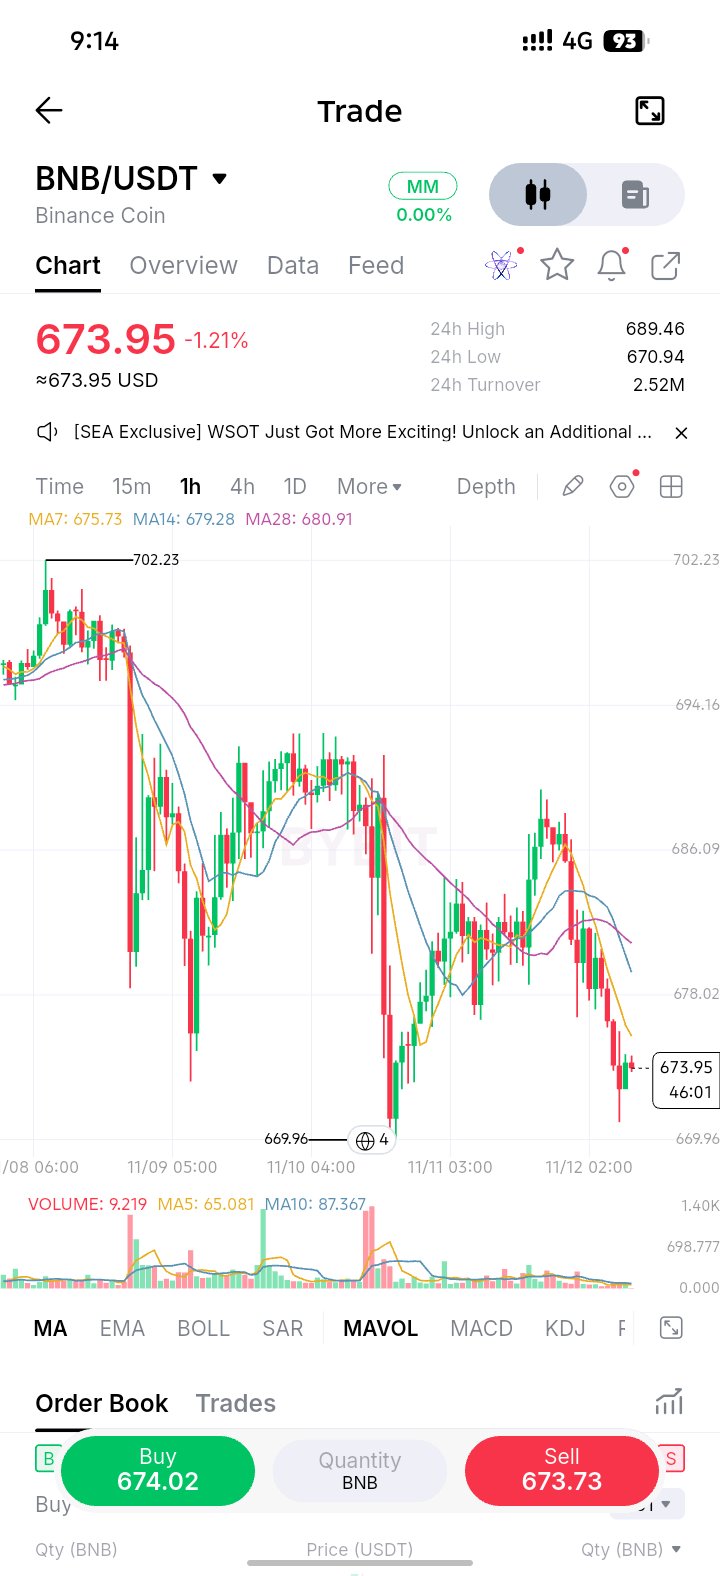
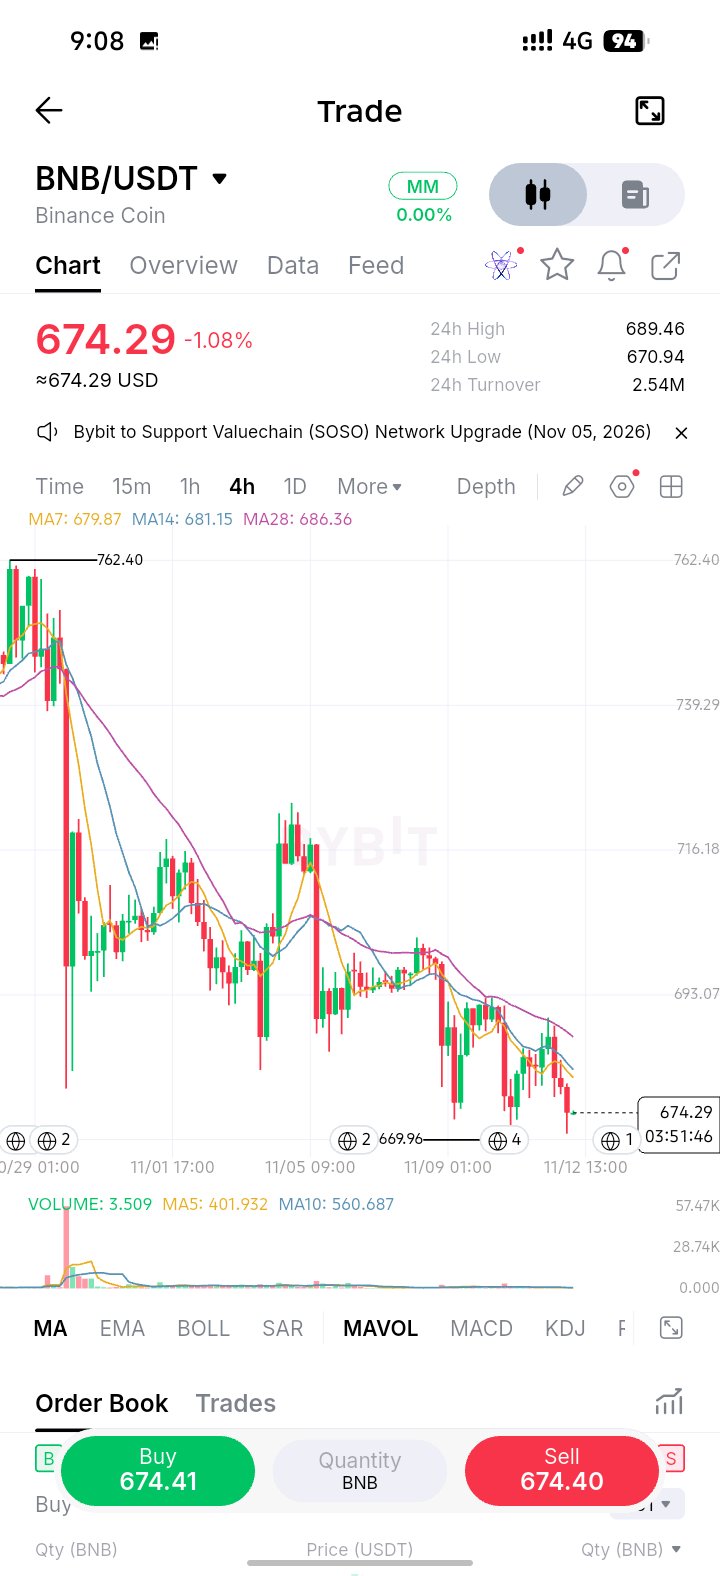
$BNBUSDT Technical Analysis Timeframe: 4 Hours (4H) Current Price: $674.29 24H Change: -1.08% Market Trend: BEARISH (Downtrend) 1. Market Direction BNB is currently showing bearish momentum. Reasons: Price is below MA7 ($679.87). Price is below MA14 ($681.15). Price is below MA28 ($686.36). All three moving averages are pointing downward. Sellers currently have more control of the market. 2. Support Levels Support 1: $670 Support 2: $665 Support 3: $660 If BNB breaks below $670 with a strong 4H candle, further downside is possible. 3. Resistance Levels Resistance 1: $680 Resistance 2: $686 Resistance 3: $693 BNB needs to break above $686 and hold to show signs of a stronger bullish reversal. 4. Trading Signals Signal Direction Current trend Bearish Moving averages Bearish Support $670 Resistance $680–686 Short-term outlook Bearish 5. My Prediction BNB is more likely to continue downward than upward in the short term. However: If $670 breaks, watch for $665. If $670 holds and a bullish reversal candle appears, a bounce towards $680 is possible. My advice: Don't rush to BUY. Wait for confirmation around $670. --- Technical Analysis Lesson Remember this important rule: When MA7 < MA14 < MA28, it often indicates a bearish trend. When MA7 > MA14 > MA28, it often indicates a bullish trend. #ByXIMPACT
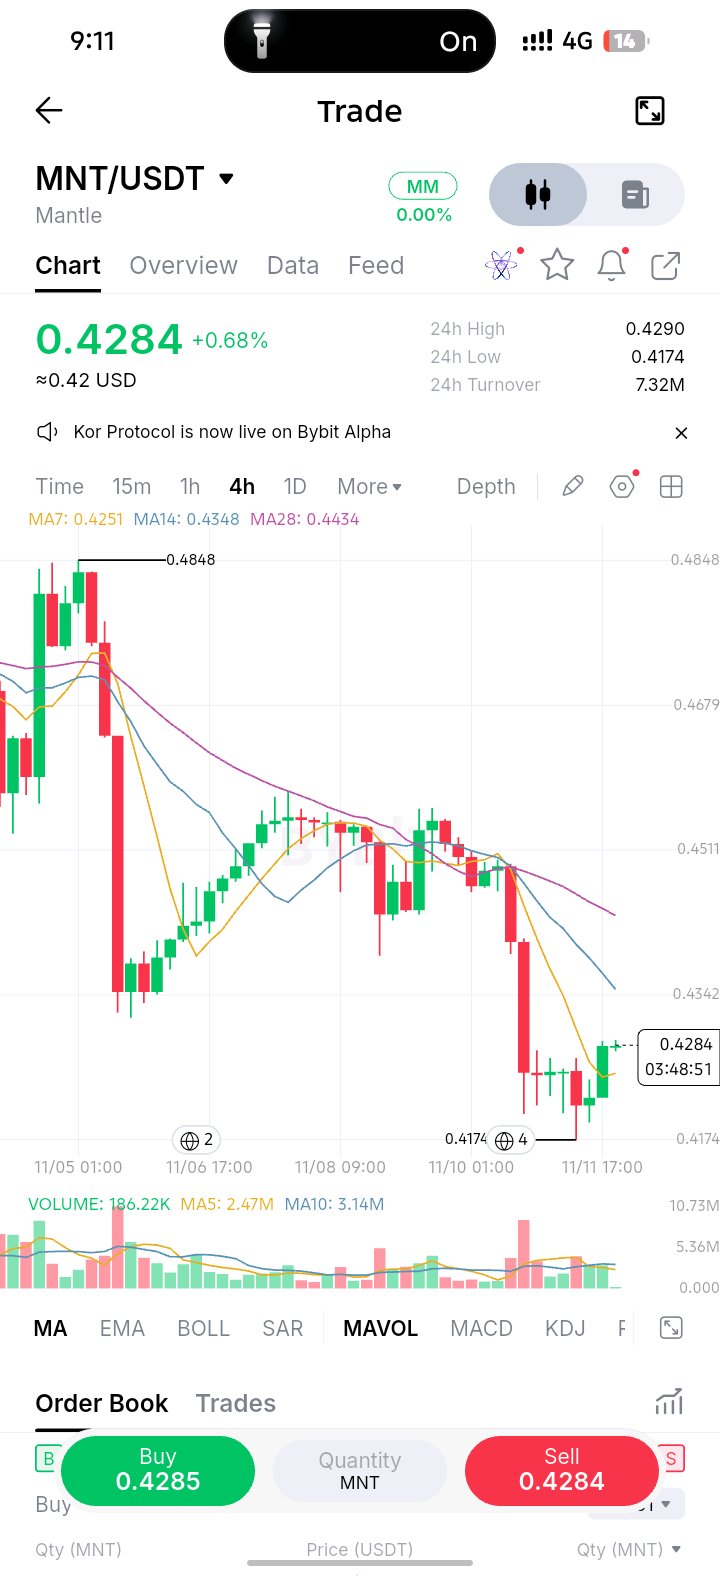
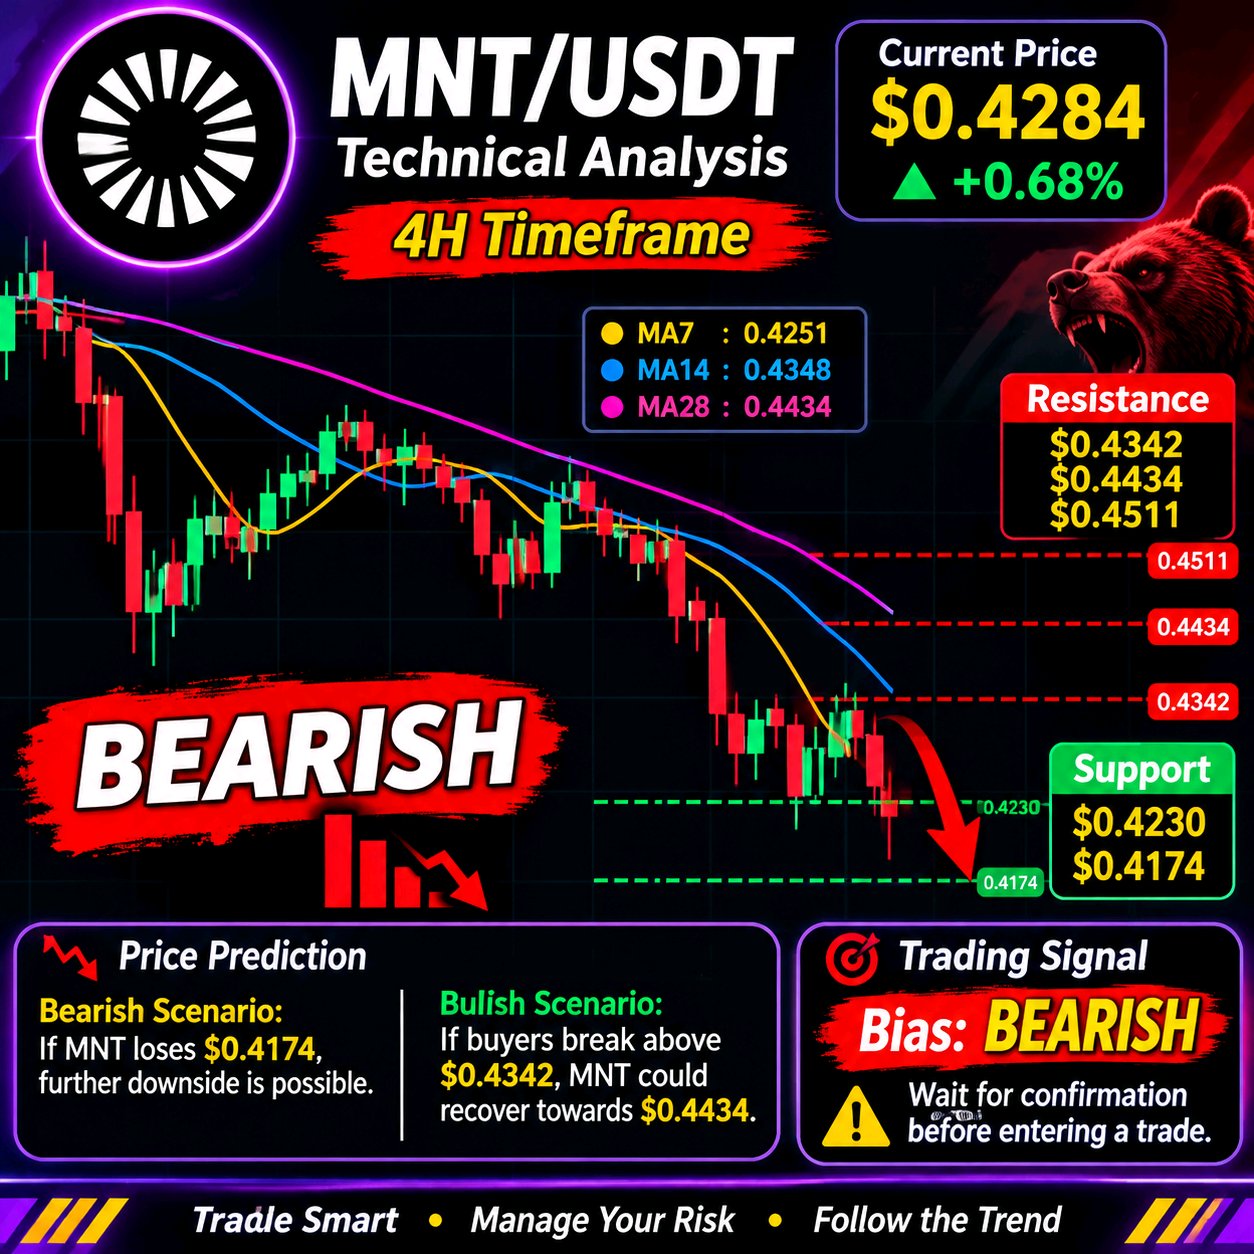
$MNTUSDT Technical Analysis (4H) Current Price: $0.4284 24H Change: +0.68% Trend: Bearish Market Analysis MNT is currently showing a bearish market structure after a strong downward move. MA7: 0.4251 – Short-term recovery. MA14: 0.4348 – Resistance. MA28: 0.4434 – Major resistance. Buyers are attempting a small recovery after touching the $0.4174 support area. The overall trend remains bearish until price breaks above key resistance levels. Key Levels Resistance: $0.4342 $0.4434 $0.4511 Support: $0.4230 $0.4174 Price Prediction Bearish scenario: If MNT loses $0.4174, further downside is possible. Bullish scenario: If buyers push above $0.4342 and maintain momentum, MNT could recover towards $0.4434. Trading Signal Bias: BEARISH I would wait for confirmation before entering a trade. The current upward movement could be only a temporary recovery. #ByXIMPACT
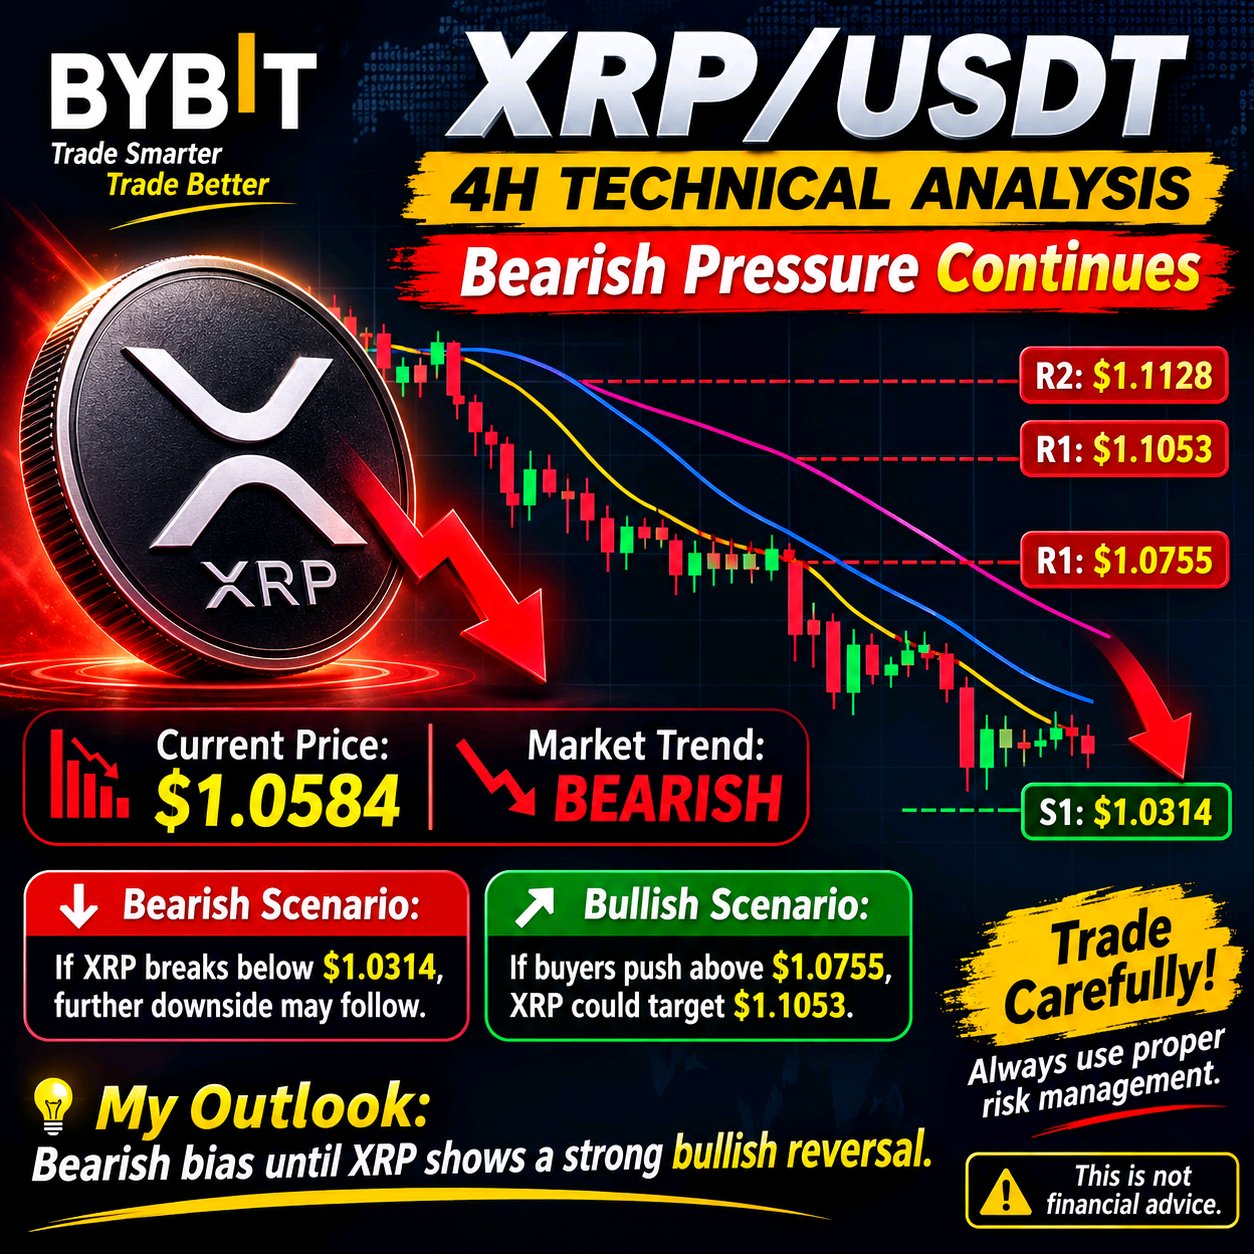
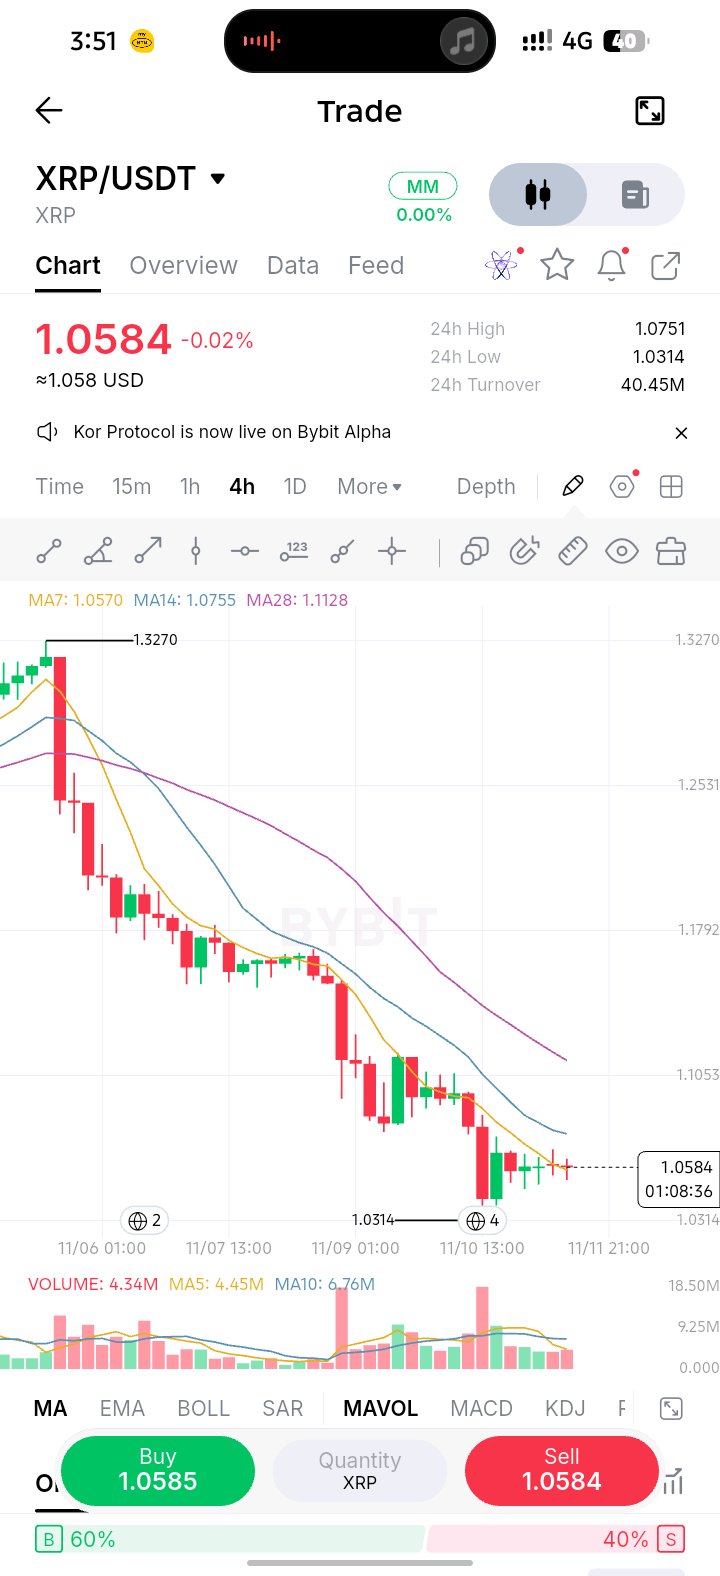
$XRPUSDT – 4H Technical Analysis | Bearish Pressure Continues XRP/USDT – 4H MARKET ANALYSIS Current Price: $1.0584 Market Trend: BEARISH XRP is still showing strong bearish momentum on the 4-hour timeframe. The price remains below MA14 and MA28, indicating that sellers are still controlling the market. Key Levels: Support 1: $1.0314 Resistance 1: $1.0755 Resistance 2: $1.1053 Major Resistance: $1.1128 Bearish Scenario: If XRP breaks below $1.0314, further downside movement may follow. Bullish Scenario: If buyers regain control and push the price above $1.0755, XRP could attempt a recovery toward $1.1053. My Outlook: Bearish bias until XRP shows a strong bullish reversal. Trade carefully. Always use proper risk management. This is not financial advice. #ByXIMPACT