NEUTRAL
6632Like0Shares169Fans70Follow
crypto trader/ meme coin
crypto trader/ meme coin
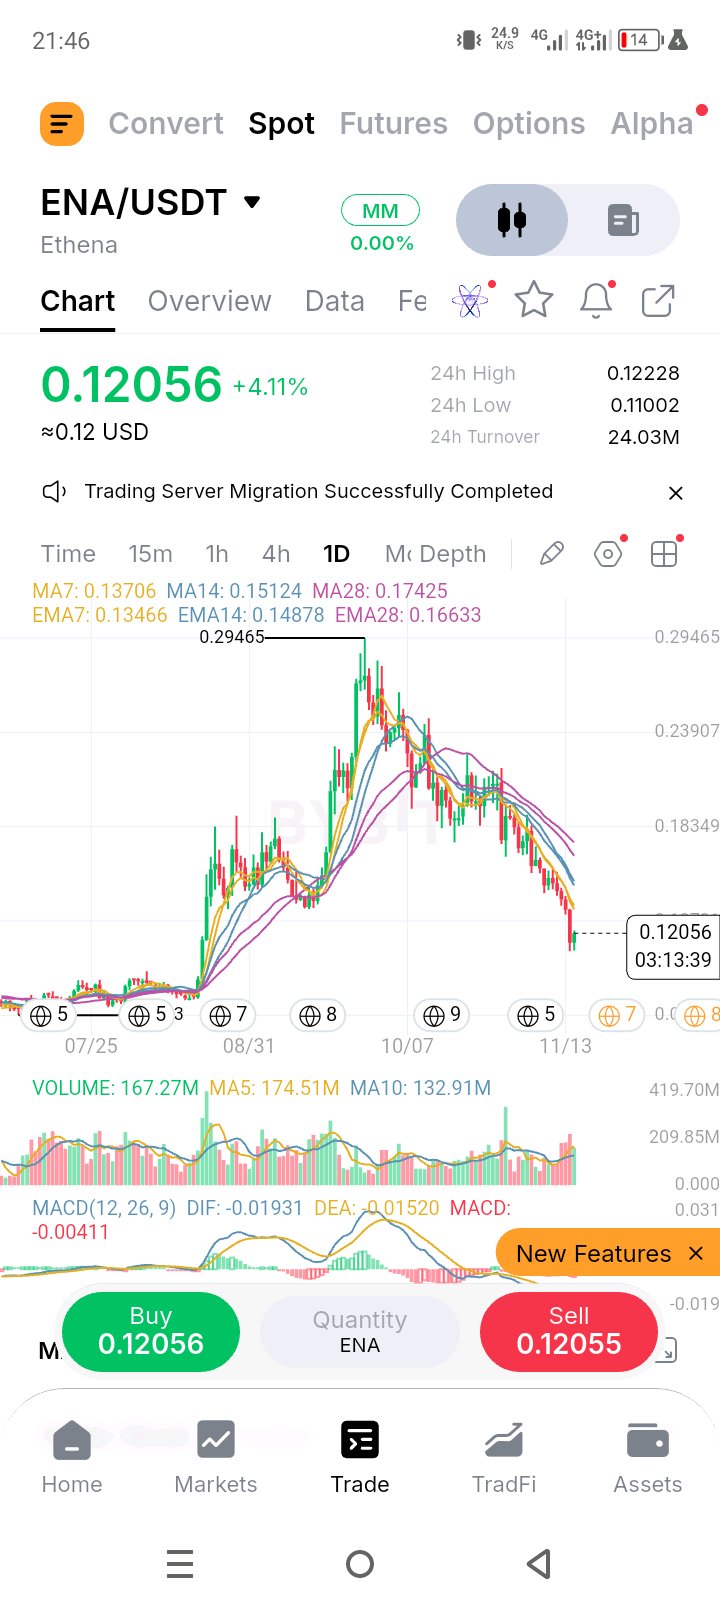
$ENAUSDT is at 0.12056 (+4.11%), about 59.1% under the 0.29465 high, 1.4% under the 24h high of 0.12228 and 9.6% above the 24h low of 0.11002. The 24h range is an 11.1% box, and the daily candle has about three hours left. Price flushed to 0.11002 and is bouncing, but it is still trading at the lowest levels since the August breakout, with the old base roughly 0.08-0.09 (approximate) below. Every average is overhead and falling, stacked fast under slow: 10.5-12.0% under the 7s (EMA7 0.13466, MA7 0.13706), 19.0-20.3% under the 14s (EMA14 0.14878, MA14 0.15124) and 27.5-30.8% under the 28s (EMA28 0.16633, MA28 0.17425). A +4.11% day only closes a small slice of that gap, so this is a bounce inside a downtrend until the 7s are won back. Volume is heavy on both sides of this move. Today’s bar is 167.27M with about three hours left, 25.9% above the MA10 (132.91M) and only 4.1% under the MA5 (174.51M), and the 24h turnover of 24.03M USDT works out to roughly 199.3M ENA, about 14% above the MA5 and 50% above the MA10. The MA5 sits 31.3% above the MA10. Real size traded at 0.11002, which is what a flush looks like, and a bounce on that kind of volume is worth respecting. MACD is still negative and pointing down: DIF (-0.01931) is under DEA (-0.01520), a histogram of -0.00411, with both lines below zero, so momentum has not turned yet. Levels to watch: Support: 0.11002 (24h low), then nothing marked until the July-August base, roughly 0.08-0.09 (approximate), and about 0.0723 (grid line, approximate). Resistance: 0.12228 (24h high), about 0.12791 (grid line, approximate), 0.13466 (EMA7), 0.13706 (MA7), 0.14878 (EMA14), 0.15124 (MA14), 0.16633 (EMA28), 0.17425 (MA28), 0.18349 (grid line), 0.23907 (grid line), then 0.29465 (the high). Plan, on daily closes: Low-hold long (counter-trend): a dip into 0.1100-0.1170 that holds on the daily close above 0.11002. Entry 0.1140, stop under 0.1075, which is 0.0065 of risk. 0.12791 is about 2.1R, 0.13466 about 3.2R and 0.14878 about 5.4R. Reclaim long: a daily close above 0.13706 on volume above the 174.51M MA5, then a retest of 0.1345-0.1375 that holds. Entry 0.1395, stop under 0.1330, which is 0.0065 of risk. 0.15124 is about 1.8R, so I’d trim there, then 0.17425 is about 5.3R and 0.18349 about 6.8R. Breakdown (short or exit): a daily close under 0.11002 on volume above the 174.51M MA5, then a failed retest of 0.1100-0.1180. Entry 0.1125, stop above 0.1195, which is 0.0070 of risk. Roughly 0.09 is about 3.2R and about 0.0723 about 5.7R, though both are approximate, so I’d trail after the first. Invalidation: the low-hold long fails under 0.1075. The bearish read softens on a daily close above 0.15124 (MA14), and the downtrend has turned above 0.17425 (MA28). Risk note: a bounce this size inside a downtrend can fade as fast as it came, and the candle still has three hours to run. Stops matter more than targets. Limit orders, small size. That’s my read of the chart, not advice.$ENAUSDT #ByXIMPACT
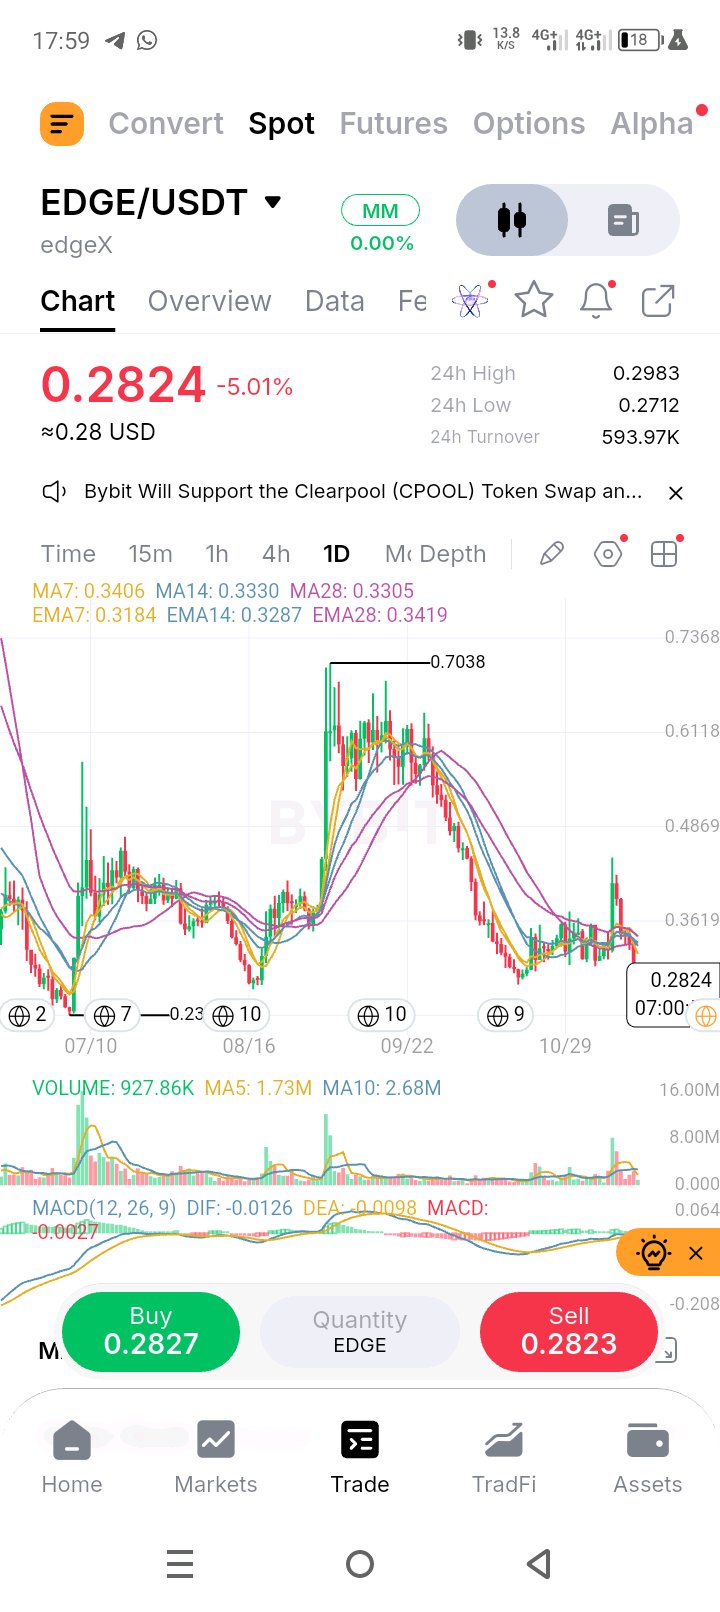
$EDGEUSDT is at 0.2824 (-5.01%), about 59.9% under the 0.7038 high, 5.3% under the 24h high of 0.2983 and 4.1% above the 24h low of 0.2712. The 24h range is a 10.0% box, and the daily candle has about seven hours left. Price has given back the whole September spike and is back near the bottom of the October-November range, roughly 0.27-0.36 by my read (approximate), with the July low of about 0.237 (approximate) still 19.2% below. Price is under every average, and they are tangled in a 0.318-0.342 pack, not stacked: 11.3% under the EMA7 (0.3184), 14.1% under the EMA14 (0.3287), 14.6% under the MA28 (0.3305), 15.2% under the MA14 (0.3330), 17.1% under the MA7 (0.3406) and 17.4% under the EMA28 (0.3419). A tangle like that is a drifting range, and a reclaim has to clear all of it. Volume is light on this drop. The 24h turnover of 593.97K USDT works out to roughly 2.10M EDGE, 22% above the MA5 (1.73M) but 22% under the MA10 (2.68M), and today’s bar is 927.86K with about seven hours left. The MA5 sits 35.4% under the MA10, because the November spike is still inside the MA10 window, so activity has faded since. A -5.01% day without a volume surge is a drift, not a capitulation. MACD is negative but shallow: DIF (-0.0126) is under DEA (-0.0098), a histogram of -0.0027, with both lines just below zero. Levels to watch: Support: 0.2712 (24h low, which lines up with the October low, approximate), then about 0.237 (the July low, approximate). Nothing is marked below it. Resistance: 0.2983 (24h high), 0.3184 (EMA7), 0.3287 (EMA14), 0.3305 (MA28), 0.3330 (MA14), 0.3406 (MA7), 0.3419 (EMA28), 0.3619 (grid line), roughly 0.44 (the November spike high, approximate), 0.4869 (grid line), 0.6118 (grid line), then 0.7038 (the high). Plan, on daily closes: Low-hold long (counter-trend): a dip into 0.2700-0.2790 that holds on the daily close above 0.2712. Entry 0.2750, stop under 0.2600, which is 0.0150 of risk. 0.3184 is about 2.9R, 0.3419 about 4.5R and 0.3619 about 5.8R. Reclaim long: a daily close above 0.3419 on volume above the 1.73M MA5, then a retest of 0.3330-0.3420 that holds. Entry 0.3480, stop under 0.3280, which is 0.0200 of risk. 0.3619 is only about 0.7R, so I’d trim a small piece there, then roughly 0.44 (approximate) is about 4.6R and 0.4869 about 6.9R. Breakdown (short or exit): a daily close under 0.2712 on volume above the 1.73M MA5, then a failed retest of 0.2710-0.2800. Entry 0.2740, stop above 0.2830, which is 0.0090 of risk. 0.2369 is about 4.1R, though it is approximate, and with nothing marked below it I’d trail the rest. Invalidation: the low-hold long fails under 0.2600. The bearish read softens on a daily close above 0.3330 (MA14), and the downtrend has turned above 0.3419 (EMA28). Risk note: 24h turnover is only 593.97K USDT, so this is a thin book and wicks can run through levels. Stops matter more than targets. Limit orders, small size. That’s my read of the chart, not advice.$EDGEUSDT #ByXIMPACT
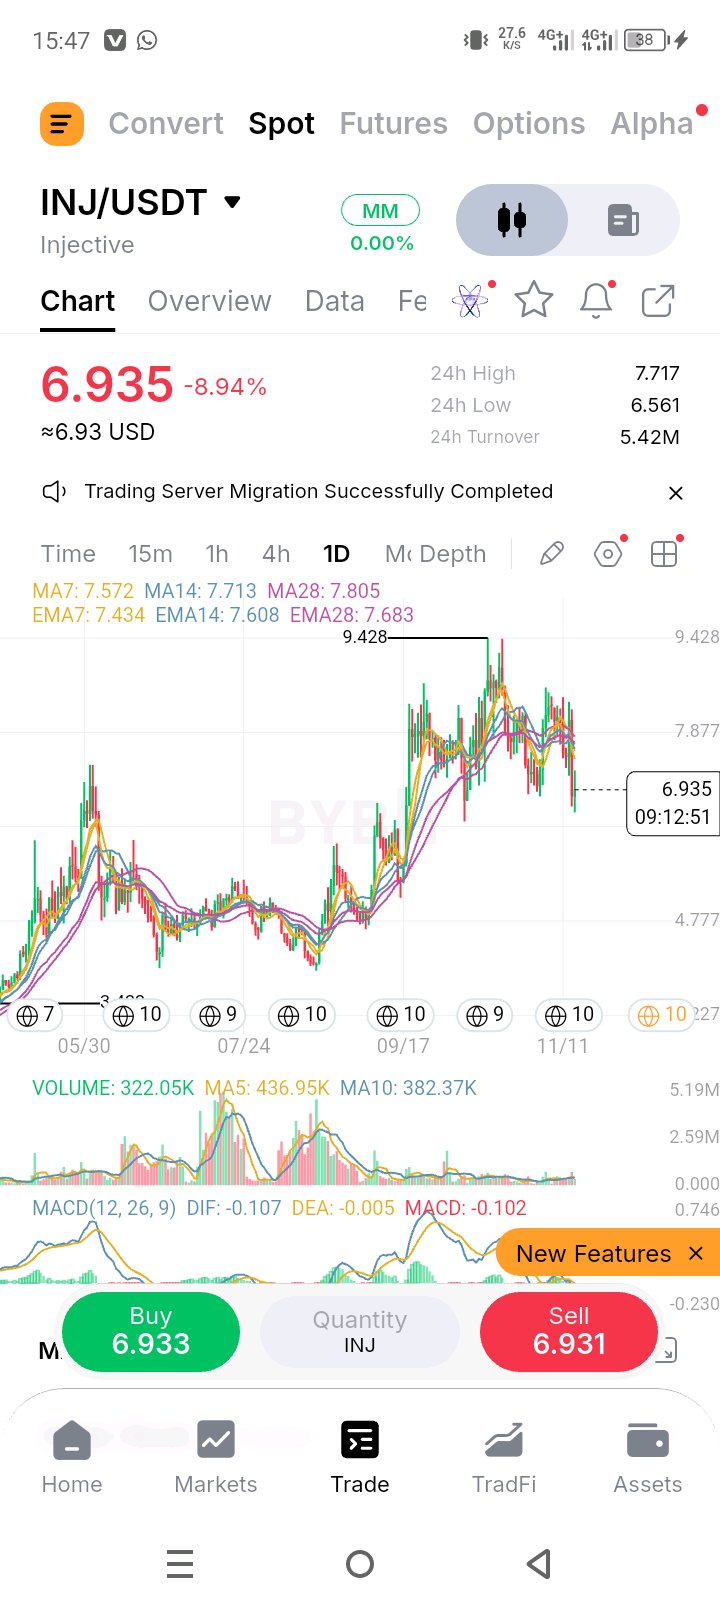
$INJUSDT is at 6.935 (-8.94%), about 26.4% under the 9.428 high, 10.1% under the 24h high of 7.717 and 5.7% above the 24h low of 6.561. The 24h range is a 17.6% box, and the daily candle has about nine hours left. Price is breaking the floor of the October-November range, roughly 6.9-7.0 by my read (approximate), after weeks of chop. Every average is overhead and bunched into a tight 7.43-7.81 band, stacked fast under slow: 6.7-8.4% under the 7s (EMA7 7.434, MA7 7.572), 8.8-10.1% under the 14s (EMA14 7.608, MA14 7.713) and 9.7-11.1% under the 28s (EMA28 7.683, MA28 7.805). That compression is what a range looks like from the inside, and price has just fallen out of the bottom of it, so the whole band now acts as one resistance zone. Volume is heavy on the drop. The 24h turnover of 5.42M USDT works out to roughly 781.5K INJ, about 1.8x the MA5 (436.95K) and 2.0x the MA10 (382.37K), while today’s bar is 322.05K with about nine hours left, so it is still building. The MA5 sits 14.3% above the MA10, so participation has been rising into the fall. That is conviction selling, not a liquidity gap. MACD is negative and sliding: DIF (-0.107) has dropped well under DEA (-0.005), a histogram of -0.102, with both lines below zero. Levels to watch: Support: 6.561 (24h low), roughly 6.4-6.5 (the early-October low, approximate), about 6.327 (grid line, approximate), then 4.777 (grid line). Nothing is marked between the last two. Resistance: 7.434 (EMA7), 7.572 (MA7), 7.608 (EMA14), 7.683 (EMA28), 7.713 (MA14), 7.717 (24h high), 7.805 (MA28), 7.877 (grid line), roughly 8.5 (the top of the October-November range, approximate), then 9.428 (the high). Plan, on daily closes: Low-hold long (counter-trend): a dip into 6.35-6.56 that holds on the daily close above 6.327. Entry 6.50, stop under 6.20, which is 0.30 of risk. 7.434 is about 3.1R, 7.683 about 3.9R and 7.877 about 4.6R. Reclaim long: a daily close above 7.805 on volume above the 436.95K MA5, then a retest of 7.70-7.82 that holds. Entry 7.95, stop under 7.62, which is 0.33 of risk. Roughly 8.5 is about 1.7R (approximate), so I’d trim there, then 9.428 is about 4.5R. Breakdown (short or exit): a daily close under 6.327 on volume above the 436.95K MA5, then a failed retest of 6.33-6.60. Entry 6.45, stop above 6.65, which is 0.20 of risk. Nothing is marked between 6.33 and 4.777, so the trade is a trail toward the 4.777 grid line, about 8.4R. Invalidation: the low-hold long fails under 6.20. The bearish read softens on a daily close above 7.572 (MA7), and the downtrend has turned above 7.805 (MA28). Risk note: -8.94% in a day takes price out of a range it had held for weeks, and with nothing marked between 6.33 and 4.777, a failed floor can fall fast. Stops matter more than targets. Limit orders, small size. That’s my read of the chart, not advice.$INJUSDT #ByXIMPACT
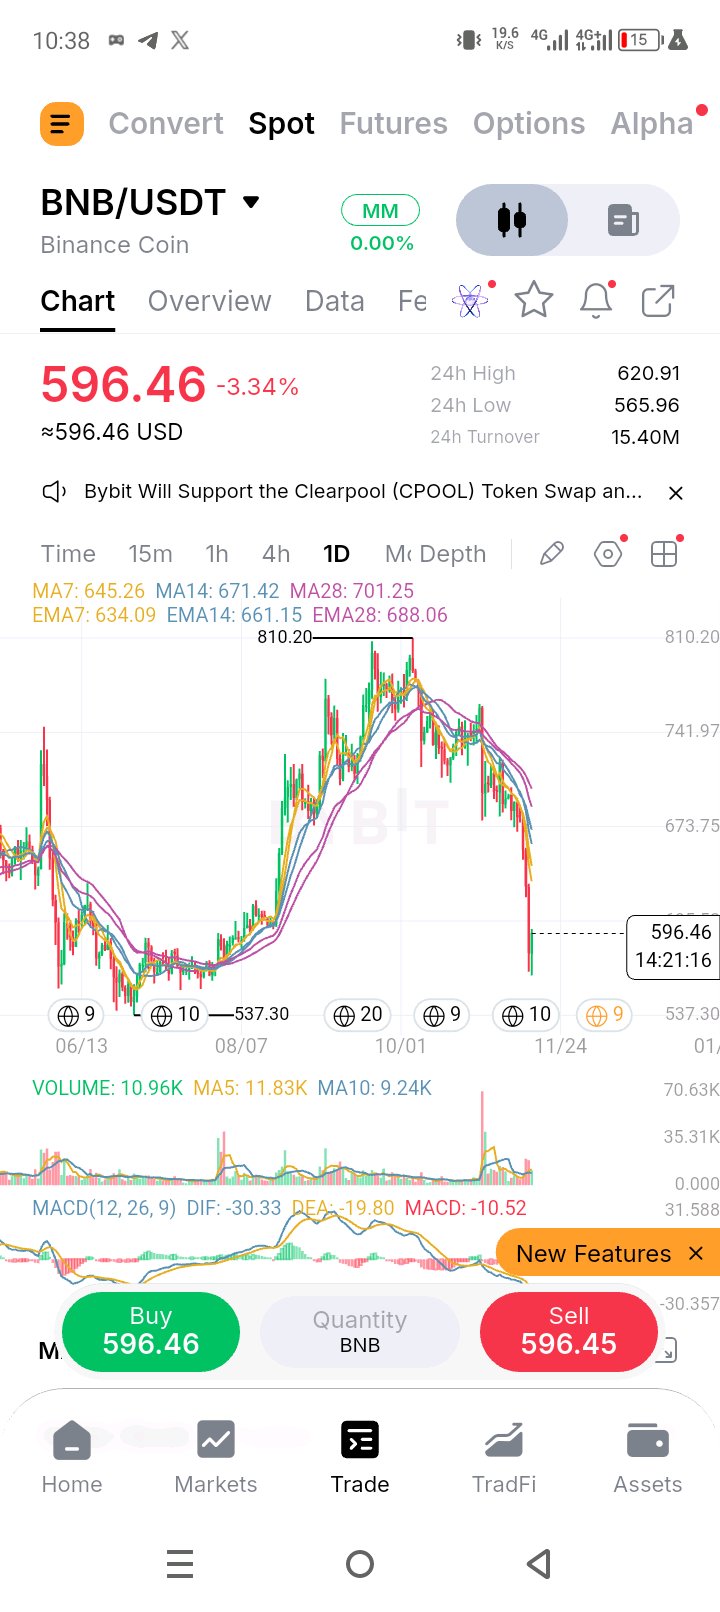
$BNBUSDT is at 596.46 (-3.34%), about 26.4% under the 810.20 high, 3.9% under the 24h high of 620.91 and 5.4% above the 24h low of 565.96. The 24h range is a 9.7% box, and the daily candle has about fourteen hours left. Price has given back most of the rally and is back at the top of the July-August base, roughly 565-595 by my read (approximate), with the 537.30 low still 11.0% below. Every average is overhead and falling, stacked fast under slow: 5.9-7.6% under the 7s (EMA7 634.09, MA7 645.26), 9.8-11.2% under the 14s (EMA14 661.15, MA14 671.42) and 13.3-14.9% under the 28s (EMA28 688.06, MA28 701.25). The 7s have rolled over hard, so the first test is the 634-645 pocket, not the 28s. Volume told the story on the way down. The 24h turnover of 15.40M USDT works out to roughly 25.8K BNB, about 2.2x the MA5 (11.83K), and today’s bar is 10.96K with about fourteen hours left, already 18.6% above the MA10 (9.24K). The MA5 sits 28.0% above the MA10, so participation has been building into the flush. That is heavy selling that tagged the base lows at 565.96 and bounced. MACD is negative and pointing down hard: DIF (-30.33) is under DEA (-19.80), a histogram of -10.52, with both lines below zero. Levels to watch: Support: 565.96 (24h low), roughly 565-580 (the July-August base lows, approximate), 537.30 (the low marked on the chart). Nothing is marked below it. Resistance: about 605.52 (grid line, approximate), 620.91 (24h high), 634.09 (EMA7), 645.26 (MA7), 661.15 (EMA14), 671.42 (MA14), 673.75 (grid line), 688.06 (EMA28), 701.25 (MA28), 741.97 (grid line), then 810.20 (the high). Plan, on daily closes: Low-hold long (counter-trend): a dip into 565-585 that holds on the daily close above 565.96. Entry 575, stop under 555, which is 20 of risk. 634.09 is about 3.0R, 661.15 about 4.3R and 688.06 about 5.7R. Reclaim long: a daily close above 645.26 on volume above the 11.83K MA5, then a retest of 632-646 that holds. Entry 652, stop under 625, which is 27 of risk. 671.42 is only about 0.7R, so I’d trim a small piece there, then 701.25 is about 1.8R and 741.97 about 3.3R. Breakdown (short or exit): a daily close under 565.96 on volume above the 11.83K MA5, then a failed retest of 566-590. Entry 572, stop above 590, which is 18 of risk. 537.30 is about 1.9R, and with nothing marked below it I’d trail the rest. Invalidation: the low-hold long fails under 555. The bearish read softens on a daily close above 671.42 (MA14), and the downtrend has turned above 701.25 (MA28). Risk note: price is sitting on the top edge of an old base after a vertical drop, so it can snap back or break through quickly. Stops matter more than targets. Limit orders, small size. That’s my read of the chart, not advice.$BNBUSDT #ByXIMPACT
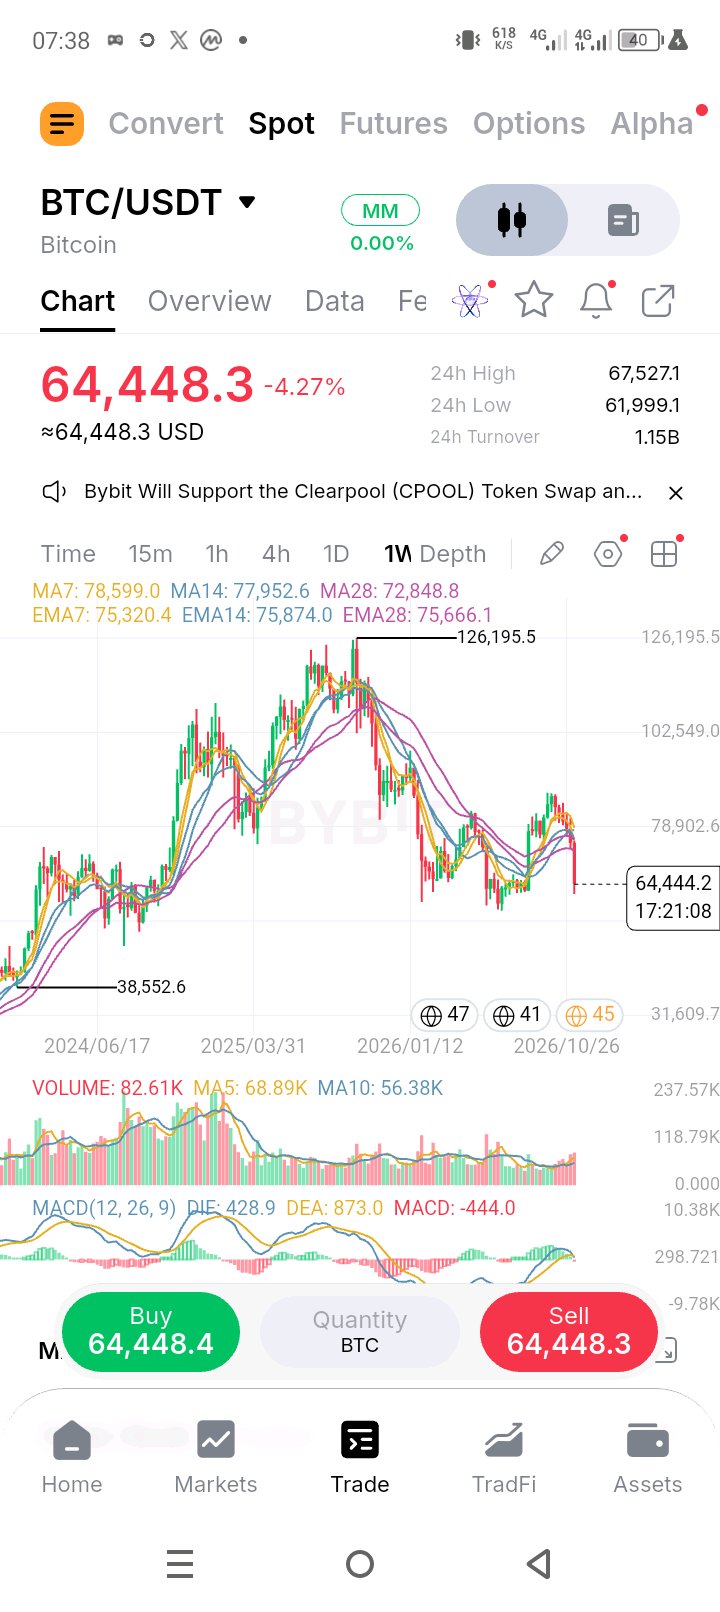
$BTCUSDT on the weekly is at 64,448.3 (-4.27% on the day), about 48.9% under the 126,195.5 high and 67.2% above the 38,552.6 low marked on the chart. The 24h range is 61,999.1 to 67,527.1, an 8.9% box, and the weekly candle has about seventeen hours left. Price has rejected from the recent swing high, roughly 86-87k (approximate), and is giving back most of that bounce. Price is under every average. The three EMAs are braided into a tight 75.3-75.9k band (EMA7 75,320.4, EMA28 75,666.1, EMA14 75,874.0), 14.4-15.1% overhead, which says the weekly trend had already gone flat before this drop. The MAs are more spread out: MA28 72,848.8 is 11.5% overhead, MA14 77,952.6 is 17.3% and MA7 78,599.0 is 18.0%. Volume is rising into the drop. The weekly bar is 82.61K BTC with about seventeen hours still to run, already 19.9% above the MA5 (68.89K) and 46.5% above the MA10 (56.38K), and the MA5 sits 22.2% above the MA10. The 24h turnover of 1.15B USDT works out to roughly 17.8K BTC, above the weekly bar’s average daily pace of about 13.2K. This is not a quiet slide. Weekly MACD has rolled over: DIF (428.9) is under DEA (873.0), a histogram of -444.0. Both lines are still above zero, so the bigger structure has not flipped, but momentum is turning down. Levels to watch: Support: 61,999.1 (24h low), roughly 58-60k (the two prior weekly swing lows, approximate), 55,256.1 (grid line, approximate), 38,552.6 (the low marked on the chart). Resistance: 67,527.1 (24h high), 72,848.8 (MA28), 75,320.4 (EMA7), 75,666.1 (EMA28), 75,874.0 (EMA14), 77,952.6 (MA14), 78,599.0 (MA7), 78,902.6 (grid line), roughly 86-87k (the recent swing high, approximate), 102,549.0 (grid line), then 126,195.5 (the high). Plan, on weekly closes: Low-hold long (counter-trend): a dip into 58,000-60,500 that holds on the weekly close. Entry 60,000, stop under 56,500, which is 3,500 of risk. 67,527.1 is about 2.2R, 72,848.8 about 3.7R and 75,666.1 about 4.5R. Reclaim long: a weekly close above 75,874.0 on volume above the 68.89K MA5, then a retest of 75,000-76,000 that holds. Entry 76,500, stop under 73,500, which is 3,000 of risk. 78,902.6 is only about 0.8R, so I’d trim there, then roughly 86,500 (approximate) is about 3.3R and 102,549.0 about 8.7R. Breakdown (short or exit): a weekly close under 58,000 on volume above the 68.89K MA5, then a failed retest of 58,000-60,500. Entry 59,000, stop above 61,500, which is 2,500 of risk. 55,256.1 is about 1.5R and 38,552.6 about 8.2R, so I’d trail after the first. Invalidation: the low-hold long fails under 56,500. The bearish read softens on a weekly close above 77,952.6 (MA14), and the downtrend has turned above 78,902.6, which also clears the MA7. Risk note: this is a weekly read with the candle still open, so the close can change the picture, and stops on this timeframe are wide, so size accordingly. Limit orders, small size. That’s my read of the chart, not advice.$BTCUSDT #ByXIMPACT
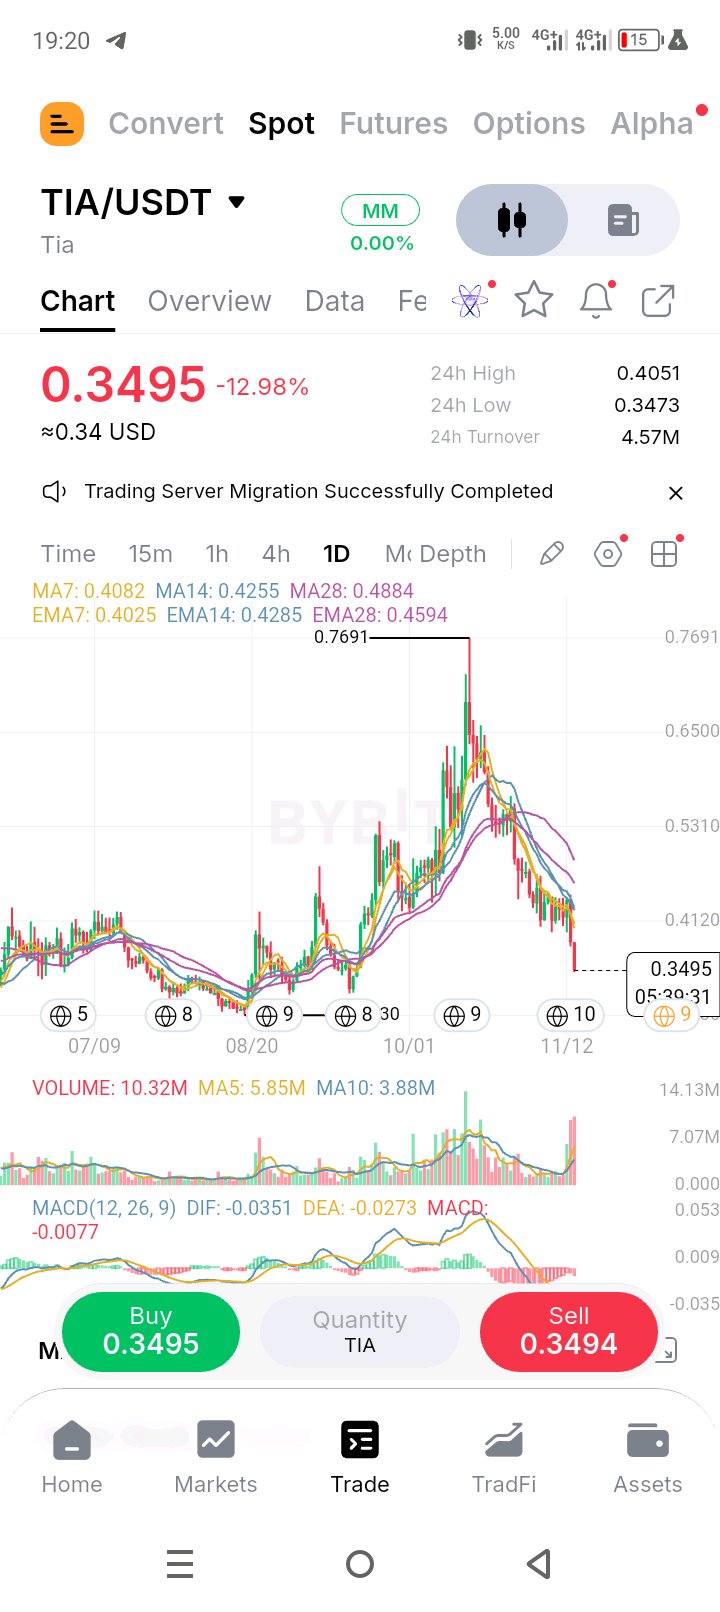
$TIAUSDT is at 0.3495 (-12.98%), about 54.6% under the 0.7691 high, 13.7% under the 24h high of 0.4051 and just 0.6% above the 24h low of 0.3473. The 24h range is a 16.6% box, and the daily candle has about five and a half hours left. Price has given back the whole rally and is back near the September low, roughly 0.32 by my read (approximate), with the August low of 0.2930 still 19.3% below. Every average is overhead and falling, stacked fast under slow: 13.2-14.4% under the 7s (EMA7 0.4025, MA7 0.4082), 17.9-18.4% under the 14s (MA14 0.4255, EMA14 0.4285) and 23.9-28.4% under the 28s (EMA28 0.4594, MA28 0.4884). A -12.98% candle has opened a wide gap to the whole stack, so any reclaim has to be earned in steps. Volume is heavy on this drop. Today’s bar is 10.32M with about five and a half hours still to run, already 76.4% above the MA5 (5.85M) and 2.7x the MA10 (3.88M), and the MA5 sits 50.8% above the MA10, so participation has been building into the fall. The 24h turnover of 4.57M USDT works out to roughly 13.1M TIA. That is high-conviction selling, the kind that either exhausts itself or keeps running. MACD is negative and still pointing down: DIF (-0.0351) is under DEA (-0.0273), a histogram of -0.0077, with both lines below zero. Levels to watch: Support: 0.3473 (24h low), roughly 0.32 (the September low, approximate), 0.2930 (the August low, the lowest price on this chart). Nothing is marked below it. Resistance: 0.4025 (EMA7), 0.4051 (24h high), 0.4082 (MA7), 0.4120 (grid line), 0.4255 (MA14), 0.4285 (EMA14), 0.4594 (EMA28), 0.4884 (MA28), 0.5310 (grid line), 0.6500 (grid line), then 0.7691 (the high). Plan, on daily closes: Low-hold long (counter-trend): a dip into 0.3400-0.3480 that holds on the daily close above 0.3473. Entry 0.3480, stop under 0.3300, which is 0.0180 of risk. 0.4025 is about 3.0R, 0.4285 about 4.5R and 0.4594 about 6.2R. Reclaim long: a daily close above 0.4082 on volume above the 5.85M MA5, then a retest of 0.4025-0.4085 that holds. Entry 0.4150, stop under 0.3990, which is 0.0160 of risk. 0.4285 is only about 0.8R, so I’d trim there, then 0.4884 is about 4.6R and 0.5310 about 7.3R. Breakdown (short or exit): a daily close under 0.3473 on volume above the 5.85M MA5, then a failed retest of 0.3475-0.3600. Entry 0.3520, stop above 0.3640, which is 0.0120 of risk. 0.3200 is about 2.7R and 0.2930 about 4.9R, though the 0.32 area is approximate, so I’d trail after the first. Invalidation: the low-hold long fails under 0.3300. The bearish read softens on a daily close above 0.4255 (MA14), and the downtrend has turned above 0.4884 (MA28). Risk note: a -12.98% day with the candle still open can change shape by the close, and a heavy-volume flush often snaps back hard before it resumes. Stops matter more than targets. Limit orders, small size. That’s my read of the chart, not advice$TIAUSDT #ByXIMPACT
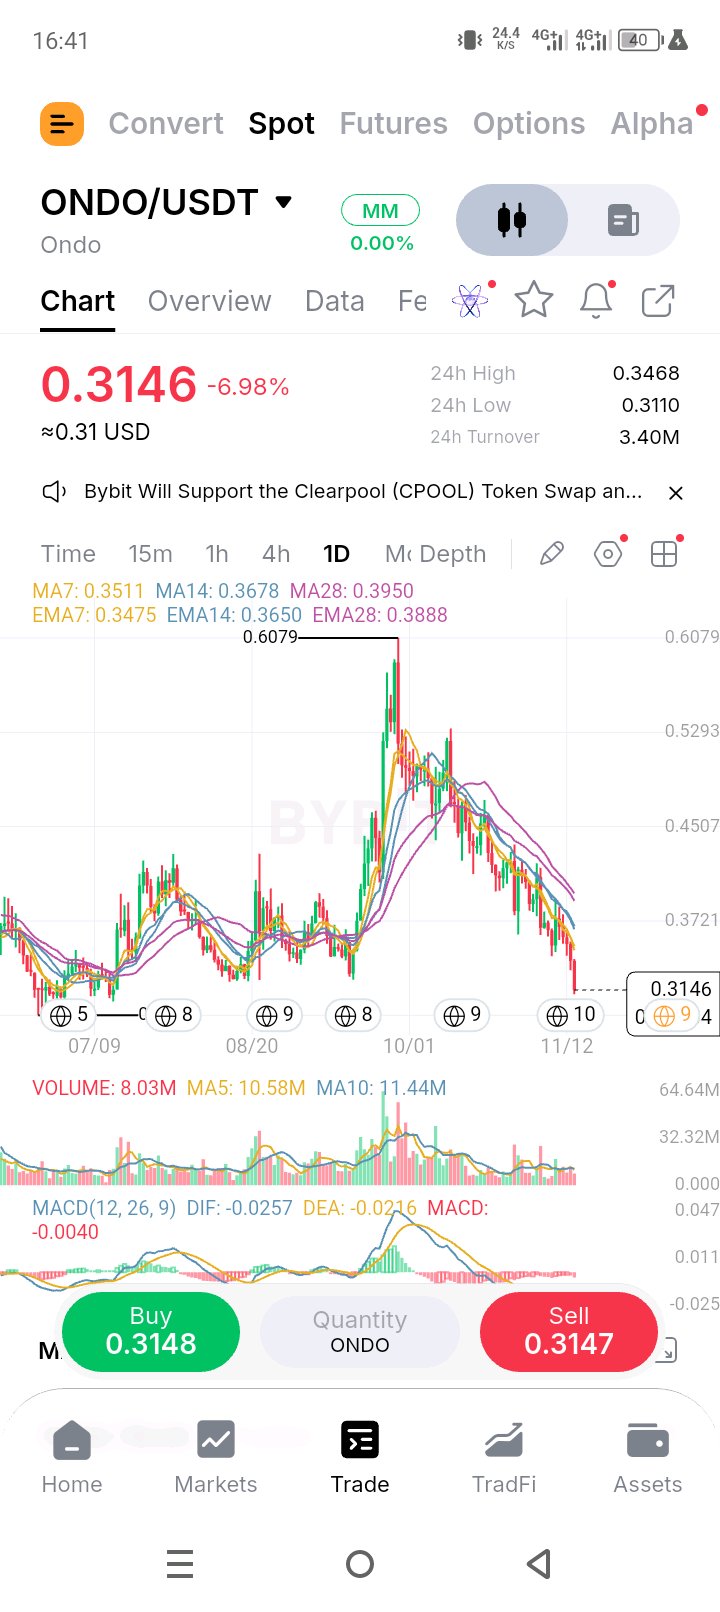
$ONDOUSDT is at 0.3146 (-6.98%), about 48.2% under the 0.6079 high, 9.3% under the 24h high of 0.3468 and 1.2% above the 24h low of 0.3110. The 24h range is an 11.5% box, and the daily candle has about eight hours left. Price has broken below the August and September lows, roughly 0.32-0.33 by my read (approximate), and is trading near the lowest prices since July. Every average is overhead and falling, stacked fast under slow: 9.5-10.4% under the 7s (EMA7 0.3475, MA7 0.3511), 13.8-14.5% under the 14s (EMA14 0.3650, MA14 0.3678) and 19.1-20.4% under the 28s (EMA28 0.3888, MA28 0.3950). A -6.98% day pushes price further from all of them, so a bounce has a long way to run before it meets the stack. Volume is only average on this drop. The 24h turnover of 3.40M USDT works out to roughly 10.8M ONDO, about 2% above the MA5 (10.58M) and 5.5% under the MA10 (11.44M), and today’s bar is 8.03M with about eight hours left, so it is still building. The MA5 sits 7.5% under the MA10. That is a grind lower with no capitulation spike yet, which means the washout may not be done. MACD is negative and still pointing down: DIF (-0.0257) is under DEA (-0.0216), a histogram of -0.0040, with both lines below zero. Levels to watch: Support: 0.3110 (24h low), roughly 0.294 (the July low, approximate). Nothing is marked below it on this chart. Resistance: roughly 0.32-0.33 (the broken August-September lows, approximate), 0.3468 (24h high), 0.3475 (EMA7), 0.3511 (MA7), 0.3650 (EMA14), 0.3678 (MA14), 0.3721 (grid line), 0.3888 (EMA28), 0.3950 (MA28), 0.4507 (grid line), 0.5293 (grid line), then 0.6079 (the high). Plan, on daily closes: Low-hold long (counter-trend): a dip into 0.3050-0.3130 that holds on the daily close above 0.3110. Entry 0.3120, stop under 0.2980, which is 0.0140 of risk. 0.3475 is about 2.5R, 0.3650 about 3.8R and 0.3888 about 5.5R. Reclaim long: a daily close above 0.3511 on volume above the 11.44M MA10, then a retest of 0.3470-0.3515 that holds. Entry 0.3560, stop under 0.3430, which is 0.0130 of risk. 0.3721 is only about 1.2R, so I’d trim there, then 0.3950 is about 3.0R and 0.4507 about 7.3R. Breakdown (short or exit): a daily close under 0.3110 on volume above the 10.58M MA5, then a failed retest of 0.3110-0.3220. Entry 0.3150, stop above 0.3260, which is 0.0110 of risk. 0.2940 is about 1.9R, though it is approximate, and with nothing marked below it I’d trail the rest. Invalidation: the low-hold long fails under 0.2980. The bearish read softens on a daily close above 0.3678 (MA14), and the downtrend has turned above 0.3950 (MA28). Risk note: price just lost its base and is down almost 7% on the day, so bounces can be sharp and short. Stops matter more than targets. Limit orders, small size. That’s my read of the chart, not advice.$ONDOUSDT #ByXIMPACT
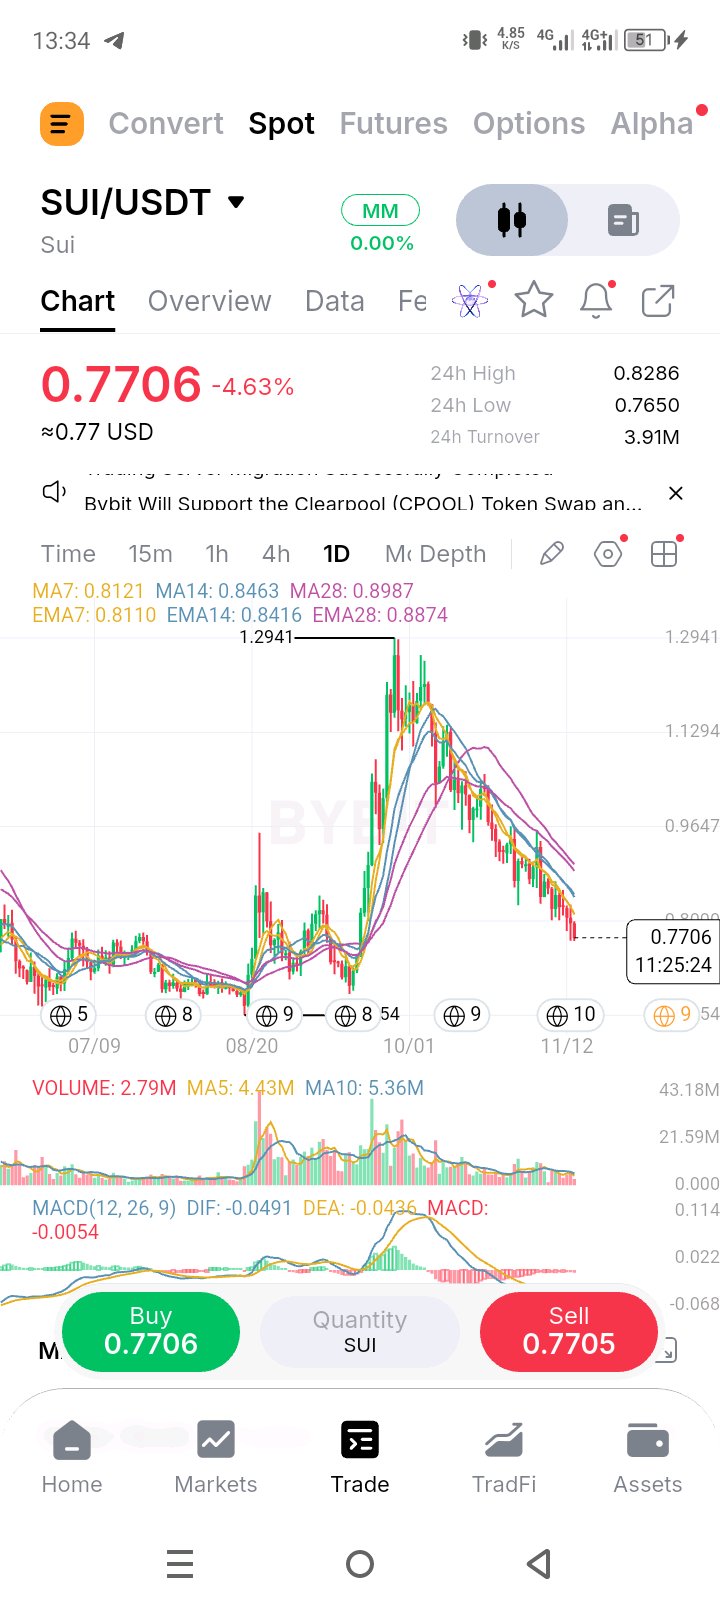
$SUIUSDT is at 0.7706 (-4.63%), about 40.5% under the 1.2941 high, 7.0% under the 24h high of 0.8286 and 0.7% above the 24h low of 0.7650. The 24h range is an 8.3% box, and the daily candle has about eleven and a half hours left. Price has given back the whole rally and is back inside the August-September base (approximate), with the August low of 0.6354 still 21.3% below. Every average is overhead and falling, stacked fast under slow: 5.0-5.1% under the 7s (EMA7 0.8110, MA7 0.8121), 8.4-8.9% under the 14s (EMA14 0.8416, MA14 0.8463) and 13.2-14.3% under the 28s (EMA28 0.8874, MA28 0.8987). The 0.8000 grid line sits just under the fast pair, so the first resistance is a zone, not a line. Volume has been fading into the decline: the MA5 (4.43M) sits 17.3% under the MA10 (5.36M). Today’s bar is 2.79M with over eleven hours left, so it is early, and the 24h turnover of 3.91M USDT works out to roughly 5.1M SUI, about 15% above the MA5 but still under the MA10. This is steady selling, not a panic. MACD is negative and still pointing down: DIF (-0.0491) is under DEA (-0.0436), a histogram of -0.0054, with both lines below zero. Levels to watch: Support: 0.7650 (24h low), roughly 0.65-0.67 (the September low, approximate), 0.6354 (the August low, the lowest price on this chart). Nothing is marked below it. Resistance: 0.8000 (grid line), 0.8110 (EMA7), 0.8121 (MA7), 0.8286 (24h high), 0.8416 (EMA14), 0.8463 (MA14), 0.8874 (EMA28), 0.8987 (MA28), 0.9647 (grid line), 1.1294 (grid line), then 1.2941 (the high). Plan, on daily closes: Low-hold long (counter-trend): a dip into 0.7550-0.7700 that holds on the daily close above 0.7650. Entry 0.7650, stop under 0.7350, which is 0.0300 of risk. 0.8110 is about 1.5R, 0.8416 about 2.6R and 0.8874 about 4.1R. Reclaim long: a daily close above 0.8121 on volume above the 5.36M MA10, then a retest of 0.8000-0.8125 that holds. Entry 0.8180, stop under 0.7950, which is 0.0230 of risk. 0.8463 is about 1.2R, so I’d trim there, then 0.8987 is about 3.5R and 0.9647 about 6.4R. Breakdown (short or exit): a daily close under 0.7650 on volume above the 4.43M MA5, then a failed retest of 0.7650-0.7800. Entry 0.7720, stop above 0.7850, which is 0.0130 of risk. 0.6700 is about 7.8R and 0.6354 about 10.5R, though the 0.67 area is approximate, so I’d trail after the first. Invalidation: the low-hold long fails under 0.7350. The bearish read softens on a daily close above 0.8463 (MA14), and the downtrend has turned above 0.8987 (MA28). Risk note: the 24h low is the only nearby floor, so a close under 0.7650 can slide a long way before the next marked support. Stops matter more than targets. Limit orders, small size. That’s my read of the chart, not advice.$SUIUSDT #ByXIMPACT
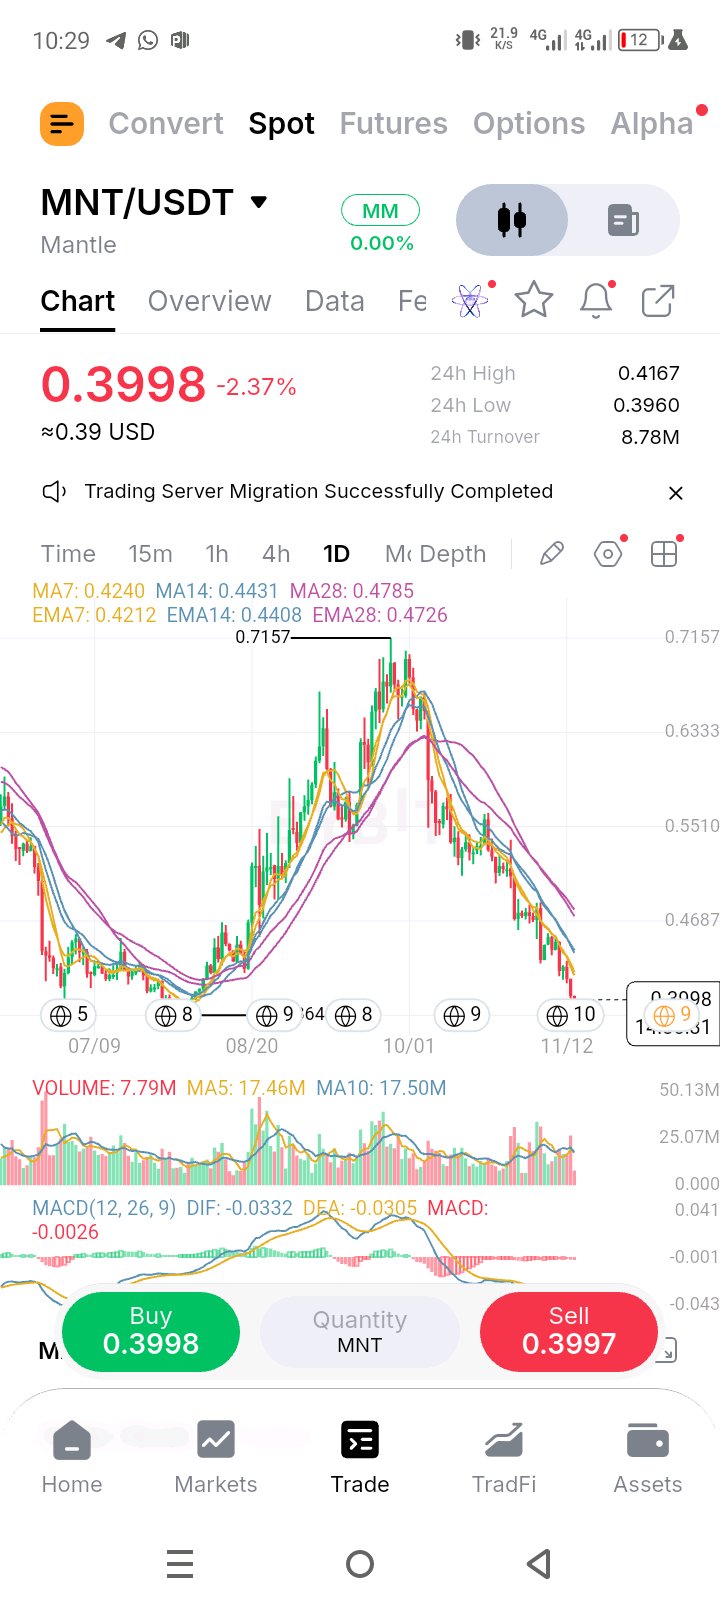
$MNTUSDT is at 0.3998 (-2.37%), about 44.1% under the 0.7157 high, 4.1% under the 24h high of 0.4167 and 1.0% above the 24h low of 0.3960. The 24h range is a 5.2% box, and the daily candle has about fourteen hours left. Price has given back the whole rally and is now 3.5% above the August low of 0.3864, the lowest price on this chart. Every average is overhead and sloping down, stacked fast under slow: 5.1-5.7% under the 7s (EMA7 0.4212, MA7 0.4240), 9.3-9.8% under the 14s (EMA14 0.4408, MA14 0.4431) and 15.4-16.4% under the 28s (EMA28 0.4726, MA28 0.4785). The gap to the 28s is wide, so any bounce has a lot of overhead to chew through. Volume is picking up into the floor. Today’s bar is 7.79M with about fourteen hours left, too early to judge, but the 24h turnover of 8.78M USDT works out to roughly 22.0M MNT, about 26% above both the MA5 (17.46M) and the MA10 (17.50M). Those two are level, so the extra activity is new, and it is arriving right as price nears the August low. MACD is negative and still pointing down: DIF (-0.0332) is under DEA (-0.0305), a histogram of -0.0026, with both lines below zero. Levels to watch: Support: 0.3960 (24h low), 0.3864 (the August low). Nothing is marked below it on this chart. Resistance: 0.4167 (24h high), 0.4212 (EMA7), 0.4240 (MA7), 0.4408 (EMA14), 0.4431 (MA14), 0.4687 (grid line), 0.4726 (EMA28), 0.4785 (MA28), 0.5510 (grid line), 0.6333 (grid line), then 0.7157 (the high). Plan, on daily closes: Low-hold long (counter-trend): a dip into 0.3864-0.3960 that holds on the daily close above 0.3864. Entry 0.3900, stop under 0.3780, which is 0.0120 of risk. 0.4212 is about 2.6R, 0.4431 about 4.4R and 0.4726 about 6.9R. Reclaim long: a daily close above 0.4240 on volume above the 17.50M MA10, then a retest of 0.4190-0.4245 that holds. Entry 0.4290, stop under 0.4150, which is 0.0140 of risk. 0.4431 is only about 1.0R, so I’d trim there, then 0.4785 is about 3.5R and 0.5510 about 8.7R. Breakdown (short or exit): a daily close under 0.3864 on volume above the 17.50M MA10, then a failed retest of 0.3860-0.3960. Entry 0.3880, stop above 0.4000, which is 0.0120 of risk. The August low is the bottom of this chart, so there is nothing below to aim at and the trade is a trail. Invalidation: the low-hold long fails under 0.3780. The bearish read softens on a daily close above 0.4431 (MA14), and the downtrend has turned above 0.4785 (MA28). Risk note: the August low is the floor of this chart, so a break leaves no marked support to lean on and can run fast. Size small, use limit orders and respect the stop. That’s my read of the chart, not advice.#ByXIMPACT$MNTUSDT
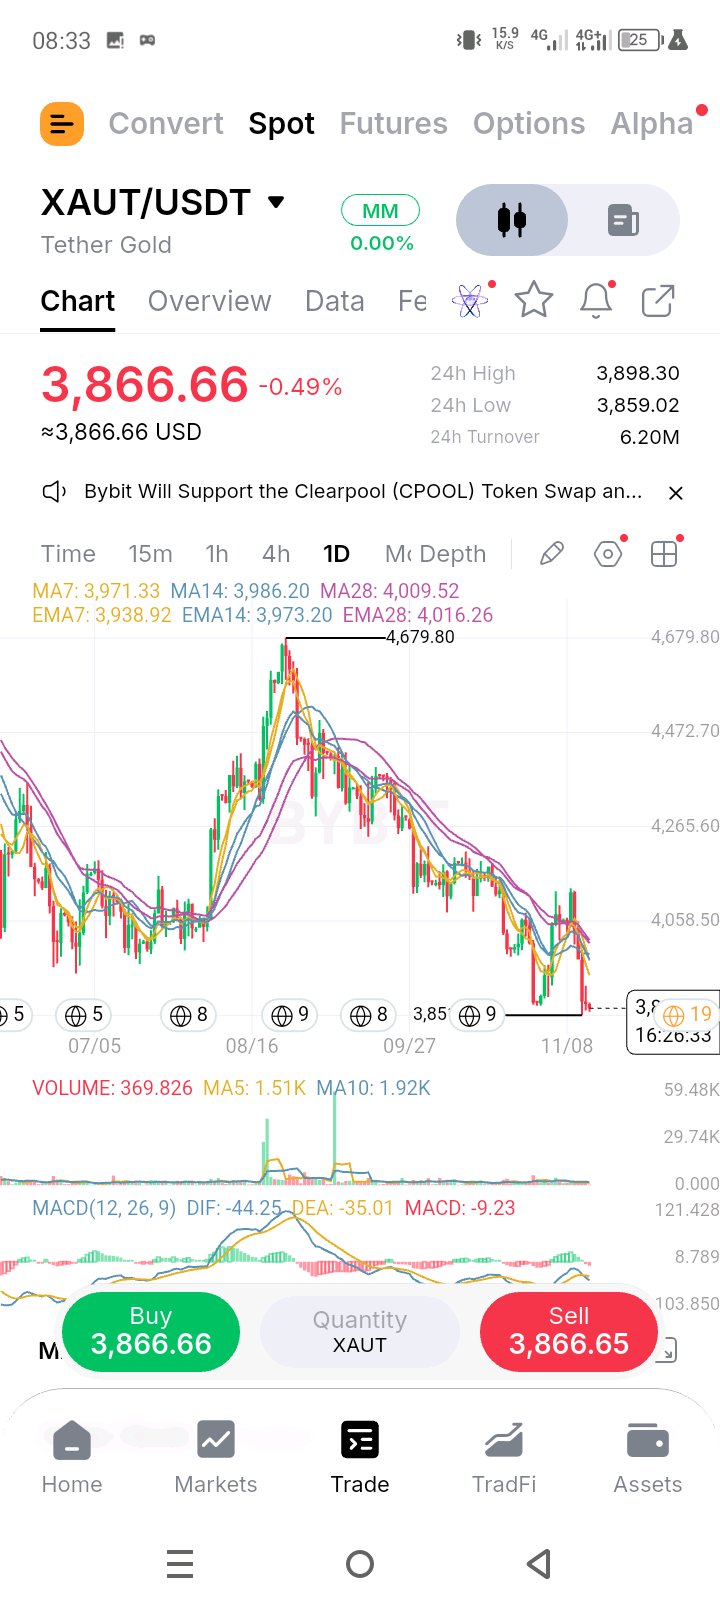
$XAUTUSDT is at 3,866.66 (-0.49%), about 17.4% under the 4,679.80 high, 0.2% above the 24h low of 3,859.02 and 0.4% above the 3,851.40 low marked on the chart. The 24h range is a tight 1.0% box, and the daily candle still has over sixteen hours left. Price is pinned to the bottom of the chart, under every average. All the averages are overhead, bunched into a 3,939-4,016 band: 1.8% under the EMA7 (3,938.92), 2.6% under the MA7 (3,971.33), 2.7-3.0% under the 14s (EMA14 3,973.20, MA14 3,986.20) and 3.6-3.7% under the 28s (MA28 4,009.52, EMA28 4,016.26). The 4,000 round number sits inside that band, so a reclaim has to clear the whole stack, not one line. Volume is dry. The MA5 (1.51K) sits 21.4% under the MA10 (1.92K), so activity has been fading, and today’s bar is only 369.83 with over sixteen hours left, which is too early to judge. The 24h turnover of 6.20M USDT works out to roughly 1.6K XAUT, about 6% above the MA5. Nobody is rushing to sell this low, but nobody is stepping in either. MACD is negative and pointing down: DIF (-44.25) is under DEA (-35.01), a histogram of -9.23, with both lines below zero. Levels to watch: Support: 3,859.02 (24h low), 3,851.40 (the marked low). Nothing is marked below it on this chart. Resistance: 3,898.30 (24h high), 3,938.92 (EMA7), 3,971.33 (MA7), 3,973.20 (EMA14), 3,986.20 (MA14), 4,009.52 (MA28), 4,016.26 (EMA28), 4,058.50 (grid line), 4,265.60 (grid line), 4,472.70 (grid line), then 4,679.80 (the high). Plan, on daily closes: Low-hold long (counter-trend): a dip into 3,850-3,870 that holds on the daily close above 3,851.40. Entry 3,860, stop under 3,830, which is 30 of risk. 3,938.92 is about 2.6R, 3,973.20 about 3.8R and 4,016.26 about 5.2R. Reclaim long: a daily close above 4,016.26 on volume above the 1.51K MA5, then a retest of 3,990-4,020 that holds. Entry 4,030, stop under 3,980, which is 50 of risk. 4,058.50 is only about 0.6R, so I’d trim a small piece there, then 4,265.60 is about 4.7R and 4,472.70 about 8.9R. Breakdown (short or exit): a daily close under 3,851.40 on volume above the 1.51K MA5, then a failed retest of 3,850-3,880. Entry 3,855, stop above 3,885, which is 30 of risk. There is no level below to measure a target against, so the trade is a trail. Invalidation: the low-hold long fails under 3,830. The bearish read softens on a daily close above 3,986.20 (MA14), and the downtrend has turned above 4,016.26 (EMA28). Risk note: the day has barely started and the range is only 1.0%, and a quiet tape can break either way on one headline. XAUT tracks gold, so gold’s own moves can override this chart. Limit orders, small size. That’s my read of the chart, not advice$XAUTUSDT #ByXIMPACT
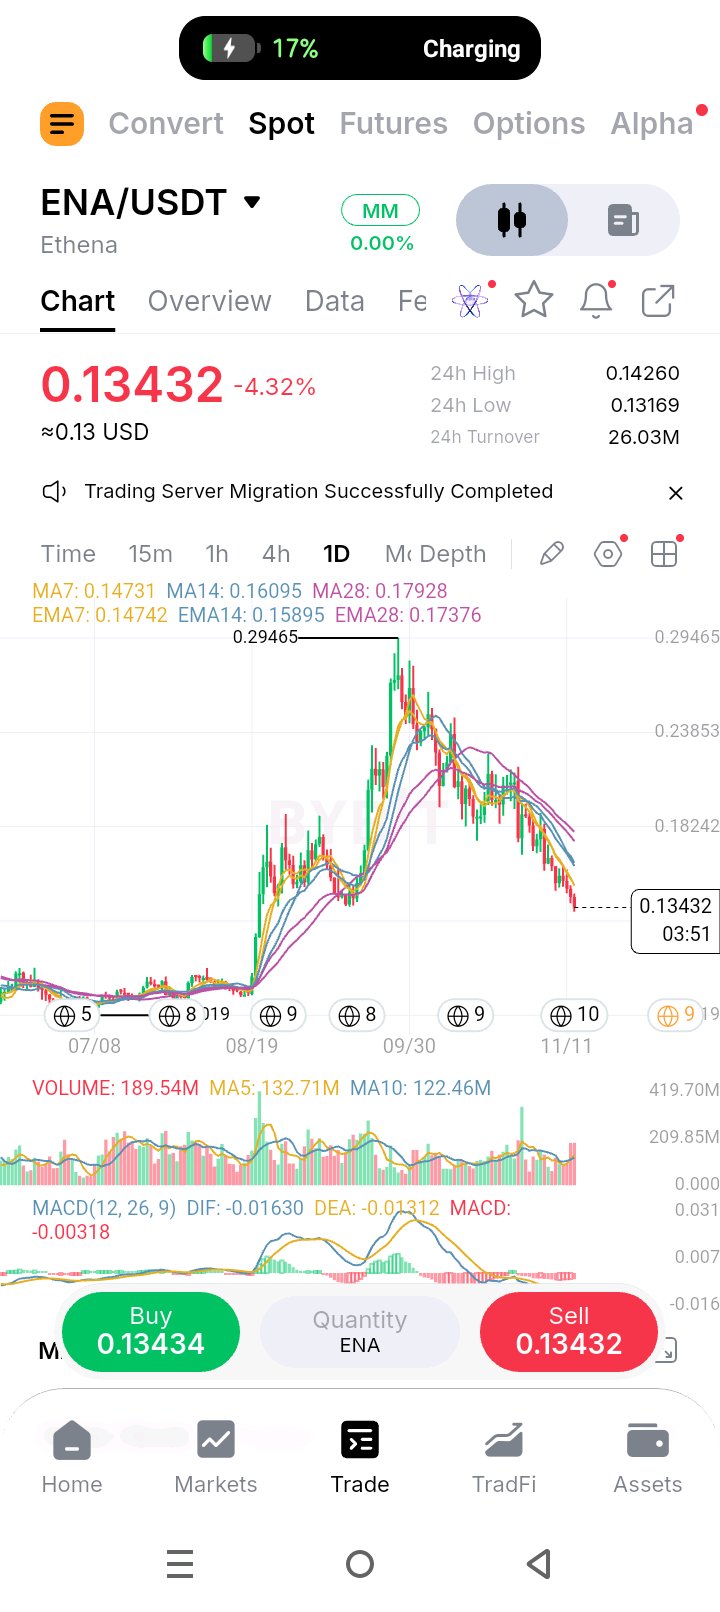
$ENAUSDT is at 0.13432 (-4.32%), about 54.4% under the 0.29465 high, 5.8% under the 24h high of 0.14260 and 2.0% above the 24h low of 0.13169. The 24h range is an 8.3% box, and the daily candle has under four minutes left. Price has given back the whole second leg and is right around the September pullback low, roughly 0.135-0.140 by my read (approximate). Every average is overhead and falling, stacked fast under slow: 8.8-8.9% under the 7s (EMA7 0.14742, MA7 0.14731), 15.5-16.5% under the 14s (EMA14 0.15895, MA14 0.16095) and 22.7-25.1% under the 28s (EMA28 0.17376, MA28 0.17928). Price has to win back the 7s before the rest of the stack even comes into play. Volume is loud on the way down. Today’s bar is 189.54M with the candle almost done, 42.8% above the MA5 (132.71M) and 54.8% above the MA10 (122.46M), and the MA5 sits 8.4% above the MA10, so participation has been building into the low. The 24h turnover of 26.03M USDT works out to roughly 193.8M ENA, right in line with the bar. That is real selling, not a quiet bleed. MACD is negative and pointing down: DIF (-0.01630) is under DEA (-0.01312), a histogram of -0.00318, with both lines below zero. Levels to watch: Support: 0.13169 (24h low), about 0.1263 (grid line, approximate), then nothing marked until the August base, roughly 0.08-0.09 (approximate), and about 0.0702 (grid line, approximate). Resistance: 0.14260 (24h high), 0.14731 (MA7), 0.14742 (EMA7), 0.15895 (EMA14), 0.16095 (MA14), 0.17376 (EMA28), 0.17928 (MA28), 0.18242 (grid line), 0.23853 (grid line), then 0.29465 (the high). Plan, on daily closes: Low-hold long (counter-trend): a dip into 0.1270-0.1320 that holds on the daily close above 0.13169. Entry 0.1300, stop under 0.1230, which is 0.0070 of risk. 0.14742 is about 2.5R, 0.15895 about 4.1R and 0.17376 about 6.3R. Reclaim long: a daily close above 0.14742 on volume above the 132.71M MA5, then a retest of 0.1465-0.1480 that holds. Entry 0.1490, stop under 0.1445, which is 0.0045 of risk. 0.15895 is about 2.2R, so I’d trim there, then 0.17376 is about 5.5R and 0.18242 about 7.4R. Breakdown (short or exit): a daily close under 0.13169 on volume above the 132.71M MA5, then a failed retest of 0.1315-0.1350. Entry 0.1325, stop above 0.1360, which is 0.0035 of risk. 0.1263 is about 1.8R, and with nothing marked below it until the August base, I’d trail the rest. Invalidation: the low-hold long fails under 0.1230. The bearish read softens on a daily close above 0.16095 (MA14), and the downtrend has turned above 0.17928 (MA28). Risk note: the candle is about to close, so everything here can shift at the close, and with that much air under 0.1263 a break lower can run. Stops matter more than targets. Limit orders, small size. That’s my read of the chart, not advice.#ByXIMPACT$ENAUSDT
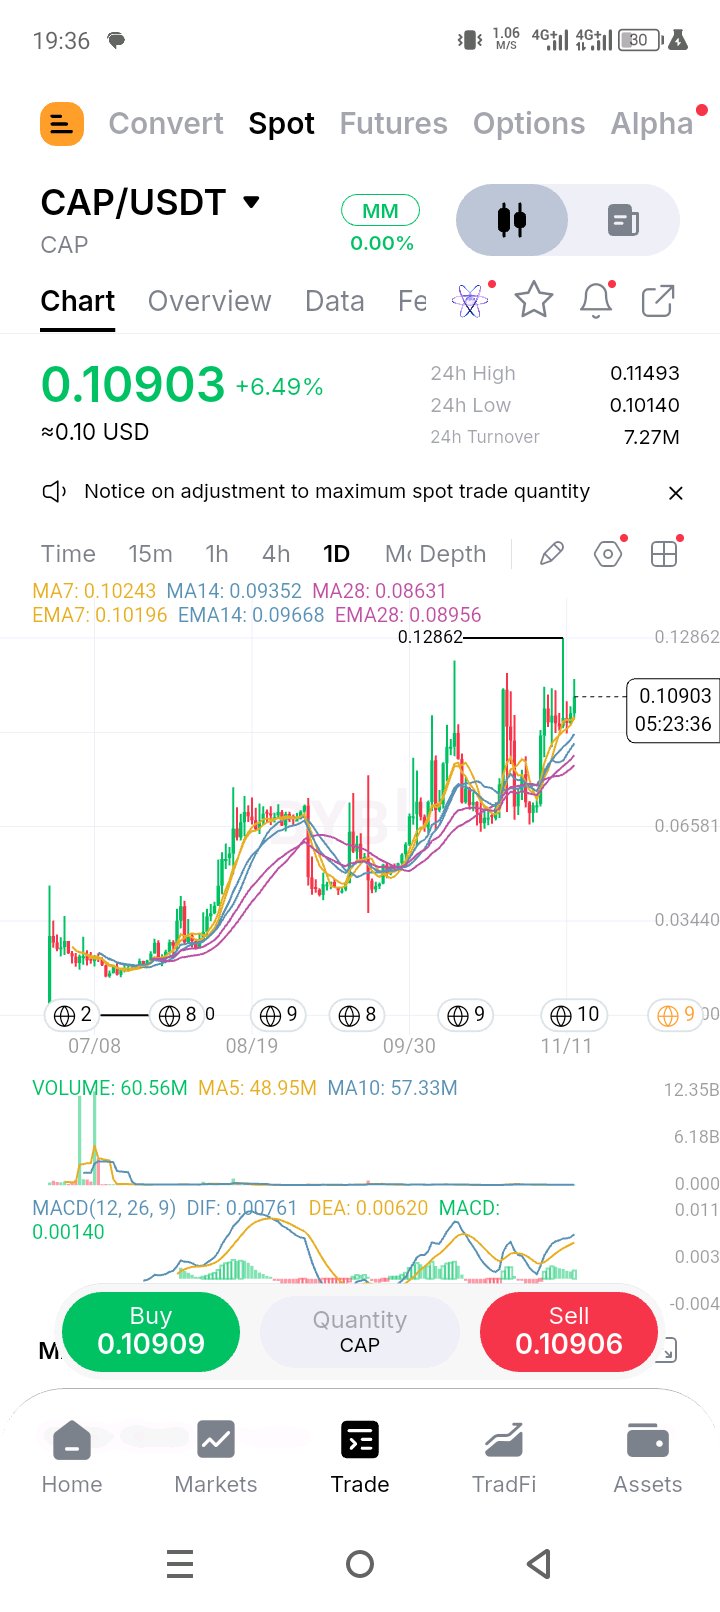
$CAPUSDT is at 0.10903 (+6.49%), about 15.2% under the 0.12862 high, 5.1% under the 24h high of 0.11493 and 7.5% above the 24h low of 0.10140. The 24h range is a 13.3% box, and the daily candle has just over five hours left. Price is above every average and pressing back toward the high. Every average is below price and curling up, stacked fast over slow: 6.4-6.9% above the 7s (EMA7 0.10196, MA7 0.10243), 12.8-16.6% above the 14s (EMA14 0.09668, MA14 0.09352) and 21.7-26.3% above the 28s (EMA28 0.08956, MA28 0.08631). That is a clean uptrend, but the gap to the 28s says it is stretched. Volume is expanding on the push. Today’s bar is 60.56M with just over five hours still to run, already 23.7% above the MA5 (48.95M) and 5.6% above the MA10 (57.33M), and the 24h turnover of 7.27M USDT works out to roughly 66.7M CAP, about 36% above the MA5. The MA5 is still 14.6% under the MA10, so this is a fresh pickup, not a long build. Buyers are paying up. MACD is positive: DIF (0.00761) is above DEA (0.00620), a histogram of +0.00140, with both lines above zero and turning up. Levels to watch: Support: 0.10243 (MA7), 0.10196 (EMA7), 0.10140 (24h low), 0.09722 (grid line, approximate), 0.09668 (EMA14), 0.09352 (MA14), 0.08956 (EMA28), 0.08631 (MA28), then 0.06581 (grid line). Resistance: 0.11493 (24h high), then 0.12862 (the high). Nothing is marked above it on this chart. Plan, on daily closes: Pullback long (trend continuation): a dip into 0.1020-0.1050 that holds on the daily close above the 7s. Entry 0.1040, stop under 0.0965, which is 0.0075 of risk. 0.11493 is about 1.5R and 0.12862 about 3.3R, then nothing is marked above, so I’d trail. Breakout long: a daily close above 0.11493 on volume above the 57.33M MA10, then a retest of 0.1130-0.1150 that holds. Entry 0.1160, stop under 0.1105, which is 0.0055 of risk. 0.12862 is about 2.3R, and with nothing marked above it I’d trail the rest. Breakdown (exit or short): a daily close under 0.10140 on volume above the 48.95M MA5, then a failed retest of 0.1015-0.1045. Entry 0.1030, stop above 0.1060, which is 0.0030 of risk. 0.09722 is about 1.9R, 0.09352 about 3.2R and 0.08956 about 4.5R. Invalidation: the pullback long fails under 0.0965. The bullish read softens on a daily close under 0.09352 (MA14), and the uptrend has turned under 0.08631 (MA28). Risk note: price is stretched, 16.6% over the MA14 and 26.3% over the MA28, and stretched moves can snap back fast. I’d rather wait for the dip than chase. Limit orders, small size. That’s my read of the chart, not advice.$CAPUSDT #ByXIMPACT
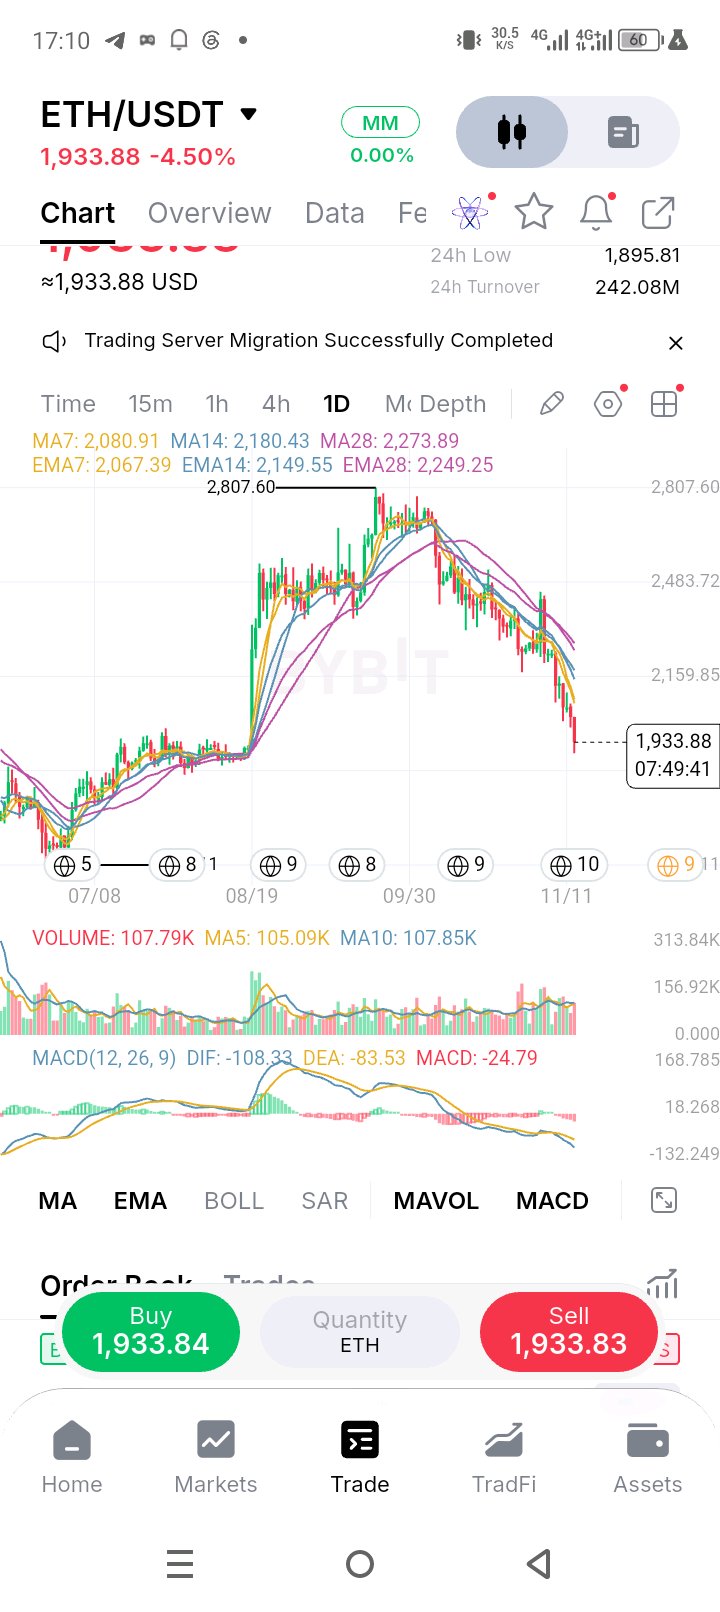
$ETHUSDT is at 1,933.88 (-4.50%), about 31.1% under the 2,807.60 high and 2.0% above the 24h low of 1,895.81. The daily candle has just under eight hours left. Price has given back the whole rally and is sitting inside the August base, which by my read ran roughly 1,850-1,950 (approximate), the shelf the breakout launched from. Every average is overhead and falling, stacked fast under slow: 6.5% under the EMA7 (2,067.39), 7.1% under the MA7 (2,080.91), 10.0-11.3% under the 14s (EMA14 2,149.55, MA14 2,180.43) and 14.0-15.0% under the 28s (EMA28 2,249.25, MA28 2,273.89). A -4.50% day with that stack overhead says sellers are still in control. Volume is solid on the way down. Today’s bar is 107.79K with almost eight hours still to run, level with the MA10 (107.85K) and 2.6% above the MA5 (105.09K), and the 24h turnover of 242.08M USDT works out to roughly 125K ETH, about 19% above the MA5. Participation is rising into the drop, which makes this a real sell-off, not thin air. MACD is negative and still pointing down: DIF (-108.33) is under DEA (-83.53), a histogram of -24.79, with both lines below zero. Levels to watch: Support: 1,895.81 (24h low), about 1,836 (grid line, approximate), about 1,512 (grid line, near the July low, approximate). Resistance: 2,067.39 (EMA7), 2,080.91 (MA7), 2,149.55 (EMA14), 2,159.85 (grid line), 2,180.43 (MA14), 2,249.25 (EMA28), 2,273.89 (MA28), 2,483.72 (grid line), then 2,807.60 (the high). Plan, on daily closes: Low-hold long (counter-trend): a dip into 1,880-1,920 that holds on the daily close above 1,895.81. Entry 1,905, stop under 1,865, which is 40 of risk. 2,067.39 is about 4.1R, 2,149.55 about 6.1R and 2,249.25 about 8.6R. Reclaim long: a daily close above 2,080.91 on volume above the 105.09K MA5, then a retest of 2,060-2,085 that holds. Entry 2,090, stop under 2,040, which is 50 of risk. 2,149.55 is only about 1.2R, so I’d trim a small piece there, then 2,273.89 is about 3.7R and 2,483.72 about 7.9R. Breakdown (short or exit): a daily close under 1,895.81 on volume above the 105.09K MA5, then a failed retest of 1,895-1,935. Entry 1,910, stop above 1,950, which is 40 of risk. 1,836 is about 1.9R and 1,512 about 10R, though both are approximate, so I’d trail after the first one. Invalidation: the low-hold long fails under 1,865. The bearish read softens on a daily close above 2,180.43 (MA14), and the downtrend has turned above 2,273.89 (MA28). Risk note: price is sitting on the old base after a fast drop, so I care more about where I’m wrong than where I’m right. Limit orders, small size. That’s my read of the chart, not advice.$ETHUSDT #IMPACTbyTrade
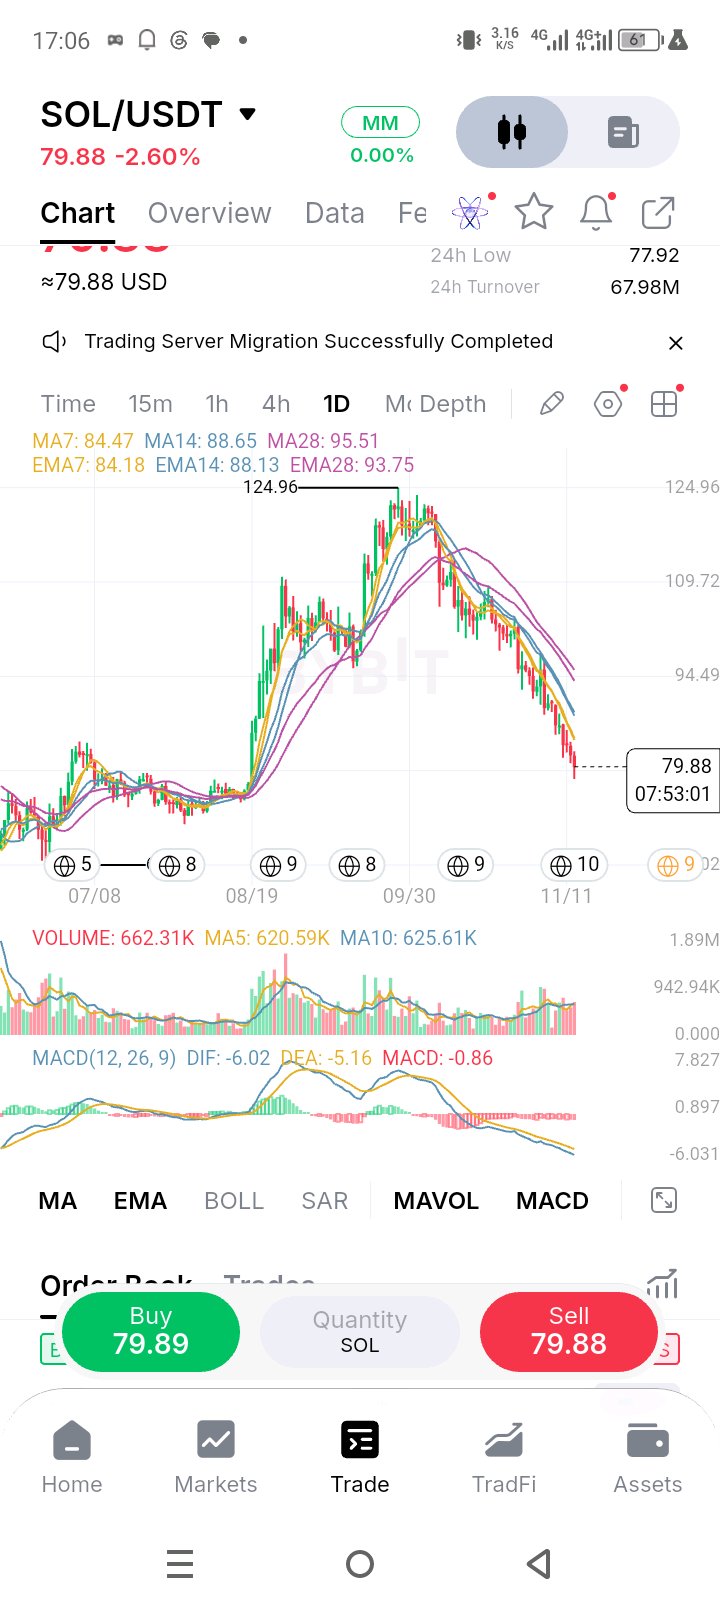
$SOLUSDT is at 79.88 (-2.60%), about 36.1% under the 124.96 high and 2.5% above the 24h low of 77.92. The daily candle has just under eight hours left. Price has given back the whole rally and is sitting just above the shelf the August breakout launched from, roughly 74-77 by my read (approximate). Every average is overhead and falling, stacked fast under slow: 5.1% under the EMA7 (84.18), 5.4% under the MA7 (84.47), 9.4-9.9% under the 14s (EMA14 88.13, MA14 88.65) and 14.8-16.4% under the 28s (EMA28 93.75, MA28 95.51). That is an orderly trend down, not a one-day flush. Volume is holding up on the way down. Today’s bar is 662.31K with almost eight hours still to run, already 6.7% above the MA5 (620.59K) and 5.9% above the MA10 (625.61K), and the 24h turnover of 67.98M USDT works out to roughly 851K SOL, about 37% above the MA5. With the MA5 and MA10 level, the extra participation is today’s, and it is arriving into the low. That is selling with some conviction. MACD is negative and still pointing down: DIF (-6.02) is under DEA (-5.16), a histogram of -0.86, with both lines below zero and at the lowest reading on this chart. Levels to watch: Support: 79.26 (grid line, right under price), 77.92 (24h low), roughly 74-77 (the August breakout shelf, approximate), 64.02 (grid line, near the July low, approximate). Resistance: 84.18 (EMA7), 84.47 (MA7), 88.13 (EMA14), 88.65 (MA14), 93.75 (EMA28), 94.49 (grid line), 95.51 (MA28), 109.72 (grid line), then 124.96 (the high). Plan, on daily closes: Low-hold long (counter-trend): a dip into 77.00-79.30 that holds on the daily close. Entry 78.50, stop under 75.00, which is 3.50 of risk. 84.18 is about 1.6R, 88.13 about 2.8R and 93.75 about 4.4R. Reclaim long: a daily close above 84.47 on volume above the 620.59K MA5, then a retest of 83.50-84.50 that holds. Entry 85.00, stop under 82.50, which is 2.50 of risk. 88.65 is about 1.5R, so I’d trim there, then 95.51 is about 4.2R and 109.72 about 9.9R. Breakdown (short or exit): a daily close under 77.92 on volume above the 620.59K MA5, then a failed retest of 77.90-79.30. Entry 78.00, stop above 80.00, which is 2.00 of risk. 75.00 is about 1.5R and 64.02 about 7.0R, though both are approximate, so I’d trail after the first one. Invalidation: the low-hold long fails under 75.00. The bearish read softens on a daily close above 88.65 (MA14), and the downtrend has turned above 95.51 (MA28). Risk note: price is back at a shelf while the trend is still down, so stops matter more than targets. Use limit orders and keep size small. That’s my read of the chart, not advice. $SOLUSDT#IMPACTbyTrade$SOLUSDT
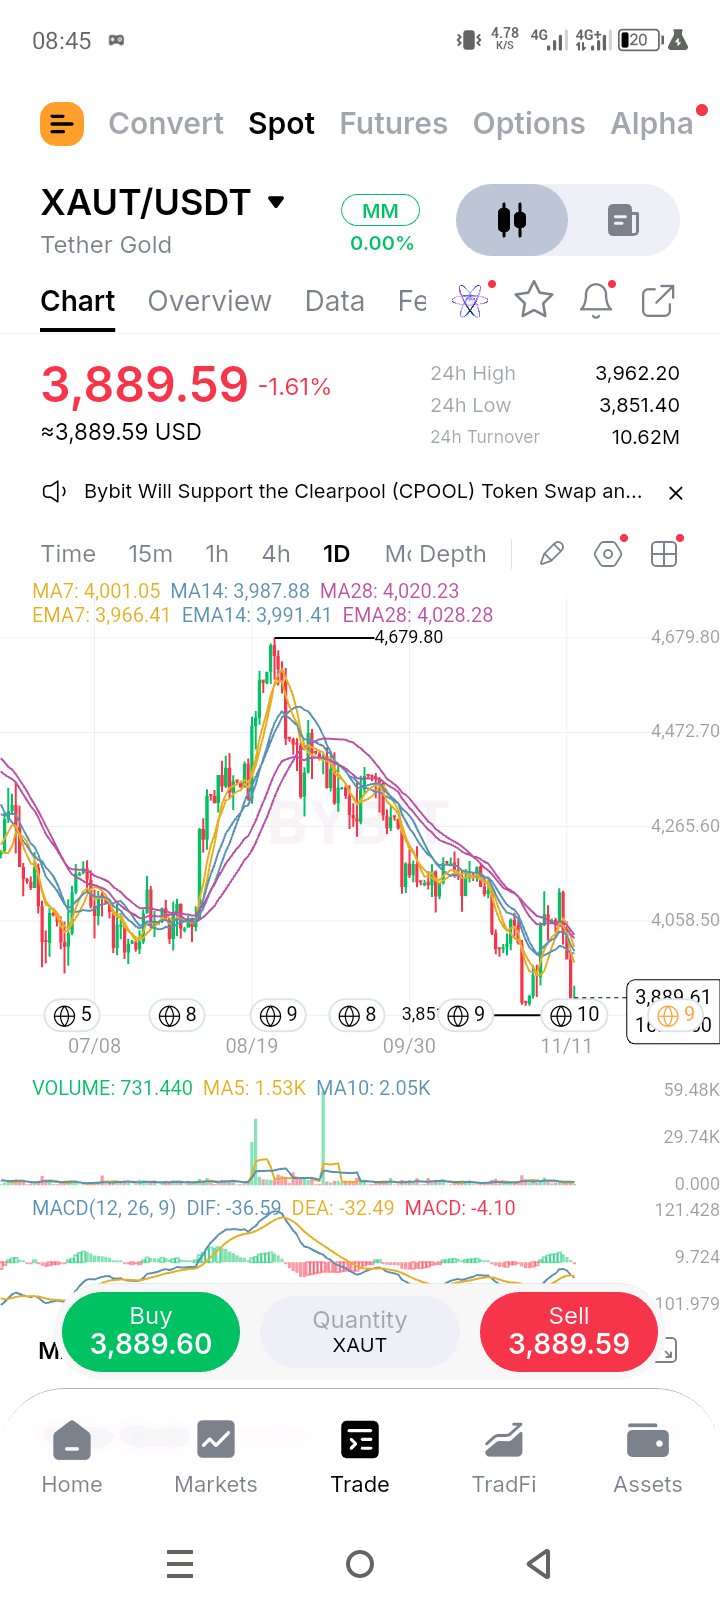
$XAUTUSDT is at 3,889.59 (-1.61%), about 16.9% under the 4,679.80 high and 1.0% above today’s low of 3,851.40. The 24h range is 3,851.40 to 3,962.20, a 2.9% box. Price has given back the whole rally and is trading near the lowest prices on this chart, with the daily candle still open. Every average is overhead and sloping down, packed into a tight 3,966-4,028 band: 1.9% under the EMA7 (3,966.41), 2.8% under the MA7 (4,001.05), 2.5-2.6% under the 14s (MA14 3,987.88, EMA14 3,991.41) and 3.3-3.4% under the 28s (MA28 4,020.23, EMA28 4,028.28). The 4,000 round number sits inside that cluster, so it stacks as one resistance zone, not separate levels. Volume is waking up late. Today’s bar is only 731.44 with the candle still open, well under the MA5 (1.53K) and MA10 (2.05K), and the MA5 sits 25% under the MA10, so the last few days were quiet. But the 24h turnover of 10.62M USDT works out to roughly 2.7K XAUT, above both averages, so most of that pace came before today’s candle opened. Selling is picking up into the low, and today’s bar needs the close to confirm it. MACD is negative: DIF (-36.59) is under DEA (-32.49), a histogram of -4.10, with both lines below zero. The histogram is shallow, so momentum leans down without accelerating. Levels to watch: Support: 3,851.40 (24h low). Nothing is marked below it on this chart. Resistance: 3,962.20 (24h high), 3,966.41 (EMA7), 3,987.88 (MA14), 3,991.41 (EMA14), 4,001.05 (MA7), 4,020.23 (MA28), 4,028.28 (EMA28), 4,058.50 (grid line), 4,265.60 (grid line), 4,472.70 (grid line), then 4,679.80 (the high). Plan, on daily closes: Low-hold long (counter-trend): a dip into 3,850-3,880 that holds on the daily close. Entry 3,870, stop under 3,830, which is 40 of risk. 3,966.41 is about 2.4R, 3,991.41 about 3.0R and 4,028.28 about 4.0R. Reclaim long: a daily close above 4,028.28 on volume above the 1.53K MA5, then a retest of 4,000-4,030 that holds. Entry 4,040, stop under 3,990, which is 50 of risk. 4,058.50 is only about 0.4R, so I’d trim a small piece there, then 4,265.60 is about 4.5R and 4,472.70 about 8.7R. Breakdown (short or exit): a daily close under 3,851.40 on volume above the 1.53K MA5, then a failed retest of 3,850-3,890. Entry 3,865, stop above 3,905, which is 40 of risk. There’s nothing marked below on this chart to measure a target against, so I’d trail instead. Invalidation: the low-hold long fails under 3,830. The bearish read softens on a daily close above 3,991.41 (EMA14), and the downtrend has turned above 4,028.28 (EMA28). Risk note: price is near the lows of the chart and nothing is marked beneath it, so stops matter more than targets. XAUT tracks gold, so a move in gold itself can override these levels. Use limit orders and keep size small. That’s my read of the chart, not advice.$XAUTUSDT #ByXIMPACT
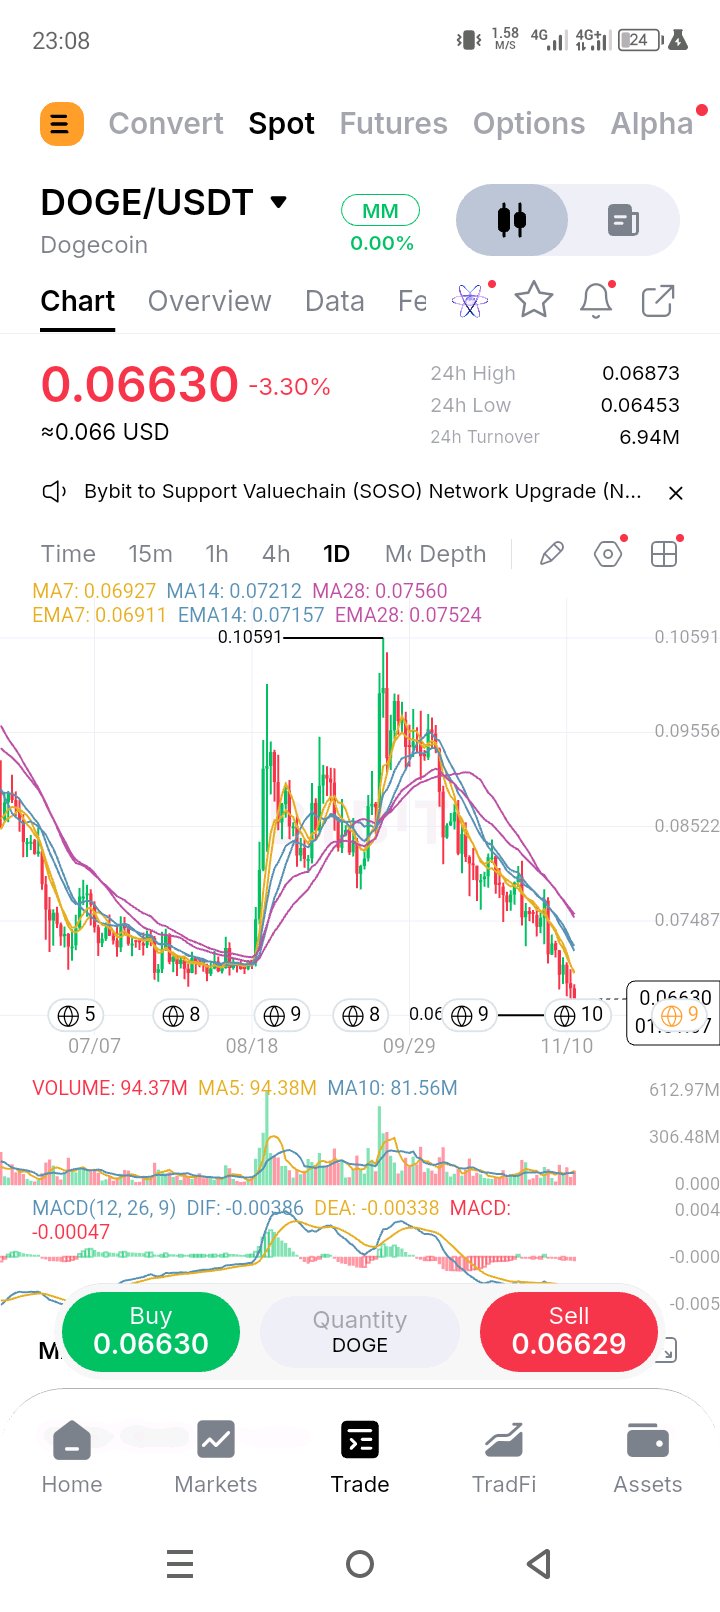
$DOGEUSDT is at 0.06630 (-3.30%), about 37% under the late-September high of 0.10591 and 2.7% above today’s low of 0.06453, which lines up with the 0.0645 grid line. The 24h range is 0.06453 to 0.06873, a 6.5% box. Price has broken below the whole August base, which by my read sat around 0.070-0.072, so it’s trading near the lowest prices on this chart, and the candle has under two hours left. Every average is overhead and falling: 4.1-4.3% under the EMA7 (0.06911) and MA7 (0.06927), 7.4-8.1% under the EMA14 (0.07157) and MA14 (0.07212), and 11.9-12.3% under the EMA28 (0.07524) and MA28 (0.07560). The old August base around 0.070-0.072 now acts as resistance, which stacks right on top of the fast pair and the 14s. Volume is holding up on the way down. Today’s bar is 94.37M with under two hours to go, level with the MA5 (94.38M) and 16% above the MA10 (81.56M), and the 24h turnover of 6.94M USDT works out to roughly 105M DOGE. The MA5 is about 16% above the MA10, so participation has been rising into the low. That’s selling with conviction, not a drift. MACD is neutral to negative: DIF (-0.00386) is just under DEA (-0.00338), a histogram of -0.00047, with both lines below zero. Levels to watch: Support: 0.06453 (24h low and the grid line). Nothing is marked below it on this chart. Resistance: 0.06873 (24h high), 0.06911 (EMA7), 0.06927 (MA7), roughly 0.070-0.072 (the old August base, approximate), 0.07157 (EMA14), 0.07212 (MA14), 0.07487 (grid line), 0.07524 (EMA28), 0.07560 (MA28), 0.08522 (grid line), then 0.10591 (the high). Plan, on daily closes: Low-hold long: a dip into 0.0640-0.0660 that holds on the daily close. Entry 0.0655, stop under 0.0625, which is 0.0030 of risk. 0.06911 is about 1.2R, 0.07157 about 2.0R and 0.07524 about 3.2R. Reclaim long: a daily close above 0.06927 on volume above the 94.38M MA5, then a retest of 0.0687-0.0693 that holds. Entry 0.0700, stop under 0.0675, which is 0.0025 of risk. The MA14 at 0.07212 is only about 0.8R, so I’d trim there, then 0.07524 is about 2.1R and 0.08522 about 6.1R. Breakdown (short or exit): a daily close under 0.06453 on volume above the 94.38M MA5, then a failed retest of 0.0645-0.0675. Entry 0.0660, stop above 0.0690, which is 0.0030 of risk. There’s nothing marked below on this chart to measure a target against, so I’d trail instead. Invalidation: the low-hold long fails under 0.0625. The bearish read softens on a daily close above 0.07212 (MA14), and the downtrend has turned above 0.07560 (MA28). Risk note: with price near the lows of the chart and no levels beneath it, stops matter more than targets. Use limit orders and keep size small. That’s my read of the chart, not advice.$DOGEUSDT #IMPACTbyTrade
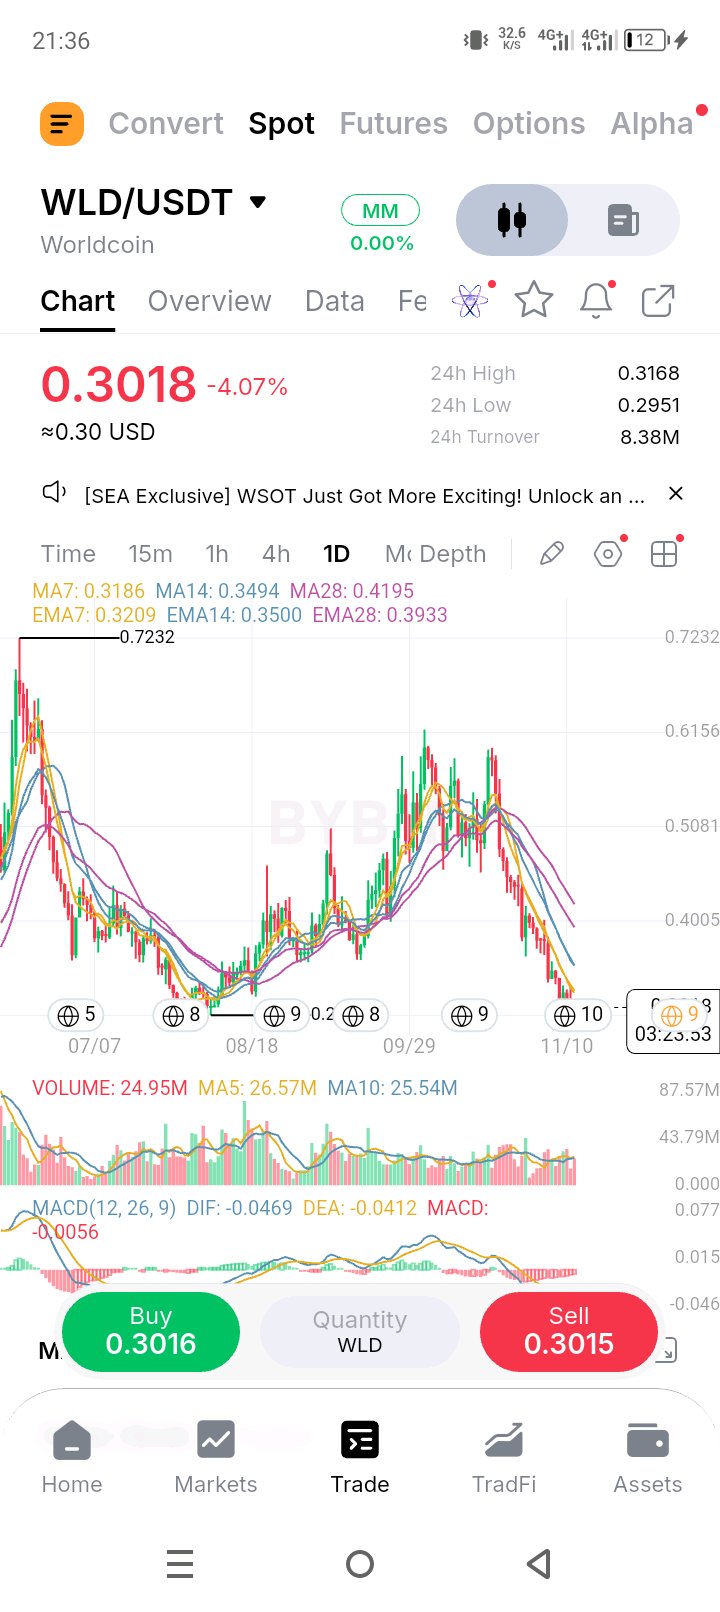
$WLDUSDT is at 0.3018 (-4.07%), about 51% under the early-October high (roughly 0.615 by my read of the axis) and 2.9% above the 0.2930 grid line, which lines up with the August low. Today’s low of 0.2951 stopped within 0.7% of that level, and the 24h range is 0.2951 to 0.3168, a 7.4% swing. The candle has about three and a half hours left, so the close is nearly set. Every average is overhead and falling: 5.3% under the MA7 (0.3186), 5.9% under the EMA7 (0.3209), 13.6-13.8% under the 14s (0.3494 and 0.3500), 23.3% under the EMA28 (0.3933) and 28.1% under the MA28 (0.4195). The first node is 0.3168-0.3209, where the 24h high, MA7 and EMA7 sit within 1.3% of each other. Beyond it, the old September floor, roughly 0.36-0.38 by my read, sits just above the 14s. Volume is steady, not accelerating. Today’s bar is 24.95M with three and a half hours left, already 94% of the MA5 (26.57M) and 98% of the MA10 (25.54M), and the 24h turnover of 8.38M USDT works out to roughly 27.8M WLD. MACD is the encouraging part: DIF (-0.0469) is under DEA (-0.0412), but the histogram has shrunk to -0.0056, and by my read the DIF has stayed roughly flat while price edged lower. That’s a mild positive divergence, not a signal on its own. Levels to watch: Support: 0.2951 (24h low), then 0.2930 (grid line, partly hidden behind the price label, so worked out from the axis spacing, and about where the August low sits). There’s nothing marked below it on this chart. Resistance: 0.3168 (24h high), 0.3186 (MA7), 0.3209 (EMA7), roughly 0.36-0.38 (the old September floor, approximate), 0.3494 (MA14), 0.3500 (EMA14), 0.3933 (EMA28), 0.4005 (grid line), 0.4195 (MA28), 0.5081 (grid line), then 0.6156 (grid line). Plan, on daily closes: August-low long: a hold of 0.2930-0.3000 on the daily close. Entry 0.2970, stop under 0.2820, which is 0.0150 of risk. 0.3209 is about 1.6R, 0.3500 about 3.5R and 0.3933 about 6.4R. Reclaim long: a daily close above 0.3209 on volume above the 26.57M MA5, then a retest of 0.3168-0.3209 that holds. Entry 0.3250, stop under 0.3110, which is 0.0140 of risk. 0.3500 is about 1.8R, 0.3933 about 4.9R and 0.4195 about 6.8R. Breakdown (short or exit): a daily close under 0.2930 on volume above the 26.57M MA5, then a failed retest of 0.2930-0.3010. Entry 0.2970, stop above 0.3050, which is 0.0080 of risk. There’s nothing marked below on this chart to measure a target against, so I’d trail instead. Invalidation: the August-low long fails under 0.2820. The bearish read softens on a daily close above 0.3500 (EMA14), and the downtrend has turned above 0.4195 (MA28). Risk note: this is the second test of the same support in a few days, and nothing below it is tested on this chart, so stops matter. Use limit orders and keep size small. That’s my read of the chart, not advice #ByXIMPACT$WLDUSDT
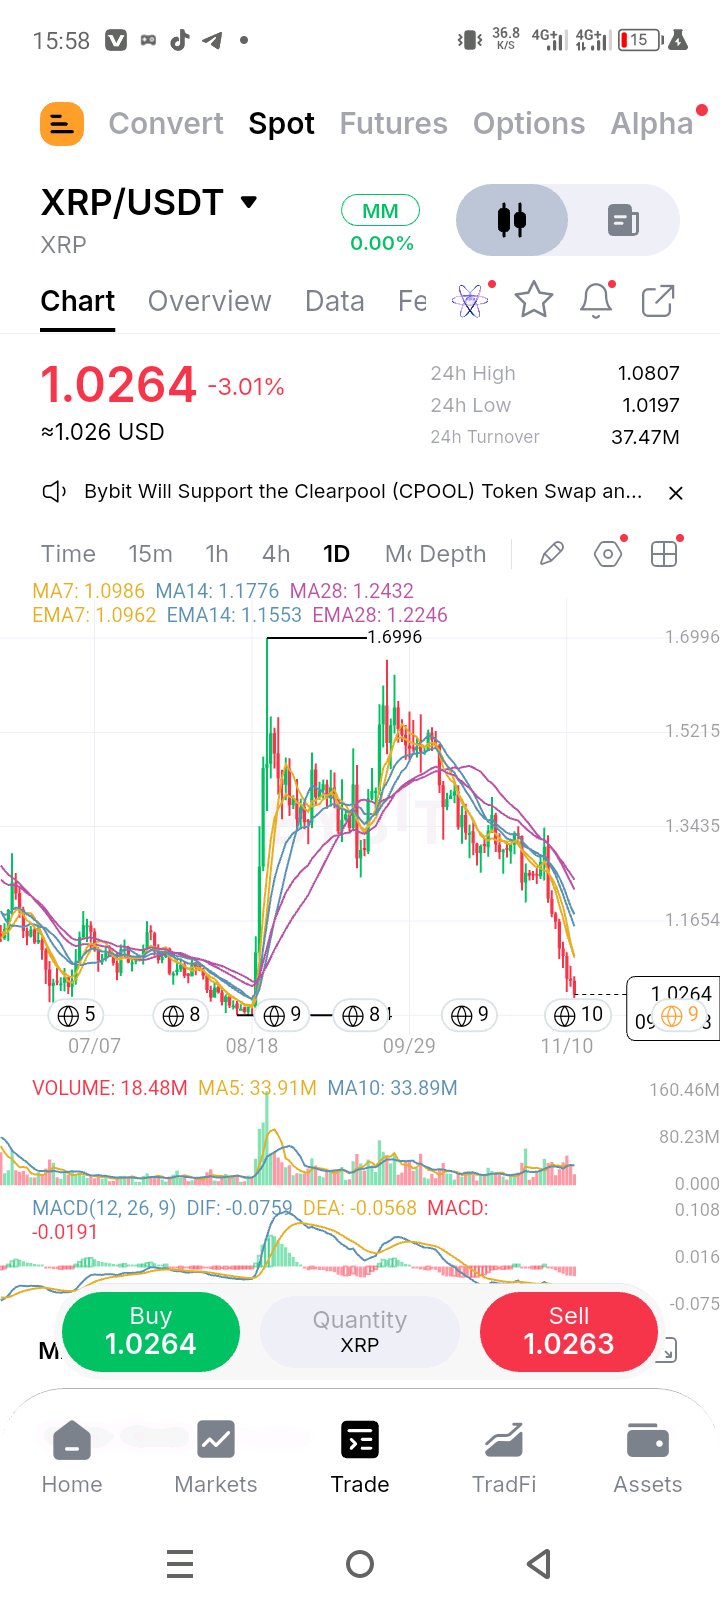
$XRPUSDT is at 1.0264 (-3.01%), a massive 39.6% under the peak of 1.6996 from mid-September, and currently sitting just 0.6% above the 24h low of 1.0197. The recent push toward the moving average cluster failed dramatically, resulting in a steep, cascading drop. Price is currently breaking down below major structural support. The 24h range is 1.0197 to 1.0807, about 6.0%, and the daily candle has roughly 8 hours left. All six averages are stacked heavily above the current price, confirming a violent bearish macro trend. Price is 6.5% under the short-term MA7 (1.0986) and 11.5% under the EMA7 (1.0962). The medium and long-term averages are acting as heavy ceilings: MA14 (1.1776), EMA14 (1.1553), and EMA28 (1.2246). The MA28 sits a massive 19.3% above current price. So every moving average on the chart is acting as overhead resistance, and the 24h low (1.0197) is the only immediate floor. Volume is showing signs of exhaustion on the sell-off. Current candle volume is 18.48M, which is roughly 45% below both the MA5 (33.91M) and MA10 (33.89M). Price is falling hard on declining volume. That means the aggressive sellers might be running out of steam, but there is absolutely no aggressive buying stepping in to catch the knife. Thin volume during a breakdown can lead to sharp, erratic wicks. MACD is deeply negative and expanding downward. DIF (-0.0759) is below DEA (-0.0568), and the histogram is at -0.0191. Both lines are far below the zero line, and the expanding red histogram confirms that bearish momentum is still accelerating. There is no sign of a bullish divergence or a bottoming cross yet. Levels to watch: Support: 1.0197 (24h low), then the deeper structural floor around 1.0000 (psychological level) and the prior chart swing low near 0.9000. Resistance: 1.0807 (24h high), 1.0962 (EMA7), 1.0986 (MA7), 1.1553 (EMA14), 1.1776 (MA14), then 1.2246 (MA28). Plan, on daily closes: Floor long (high risk): a dip into 1.0000-1.0197 that holds on the daily close. Entry 1.015, stop under 0.990, which is 25 of risk. 1.0962 is about 3.2R, and 1.1553 is about 5.6R. Reclaim long: a daily close above 1.0986 (MA7) on volume above the 33.91M MA5, then a retest of 1.080-1.098 that holds. Entry 1.100, stop under 1.050, which is 50 of risk. 1.1776 is about 1.5R and 1.2246 is about 2.5R. Breakdown (short): a daily close under 1.0197 on volume expansion, then a failed retest of 1.020-1.050. Entry 1.010, stop above 1.050, which is 40 of risk. The 0.900 structural floor is about 2.7R. Invalidation: the floor long fails on a close back under 0.990, and the reclaim idea is wrong on a close back under 1.050. A daily close under 1.0000 ends the immediate bounce scenario and opens deep macro downside. Risk note: XRP is in a steep, unconfirmed freefall with no moving average support in sight. The MACD is accelerating downward, and while volume is dropping, there is no bullish reversal signal. Catching this falling knife is highly dangerous. Use limit orders and keep size very small. That’s my read of the chart, not advice.$XRPUSDT #ByXIMPACT
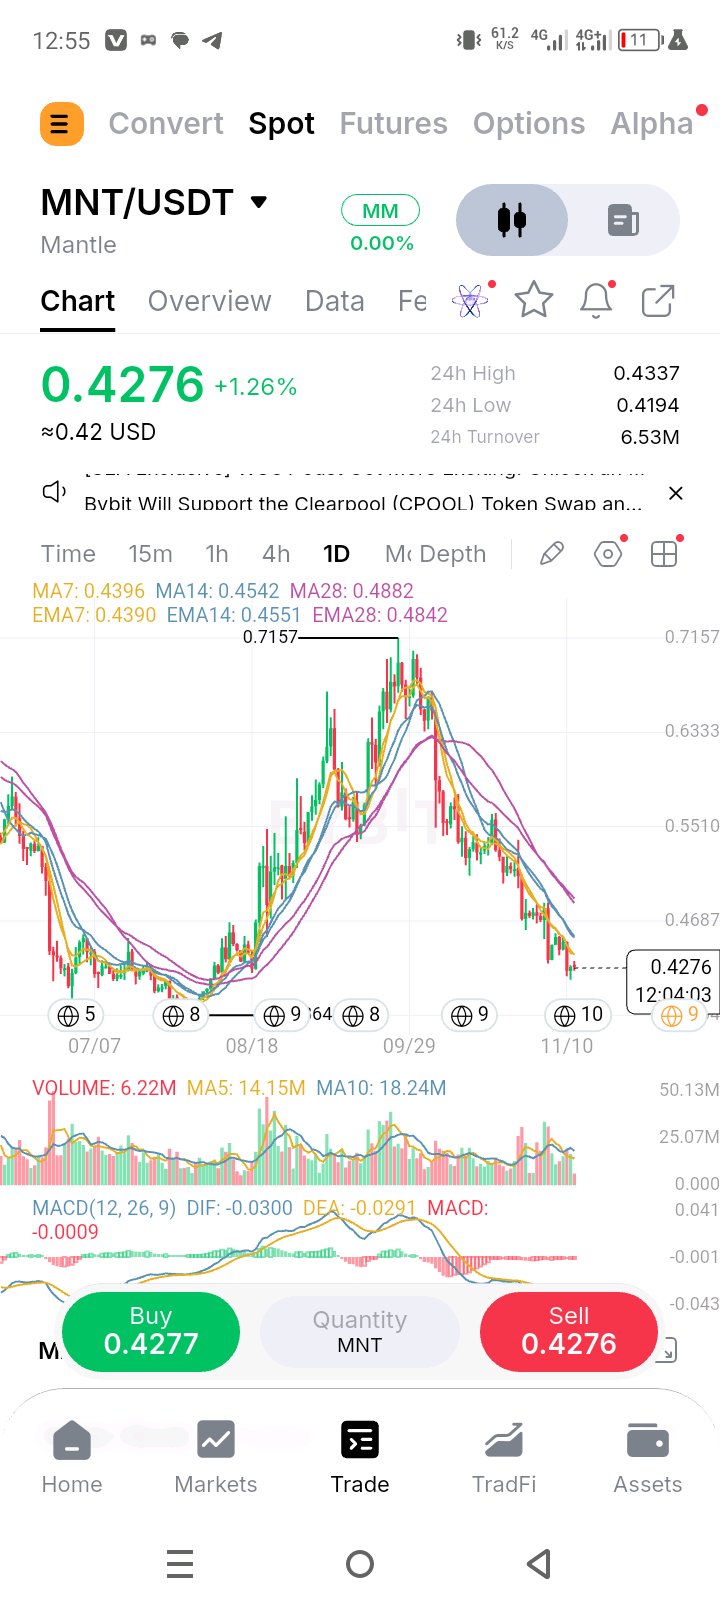
$MNTUSDT is at 0.4276 (+1.26%), about 40% under the late-September high of 0.7157 and only 2.0% above today’s low of 0.4194. It has now slid into the area where the July and August lows sit, roughly 0.40-0.41 by my read of the axis, with the chart low at the 0.3864 grid line. The 24h range is 0.4194 to 0.4337, a 3.4% box, and the candle has about 12 hours left. Every average is overhead and falling: 2.6-2.7% under the EMA7 (0.4390) and MA7 (0.4396), 5.9-6.0% under the MA14 (0.4542) and EMA14 (0.4551), and 11.7-12.4% under the EMA28 (0.4842) and MA28 (0.4882). The 0.4687 grid line sits between the 14s and the 28s, so a bounce has three layers to get through, the first only 2.6% away. Volume is fading with the price. The 24h turnover of 6.53M USDT works out to roughly 15.3M MNT, about 8% above the MA5 (14.15M) but 16% under the MA10 (18.24M), and today’s bar is 6.22M with 12 hours to go. The MA5 is about 78% of the MA10. The slide hasn’t been accelerating on volume. MACD has flattened out: DIF (-0.0300) is only 0.0009 under DEA (-0.0291), with both lines below zero, so downside momentum has stopped growing, though it hasn’t turned. Levels to watch: Support: 0.4194 (24h low), roughly 0.40-0.41 (the July-August lows, approximate), then 0.3864 (grid line, the chart low). Resistance: 0.4337 (24h high), 0.4390 (EMA7), 0.4396 (MA7), 0.4542 (MA14), 0.4551 (EMA14), 0.4687 (grid line), 0.4842 (EMA28), 0.4882 (MA28), 0.5510 (grid line), 0.6333 (grid line), then 0.7157 (the high). Plan, on daily closes: Floor long: a dip into 0.4000-0.4200 that holds on the daily close. Entry 0.4150, stop under 0.3950, which is 0.0200 of risk. 0.4396 is about 1.2R, 0.4551 about 2.0R and 0.4882 about 3.7R. A sweep of the lows toward 0.3864 is possible, so I’d wait for a reaction candle. Reclaim long: a daily close above 0.4396 on volume above the 14.15M MA5, then a retest of 0.4337-0.4396 that holds. Entry 0.4430, stop under 0.4300, which is 0.0130 of risk. The 14s at 0.4551 are only about 0.9R, so I’d trim there, then 0.4687 is about 2.0R and 0.4882 about 3.5R. Breakdown (short or exit): a daily close under 0.4194 on volume above the 14.15M MA5, then a failed retest of 0.4194-0.4300. Entry 0.4250, stop above 0.4350, which is 0.0100 of risk. The 0.3864 chart low is about 3.9R, and under it there’s nothing on this chart to measure against. Invalidation: the floor long fails under 0.3950. The bearish read softens on a daily close above 0.4551 (EMA14), and the downtrend has turned above 0.4882 (MA28). Risk note: a support zone that gets tested again and again can be swept before it holds, so I’d wait for a reaction candle and keep size small. Use limit orders. That’s my read of the chart, not advice.$MNTUSDT #IMPACTbyTrade
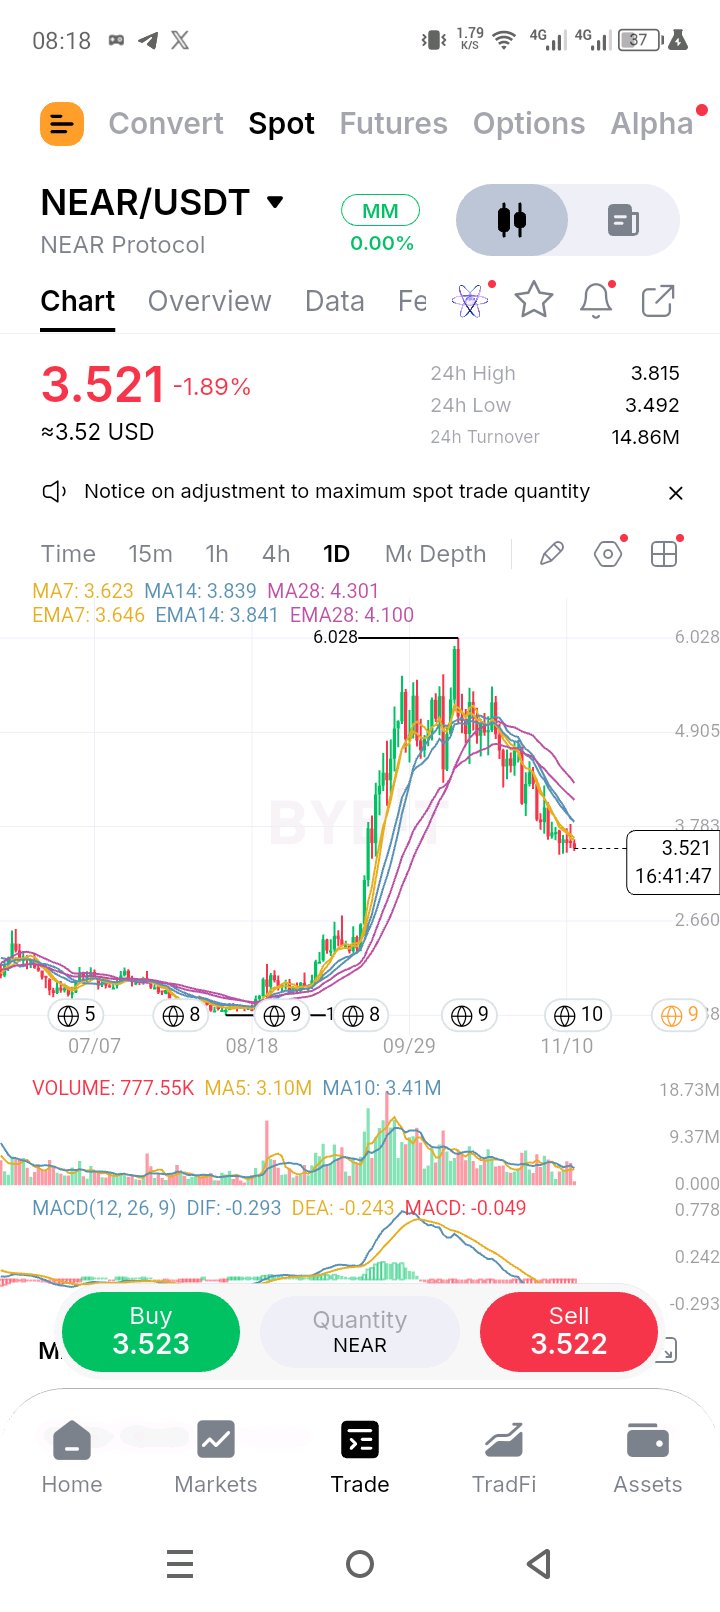
$NEARUSDT is at 3.521 (-1.89%), about 42% under the mid-October high of 6.028 and just 0.8% above today’s low of 3.492, which sits right on the recent low near 3.48 (read off the axis, so approximate). The 24h range is 3.492 to 3.815, a 9% swing: price pushed above the 3.783 grid line, was rejected, and has given back almost all of that push. The candle has about 16 hours left. Every average is overhead and falling: 2.8% under the MA7 (3.623), 3.4% under the EMA7 (3.646), 8.3% under the MA14 (3.839) and EMA14 (3.841), 14.1% under the EMA28 (4.100) and 18.1% under the MA28 (4.301). The 3.783 grid line, the 24h high and the 14s all sit between 3.78 and 3.84, a 1.5% node, and that’s the wall a bounce has to clear. Volume is moderate. The 24h turnover of 14.86M USDT works out to roughly 4.2M NEAR, about 36% above the MA5 (3.10M) and 24% above the MA10 (3.41M), though today’s own bar is only 777.55K about seven hours in. The selling hasn’t needed a spike. MACD is flat and negative: DIF (-0.293) is under DEA (-0.243), a histogram of -0.049, with both lines below zero. Levels to watch: Support: 3.492 (24h low), roughly 3.48 (the recent low, approximate), then the 2.660 grid line, roughly 2.2 (the base top, approximate) and the 1.537 grid line. Nothing is marked between 3.48 and 2.66. Resistance: 3.623 (MA7), 3.646 (EMA7), 3.783 (grid line), 3.815 (24h high), 3.839 (MA14), 3.841 (EMA14), 4.100 (EMA28), 4.301 (MA28), 4.905 (grid line), then 6.028 (the high). Plan, on daily closes: Low-hold long: a dip into 3.44-3.50 that holds on the daily close. Entry 3.480, stop under 3.360, which is 0.120 of risk. 3.646 is about 1.4R, 3.841 about 3.0R and 4.100 about 5.2R. Reclaim long: a daily close above 3.841 on volume above the 3.10M MA5, then a retest of 3.78-3.84 that holds. Entry 3.880, stop under 3.720, which is 0.160 of risk. 4.100 is about 1.4R, 4.301 about 2.6R and 4.905 about 6.4R. Breakdown (short or exit): a daily close under 3.470 on volume above the 3.10M MA5, then a failed retest of 3.47-3.60. Entry 3.540, stop above 3.650, which is 0.110 of risk. The 2.660 grid line is about 8.0R, but there’s nothing marked in between, so treat that target as rough. Invalidation: the low-hold long fails under 3.360. The bearish read softens on a daily close above 3.841, and the downtrend has turned above 4.301 (MA28). Risk note: a low that keeps getting retested with nothing marked beneath it tends to give way eventually, so I’d wait for the daily close and keep size small. Use limit orders. That’s my read of the chart, not advice #IMPACTbyTrade$NEARUSDT