Khaleepha
Khaleepha FX | Forex & Crypto Trader 📊 Market Analyst | 🎯 Discipline | 📈 Consistency +234 9030829501
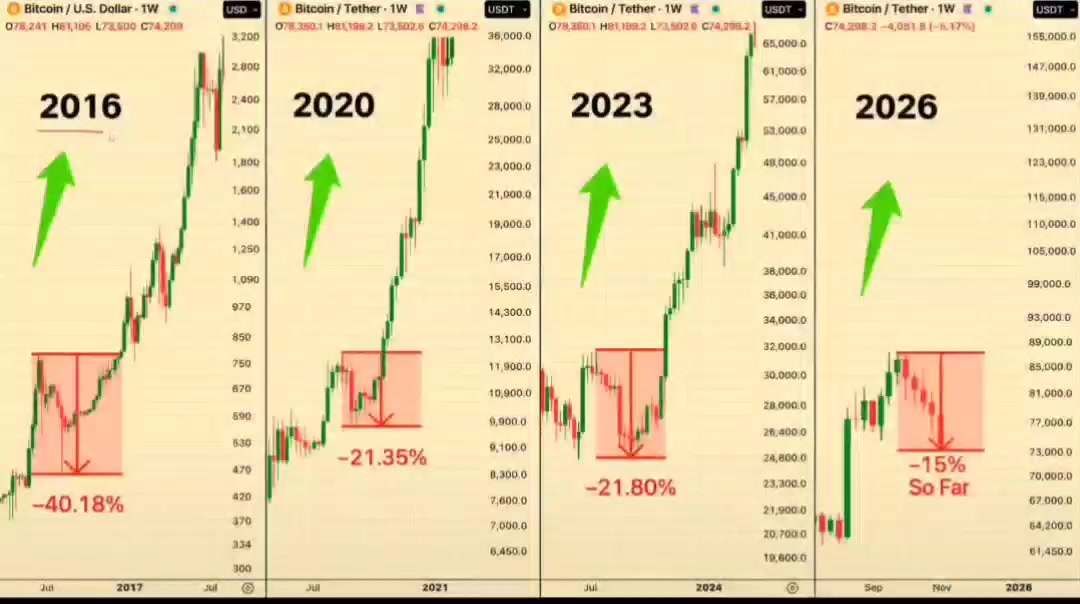
🚨 WARNING: 99% OF PEOPLE WILL MISS THE NEXT BITCOIN RALLY!! Everyone was BEGGING for a BTC crash. Now Bitcoin is down 15%, and suddenly nobody wants to buy. Look at what happened before: → 2016: −40.18% → MASSIVE RALLY → 2020: −21.35% → MASSIVE RALLY → 2023: −21.80% → MASSIVE RALLY → 2026: −15% SO FAR → ??? See the pattern? Every major shakeout was followed by another explosive move higher. The same setup could be forming AGAIN. $BTCUSDT #NovUSCPIWatch
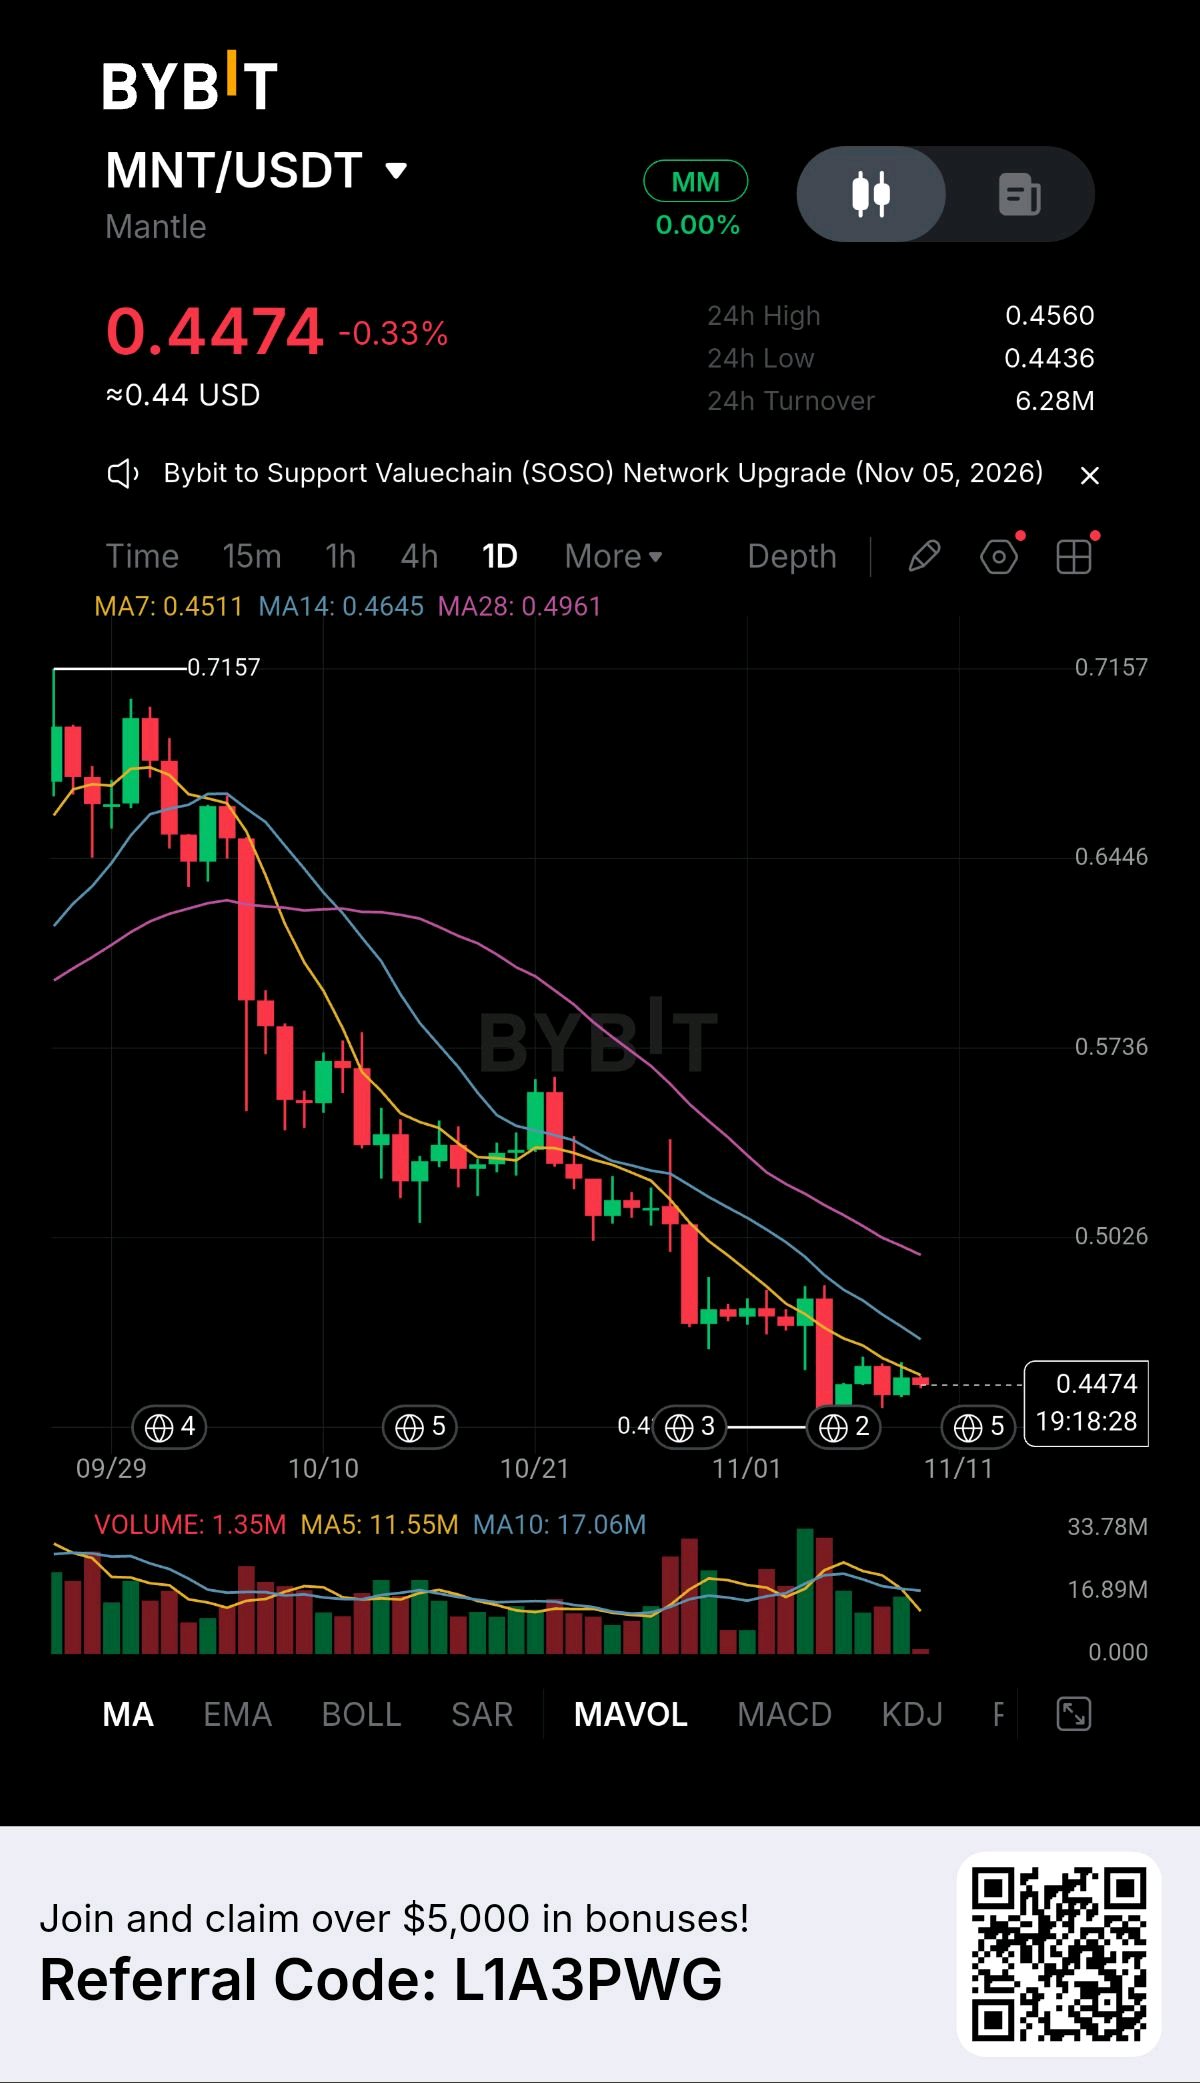
🚨 $MNT CONTINUES TO STRUGGLE — BEARS MAINTAIN CONTROL! 📉 Market Update: Mantle (MNT) is trading around $0.4474, down 0.33%, as the daily chart continues to show persistent selling pressure. The price remains below all three moving averages: - MA7: $0.4511 - MA14: $0.4645 - MA28: $0.4961 The overall structure remains bearish, with lower highs and lower lows dominating the chart. Recent price action suggests consolidation near the support zone rather than a confirmed reversal. 📊 Key Technical Levels: - Immediate Support: $0.440–$0.443 - Major Support: $0.420–$0.425 - Immediate Resistance: $0.451–$0.465 - Major Resistance: $0.490–$0.503 🔍 Market Scenarios: 🔴 Bearish: A confirmed daily close below $0.440 could expose the $0.420–$0.425 support zone, increasing downside pressure. 🟢 Bullish: A strong recovery above $0.465 could open the door toward $0.490–$0.503. However, buyers need to reclaim these levels to establish a stronger recovery. 📌 Fundamental Analysis: No confirmed fresh MNT-specific catalyst is evident from the provided chart. Mantle ecosystem growth, network adoption, liquidity, and broader market sentiment remain important factors to monitor. 🎯 Market Takeaway: MNT remains under bearish pressure while trading below its moving averages. The $0.440 support zone is critical. Traders should watch for a confirmed breakdown or a convincing recovery before expecting a trend change. What's your prediction? Will $MNT break below $0.440 or recover toward $0.500? $MNTUSDT #USPayrollsAndRateDecisionsDriveMacroWeek

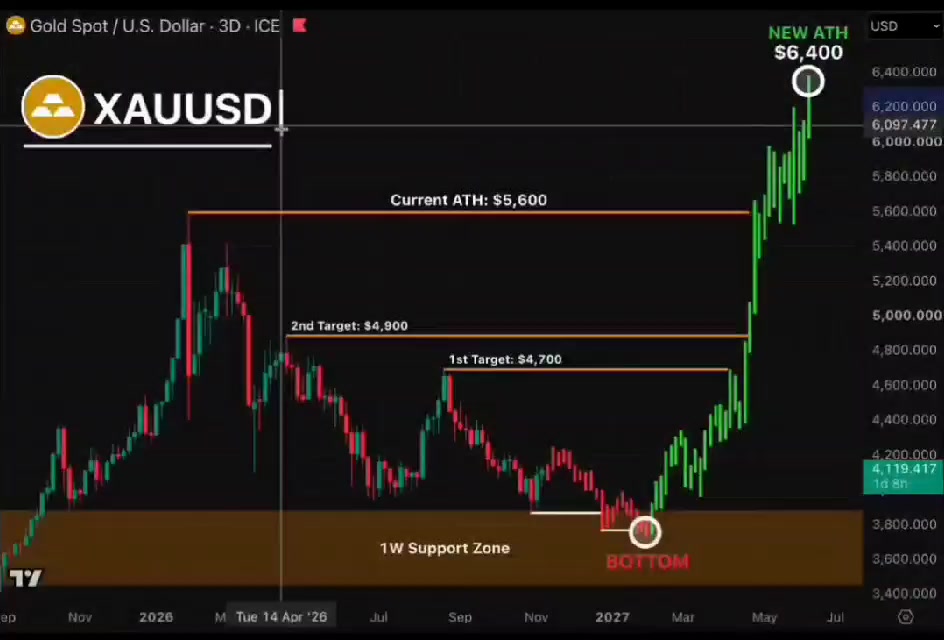
🚨 GOLD IS PREPARING ITS FINAL SHAKEOUT Gold is down ~30% from its $5,600 ATH. Everyone expects an even BIGGER crash I see the opposite: the last flush before the next leg up My roadmap: → $3,800-3,900: final wash into 1W support → CAPITULATION: weak hands get wiped out → $4,700 → $4,900: first targets → $5,600 → $6,400: breakout to NEW ATH That's a ~50% rise from the bottom to the old ATH Fear is building, weak hands are selling. This is exactly how major cycle bottoms form I'm not chasing here. I'm waiting for the capitulation $XAUTUSDT #MidtermsMarketWatch
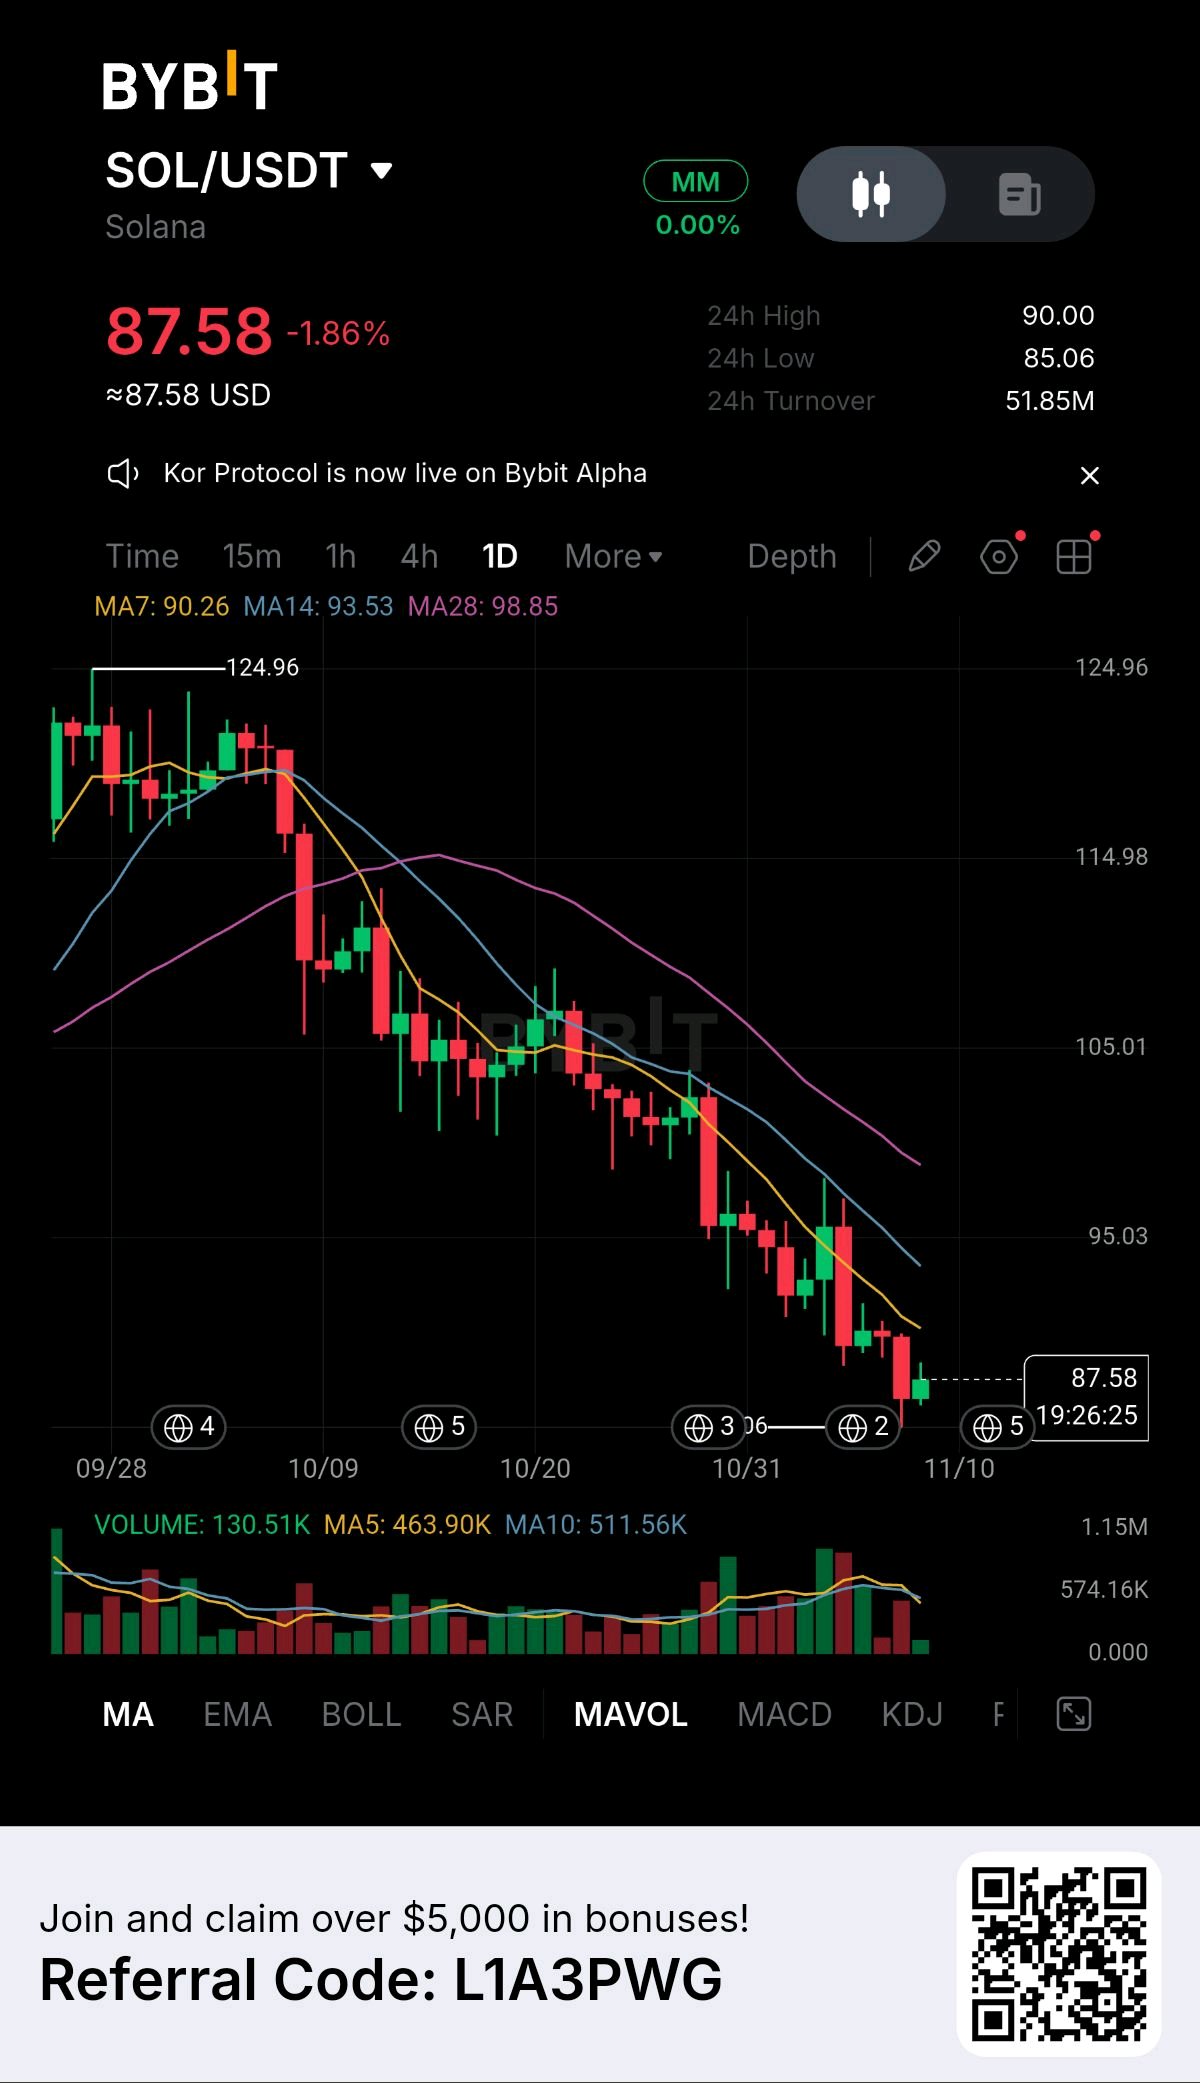
🚨 $SOLUSDT UNDER BEARISH PRESSURE — SELLERS STILL DOMINATE THE DAILY TREND! 📉 Market Update: Solana is trading around $87.58, down 1.86%, as bearish momentum continues to weigh on price. The daily chart shows a clear downward trend, with SOL trading below all three moving averages: - MA7: $90.26 - MA14: $93.53 - MA28: $98.85 This indicates that sellers remain in control, despite occasional recovery attempts. 📊 Key Technical Levels: - Immediate Support: $85–$86 - Major Support: $83 - Immediate Resistance: $90–$93 - Major Resistance: $98–$100 🔍 Market Scenarios: 🔴 Bearish: A daily close below $85 could expose the $83 support zone. Losing that level may create further downside pressure. 🟢 Bullish: A strong recovery above $90–$93 could provide early relief, while reclaiming $98–$100 would strengthen the bullish recovery case. 📌 Fundamental Analysis: The chart alone does not confirm any fresh fundamental catalyst. Broader crypto market sentiment, Solana ecosystem developments, and network activity remain important factors to monitor. 🎯 Market Takeaway: SOL remains technically bearish while trading below its major moving averages. Traders should watch the $85 support zone closely for signs of a breakdown or potential recovery. What's your prediction? Will SOL drop toward $83 or recover above $100? #WSOT2026

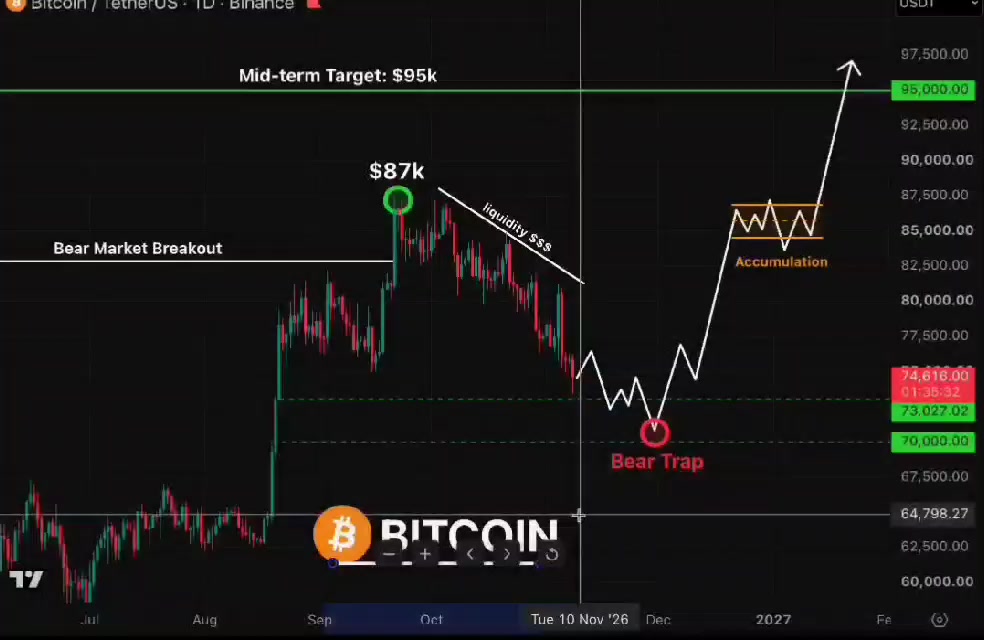
🚨 MASS $BTCUSDT LIQUIDATIONS AREN'T OVER YET... BITCOIN dropped to $73k, continuing its large-scale correction... I warned earlier about Bull Trap ~$87k, drop to $75k and continuation to $70k Now everything is following my plan exactly: $87k -> $75k -> $70k -> $80k -> $95k Whales are planning one last shakeout before the upcoming wave of growth Don't make the biggest mistake of 2026... #MidtermsMarketWatch #BybitAIEvolving
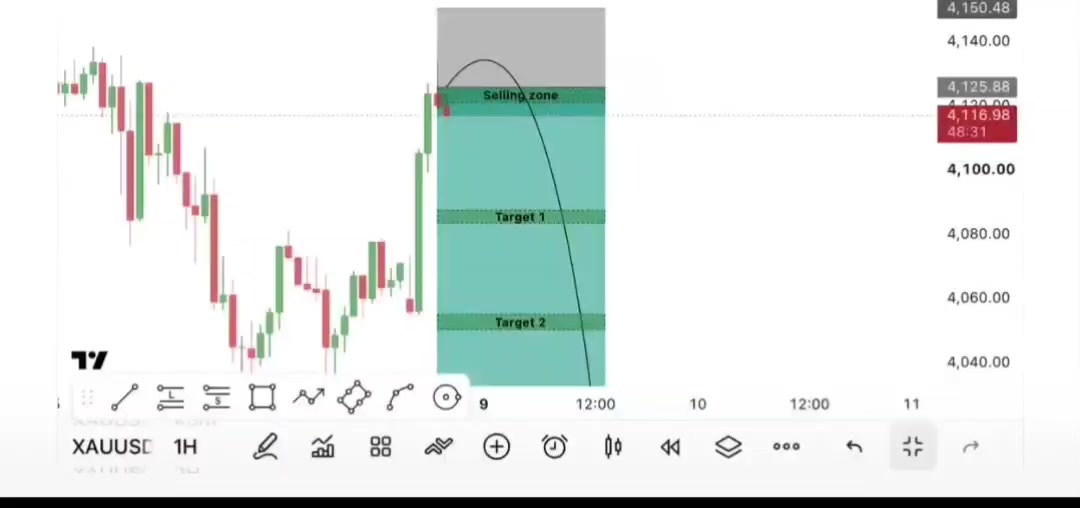
🔴 $XAUTUSDT SELL SETUP 🔴 📍 Entry Zone: 4119–4126 🎯 Target 1: 4085 🎯 Target 2: 4052 🎯 Final Target: 4020 🛑 Stop Loss: 4150 📉 Analysis: Bearish Rejection from Selling Zone. #WSOTPicktoEarn10U #MidtermsMarketWatch
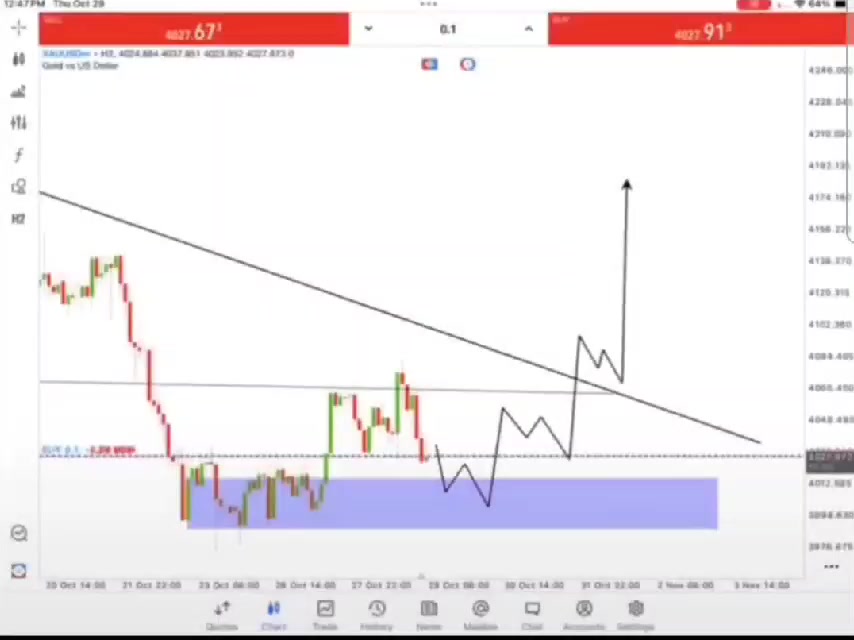
📊 #Gold (XAUUSD) Market Watch 🚀 Gold is near a key support zone! Will we see a bullish reversal? 📈👀 💬 What’s your view? BUY or SELL? $XAUTUSDT #ByXIMPACT
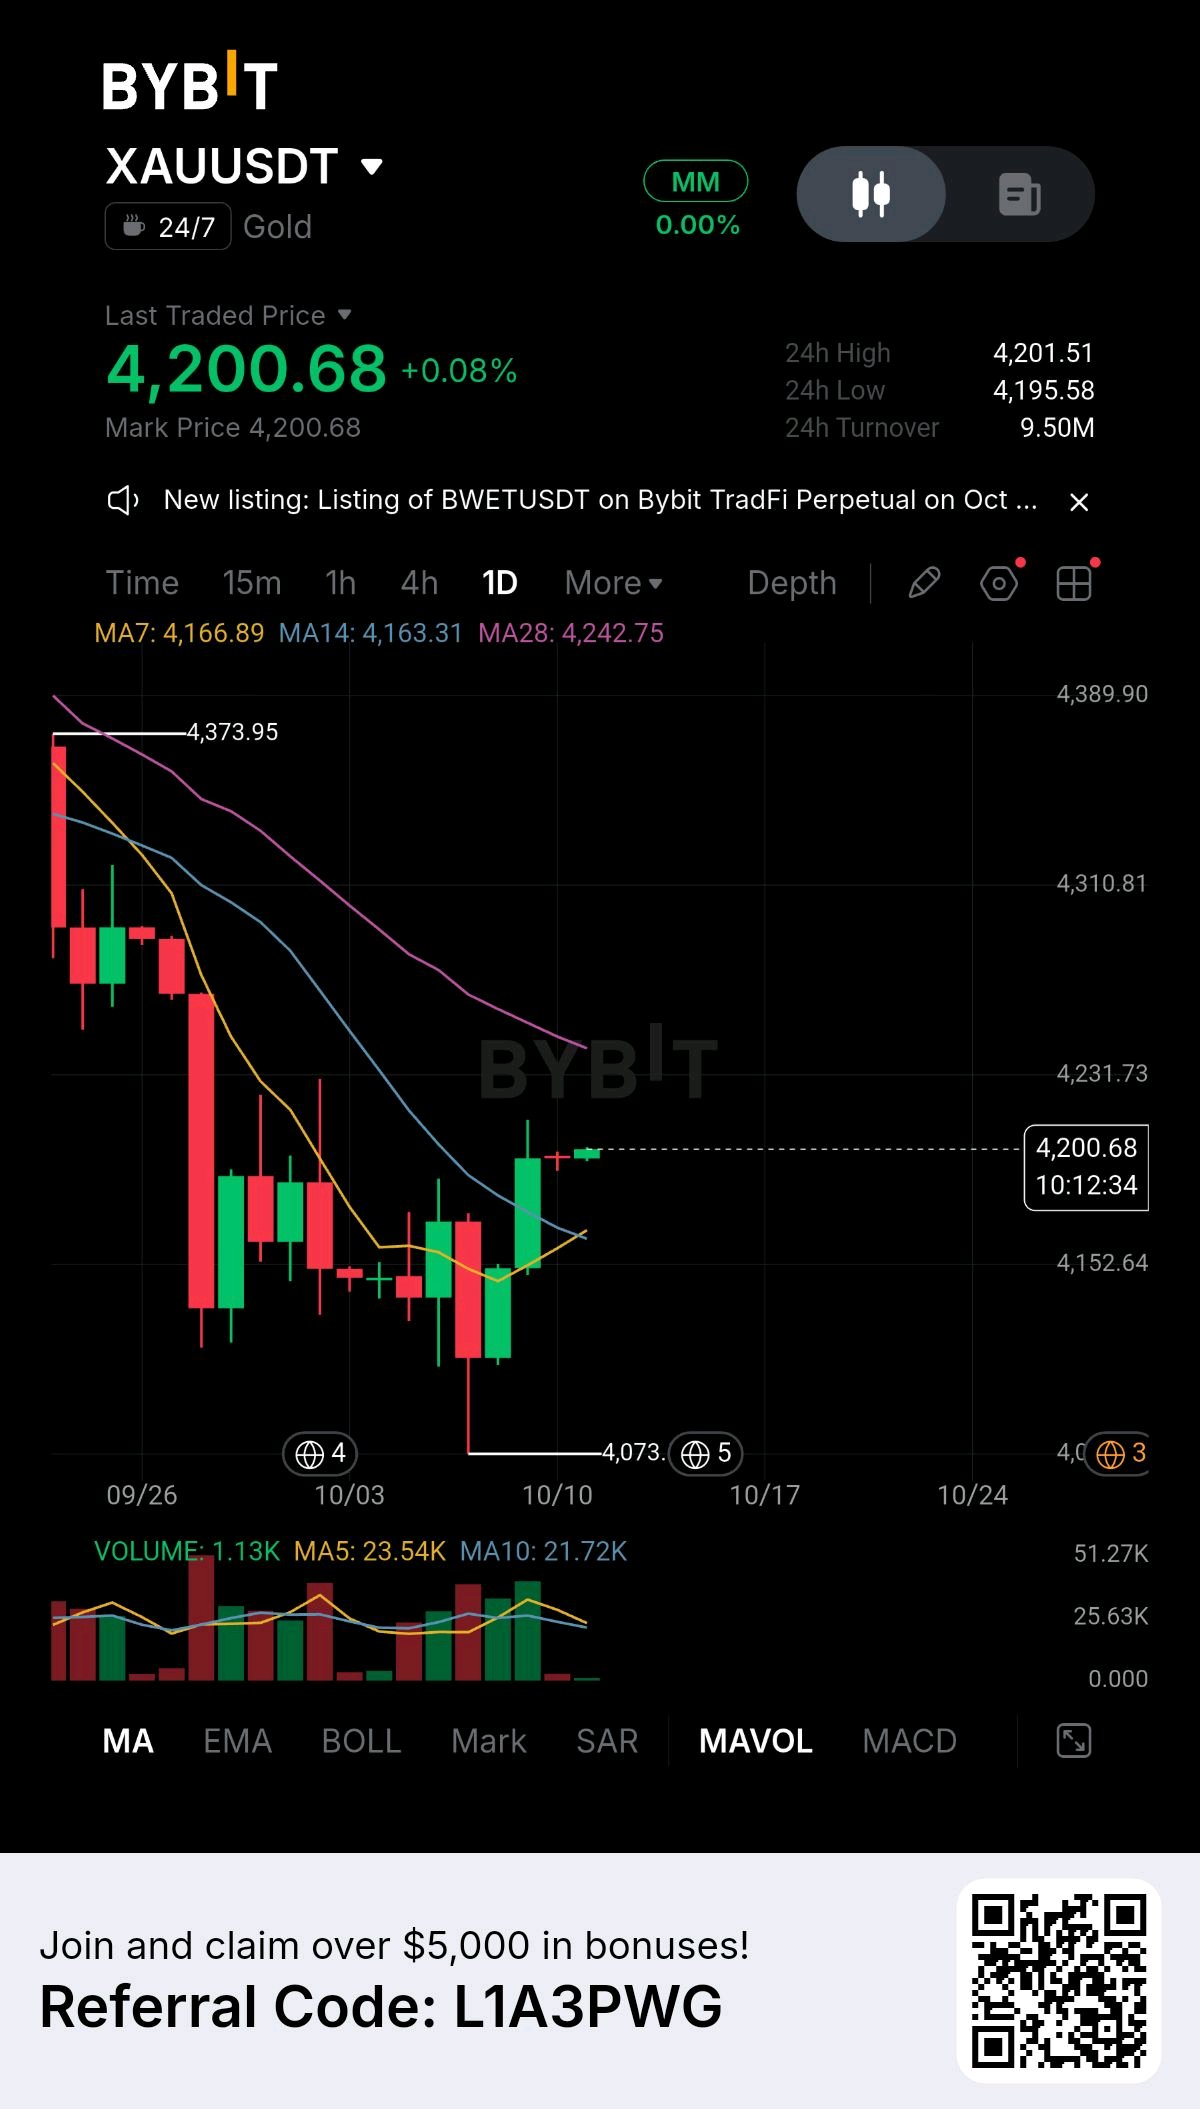
🚨 $XAUUSD GOLD REBOUNDS — BULLS FIGHT TO RECLAIM $4,200! 📊 Market Update: Gold is trading around $4,200.68 after recovering from the $4,073 support zone. Buyers have pushed price back above the MA7 ($4,166.89) and MA14 ($4,163.31), signaling a short-term recovery. However, the MA28 at $4,242.75 remains overhead resistance. 🔑 Key Levels: Resistance: $4,231–$4,243 Major Resistance: $4,310–$4,374 Support: $4,163–$4,152 Major Support: $4,073 📈 Bullish Scenario: A strong breakout above $4,243 could open the way toward $4,310 and potentially $4,374. 📉 Bearish Scenario: Rejection around $4,231–$4,243 could trigger another pullback toward $4,163. Losing $4,152 may expose the $4,073 support zone. 🌍 Fundamental Analysis: Gold's next move may depend on US economic data, Federal Reserve policy expectations, the US dollar, and safe-haven demand. These factors need confirmation from current market news. 🎯 Market Takeaway: Gold is showing signs of recovery, but the broader reversal is not confirmed. Watch how price reacts around $4,231–$4,243 before assuming the next major move. 💬 What's your target for gold next — $4,300 or a retest of $4,073? $XAUTUSDT #ByXIMPACT

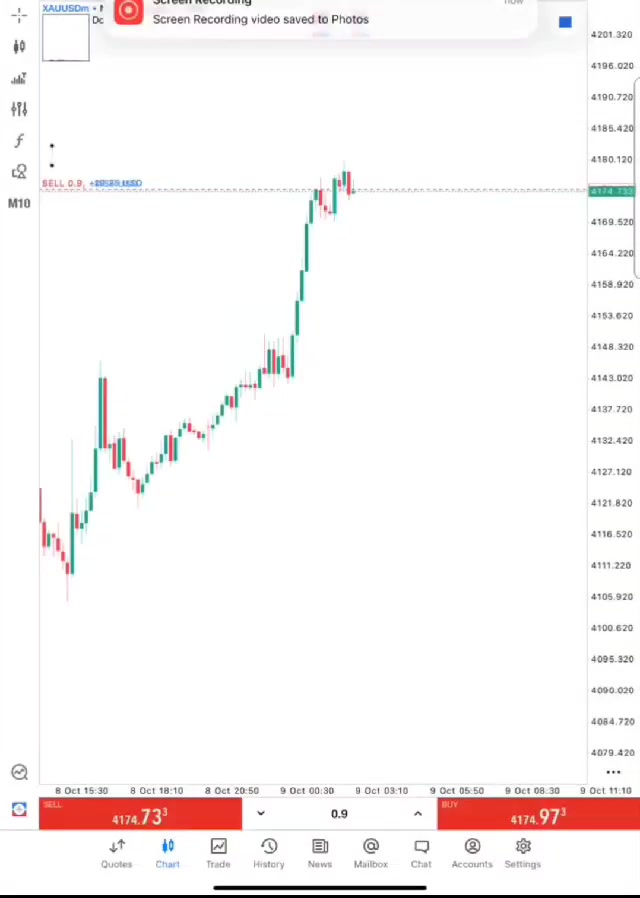
The overall market outlook remains bearish…. $XAUTUSDT As long as gold stays below the 4180-4185 short-selling zone, the market will continue to fall to test the 4183-4190 support level. In the short term, short positions can be opened at 4175-4180, with a downside target around 4098… #ByPickMakeYourPickCount
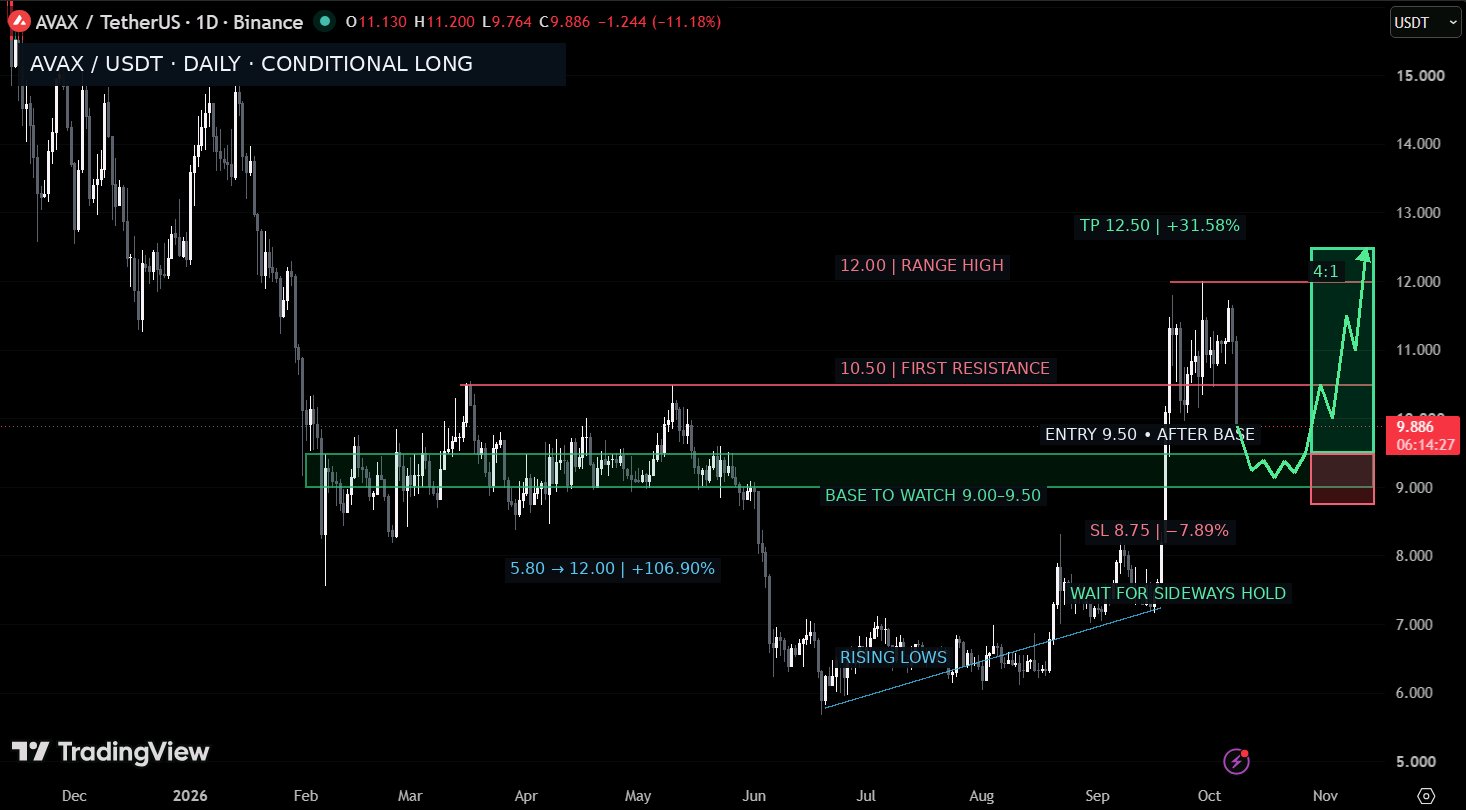
🚀 $AVAX NEEDS A BASE BEFORE THE NEXT PUSH After doubling from its June low, $AVAX is pulling back toward a familiar area. $9.00–$9.50 is the zone to watch. If price starts moving sideways there, holds its lows and then recovers $9.50, the case for another upward leg becomes stronger. That could bring $10.50 back into view, followed by $12.00–$12.50. The sideways base comes first. Losing $8.75 would weaken this scenario and expose the lower $7.50–$8.00 area. $AVAXUSDT #ByXIMPACT
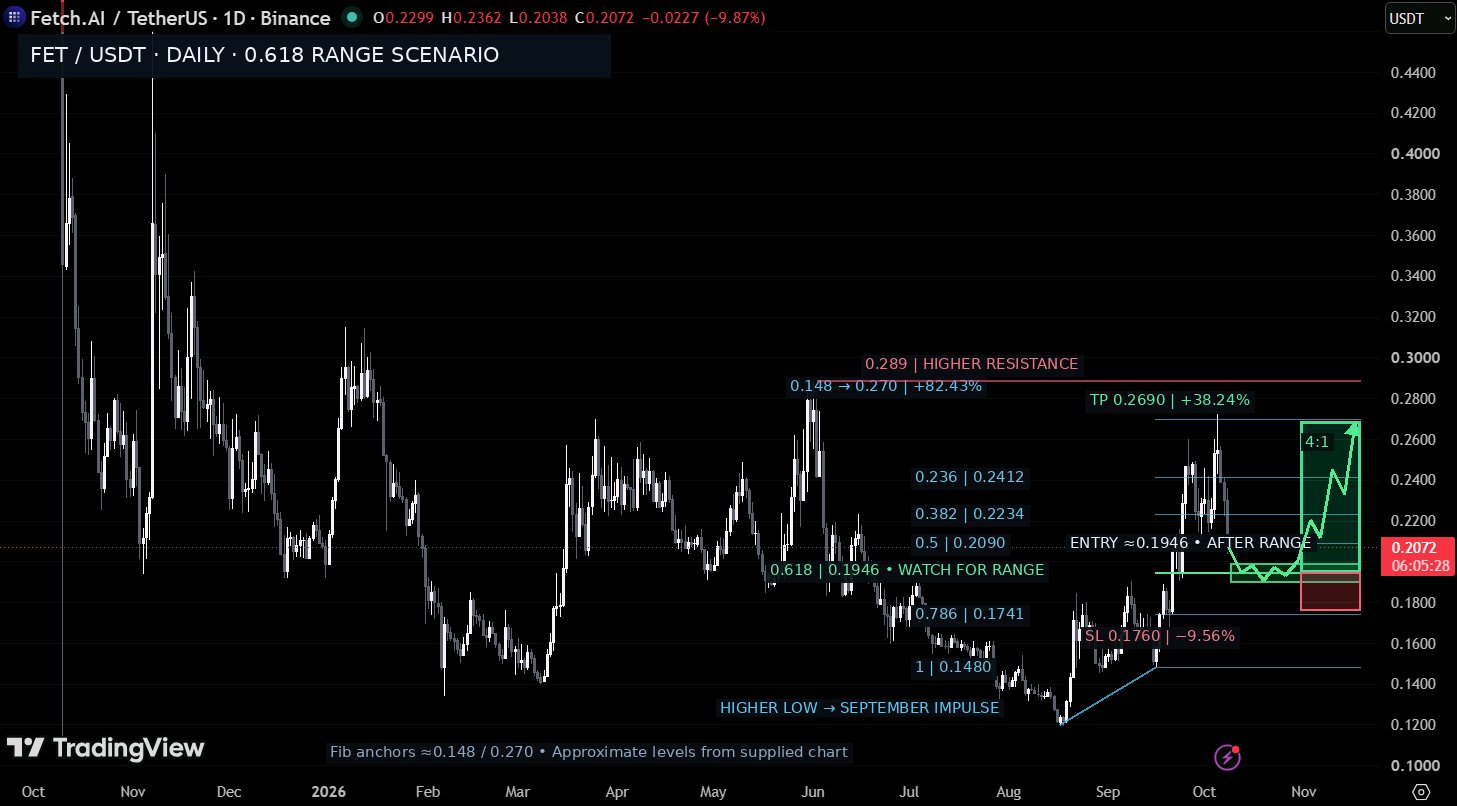
🚀 $FET’S PULLBACK HAS A ZONE WORTH WATCHING The latest upward leg from roughly $0.148 to $0.270 places the 0.618 retracement near $0.1946. If $FET reaches $0.190–$0.199 and starts moving sideways while holding its lows, that could build a base for another push higher. A recovery above that range would bring $0.222 and $0.241 into focus, followed by the previous high near $0.270. The sideways hold comes first. Losing $0.176 would weaken this scenario. $FETUSDT #BybitOdds
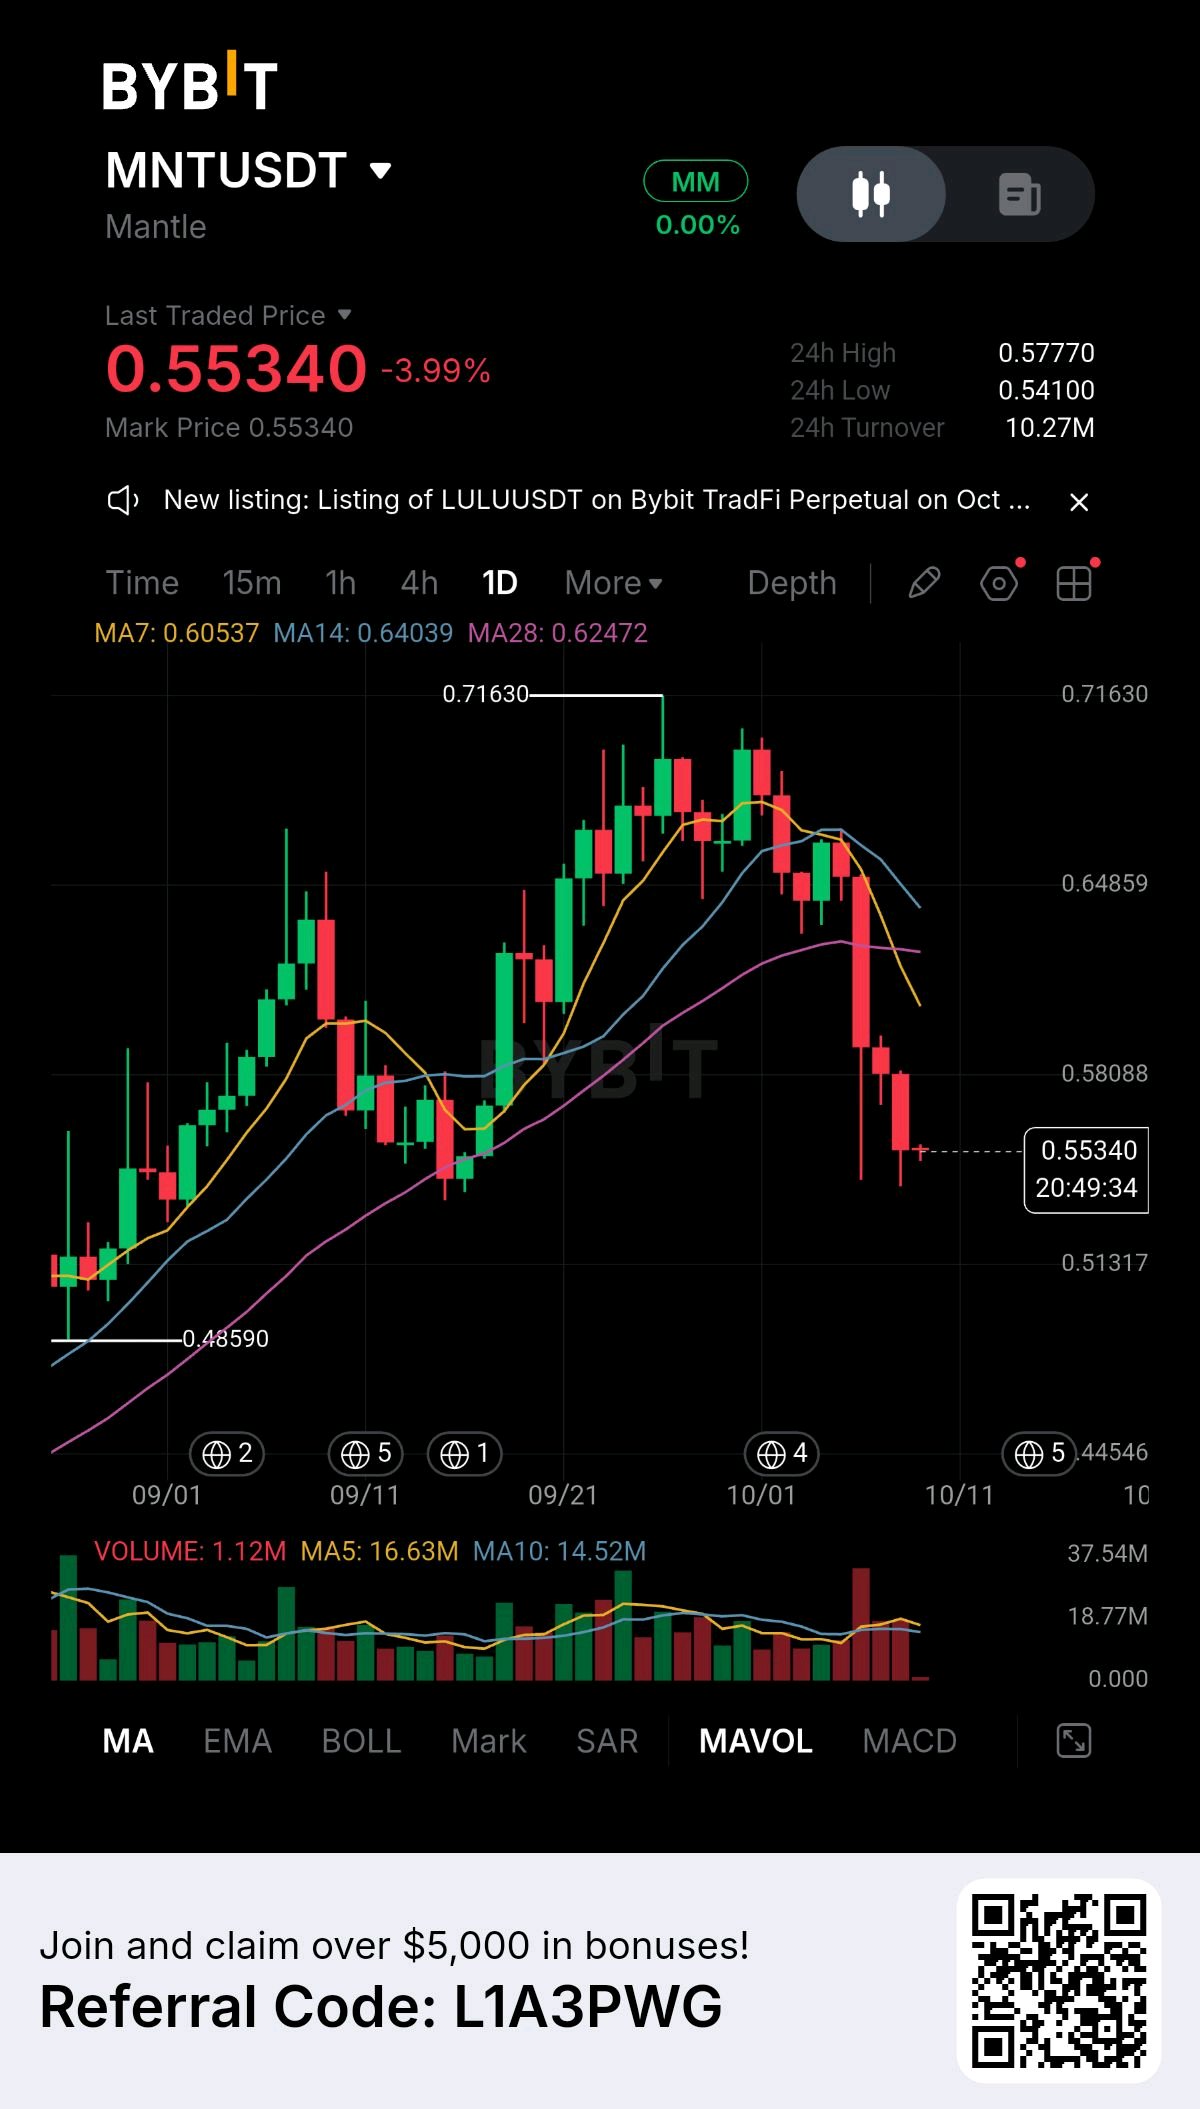
🚨 $MNT BREAKS DOWN — BEARS TAKE CONTROL ON THE DAILY CHART $MNT is trading around $0.5534 (-3.99%), extending its decline after a sharp rejection from the $0.68–$0.70 zone. Price is now trading below MA7 ($0.6054), MA14 ($0.6404), and MA28 ($0.6247), confirming strong bearish momentum. 📊 Key Levels • Resistance: $0.580–$0.605 • Major resistance: $0.625–$0.648 • Support: $0.540–$0.550 • Major support: $0.513–$0.520 • Lower support: $0.485–$0.490 📉 Bearish Scenario: A confirmed daily close below $0.540 could expose the $0.513–$0.520 zone, with further downside possible if selling pressure continues. 📈 Bullish Scenario: Reclaiming $0.605 would be the first sign of recovery. A move above $0.625–$0.648 would further weaken the bearish structure. Market Takeaway: The daily trend is bearish while MNT remains below $0.605. Watch the $0.540 support closely for signs of either a breakdown or a relief bounce. Will MNT break below $0.540, or can buyers stage a recovery? $MNTUSDT #ByXIMPACT

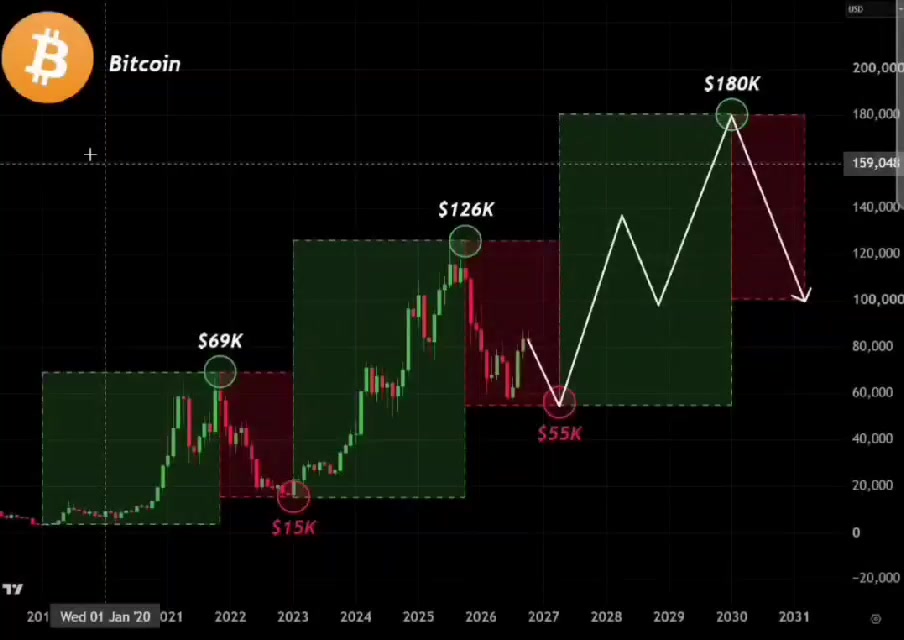
🚨 BITCOIN HAS ONE LAST TRAP BEFORE THE NEXT BULL RUN Bitcoin is entering the last leg down. The bull trap is finished. One more flush before the next cycle actually begins. Here's the path: $79K → $67K → $55K → New bull run Next stops: → $67K within days → $55K before the reversal → New bull run by Oct-Nov That $55K zone is the one nobody wants to sit through. Max fear, liquidations printing red, every account that called the bottom at $85K going quiet. And that's exactly where the next cycle gets built. Not at the bounce everyone celebrated. At the capitulation almost nobody has the stomach for. The crowd will panic-sell the low and then chase it 40% higher a month later. Same mistake, every single cycle. $BTCUSDT #BybitOdds
🚨 $XAU ALERT: Spot gold may test resistance zone $4,156-$4,167 🟢 Bullish: 50% • A strong bounce around the $4,062 level is described as suggesting completion of the three-wave cycle from $4,225. • A break above the $4,156-$4,167 resistance zone may lead to a gain toward $4,185. • Gold has climbed back into a daily neutral range of $4,122-$4,233. 🔴 Bearish: 50% • Immediate support is at $4,123, and a break below it may trigger a fall into the $4,091-$4,109 range. • The daily move is described as confusing and offering little clue about the next direction. $XAUTUSDT #ByXIMPACT

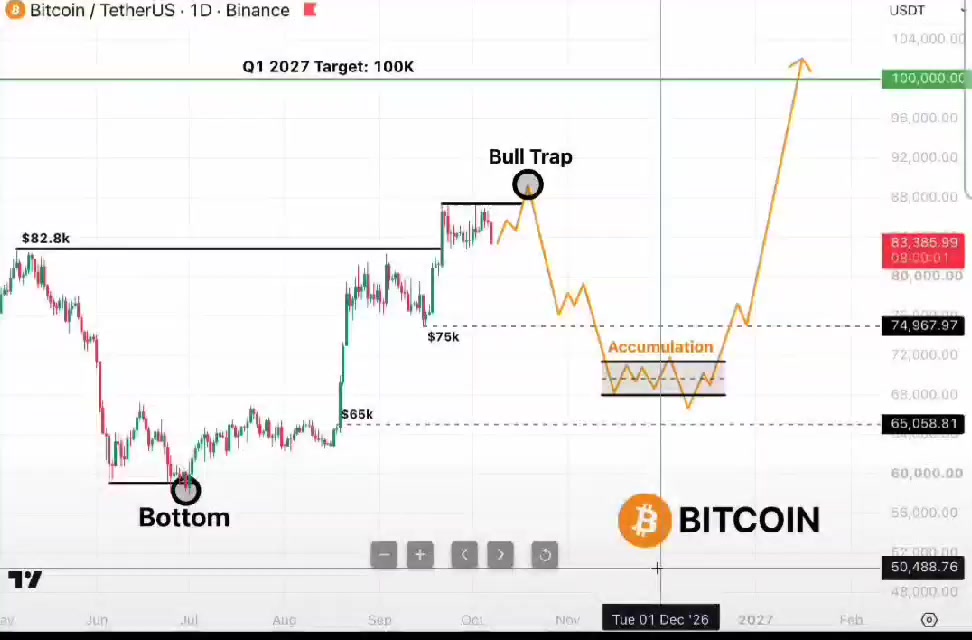
🚨 $BTC IS SETTING A FINAL TRAP BEFORE DUMP 15+ days of ranging between $82K-$87K, building liquidity on both sides... Lower pools got swept today, next target is a pump to $88K+ Here's my plan that nobody wants to believe: $83K → $88K-$90K → $70K → $68K → $100K -> $88K-$90K - euphoria returns -> $68K - mass panic / feeling that Bull Run never started -> $100K - first target of the real Bull Run $BTCUSDT #ByXIMPACT
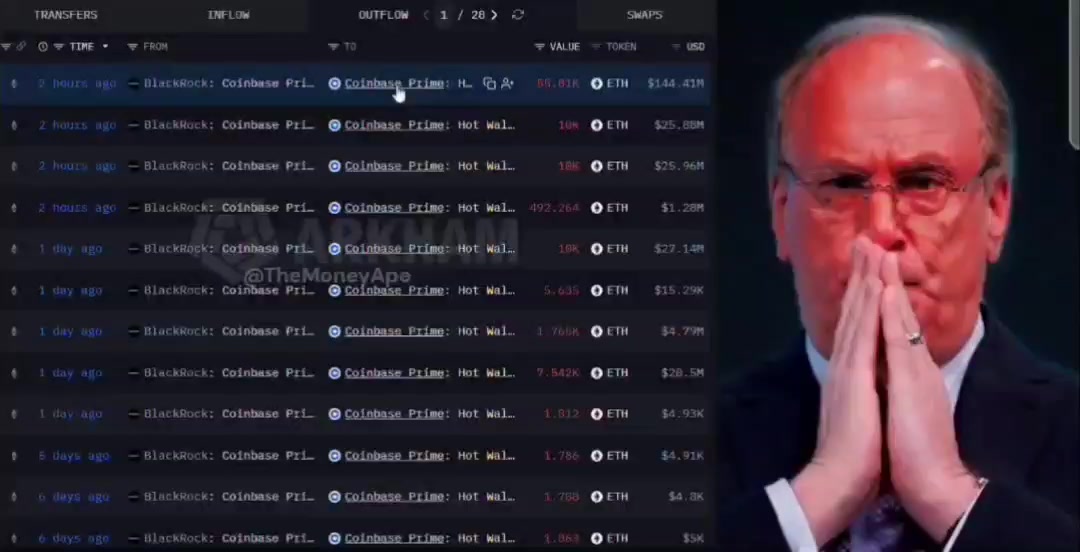
🚨 BREAKING NEWS: BLACKROCK IS SELLING $ETHUSDT 🇺🇸 BlackRock would have sold 76,302 $ETH, valued at approximately 197.5 MILLION DOLLARS. And most worryingly: THE SALE DOES NOT SEEM TO BE OVER. Then, BitMine reduced its pace of accumulation. And now, BLACKROCK STARTS TO DUMP ETH. Too many distribution signals at the same time. 👀 WHAT IS REALLY HAPPENING BEHIND THIS MOVEMENT? If the whales start selling while the market is already under pressure… $BTCUSDT #USNonfarmPayrolls #BybitOdds
🚨🚨 METEORA JUST MADE ITS MOVE! 🟣🔥 While the WHOLE world watches the war between Pumpfun and StonkFun… Meteora just launched DLMM Pro. 👀 And $MET is reacting strongly: 📈 +30% in 24h 🔥 +35% in 7 days 💰 ~$130M volume in 24h 🟣 ~$242M market cap 💵 Price → ~$0.43 WHAT IS DLMM PRO? → Teams create their own launch markets → Define fees and start operating from launch → High fees at first and decreasing with maturation → A single pool from day 1, NO MIGRATIONS 💥 The launchpad war on Solana just opened a THIRD FRONT. ⚠️ And WATCH OUT: $MET unlock arrives on October 23. 👀 IS THE DEFINITIVE BATTLE FOR SOLANA'S LAUNCHPADS COMING? $METUSDT $SOLUSDT #ByXIMPACT

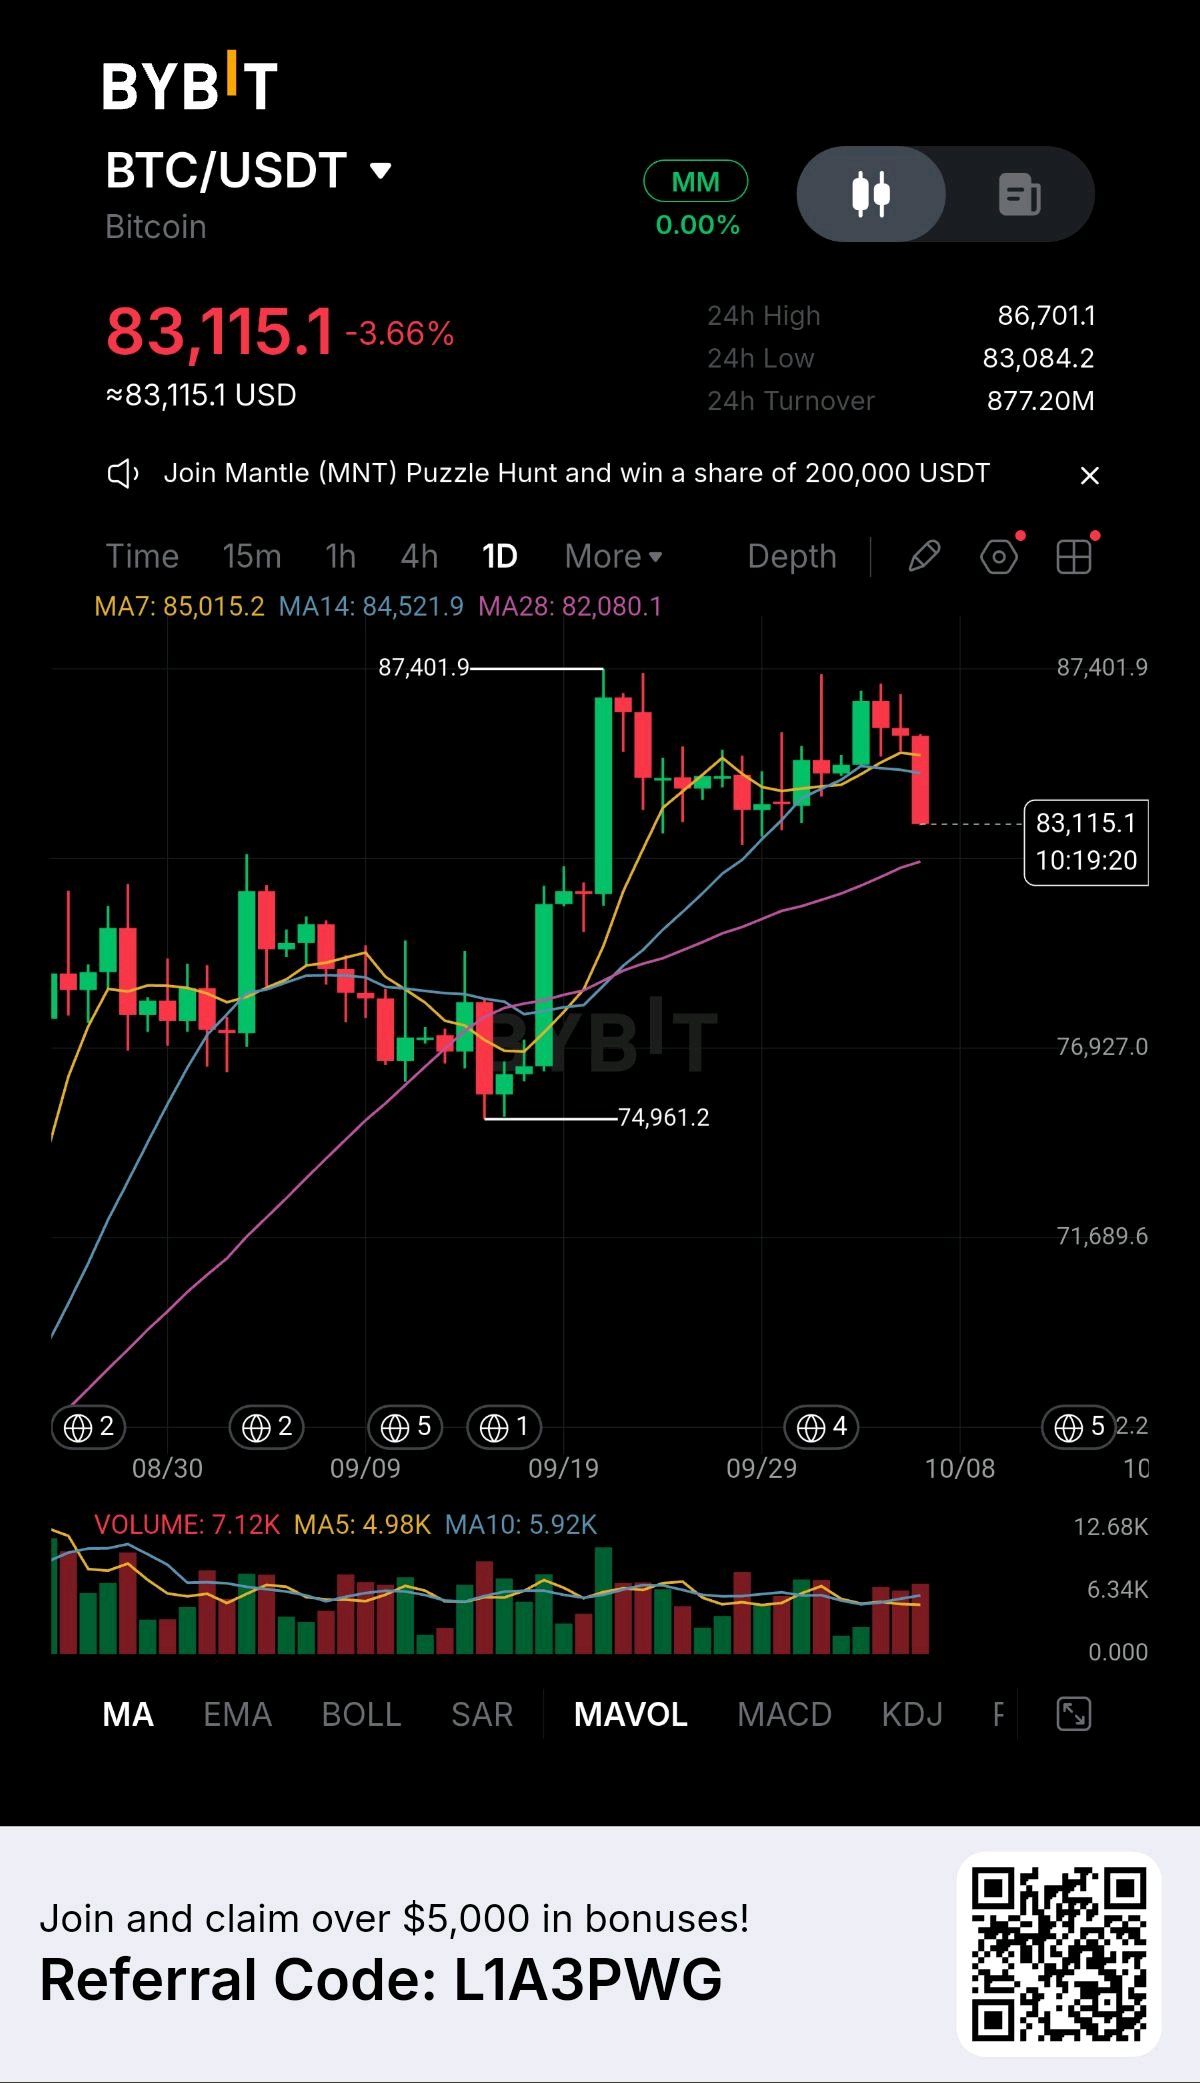
🚨 $BTC BREAKS LOWER — BEARS TEST KEY DAILY SUPPORT $BTC is trading around $83,115 (-3.66%), with a strong bearish daily candle pushing price below the MA7 ($85,015) and MA14 ($84,522). BTC is now testing the MA28 near $82,080, making this a critical zone. 📊 Key Levels • Resistance: $84,500–$85,000 • Major resistance: $86,700–$87,400 • Support: $82,000–$82,100 • Major support: $76,900–$77,000 📉 Bearish Scenario: A confirmed daily close below $82,000 could open the way toward $77,000. 📈 Bullish Scenario: Reclaiming $84,500–$85,000 would reduce the immediate bearish pressure and put $86,700+ back in focus. Market Takeaway: Short-term bias is bearish while BTC remains below $85K. The key battle now is whether buyers can defend the $82K area. $BTCUSDT #ByXIMPACT

🚨 $ETH UNDER PRESSURE — BEARS TEST KEY SUPPORT $ETH is trading around $2,617 (-2.70%) after failing to hold the recent consolidation zone near $2,700. The daily candle has turned sharply bearish, with price now sitting around the MA28 at $2,623, making this a critical area. 📊 Key Levels • Resistance: $2,680–$2,725 • Support: $2,620 • Major support: $2,575–$2,580 • Deeper support: $2,405 📉 Bearish Scenario: A confirmed daily break below $2,620 could expose $2,580, with further downside toward $2,405 if selling accelerates. 📈 Bullish Scenario: Reclaiming $2,680–$2,725 would weaken the bearish setup and could bring $2,800+ back into focus. Market Takeaway: Short-term bias is bearish below $2,680. Watch the $2,620 support closely—losing it could trigger another leg lower. Do you see $ETH holding $2,620, or are we heading toward $2,580? $ETHUSDT #ByXIMPACT
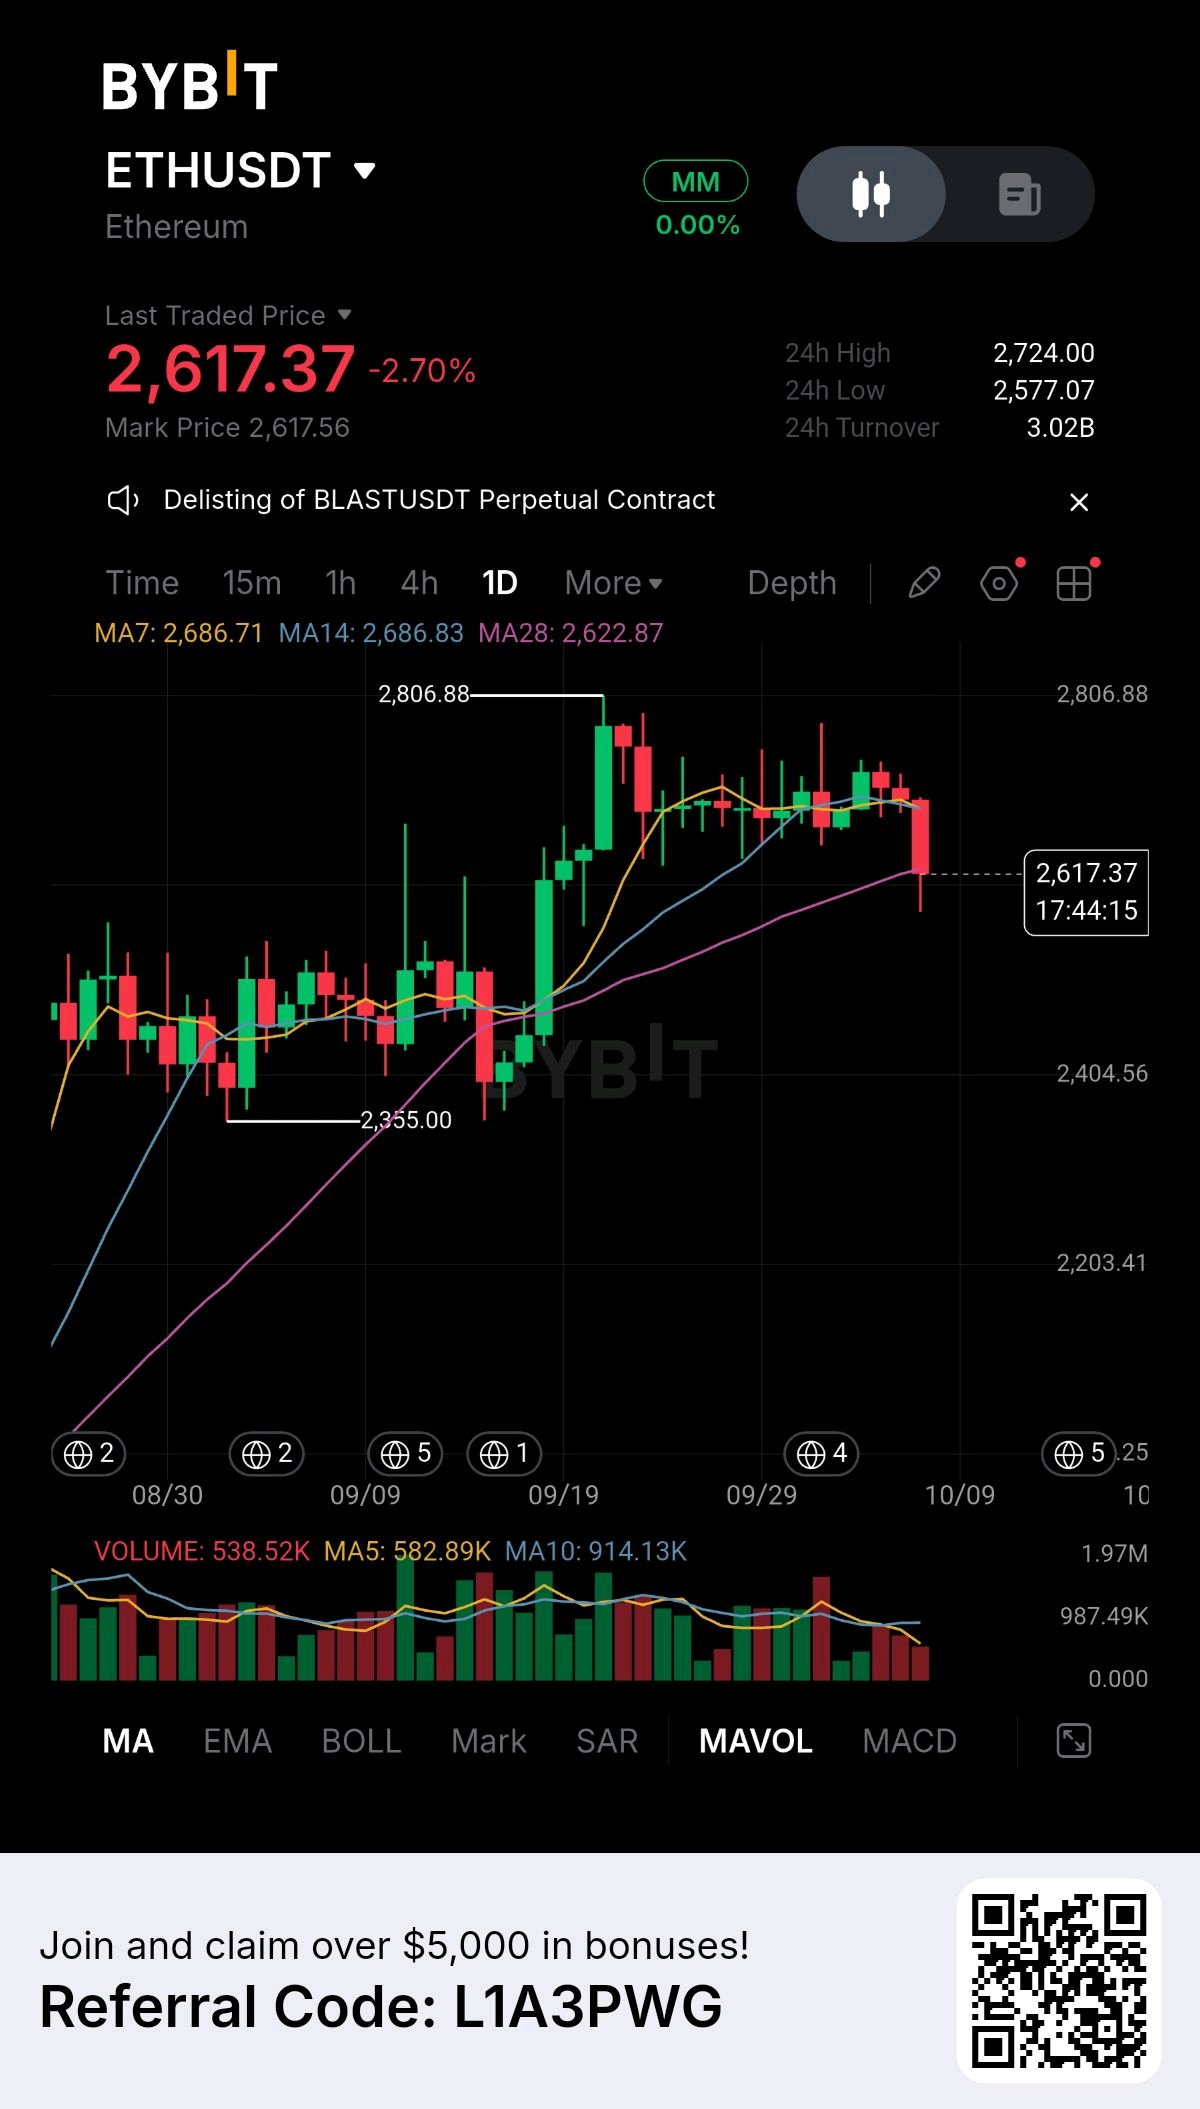

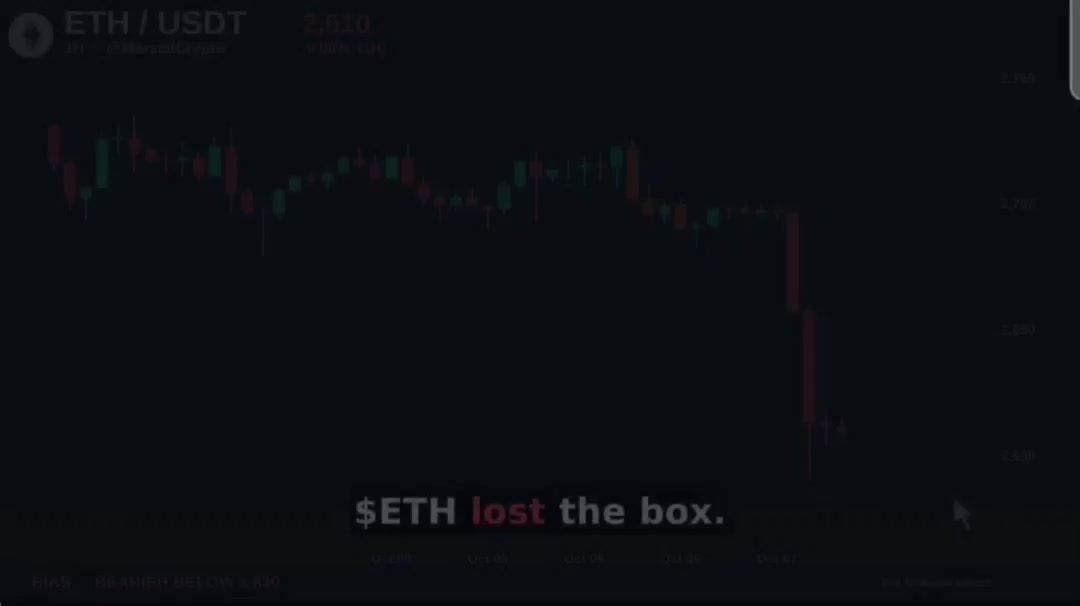
$ETHUSDT lost the box. Two weeks of every dip into $2,630 getting bought, then one hourly candle at 3am UK dumped it to $2,590 on nearly 10x normal volume. As long as $2,630 caps it I think $2,590 breaks and $2,564 liquidity gets tested next. Reclaim it and $2,683 is back in play. Not financial advice #ISMManufacturingPMI