MuzammilWeb3
7793Like0Shares97Fans21Follow
🚀 Crypto Signals for Byx Traders | Trade Smart, Profit Smart 💰
🚀 Crypto Signals for Byx Traders | Trade Smart, Profit Smart 💰
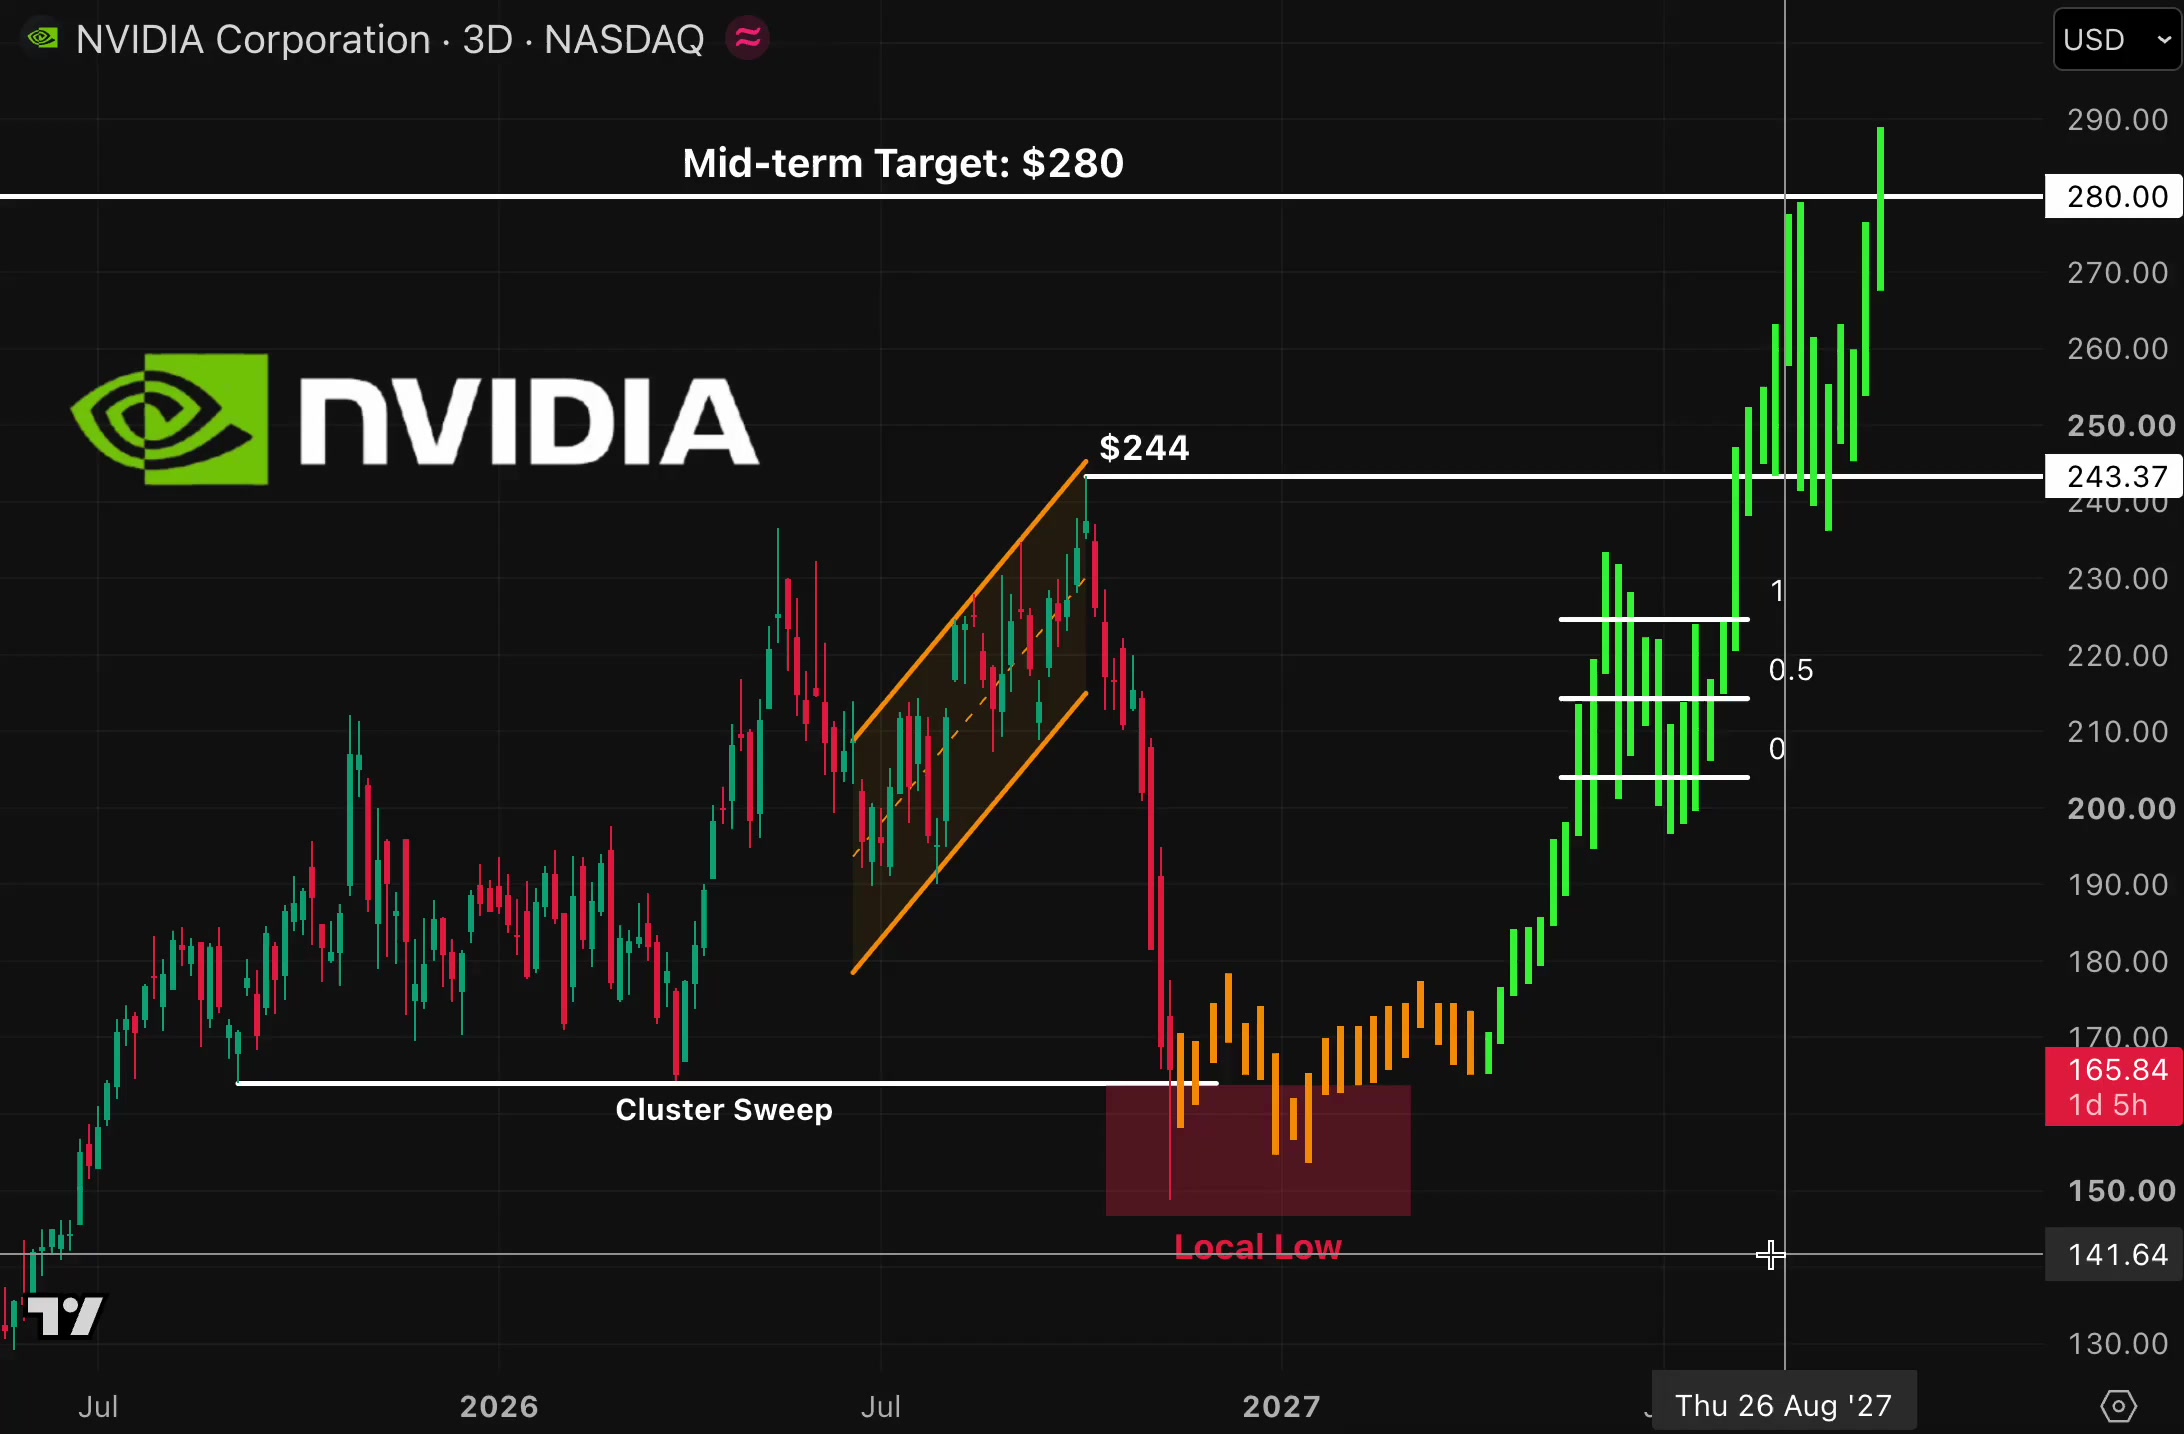
NVDA has gone from a hard slide to a quiet base, and a quiet base is the kind of chart where I'd rather buy a small dip than chase the high. The chart attached is only background on the bigger picture. The trade below stands on today's Bybit 1h and 15m charts alone. $NVDAXUSDT is at 161.55 (+1.12%), inside a 24h range of 156.15 to 161.74 That puts it 97% of the way up the range, 3.5% above the low and 0.1% under the high. Turnover is 54.23M. The levels I'm watching: Up: 161.74 (24h high) -> 163.99 (chart gridline, an area) -> 171.84 (1h chart high) Down: 160.89 (1h MA7) -> 160.80 (1h MA14) -> 160.70 (15m MA14) -> 160.35 (1h MA28) On the 1h, price is over MA7 (160.89), MA14 (160.80) and MA28 (160.35), by 0.4%, 0.5% and 0.7% The three have flattened and bunched after the slide from 171.84, so I read 160.35 to 160.90 as one support zone, and price is only now stepping away from it. On the 15m, price is over MA7 (160.85), MA14 (160.70) and MA28 (160.84), by 0.4%, 0.5% and 0.4% All three are tightly stacked and turning up, and the last candles are a clean run of green into the 24h high. I don't want to buy the top of that run, I want it to come back to the stack. I'm watching volume. The 15m bar is 2.79K against MA5 2.66K and MA10 2.38K with 06:42 left, so the push is above both averages but still forming. The 1h bar is 12.87K against 8.80K and 8.64K with 06:37 left, also above both. Participation is picking up on the way up, which is what I want from a base, but it is still small next to the flush earlier in the week. The trade, buying the dip into the stack: - Entry: 160.60 to 161.00 (limit, needs a 0.3% to 0.6% dip) - Stop: below 159.90 - Target 1: 162.30 (~1.7R from 160.80) - Target 2: 163.60 (~3.1R) Invalid if the 15m closes below 159.90, because that loses the 1h MA28 and the whole stack together. My thinking is to stay small, since this is a TradFi perp with thin liquidity and price is already at the 24h high. Limit orders, small size, and no dip, no trade. #IMPACTbyTrade
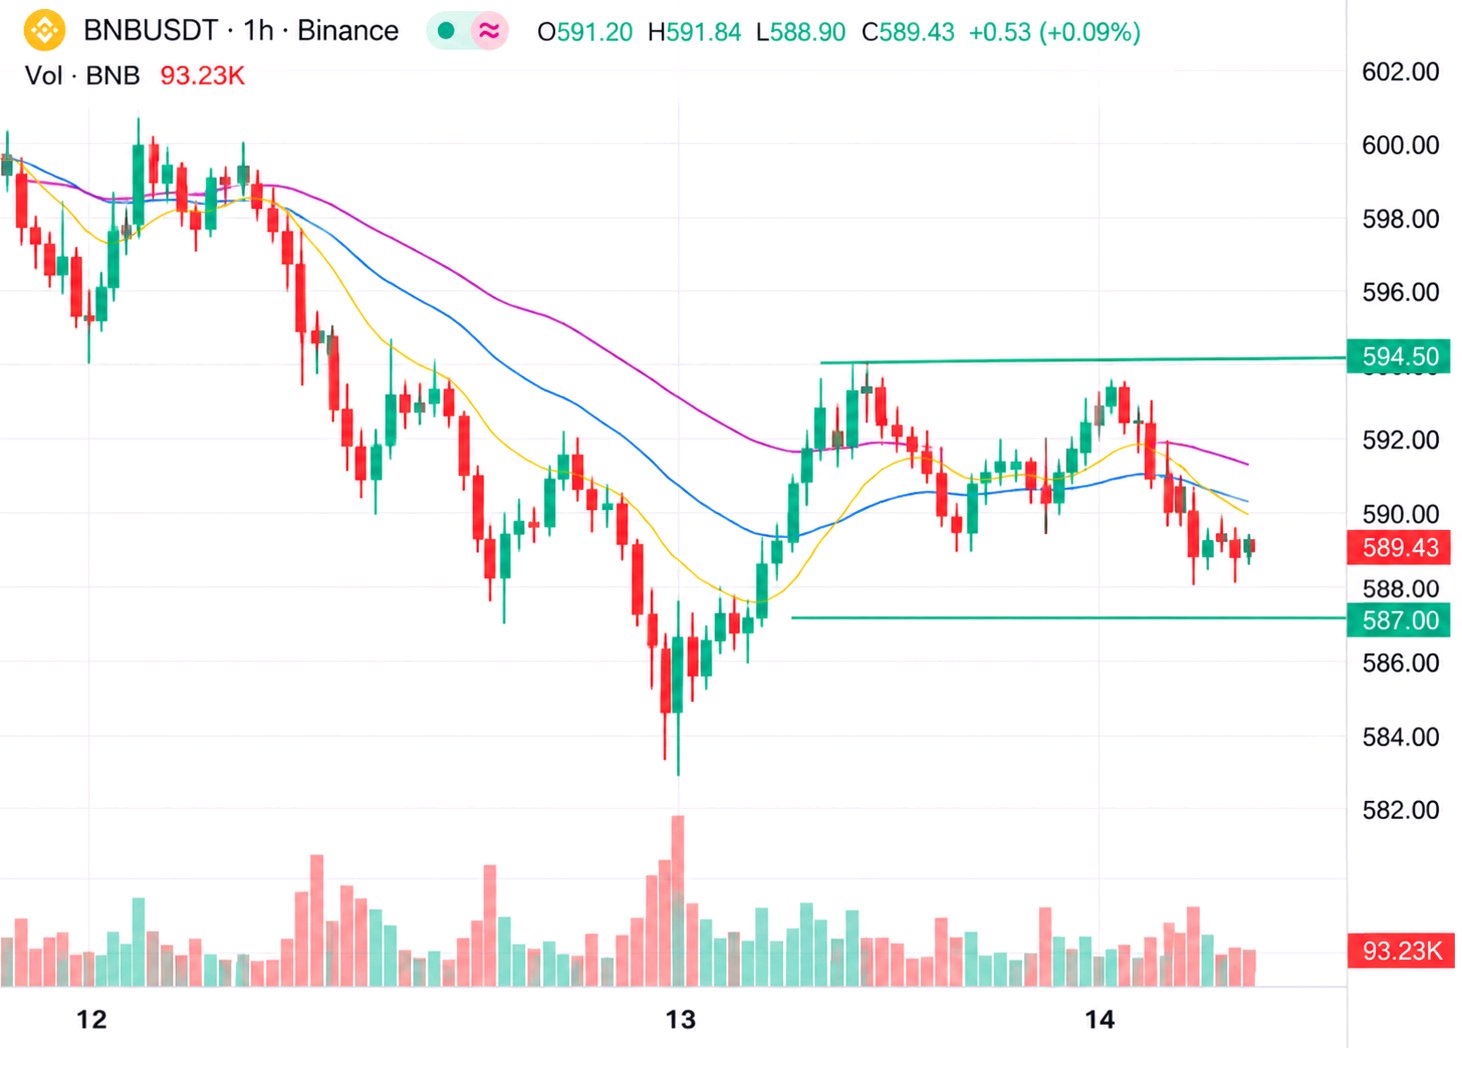
BNB gave back its whole afternoon in a couple of candles and is now sitting right on the hourly line it just lost. I'd rather sell the first push back up than the dip itself. $BNBUSDT is at 589.43 (+0.09%), inside a 24h range of 565.52 to 599.47. That puts it 70% of the way up the range, 4.2% above the low and 1.7% under the high. Turnover is 57.15M. What I'm marking: Up: 592.55 (15m MA14) -> 592.97 (1h MA14) -> 593.76 (1h MA7) -> 594.83 (15m MA28) -> 599.47 (24h high) Down: 589.89 (1h MA28) -> 585.70 (recent swing low, my read) -> 582.49 (chart gridline, an area) On the 1h, price is under MA7 (593.76), MA14 (592.97) and MA28 (589.89), by 0.7%, 0.6% and 0.1%. The three have flattened and bunched after the long slide from 658, and price has just slipped back under all of them, so I read 592.5 to 594.8 as one ceiling, not four lines. On the 15m, price is level with MA7 (589.47) and under MA14 (592.55) and MA28 (594.83), by 0.5% and 0.9%. Both of those are sloping down, and the last candles are small red ones with no real push back up. I'm watching volume. The 15m bar is 92.630 against MA5 217.778 and MA10 434.612 with 02:19 left, so it is still forming and I won't judge it. The 1h bar is 93.230 against 1.16K and 2.19K with 47:13 left, barely opened. The biggest bars came on the morning bounce, and the last few hours have been very quiet, which is why I'm waiting for the lift and not chasing the drop. The trade, selling the retest of the 1h averages: - Entry: 592.50 to 594.50 (limit, needs a 0.5% to 0.9% bounce) - Stop: above 596.50 - Target 1: 587.00 (~2.2R from 593.50) - Target 2: 583.00 (~3.5R) Invalid if the 15m closes above 596.50. That would take back the whole hourly cluster and the 15m MA28 together, and I'd step aside. My thinking is to keep it small, since the day is flat and the range is tight. Limit orders, modest size, and no lift, no trade. #IMPACTbyTrade

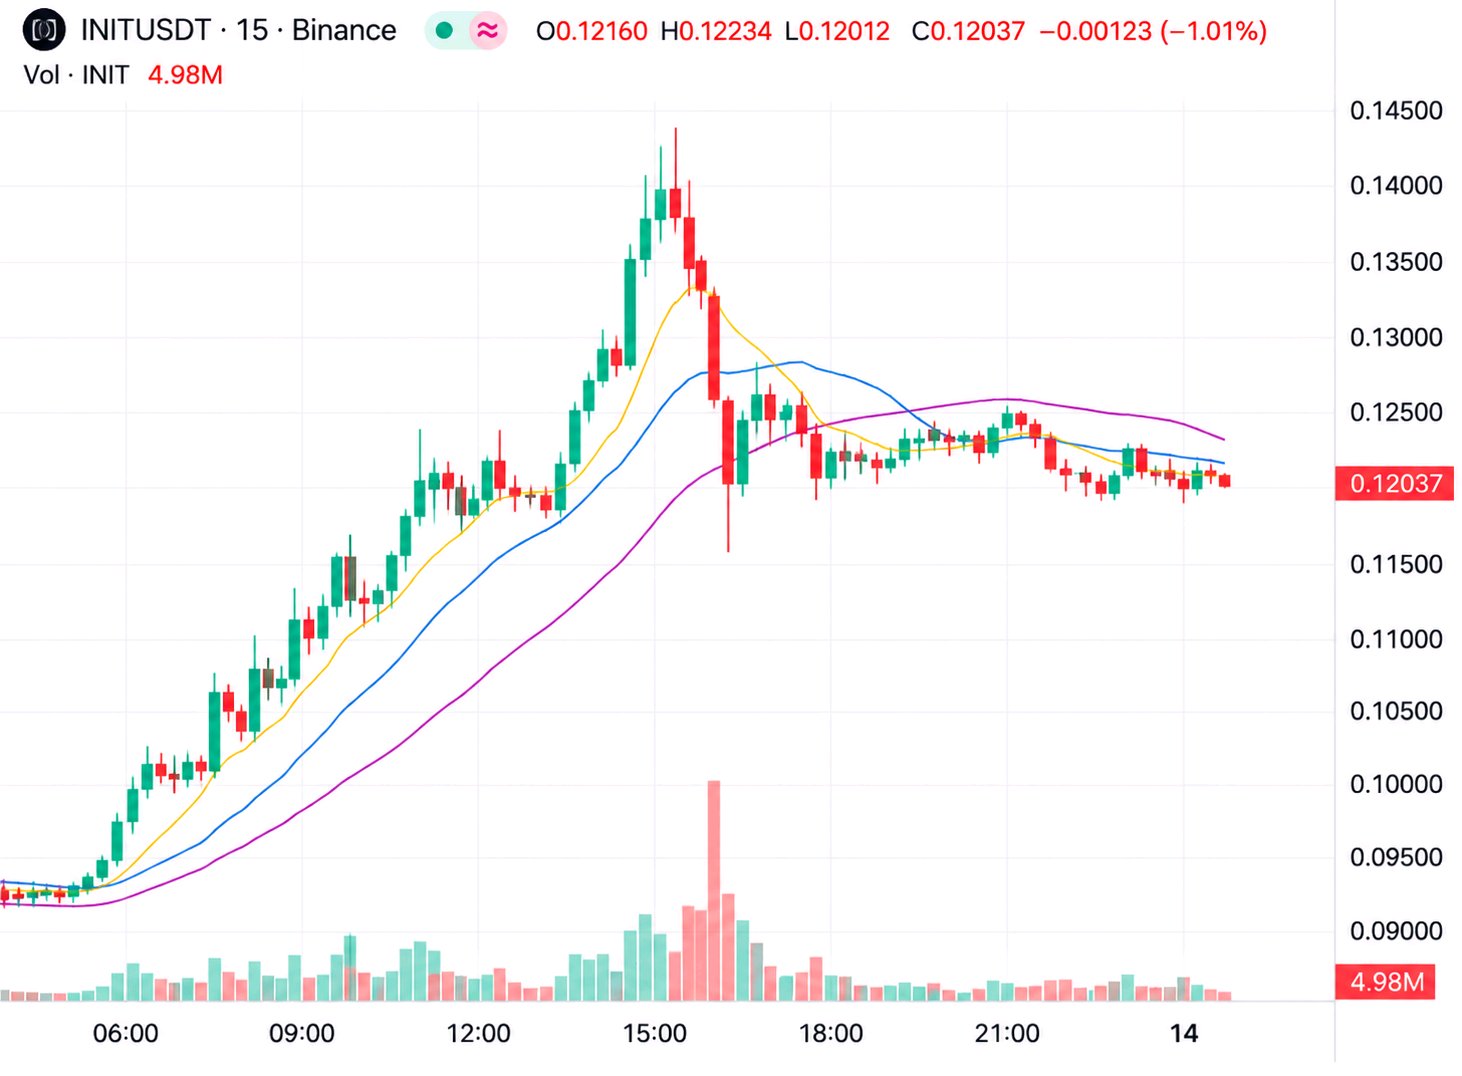
INIT is still up 23% on the day, but the tallest volume bar of the whole run is the red one that came off the top, and price has already slipped under its fast averages. I'm not buying that dip. I want to see if the bounce can even climb back to them. $INITUSDT is at 0.12037 (+23.19%), inside a 24h range of 0.09279 to 0.14280. That puts it 55% of the way up the range, 29.7% above the low and 15.7% under the high. Turnover is 57.63M. The map I'm using: Up: 0.12415 (15m MA7) -> 0.12443 (15m MA28) -> 0.12517 (1h MA7) -> 0.1265 (top of the small shelf after the crash, an area) -> 0.12928 (15m MA14) -> 0.14280 (24h high) Down: 0.1178 (wick low from the flush) -> 0.11353 (1h MA14) -> 0.10626 (1h MA28) -> 0.09279 (24h low) On the 1h, price is 4.0% under MA7 (0.12517) but still over MA14 (0.11353) and MA28 (0.10626), by 5.7% and 11.7% Both of those are still climbing underneath from the run, so the higher timeframe has not broken yet. That is why I only want the retest, not the chase down. On the 15m, MA7 (0.12415), MA28 (0.12443) and MA14 (0.12928) all sit above price, by 3.1%, 3.4% and 7.4% The fast lines have rolled over, and the last candles are small and stacked on top of each other under 0.1242, which looks like a pause after a loss, not buyers taking over. I'm watching volume too. The 17:00 bar is the tallest on the chart, around 24M by my read of the axis. The 15m bar now is 4.98M against MA5 6.33M and MA10 10.14M with 02:36 left, so it is almost done. The 1h bar is 17.04M against 40.15M and 34.82M with 17:33 left, a quiet hour. The flush was loud and everything since has been a lot lighter. The trade, selling the retest of the averages: - Entry: 0.1242 to 0.1252 (limit, needs a 3.1% to 4.0% lift and a stall there) - Stop: above 0.1295 - Target 1: 0.1150 (~2.0R from 0.12466) - Target 2: 0.1075 (~3.5R) Invalid if the 15m closes above 0.1295. That would put price over the 15m MA14 and the shelf high together, and I'd step aside. The stop is about 3.9% from the middle of the zone and this coin just moved 23% in a day, so I keep it small. Limit orders only, and if it never climbs back, I let it go. #IMPACTbyTrade

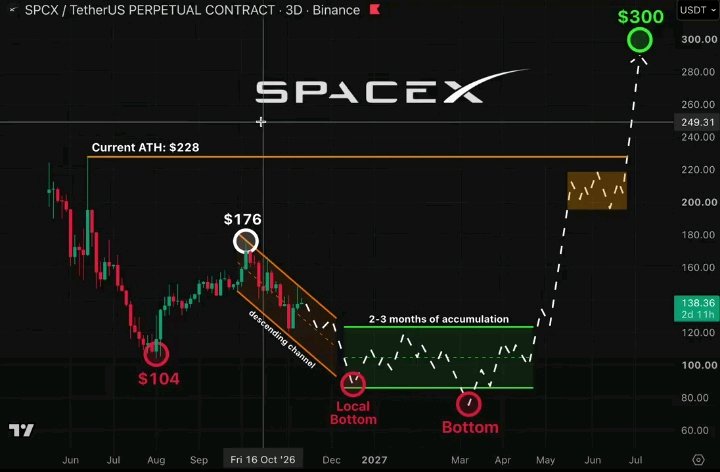
SPCX has climbed almost 4% off the overnight low and now sits right under the high, and I'm not buying that. If I'm in, it's on a dip back into the averages it has been standing on. $SPCXXUSDT is at 138.56 (+1.88%), inside a 24h range of 133.53 to 138.62. That puts it 99% of the way up the range, 3.8% above the low and 0.04% under the high, on 17.54M of turnover. That is not deep for a move this size, so I'm treating it carefully. The map I'm using: Up: 138.62 (24h high) -> 139.80 (an area where it stalled before the drop, not a clean level) -> 143.15 (1h chart high) Down: 138.35 (15m MA7) -> 138.12 (15m MA14) -> 137.84 (1h MA7) -> 137.72 (15m MA28) -> 137.00 (1h MA14) -> 133.53 (24h low) On the 1h, price is over MA7 (137.84), MA14 (137.00) and MA28 (136.16), by 0.5%, 1.1% and 1.7%. All three are rising and the gap between them keeps widening, so this bounce has structure under it. It has also won back about half (52%) of the swing from 143.15 down to 133.53, which is a natural place for it to pause. On the 15m, price is over MA7 (138.35), MA14 (138.12) and MA28 (137.72), by 0.2%, 0.3% and 0.6% The stack is rising in order and the candles are riding the fast line. That is a healthy trend, but it also means nothing here is cheap right now. Volume is the part I'm less sure about. The 15m bar is 553.87 against MA5 588.72 and MA10 888.39 with 07:57 left, so it is still forming and I won't judge it. The 1h bar is 1.66K against 4.06K and 3.91K with 37:53 left, early in the candle. The heaviest bars came on the way down and on the first bounce off the low, and the climb since has been quiet next to them. Price is rising without much behind it, so I want a dip, not a breakout. The trade, buying a pullback into the stack: - Entry: 137.72 to 138.12 (limit, needs a 0.3% to 0.6% dip first) - Stop: below 137.40 - Target 1: 138.55 (~1.2R from 137.92) - Target 2: 139.80 (~3.6R) Invalid if the 15m closes under 137.40. That puts price under the 15m MA28 and the last higher low (about 137.5) together, and I'd step aside. This is a TradFi perp, so liquidity can be thinner than on the crypto majors and fills can slip. I'm keeping the size small and using limit orders only. If it never dips, I don't chase the high. #IMPACTbyTrade

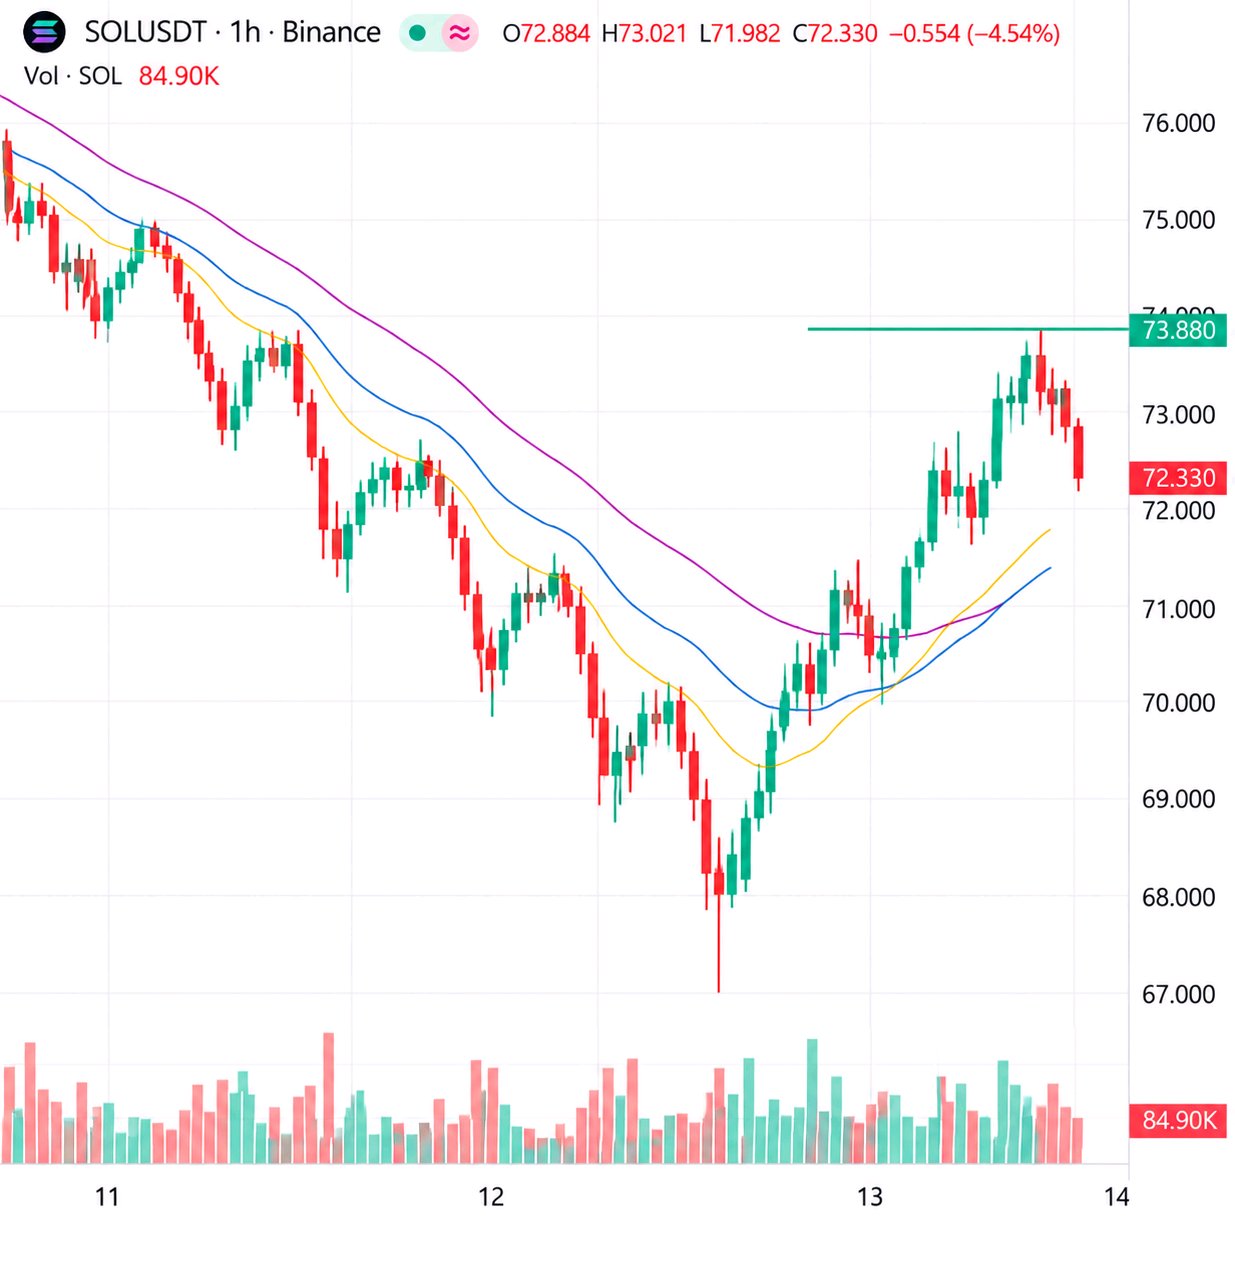
SOL has climbed 7% off the low and walked right up to the one hourly line that has turned it back all week. Before I trust the bounce, I want to see what happens when it touches. $SOLUSDT is at 72.330 (-4.54%), inside a 24h range of 67.320 to 76.020. That puts it 58% of the way up the range, 7.4% above the low and 4.9% under the high. Turnover is 930.11M. The map I'm using: Up: 72.540 (15m chart high) -> 73.880 (chart gridline, an area) -> 76.020 (24h high) Down: 72.034 (15m MA7) -> 71.615 (15m MA14) -> 71.083 (15m MA28) -> 67.320 (24h low) On the 1h, price is over MA7 (71.177) and MA14 (70.583), by 1.6% and 2.5%, but only 0.3% over MA28 (72.132), and that line is still sloping down from the 82 area. Price is sitting on a falling average that has not been tested yet, so I read 72.1 to 72.7 as the first real wall. On the 15m, price is over MA7 (72.034), MA14 (71.615) and MA28 (71.083), by 0.4%, 1.0% and 1.8% The stack is rising, but the last candles are small and overlapping right under 72.540, which looks like hesitation, not momentum. I'm watching volume. The 15m bar is 52.82K against MA5 40.79K and MA10 86.20K with 04:07 left, still forming, so I won't judge it. The 1h bar is 84.90K against 299.35K and 345.31K with 34:03 left, early in the candle. The tall bars on this chart are the red ones on the drop, and the recovery has been far lighter than that. The trade, selling the rejection at the 1h MA28: - Entry: 72.45 to 72.70 (limit, needs a 0.2% to 0.5% lift) - Stop: above 73.00 - Target 1: 71.65 (~2.2R from 72.575) - Target 2: 71.10 (~3.5R) Invalid if the 15m closes above 73.00. That would put price over the 1h MA28 and the 72.54 high together, and I'd step aside. My thinking is to keep it small, since the bounce is real and could still extend. Limit orders, modest size, and no lift, no trade. #IMPACTbyTrade

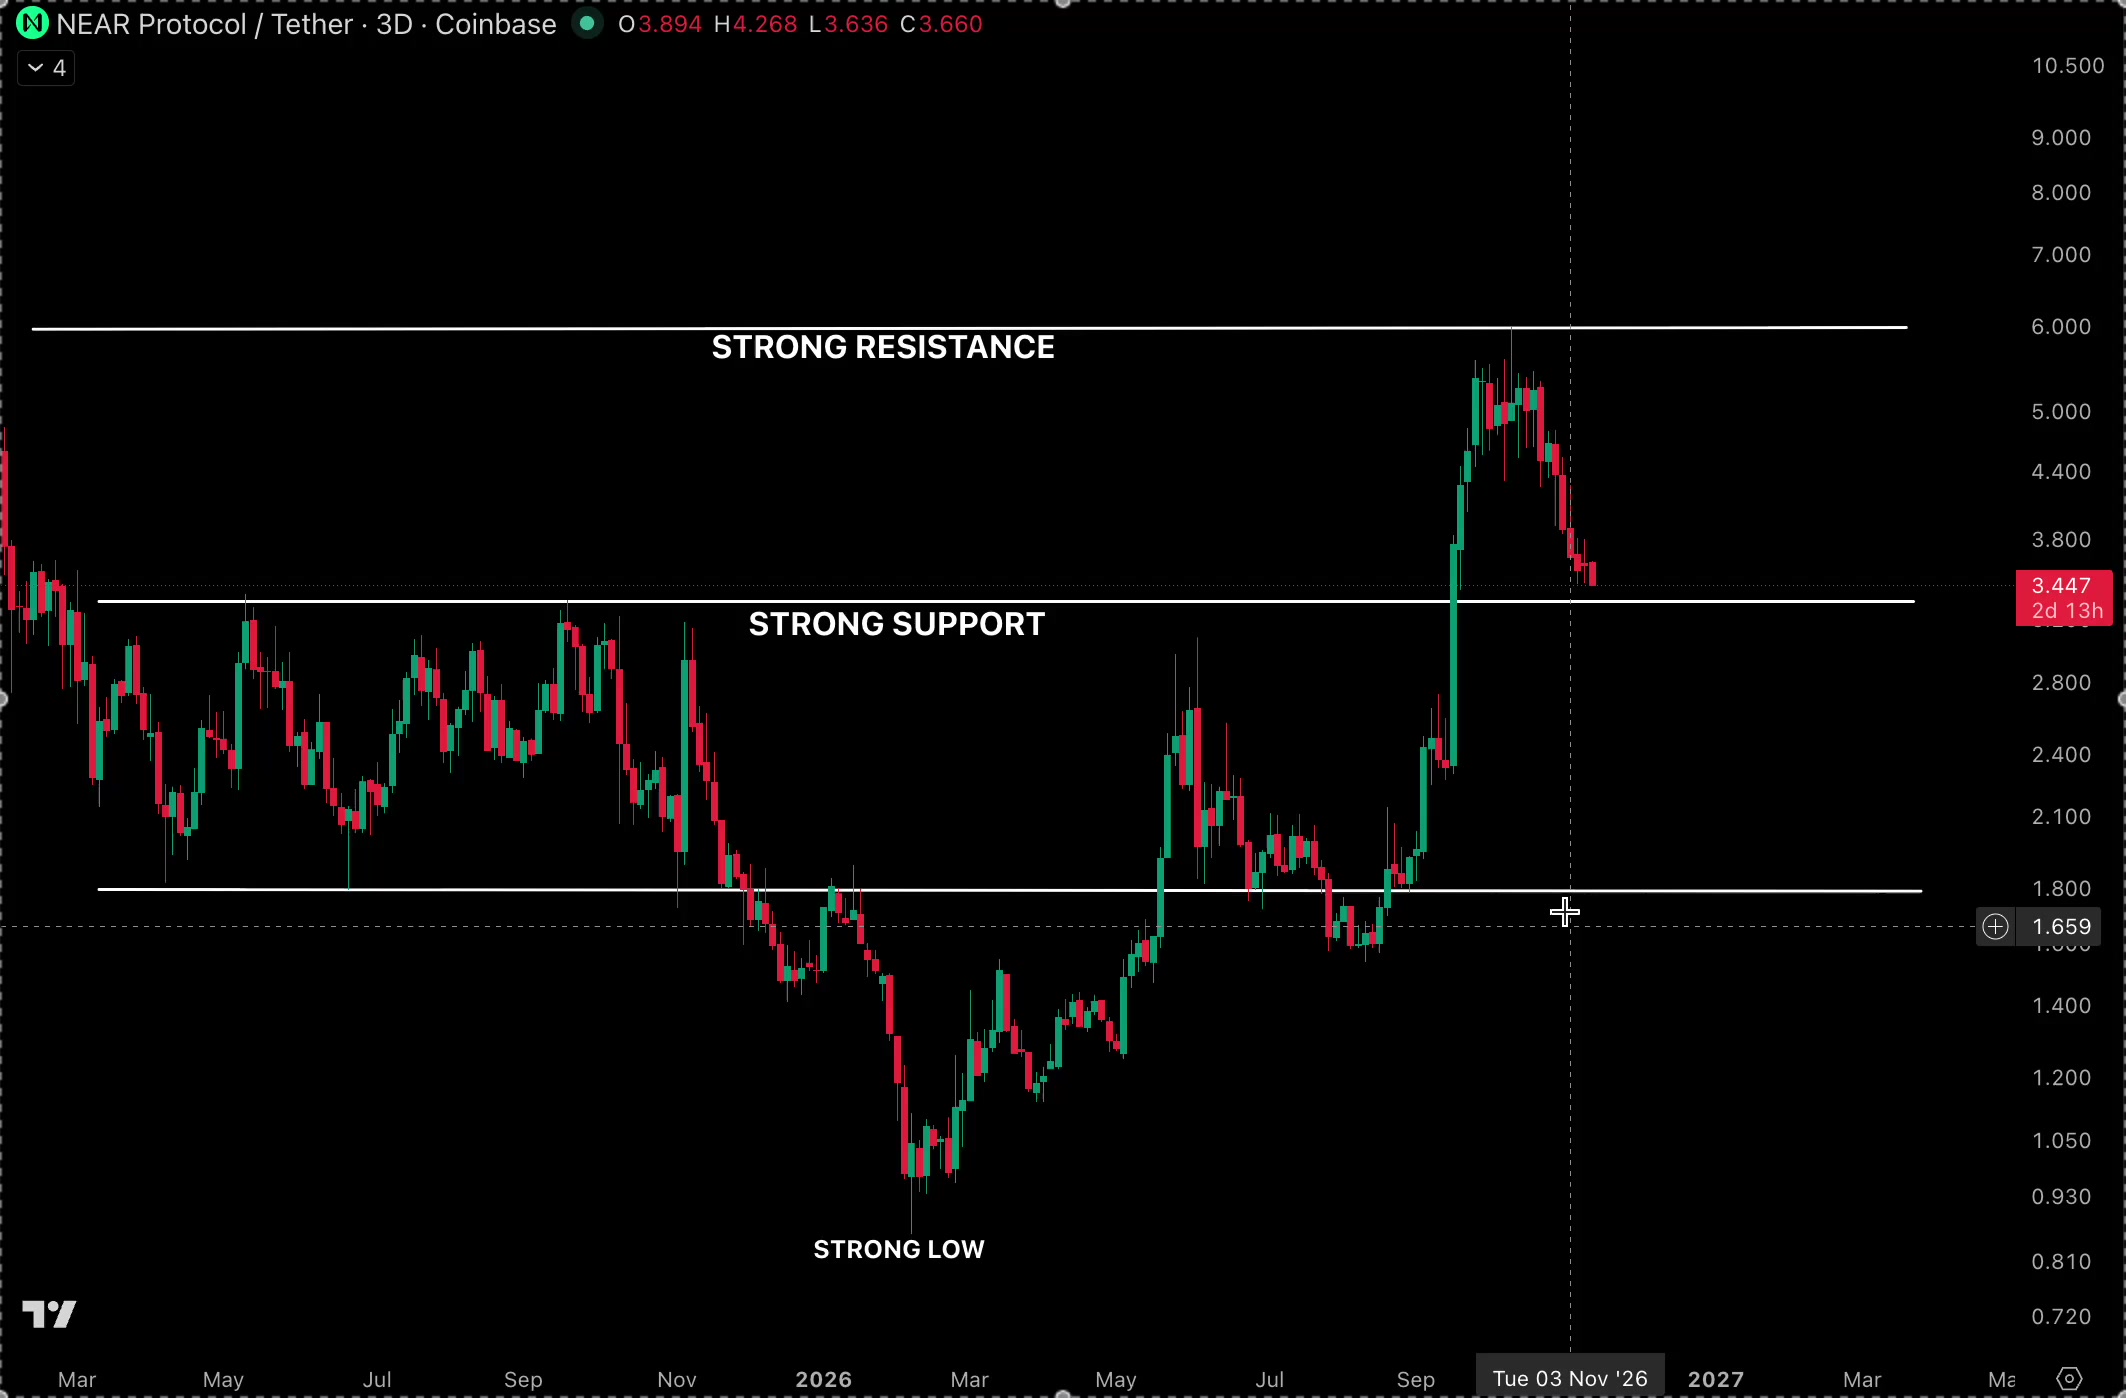
I'm done trying to catch NEAR on the way down. What I like now is that it finally closed above the line that kept pushing it back $NEARUSDT is at 3.1740 (-4.51%), inside a 24h range of 2.8670 to 3.3510. That puts it 63% of the way up the range, 10.7% above the low and 5.3% under the high. Turnover is 218.58M What I'm marking: Up: 3.1970 (15m chart high) -> 3.2394 (chart gridline, an area) -> 3.3510 (24h high) Down: 3.1687 (15m MA7) -> 3.1510 (1h MA28) -> 3.1435 (15m MA14) -> 3.1362 (1h MA7) On the 1h, price is over MA7 (3.1362), MA14 (3.0801) and MA28 (3.1510), by 1.2%, 3.0% and 0.7% MA28 was the line capping every bounce, and price has now closed above it, so I want to see that line act as a floor. On the 15m, price is over MA7 (3.1687), MA14 (3.1435) and MA28 (3.1366), by 0.2%, 1.0% and 1.2% The three are stacked in order and rising, and the candles since noon have been small and overlapping, which reads as a pause, not a fade. I'm watching volume. The 15m bar is 281.99K against MA5 594.75K and MA10 692.69K with 07:05 left, still forming. The 1h bar is 902.84K against 2.15M and 2.25M with 37:01 left, also unfinished. Participation is light on this pause, so I'm keeping the plan patient. The trade, buying the dip into the 1h MA28: - Entry: 3.1400 to 3.1650 (limit, needs a 0.3% to 1.1% dip) - Stop: below 3.1100 - Target 1: 3.2250 (~1.7R from 3.1525) - Target 2: 3.2700 (~2.8R) Invalid if the 15m closes below 3.1100, because that loses the 1h MA28 and the 15m stack together. My thinking is to stay small, since the day is still down 4.5%. Limit orders, modest size, and no dip, no trade. #IMPACTbyTrade
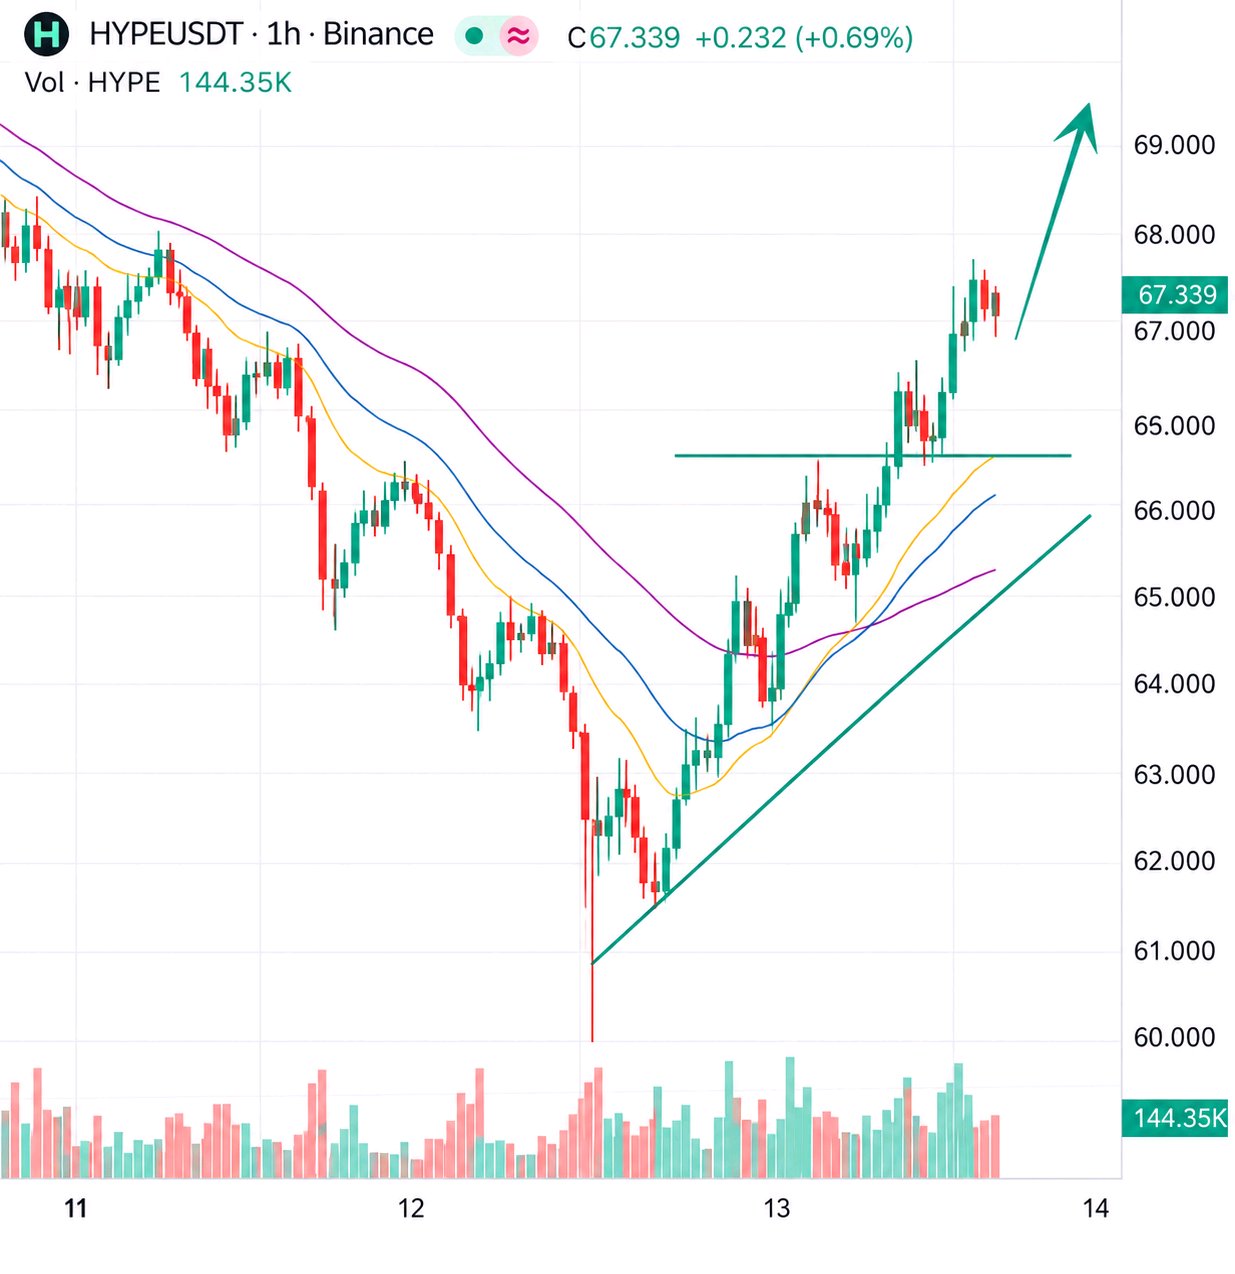
HYPE didn't just bounce, it climbed back over the hourly average that had been capping it, and what price does with that line next is the whole trade for me. $HYPEUSDT is at 67.339 (-2.07%), inside a 24h range of 60.017 to 69.678. That puts it 76% of the way up the range, 12.2% above the low and 3.4% under the high. Turnover is 462.22M. Where I'm looking: Up: 67.593 (15m chart high) -> 69.678 (24h high) Down: 66.250 (1h MA28) -> 65.879 (15m MA7) -> 65.590 (15m MA14) -> 60.017 (24h low) On the 1h, price is over MA7 (65.883), MA14 (64.698) and MA28 (66.250), by 2.2%, 3.9% and 1.6% Price has just closed back over MA28 after a long slide, so I read 66.25 as the line that has to hold as support, and the fast pair sitting under it adds a cushion. On the 15m, price is over MA7 (65.879), MA14 (65.590) and MA28 (65.814) by 2.2%, 2.6% and 2.3% All three have turned up and are tightly stacked, and the last candle is a long green one that went straight away from them. I don't want to buy after a candle like that, I want it to come back. I'm watching volume. The 15m bar is 20.92K against MA5 54.31K and MA10 36.79K with 07:39 left, still forming. The 1h bar is 144.35K against MA5 107.01K and MA10 191.47K with 37:37 left, already over the MA5 before the candle is half done. That is the kind of participation I want to see from a reclaim. The trade, buying the retest of the 1h MA28: - Entry: 66.10 to 66.55 (limit, needs a 1.2% to 1.8% dip) - Stop: below 65.55 - Target 1: 67.55 (~1.6R from 66.33) - Target 2: 68.40 (~2.7R) Invalid if the 15m closes below 65.55. That would put price back under the 1h MA28 and the 15m stack together, and I'd leave it alone. My plan is to keep it small, since the bounce is already 12% off the low. Limit orders, small size, and no dip, no trade. #IMPACTbyTrade

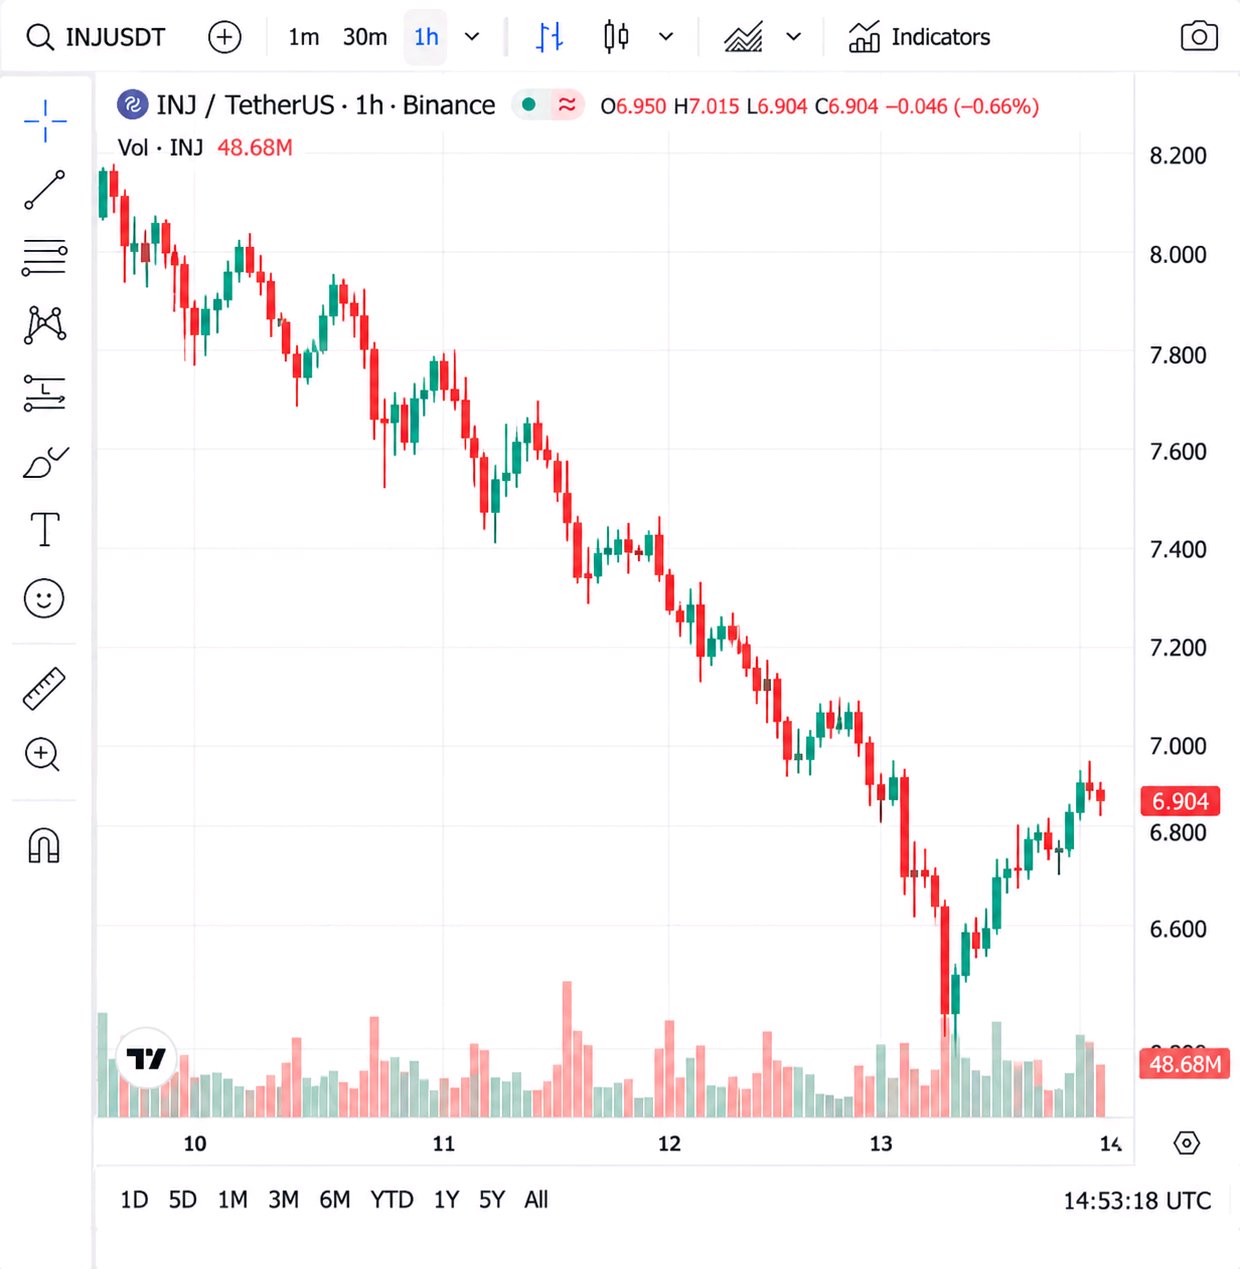
INJ's bounce only got back about 38% of the 24h range before it started losing its averages, and I don't trust it. $INJUSDT is -13.76% at 6.9040, 5.3% above the 6.5540 low, with the 8.0540 high 16.7% overhead. That puts it about 23% of the way up the 24h range, on 48.68M of turnover. The low printed around 6:45 AM, the bounce topped near 7.12 around 10:15, and since then it has been sliding out of a 6.95 to 7.10 shelf until it now sits under all three 15m averages. Volume says the bounce was thin. The 15m candle shows 15.33K against 19.24K (MA5) and 25.22K (MA10), about 0.8x and 0.6x, with the bar nearly closed. The 1h bar shows 15.36K against 107.30K and 173.81K, but that hour only just opened, so I'm not reading anything into that one. The heavy volume came on the way down, and the bounce never got close to it. The averages: 1h MA14 6.9041 (0.0%, price is sitting right on it) 15m MA28 6.9370 (+0.5%) 1h MA7 6.9551 (+0.7%) 15m MA7 6.9767 (+1.1%) 15m MA14 7.0040 (+1.5%) 1h MA28 7.3284 (+6.1%) Four of those six land inside 6.937 to 7.004, a 1% band, and that band is the zone I care about. Up: 6.937 / 6.955 / 6.977 / 7.004 -> 7.12 (bounce high) -> 7.328 (1h MA28) -> 8.054 (24h high) Down: 6.904 (1h MA14, where it sits now) -> 6.554 (24h low) What I'd do is sell a retest, nothing else: Entry 6.937 to 7.004, after price climbs back into it and stalls. That takes a 0.5% to 1.5% bounce first. Stop above 7.13, over the 7.12 bounce high. Target 1: 6.60, just above the 6.554 low (about 2.3R) Target 2: 6.45 if the low gives way (about 3.3R). No level is visible under 6.554, so that one is a measured move. If the 1h candle closes under 6.9041 and keeps sliding without ever retesting, I'm not chasing it. If a 15m candle closes above 7.13, the bounce was real and I step aside. R is counted from the middle of the zone (6.9705) with a stop about 2.3% away. That is a wide stop, so I'd size smaller than usual. A -13% day makes everybody a dip buyer. I'd rather wait and see who is still holding at 7.00 #IMPACTbyTrade

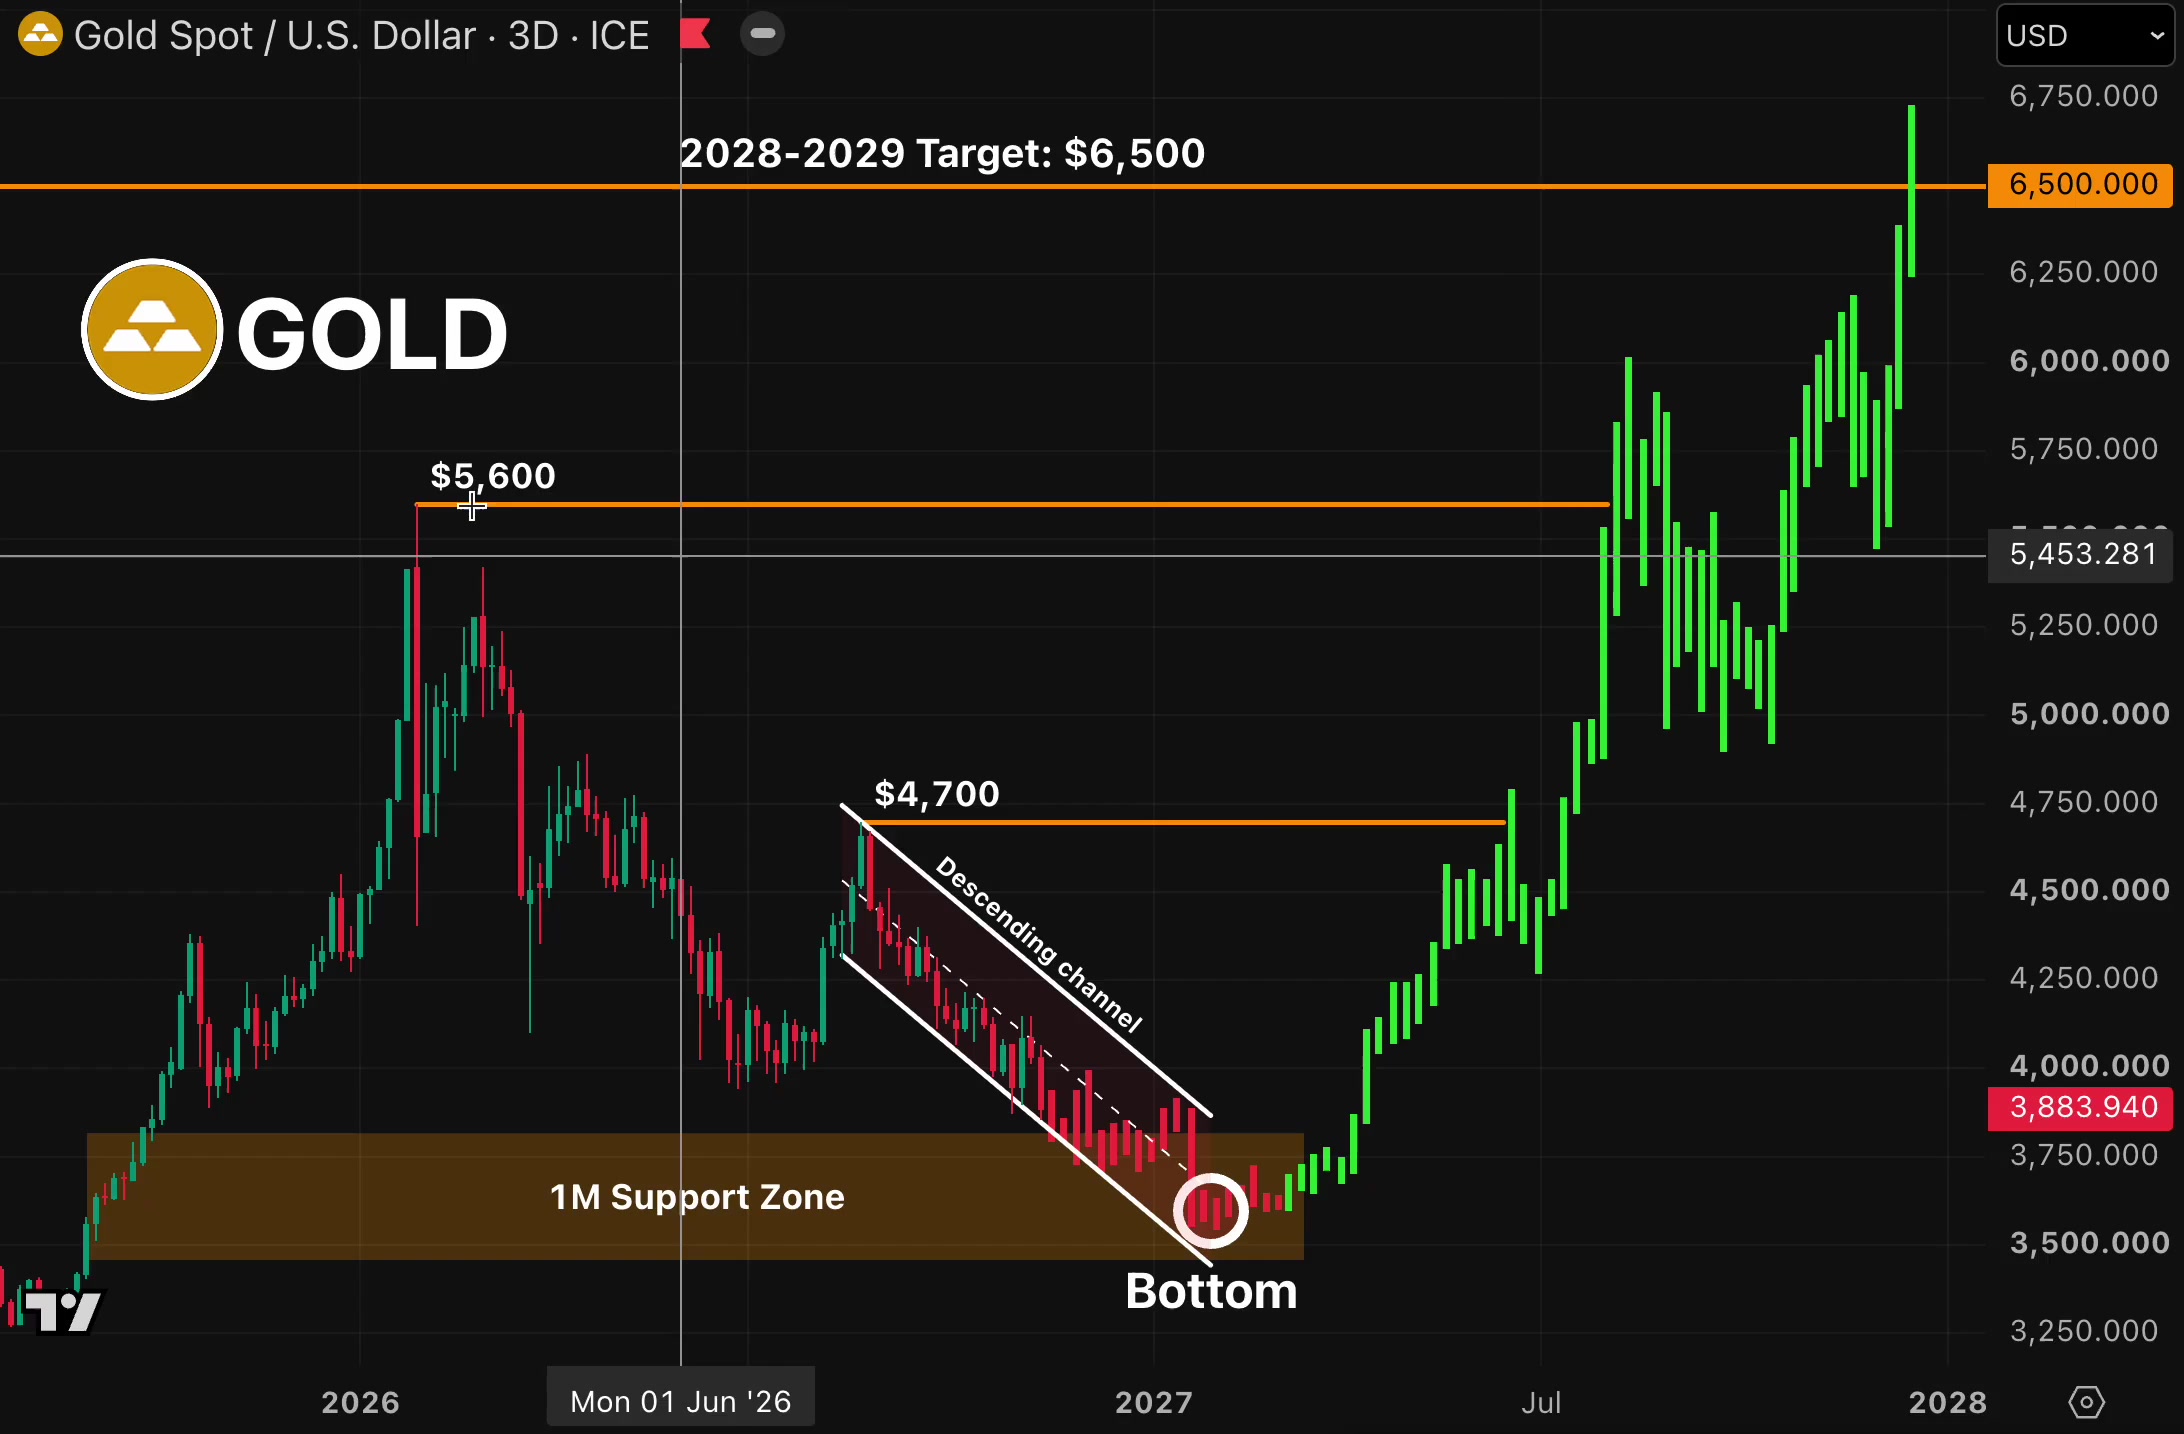
Gold is sitting on top of every average I can see, and when price has no side, I'd rather pick a spot than guess a direction $XAUTUSDT is at 3,835.26 (-1.27%), inside a 24h range of 3,777.66 to 3,888.21. That puts it 52% of the way up the range, 1.5% above the low and 1.4% under the high. Turnover is 139.29M. What I'm marking: Up: 3,853.10 (1h MA28) -> 3,857.55 (chart gridline, an area) -> 3,881.30 (15m chart high) Down: 3,829.59 (1h MA14) -> 3,800 (my estimate) -> 3,777.66 (24h low) On the 1h, price is level with MA7 (3,835.61), 0.1% over MA14 (3,829.59) and 0.5% under MA28 (3,853.10). MA28 is the one still sloping down from the 3,957 area, so the first test above price is a falling line. On the 15m, MA7 (3,834.07), MA14 (3,837.19) and MA28 (3,833.70) are all within 0.1% of price. Nothing there is a trend, so I won't trade the middle of it, I'd rather wait for the lift into the hourly line. I'm watching volume. The 15m bar is 35.812 against MA5 78.281 and MA10 99.338 with 06:34 left, and the 1h bar is 35.812 against 492.822 and 1.17K with 51:30 left, so both candles are just getting started and I won't judge them. The tallest bars on both panels are the red ones from the flush to 3,777.66, and the recovery since has been quiet. The trade, selling the retest of the 1h MA28: - Entry: 3,848 to 3,858 (limit, needs a 0.3% to 0.6% lift) - Stop: above 3,870 - Target 1: 3,826 (~1.6R from 3,853) - Target 2: 3,800 (~3.1R) Invalid if the 15m closes above 3,870. My thinking is that a close over the 1h MA28 would mean the flush is being absorbed, and I'd step aside. Limit orders, small size because gold can gap, and no lift, no trade. #IMPACTbyTrade
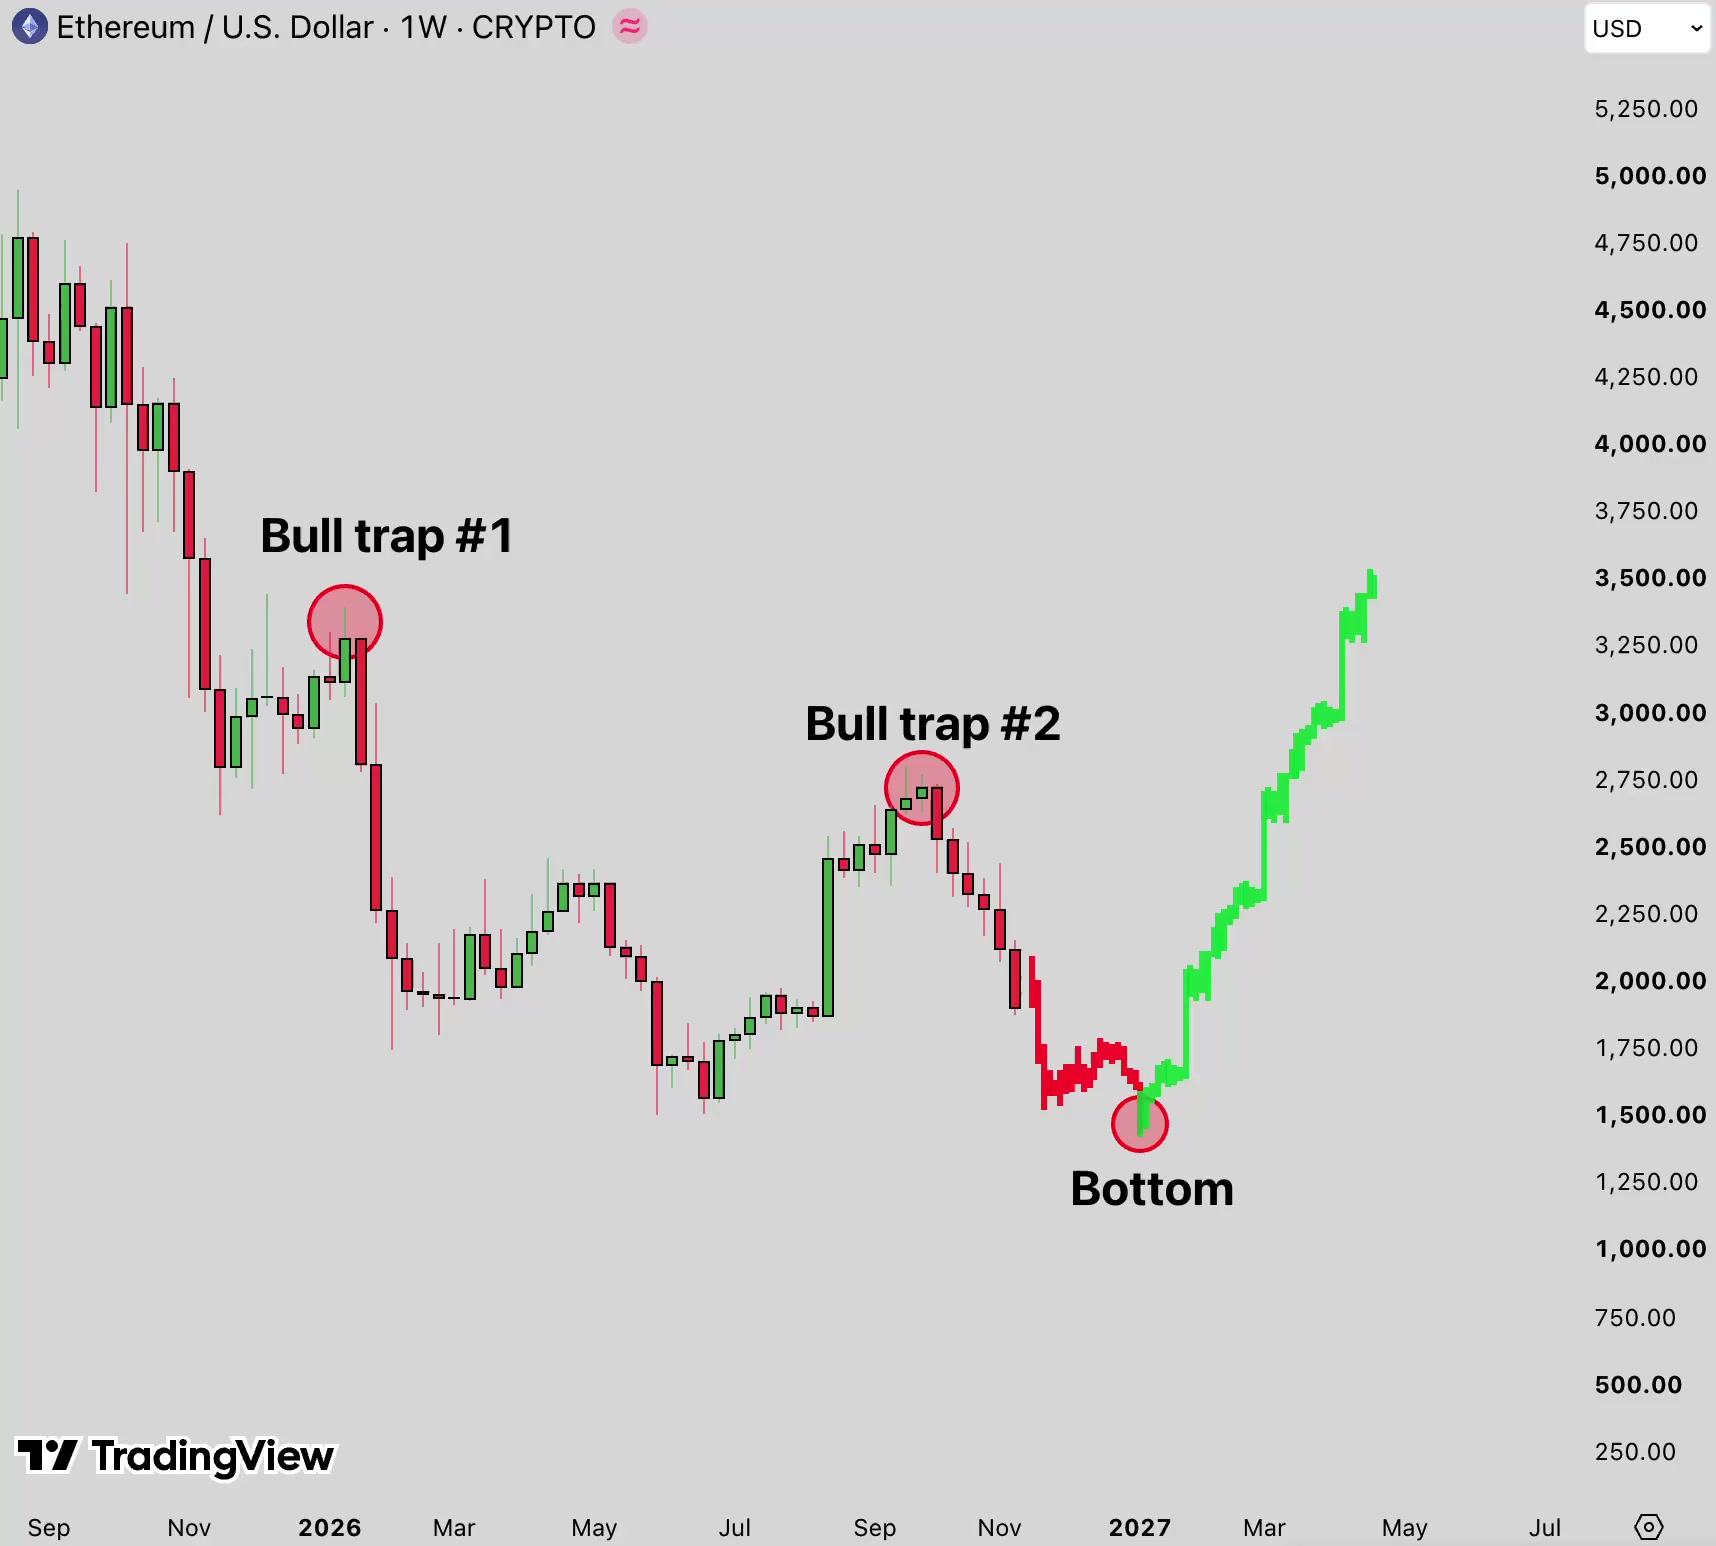
Everyone has a bottom call for ETH right now. I don't need one, I just need a dip I can define, and the hourly chart is giving me one. The video attached shows the bigger picture of ETH's bull traps and where the last flush ended. That's the backdrop. The trade below is built only on today's hourly and 15m charts. $ETHUSDT is at 1,808.04 (-4.72%), inside a 24h range of 1,709.06 to 1,919.14. That puts it 47% of the way up the range, 5.8% above the low and 5.8% under the high. Turnover is 4.08B. The levels I'm watching: Up: 1,816.60 (15m MA7) -> 1,832 (bounce high, my read) -> 1,843.98 (1h MA28) Down: 1,794.39 (1h MA14) -> 1,784.34 (1h MA7) -> 1,777.00 (15m MA28) -> 1,709.06 (24h low) On the 1h, price is over MA7 (1,784.34) and MA14 (1,794.39), by 1.3% and 0.8%, and 2.0% under MA28 (1,843.98). The fast pair has bunched together right under price after the bounce, so I read 1,784 to 1,794 as one support zone. MA28 is still falling, which is why I'm only treating this as a bounce. On the 15m, price is 0.5% under MA7 (1,816.60), 0.1% over MA14 (1,806.53) and 1.7% over MA28 (1,777.00). The last candles are small red ones drifting back toward the averages, which is the kind of dip I'm willing to buy. I'm watching volume. The 15m bar is 2.84K against MA5 6.35K and MA10 12.88K with 12:19 left, still forming. The 1h bar is 2.86K against 97.32K and 124.78K with 57:15 left, just opened. The bounce came on a big green bar and the pullback so far is quiet, so I'm not seeing sellers rush back in. The trade, buying the dip into the 1h pair: - Entry: 1,786 to 1,798 (limit, needs a 0.6% to 1.2% dip) - Stop: below 1,770 - Target 1: 1,830 (~1.7R from 1,792) - Target 2: 1,844 (~2.4R) Invalid if the 15m closes below 1,770, because that loses the 15m MA28 and the 1h MA7 together and the bounce is over. My thinking is to stay small, since the bigger trend is still down. Limit orders, small size, and no dip, no trade. #IMPACTbyTrade
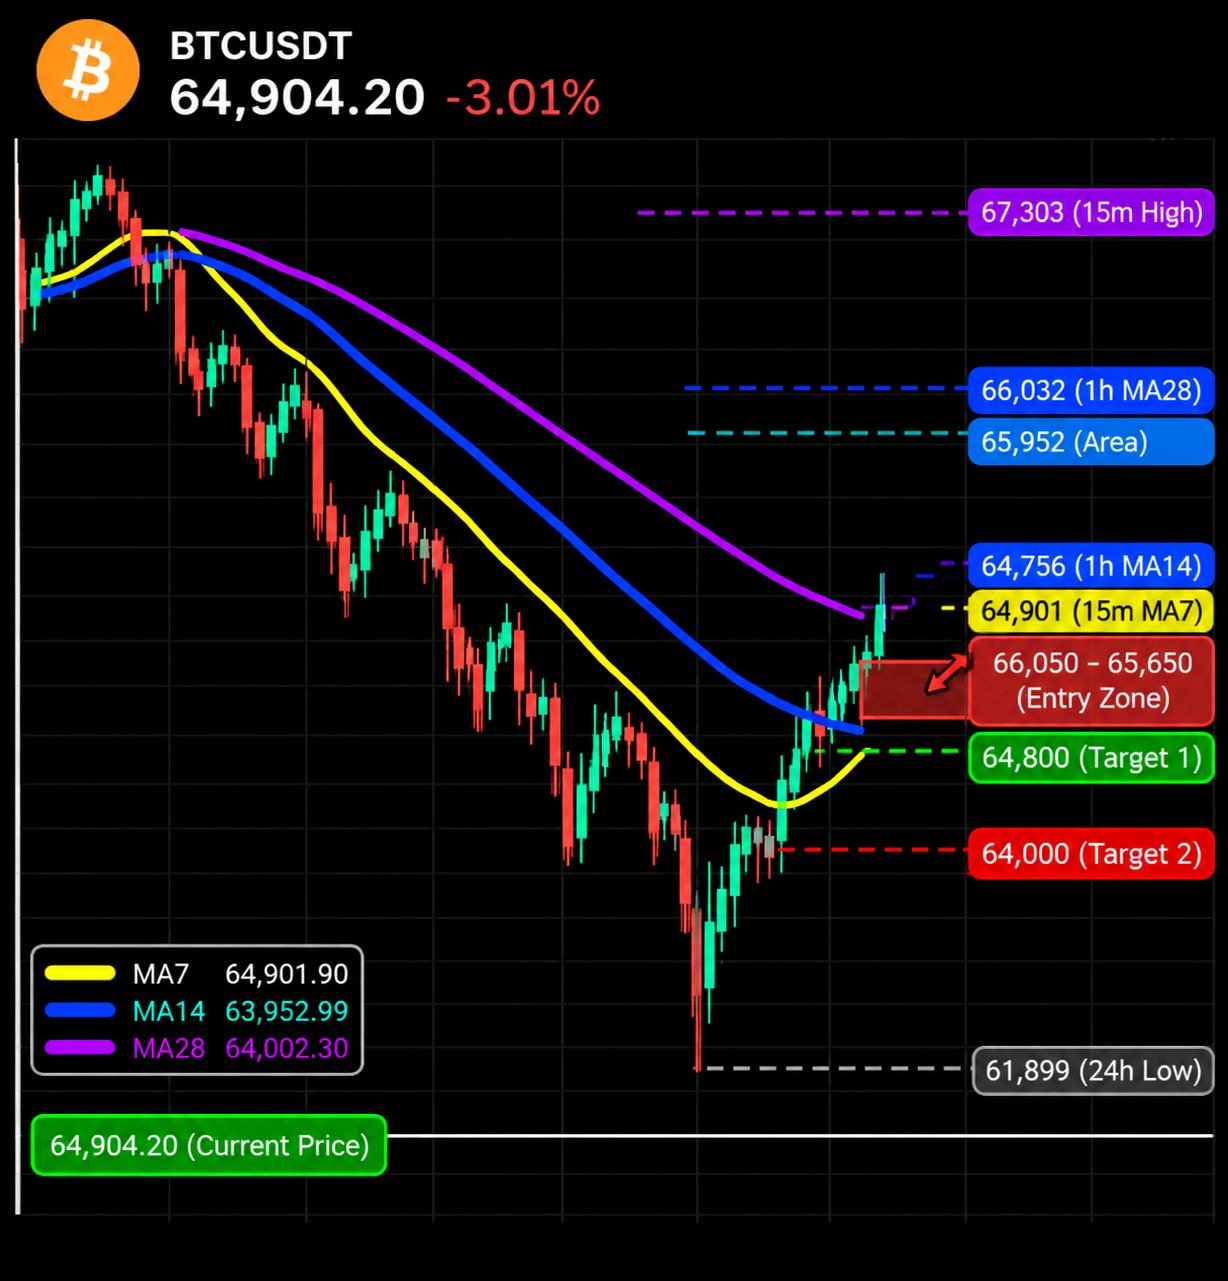
A 5% bounce inside a falling market is either the start of something or a trap, and the hourly averages above price are going to tell me which. $BTCUSDT is at 64,904.20 (-3.01%), inside a 24h range of 61,899.20 to 67,496.00 That puts it 54% of the way up the range, 4.9% above the low and 3.8% under the high Turnover is 9.93B The map I'm using: Up: 65,952 (chart gridline, an area) -> 66,032 (1h MA28) -> 67,303 (15m chart high) Down: 64,757 (1h MA14) -> 64,002 (15m MA28) -> 61,899 (24h low) On the 1h, price has climbed back over MA7 (63,975.22) and MA14 (64,756.66), by 1.4% and 0.2%, but it is still 1.7% under MA28 (66,032.35), and that line has been sloping down for days with no flat stretch. The bounce is a single long green candle, so I treat MA28 as the first real test, not the finish line. On the 15m, price is right on MA7 (64,901.90) and 1.5% and 1.4% over MA14 (63,952.99) and MA28 (64,002.30) The ladder has turned up under price and that is a fair bounce, but the last few candles are small and overlapping, which looks like a pause to me, not a second leg. I'm watching volume. The 15m bar is 530.289 against MA5 1.79K and MA10 3.18K, and the 1h bar is 7.29K against 11.14K and 9.59K, both with about 11 minutes left, so neither is final. The tallest bars on the 1h panel are the red ones from the drop, and I would want a real surge to believe this bounce has more room. The trade, selling the retest of the 1h MA28: - Entry: 65,650 to 66,050 (limit, needs a 1.1% to 1.8% bounce) - Stop: above 66,450 - Target 1: 64,800 (~1.8R from 65,850) - Target 2: 64,000 (~3.1R) Invalid if the 15m closes above 66,450. My thinking is that a close over the 1h MA28 would turn the whole slide into a base, and I'd stand aside. Limit orders, modest size, and no retest, no trade. If price never gets back to 65,650, I simply watch. #IMPACTbyTrade

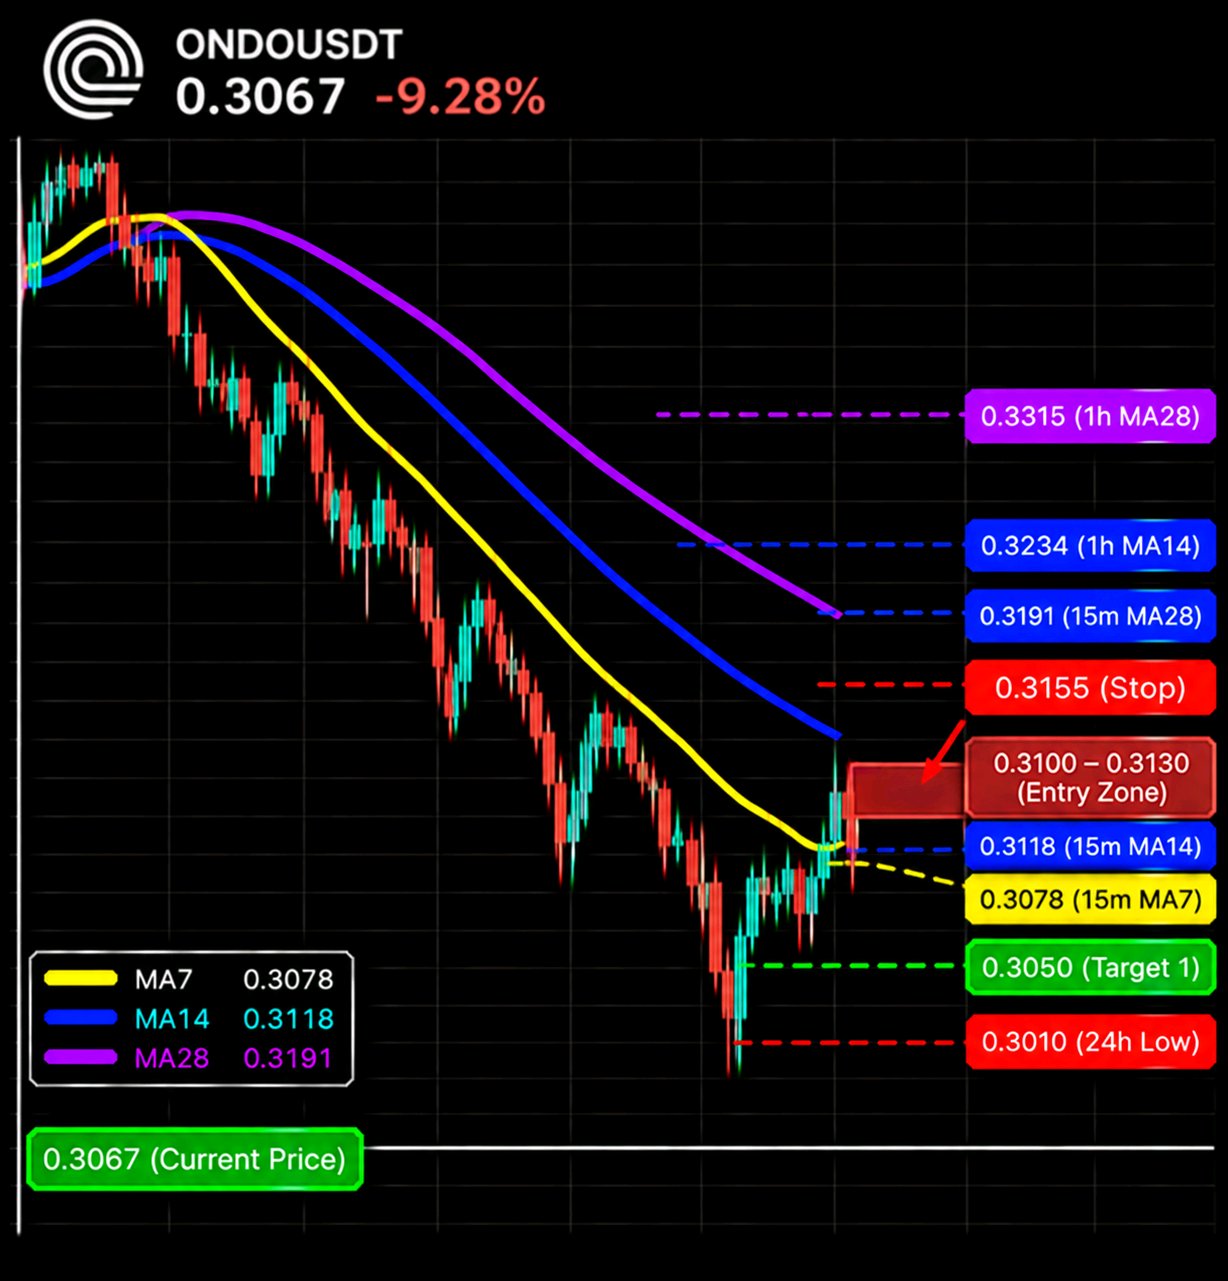
ONDO is down almost a tenth on the day and the chart still doesn't look finished to me. Every average above price is falling, and that's the part I trust more than the percentage $ONDOUSDT is at 0.3067 (-9.28%), inside a 24h range of 0.3038 to 0.3465. That puts it 7% of the way up the range, 1.0% above the low and 11.5% under the high. Turnover is 30.40M My levels: Up: 0.3078 (15m MA7) -> 0.3118 (15m MA14) -> 0.3173 (1h MA7) -> 0.3191 (15m MA28) Down: 0.3038 (24h low) -> 0.3010 (my estimate) On the 1h, price is under MA7 (0.3173), MA14 (0.3234) and MA28 (0.3315), by 3.5%, 5.4% and 8.1%. They are fanned out in order and every one is sloping down, and the last few 1h candles fell through them with barely a pause On the 15m, price is under MA7 (0.3078), MA14 (0.3118) and MA28 (0.3191), by 0.4%, 1.7% and 4.0%. After the flush there is a small base of candles at the low, but none of them has closed back over the fast average, so I'm waiting for the bounce to come to the MA14, not selling the floor I'm watching volume. The 15m bar is 234.05K against MA5 1.62M and MA10 2.19M with 11:16 left, still forming, so I'm not judging it. The 1h bar is 1.10M against 8.40M and 5.04M with 41:12 left, just opened. The tallest bars on both charts are the red ones on the drop, and the base since has been light The trade, sell the bounce into the 15m MA14: - Entry: 0.3100 to 0.3130 (limit, needs a 1.1% to 2.1% bounce) - Stop: above 0.3155 - Target 1: 0.3050 (~1.6R from 0.3115) - Target 2: 0.3010 (~2.6R) Invalid if the 15m closes above 0.3155. My thinking is that a reclaim of the 1h MA7 area would mean the flush is being bought, and I'd stay out Limit orders, small size after a move this fast, and no bounce, no trade. I would rather miss it than short the low. #IMPACTbyTrade

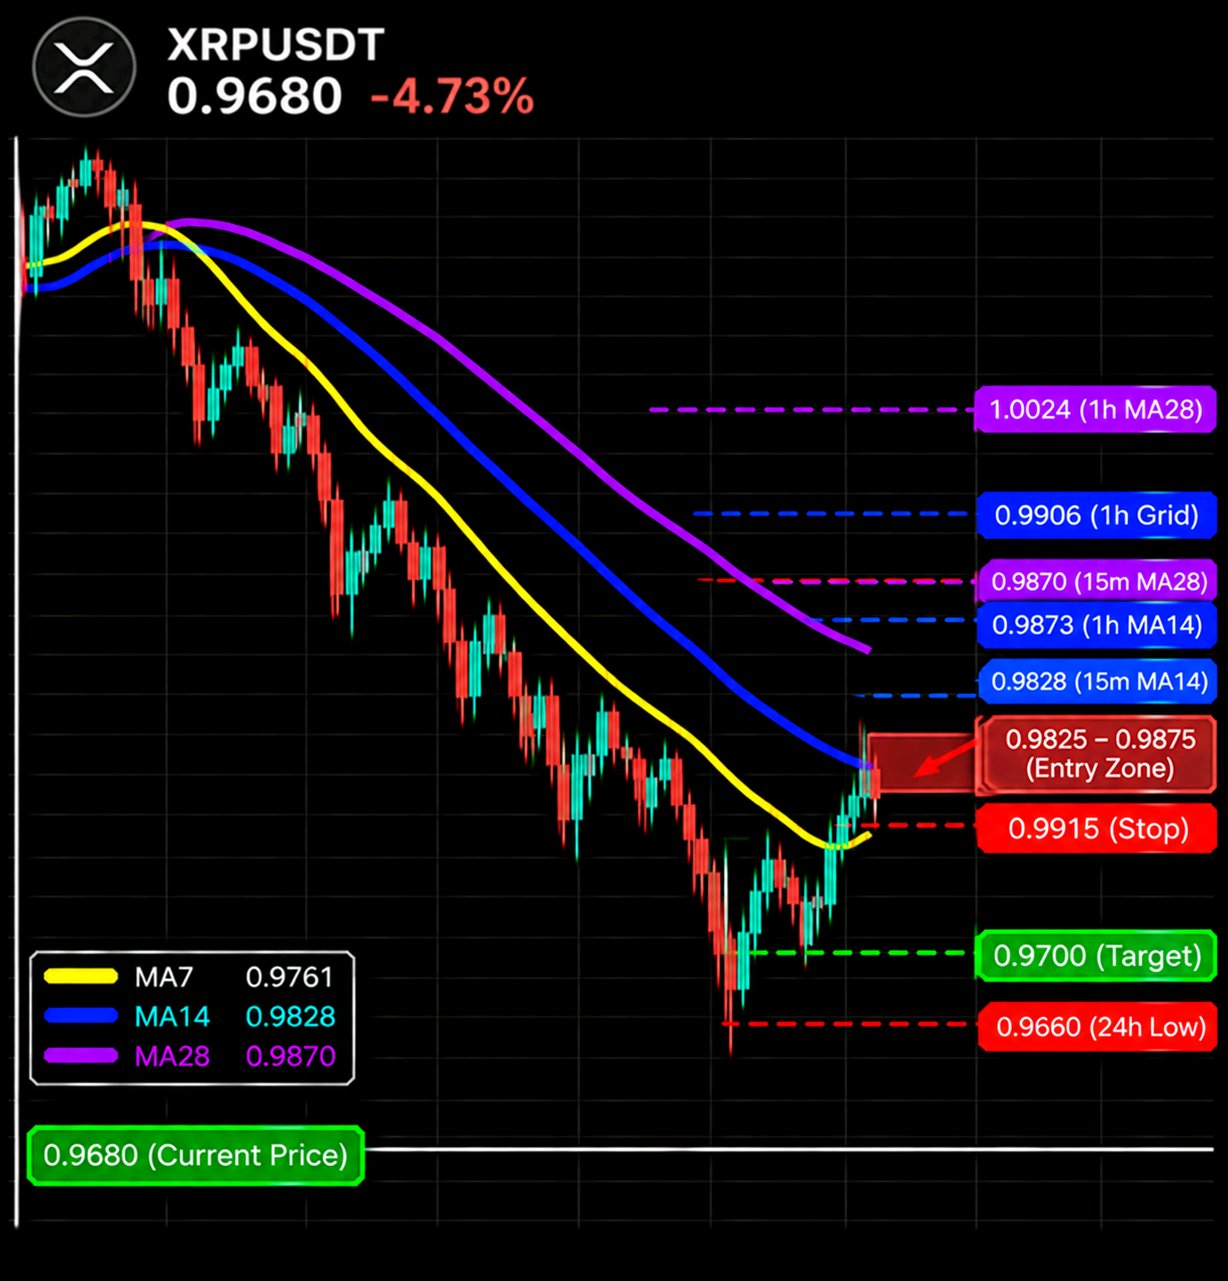
Five coins on my screen are down 5% to 10%, and XRP is sitting 0.2% off its low. I'm not selling that low. I'm waiting for it to climb back to the shelf it just fell through $XRPUSDT is at 0.9680 (-4.73%), inside a 24h range of 0.9660 to 1.0294. That puts it 3% of the way up the range and 6.0% under the high, on 364.39M of turnover. On the 1h it has slid 9.3% from 1.0645 to 0.9660, and the 15m shows it holding a shelf around 0.979 to 0.992 for hours before it let go The zone I'd use is 0.9825 to 0.9875: Up: 0.9761 (15m MA7) -> 0.9828 (15m MA14) -> 0.9847 (1h MA7) -> 0.9870-0.9873 (15m MA28 / 1h MA14) -> 0.9906 (1h gridline) -> 1.0024 (1h MA28) Down: 0.9660 (24h low) On the 1h, MA7 (0.9847), MA14 (0.9873) and MA28 (1.0024) are in bearish order and all pointing down, with price 1.6%, 1.9% and 3.4% under them. On the 15m, MA7 (0.9761), MA14 (0.9828) and MA28 (0.9870) fall the same way, with price 0.8%, 1.5% and 1.9% under them. Four averages are stacked inside half a percent right where the old shelf used to be The volume says the drop wasn't a fluke. The 1h bar on the move to 0.9660 is one of the biggest on the chart. The current 15m candle shows 2.05M with about six minutes left, against 9.61M and 8.54M, so I'm not calling that low yet, and the 1h candle just opened, so I'm ignoring its 2.06M My plan, selling the bounce into the old shelf: - Entry: 0.9825 to 0.9875 - Stop: above 0.9915 - Target: 0.9700 (~2.3R from the 0.9850 midpoint) No second target from me, because I can't see a level under the 24h low. It needs a bounce of 1.5% to 2.0% to reach the zone, and I only want it if price stalls there. I'm wrong if a 15m candle closes above 0.9915, back over the shelf and every average. How I see it: if the bounce stalls under that stack, the 0.9660 low gets tested again before anything else happens On a day like this, a stop of about 0.6% can get wicked by one candle. I'd keep size modest and use limit orders. If price never bounces into the zone, I simply have no trade I'd rather sell a shelf that already broke than a low that's still printing #IMPACTbyTrade

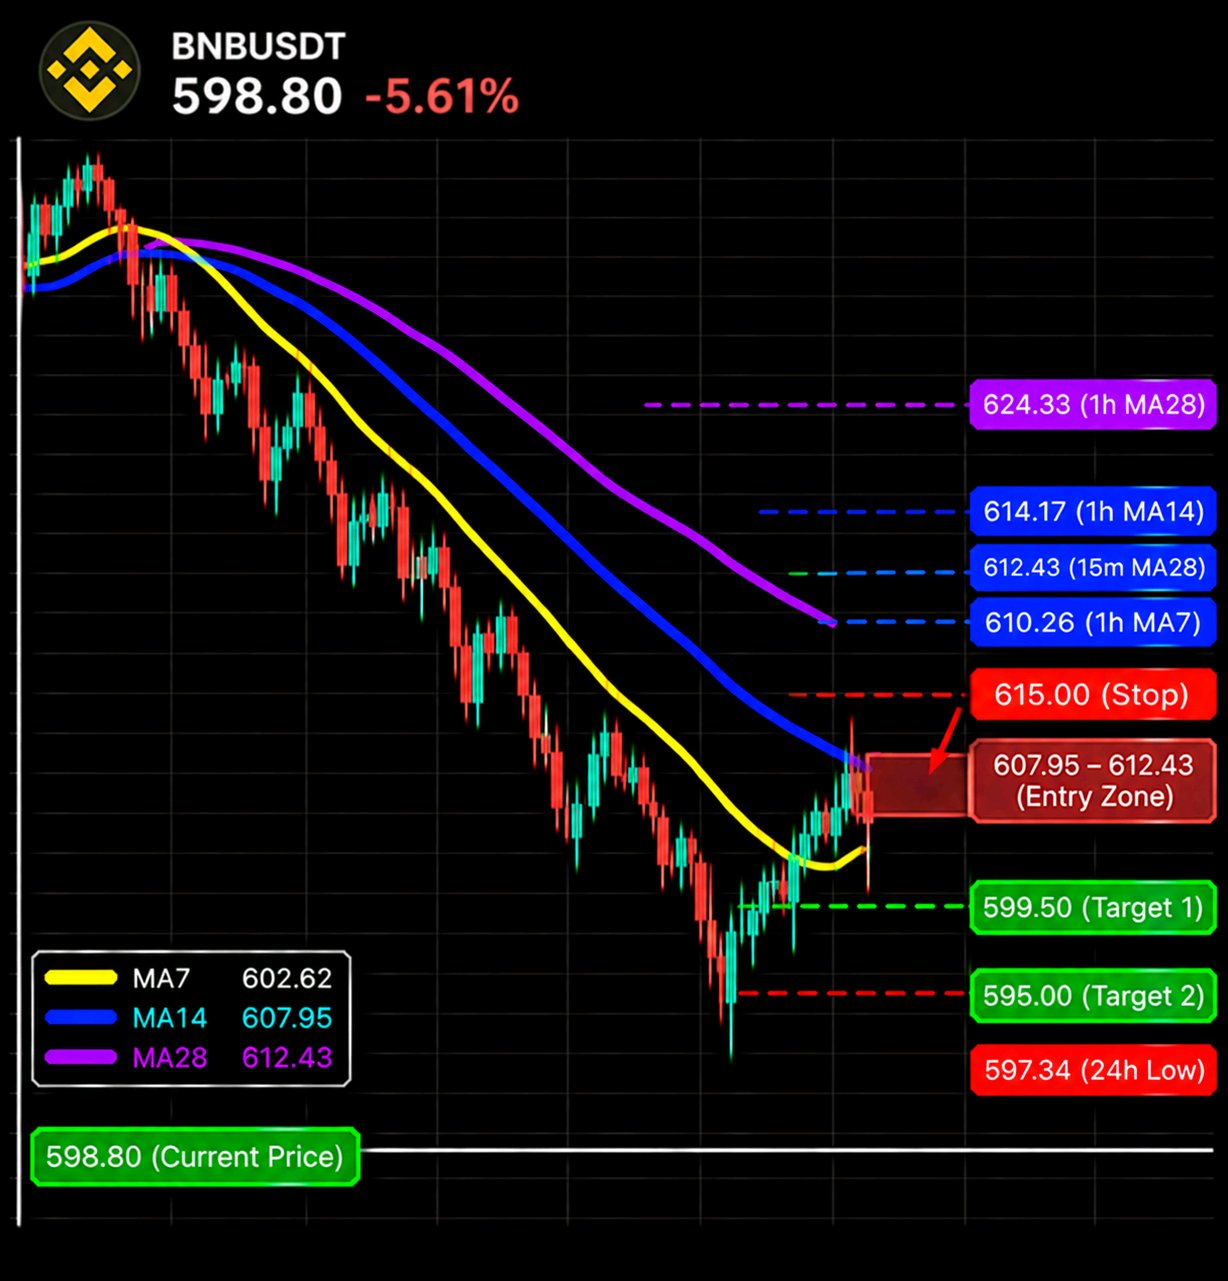
BNB has been bleeding in a straight line since around 6 PM, and the only entry I'd take is the one where it finally gets a bounce and gives it back. $BNBUSDT is -5.61% at 598.80, 0.24% above the 597.34 low and 6.7% under the 638.95 high, about 3.5% of the way up the 24h range, on 31.09M of turnover. It dropped through the 615 to 621 area it had been sitting in and then printed red candle after red candle with barely a bounce in between. The part I'm paying attention to is that the selling got quiet. The latest 15m candle shows 428 against 1.57K (MA5) and 1.33K (MA10), roughly 0.3x of each, after a stretch of bars several times that size. The 1h bar shows 431 against 3.06K and 2.30K, but that hour only just opened. Quiet at the low can mean a bounce is close. It does not mean the sellers are done, so I want the bounce to come to me. The averages (all above price): 15m MA7 602.62 (+0.6%) 15m MA14 607.95 (+1.5%) 1h MA7 610.26 (+1.9%) 15m MA28 612.43 (+2.3%) 1h MA14 614.17 (+2.6%) 1h MA28 624.33 (+4.3%) The 15m MA7 at 602.62 is just the fast line and sits too close to the low for me to sell. The zone I care about is where the 15m MA14, 1h MA7 and 15m MA28 stack up, 607.95 to 612.43. Up: 602.62 -> 607.95 / 610.26 / 612.43 -> 614.17 -> 624.33 -> 638.95 (24h high) Down: 597.34 (24h low), nothing visible under it My trade, only if the bounce shows up: Entry 607.95 to 612.43, after price reaches it and stalls (a candle or two that cannot close above 612.43). That means a 1.5% to 2.3% bounce first. Stop above 615.00, over the 1h MA14 at 614.17 Target 1: 599.50, just above the 597.34 low (about 2.2R) Target 2: 595.00 if the low breaks (about 3.2R). Nothing is mapped under 597.34, so that one is a measured move. If it slides under 597.34 without bouncing, I leave it alone. If a 15m candle closes above 615.00, the sellers lost control of the bounce and the idea is dead. R is counted from the middle of the zone (610.19) with a stop about 0.8% away. Keep the size small enough that the stop does not hurt. Not financial advice. Honestly the hardest part of this one is doing nothing while it sits at the low. #IMPACTbyTrade

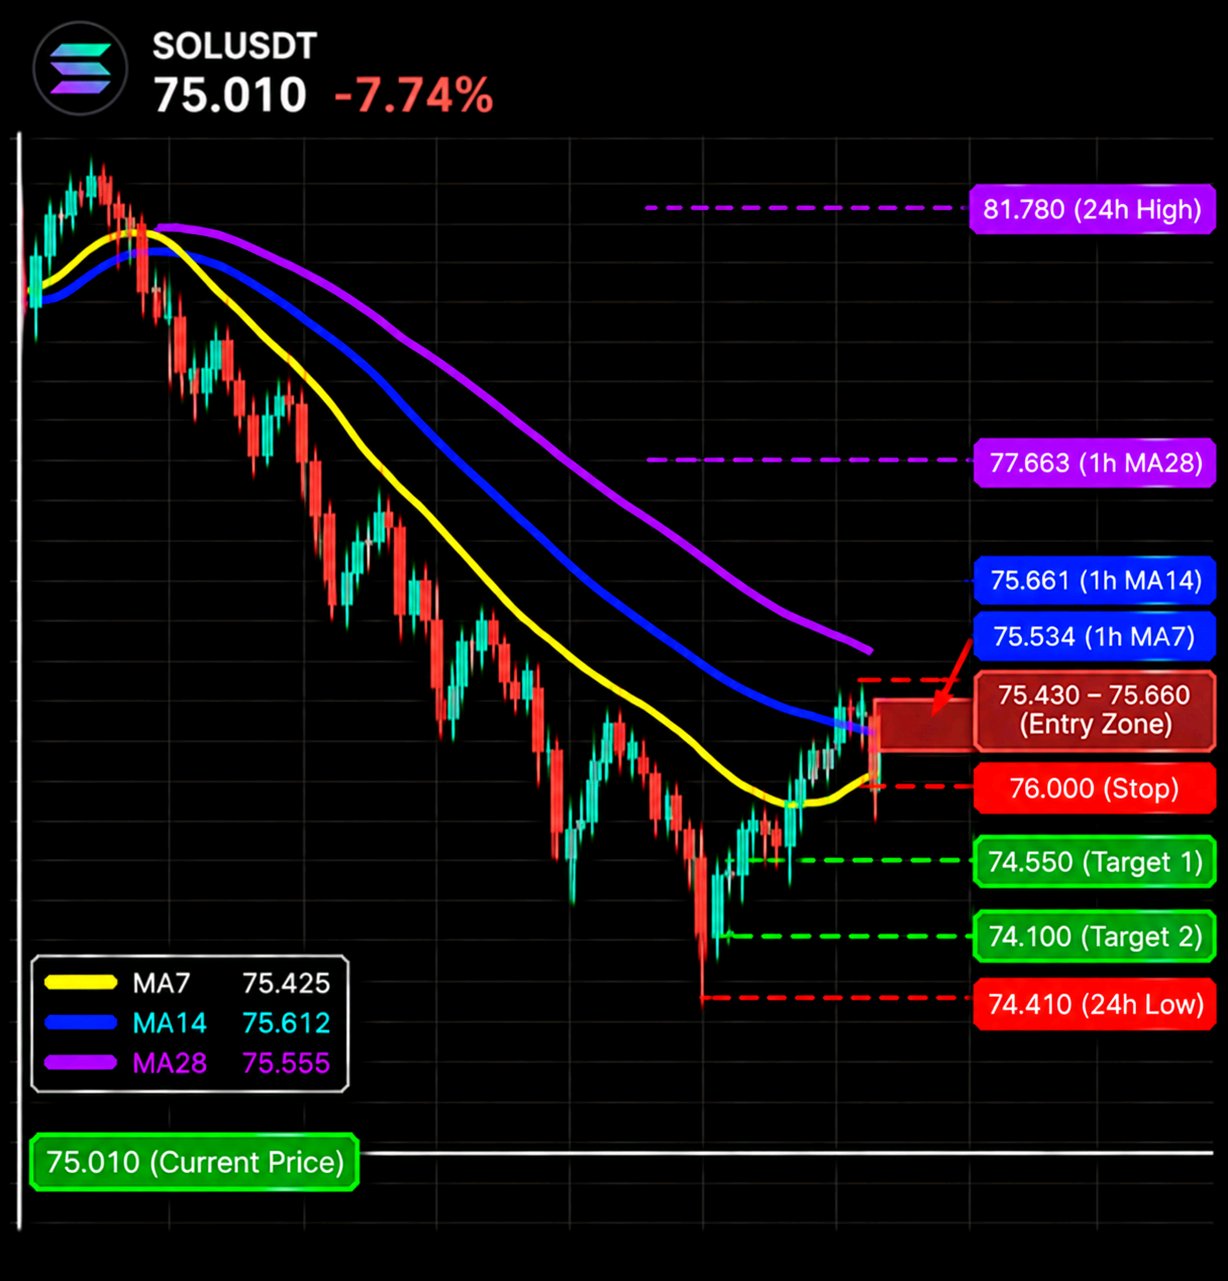
SOL spent six hours going nowhere, then one candle cracked the floor. I'm not chasing that. I want to see the bounce fail first. $SOLUSDT is -7.74% at 75.010, 0.8% above the 74.41 low and 9.0% under the 81.78 high, only about 8% of the way up the 24h range. The range it was sitting in ran roughly 75.0 to 75.9 (12:15 to 18:45) Turnover is 608.92M, more than ten times anything else I looked at today, so these levels are not thin ones. Volume is the story here. The 15m bar prints 258.82K against 103.61K (MA5) and 71.92K (MA10), about 2.5x and 3.6x. The 1h bar shows 258.96K, almost the same number, so the hour just opened and one candle did all of it. That is already 1.4x the 1h MA5 (182.41K) and 1.3x the MA10 (193.16K). Both bars are still forming, so the close has to back it up. The averages (all above price): 15m MA7 75.425 (+0.6%) 15m MA28 75.555 (+0.7%) 15m MA14 75.612 (+0.8%) 1h MA7 75.534 (+0.7%) 1h MA14 75.661 (+0.9%) 1h MA28 77.663 (+3.5%) The three 15m lines sit inside a 0.25% band and the 1h MA7 and MA14 land right on it, so I'm watching one cluster (75.43 to 75.66), not six separate lines. Up: 75.43 / 75.56 / 75.61 -> 75.66 -> 77.66 (1h MA28) -> 81.78 (24h high) Down: 74.41 (24h low), nothing mapped under it Plan: sell the retest only. Entry 75.43 to 75.66, and only once price gets there and stalls. That takes a 0.6% to 0.9% bounce first. Stop above 76.00, over the top of that range and the 1h MA14. Target 1: 74.55, just above the 74.41 low (about 2.2R) Target 2: 74.10 if the low goes (about 3.2R) There is no level visible below 74.41, so that one is a measured move. If it bleeds under 74.41 and keeps going without ever retesting, I'm not chasing it. If a 15m candle closes back above 76.00, the range is holding and I'm wrong. R is counted from the middle of the zone (75.545) with a stop 0.6% away. Small stop, so size small too. Not financial advice. Anyone else watching 75.43 to 75.66 for this one? #IMPACTbyTrade

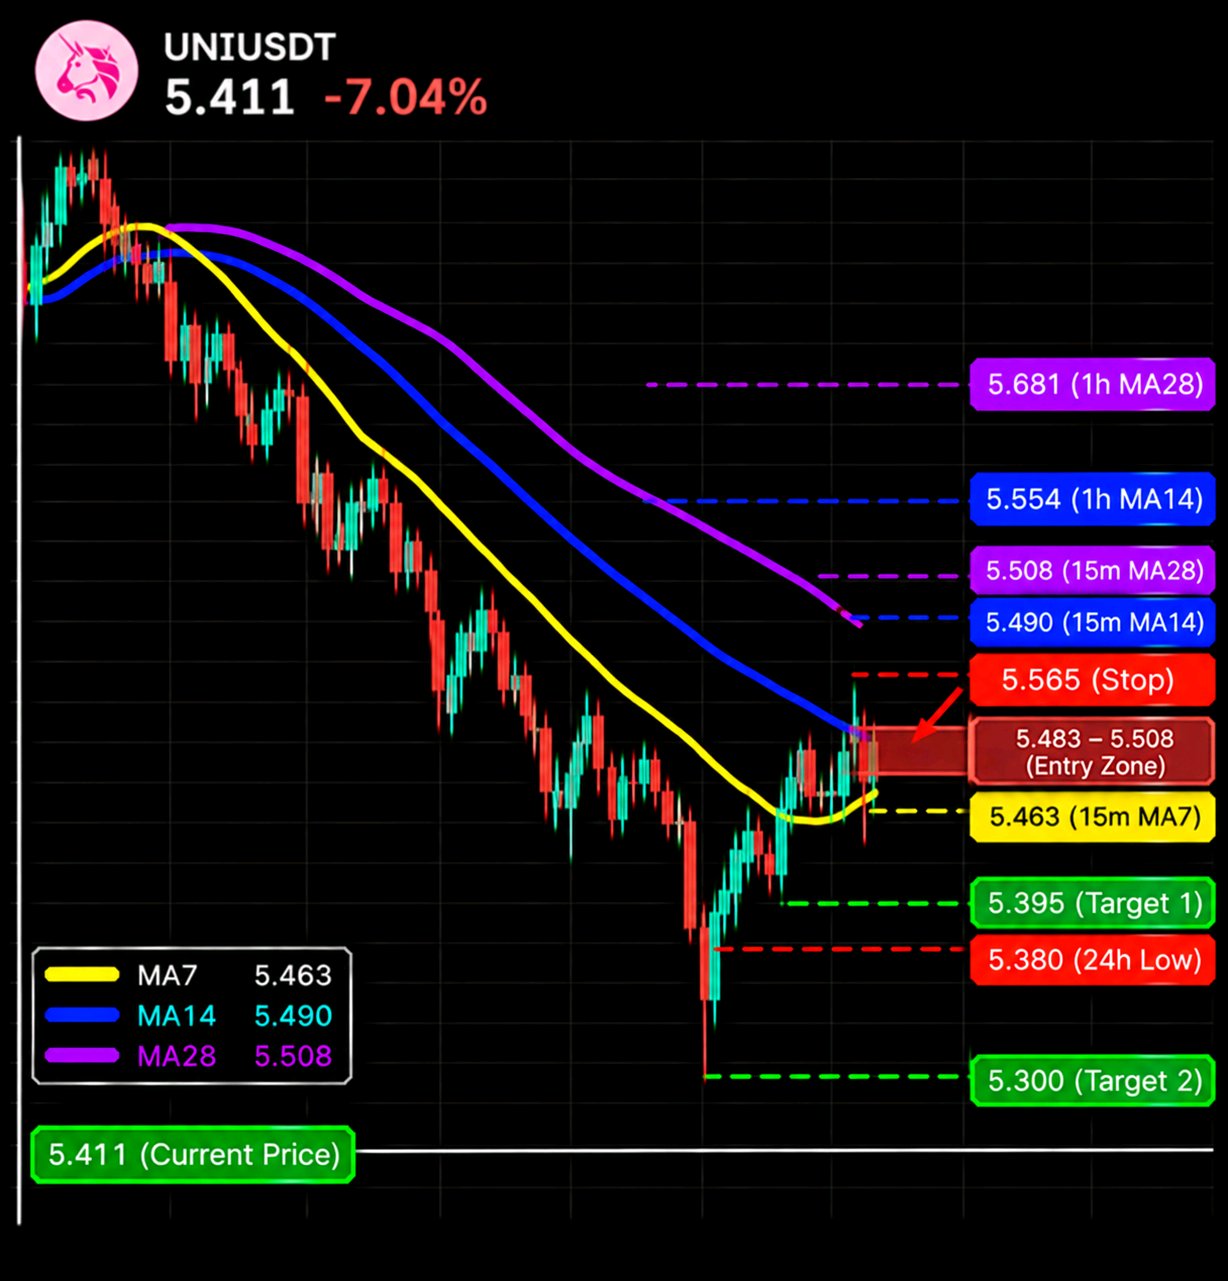
Everything on my list is bleeding, but UNI is the only one I'd want to sell, and only after it bounces $UNIUSDT is at 5.411 (-7.04%), only 0.6% above the 5.380 low and about 5% of the way up a 24h range that tops out at 6.022 (11.3% overhead). Turnover is 34.73M, so there is real money behind this move Volume read: the current 15m candle shows 210.25K against 79.67K (MA5) and 56.41K (MA10), roughly 2.6x and 3.7x The 1h bar shows 210.41K, almost the same number, which tells me the hour has barely started and nearly all of it came in one candle. It already beats the 1h MA10 (191.43K). Both candles are still open, so I treat it as heavy selling that the close still has to confirm The averages (all above price): 15m MA7 5.463 (+1.0%) 15m MA14 5.490 (+1.5%) 15m MA28 5.508 (+1.8%) 1h MA7 5.483 (+1.3%) 1h MA14 5.554 (+2.6%) 1h MA28 5.681 (+5.0%) Fast under slow on both timeframes and price under all six. Up: 5.463 / 5.490 / 5.508 -> 5.554 -> 5.681 -> 6.022 (24h high) Down: 5.380 (24h low), nothing visible below it My plan (sell the bounce only): Entry 5.483 to 5.508 (1h MA7 plus the 15m MA14 / MA28). That needs a 1.3% to 1.8% bounce first, and I want to see price reach the zone and stall there, not tag it and short blindly Stop above 5.565 (a reclaim of the 1h MA14 at 5.554 means this is no longer a weak bounce) Target 1: 5.395, just above the 5.380 low (about 1.4R) Target 2: 5.300 if the low gives way (about 2.8R) There is no level visible under 5.380, so that one is a measured move, not a mapped one. If it slides through 5.380 without ever bouncing, I don't chase it. I let that one go and wait for the next retest. R is counted from the middle of the zone (5.4955) with a stop about 1.3% away, so a stop-out stays small. Size it that way. Not financial advice. Would you rather wait for the bounce or take the low? I know which one has hurt me more. #IMPACTbyTrade

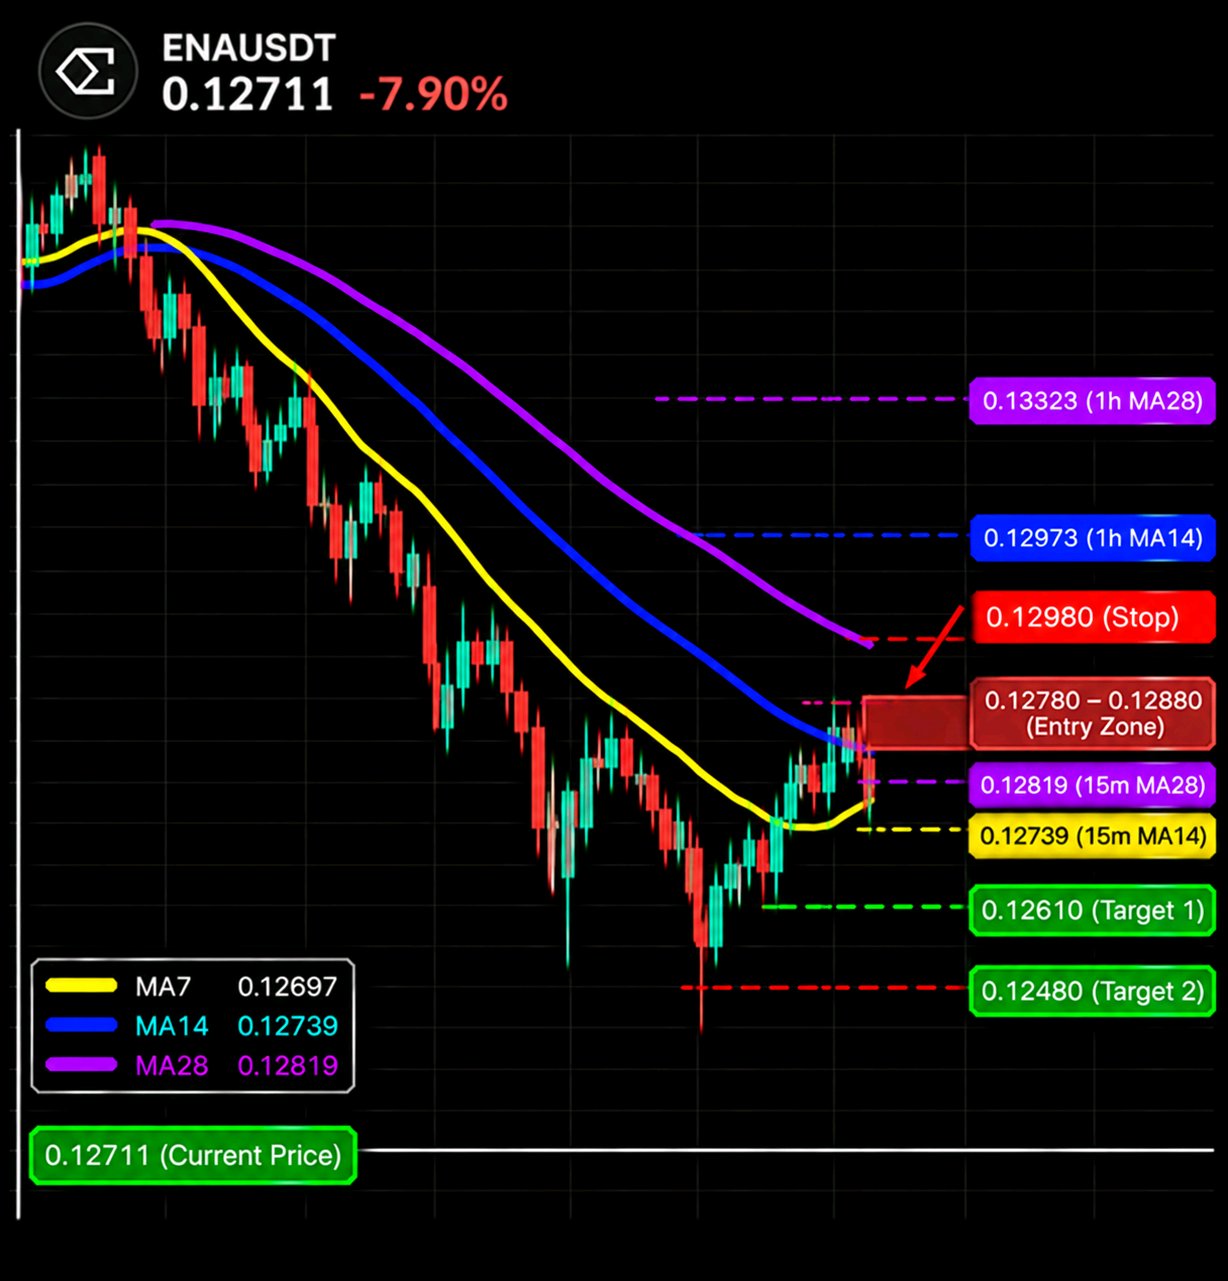
ENA keeps reminding me that a coin can be 8% down and still not look cheap, because every hourly average is sitting above it and none of them is flattening $ENAUSDT is at 0.12711 (-7.90%), inside a 24h range of 0.12598 to 0.14258. That puts it 7% of the way up the range, 0.9% above the low and 10.9% under the high. Turnover is 75.54M What I'm marking: Up: 0.12739 (15m MA14) -> 0.12772 (1h MA7) -> 0.12819 (15m MA28) -> 0.12973 (1h MA14) Down: 0.12598 (24h low) -> 0.12480 (my estimate) On the 1h, price is under MA7 (0.12772), MA14 (0.12973) and MA28 (0.13323), by 0.5%, 2.0% and 4.6%. They are stacked in order, fanned wide, and all three keep sloping down, so there is no stretch where buyers have taken control On the 15m, price is 0.1% over MA7 (0.12697), but 0.2% under MA14 (0.12739) and 0.9% under MA28 (0.12819). The candles have been moving sideways around the fast lines, so I don't want to short the middle of that, I want to be paid for waiting for the bounce I'm watching volume. The 15m bar is 396.20K against MA5 2.95M and MA10 3.52M with 12:39 left, and the 1h bar is 405.97K against 10.72M and 20.37M with 57:37 left. Both candles are barely started, so I won't judge them yet, but the tall bars on both charts came on the drops, not on the small bounces since My thinking: the first spot where a bounce can get stuck is the 1h MA7 and the 15m MA28, both within 0.4% of each other, and above them the 1h MA14 is the line that would tell me the bounce is real The trade, selling the bounce: - Entry: 0.12780 to 0.12880 (limit, needs a 0.5% to 1.3% bounce) - Stop: above 0.12980 - Target 1: 0.12610 (~1.5R from 0.12830) - Target 2: 0.12480 (~2.3R) I'm wrong if the 15m closes above 0.12980, because then price has taken back the 1h MA14 and I'd step aside. Small size, limit orders only. If it never reaches 0.12780, there is no trade. #IMPACTbyTrade

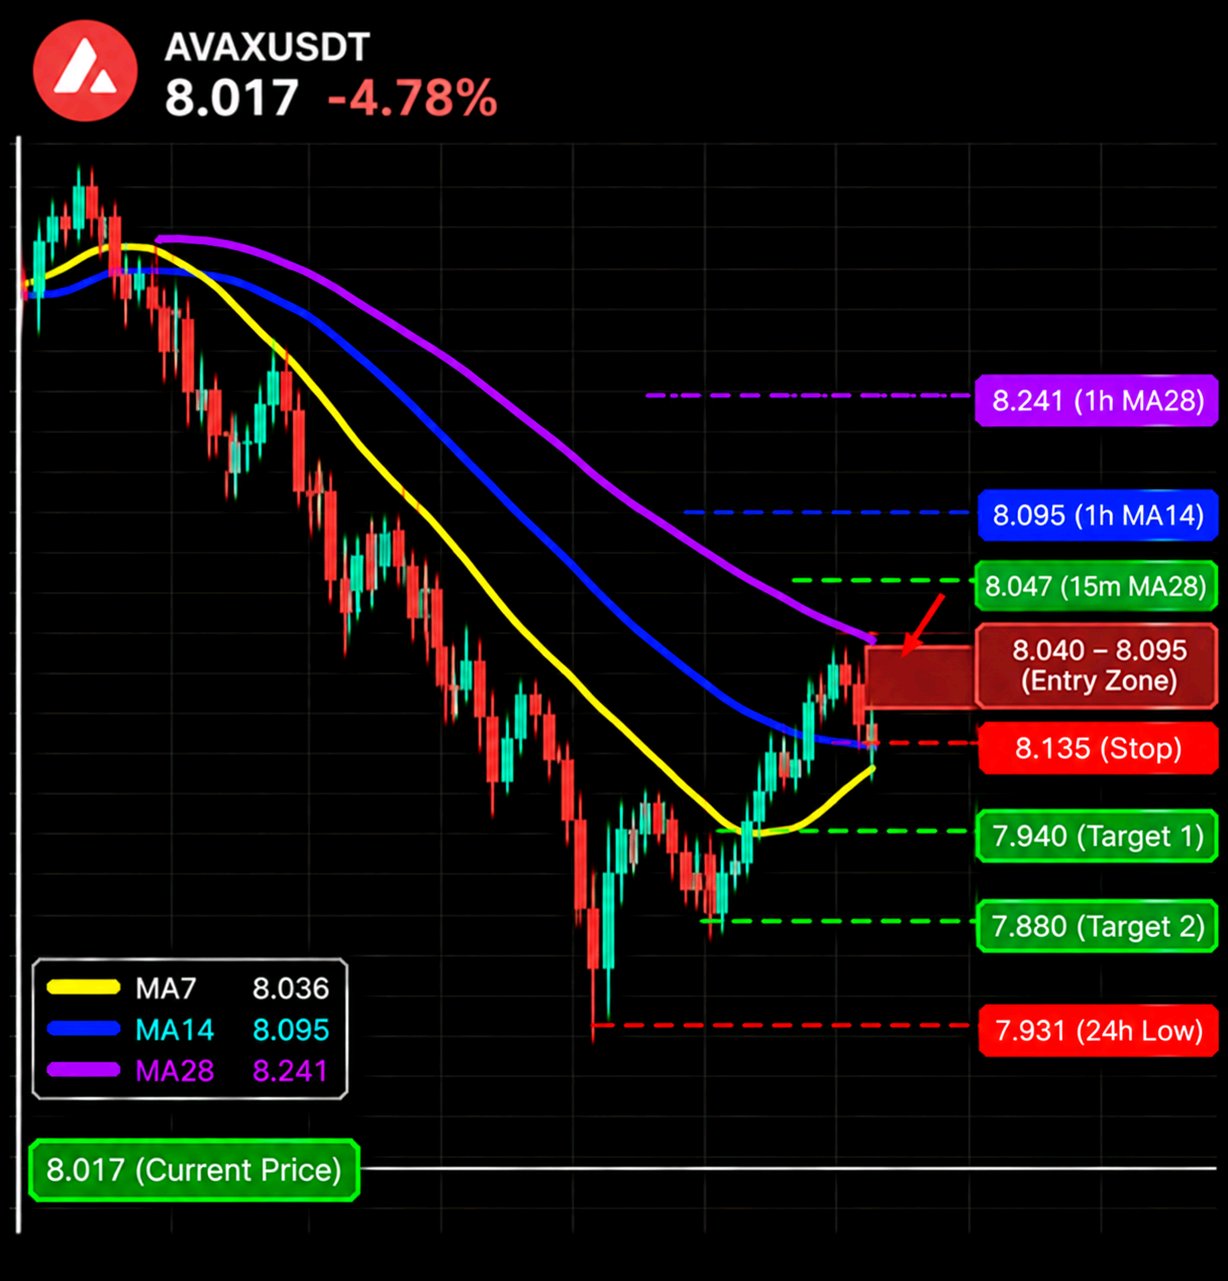
AVAX has been giving back the same ground all afternoon, and the hourly chart shows exactly where each bounce has been running out of air. $AVAXUSDT is at 8.017 (-4.78%), inside a 24h range of 7.931 to 8.629. That puts it 12% of the way up the range, 1.1% above the low and 7.1% under the high. Turnover is 29.73M Here is the map I'm using: Up: 8.036 (1h MA7) -> 8.047 (15m MA28) -> 8.095 (1h MA14) -> 8.241 (1h MA28) Down: 7.931 (24h low) -> 7.880 (my estimate) On the 1h, price is under MA7 (8.036), MA14 (8.095) and MA28 (8.241), by 0.2%, 1.0% and 2.7% The three are fanned out and pointing down, and every bounce since the 8.45 area has topped out at the fast line, so I read 8.04 to 8.10 as the area where the next one has to prove itself. On the 4h, price is also under MA7 (8.208), MA14 (8.279) and MA28 (8.378), by 2.3%, 3.2% and 4.3%, so the bigger picture is leaning the same way. On the 15m, price is level with MA14 (8.018) and 0.1% over MA7 (8.012), but 0.4% under MA28 (8.047). The last candle is a small green one that has only just reached the fast lines, so I'm not selling this exact price, I'm waiting for a little more. Volume is light. The 1h bar shows 15.23K against MA5 119.19K and MA10 141.10K with 44:26 left, so it is still early in the candle and I won't judge it. The 15m bar was 12.48K against 18.32K and 20.09K when I looked. The tall bars on this chart came on the drops and this bounce has none, so I lean toward selling into it. My plan, selling the bounce into the 1h averages: - Entry: 8.040 to 8.095 (limit, needs a 0.3% to 1.0% bounce) - Stop: above 8.135 - Target 1: 7.940 (~1.9R from 8.068) - Target 2: 7.880 (~2.8R) I'm wrong if the 15m closes above 8.135, because then price has taken back the 1h MA14 and I'd step aside. Small size, limit orders only. If it never reaches 8.040, there is no trade, and I'm fine with that. #IMPACTbyTrade

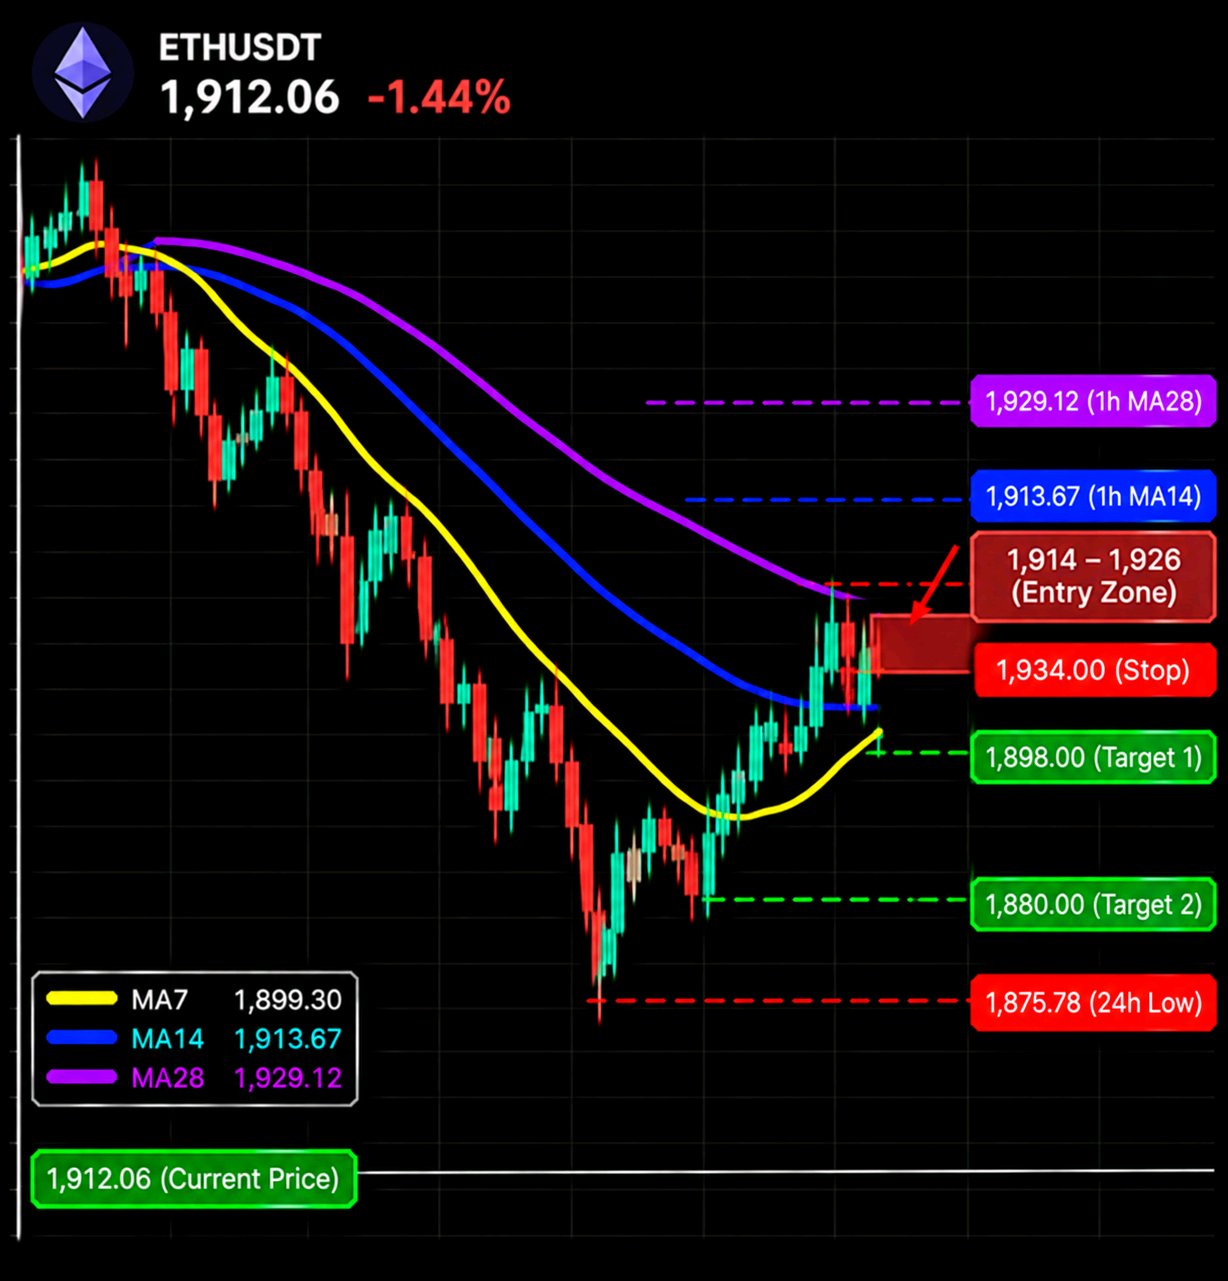
ETH has spent the last few hours climbing off 1,875, and the climb is walking straight into the hourly averages, which is the one place I'd expect it to get tired. $ETHUSDT is at 1,912.06 (-1.44%), inside a 24h range of 1,875.78 to 1,988.67. That puts it 32% of the way up the range, 1.9% above the low and 3.9% under the high Turnover is 2.39B. The ceiling I'm marking: Up: 1,913.67 (1h MA14) -> 1,929.12 (1h MA28) -> 1,952.21 (15m chart high) Down: 1,903.73 (15m MA7) -> 1,899.67 (15m MA28) -> 1,875.78 (24h low) On the 1h, price is 0.7% over MA7 (1,899.30), but 0.1% under MA14 (1,913.67) and 0.9% under MA28 (1,929.12). MA14 and MA28 are both still sloping down from the 2,053 area, so price has just reached the first of two falling lines, and I'm treating 1,914 to 1,929 as one zone. On the 15m, price is over MA7 (1,903.73), MA14 (1,901.56) and MA28 (1,899.67) by 0.4%, 0.6% and 0.7% The averages have turned flat and the last candle is a long green one with a wick above it, so buyers have shown up, but they have not yet been tested at the hourly line. Volume is the honest part. The 15m bar shows 17.98K against MA5 8.26K and MA10 7.79K with 00:52 left, so it is above both averages and still forming, which means this bounce has real buying behind it. The 1h bar is 38.38K against 33.07K and 52.08K with 00:39 left, above the MA5 but below the MA10. That is why I'm waiting for the zone and not shorting here. My plan, selling into the hourly averages: - Entry: 1,914 to 1,926 (limit, needs a 0.1% to 0.7% rise) - Stop: above 1,934 - Target 1: 1,898 (~1.6R from 1,920) - Target 2: 1,880 (~2.9R) I'm wrong if the 15m closes above 1,934, because that puts price over the 1h MA28 and the bounce becomes a reversal, so I'd leave it. Limit orders, small size, and if the climb never reaches 1,914 I simply don't have a trade. #IMPACTbyTrade

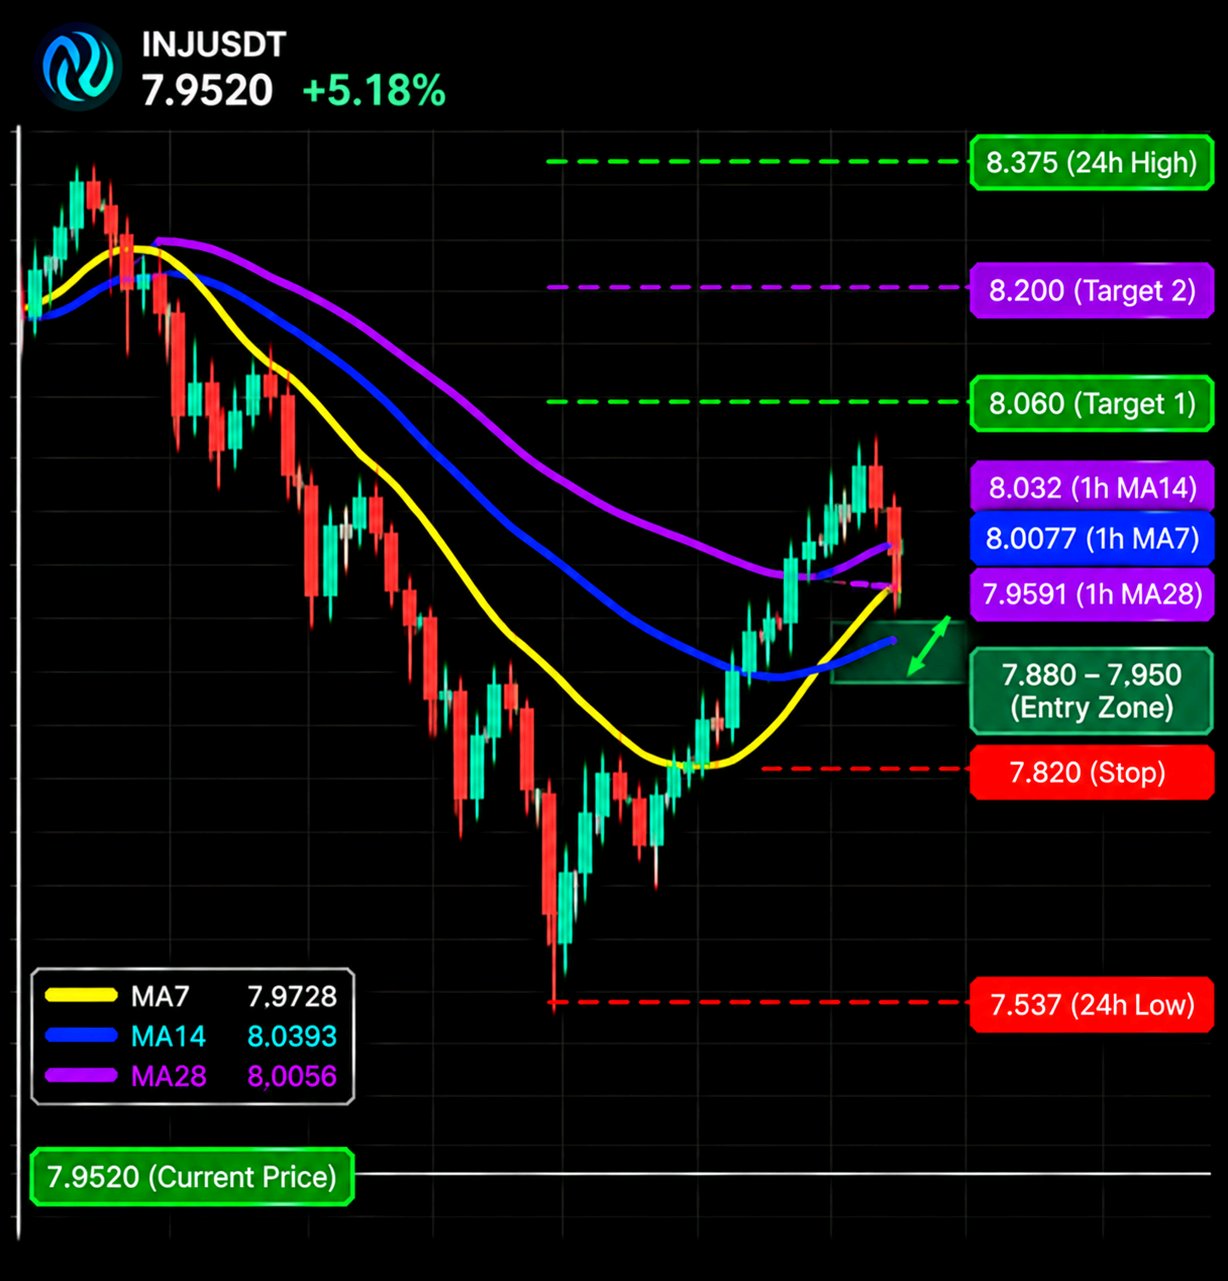
Every chart on my screen is bleeding to a fresh low except INJ, which is still 5% green and pulling back onto its rising 1h average. That contrast is what caught my eye $INJUSDT is at 7.9520 (+5.18%), inside a 24h range of 7.5370 to 8.3750. That puts it 50% of the way up the range, 5.5% above the low and 5.1% under the high. Turnover is 44.54M The shelf I'm watching: Up: 7.973 (15m MA7) -> 8.006 (15m MA28) -> 8.032 (1h MA14) -> 8.375 (24h high) Down: 7.959 (1h MA28) -> 7.859 (15m low) -> 7.537 (24h low) On the 1h, price is 0.7% under MA7 (8.0077) and 1.0% under MA14 (8.0318), and sitting right on MA28 (7.9591), 0.1% under it. MA28 is the one still climbing steeply from the 7.45 area, so that line is the whole trade for me: if it holds, this is a pullback, and if it doesn't, it's a top. On the 15m, price is under MA7 (7.9728), MA14 (8.0393) and MA28 (8.0056), by 0.3%, 1.1% and 0.7% The fast lines have rolled over after the spike to 8.3360, so I'm not buying the current price, I want a small flush into the shelf first. Volume is quiet. The 15m bar shows 1.60K against MA5 26.87K and MA10 36.98K with 13:24 left, so it is still forming and I won't judge it. The 1h shows 2.24K against 172.61K and 177.13K with 58:21 left, barely opened. The push up came on much bigger bars than this pullback, which is what I'd want from a dip I'm willing to buy. My plan, buying the pullback into the shelf: - Entry: 7.880 to 7.950 (limit, needs up to a 0.9% dip) - Stop: below 7.820 - Target 1: 8.060 (~1.5R from 7.915) - Target 2: 8.200 (~3.0R) I'm out if the 15m closes below 7.820. That means the 1h MA28 and the 15m low both gave way, and the pullback has turned into a reversal. Limit orders, small size, and if 7.95 never trades I simply have no position. #IMPACTbyTrade