MAYA_
7304Like1Shares443Fans398Follow
I am MAYA_ 👉 Spot, Futures And Alpha Trading Market Analyst 💫🫰
I am MAYA_ 👉 Spot, Futures And Alpha Trading Market Analyst 💫🫰
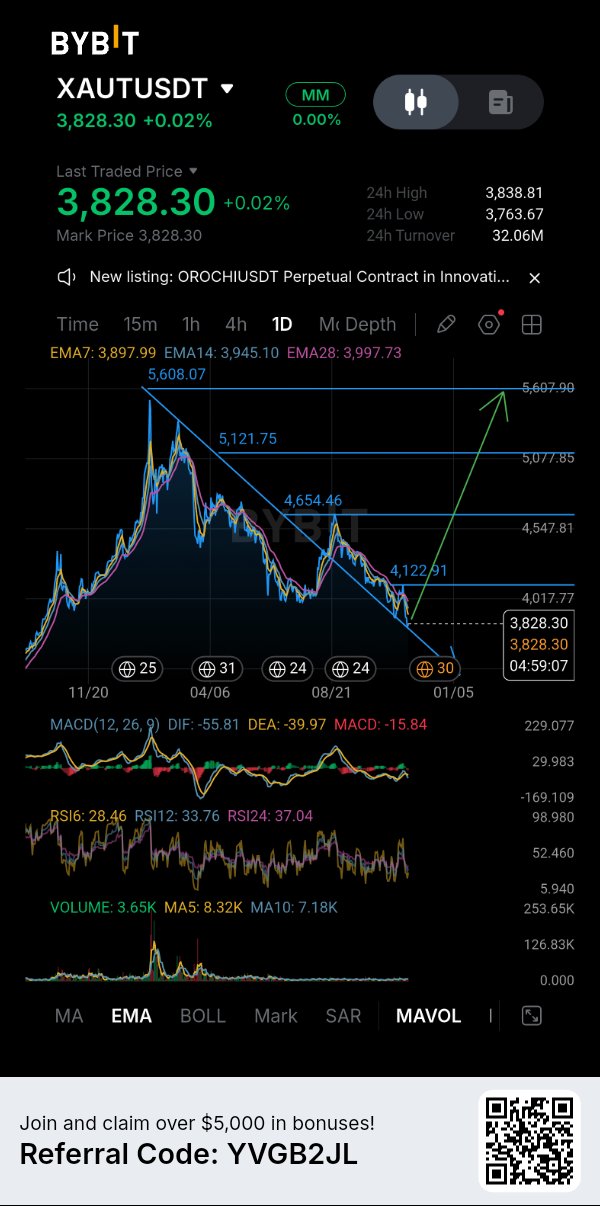
XAUT /GOLD 👉 BUY THE DIP 🚀
$XAUT UPDATE : GOLD IS LOSING MOMENTUM, BUT A RECOVERY COULD STILL BE ON THE TABLE. $XAUTUSDT is currently trading around $3,828, and the daily chart is showing some clear signs of weakness. The broader structure has been moving downward, with a sequence of lower highs and lower lows developing from the previous peak near $5,608. However, I don't think this is the right moment to completely dismiss a potential recovery. The price is aproaching an important short-term area, and I want to see how buyers react before making any strong directional assumption. Daily Market Structure📊 Most noticeable issue is that XAUT remains below all three visible EMAs. EMA7 is at $3,897.99, EMA14 at $3,945.10, and EMA28 at $3,997.73. This alignment tells me sellers still have the advantage, at least on the daily timeframe. descending trendline also remains an important obstacle. Until price breaks above it and establishes a stronger structure, I wouldn't consider the recovery confirmed. Momentum & Volume: RSI readings are worth watching. RSI6 is at 28.46, RSI12 at 33.76, and RSI24 at 37.04. short-term RSI is already in oversold territory, which could create room for a relief bounce. But oversold conditions alone don't guarantee a reversal. MACD is also still negative, with DIF at -55.81 and DEA at -39.97. The histogram remains below zero, suggesting bearish momentum hasn't fully disappeared. Volume is currently 3.65K, below both MA5 at 8.32K and MA10 at 7.18K. I would like to see stronger buying participation before trusting a sustained recovery. Bullish Scenario🟢 The first thing I want to see is buyers defending the recent low around $3,763.67. If that area holds and price starts reclaiming the EMA7 near $3,898, the next important recovery levels are $3,945 and $3,998. A stronger move above the EMA cluster, followed by a break of the descending trendline, would improve the daily outlook. Beyond that, $4,122.91 becomes an important higher resistance reference. Bearish Scenario🔴 If buyers fail to defend $3,763.67, another downward move becomes possible. In that situation, I wouldn't rush into buying simply because RSI is oversold. I'd rather wait for price to stabilize and show an actual change in momentum. For Traders Already Holding XAUT🎯 I'd personally pay close attention to the $3,898–$3,998 recovery zone. If price reaches this area, partial profit-taking could be worth considering depending on the entry and position size. I wouldn't assume the larger recovery projection toward $5,608 is guaranteed. That remains a possibility illustrated on the chart, not a confirmed target. Risk Management⚠️ recent low at $3,763.67 is the immediate level I'm watching. A breakdown below it would weaken the short-term recovery thesis. A bounce without confirmation is not a reliable entry. Entry, stop-loss, and risk-to-reward should be established before entering, with position sizing reflecting the risk involved. My overall view: XAUT is showing weakness, but oversold momentum could create an opportunity if buyers finaly step in. I'm more interested in confirmation than trying to catch the exact bottom. Would you consider buying a recovery above $3,898, or would you rather wait for a confirmed break of the descending trendline? #ByXIMPACT #WSOT2026 #WSOTShowYourAITradeToEarn10USDT #JensenHuangExitTestsNvidiasAILeadership #USPPITestsTheHigherForLongerTrade

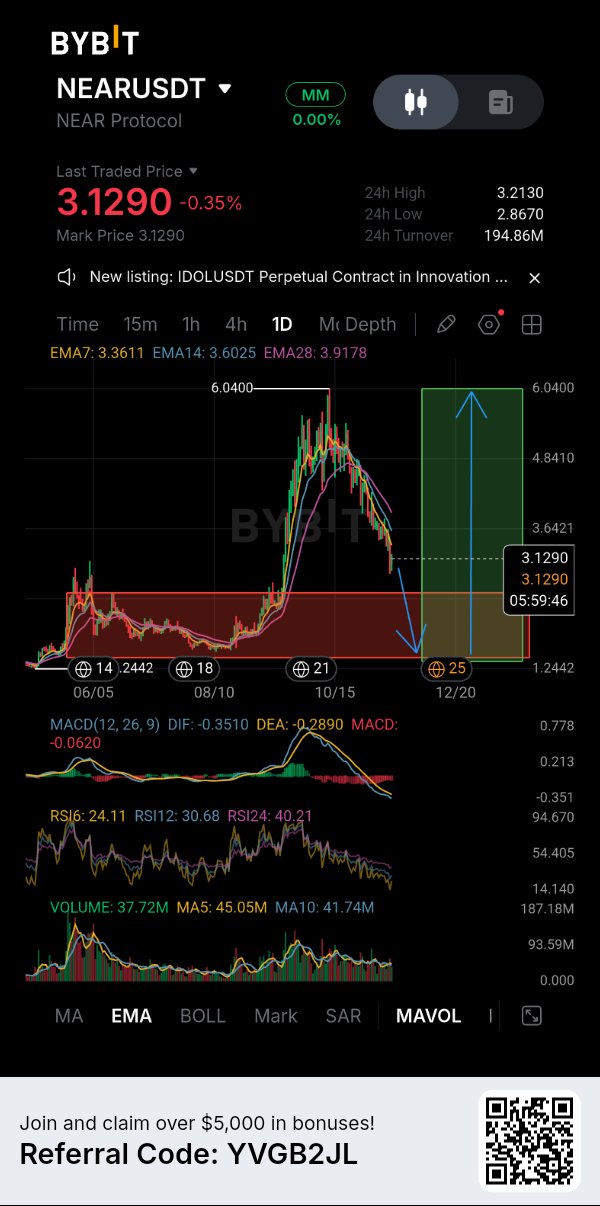
NEAR SPOT BUY 🟢 GREAT OPPortunity
$NEAR EMERGENCY UPDATE : DOWNTREND IS GETTING DEEPER, BUT I'M WATCHING THE BIGGER OPPORTUNITY💯 $NEARUSDT is currently trading around $3.129, and the daily chart is showing clear signs of weakness. After the strong rally toward $6.04, price has gradually lost momentum and sellers have taken control. What concerns me most is that NEAR is now trading below all three visible EMAs. The EMA 7 is at $3.3611, EMA 14 at $3.6025, and EMA 28 at $3.9178. This bearish alignment tells me that buyers still have some work to do before the recovery becomes convincing. MY BYBIT 👉 WHAT THE DAILY CHART IS TELLING ME📊 RSI is another important detail here. RSI 6 is sitting at 24.11, RSI 12 at 30.68, and RSI 24 at 40.21. Short-term momentum is clearly stretched toward oversold territory. Meanwhile, MACD remains negative, with DIF at -0.3510 and DEA at -0.2890. The histogram is also below zero. So, although a relief bounce is possible, I don't want to confuse oversold conditions with a confirmed trend reversal. TWO SCENARIOS I'M WATCHING🟢🔴 BULLISH SCENARIO🟢 First, I want to see NEAR defend its current lower price region and establish some buying strength. The first recovery area I'm watching is around $3.36, followed by $3.60 and $3.92, where the visible EMAs are positioned. Reclaiming these levels would gradually improve the daily structure. A stronger recovery could eventually bring the previous $6.04 swing high back into focus, but that's a much bigger possibility, not an immediate target. BEARISH SCENARIO🔴 If sellers continue pushing price lower, the recent 24H low around $2.867 becomes an important nearby reference. A sustained breakdown could expose the much wider historical support region visible around $1.24. The chart annotation also illustrates a possible deeper correction before a larger recovery. However, I would need to see actual price confirmation before treating that projection as a realistic trading setup. FOR TRADERS ALREADY HOLDING NEAR🎯 I wouldn't make decisions based on RSI alone. If price starts recovering toward the EMA resistance cluster, partial profit-taking could be considered depending on individual entry prices. For anyone looking to build a larger position, I'd prefer seeing a confirmed recovery rather than averaging down blindly during continued weakness. RISK MANAGEMENT⚠️ $2.867 area deserves attention as the recent daily low. Losing it could increase downside pressure. A bounce without confirmation isn't a reliable entry. Liquidity zones aren't automatically buying opportunities either. Entry, stop-loss, position sizing, and risk-to-reward should all be considered before taking a trade. MY FINAL THOUGHTS🤔 I still see potential for a larger recovery in NEAR, but the current daily structure isn't bullish yet. I'd rather wait for buyers to prove themselves than rush into a falling market. Sometimes protecting capital during a weak market is the best trade. Are you accumulating NEAR at these prices, or waiting for a deeper correction before considering an entry? #IMPACTbyTrade #WSOT2026 #WSOTShowYourAITradeToEarn10USDT #JensenHuangExitTestsNvidiasAILeadership #USPPITestsTheHigherForLongerTrade

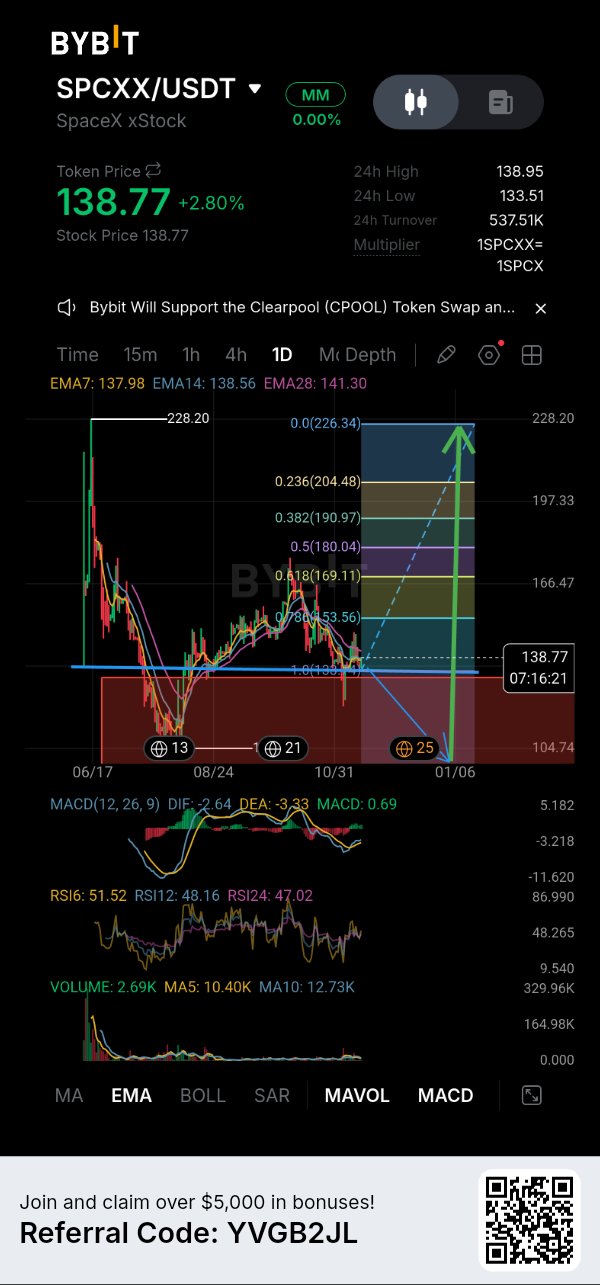
$SPCXX UPDATE 🚀
PRICE IS DEFENDING A CRITICAL SUPPORT ZONE, BUT THE BIGGER RECOVERY IS NOT CONFIRMED YET $SPCXXUSDT is currently trading around $138.77, up approximately 2.80%, and I'm paying close attention to how price behaves around this area. After the massive move toward $228.20, the chart went through a significant correction. We then saw a recovery, followed by another rejection and a gradual move back toward the lower support region. Now price is trying to stabilize around the $133–$139 area. This is an important region because it sits near the visible Fibonacci baseline and the recent price structure. Here's what I'm watching 👀 1. DAILY TECHNICAL STRUCTURE The chart is currently showing a mixed picture. Price is trading above EMA7 ($137.98) and EMA14 ($138.56), which suggests some short-term recovery. However, EMA28 remains higher at $141.30. That means buyers have made some progres but they still need to reclaim the longer EMA before I become more confident about a sustained recovery. RSI readings are also relatively neutral RSI6: 51.52 RSI12: 48.16 RSI24: 47.02 Momentum is improving slightly, but this is not an overbought breakout signal. MACD is showing a positive histogram reading of 0.69, while DIF (-2.64) and DEA (-3.33) remain below zero. This suggests early momentum improvement rather than a fully established bullish trend. One thing I don't want to ignore is volume. Current volume is 2.69K, below both MA5 (10.40K) and MA10 (12.73K). So far, the recovery does not have convincing volume confirmation. 2. BULLISH AND BEARISH SCENARIOS🟢🔴 BULLISH SCENARIO If buyers continue defending the $133–$139 region and price reclaims $141.30, I would start watching for a stronger recovery. visible Fibonacci levels provide the next upside reference points: $153.56 – 0.786 Fib $169.11 – 0.618 Fib $180.04 – 0.5 Fib $190.97 – 0.382 Fib A sustained move above these levels could gradually improve the broader structure. The larger chart also shows $204.48 and $226.34 as higher Fibonacci reference levels. However, these are potential recovery targets, not confirmed price destinations. BEARISH SCENARIO if price loses the $133 area and fails to reclaim it, the current recovery attempt could weaken. The chart highlights a broader lower region around $104.74. A deeper move toward that area cannot be ruled out if selling pressure increases. I would rather wait for price confirmation than assume every dip is an opportunity. 3. FOR TRADERS ALREADY HOLDING SPCXX I wouldn't approach this as an all-or-nothing decision. If price starts recovering toward $153.56, taking partial profits could be worth considering, depending on individual entry prices and risk exposure. For anyone targeting a larger recovery, I would want to see stronger volume and acceptance above the EMA28 before becoming more comfortable with that idea. RISK MANAGEMENT⚠️ $133 area is the immediate level I would monitor. A sustained breakdown below this region would weaken the short-term recovery thesis..A bounce without confirmation is not a reliable entry. Liquidity zones are not automatically buying opportunities either. Entry, stop-loss, and risk-to-reward should be established before entering. Position sizing also needs to reflect the risk involved. MY FINAL THOUGHTS💯 I can see some early signs of stabilization, but I don't think the chart has earned a strong bullish confirmation yet. The bigger recovery idea remains posible, but the difference between a temporary bounce and an actual trend reversal matters. I'd rather protect capital and wait for buyers to prove their strength than chase an early move. What do you think about here? Would you consider the $133–$139 region a potential accumulation area, or wait for a confirmed breakout above $141.30? Let's see..... ✅ #ByXIMPACT

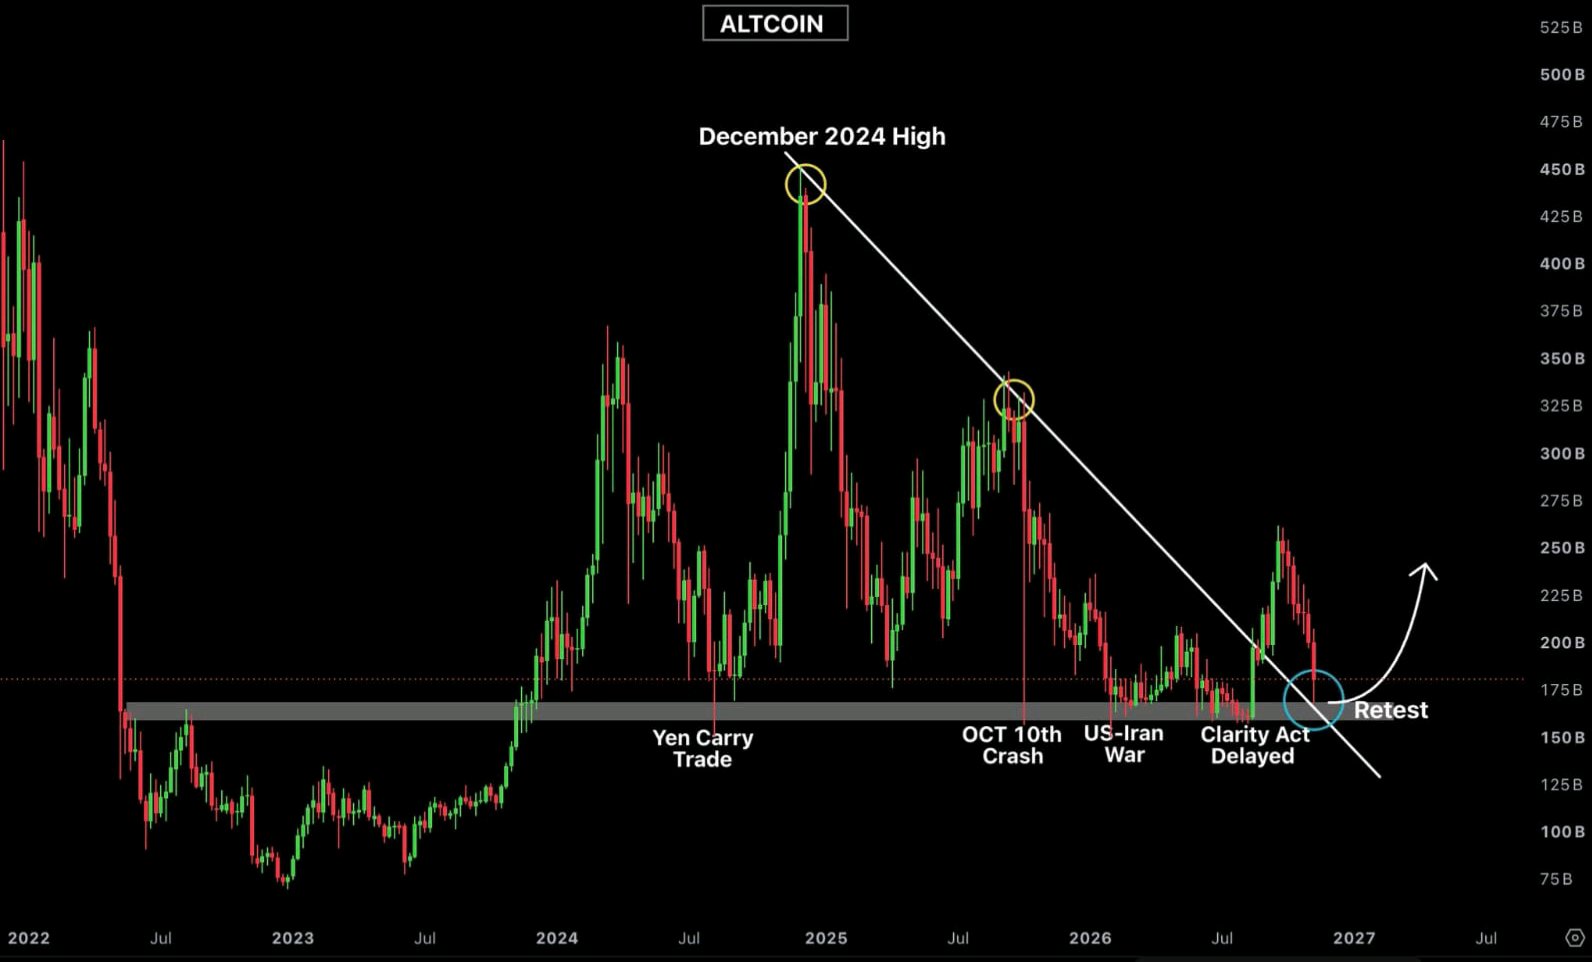
Are ALTs really coming soon?🤔
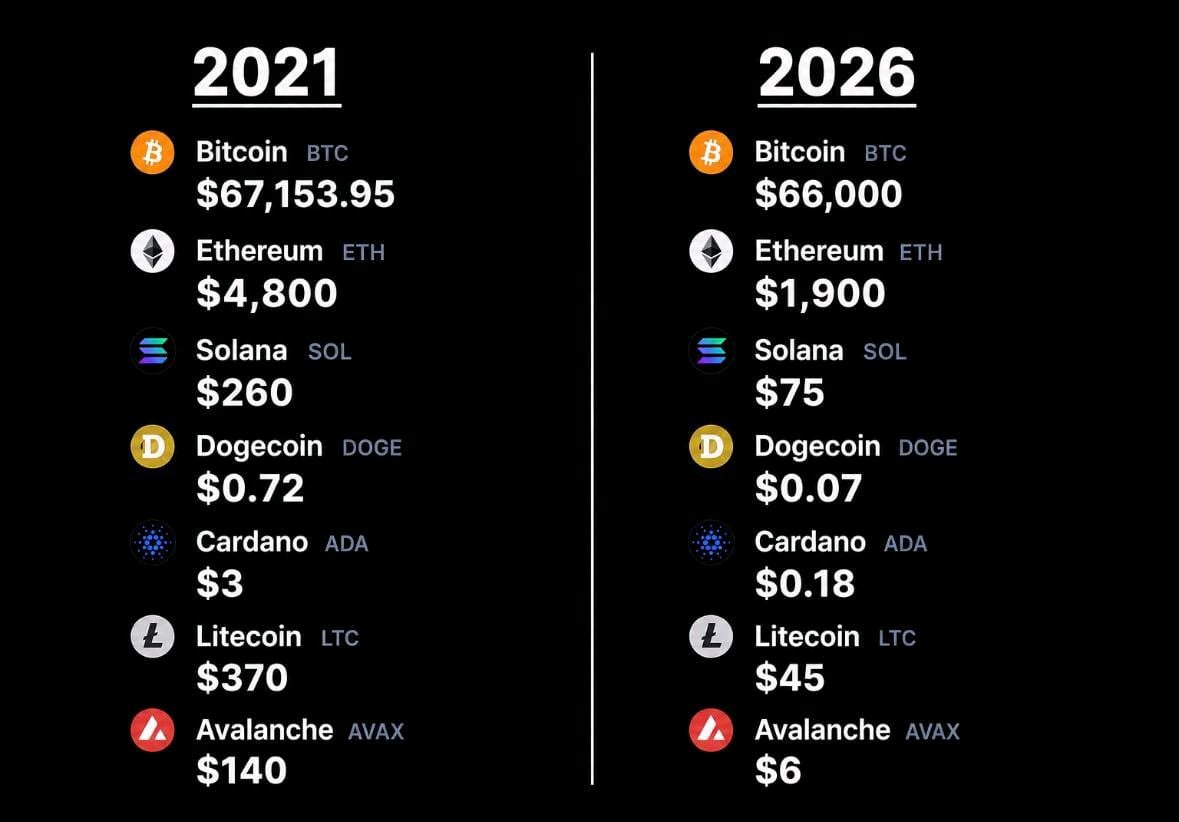
CRYPTO MARKET IS BEING TESTED AGAIN BUT HOW MUCH MORE PRESSURE CAN ALTCOINS TAKE ? REALLY, I keep wondering how many times a market can test the same support level before something finally changes. Altcoins are now testing an important support zone for the fifth time, and honestly, that makes this situation worth watching very closely. What makes this level interesting is not just the price action itself. It is everything that has hapened around it. This support has survived several major events, including the Yen carry trade unwind, the October 10 market crash, the US-Iran war, and the delay surrounding the CLARITY Act. Each of these events brought uncertainty into the crypto market, yet this particular level managed to hold. That tells us something about the importance of this zone. Buyers have repeatedly stepped in whenever prices approached it. But there is another side to consider. Every time support gets tested, traders naturally start questioning how much buying pressure remains. Holding five times is impressive, but it doesn't automatically guarantee a sixth bounce. Hmm, And this is where I think the bigger market picture becomes important. Since Trump took office, more than $1.4 trillion has reportedly disappeared from the total crypto market capitalization. The damage across major cryptocurrencies has been significant. $BTCUSDT is down 40%, $ETHUSDT has declined 46%, SOL has lost 73%, and XRP is down 71%. LINK has dropped 65%, while AVAX is down 82%. DOGE has fallen 85%, and ADA has suffered an even larger decline of 86%. These numbers are difficult to ignore. Even established cryptocurrencies have struggled to maintain their previous valuations. For altcoin investors, the situation has been particularly painful because many assets have experienced much deeper declines than Bitcoin. MEANWHILE, contrast with traditional markets is interesting. Gold has gained 48%, silver is up 64%, and global stock markets are trading near their all-time highs. Think about that difference for a moment. Capital hasn't necessarily disappeared from every market. Instead, different asset classes have experienced very different levels of demand and investor confidence. Crypto has clearly struggled to attract the same enthusiasm during this period. There is also an uncomfortable irony in calling someone the first pro-crypto President while looking at the performance of the crypto market during his time in office. Political support and actual market performance are two completely different things. A supportive political narrative cannot automatically protect investors from macroeconomic pressure, liquidity problems, or changing market sentiment. Still, I don't think the current situation should be viewed through pure negativity either. That fifth support test could become an interesting turning point if buyers manage to defend the level again. A successful bounce might help restore some confidence across altcoins. However, if the level finally breaks, the market could face another difficult period. PERSOALLY, I would rather wait for confirmation than asume the support will hold simply because it survived the previous four tests. The crypto market has already experienced enough uncertainty. Now the real question is whether buyers still have enough strength to defend this level. Another bounce is possible, but nothing is guaranteed. For now, patience and risk management matter more than optimism. next move from this support could tell us quite a lot about the market's underlying strength. market is volatile, so you have to manage your own risk.....👍⚠️ #ByXIMPACT #WSOT2026 #WSOTShowYourAITradeToEarn10USDT #JensenHuangExitTestsNvidiasAILeadership #USPPITestsTheHigherForLongerTrade

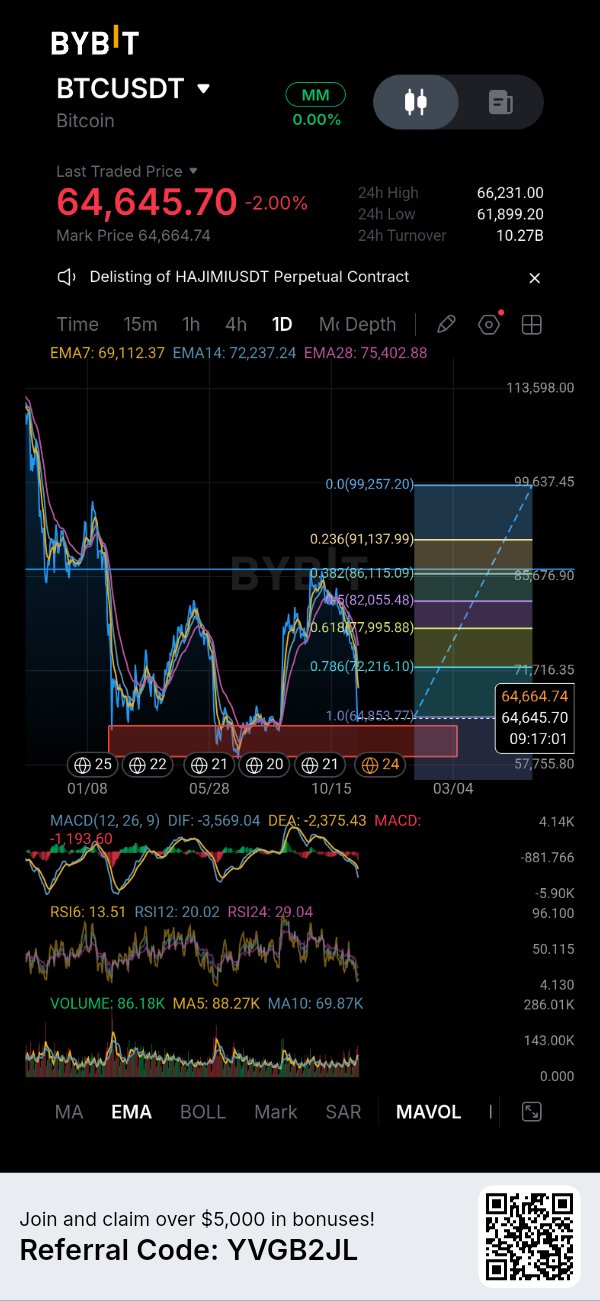
$BTC EMERGENCY UPDATE BTC Breaks Below $65K – oversold conditions are building, but Is the bottom In?🤔 $BTCUSDT is showing serious weakness on the daily timeframe, and I don't think this is the moment to blindly chase a bounce. BTC is currently trading around $64,645, down approximately 2% on the day. More importantly, price has slipped below the visible Fibonacci 1.0 level near $64,853, putting aditional pressure on an already weak market structure. Here's what concerns me: BTC is trading below all three visible EMAs. EMA 7: $69,112 EMA 14: $72,237 EMA 28: $75,402 This alignment tells me sellers still have control of the daily trend. Any recovery will need more than a few green candles to convince me that momentum is actually changing. Daily Technical Structure📊 RSI readings are particularly interesting right now. RSI 6 is at 13.51, RSI 12 at 20.02, and RSI 24 at 29.04. These readings show deeply oversold conditions across the displayed RSI periods. However, I want to make one thing clear: oversold doesn't automatically mean a bottom is confirmed. MACD also remains negative, with DIF at -3,569.04 and DEA at -2,375.43. The negative histogram reinforces the current bearish momentum. For now, the visible red demand zone around the upper-$50K to low-$60K region is an important area to monitor. If buyers manage to defend this region, a technical recovery could develop. Bullish vs Bearish Scenarios🟢🔴 Bullish Scenario i want to see BTC reclaim the $64,853 area first, followed by a stronger recovery above $66,231, the visible 24-hour high. If momentum improves, the first major recovery reference is the EMA 7 near $69,112. Beyond that, $72,216 becomes important because it aligns with the EMA 14 and the 0.786 Fibonacci level. A sustained recovery above these levels would make the bullish case more interesting. Bearish Scenario if BTC continues trading below $64,853 and selling pressure increases, the marked demand zone could become the next major test. A decisive breakdown through that region would weaken the possibility of an immediate recovery and could expose BTC to another leg lower. I would rather wait for a reaction from buyers than assume every dip is an opportunity. For Traders Already Holding BTC Personally, I would focus on protecting capital and managing exposure rather than making emotional decisions. Traders sitting on profitable positions may consider partial profit-taking during confirmed recovery attempts toward nearby resistance. Those holding for a larger move should reassess their exposure if the daily structure continues deteriorating. I would become more interested in rebuilding a larger position after BTC demonstrates support defense and a confirmed market structure shift. Risk Management⚠️ $64,853 Fibonacci level is an important immediate reference, while the marked demand zone is the bigger area to watch. A bounce without confirmation is not a reliable entry. Liquidity zones are not automatically buying zones either. Entry, stop-loss, and risk-to-reward should be established before entering, with position sizing adjusted to the risk involved. Final Thoughts BTC is deeply oversold, but the daily trend hasn't given buyers a convincing reason to celebrate yet. I still see the posibility of a relief bounce, but I don't want to confuse a temporary recovery with a confirmed reversal. Sometimes the best trade is simply waiting until the market shows its hand. Protecting capital matters more than catching the exact bottom. What's your approach here? Would you consider buying a confirmed bounce around the demand zone, or wait for BTC to reclaim $69K first? market is volatile, so you have to manage your own risk.....👍 #IMPACTbyTrade #BitcoinHitsTwoMonthLowAfterUSMidterms

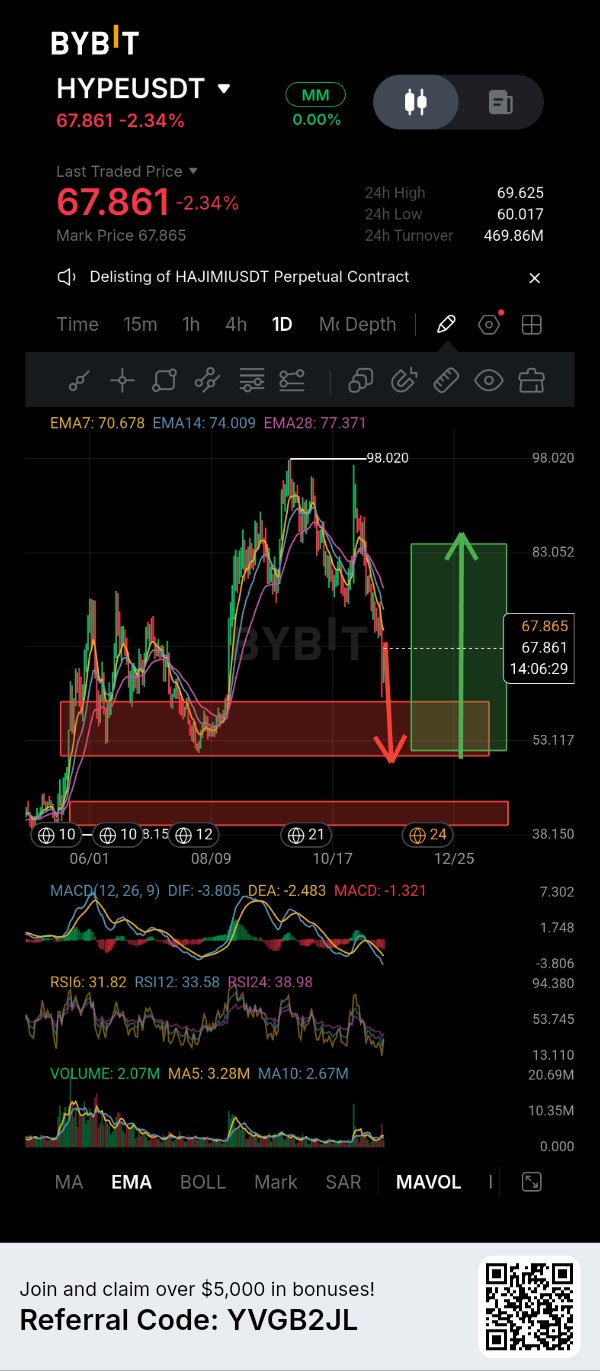
$HYPEUSDT EMERGENCY UPDATE a deeper correction could come before the next major recovery I'm watching $HYPEUSDT closely because the daily chart is showing increasing weakness, and I don't think this is the right moment to rush into a long position. HYPE is currently trading around $67.861, down 2.34%, after failing to maintain its previous bullish momentum. What concerns me most is the EMA structure. EMA 7 is at $70.678, EMA 14 at $74.009, and EMA 28 at $77.371. Price is trading below all three averages, which suggests sellers currently have control of the short-term trend. Daily Market Structure📊 rejection from the $98.020 swing high has gradually developed into a deeper correction. The recent price action also shows that buyers haven't managed to establish a convincing recovery. Momentum indicators aren't particularly encouraging either. RSI 6 is at 31.82, RSI 12 at 33.58, and RSI 24 at 38.98. These readings indicate considerable selling pressure, although they also suggest that the market is approaching oversold territory. MACD remains negative, with DIF at -3.805 and DEA at -2.483. The histogram is also negative at -1.321. Meanwhile, volume is 2.07M, below both MA5 and MA10. I would like to see stronger buying participation before trusting a meaningful recovery. Bearish Scenario 🟢 my main concern is the possibility of another downward move toward the $53–$58 demand zone marked on the chart. if the current recovery attempts fail and sellers continue pushing price lower, this region could become the next important area to watch. However, I wouldn't automatically consider it a buying opportunity. I want to see selling pressure slow down and buyers demonstrate that they can defend the zone. If that area fails, the lower marked support around $39–$43 becomes relevant. Bullish Scenario🔴 The bullish outlook isn't completely off the table, but HYPE needs to reclaim its EMA levels first. A recovery above $70.67 would be an initial improvement. Reclaiming $74 and subsequently $77.37 would provide stronger evidence that buyers are returning. If the broader daily structure improves, the $83 area becomes an important upside recovery target. For Traders Already Holding HYPE I wouldn't make decisions based on panic. Personally, I would reassess exposure if the daily weakness continues rather than blindly averaging down. If price eventually reaches the $53–$58 region and produces a convincing reversal, that could create a more interesting opportunity to rebuild exposure gradually. Risk Management⚠️ A bounce without confirmation isn't a reliable entry. The marked demand zones are areas to monitor, not guaranteed reversal points. Entry, stop-loss, and risk-to-reward should be established before entering, with position sizing reflecting the risk involved. My current approach is patience over prediction. HYPE may eventually recover, but protecting capital during a correction is just as important as capturing the next rally. Would you wait for HYPE to reach the $53–$58 demand zone, or do you think buyers can defend the current price and start a recovery? Let's see..... 🚀 #IMPACTbyTrade

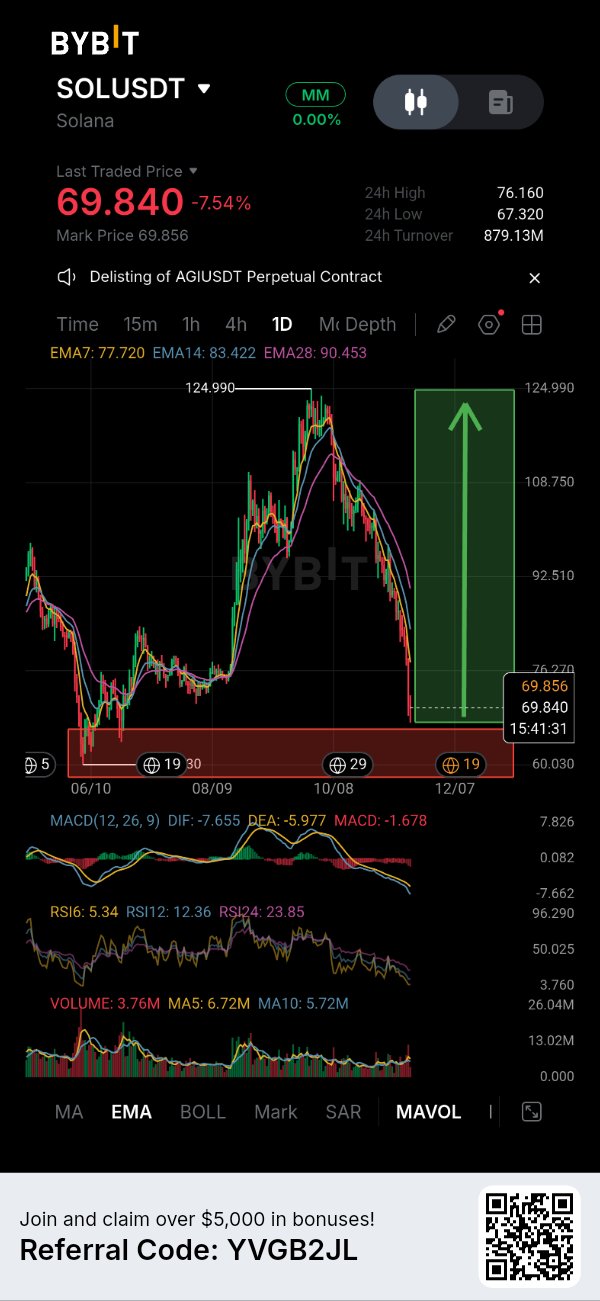
$SOLUSDT UPDATE market structure is under heavy pressure, but here is what I am watching. LOOKING AT THE 1D CHART ON BYBIT SOL is currently trading around $69.84, showing a notable 24-hour decline of -7.54%. Price action has experienced a sharp rejection from the local top near the 124.990 level, breaking down aggressively below the EMA lines (EMA7 at 77.720, EMA14 at 83.422, and EMA28 at 90.453). While the broader chart shows a highlighted gren zone pointing upward toward the 124.990 resistance, the immediate reality is that sellers are dominating short-term momentum, testing the lower red support band near the 60.030 region. Technical Analysis & Market Context📊 On the daily timeframe, the indicators reflect severe downward momentum. The MACD is deeply negative with expanding histogram bars (DIF: -7.655, DEA: -5.977, MACD: -1.678), confirming that bearish pressure remains strong. Meanwhile, the Relative Strength Index has plunged into extreme oversold territory, with RSI6 reading 5.34, RSI12 at 12.36, and RSI24 at 23.85. Volume has also spiked during this corrective phase, indicating active liquidation as price approaches the lower demand boundary. Two Possible Market Scenarios🟢🔴 Bullish Scenario for buyers to regain control, SOL needs to stabilize above the immediate support zone and form a confirmed reversal pattern on lower timeframes. A successful defense of this area could pave the way for a relief bounce toward the declining EMA cluster and the previous structural breakdown levels before attempting any larger recovery toward the upper targets. Bearish Scenario if the current support zone fails to absorb the selling pressure, the door opens to a deeper retracement toward the lower boundary of the visible range near 60.030. A breakdown here would require patience, and I would need to see clear bullish market structure confirmation before considering any new long setup. For Traders Already Holding SOL If you are already holding a position from higher levels, managing risk is critical right now. Chasing a falling knife or holding blindly without a plan can compound losses. Depending on your average entry, reassessing your exposure may be necessary if key support levels give way, and I'd rather wait for a verified bottoming structure than assume a bounce is guaranteed. Risk Management⚠️ A bounce without confirmation is not a reliable entry. Liquidity zones and oversold RSI readings should not automatically be treated as buy zones. Entry, stop-loss, and risk-to-reward paramters should be strictly defined before entering any trade. Position sizing must reflect the high volatility currently present in the market. Sometimes waiting for confirmation creates a better opportunity than entering too early. Protecting capital matters more than chasing every move. Would you buy this retracement here, or would you wait for a confirmed market structure shift? LET'S See......🚀 #IMPACTbyTrade

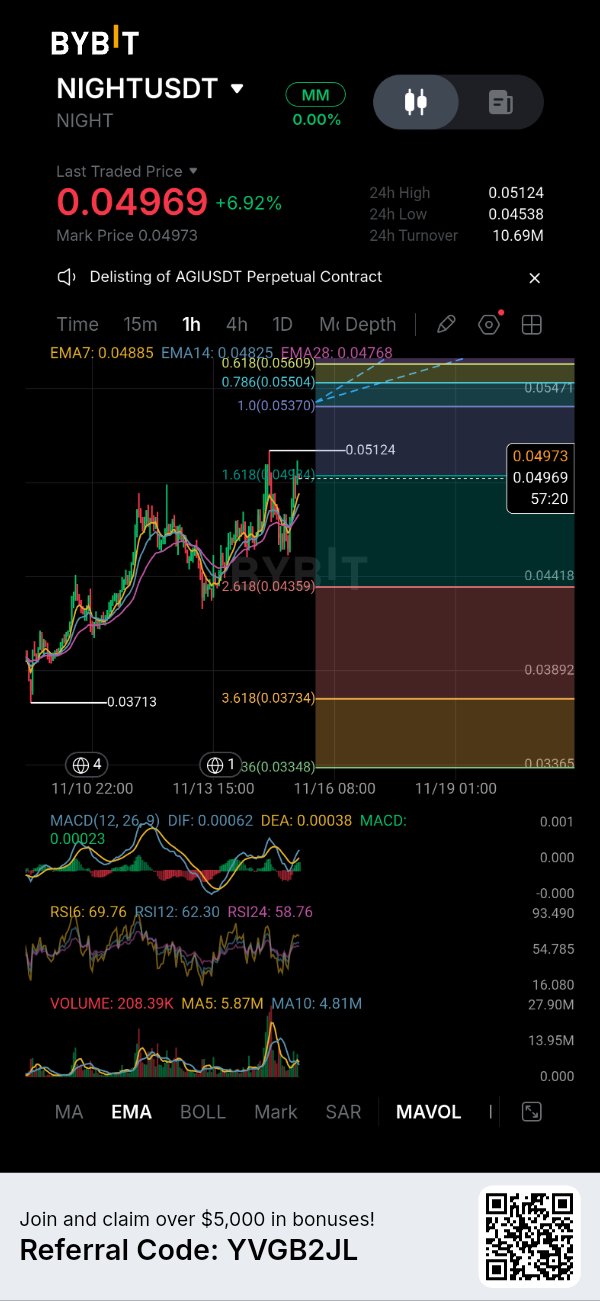
$NIGHTUSDT market update testing key fibonacci extension levels after a sharp impulsive leg Here's what I'm watching on $NIGHT right now. After a powerful impulsive recovery from the 0.03713 low, the price has pushed up to test the 0.04969 level, showing a 24-hour gain of +6.92% on the 1-hour timeframe. While the overall upward momentum remains active, price action is currently interacting with critical retracement and extension levels that dictate whether we see a continuation or a local consolidation. I'm not rushing into a new position here; I'd rather protect my capital than chase the move while indicators show heightened momentum. Technical Analysis Looking at the 1-hour timeframe visible on the chart, price action is currently hovering around the 1.618 Fibonacci extension level at 0.04944, right near the 0.04973 mark. Moving Averages & Momentum: The EMA7 (0.04885) and EMA14 (0.04825) are positioned just below the current price, acting as dynamic support, while the EMA28 sits further back at 0.04768. The MACD indicator shows a narrowing histogram with DIF (0.00062) and DEA (0.00038) pointing to a slight deceleration in immediate momentum after the aggressive climb. Meanwhile, the RSI sub-indicators are elevated—RSI6 sits at 69.76, RSI12 at 62.30, and RSI24 at 58.76—suggesting the market is approaching locally overbought conditions without yet showing a hard reversal signal. Support & Resistance Zones immediate support is established around the 0.04880–0.04900 region (confluent with the fast EMAs and recent local consolidation). On the upside, overhead resistance looms near the 0.05124 (24h high) and higher Fibonacci extension bands up toward 0.05471 and the 0.05609 region. Two Possible Market Scenarios Bullish Scenario for buyers to regain total control and push toward the 0.05124 high and subsequent Fibonacci resistance layers, we need to see a sustained holding above the 0.04944 level followed by expanding volume on a breakout past the 0.05124 threshold. Confirmation via a strong 1-hour candle close above local resistance would pave the way for a test of higher targets. Bearish Scenario if buyers fail to defend the immediate 0.04880 support cluster and the 1.618 extension level fails to hold as support, a deeper retracement toward the 0.04418 support zone or lower structural imbalance areas could open up. A breakdown below the fast EMAs would signal short-term exhaustion, requiring patience and waiting for a confirmed market structure shift before considering any new long entries. For Traders Already Holding $NIGHT If you are already positioned in $NIGHT from lower levels, managing risk around this 1.618 Fibonacci extension is crucial. Taking partial profits near current levels (around 0.04969–0.04973) makes sense to lock in gains after a rapid upward push, while letting a runner target the 0.05124 daily high or higher extension levels. However, if price slips back below the short-term EMA bands, reassessing the position and tightening stop-losses will help protect accumulated profits. Risk Management⚠️ The immediate invalidation level for the aggressive short-term bullish thesis lies below the rising EMA support structure and the local swing base. A bounce without volume confirmation is not a reliable entry. Entry, stop-loss, and risk-to-reward ratios must be established prior to opening any new exposure. Position sizing should strictly reflect the voltility inherent in lower-cap assets testing upper extension levels. A delayed target or local consolidation doesn't necessarily mean a failed trend, but protecting capital matters more than chasing every green candle. Would you take partial profits here at the extension level, or wait for a confirmed breakout above the 24H high? Let's see..... 🤔 #IMPACTbyTrade

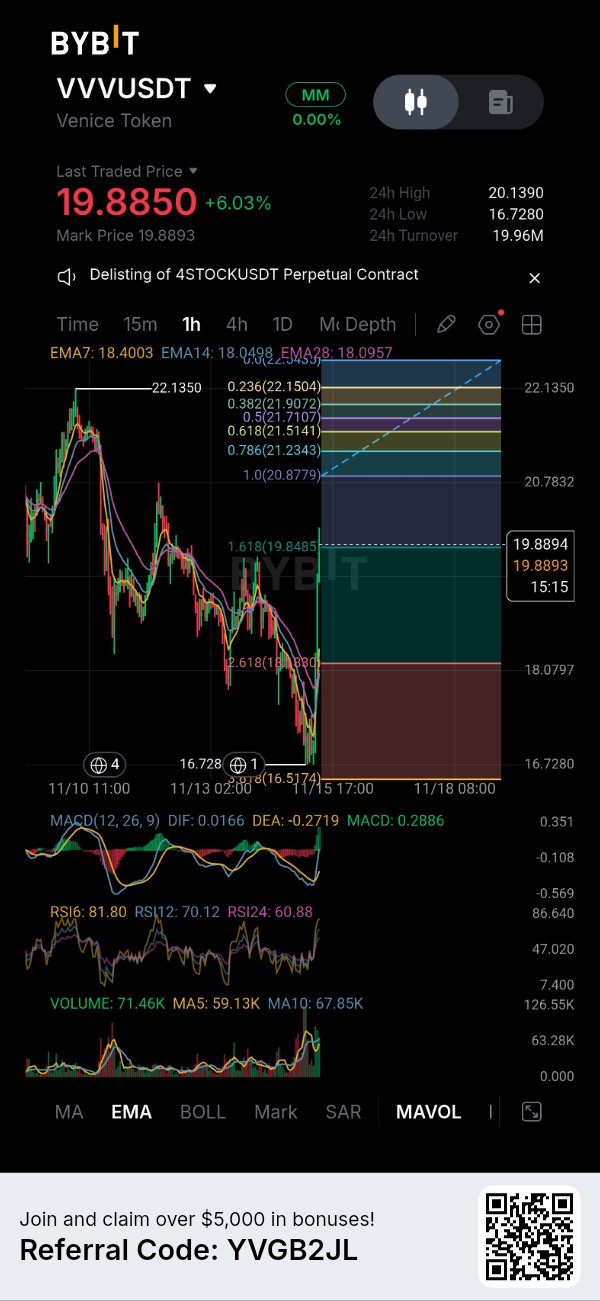
$VVV shortterm weakness and support defense at play MY BYBIT 1H CHART IS SAYing....👇 Here's what I'm watching on $VVVUSDT right now. The token is trading around 19.8850, showing a 24-hour gain of +6.03% with a 24-hour high of 20.1390 and a low of 16.7280. While the broader price action reflects a sharp swing following the recent low of 16.7280 down on 11/13, I'm not rushing into a position yet. My plan is to wait for confirmation before making a move. Technical Breakdown & Market Context Looking at the 1H timeframe displayed on the chart, we can see the EMA lines (EMA7 at 18.4003, EMA14 at 18.0498, and EMA28 at 18.0957) have recently crossed back as price bounced sharply from the 16.7280 support area. Buyers defended that lower boundary aggressively, sparking a recovery towards the 19.88 zone At the same time, the Fibonacci extension and retracement levels mapped on the chart highlight overhead resistance. The price is currently interacting around the 1.618 level near 19.8485. MACD shows a positive crossover developing (MACD 0.2886), while the RSI sub-indicators (RSI6 at 81.80, RSI12 at 70.12, and RSI24 at 60.88) indicate that short-term momentum has heated up significantly into higher zones, suggesting a potential cooling-off period or local consolidation is needed Two Possible Market Scenarios Bullish Scenario: For buyers to regain full control and push for a continuation, $VVV needs to consolidate above the 19.84–19.88 area and break cleanly past the immediate local resistance. A sustained move higher would open up paths toward testing the upper Fibonacci resistance zones visible on the chart near the 21.00 to 22.13 range. Bearish Scenario: If buyers fail to sustain momentum at these levels, a retracement back toward the EMA cluster (roughly 18.04 to 18.40) is entirely possible. A breakdown below these moving averages and a failure to defend the intermediate support zones would open the door to a retest of the lower demand structure near the 16.7280 baseline For Traders Already Holding $VVV If you are already positioned in $VVV from lower levels, managing risk here is crucial given the rapid bounce from 16.7280. Taking partial profits around the current 1.618 Fibonacci extension zone (near 19.84) makes a lot of sense to lock in gains. However, holding a runner while protecting remaining capital with a breakeven stop loss allows you to see if the structure can challenge higher targets. Risk Management A sharp rejection from the current resistance zone without consolidation would weaken the immediate bullish thesis. Chasing an asset after an aggressive multi-percent bounce without confirmation is not a reliable entry strategy. Entry levels, invalidation points, and risk-to-reward ratios must be clearly defined before committing capital. Final Conclusion Protecting capital matters more than chasing every green candle, and sometimes waiting for a healthy pullback or structural confirmation creates a much cleaner opportunity than entering mid-move. Would you take partial profits at current resistance, or are you waiting for a confirmed retracement before entering? #IMPACTbyTrade

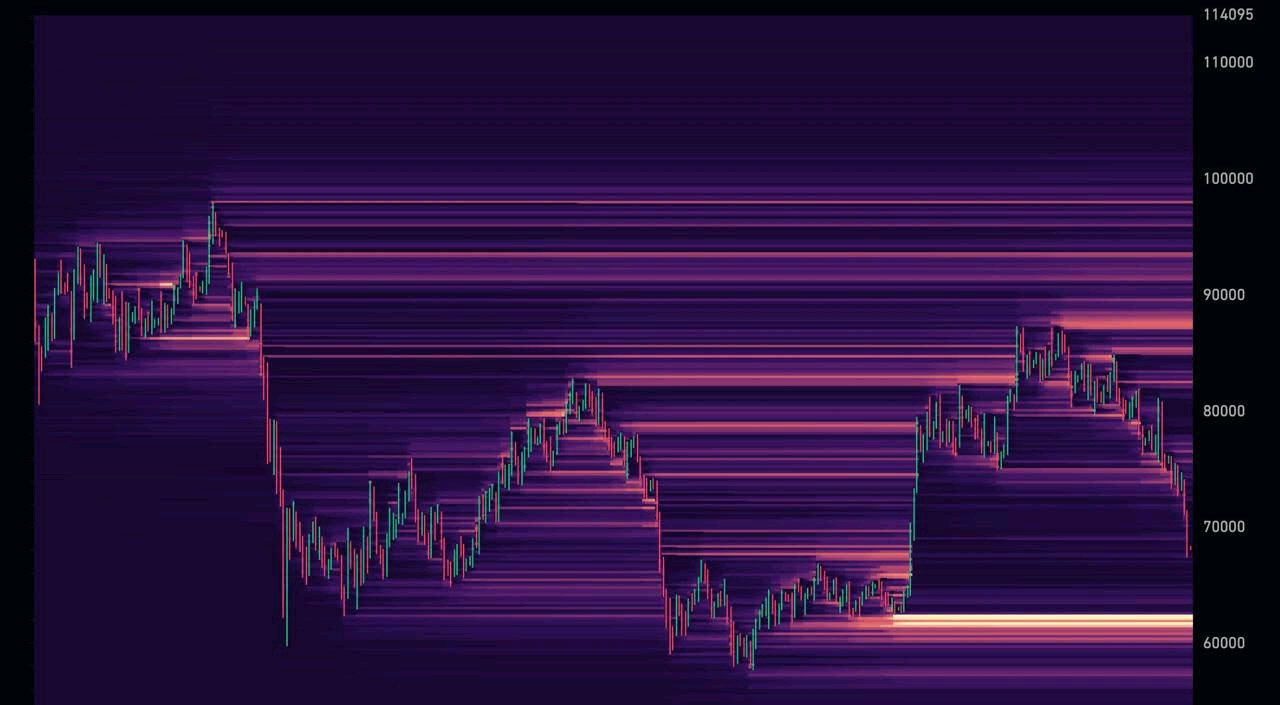
BITCOIN UNDER PRESSURE: IS $60K THE NEXT LIQUIDITY TARGET? Hmm, I keep wondering whether the current Bitcoin decline is simply another correction or something that could develop into a deeper market reset. The way $BTCUSDT has been moving lately makes it difficult to ignore the possibility of another downside move, especially with the $60,000 liquidity zone attracting so much attention. Bitcoin recently broke below $65,000, marking a fresh three-month low. The decline is becoming more noticeable when we look at the broader picture. BTC has dropped approximately 13.5% in just one week and is now more than 20% below its late October levels. That's not a small correction anymore, and naturally, market participants are becoming more cautious. But what is actually putting pressure on the market? One major concern is institutional demand. Spot Bitcoin ETFs have reportedly recorded seven consecutive days of outflows. This matters because ETF demand has become an important part of Bitcoin's market structure. When those flows remain negative for several sessions, it can add pressure to an already weak market. Then there is the macroeconomic situation. Hot CPI data has increased concerns about a potential December Fed rate hike. At the same time, the 10-year Treasury yield has reached 5.15%, while the US dollar is trading near a seven-month high. These conditions can make risk assets less attractive, and Bitcoin is certainly not immune to that pressure. INTERESTINGLY, onchain analyst James Check describes this as the fourth capitulation event since Bitcoin's all-time high. He also suggests BTC has entered a deep-value zone similar to conditions seen in February and June. That perspective is worth considering, but I wouldn't automatically interpret oversold conditions as a signal that the bottom is already in. RSI is currently around 22, while the Fear and Greed Index sits at 13. Both readings reflect serious market weakness. However, markets can remain oversold longer than many traders expect, particularly when liquidity is thin and macroeconomic uncertainty remains elevated. TECHNICALLY, I am watching three important areas🤔 FIRST $62,750, which represents the August low. If selling pressure continues, this could become the next important area to watch. Below that, $60,000 stands out as a major liquidity zone. A move toward that level could trigger further liquidations and create additional volatility. On the upside, reclaiming $67,900, around the 200-week average mentioned in the market analysis, would be an important early sign of stabilization. For now, I also think shorting weaker altcoins is something traders may consider, but chasing every downward candle can be dangerous. Weekend liquidity can amplify moves in both directions, and sudden reversals are always possible. Personally, I don't want to assume that $60K is guaranteed, but I also don't see enough confirmation to confidently call this the bottom. Sometimes the better decision is simply to wait for the market to reveal its next move. Would you start buying around these levels, or keep some capital ready in case Bitcoin visits $60K? The market is volatile, so you have to manage your own risk. These are personal market observations, not financial advice or a recommendation to buy or sell. Always do your own research. #IMPACTbyTrade #WSOT2026 #WSOTShowYourAITradeToEarn10USDT #BitcoinHitsTwoMonthLowAfterUSMidterms


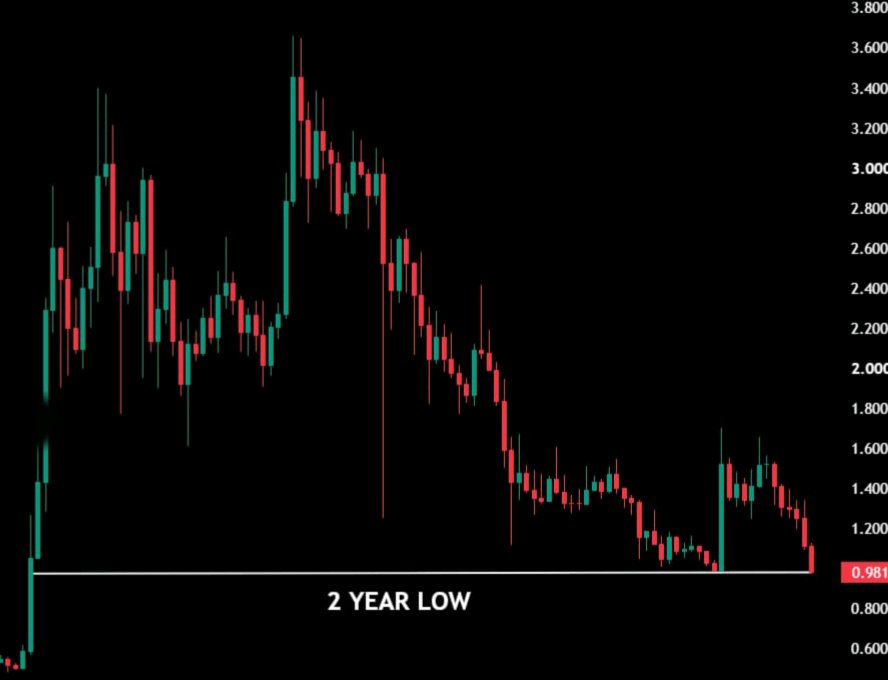
2 YEAR LOW FOR $XRP TODAY ON 1W CHART 🔴
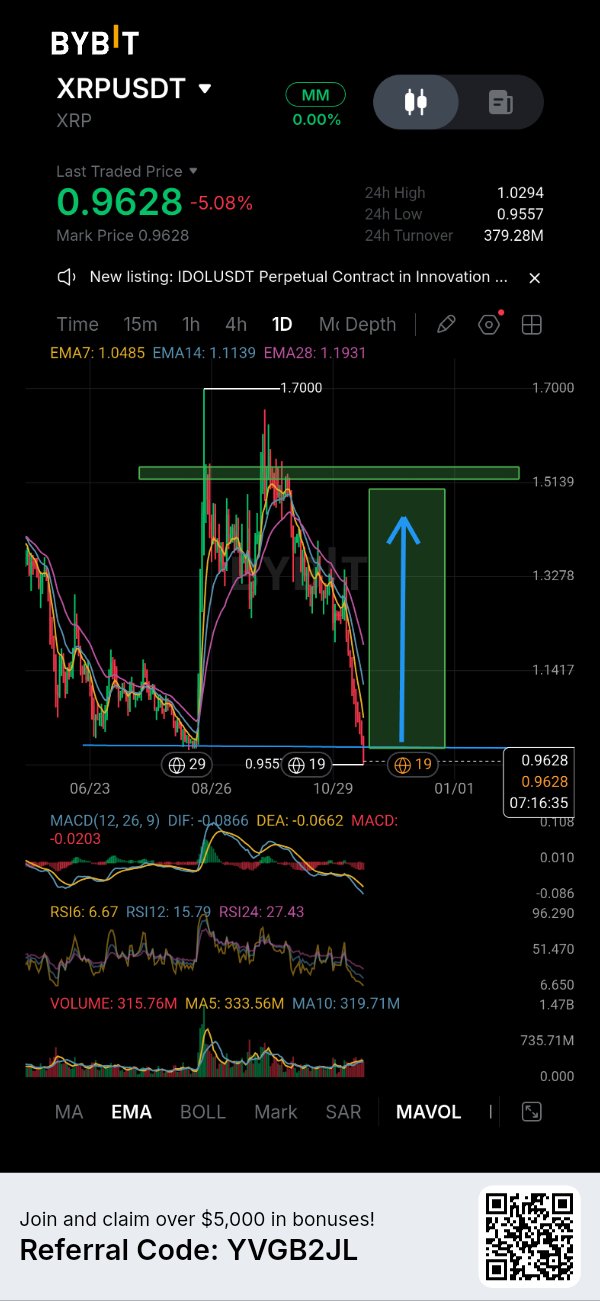
BUY THE DIP $XRPUSDT 💯 🟢 MY BYBIT 1D CHART IS SAYing....👇 $XRP MARKET UPDATE Shortterm weakness is testing key levels, but patience matters🤔 LOOKING AT THE CURRENT daily chart on XRPUSDT price is trading at 0.9628, down -5.08% on the session, after a sharp corrective pullback from higher levels. The market is showing clear short-term weakness, driven by active downward momentum as price trades below the key moving averages (EMA7 at 1.0485, EMA14 at 1.1139, and EMA28 at 1.1931). While the broader structure still reflects a significant past expansion toward the 1.7000 resistance region, the immediate price action is testing critical structural boundaries. I'm not rushing into a position here, as catching a falling knife without confirmation rarely yields a clean risk-to-reward setup. TECHNICAL ANALYSIS 📊 on the lower and daily timeframes visible in the chart, price is hovering just above structural support near the 0.9557 swing low, which aligns with the 24-hour low of 0.9557. Sellers have dominated recent candles, pushing momentum indicators into extreme territory. Specifically, RSI6 is sitting deeply oversold at 6.67, while RSI12 (15.79) and RSI24 (27.43) confirm widespread downward pressure. Furthermore, the MACD indicator shows ongoing bearish expansion with DIF at -0.0866 and DEA at -0.0662. However, extreme RSI readings like these often hint at potential exhaustion, making this a crucial area where buyers need to step in and defend the support zone to prevent a deeper breakdown. Two Possible Market Scenarios BULLISH SCENARIO for buyers to regain control, price needs to stabilize above the 0.9557 support floor and form a clear structural base or higher low. A successful defense here must be followed by a reclaim of the psychological 1.0000 handle and a push back toward mid-range resistance and the moving average clusters to validate a recovery toward higher targets. BEARISH SCENARIO if the 0.9557 support fails to hold under continued selling pressure, the door opens to a deeper retracement toward lower historical demand zones visible on the daily timeframe. A clean breakdown would invalidate the immediate stabilization thesis, requiring patience for a confirmed market structure shift before considering any long exposure. For Traders Already Holding XRP🎯 Managing an existing holding in this environment requires evaluating whether your original thesis accounts for this volatility. If you are already positioned, chasing more risk here is rarely wise. Instead, monitor how price reacts around the 0.9557 structural support. Partial profit-taking or risk reduction may have made sense during higher expansions, but at these current levels, forcing a decision without seeing how buyers handle this test could lead to reactive mistakes. Reassessing the position is only justified once a clear recovery or breakdown confirmation occurs. RISK MANAGEMENT remains paramount. A bounce without confirmation is not a reliable entry, and support levels should never be treated as guaranteed buy zones. Entry parameters, stop-loss placement based on invalidation below key structural lows, and strict position sizing must be established before committing capital. Protecting capital matters more than chasing every move. Would you buy the retracement here or wait for a confirmed market structure shift? LET'S See......👍 #IMPACTbyTrade

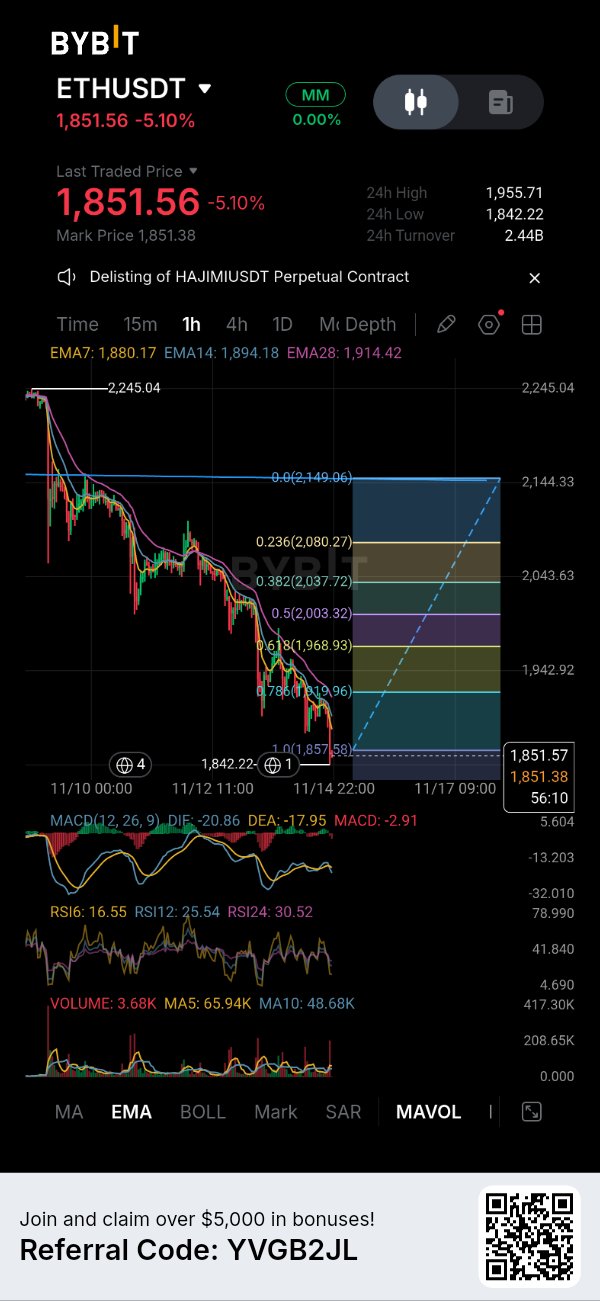
Hmm Really..... 🤔 Institutions are going ALL in on $ETHUSDT but I think there's something more interesting happening beneath the surface. Why focus only on buying ETH when the technology itself is still evolving? Ethlabs proposing to bring quantum resistance forward to 2027 caught my attention. By removing faster block times from the Hegotá upgrade, the focus shifts toward post-quantum cryptography and long-term security, especially as AI driven risks grow. Honestly, faster transactions matter, but protecting the network's future matters too. Ethereum seems to be thinking beyond today's demands. The real question is how well it can turn that vision into reality. MY BYBIT 1H CHART IS SAYing....👇 $ETHUSDC has experienced a sharp, sustained corrective move down to 1,851.56, wiping out value over the past few sessions with heavy downside momentum. Looking at the hourly chart, price is trading well below all major moving avrages, including the EMA7 at 1,880.17 and EMA28 at 1,914.42, confirming that sellers remain firmly in control of the near-term trend. YES RIGHT NOW i won't chase this aggressive drop by trying to catch a falling knife. However, price has reached the 1.0 Fibonacci extension level sitting around 1,857.58 (with a daily low marked at 1,842.22), and momentum indicators like the RSI6 are deeply oversold down at 16.55. This is where my plan becomes interesting, but it remains a conditional setup rather than an immediate market entry. I want to see whether buyers can step in to defend this immediate structural floor around the 1,842 to 1,857 region. If we print a clear bullish reaction, a liquidity sweep, or a higher-low confirmation on lower timeframes, a relief bounce toward the initial resistance zones and previous Fibonacci retracement levels..... such as the 0.786 around 1,919.96 could materialize. MY RISK MANAGEMENT is strict here. Any sustained breakdown below the recent low of 1,842.22 invalidates the defensive thesis entirely, as it would signal continuing continuation of the macro downtrend without a meaningful base. I am patiently watching how price reacts at these levels before committing any capital💯 #IMPACTbyTrade #WSOT2026 #WSOTShowYourAITradeToEarn10USDT #DeutscheBankLaunchesDigitalAssetCustody #USPPITestsTheHigherForLongerTrade

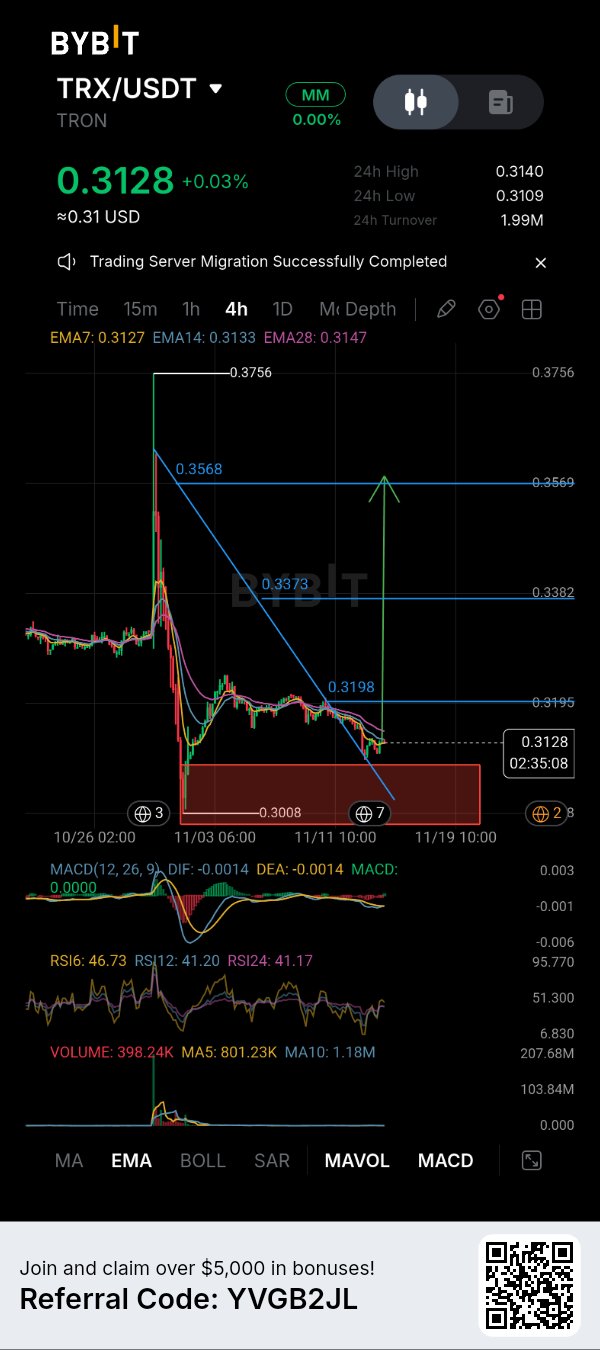
$TRX MY BYBIT 4H CHART IS SAYing....👇
$TRX buyers are defending support but a stronger recovery still needs vonfirmation $TRXUSDT IS CURRENTLY trading around $0.3128 on the 4H chart, and I'm watching this area closely because the market is approaching an important decision point. After the sharp spike toward $0.3756, price experienced a significant correction and gradully lost momentum. The recovery attempts have remained relatively weak, while the overall short-term structure continues to show downward pressure. HOWEVER something worth watching is the reaction around the $0.3008 demand area. Buyers have managed to keep price above this zone so far, and the latest candles suggest some stabilization. I wouldn't call this a confirmed reversal yet, but the selling pressure appears less aggressive than during the initial decline. 4H TECHNICAL ANALYSIS 📊 👉 EMA structure still deserves attention. EMA7 is around $0.3127, EMA14 at $0.3133, and EMA28 near $0.3147. Price is sitting around the shortest EMA but remains below the other two. This suggests that buyers are attempting to regain short-term control, although the broader 4H momentum has not fully shifted bullish. 👉 RSI readings are also showing a relatively weak position: RSI6 at 46.73, RSI12 at 41.20, and RSI24 at 41.17. There is room for recovery, but momentum hasn't reached a convincing bullish level. 👉 MACD is hovering around neutral territory, with DIF and DEA both near -0.0014. The histogram is close to zero, suggesting that bearish momentum may be slowing, but a stronger bullish crossover and follow-through would make the recovery more convincing. Two Possible Scenarios 🟢BULLISH SCENARIO my first focus is the $0.3198 resistance. A convincing 4H breakout and successful retest of this level could create room for a recovery toward $0.3373. If buyers manage to reclaim that area, the next visible resistance is around $0.3568. I would rather wait for a confirmed breakout than anticipate one. 🔴 BEARISH SCENARIO if TRX fails to reclaim $0.3198 and selling pressure returns, another test of the $0.3008 demand zone becomes possible. A decisive breakdown below this area would weaken the current recovery thesis considerably. For Traders Already Holding TRX I would personaly watch the $0.3198 level before becoming more optimistic. Traders holding from lower levels could consider partial profit-taking near resistance rather than assuming an immediate continuation toward higher targets. A stronger position would require confirmation through reclaimed resistance and improving momentum. RISK MANAGEMENT ⚠️ $0.3008 area is the important visible downside reference. A bounce without confirmation is not a reliable entry. Demand zones are not guaranteed reversal points, so entry, stop-loss, position sizing, and risk-to-reward should be planned before taking a trade. My view is that TRX is showing early signs of stabilization, but the 4H structure still needs work. I don't want to chase a small bounce and get caught in another rejection. Sometimes protecting capital and waiting for the market to prove its direction is the better trade. What's your approach here? Would you consider buying a confirmed breakout above $0.3198, or wait for another test of $0.3008? #IMPACTbyTrade #DeutscheBankLaunchesDigitalAssetCustody #WSOTShowYourAITradeToEarn10USDT #WSOT2026

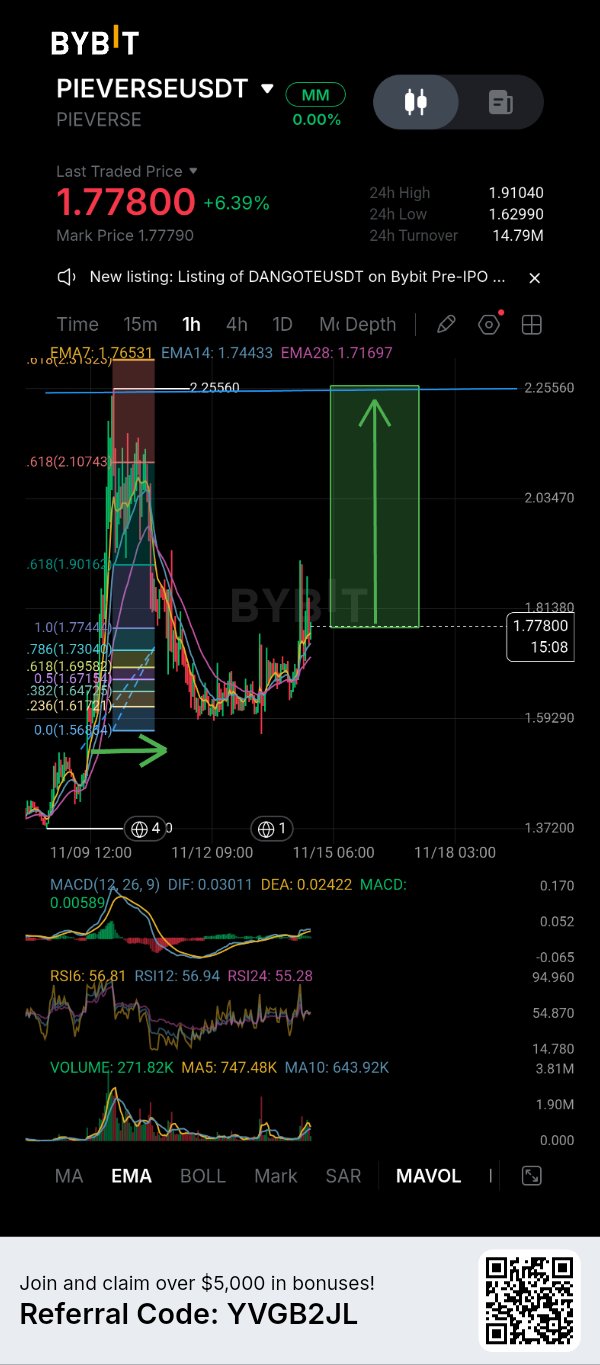
MY BYBIT 1H CHART IS SAYing....👇
My previous analysis has successfully followed its projected path, just as I showed on the chart💥 $PIEVERSEUSDT buyers are regaining control but next resistance will be important✅ $PIEVERSEUSDT is showing an interesting recovery on the 1H chart. After the previous rejection from the $2.25 area, price went through a noticeable correction and eventually found support around the $1.56–$1.60 region. Since then, buyers have gradually stepped back in, and the latest move has pushed price toward $1.778, currently showing a 6.39% gain. What I find interesting here is that the recovery is not just about one green candle. Price has started moving back above the shortterm EMA structure, which suggests that momntum is improving. However, I don't want to confuse a strong recovery with a confirmed breakout just yet. 1H TECHNICAL STRUCTURE shortterm EMA levels are looking constructive EMA7: $1.76531 EMA14: $1.74433 EMA28: $1.71697 PRICE is currently trading above all three EMAs, which gives buyers a better short-term position. The $1.7744 Fibonacci level is also an important area to watch around the current price. RSI readings are sitting around 55–57, showing improving momentum without entering an extremely overbought condition. MACD is also positive, with DIF at 0.03011 and DEA at 0.02422. This supports the recovery, although I would still like to see stronger volume behind the move. BULLISH SCENARIO if buyers can maintain price above the $1.765–$1.774 region and reclaim the nearby $1.8138 resistance, the next important area becomes $1.9016–$1.9104. A convincing breakout above that zone could open the door toward higher Fibonacci levels around $2.0347 and $2.1074. chart also shows a larger upside projection toward $2.2556. I see that as a potential extended target rather than something the market is guaranteed to reach. BEARISH SCENARIO on the other hand, if price fails to hold the current recovery, I will be watching $1.7443 and $1.7304 first. Losing those areas could expose the $1.7169 EMA28 region. A deeper correction could bring price back toward $1.6958 and potentially the previous demand area around $1.56–$1.60. That would weaken the immediate bullish structure and require buyers to prove themselves again. FOR Traders Already Holding PIEVERSE I would avoid getting too aggressive after a 6% recovery. If price approaches $1.90–$1.91, taking partial profits could be worth considering, especially if momentum starts slowing down. For anyone looking toward the larger $2.25 projection, I would prefer to see a confirmed breakout and sustained buying pressure first. RISK MANAGEMENT ⚠️ a bounce without confirmation is not a reliable entry. I would rather watch how price behaves around the EMA support cluster than chase an extended candle. Entry, stop-loss, position sizing, and risk-to-reward should all be planned before entering. The market is volatile, so you have to manage your own risk. My Overall View💯 PIEVERSE is showing encouraging short-term strength, and the recovery structure currently favors buyers. But the real test is whether they can push through $1.8138 and eventually challenge the $1.90 resistance zone. I don't think chasing price is necesary here. Sometimes waiting for confirmation gives a much better opportunity than entering simply because the candles look bullish. What would you prefer here: buying a pullback around the EMA support zone or waiting for a confirmed breakout above $1.8138? Follow for more chart updates......👍 #ByXIMPACT #DeutscheBankLaunchesDigitalAssetCustody #WSOT2026 #WSOTShowYourAITradeToEarn10USDT

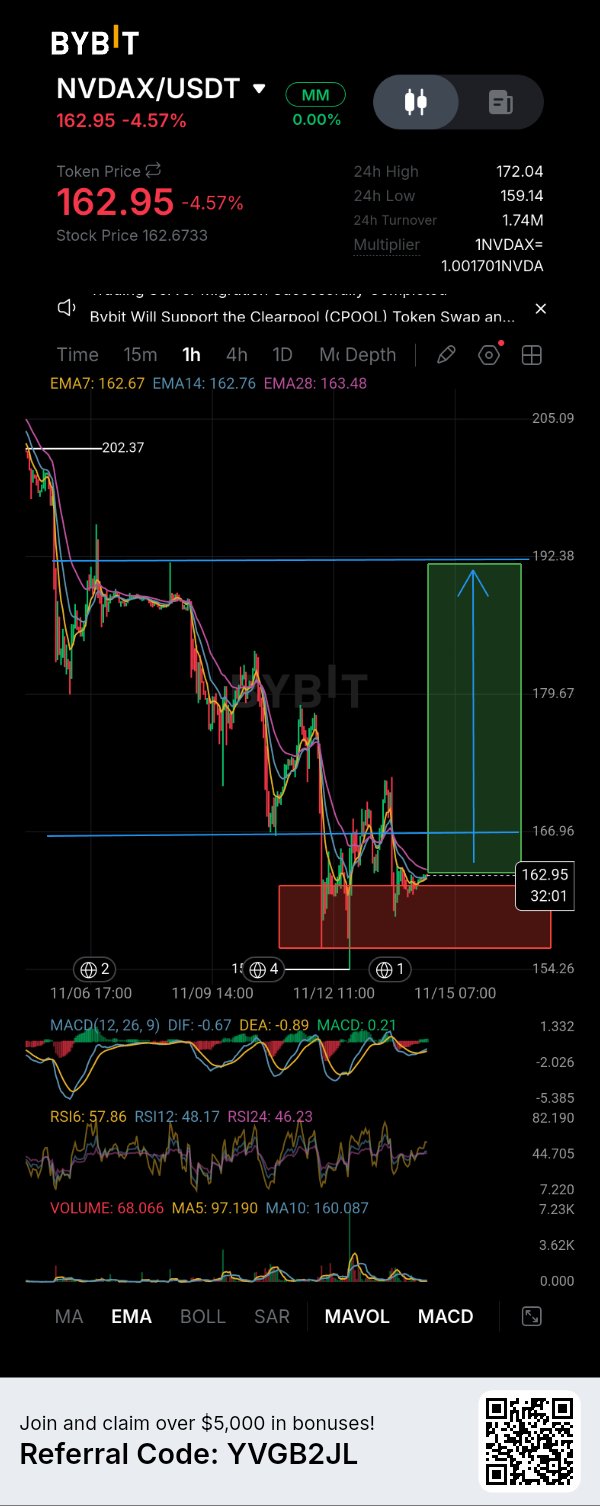
NVDAX UPDATE price is trying to stabilize, but bulls still have one major resistance to break MY BYBIT 1H CHART IS SAYing....👇 $NVDAXUSDT is trading around 162.95, down 4.57%, and I'm watching this area closely because the chart is starting to show some signs of stabilization after a significant correction..The bigger picture on the 1H chart is still not completely bullish. Price has fallen from the 202 area toward the 154–155 region before attempting a recovery. However, buyers are now trying to defend the lower support zone, and the recent price action suggests that selling pressure may be slowing down. I'm interested in this setup, but I don't want to confuse a short-term recovery with a confirmed trend reversal. 1H TECHNICAL ANALYSIS Here's what I'm watching👁️ EMA VALUES are curently EMA7 at 162.67, EMA14 at 162.76, and EMA28 at 163.48. Price is slightly above the shorter EMAs but remains below EMA28. This is an interesting situation because short-term momentum is improving, although buyers haven't fully regained control. The first important resistance is around 166.96. A convincing break above this level could give buyers room to challenge the 179.67 area. Beyond that, 192.38 is the next major upside level visible on my chart. That's an ambitious recovery target, not something I would assume will happen without confirmation. ON THE MOMENTUM SIDE MACD shows DIF at -0.67 and DEA at -0.89, with a positive histogram reading of 0.21. RSI6 is 57.86, while RSI12 and RSI24 remain around 48 and 46 respectively. This suggests some short-term recovery, but the broader momentum picture is still mixed. BULLISH SCENARIO If buyers continue defending the current consolidation area and reclaim 166.96, I would start paying more attention to a potential recovery toward 179.67. A sustained move above that resistance could strengthen the bullish case for another attempt toward 192.38. BEARISH SCENARIO If price fails to reclaim 166.96 and selling pressure returns, the current recovery could turn into another rejection. The marked support region around 156–162 is important. Losing that area would weaken the recovery structure and expose the previous low near 154.26. I would rather wait for buyers to demonstrate strength than enter simply because price has already fallen significantly. For Traders Already Holding NVDAX I wouldn't approach this chart with an all-or-nothing mindset. Traders considering profit-taking could watch the 166.96 resistance first, followed by 179.67 if recovery continues..For anyone holding through the correction, protecting capital and reassessing the structure after each major resistance test makes more sense than blindly waiting for 192.38. RISK Management 154.26 area is the important visible downside reference. A breakdown below the marked support region would significantly weaken the immediate bullish thesis. A bounce without confirmation is not a reliable entry. Liquidity zones are not automatically buying opportunities. Entry, stop-loss, and risk-to-reward should be established beforehand, with position sizing adjusted to the risk involved. My Final View 👍 I can see why this setup is attracting attention, especially with short-term momentum showing some improvement. But the market hasn't confirmed a complete reversal yet. For now, 166.96 is the level I want buyers to reclaim. I'd rather miss the first part of a recovery than chase a move that hasn't established its strength. What would you prefer here: buying near the current support zone or waiting for a confirmed breakout above 166.96? market is volatile, so you have to manage your own risk......✅ #ByXIMPACT #SanDiskAnnounces8For1StockSplit #AITechSelloffErases2Point5TrillionFromNasdaq100 #DeutscheBankLaunchesDigitalAssetCustody

GREAT OPPORTUNITY $BTC 👉BUY THE DIP
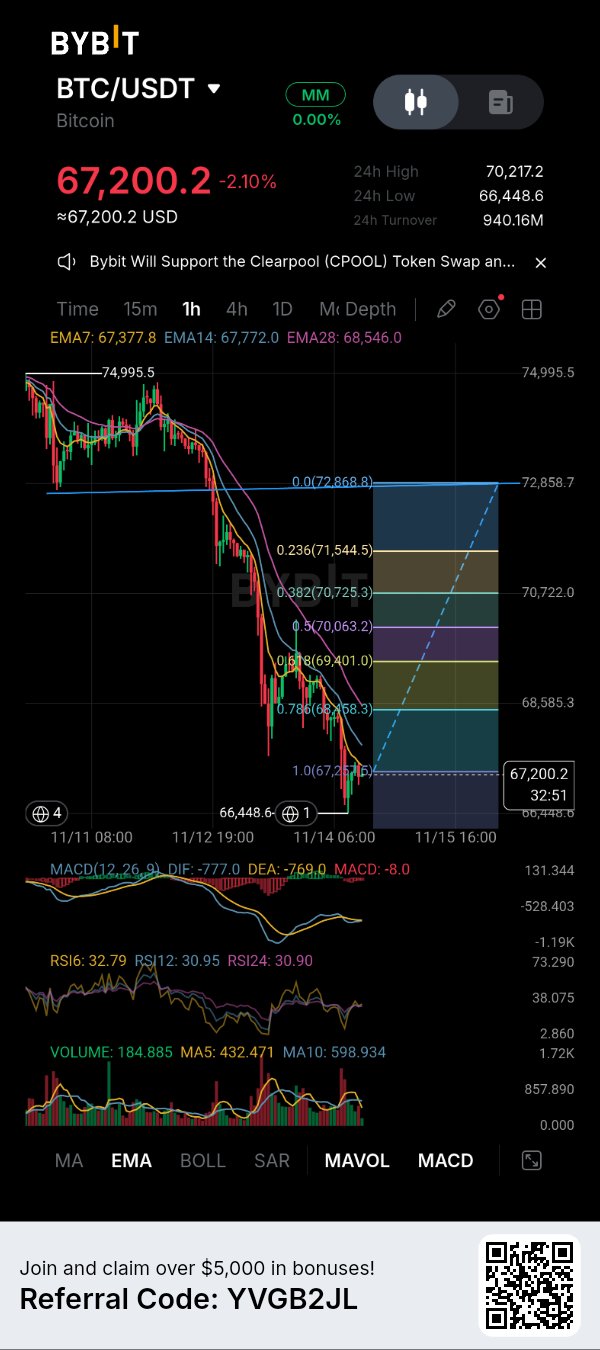
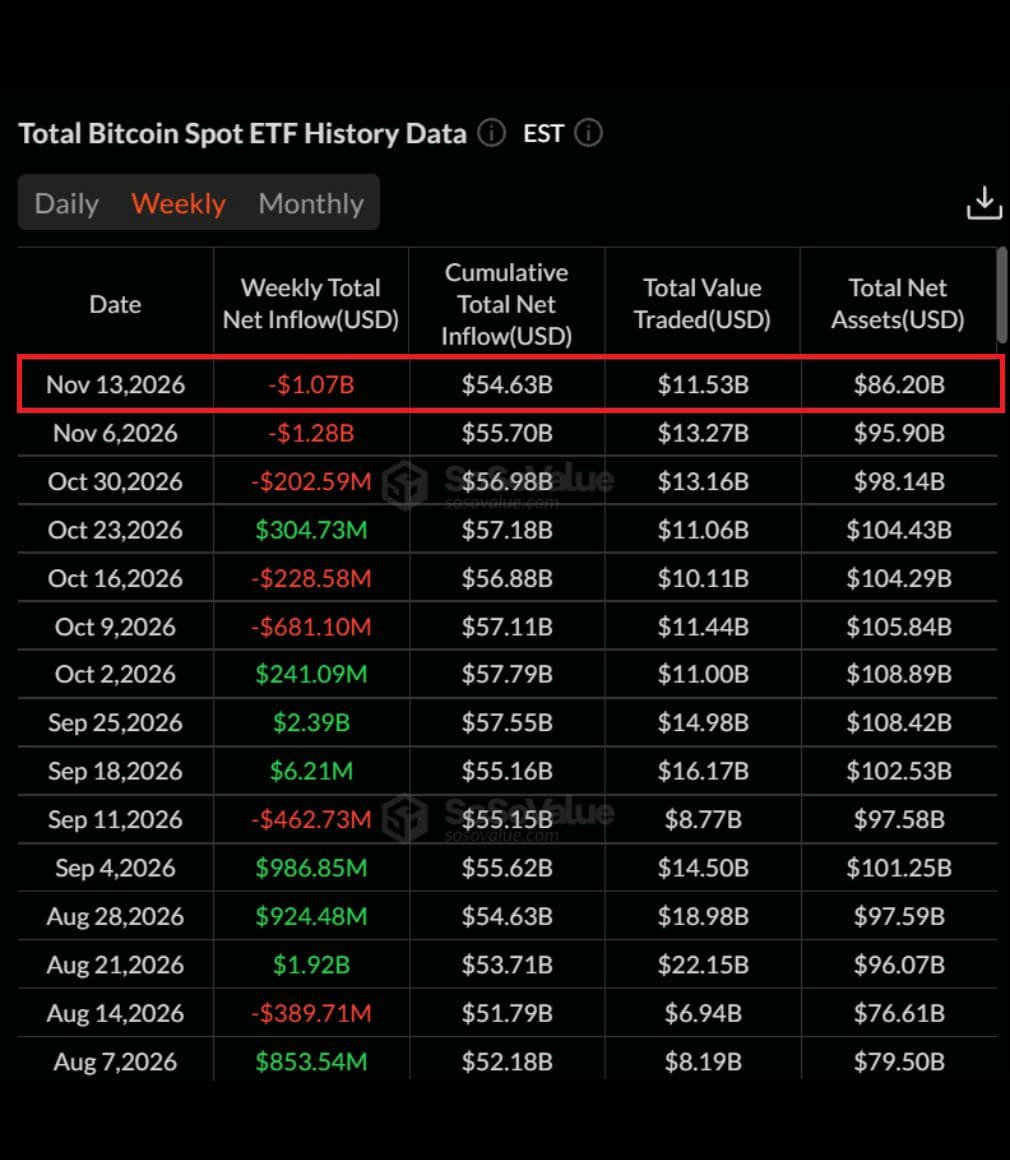
BITCOIN ETF OUTFLOWS are becoming harder to ignore. BlackRock and other spot Bitcoin ETFs reportedly sold $1.07 billion worth of BTC this week alone, bringing total ETF outflows above $2.35 billion this month. Honestly, this is something I'm watching closely. Institutional demand plays an important role in market sentiment, and sustained selling pressure could make Bitcoin's recovery more difficult. But I wouldn't jump to conclusions yet. Let's see whether buyers can absorb this pressure. MY BYBIT 1H CHART IS SAYing....👇 BTC EMERGENCY UPDATE Is testing $67K : Is a recovery finally coming or Is more downside ahead ?🤔 $BTCUSDT is showing clear shortterm weakness, and I think this is a moment where patience matters more than trying to catch the bottom. BTC is currently trading around $67,200, down approximtely 2.10%, after dropping from the $70K region. The 1H chart shows a persistent bearish structure, with lower price movement and all three EMAs positioned above the current price. Here's what I'm watching👁️🗨️ 1. Short-Term Market Structure first important observation is the EMA structure. EMA 7 is around $67,377, EMA 14 is near $67,772, while EMA 28 sits much higher at $68,546. Bitcoin is trading below all three, which tells me sellers still have short-term control. The recent low around $66,448.6 is the immediate level I'm watching. Price has reacted from that area, but I wouldn't call it a confirmed reversal yet. RSI READINGS are hovering around 30–33, suggesting considerable downside momentum and potentially oversold conditions. MACD also remains negative, with the DIF around -777 and DEA around -769. A relief bounce is possible, but oversold RSI alone isn't a reason to enter a long position. 2. Important Fibonacci Levels visible Fibonacci levels give us a useful recovery roadmap: $67,201: Immediate reference level. $68,458: First meaningful recovery resistance. $69,401: Next upside checkpoint. $70,063: Important resistance. $70,702: Further recovery target. $71,544: Higher resistance. $72,858: Major visible Fibonacci reference. I don't expect BTC to reclaim all these levels immediately. Buyers first need to recover the EMA cluster and demonstrate that they can sustain price above it. 3. Two Possible Scenarios Bullish Scenario: If Bitcoin successfully defends the $66,448 low and starts building higher lows, I would watch for a recovery toward $67,772 and eventually $68,458. A sustained reclaim of $68,546 would make the short-term outlook more interesting. Beyond that, $69,401 becomes the next important upside level. Bearish Scenario: If BTC loses $66,448 with convincing selling pressure, the current recovery attempt could fail and another downward move may develop. The screenshot doesn't provide enough confirmed information to assign a reliable deeper downside target, so I would rather wait than manufacture one. 4. For Traders Already Holding BTC I wouldn't treat this chart as a reason for every holder to exit. However, short-term traders may consider partial profit-taking on a recovery into resistance, depending on their entry and existing risk. For anyone looking to increase exposure, I would prefer seing a confirmed reclaim of resistance rather than averaging down simply because RSI looks oversold. Risk Management: The $66,448 area is the immediate downside reference. A decisive breakdown would weaken the possibility of a short-term recovery. A bounce without confirmation is not a reliable entry. Liquidity areas aren't automatically buying opportunities either. Entry, stop-loss, position sizing and risk-to-reward should all be established before taking a trade. My Final Thoughts Bitcoin is approaching an interesting area, but the 1H structure hasn't turned bullish yet. I want to see buyers reclaim important levels before becoming more confident. Sometimes protecting capital and waiting for confirmation is the better trade. What's your approach here? Would you consider buying BTC near $66.4K–$67K, or wait for a confirmed recovery above $68.5K? The market is volatile, so you have to manage your own risk. Follow for more chart updates. Not financial advice. Do your own research. #ByXIMPACT #BitcoinHitsTwoMonthLowAfterUSMidterms

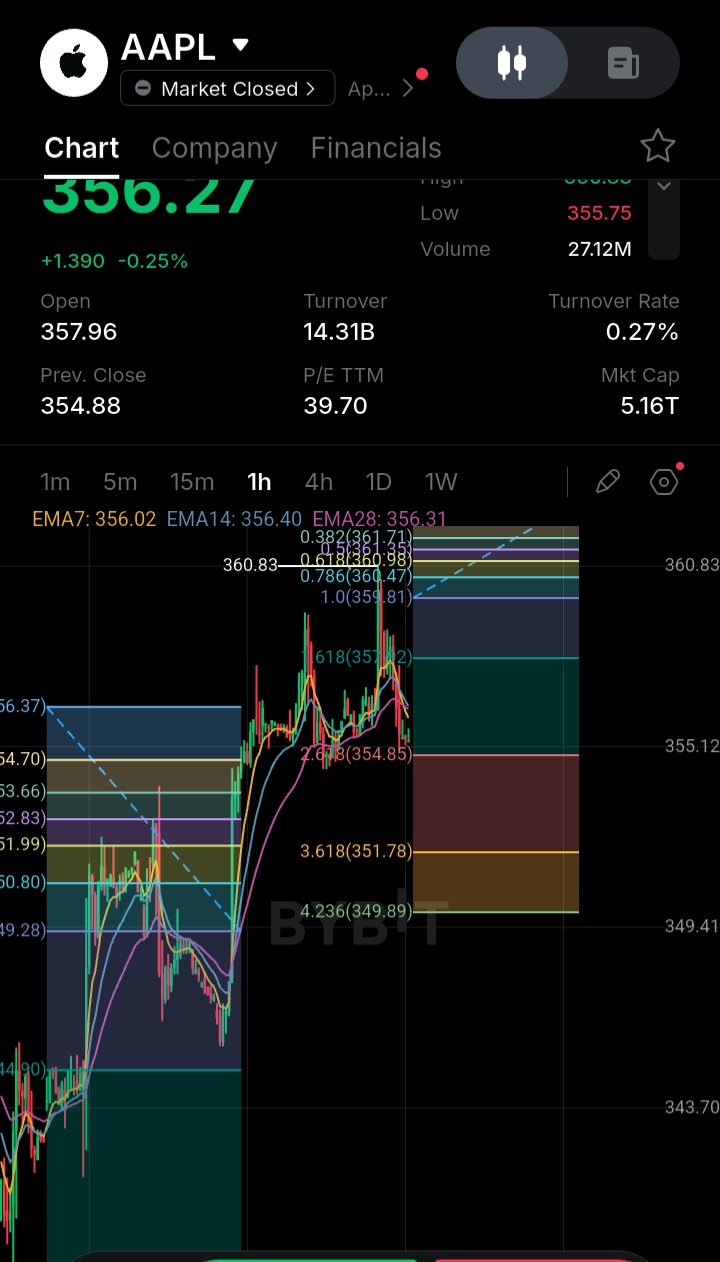
$AAPL pullback after reaching the 360.83 resistance zone. MY BYBIT 1H CHART $AAPLXUSDT is showing signs of short-term exhaustion after its recent bullish expansion. Price pushed higher from the lower 340s, established a strong recovery structure, and eventually reached the 360.83 area. However, buyers have struggled to maintain that momentum, and the latest candles show a pullback from the recent high. stock is currently trading around $356.27, with the visible session low at $355.75. What matters here is that price has moved back toward its shortterm EMA cluster after the rejection. This is where I want to see whether buyers are still willing to defend the recovery. Here Is What the Indicators Are Suggesting📊 EMA structure is becoming particularly interesting. EMA7: $356.02 EMA14: $356.40 EMA28: $356.31 PRICE IS CURRENTLY slightly above EMA7 but below EMA14 and EMA28. These averages are tightly clustered, suggesting that short-term momentum has become less decisive. For me, the $356.00–$356.40 area is important. A sustained move above this cluster would improve the imediate recovery structure, while repeated rejection could keep sellers in control. Fibonacci structure also deserves attention. The visible upper retracement area extends from approximately $359.81 to $361.71, with the recent high near $360.83. Below the current price, the chart displays important extension levels at $354.85, $351.78 and $349.89. partially visible MACD readings appear to show DIF near -0.00, DEA around 0.32 and MACD around -0.33. This suggests negative short-term momentum, although I would want a clearer histogram recovery before considering a confirmed bullish shift. VOLUME is displayed at 27.12M, but without a clear comparison against its volume average, I wouldn't draw strong conclusions about participation. Key Price Levels🎯 Support🟢 $355.75 – Immediate visible session support. $354.85 – Important Fibonacci extension level. $351.78 – Next downside extension. $349.89 – Deeper structural extension. Resistance🔴 $356.31–$356.40 – Immediate EMA resistance cluster. $359.81 – Important Fibonacci retracement level. $360.83 – Recent visible swing high. $361.71 – Upper Fibonacci resistance. WHAT COMES NEXT? Bearish Scenario If AAPL loses $355.75 and cannot reclaim it, I would watch $354.85 closely. A decisive move below that level could expose $351.78 and potentially $349.89 Bullish Scenario If buyers defend the current support and reclaim the EMA cluster, a recovery toward $359.81 becomes possible. A sustained breakout above $360.83 would be a stronger indication that bullish momentum is returning My Market Perspective I wouldn't rush into an entry here. The previous upward move was strong, but the latest rejection tells me that buyers need to prove themelves again. My main focus is the reaction around $355.75–$354.85. If this area holds and price starts reclaiming the short-term EMAs, the recovery idea becomes more attractive. HOWEVER if support breaks, I don't want to keep looking for longs simply because the earlier structure was bullish. For now, patience makes more sense than chasing either direction. I would wait for confirmation rather than assume this pullback is already over market can always take another direction, so risk management remains essential....✅ #ByXIMPACT

💥 Get your Bybit Card now💥
#NewFinancialPlatform I MEAN actually..... have you ever thought about how much value gets lost in everyday spending? We make small purchases almost every day, whether it's shopping, subscriptions, food, or other regular expenses. But what if some of that spending could also bring something back? I'M REALLY SURPRISED that's an interesting idea behind the Bybit Card 💥 Instead of treating everyday purchases as money going out with nothing in return, Bybit introduces a cashback system that rewards eligible crypto spending. Depending on your tier, you can enjoy between 2% and 10% cashback. OF COURSE, the actual benefit depends on your tier and how much you spend. I wouldn't look at cashback as a reason to spend more than necessary. That would defeat the purpose, honestly. What interests me more is how crypto platforms are gradually connecting digital asets with real-world payment habits. People don't necessarily want to keep crypto limited to trading anymore. They also want practical ways to use it. MAYBE that's where products like the Bybit Card become more relevant over time. Let's see how this approach develops. Get your Bybit Card: https://i.bybit.com/1EabGihJ #WSOT2026 #WSOTShowYourAITradeToEarn10USDT #AnthropicIPOTestsTheAIBoom #JensenHuangExitTestsNvidiasAILeadership $AAPLXUSDT $METAXUSDT


CRYPTO MARKET IS BLEEDing AGAIN 🔴
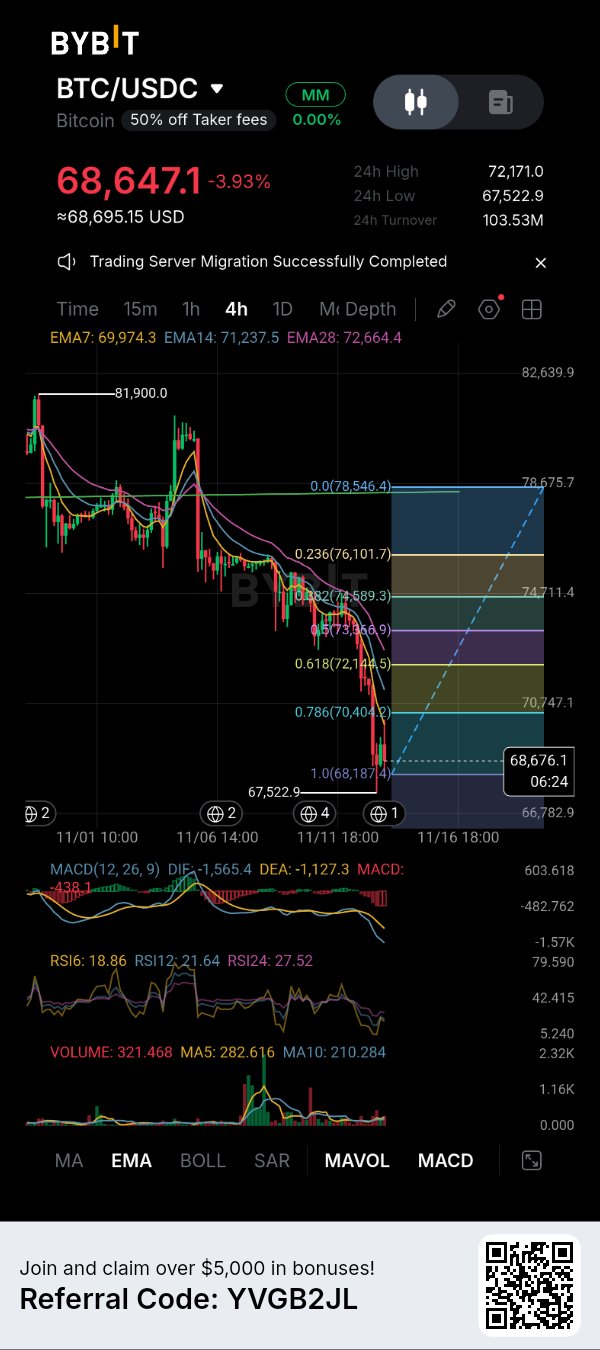
$BTC below $70K, $ETH below $2K and $BNB around $642. Fear & Greed Index: 21 (Extreme Fear) My Portfolio is also deep in red, but I'm still holding strong! How's your portfolio doing? Are you buying the dip, holding, or selling? BITCOIN'S TREASURY narrative is getting more interesting. Texas Democrat Ron Reynolds has introduced a bill allowing cities and counties to buy up to $10 million in Bitcoin. With over 1,450 local governments in Texas, that's worth watching. Still, a proposed bill doesn't mean actual buying pressure. I'm more interested in whether this idea develops into real adoption. For now, I won't chase headlines. Bitcoin still needs to prove its strength through price action🤔 MY BYBIT 4h CHART $BTCUSDT is showing signs of short-term exhaustion, but I'm not ready to call this a confirmed bottom yet. BTC is trading around $68,647 on the 4H chart after an aggressive decline from the $81,900 swing high. The important thing here is that sellers have maintained control throughout the move, and price is still trading below all three visible EMAs : EMA7 at $69,974, EMA14 at $71,237, and EMA28 at $72,664. That alignment tells me the broader short-term structure remains bearish. However, there is something worth watching. RSI6 has dropped to 18.86, RSI12 to 21.64, and RSI24 to 27.52. All three are in deeply oversold territory. MACD is also negative, confirming that bearish momentum remains significant. Price recently reached $67,522.9 before recovering toward the $68,600 area. I'm watching this low very carefully because another rejection followed by a fresh breakdown could expose Bitcoin to further downside. FOR A POTENTIAL LONG i would rather see buyers defend the $67,522–$68,187 area and establish a higher low. A recovery above $69,974 would be my first indication that short-term momentum is improving. If buyers manage to reclaim the higher resistance levels, my upside areas would be $70,404, followed by $72,144 and $73,566. The $76,101 region would become relevant only if the recovery develops into a stronger structural reversal. ON THE OTHERHAND losing $67,522 with sustained selling pressure would invalidate my immediate recovery idea. I wouldn't blindly buy just because RSI is oversold. My preference right now is patience. The risk-to-reward on a confirmed recovery could become interesting, but entering before buyers demonstrate strength is a different story BITCOIN needs to prove that selers are losing control before I consider a serious long position....👍 market is volatile, so you have to manage your own risk. Follow for more chart updates. Not financial advice. Do your own research💯 #ByXIMPACT #BitcoinHitsTwoMonthLowAfterUSMidterms #DeutscheBankLaunchesDigitalAssetCustody #AnthropicIPOTestsTheAIBoom

Hmm really..... sometimes I feel investors focus too much on what is happening today and forget to look at what might happen over the next year. I mean, look at the technology market right now. Big tech stocks have faced selling pressure, AI infrastructure spending is becoming a concern, and investors are questioning whether these companies can turn their massive investments into future profits. But Goldman Sachs sees a different picture. Acording to Bloomberg's November 13 report, strategists led by Peter Oppenheimer expect the S&P 500 to rise around 14% to 8,700 over the next 12 months. The team also favors US and Japanese stocks while remaining underweight European equities in 2027. What caught my attention is the reason behind this optimism. Think about buying a strong business during a temporary period of uncertainty. Its share price falls, but its financial foundation hasn't necessarily collapsed. Would that make the business less valuable, or could it create an opportunity? That's the question Goldman is looking at with large technology companies, especially hyperscalers. These cloud giants are investing heavily in AI infrastructure. Their spending is enormous, and their cash flow has turned negative. That's a genuine concern, not something investors should simply ignore. However, Goldman points out that their balance sheets remain healthy, including net debt-to-equity measures. In simple words, spending heavily doesn't automatically mean a company is financially weak. It's like building a large factory. The initial cost is high, but what matters is whether that factory can generate enough business in the future. The recent decline has also changed valuations. The Nasdaq 100 is down around 9% from its early-October high. Goldman believes some large cloud providers are now trading below their historical valuation levels. Personally, I think this is where investors need to be careful. A cheaper price doesn't always mean a better investment. Future earnings, infrastructure costs and actual returns still matter. Another interesting point is interest rates. Goldman favors businesses that could benefit from falling bond yields, easing inflation and lower oil prices. But current conditions aren't completely supportive yet. US 10-year Treasury yields have moved above 5%, and markets are pricing in a possible December Fed rate hike. So there is still a gap between the opportunity Goldman expects and the situation we are seeing today.Europe is another interesting part of this discussion. The Stoxx Europe 600 recently reached a record high, but Goldman still recommends underweighting European stocks because of valuation concerns, government debt problems and political uncertainty. Interestingly, Citi has a different opinion. It recently downgraded US stocks to neutral and upgraded European stocks outside the UK to overweight. Two major institutions, two different views. And honestly, that's a reminder that even experienced strategists don't have a guaranteed map of where the market is going. My takeaway is simple: I wouldn't judge the next 12 months only by the recent tech selloff. I would watch company balance sheets, future earnings, AI spending returns and bond yields together. The S&P 500 is already up 11% this year, so chasing the market blindly doesn't make much sense to me. The real oportunity may come from understanding which companies can turn today's heavy investments into tomorrow's sustainable growth. market is volatile, so you have to manage your own risk.....👍 Follow for more market updates #ByXIMPACT #WSOTShowYourAITradeToEarn10USDT #USPPITestsTheHigherForLongerTrade #SanDiskAnnounces8For1StockSplit #AITechSelloffErases2Point5TrillionFromNasdaq100 $NVDAXUSDT $AAPLXUSDT