RoYoK
17265Like13Shares645Fans70Follow
Content Creator - YouTuber
Content Creator - YouTuber
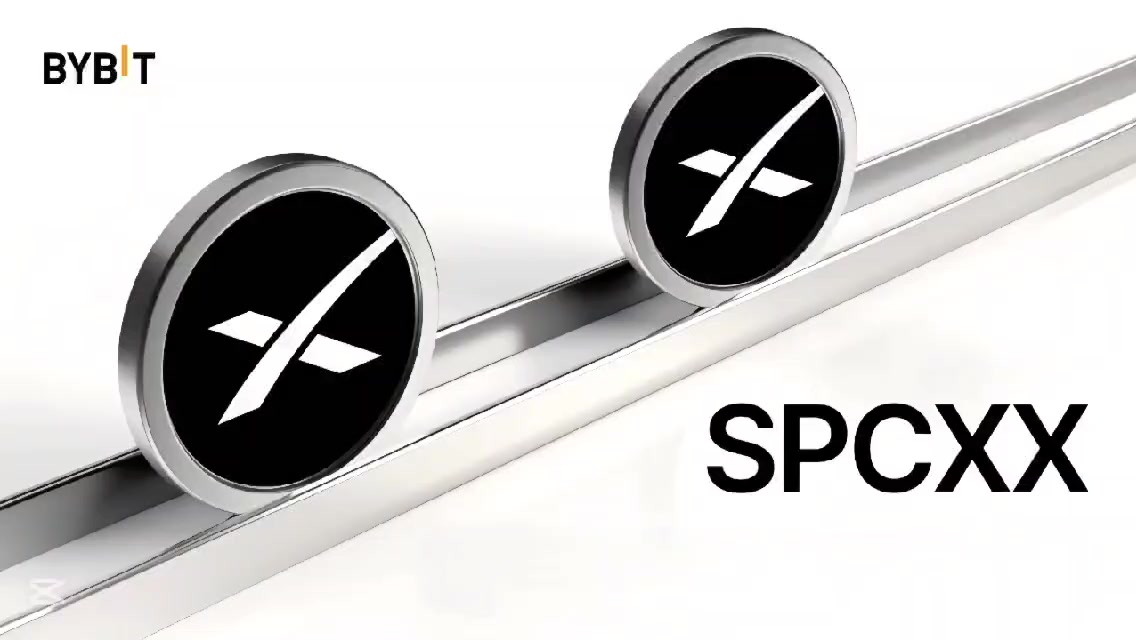
🚀 SpaceX xStock's chart was flashing mixed signals before the headlines arrived, something important happened on $SPCXXUSDT daily chart during the recent correction. After a sharp drop from the 167.05 high, price found a hard floor at 120.55 recovery from that low was aggressive, but it stalled exactly where the technicals suggested it would at 1.0 Fibonacci extension of 135.35 and the 1.618 level at 138.61 EMA50 sits higher at 144.05, still acting as a ceiling chart captured price near 139.13, with the daily candle still open and the RSI recovering to the mid-50s But real story is in the liquidity map Coinglass liquidation heatmap for SPCXX shows two massive clusters of leverage sitting right on top of current price There is a heavy concentration of liquidity at 140, and another dense band just below at 138, these are the zones where leveraged positions are stacked, and they act as magnets for price action When price approaches a cluster like this, the market often hunts that liquidity sweeping the stops and forcing liquidations before deciding on a real direction Recent headlines added context to the volatility. SpaceX is dealing with a wave of insider unlocks, including a 59.1 million share release and a larger 319 million share unlock that hit the market recently company also launched a classified national security mission for the U.S. Space Force, which adds fundamental noise to the tape But here's what interests me most 🤔 chart's rejection at the 138 140 zone and the liquidation heatmap were already telling the same story before the unlocks hit the wire That is why always study both price structure and positioning together, price action reveals where buyers are losing control, and the heatmap reveals where the market is most fragile charts cannot predict specific events, but they can warn us when leverage is stacked in a way that makes a violent move likely today Trading Perspective SPCXX is now trapped between two forces. The heatmap suggests that if price can push through 140 and hold above it, the liquidity above could fuel a short squeeze toward the EMA50 at 144.05 and the 2.618 fibonacci extension at 143.88 But bigger opportunity lies lower 🙂↕️ If the 138 support fails and the heatmap's lower liquidity cluster is swept, I see a clear path back toward the 134 135 zone, and ultimately the major demand block at 120.55 if the selling accelerates that is where will become particularly interested in a potential long setup I'm not planning to buy simply because price reaches my box want to see a meaningful bullish reaction, a market structure shift, and evidence that buyers can defend a new higher low only then will consider positioning for a recovery toward the 153 167 region, with the possibility of a new higher high above that area if the fundamental catalysts align Risk Management ⚡️ I have no confirmed long entry yet. My stop-loss and risk to reward ratio will depend on the actual bullish confirmation and entry price sustained breakdown below 134.75 without a convincing recovery would invalidate my proposed bullish setup, and I would step aside rather than force a trade It is also important to remember that SPCXX is a tokenized derivative, not actual SpaceX equity. It offers 24/7 price exposure but grants no shareholder rights or dividends, so entries must account for the token's own liquidity and the wider spreads that come with macro uncertainty i'm willing to miss the first part of a recovery rather than commit capital before my conditions are met. Patience matters more than catching the exact bottom Faster Nvidia Update 🖥 i'm maintaining my cautious stance on Nvidia $NVDAXUSDT given the recent headline risk Nvidia's stock has been highly volatile, with the CEO related investigation headlines causing an initial 8.8% drop to 170.24 before the stock pared losses to trade around 179.35 retail buyers stepped in aggressively, with reports of $111 million in net buying in the first 30 minutes of the session, which shows there is still strong dip-buying interest i'm bullish on Nvidia's longer term AI potential, but I won't confuse a promising business story with a confirmed trading entry stock remains oversold on some metrics, and a relief rally is possible, but the headline overhang means the structure is still fragile for now, I'm watching for stronger price structure before taking a fresh position opportunity doesn't disappear just because I choose to wait for confirmation 😏 #IMPACTbyTrade #JensenHuangExitTestsNvidiasAILeadership
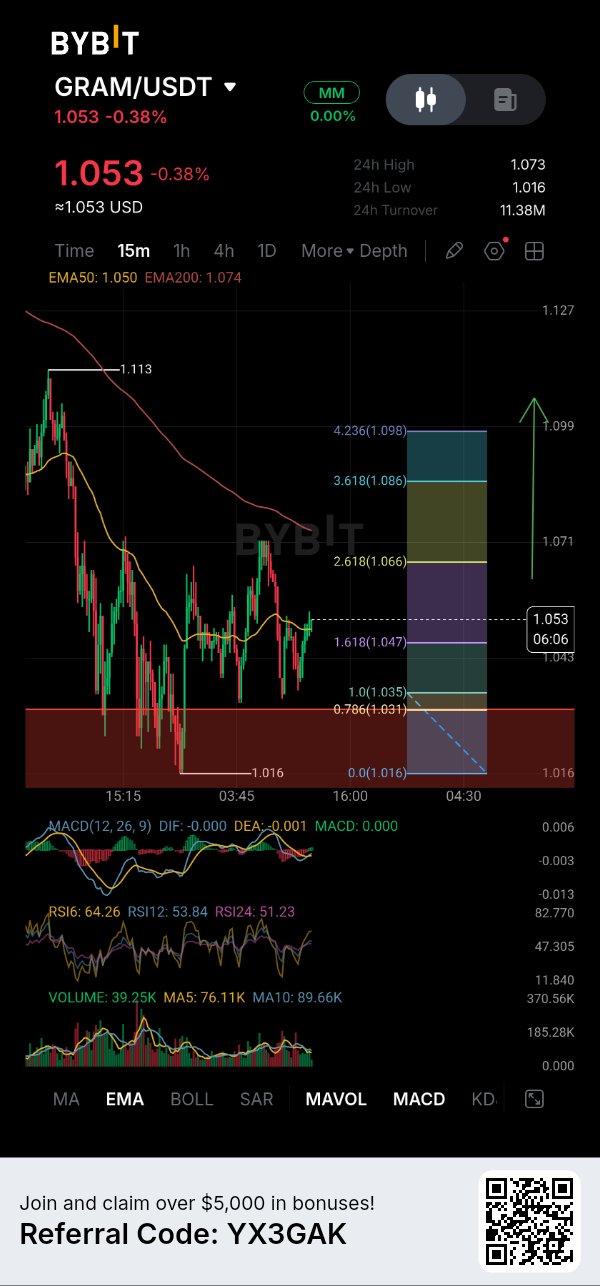
$GRAMUSDT is approaching an area where believe buyers could start showing strong interest again 😏 after a recent dip to $1.016, GRAM is now trading around $1.048, successfully holding above the critical 0.786 Fibonacci level at $1.031 and finding solid footing right at the EMA50 this is a promising demand area that looks ready to support a fresh upward push, making the current price action quite attractive for a recovery setup what matters to me now is how buyers react around this pivot zone. The first important level is the 1.618 Fibonacci retracement at $1.047, which we are currently testing If GRAM reclaims this level with a strong hourly close and holds it during a retest, I'll become more confident about a move toward the 2.618 Fib at $1.066 bove that, EMA200 at $1.075 is the next major resistance level before my extended target at $1.098 We are also approaching the highly anticipated Asian market open today, which is expected at 00:00 UTC historically, this session often brings renewed liquidity and trading volume as we head into this timeframe, I want to see if Asian traders step in to drive genuine buying strength, which could provide the momentum needed to break through these local resistance levels chart shows a solid potential upside scenario from current levels up to $1.098 that is an attractive recovery path, but it does not mean price will move there without some consolidation. GRAM still needs to overcome the overhead EMA200, and want to see genuine buying strength, confirmed by an expansion in volume, before expecting a larger rally Risk Management main demand zone I'm watching is the red order block around $1.016 to $1.031 convincing hourly close below this area would seriously weaken my bullish outlook since I haven't confirmed an exact entry and stop-loss, I'm not assigning an artificial risk-to-reward ratio to this setup I'm interested in buying strength near these lows, but I don't need to catch the exact bottom. I'd rather miss the first part of a recovery than enter too early and watch another support level fail. For now, I'm giving GRAM time to prove that buyers are ready to defend this area if the EMA50 at $1.050 turns back into solid support, the bigger recovery targets become much more interesting #IMPACTbyTrade $HYPEUSDT

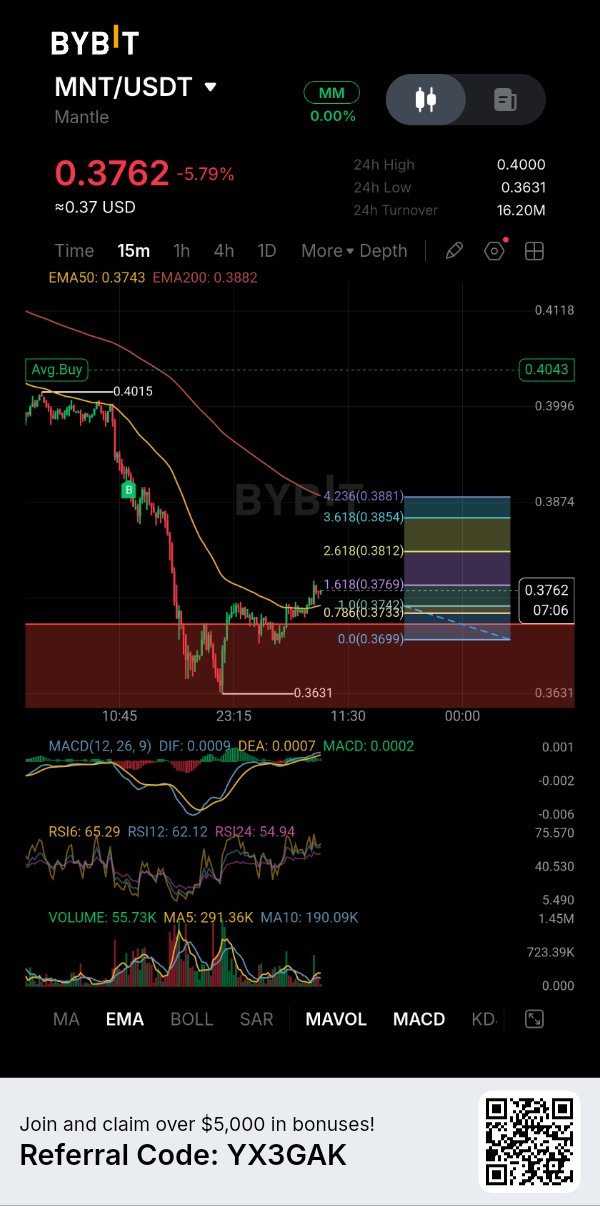
$MNTUSDT is bleeding Out, is real Capitulation just getting started ? Mantle is trading around $0.3762, down 5.79%, after a brutal session that saw the price get rejected from the $0.40 area and violently flushed toward the local low of $0.3631 but the chart is starting to show a setup worth watching. What stands out on the 1H chart: EMA200: $0.3882 price is trading well below this critical dynamic level, a clear bearish signal that the macro trend remains down EMA50: $0.3743 price is also below the faster moving average, confirming that short-term momentum is still with the sellers Support: $0.3631 key level buyers must defend to prevent a total collapse Resistance: $0.3882 recovery above this EMA200 is needed to even think about a trend shift MACD histogram is barely positive but the lines are flattening near the zero line, showing that bearish pressure has not fully disappeared and the bounce lacks conviction News Behind the Pain Mantle's DEX volume nearly doubled week-over-week, jumping from $15 million to $28 million, an 87% increase core contributors even proposed lowering the fourth budget cycle cap to 40 million USDx and 150 million MNT, a sign of fiscal discipline. Yet despite these positive developments, the price keeps bleeding. This is the ultimate bearish divergence Good news is being sold, and the market is telling us that the path of least resistance remains down My trading plan: watching $0.3699-$0.3762 value zone closely. This is the area where price is currently fighting for a foothold If MNT breaks below $0.3631 with volume, I expect a rapid flush toward lower levels. That is where will be watching for a reaction If price reaches the $0.3699-$0.3762 zone and shows a violent rejection wick with a bullish divergence on the RSI, that is the first sign of life confirmed breakout above $0.3882 (EMA200) after defending this zone would be the signal that the tide has finally turned However, a clear break and close below $0.3631 would invalidate the entire setup and could open the door to a deeper capitulation opportunity isn't catching a falling knife. It's waiting for the market to flush out the weak hands and confirm that the value zone is a hard floor would you consider accumulating MNT near the $0.37 value zone, or wait for a confirmed breakout above $0.3882? #IMPACTbyTrade $BTCUSDT

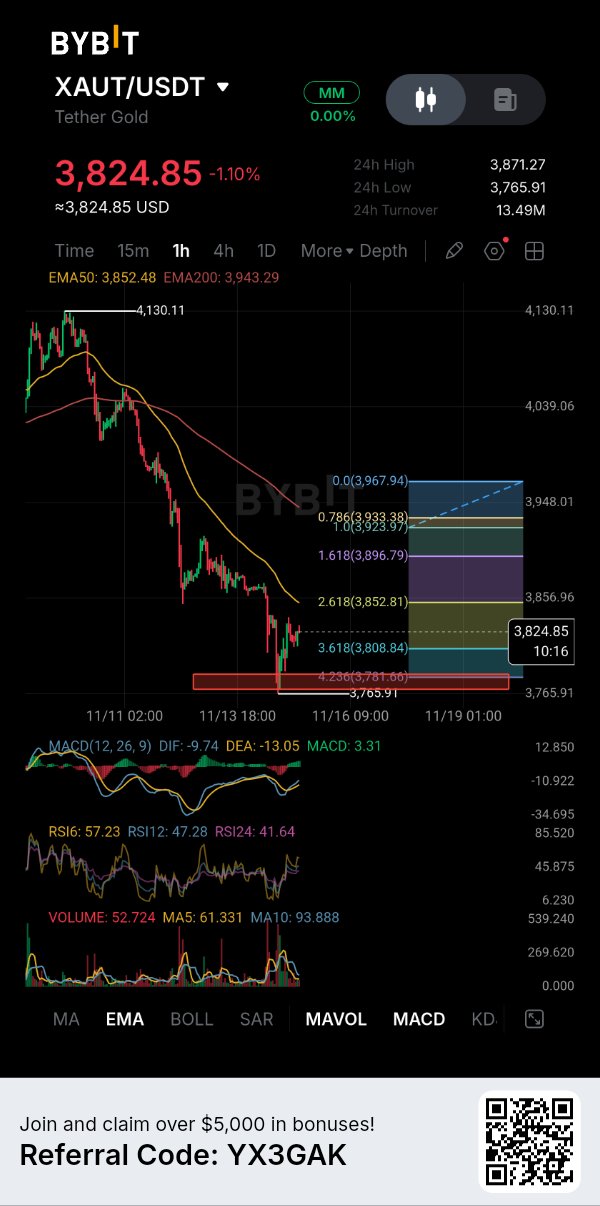
$XAUTUSDT just experienced a brutal macro flush, a sheer waterfall event that dragged the price straight through major support levels and shook out the weak hands but this violent capitulation is the exact gift I have been waiting for 🤔🤔 don't catch falling knives in the middle of a panic sell; wait for the dust to settle and buy the retest. And right now, this setup is incredibly clean look at this 1-hour chart, had a massive flush that obliterated the previous structure, dumping the price from the 4,130 high straight down into the abyss at 3,765 now, the market is doing exactly what it should after such a heavy drop: finding a temporary floor and testing the new support here is my technical read on why this is my entry zone: Dynamic Floor, look at the Fibonacci confluence. The price is fighting to establish a base right above the 3.618 extension at 3,808.84, while the EMA50 looms above at 3,852 , this is the ultimate last line of defense if buyers defend this zone, the relief bounce is imminent Reset, RSI was completely obliterated during the flush, but it has recovered beautifully to a healthy 57.23 on the short term, panic selling is exhausted, giving the bulls plenty of room to push higher Momentum, MACD is printing a bullish crossover right at the bottom. The histogram has flipped green, signaling that the bearish momentum has completely climaxed and buyers are stepping back in Execution Strategy and Risk Management: I am stepping in right here at this support level to catch the bounce. Entry, accumulating around the current price (3,824.85) as it builds a base above the Fib extension Hard Stop Loss, have placed my strict stop loss just below the recent absolute bottom and the local low at 3,765.91, if the price loses that level, the bottom is completely invalidated, and I exit immediately to protect my capital target is a clean sweep of the EMA50 at 3,852, followed by a reversion to the mean and the EMA200 up at 3,943 best option buying extreme fear, protecting my downside, and letting the volatility pay me. are you picking up XAUT on this massive pullback too? #IMPACTbyTrade $BTCUSDT

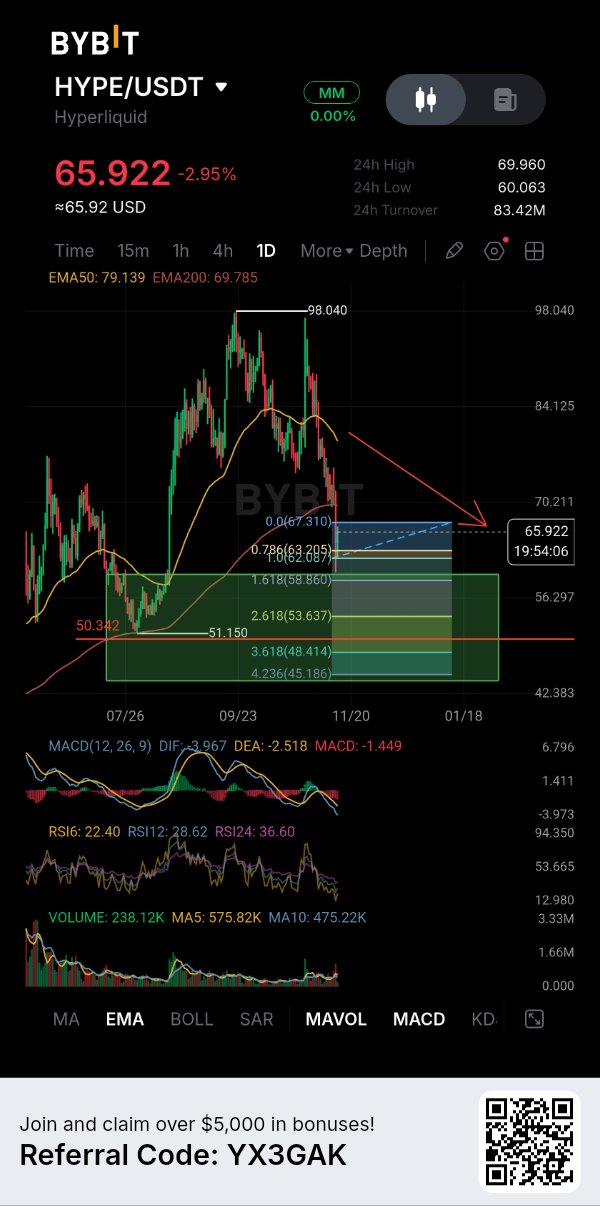
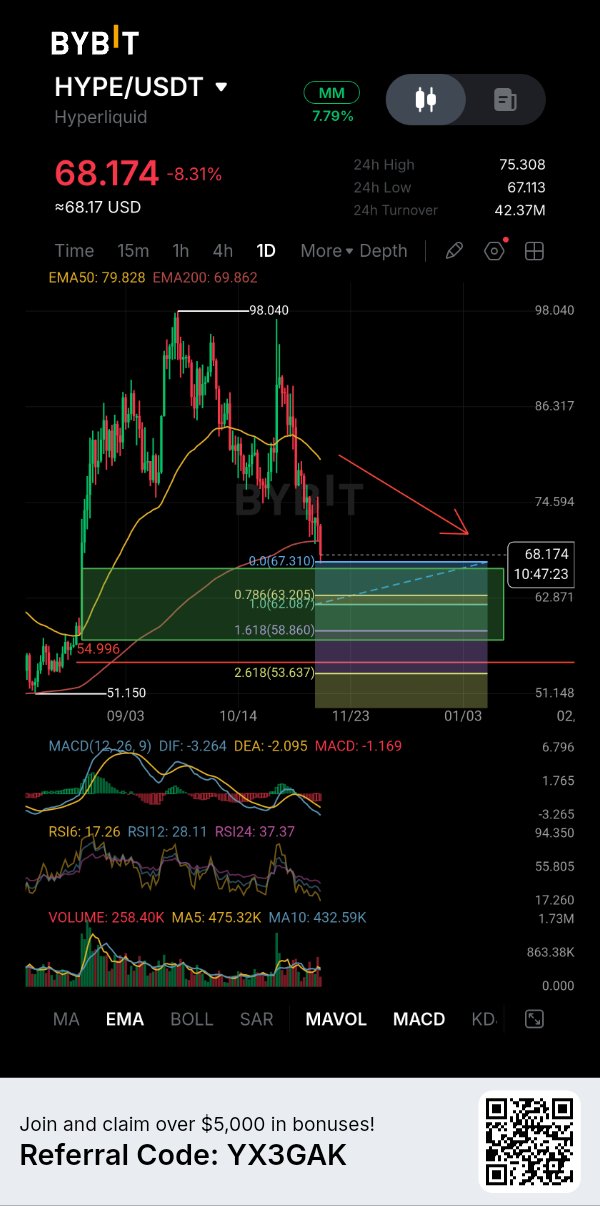
$HYPEUSDT i'm absolutely stunned by sheer magnitude of this collapse, HYPE has been completely obliterated, crashing down from its highs near $98 to the mid $60s, and brutal reality is that the relentless surge in BTC dominance has acted like a vacuum, sucking the liquidity and life right out of altcoins like this one HYPE was trading near $65.922 when I reviewed this chart, sitting dangerously below both the EMA50 at $79.139 and the EMA200 at $69.78 market has lost all major structural support, and the momentum is clearly to the downside this completely confirms a bearish outlook for the immediate future path drew shows a clear continuation of this downtrend brief retest of the EMA200 would not be enough to save this chart want to see whether buyers can even attempt to reclaim the $70 psychological level. If they fail to push above this immediate resistance, recovery is dead before it even starts MACD is deeply bearish, and while the RSI is approaching oversold territory at 22, in a strong downtrend, price can remain oversold for a long time 0.786 Fibonacci level at $63.205 is the last line of defense. If that breaks, the red arrow on my chart indicates a clear projection toward the deeper Fibonacci extensions in the green demand zone If $63.205 level continues to reject price and the recent $60.063 low breaks, I will watch the $58.860 level first deeper $53.637 level remains a highly probable downside scenario and the primary target for this move A successful reclaim of the EMA200 at $69.785 would change the immediate outlook and invalidate this bearish thesis will not enter a short right here at the bottom of a massive red candle First, need an actual rejection from a lower high, a clear entry, and a stop above the resulting swing high only then can I judge whether the available downside offers a worthwhile risk-to-reward ratio sustained strength above the $70 level would invalidate this bearish continuation plan drawing shows a possible route. Price must confirm whether that route is open #IMPACTbyTrade $BTCUSDT
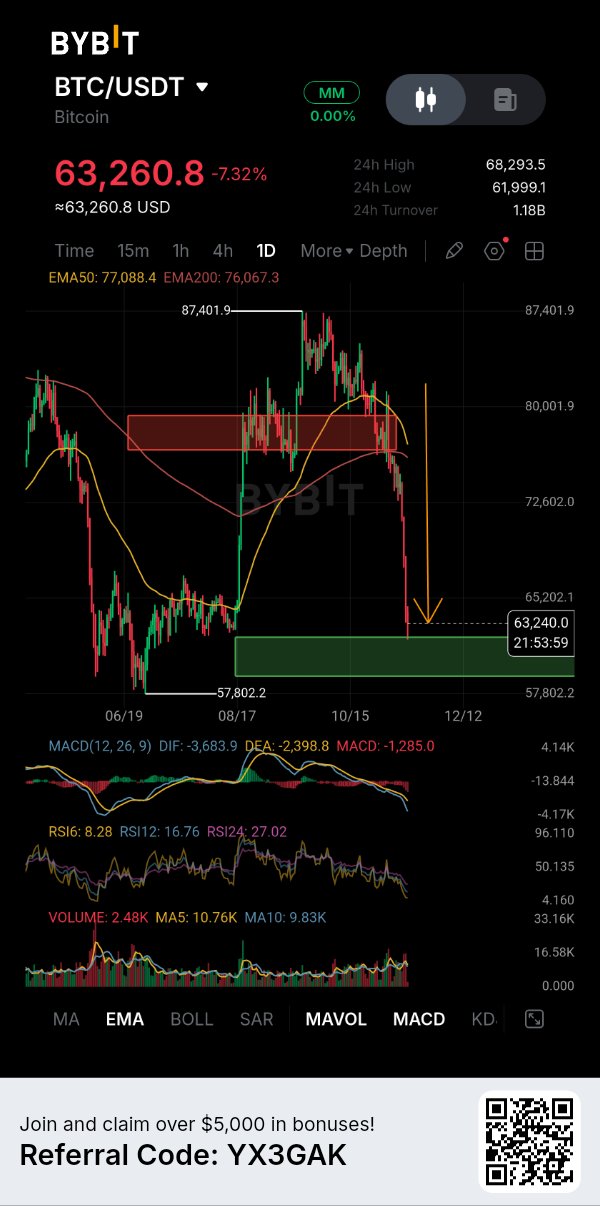
$BTCUSDT chart was signaling heavy weakness before the liquidation cascade hit, something important happened on Bitcoin's daily chart prior to this latest flush After failing to hold the highs above 87,000, price broke down through a key consolidation range and the moving averages (EMA50 and EMA200) flipped into immediate overhead resistance Instead of finding a floor, buyers were repeatedly steamrolled, creating a sharp vertical drop that now has price testing the 63,260 region. derivatives data added the final layer of pressure. Recent reports confirm that billions of dollars in leveraged positions were wiped out across the crypto market, with long positions accounting for the overwhelming majority of the damage over 90% of recent liquidations were longs s price broke below major support shelves, forced selling from these long positions accelerated the move, creating a self-reinforcing loop of liquidations But here's what interests me most. downside pressure was already building before the forced selling began. That is why I always study market structure and positioning before reacting to the headlines price action can reveal underlying fragility long before a liquidation candle prints. The charts cannot predict the exact trigger, but they can warn us when the market is overcrowded and vulnerable to a flush Trading Perspective Bitcoin is now sitting near the 63,260 level, which sits just above a major demand zone marked between 57,800 and 60,000 on the daily chart RSI is already deeply oversold (RSI6 at 8.28), but I wouldn't call a bottom confirmed just because the oscillators are stretched bigger opportunity lies lower I have marked the major demand block around the 57,800 to 60,000 area as the critical weekly support. If the current level fails to hold and the liquidation engine keeps running, that is where I will become particularly interested in a potential long setup I'm not planning to buy simply because price reaches my box key driver here is the long/short ratio. The more retail traders rush to open new long positions trying to catch the falling knife, the more fuel there is for the market to continue pushing lower to hunt that liquidity need to see a meaningful shift in open interest and a flush of these late longs before I consider a reversal. I want to see a structural shift, a higher low, and evidence that buyers can actually defend a level Risk Management I have no confirmed long entry yet. My stop-loss and risk to reward ratio will depend entirely on the actual bullish confirmation and entry price once we see a genuine capitulation A sustained breakdown through the major demand zone without a convincing recovery would invalidate any proposed long setup. The tokenized chart mirrors the underlying asset, so entries must account for the specific liquidity of the product. Patience matters more than catching the exact bottom. Fast Nvidia Update 🔥🆗️ I'm maintaining my cautious stance on Nvidia $NVDAXUSDT despite the recent volatility. Nvidia's chart has shown severe swings recently, with prices gapping down sharply toward the 160-180 region after failing to sustain the record highs While the company's long-term AI narrative remains one of the strongest in the market, the current price action reflects a broader tech selloff and profit-taking i'm bullish on Nvidia's longer-term potential, but I won't confuse a promising business story with a confirmed entry. For now, watching for price to stabilize and build a proper base before considering any fresh position opportunity doesn't disappear just because I choose to wait for confirmation #IMPACTbyTrade

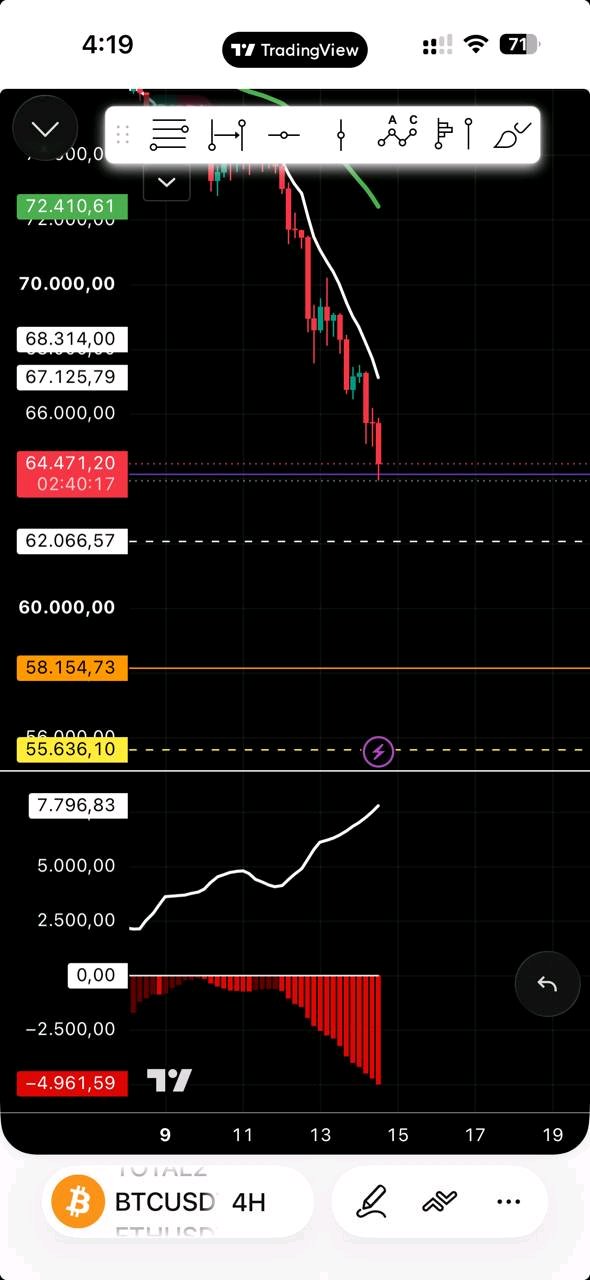
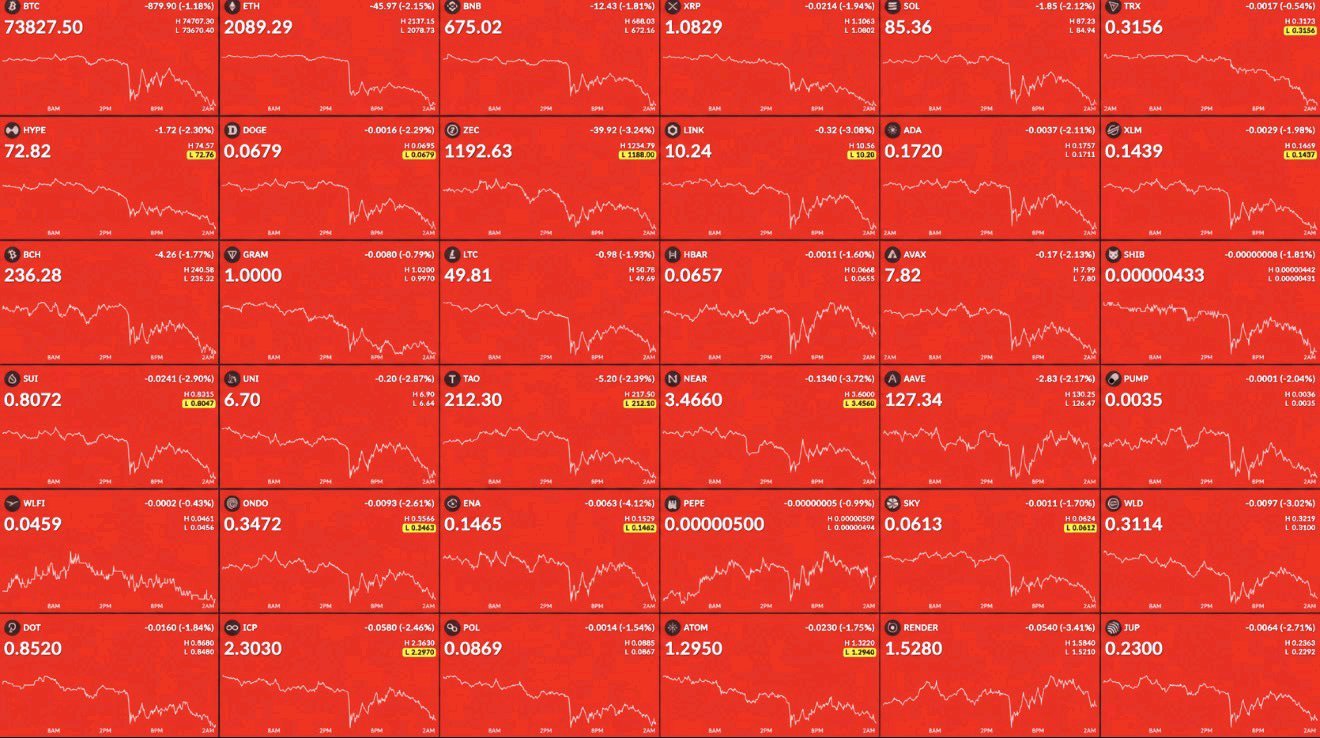
$BTCUSDT is in absolute freefall right now, and the blood is running thick in the streets, panic is palpable, but my discipline is colder than ice I told you this was coming in my previous posts, and now the market is proving my bearish thesis right This is exactly where fortunes are made on the short side, but also where stubborn bulls get obliterated. i'm playing this with surgical precision look at this 4 hour chart. We have been in a relentless, parabolic downtrend, nuking straight from the 72,000 level down to 64,471. The bounce attempts have been pathetic and immediately sold off momentum is entirely in the bears' hands, and the MACD histogram is expanding aggressively to the downside. This is heavy, structural capitulation, and there is no reason to try and catch this knife here is my strict risk management and execution plan: i'm not going to FOMO and short the absolute bottom of this vertical red candle That is a rookie mistake and I will get chopped up on a relief bounce I am waiting for the market to give me a dead cat bounce to short into Entry Strategy: i'm watching the previous support turned resistance around the 68,314 level. If price bounces into this zone and sellers step in with heavy volume to reject it, will open my short. I am waiting for a clear lower high to confirm the trend is still intact Stop Loss: I have set a strict stop loss above the 70,000 psychological level. This is my line in the sand. If the price reclaims this level with conviction, it means the bearish momentum is exhausted, and I exit immediately without arguing with the market Risk Management: sizing my position carefully. I am risking a maximum of 1-2% of my capital on this trade because volatility cuts both ways and short squeezes can be violent if I am already in profit, I am aggressively trailing my stop loss down to lock in gains respect dump, but respect my capital more market is bleeding, the trend is undeniably down, and i'm locked in, waiting for the perfect entry to press the short #IMPACTbyTrade $ETHUSDT #BitcoinHitsTwoMonthLowAfterUSMidterms
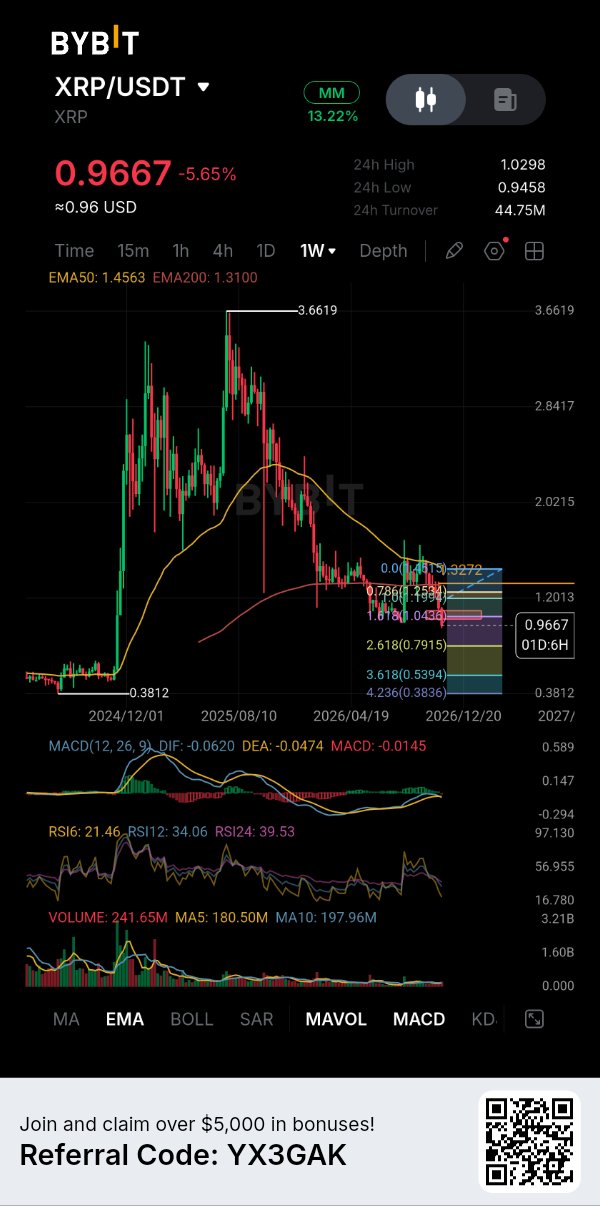
$XRPUSDT is trading around $0.9667, showing a painful -5.65% drop, after ultra plummeting from $3.6619 peak and eventually finding temporary buyers near $0.90 region since that heavy drop, price has stopped making the same aggressive downward moves and started moving sideways around the $0.90-$0.96 region that consolidation is important because it shows the market is desperately trying to establish a new balance after the volatility On the 1W chart: EMA50: $1.4563 EMA200: $1.3100 Price is trading deeply below both long-term moving averages this usually makes the $1.31-$1.45 area a massive structural ceiling that the bulls will eventually have to reclaim. Right now, XRP is sitting near the current lows. A clean move above $1.0298 would give buyers their first sign of a relief bounce Above that, the EMA200 at $1.3100 becomes the next major resistance before the previous high comes back into focus I'd watch the range breakout. After a move as aggressive as the one XRP just experienced, the next meaningful expansion could come from whichever side finally wins this consolidation 📉 #IMPACTbyTrade $XAUTUSDT
A horror show is unfolding for $ETHUSDT , has been absolutely obliterated below the critical $1,900 level, currently trading around $1,851, as the entire market bleeds out in a violent cascade numbers are staggering: over $845 million in total crypto liquidations within 24 hours as of November 14, 2026, with Ethereum alone accounting for a brutal $203 million, most of which were long positions getting completely wiped out this isn't a correction; this is a structural collapse, and the fear is palpable what matters to me now is the confirmation of a death cross between the EMA50 at $2,300.08 and the EMA200 at $2,295.16. This bearish crossover on the daily chart is a massive red flag, signaling that the medium-term trend has officially flipped price is trading miles below both moving averages, and the RSI is crushed at 11.07, deep into extreme oversold territory, yet buyers are nowhere to be found first immediate support level I'm watching is $1,813. If Ethereum loses this floor with a strong daily close, fully expect a terrifying flush toward the $1,500 region, which aligns with the lower Fibonacci extensions video chart shows a bleak outlook, and the fundamentals align with the technical damage. Spot ETH ETFs are bleeding, with over $65 million in net outflows on November 13 alone, and the Ethereum Foundation itself has been selling fear and Greed Index has plummeted to 21, signaling extreme fear. Any bounce here is likely just a dead cat bounce or short covering, not a genuine reversal Risk Management main supply zone I'm watching is the recent breakdown area around $1,951 to $2,000. A convincing daily close back above this psychological region would seriously weaken my bearish outlook and suggest a potential deviation Since we are in a freefall and I haven't confirmed an exact entry and stop-loss, I'm not assigning an artificial risk-to-reward ratio to this setup i'm interested in shorting weakness on any minor relief rallies, but I don't need to catch the exact top of a bounce I'd rather miss the first part of a retracement than enter too early and watch the price get crushed by another wave of forced liquidations. for now, I'm giving Ethereum time to prove that buyers are willing to step in, but the death cross and the relentless ETF outflows tell me this pain is far from over if $1,813 completely collapses, the extended downside targets become a total bloodbath 🔥🚨 #IMPACTbyTrade $XAUTUSDT

$HYPEUSDT experienced a brutal capitulation, a sheer waterfall event that completely shattered the previous uptrend and sent the market into a panic But this violent flush down to the macro support is the exact gift I have been waiting for. I don't catch falling knives during a heavy liquidation cascade; wait for the dust to settle and buy the retest and right now, this setup is incredibly compelling Look at this daily chart. We saw a catastrophic slide from the 98.040 peak straight into the abyss, bottoming out at 67.113. This wasn't just a random pullback; it was a heavy structural breakdown Now, the market is doing exactly what it should after such a severe flush: finding a temporary floor and testing the new support. Here is my technical read on why this is my entry zone: dynamic floor: Look at Fibonacci confluence. The price is fighting to hold right above the 1.0 level around 67.310, while the EMA200 sits just above us at 69.86 this is the ultimate last line of defense on the daily timeframe. If buyers defend this macro zone, we have a massive relief bounce incoming. reset: RSI has been completely obliterated, with the short-term RSI6 sitting at a deeply oversold 17.26. The panic selling is exhausted, giving the bulls a violent opportunity to push back up. momentum: selling volume climaxed exactly at the bottom, and we are seeing the MACD histogram printing deep negative values. The bearish momentum is extremely stretched, making a mean reversion highly probable. execution Strategy and Risk Management: I am stepping in right here at this oversold macro support level to catch the dead cat bounce. recomend Entry: Accumulating around the current price (68.174) as it defends the 67.310 Fibonacci level. yHard Stop Loss: have placed my strict stop loss just below the recent absolute bottom and the local low at 67.113. If the price loses that level, the macro structure is completely invalidated, and I exit immediately to protect my capital. primary target is a clean sweep of the EMA200 at 69.862, followed by a reversion to the mean and the 0.618 Fibonacci level around 73.295. i'm buying extreme fear, protecting my downside, and letting the volatility pay me. are you picking up HYPE on this massive pullback too? #IMPACTbyTrade $BTCUSDC

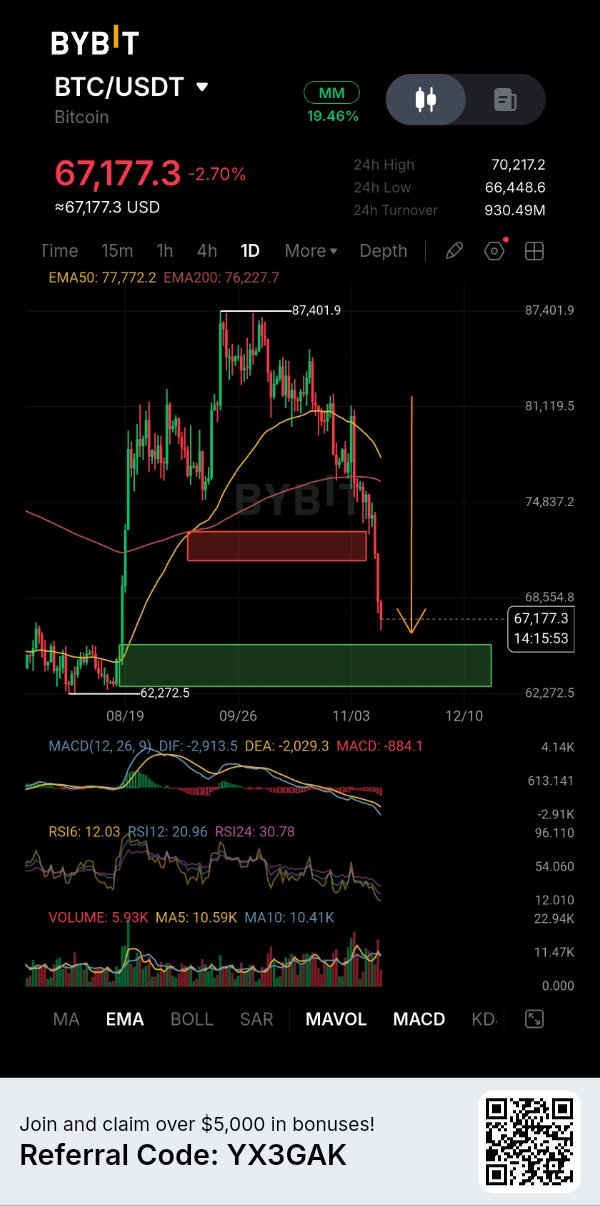
$BTCUSDT there is one specific area on my chart projection that want traders to notice 💯 path i drew shows a continuation of bearish momentum after rejection from $87,401 high BTC was trading near $67,177 when reviewed this chart, just above the recent local low and dropping directly into a major historical demand zone That changes how interpret the current price action 📊 market has lost both the EMA50 at $77,772 and the EMA200 at $76,227, which confirms the heavy selling pressure from the $74,837 to $77,772 supply zone above however, the daily RSI is deeply oversold, sitting near the 12 level. A brief bounce from this condition would not be surprising, but it would not be enough to reverse the trend want to see whether buyers can actually defend the green support zone between $62,272 and $68,554 If buyers fail to hold this area and the recent $66,448 low breaks, the recovery could lose momentum entirely, and the projected downward arrow suggests a deeper decline toward the bottom of the green zone is likely If selling pressure continues and price slides further, will watch the $62,272 level first. A break below that major structural support opens the door for a much deeper correction, which remains a projected downside scenario, not a guaranteed destination successful reclaim of the $70,000 psychological level would change the immediate outlook and bring the $74,837 supply zone back into focus will not enter a long simply because the RSI is oversold first, need an actual reaction at the green demand zone, a clear bullish confirmation structure, and a stop below the resulting swing lo only then can I judge whether the short-term bounce offers a worthwhile risk-to-reward ratio sustained strength above the $74,837 supply zone would invalidate this bearish continuation plan drawing shows a possible route Price must confirm whether that route is open #IMPACTbyTrade $XAUTUSDT #BitcoinHitsTwoMonthLowAfterUSMidterms

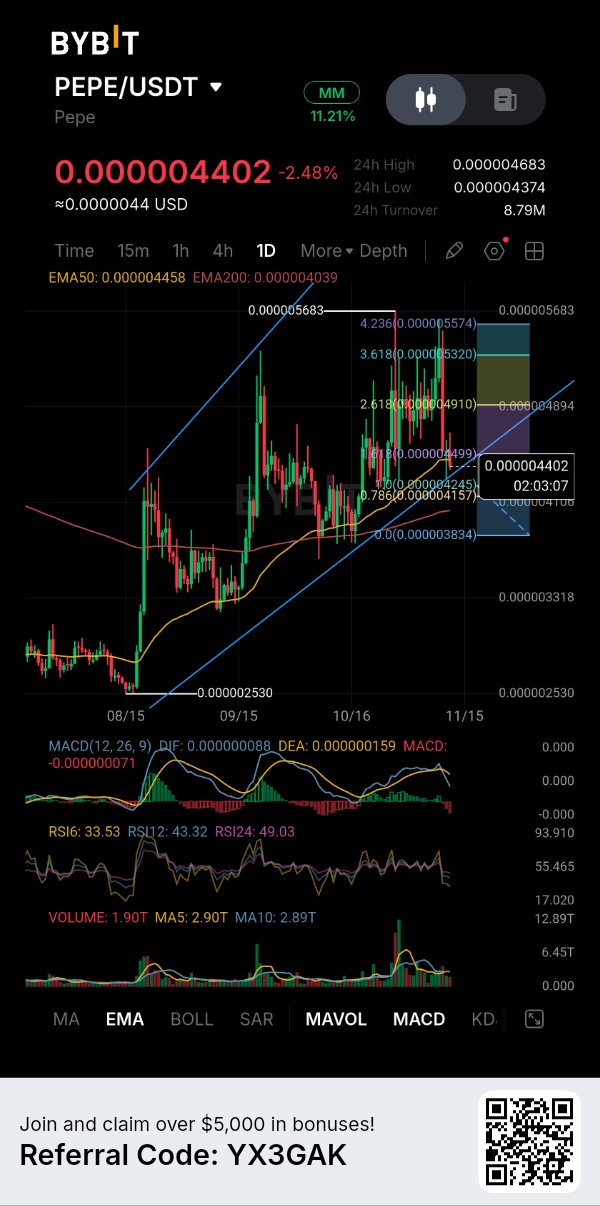
$PEPEUSDT memecoin euphoria fades as gravity takes over🩸 market tried to sustain the bullish momentum, giving retail plenty of hope for a new leg up. Yet, the structure has finally cracked, and the bears are stepping in to reclaim control of the trend. 🧸 Take a close look at my daily chart. 👀 PEPE aggressively pushed toward the highs but failed to secure a higher high, leaving a trail of trapped late buyers momentum has shifted, and we just lost a critical dynamic support. A break below key moving averages usually signals that the path of least resistance is now down. 🌊 Here is why I am leaning heavily bearish here We have lost the EMA50, and the price is now printing a clear series of lower highs. The MACD has confirmed a bearish crossover with expanding red histogram bars, signaling accelerating downward pressure. The RSI is also curling down, failing to find any relief. If buyers were ready to defend the trend, this was their moment, and they failed 📉 Now want to see sellers push through and close decisively below the 0.786 Fib level at 0.000004157 That would be the final nail in the coffin for this local uptrend, opening the trapdoor straight down toward the recent sweep low and the ultimate target at the EMA200 around 0.000004039. 🚨 I have marked a specific short idea on the chart: Entry: 0.000004383 Stop-loss: 0.000004550 Target: 0.000004000 Potential upside: 8.73% Defined downside: 3.81% Risk-to-reward: 2.29:1 This bearish thesis comes with a crystal clear exit. A move through 0.000004550 invalidates my marked setup; I won't widen the stop just to defend my prediction. A decisive reclaim above the 1.618 Fib at 0.000004499 would be a serious warning that the bulls are making a stand. ⚠️ Position size matters because volatility on memecoins can be absolutely brutal. The projected reward is highly attractive, but it is not guaranteed. 🧠 I am willing to take a calculated bearish view while retail sentiment is still clinging to false hope. Sometimes the clearest opportunities appear when the chart finally shows its true colors, and right now, PEPE is showing us the blueprint for a deeper flush. 💎 My conviction is bearish My risk is defined. Now PEPE just needs to prove the sellers are truly in control 🔥 #IMPACTbyTrade $HYPEUSDT

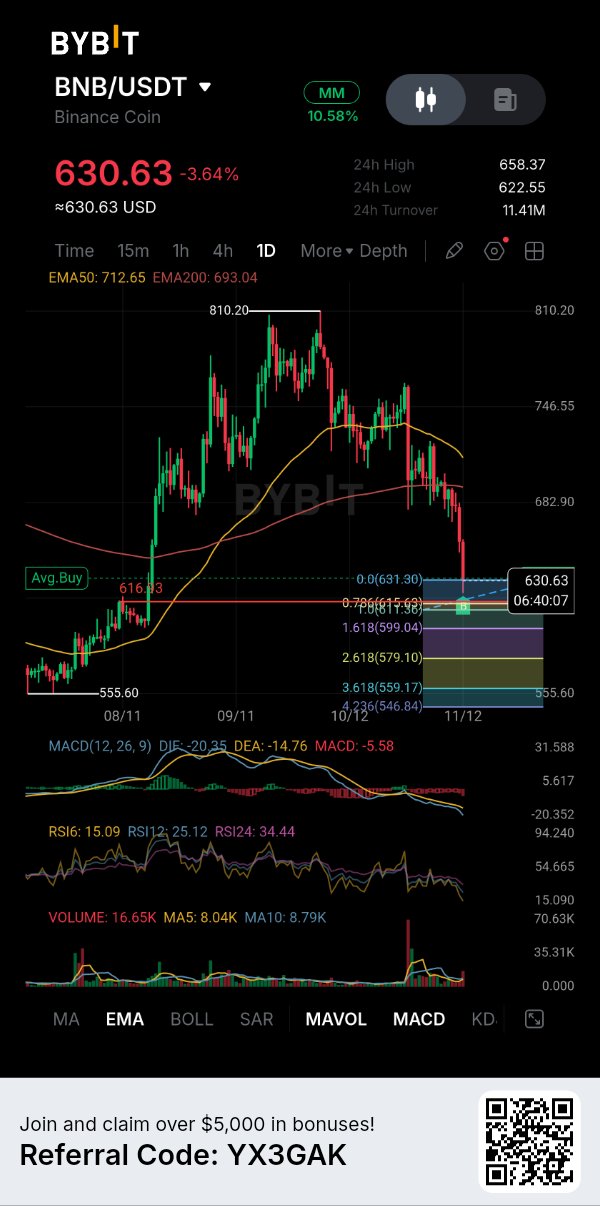
$BNBUSDT most catastrophic move is unfolding right now 📉🩸 everyone is watching the brutal fall from the 810.20 peak but there's a far more terrifying signal hiding in this daily chart that most traders are completely ignorin on daily chart, BNB completely lost its macro structure, getting violently rejected and trapped below both the EMA 50 and EMA 200 price spent time trying to find a floor, but this recent collapse didn't happen simply because of weak momentum it came after sellers completely obliterated the support zone, breaking straight through the 680 level and leaving a trail of blood. That's part of this setup most traders are missing now look at the current price. BNB is bleeding out at 631.18, sitting right on 0.786 Fibonacci level, with absolutely no bullish volume to save it bullish reversal is a complete illusion. My previous local support levels have shattered, so I am aggressively bearish right now A brief oversold signal on the RSI doesn't automatically destroy this catastrophic bearish setup. In fact, if BNB fails to reclaim the 650 area and forms a clear bearish continuation, my target towards that psychological and technical 1.618 Fibonacci level at exactly 600 dollars becomes a massive reality. Those are my targets, not a guarantee from the market i'm watching for confirmation, not blindly catching a falling knife. A sustained higher-timeframe break back above the recent lower high, followed by a successful reclaim of the 693 EMA, would invalidate this bearish setup Any new short entry needs a defined stop above the confirmed structure and a favorable risk-to-reward ratio before execution BNB has already shown what pure capitulation looks like on the charts market is screaming for lower prices here's real question: Are we watching BNB build a temporary floor for a dead cat bounce, or is this the final nail in the coffin that sends us straight down to 600 dollars? #IMPACTbyTrade $BTCUSDT

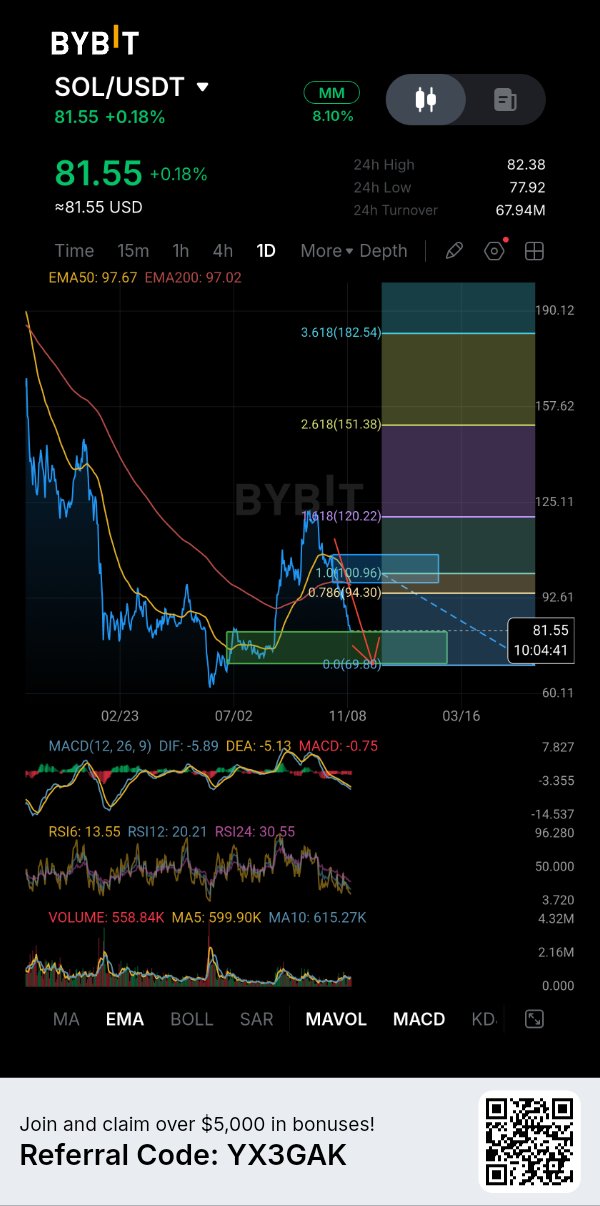
$SOLUSDT is trading around $81.55, showing a +0.18% move, after aggressively dropping from the $100.96 area and eventually finding buyers near $69.86 Since that heavy drop, price has stopped making the same aggressive downward moves and started moving sideways around the $80-$82 region consolidation is important because it shows the market is trying to establish a new balance after the panic On the 1D chart: EMA50: $97.67 EMA200: $97.02 Both averages are tightly compressed together around $97. This makes the $97.00-$97.70 area a massive structural ceiling that the bulls will eventually have to reclaim Right now, SOL is sitting right on the 0.382 Fibonacci level. A clean move above $82.38 would give buyers their first sign of renewed momentum. From there, the first meaningful area to watch is around $85.41. Reclaiming that level would be more significant because it would start moving price away from the current consolidation zone and back toward the middle of the previous range. Above that, $100.96 becomes the next major resistance before the previous high comes back into focus. But the downside remains just as important. The $69.86 region is the absolute major support visible on this chart. Buyers defended that area during the crash, and as long as it holds, the current sideway structure can still develop into a recovery base. A break below $69.86, however, would seriously weaken the setup and indicate that sellers are ready to drag it even lower. So the structure is basically: $69.86 -> Major support $77.18 -> Short term support $81.55 -> Current consolidation zone $85.41 -> First major resistance $97.00 -> EMA cluster decision zone $100.96 -> Previous high What makes this setup interesting isn't the current +0.18% move. It's the fact that SOL went through a violent flush, found support near $69, and is now compressing with the 6-period RSI completely crushed at an extreme 13.55 while the MACD remains deeply bearish. That creates a much cleaner battle between buyers catching a falling knife and sellers trying to push their luck. If buyers reclaim $85.41 and then push through the $97 EMAs, the chart could start showing signs that the recovery is gaining structure. If price continues getting rejected around the current levels and eventually loses $69.86, the entire recovery attempt would need to be reassessed. For now, I wouldn't focus on the small percentage move. I'd watch the range breakout. After a move as aggressive as the one SOL just experienced, the next meaningful expansion could come from whichever side finally wins this consolidation battle. 📈 $SOLUSDT #IMPACTbyTrade $BTCUSDT

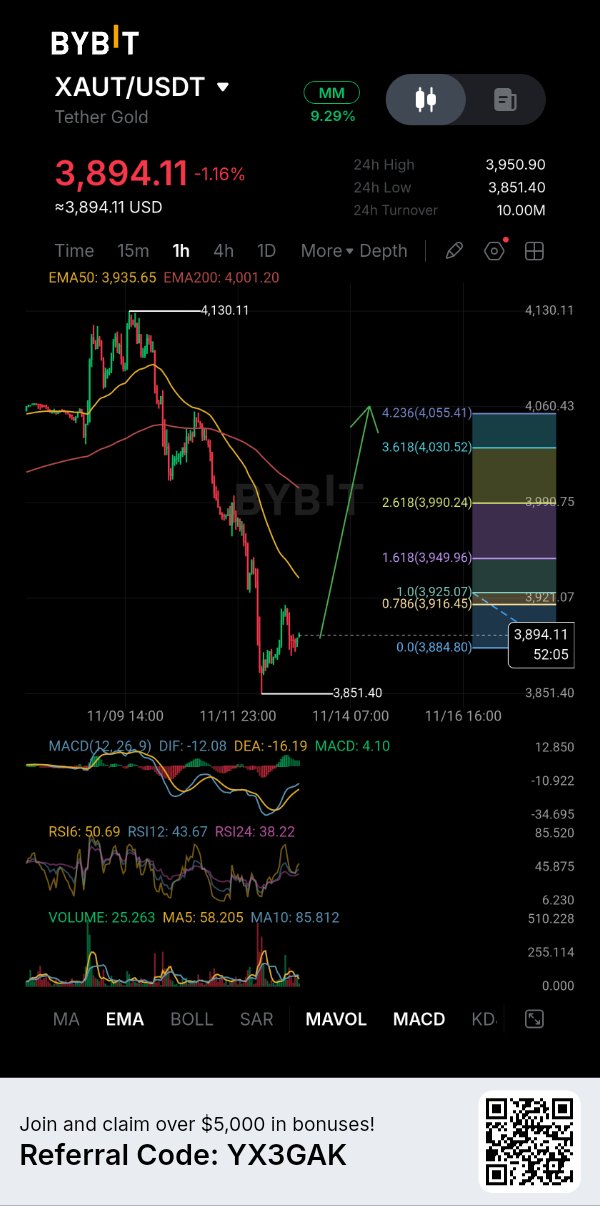
$XAUTUSDT can sustain this v-shaped relief bounce to reverse the aggressive intraday sell-off, asset has moved beyond its simple safe haven identity, introducing intense volatility and complex trading dynamics however, token is still trading well below its recent local highs, creating a clear gap between macro adoption and immediate chart performance 📉 XAUT recently traded near $3,894.11, with a 24-hour turnover volume around 10.00M. Its latest reported 24-hour range is $3,851.40-$3,950.90. The $3,884 area, aligning with the 0.0 Fibonacci level, is the immediate support zone, while the $3,925 to $3,949 area is first major recovery resistance sustained reclaim of $3,950 would provide stronger evidence that buyers are returning. The broader structure remains weak after a steep decline of nearly 6% from $4,130.11 peak 📊 technical development worth watching is the underlying momentum shift on the hourly chart MACD is printing a bullish crossover with the histogram flipping green above zero. Meanwhile, the RSI has bounced sharply from oversold territory and is now hovering near the neutral 50 level these figures demonstrate localized capitulation and a potential trend reversal, but a technical bounce does not automatically translate into a full macro recovery important question is how much real spot demand actually requires XAUT at these discounted levels 🤔 Market structure provides another important angle, especially regarding the projected path chart outlines a clear trajectory targeting the upper Fibonacci extensions, specifically the 4.236 level at $4,055 owever, price action is still suppressed below the EMA50 at $3,935 and the EMA200 at $4,001. Supply dynamics and physical backing also deserve attention, though short-term price action is currently dictated by derivative traders rather than physical accumulation ⚠️ liquidity is another concern, recent volume spikes confirm that market makers are highly active, making XAUT vulnerable to sharp whipsaws when buying or selling activity changes would focus on actual spot participation above the moving averages rather than assuming that a simple technical indicator crossover alone can create a sustained rally💧 Key figures: $3,894.11 current price area $3,950.90 24h high $3,851.40 24h low $3,884.80 immediate support $3,925.07 first resistance $3,949.96 secondary resistance $4,055.41 macro target EMA50 at $3,935.65 EMA200 at $4,001.20 10.00M 24h turnover volume 👀 Bullish confirmation, reclaim $3,925.07 and hold above the EMA50 at $3,935.65 with stronger spot volume that would put the $3,949.96 and $3,990.24 levels in focus, with further recovery possible toward the $4,055.41 target 📈 🧐 Bearish confirmation, lose $3,884.80 and fail to recover it, would expose the recent low of $3,851.40, followed by lower price discovery if selling accelerates and liquidity remains weak 📉 Tether Gold has experienced a violent technical breakdown followed by a sharp relief bounce, but the market still needs evidence that this momentum is sustainable decisive signal is whether real ecosystem activity translates into stronger spot buying and whether buyers can establish acceptance above the EMA50 until then, projected move toward $4,055 remains a developing technical setup rather than confirmed token price strength 🐻 #IMPACTbyTrade $BTCUSDT #USInflationRunsHotAndRateHikeBetsRise

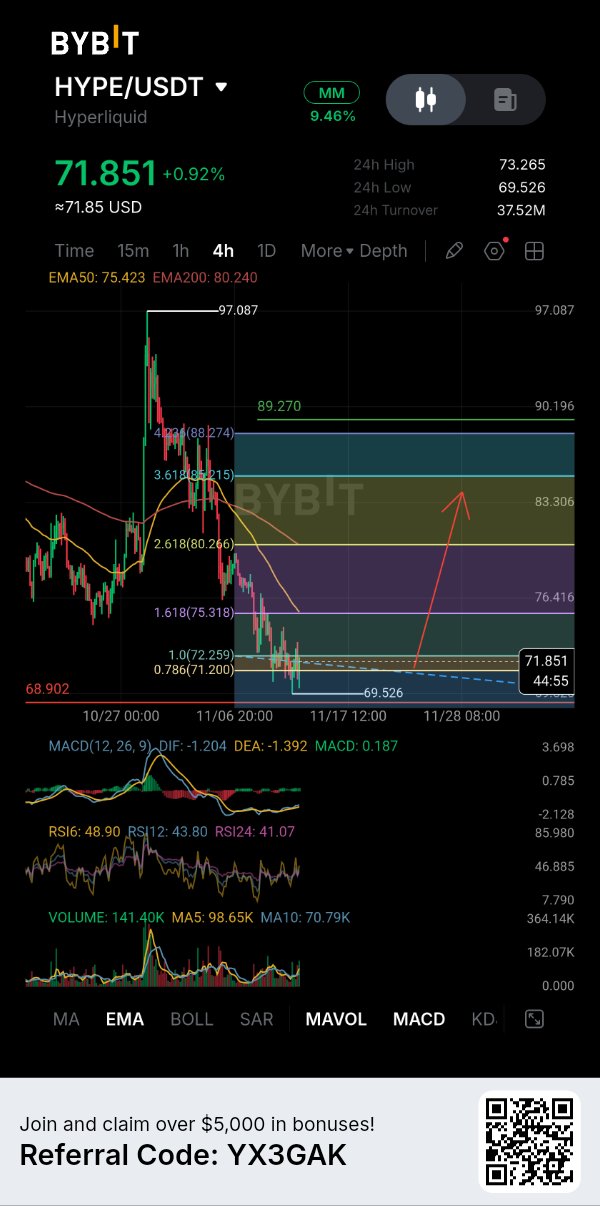
$HYPEUSDT will turned bullish when bounced from the 0.786 Fibonacci level, now i'm positioned for a continuation near $72 , here's what changed my short-term view bigger downtrend from the $97 high hasn't disappeared, but something interesting is developing on the 4H chart, and I don't want to ignore it price made a sharp low at $69.526 and has started to recover. At the same time, the MACD is printing a bullish crossover with the histogram turning positive that's a strong signal. It suggests sellers are losing control, and the momentum behind those downward moves is fading short-term RSI is now around 48.90, crossing above the RSI12 at 43.80 and the RSI24 at 41.07 This is an early improvement, not confirmation of a full trend reversal I'm heavily bullish on the possibility of a strong recovery from this area Structure I'm Watching HYPE is attempting to stabilize around $71.85 after a prolonged decline. If buyers reclaim the nearby $72.259 resistance (the 1.0 Fibonacci level) and establish a higher low, that would be my first meaningful sign of improving market structure confirmed bullish market structure shift could open the way toward $80.266, followed by larger resistance region around the EMA200 at $80.240 and the 3.618 level at $85.215 ultimate target for this setup is $85.21 I'm not restoring my previous $100 prediction. This is a separate recovery trade based on the developing 4H indicators, with a specific entry, stop and exit objective possible long Position TP & SL i've already positioned for this potential reversal, and my setup is marked directly on the chart. Entry: $71.851 Stop-loss: $69.400 Take-profit: $85.215 Potential upside: 18.60% Defined downside: 3.41% Risk-to-reward: 5.45:1 these are the theoretical price-based returns before leverage, fees and slippage. My conviction is strong, but the risk is real. A move through $69.400 would invalidate my marked trade won't widen the stop simply because I'm expecting a bullish reversal here's the important distinction: a MACD crossover and RSI recovery can appear before a reversal, but they cannot guarantee one. that's why I'm watching for buyers to break the sequence of lower highs rather than relying on the indicators alone I've taken my position because I believe this developing setup offers an attractive opportunity relative to its defined risk bearish trend brought HYPE down to this area. Now I want to see whether weakening selling momentum can finally turn into real buying strength If that structure shift confirms, this recovery could become much more interesting #IMPACTbyTrade $BTCUSDT

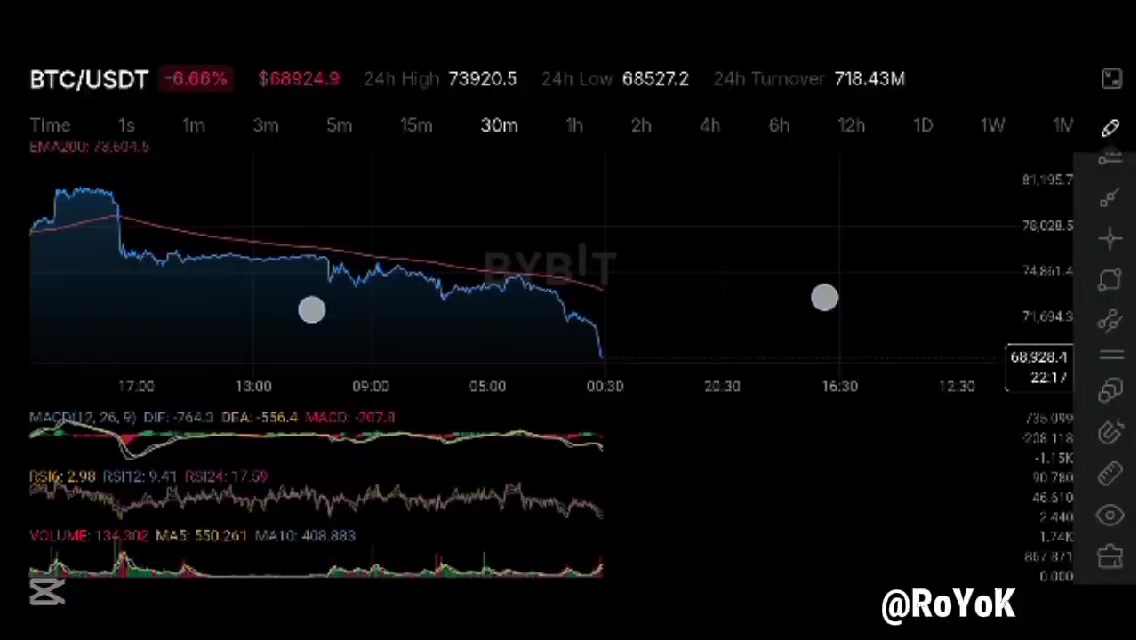
🚨 Emergency alert for $BTCUSDT , we are witnessing a brutal and continuous freefall as Bitcoin just shattered the critical 69,000 support level, currently trading around $68,861.9 market is in absolute panic mode, and the price is aggressively testing the bottom edge of this green demand block on 4hour chart This isn't just a healthy pullback; it's a severe structural breakdown, and current price action screams heavy capitulation as the bleeding continues What matters to me right now is the terrifying lack of buying support and sheer momentum behind this drop. Both the EMA50 at $74,520 and the EMA200 at $78,173 are completely detached from the current price, confirming a state of total freefall first important level to watch right now is the 24-hour low at $68,527. If Bitcoin loses this psychological and structural floor with a strong 4-hour close, fully expect a rapid cascade toward the $67,000 region chart shows a massive bearish projection, and the indicators align with this grim outlook MACD is deeply negative and expanding, while the RSI is completely crushed into extreme oversold territory however, in a strong downtrend, oversold conditions can persist for a long time. Bitcoin still needs to find a real floor, and want to see genuine order absorption before expecting any larger relief rally Risk Management main supply zone i'm watching is the recent breakdown area around $72,600 to $73,920. A convincing 4-hour close back above this region would seriously weaken my bearish outlook and signal a potential deviation Since we are in such a violent freefall and I haven't confirmed an exact entry and stop-loss, I'm not assigning an artificial risk-to-reward ratio to this setup i'm interested in shorting weakness on any minor bounces, but i don't need to catch the exact top of a dead cat bounce i'd rather miss the first part of a retracement than enter too early and watch the price get absolutely crushed by another wave of panic selling for now, I'm giving Bitcoin time to bleed out and prove that buyers are willing to step in if $68,527 completely collapses, the extended downside targets become a total bloodbath #IMPACTbyTrade #BitcoinHitsTwoMonthLowAfterUSMidterms $ETHUSDT
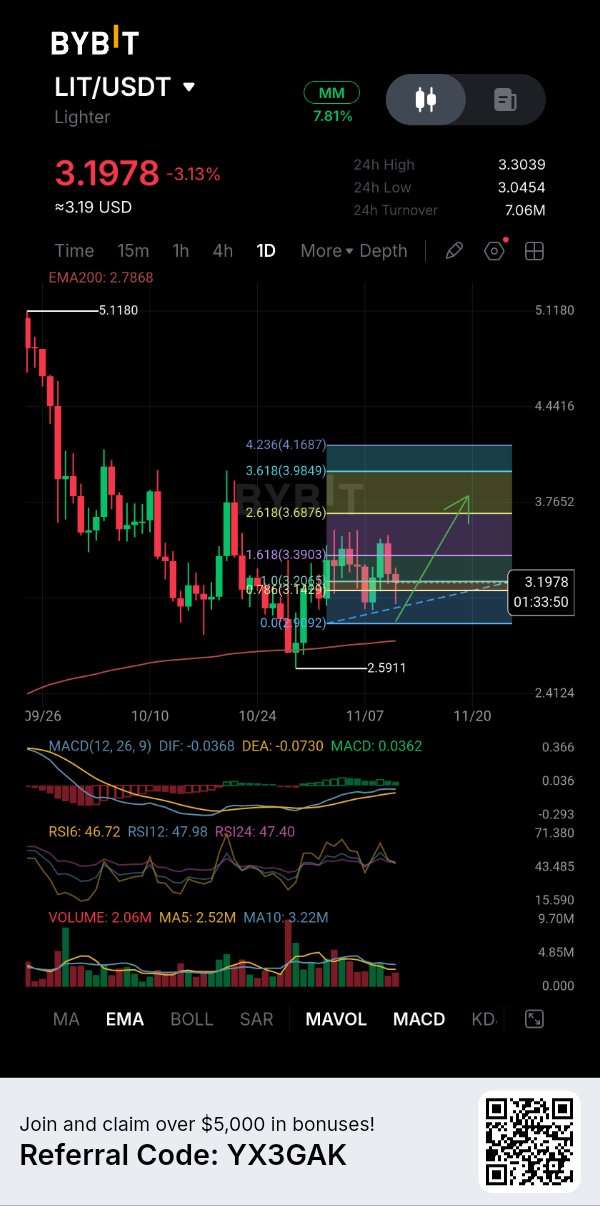
$LITUSDT alert brutal downtrend is stalling, but the bulls are facing a massive wall with EMA200 like dinamic support 😏 expected a stronger bounce after the sweep down to $2.59, opening a clear path back toward the recent highs instead, LIT is struggling to hold momentum right at the $3.20 level liquidity sweep is not the same as a confirmed trend reversal, and the strong bullish volume I wanted to see is fading won't keep defending a bullish prediction just because it was my original plan short-term bias is now neutral to bearish until we clear local resistance chart shows the next areas I'm watching. LIT could get rejected here and move back down into the $2.78 EMA200 area before another move higher important upside levels are $3.48 and $3.90, where the next major liquidity sits, but those levels are not automatic buy signals want to see an internal market structure shift, a Wyckoff spring, or another clear bullish confirmation before considering aggressive longs long-term outlook remains cautiously bullish, with $4.16 and the $5.11 highs as potential future targets if the market structure turns positive again I'll wait for a failed reclaim of the $3.50 area before considering a short and a confirmed reversal above the $3.90 Fibonacci level before considering a long Every setup needs a clear invalidation level, a protective stop and controlled position sizing. I'll calculate the risk to reward when entry and stop levels are confirmed. I'm not a financial advisor Solana is showing a different picture, SOL has already recovered strongly from its recent lows and is showing massive relative strength compared to LIT, which is still chopping around its mid-range relative strength makes me cautiously bullish on SOL in the short term and strongly bullish longer term. I'm more interested in a confirmed SOL spot setup right now, although further market-wide weakness remains a risk Would you trust a quick LIT breakout above $3.50, or wait for a retest of the $2.78 EMA200? #IMPACTbyTrade $SOLUSDT #USInflationRunsHotAndRateHikeBetsRise

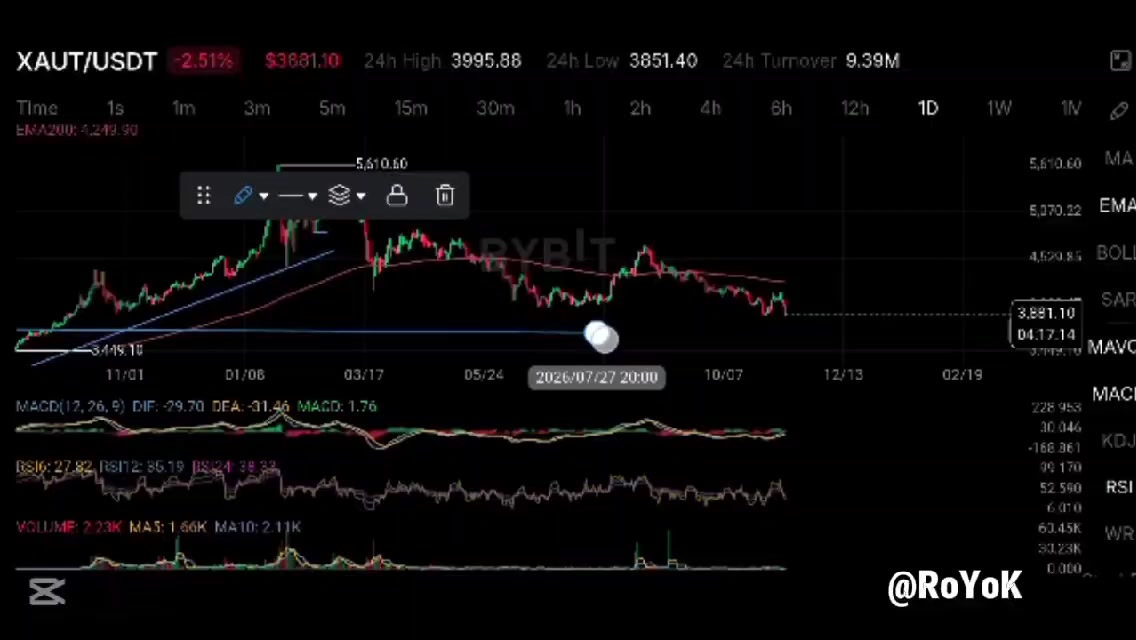
$XAUTUSDT gold market just experienced a catastrophic collapse that wiped out billions in market value, but the daily chart is now flashing a potential short term bullish signal that traders cannot afford to ignore 😱 gold plummeted over 3% on November 12, 2026, breaking below the psychological $4,000 barrier and touching its lowest level in over a year at $3,851 sell-off was relentless, marking a third consecutive session of heavy losses catalyst behind this crash was a perfect storm of macroeconomic pressure. Stronger-than-expected US inflation data and hawkish comments from several Federal Reserve officials cemented expectations for another interest rate hike next month this triggered a massive rally in the US dollar, which surged to a 19-month high, making gold significantly more expensive for foreign buyers and crushing demand for the non-yielding metal But here is where the chart gets interesting despite the bearish fundamental backdrop, the technical structure at the current level suggests the market may be oversold and primed for a violent relief bounce price has just tested a major demand zone around $3,851, which aligns with the lows from October 2025, and is already showing signs of rejection with a strong bullish reaction candle forming on the daily timeframe if buyers can sustain this momentum, the immediate upside target sits in the $4,053 to $4,265 supply zone successful reclaim of this area would not only confirm a short-term reversal but would also put the price back above the critical EMA200, which currently sits at $4,249 However, want to be very clear about the risks this is a counter-trend trade, broader trend remains firmly bearish, and the fundamental headwinds from the Fed and the dollar are still very much in play for this long setup to have a high probability of success, need to see the price hold above the $3,851 support level and clear the initial resistance at $3,900 if the price fails to hold this support and breaks below the recent low, the entire bullish thesis is invalidated, and the next major support is not visible until much lower Management I will not blindly enter a long position simply because the price is oversold. I need to see a confirmed reversal structure, such as a higher low or a strong bullish engulfing candle, before committing capital My entry will be triggered on a break and close above the $3,900 resistance level. My stop loss will be placed strictly below the $3,851.40 swing low. My first target will be the $4,053 supply zone, with a secondary target at the $4,265 level daily close below $3,851.40 would completely invalidate this recovery plan drawing shows a possible route for a short-term bounce. Price must now confirm whether that route is open #IMPACTbyTrade $BTCUSDT
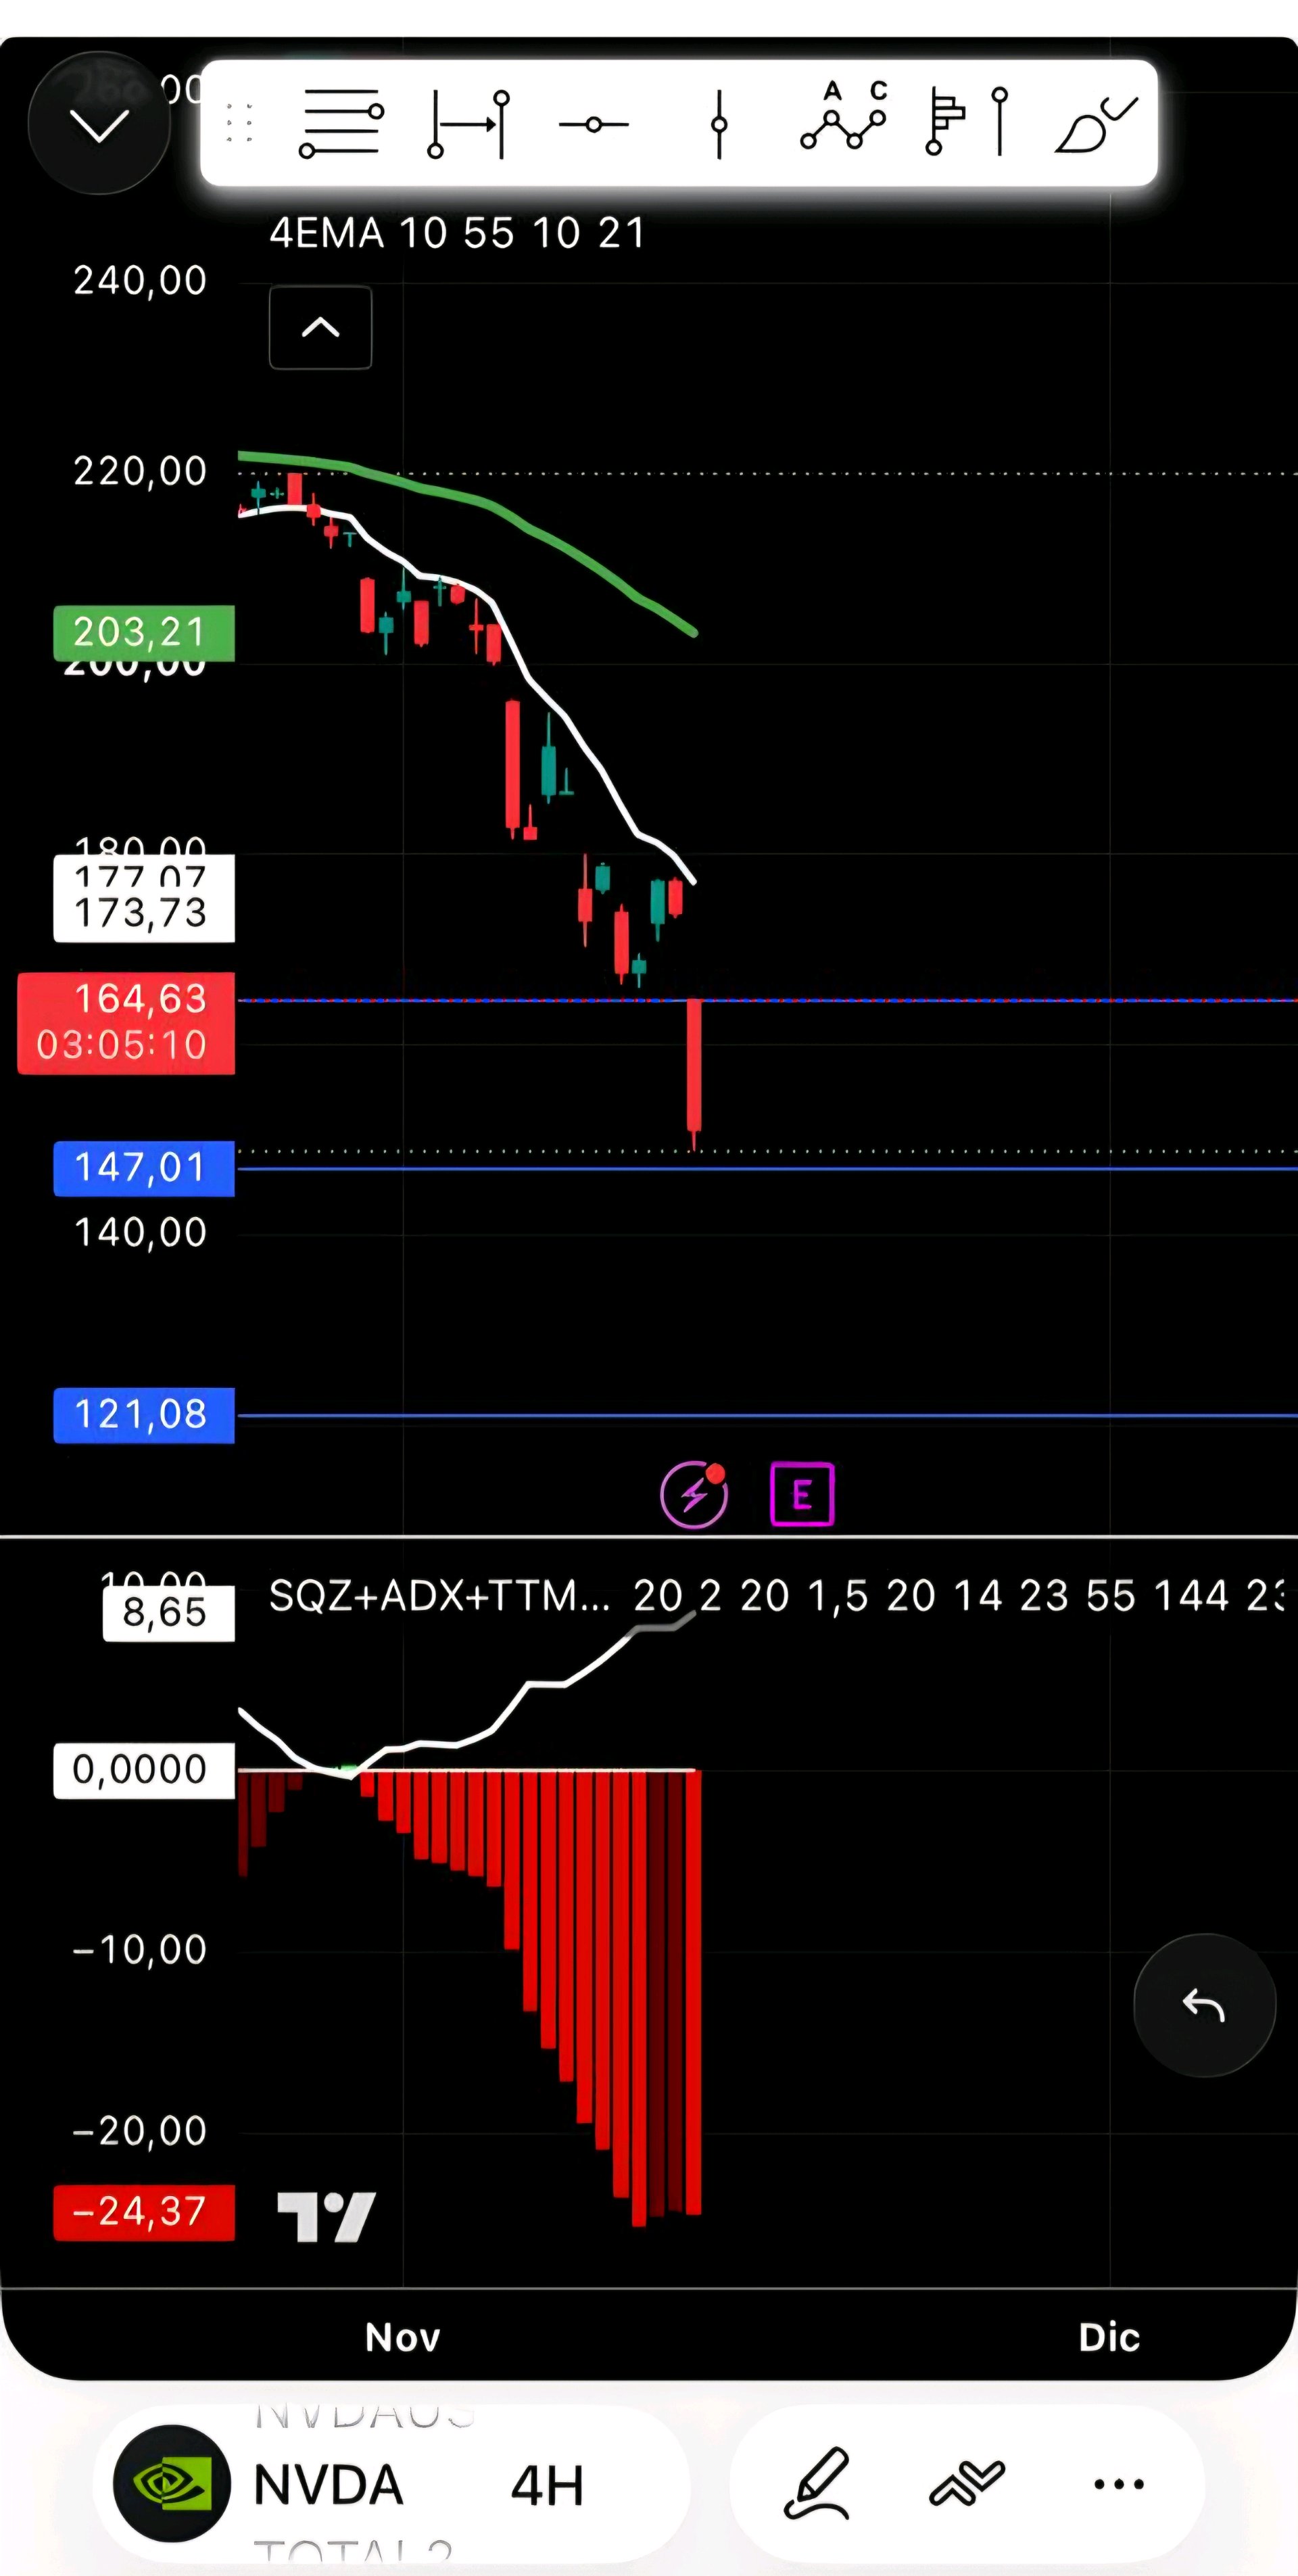
$NVDAXUSDT is hovering near $165.5, but bigger question is whether this violent plunge can generate enough spot demand to reverse the aggressive downtrend asset has moved beyond its parabolic run, introducing extreme volatility and heavy liquidations across the board however, the price is still trading close to local lows, creating a clear gap between market hype and technical capitulation 📉 NVDA recently traded near $164.63 on the 4-hour timeframe, facing immense selling pressure $173.73 to $177.07 area is the immediate resistance zone, while the $147.01 liquidity pool remains the first major support sustained reclaim of $180.00 would provide stronger evidence that buyers are returning. The broader structure remains heavily damaged after a massive drop from the $220.00 highs 📊 technical development worth watching is the sheer panic reflected in the recent price action. The chart just printed a massive red candle with a long lower wick, piercing directly into the first blue line at $147.01 before bouncing important question is how much of this selling is forced liquidation versus genuine trend continuation 🤔 Market structure provides another important angle, especially regarding those blue lines. The $147.01 and $121.08 levels are currently acting as prime long entries for contrarian buyers looking to catch a falling knife conversely, these exact same blue zones serve as aggressive take profit targets for short sellers who have ridden this massive wave down. Supply dynamics and order book depth also deserve attention, as bouncing off these lines will require immense buying pressure to absorb the overhead supply ⚠️ liquidity is another concern. The volume spike associated with the drop confirms that market makers are hunting stops, making NVDA vulnerable to sharp whipsaws when buying or selling activity changes would focus on actual spot participation at these blue lines rather than assuming that a single bounce will create a sustained V-shaped recovery 💧 Key figures: $164.63 current price area $177.07 immediate resistance $173.73 secondary resistance $147.01 first long entry and short take-profit $121.08 macro long entry and short take-profit -24.37 custom momentum indicator reading Bullish confirmation: Defend the $147.01 blue line and reclaim $173.73 with stronger spot volume. That would put $177.07 in focus, with further recovery possible toward the moving averages. 📈 Bearish confirmation: Lose $147.01 and fail to recover it. That would expose the next blue line at $121.08 if selling accelerates and liquidity remains weak 📉 NVDA has experienced a massive technical breakdown, but the market still needs evidence that this capitulation wick marks a true floor decisive signal is whether real spot buying translates into strength above $165 Until then, the chart remains a high-risk environment where the blue lines dictate battleground for both bulls and bears🐻 #IMPACTbyTrade $XAUTUSDT