shuja246
1486Like0Shares56Fans23Follow
Sharing market views, charts & lessons
Sharing market views, charts & lessons
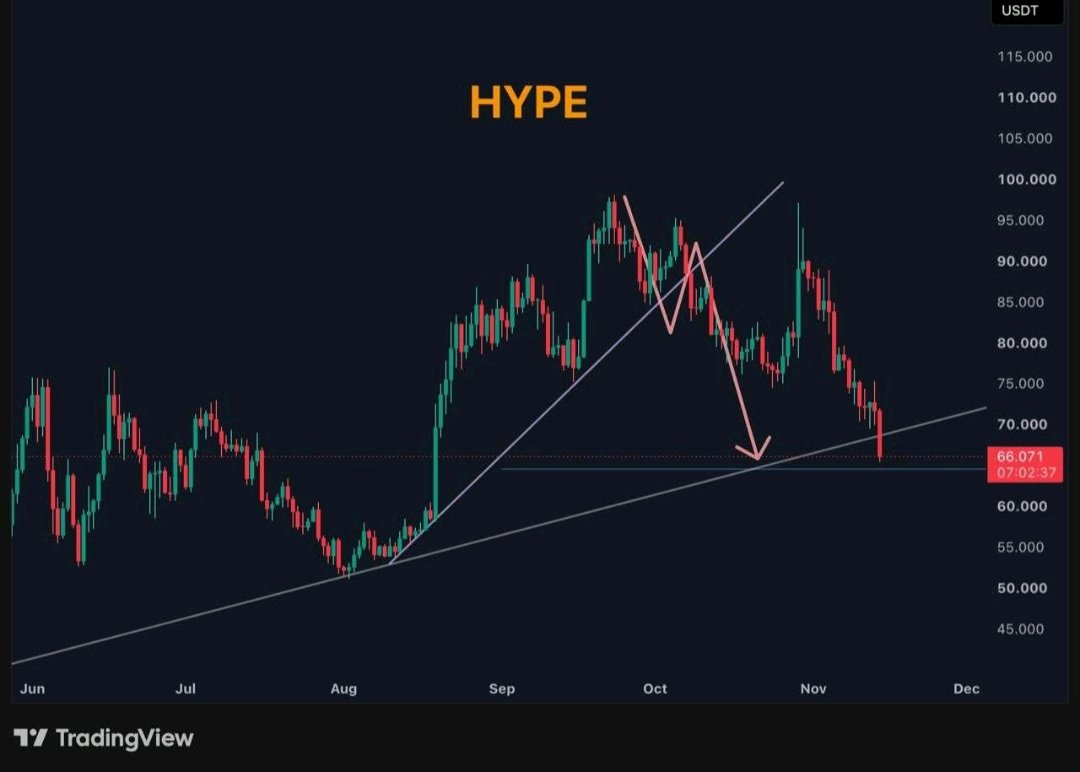
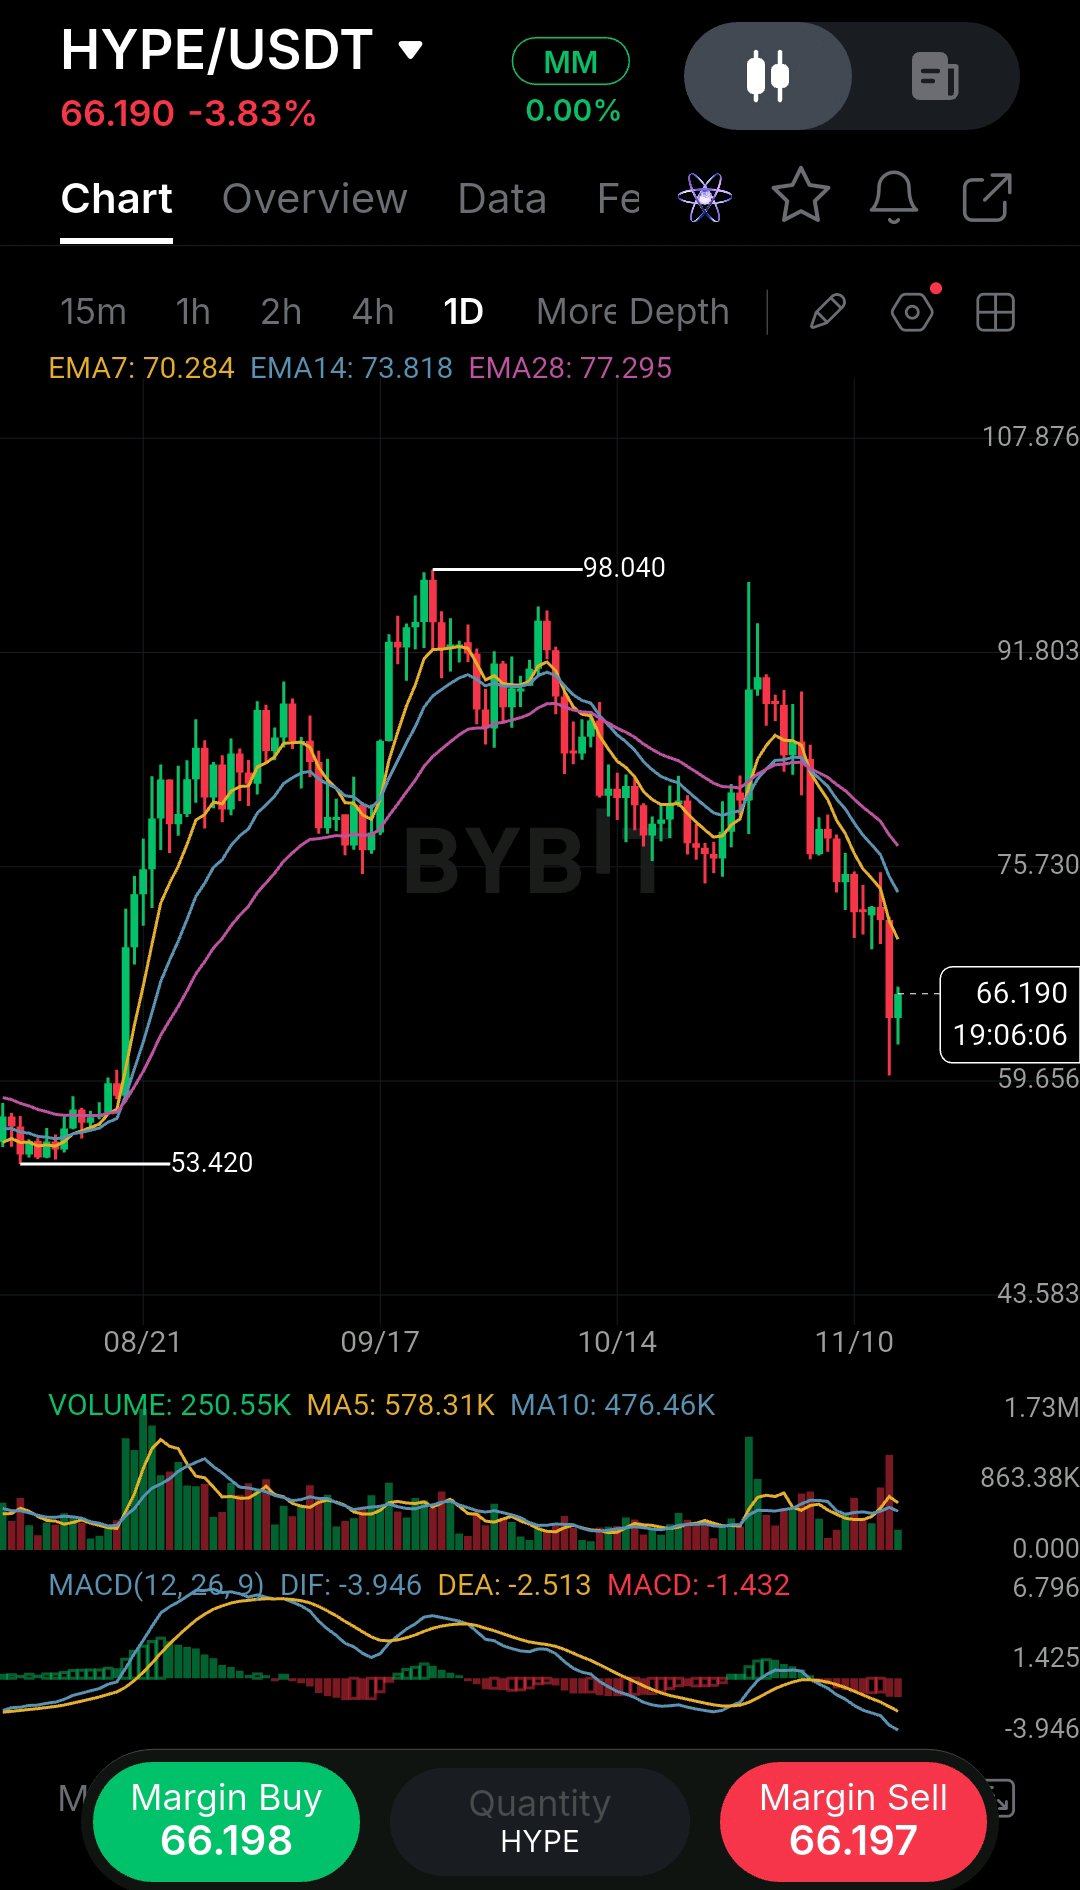
Everyone is posting this $HYPEUSDT chart today, but most people are reading it wrong. $66.071 | From $96 to $66 in one leg I am looking at this chart and I see 5 months of work in one picture. In August, HYPE was near $52. In September, it ran to $98. In October, it made a second top near $96 to $98 and failed. Now it is back at $66.071, sitting right on the rising trendline that has held since June. That trendline is not just a line for me. It is where every dip buyer from the last 5 months is sitting. If it holds, they will defend it. If it breaks, they will all sell at the same time. This is why I am not shorting $66. I have learned that shorting a 5-month trendline on the first touch is the most expensive mistake. Everyone sees the same breakdown, everyone shorts the same level, and then price bounces and traps them. My rule here is different. I need a close, not a wick. If HYPE closes below $66 and stays below it, then the trend is truly broken for me, and $59.65 opens next, then $53.42, that is the August low. If HYPE holds $66 and closes back above $70, that would be my first proof that dip buyers are still alive, then $73.81 opens. I am not chasing $66.071 in the middle. I am waiting for the market to tell me who is stronger, the trendline buyers or the breakdown sellers. Risk 1 to 2% only, 5x to 10x isolated max if I trade it. Otherwise I skip it. A trendline test is not a reason to go all in. Tell me honestly, do you trust trendlines like this, or do you think they break exactly when everyone is watching them? Give me your reason in one line, I want to read it. Tap $HYPEUSDT to trade this $66 trendline test with me, trade on this same coin #WSOT2026 #WSOTShowYourAITradeToEarn10USDT #JensenHuangExitTestsNvidiasAILeadership #USPPITestsTheHigherForLongerTrade #USInflationRunsHotAndRateHikeBetsRise @BybitX @Bybit Learn @612 Ceros @SignalX @Demon - Trader @GhostWriter @VietnexusCrypto @James @BitRase @BlockchainMaster

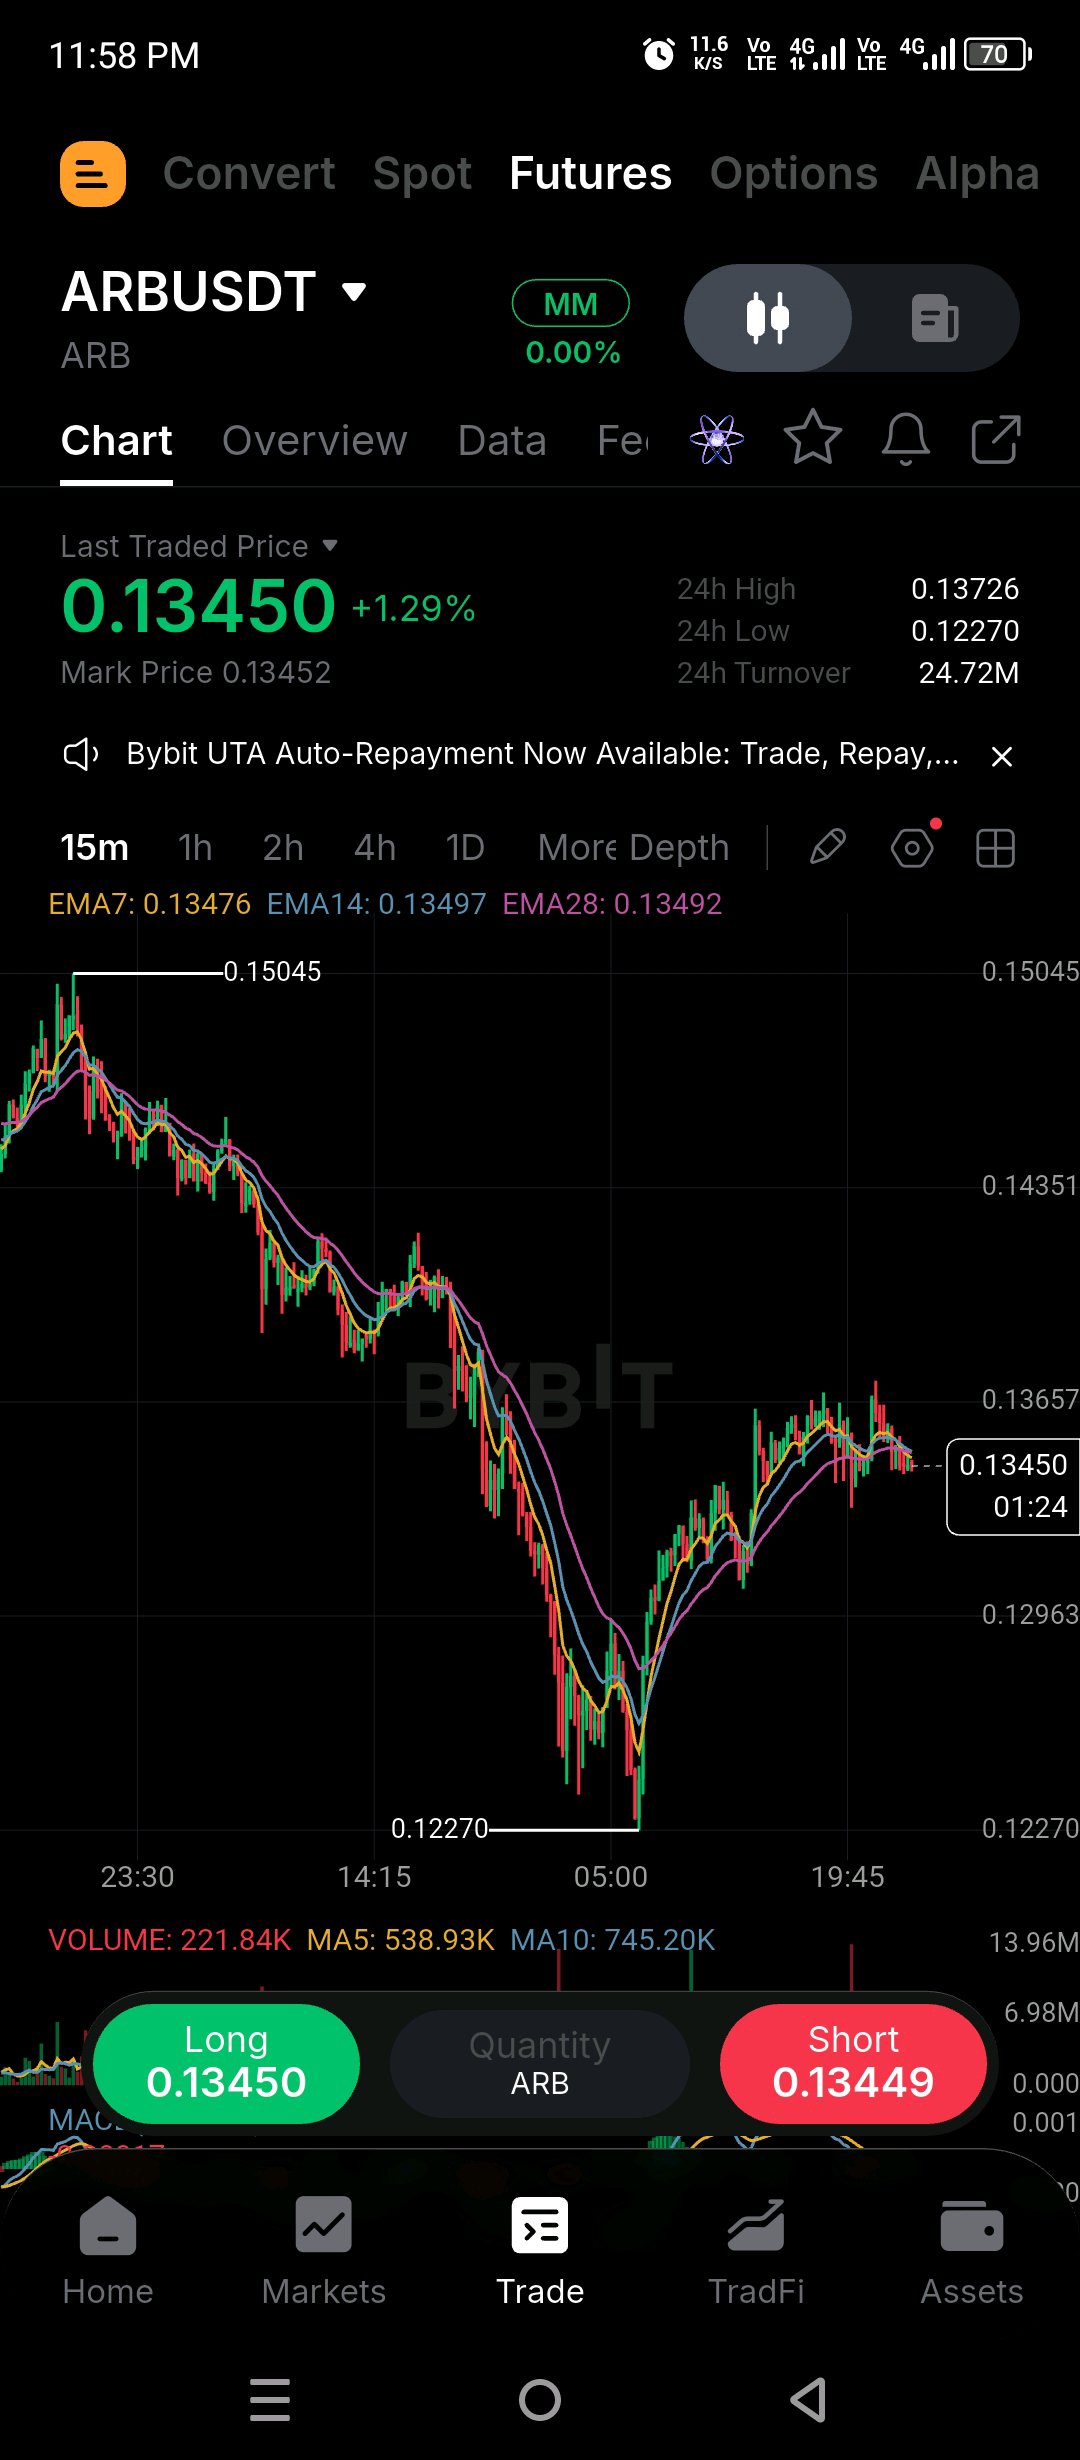
Arbitrum network is growing, but $ARBUSDT token is falling. That gap is the whole trade for me. I am looking at ARB at $0.13450 and I am confused in a good way. On one side, the network looks strong. DeFi TVL is around $1.306B, stablecoin supply is $3.804B, up 8.64% in 7 days, and tokenized real-world assets are around $1.013B. Capital is coming in. On the other side, ARB is down 21.99% in 7 days and 32.57% in 30 days. So why is price not following the network? I think the answer is simple and most people miss it. ARB is mainly a governance token. More people using Arbitrum does not automatically mean more people buying ARB. Network usage and token demand are two different things. Until ARB captures more value from that usage, strong fundamentals alone will not push price up. Then there is November 16. Two separate events are happening on the same day and people are mixing them up. First, about 92.65M ARB is scheduled to unlock, around 1.34% of circulating supply, worth around $12.6M. About 56.13M for team and contributors, 36.52M for investors. Unlock does not mean they will sell tomorrow, but timing is bad because price is already near lows. Second, the DAO is voting on whether to release 74.56M ARB and about 8,426 ETH that were frozen after the Oct 29 Binance hot-wallet exploit, to return them to Binance. Voting ends Nov 16. This is not new supply, it is a recovery decision. But it is a test of whether Arbitrum can handle emergency situations. Derivatives are also telling me a story. OI is only around $9.7M, funding is still positive near 7.09% annualized, and in the last 24h around $1.9M got liquidated, with about 92% from longs. That tells me leveraged bulls are still getting trapped while price stays low. My plan is not to buy $0.13450 in the middle. If ARB reclaims $0.1417 and holds above $0.1450 with real spot buying, that would be my first proof buyers are back, then $0.1500 to $0.1550 opens. If we lose $0.1245 and fail to get it back, then $0.1200 opens, then $0.1150 if selling speeds up. Risk 1 to 2% only, 5x to 10x isolated max if I trade it. Otherwise I skip it. I do not want to be long into an unlock with longs already crowded. Tell me what you think, does strong network growth mean ARB should go up, or is ARB just a governance token so it does not matter? Give me your reason in one line, I want to read it. Tap $ARBUSDT to trade this $0.1245 to $0.1450 range with me, trade on this same coin. #WSOT2026
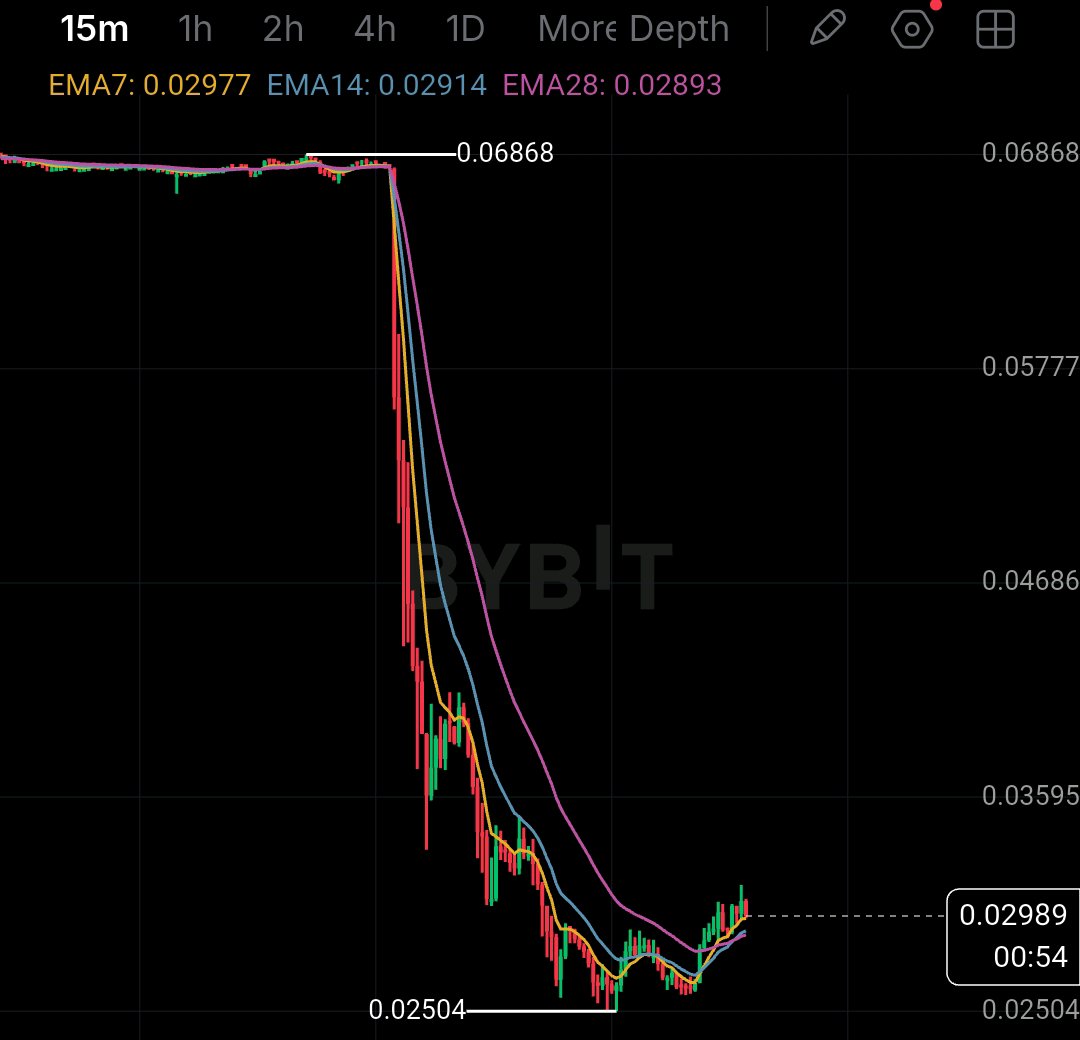
$KAVAUSDT just fell 63% in one move, and everyone is calling it cheap. I am calling it dangerous. I saw KAVA sitting at $0.06868, then in one brutal move it went to $0.02504. That is not a dip, that is capitulation. Price is now at $0.03018, trying to bounce, but I am not impressed yet. Here is why I am not buying this bounce blindly. On the 1D chart, price is still miles below EMA7 $0.05105, EMA14 $0.05854, and EMA28 $0.06315. When price is that far below all EMAs, the trend is broken. One green candle does not fix it. The only small positive I see is on the 15m chart. Price is back above EMA7 $0.02984 and EMA14 $0.02918 for the first time since the crash. That tells me some buyers are finally trying, but volume is already fading. This looks like a relief bounce, not a reversal. Cheap does not mean bottom. I have learned this the hard way. After a -60% crash, most people buy because it looks cheap, then they get trapped in a second leg down. My rule for KAVA is different now. I will not chase $0.03018. If $0.02504 holds and 15m stays above $0.02984, I will watch for a move toward $0.03682, that is EMA7 on 4h. A close above that would be my first real proof buyers are back. If we lose $0.02504 again, I stay out completely, no revenge trade. If I trade this, I risk only 1 to 2%, 5x to 10x isolated max. Otherwise I skip it. Skipping is also a decision. Be honest with me, would you buy this dip or skip it? Tell me why in one line, I want to read your reason. Tap $KAVAUSDT to watch this $0.02504 test with me, trade on this same coin. #IMPACTbyTrade
$HYPEUSDT at $66.19 after it lost $98.04 high and fell to $59.65, and tonight will decide if $70 gets reclaimed or $59.65 breaks again I saw HYPE at $65.922, sitting below EMA50 $79.139 and below EMA200 $69.78. Now it is at $66.19, still below all my EMAs. That tells me sellers are still in control, buyers have not taken back any major level yet. My bigger picture has not changed. We topped at $98.040, then we lost $79.139, then we lost $69.78, and now we are testing $66.19. On the 1D chart this is still a clean downtrend, not a bottom. MACD is still negative at -1.432, momentum is still down. For me $70 is the wall that matters tonight. That is EMA200 $69.78 plus the $70 psychological level plus EMA7 $70.284, all stacked together. If we close above $70 with volume, then $73.818 opens, then $77.295. That would be the first real sign buyers are back. For me $59.65 is the floor that must hold. That is the recent sweep low. If we lose it with a 1D close below, $53.420 opens fast, that is the August low. My plan is simple. I am not buying $66.19 in the middle, and I am not shorting here at the bottom after this big red candle. If we hold $59.65 and close above $70, I look long toward $73.818, stop below $59.65. If we get a rejection from a lower high below $70, then I look short toward $59.65, stop above $70. Risk 1 to 2% only, 5x to 10x isolated max. I want confirmation, not a chase. Tell me, does $70 get reclaimed or does $59.65 break? Comment RECLAIM if $70 comes back, BREAK if $59.65 breaks. Tap $HYPEUSDT to trade this $70 test, trade on this same coin @BybitX @Bybit Learn @612 Ceros @SignalX @Demon - Trader @GhostWriter @VietnexusCrypto @James @BitRase @RoYoK #WSOT2026 #WSOTShowYourAITradeToEarn10USDT #JensenHuangExitTestsNvidiasAILeadership #USPPITestsTheHigherForLongerTrade #USInflationRunsHotAndRateHikeBetsRise

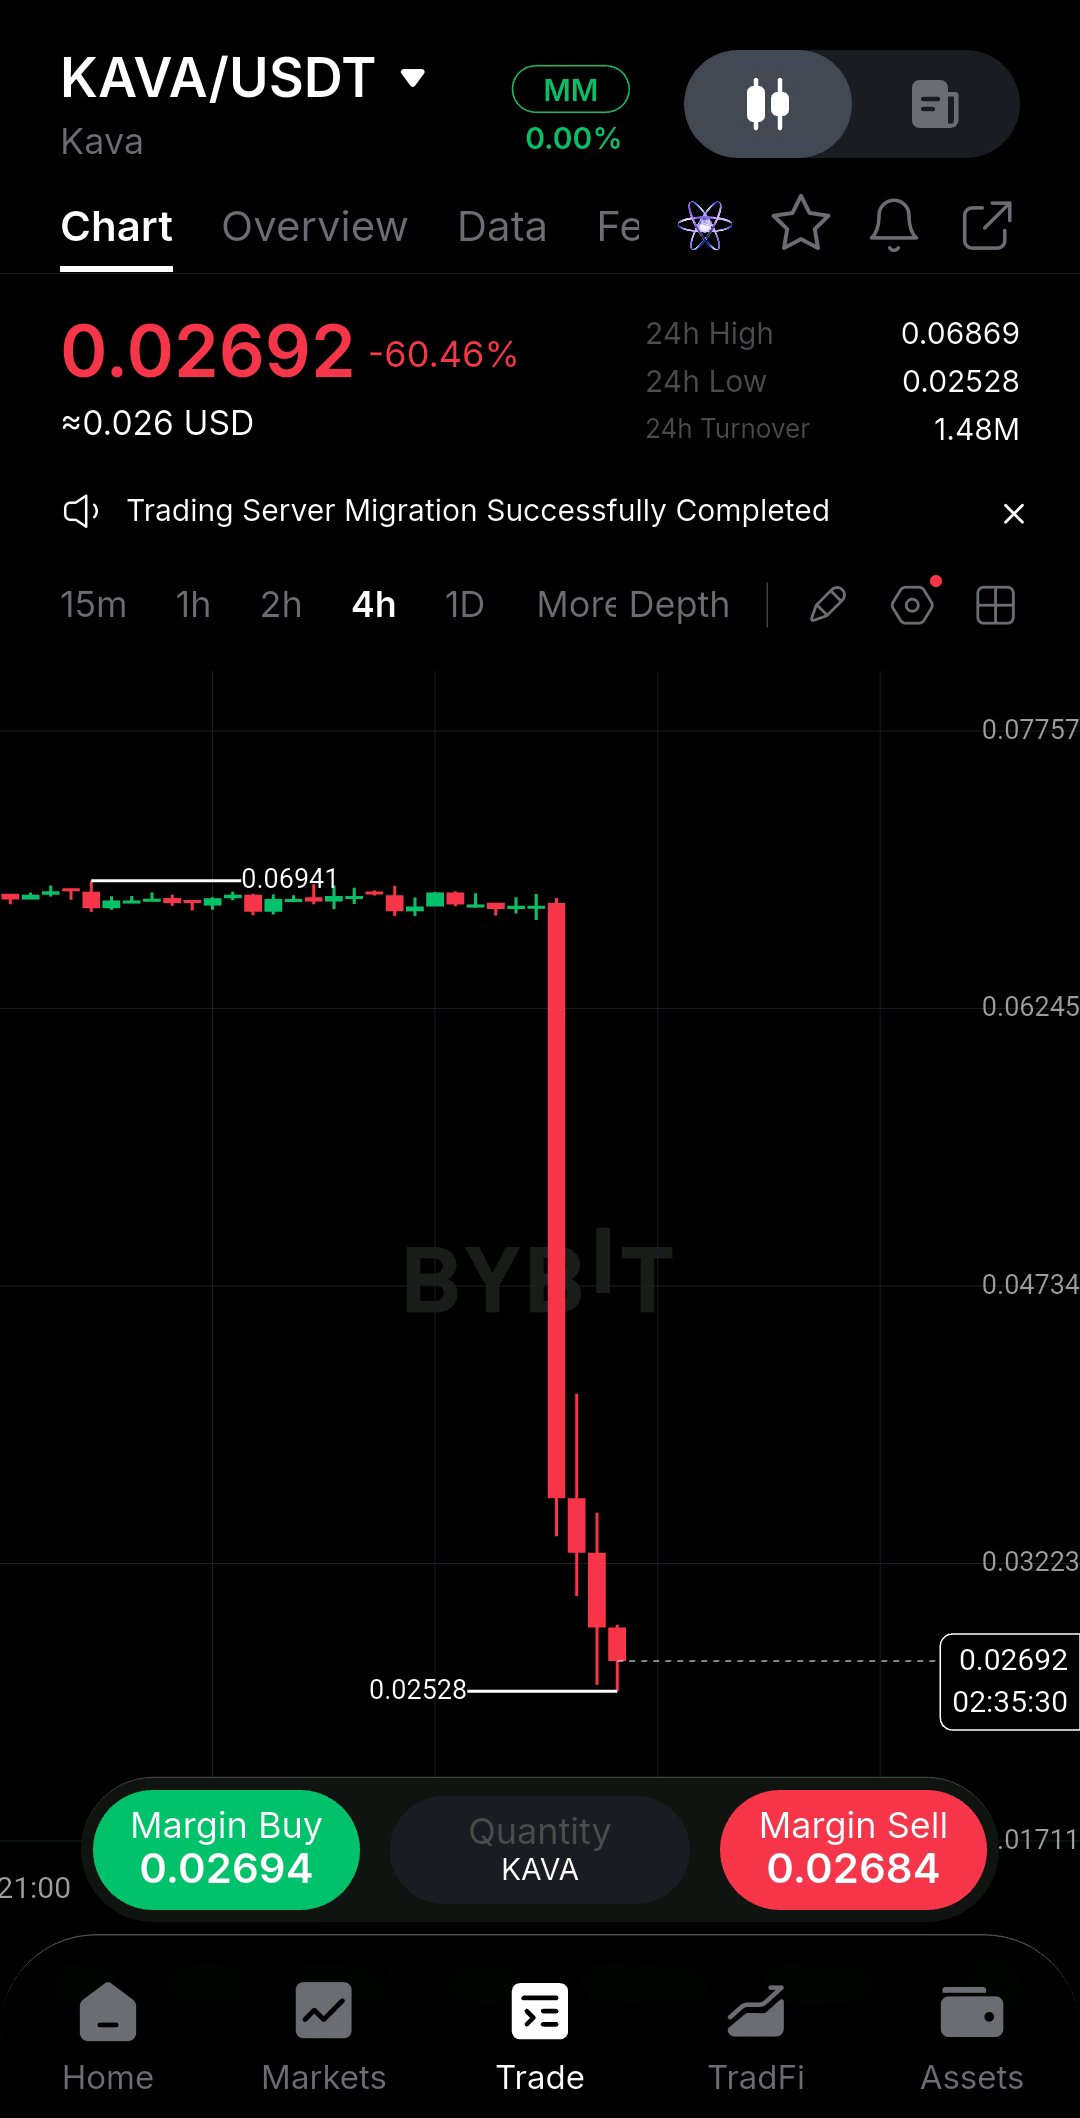
I am watching $KAVAUSDT at $0.02730 after it crashed -59.90% from $0.06874 to $0.02538, and tonight will decide if $0.02538 holds or a new low comes Live: $0.02730 -59.90% | H $0.06874 L $0.02538 | Vol 19.53M USDT I saw KAVA at $0.06888 and then one single candle sold it straight to $0.02538. That is not a normal dip, that is capitulation. Now it is at $0.02730, stuck just above the low. That tells me sellers destroyed the whole range in hours, buyers are only trying to stop the bleeding. My bigger picture has not changed. 7 days are -59.84% and 30 days are -60.40% and 1 year is -81.62%. This is still a clean downtrend, but today was panic, not a slow trend. When a coin loses 60% in one day, bounces are fast and traps are everywhere. I am not catching a falling knife here. For me $0.02538 is the floor that must hold tonight. That is the crash low. If we lose it with a 4h close below, a new low opens fast. On the upside $0.03278 is the first wall, that is the first bounce high after the crash. Break and hold above $0.03278 with volume and $0.04234 opens, then $0.05192. But $0.06874 is far away now, that is the level we lost. My plan is simple. I am not buying $0.02730 in the middle after a -60% crash. If we hold $0.02538 and close 4h above $0.03278, I look long toward $0.04234, stop below $0.02538. If $0.02538 breaks, I step aside, no revenge trade. Risk 1 to 2% only, 5x to 10x isolated max. This one is extremely volatile, Binance itself is warning about it, I am keeping size very small or skipping. Tell me, does $0.02538 hold tonight or does a new low come? Comment HOLD if $0.02538 holds, BREAK if a new low comes. Tap $KAVAUSDT to trade this $0.02538 test, trade on this same coin. #WSOT2026 #WSOTShowYourAITradeToEarn10USDT #JensenHuangExitTestsNvidiasAILeadership #USPPITestsTheHigherForLongerTrade #USInflationRunsHotAndRateHikeBetsRise @SignalX @BybitX @Bybit Learn @612 Ceros @BitRase @BlockchainMaster @RoYoK @IBLOLO
I lost money for 2 years until I learned this one trap, and now I never trade without it Live example: $BTCUSDT $65,443 after sweeping $65,066 I used to do what most traders do. Price breaks support, I panic sell. Price breaks resistance, I FOMO buy. I was always late. Then I realized something that changed everything for me. The market does not break a level to go in that direction. Most of the time it breaks a level to trap you. This is called a liquidity sweep. Smart money needs liquidity to fill big orders. Your stop loss is their liquidity. So price dips below a clear low, grabs all the stops, then reverses up fast. Same on top, price spikes above a clear high, grabs all the breakout buyers, then dumps. I saw it again on BTC. Everyone was watching $65,066. Price swept it, everyone sold, then price reclaimed it. The people who sold the break lost. The people who waited for the reclaim won. My rule now is simple, and I follow it every time: 1. I never sell the first break of support. I wait. 2. I wait for price to sweep the low and close back above it. That reclaim is my signal, not the break. 3. My entry is on the reclaim. My stop is below the sweep low. If price goes back below the sweep low, my idea is wrong, I exit. No hope, no averaging down. This is why I am not chasing $65,443 in the middle. If BTC holds $65,066 and closes above $69,134, I look long toward $72,597, stop below $65,066. If $65,066 breaks and fails to reclaim, I step aside. No trade is also a trade for me. Most traders lose because they trade the candle. I win because I trade the trap behind the candle. Patience is my edge, not indicators. Risk 1 to 2% only, 5x to 10x isolated max. I never risk my full account on one sweep. Tell me honestly, are you the one who chases the break, or the one who waits for the reclaim? Comment WAIT if you wait for the reclaim, CHASE if you chase the break. Tap $BTCUSDT to trade this sweep with me, trade on this same coin @BybitX @Bybit Learn #WSOT2026

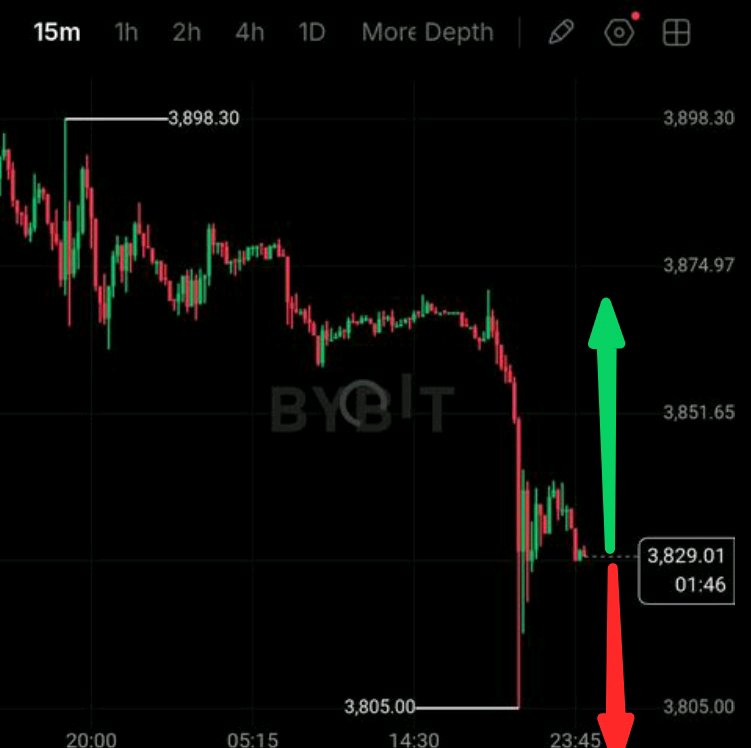
I am watching $XAUTUSDT at $3,829 after it lost $3,857 support and fell to $3,805, and tonight will decide if $3,805 holds or breaks I saw XAUT at $3,864, down -0.54% in 24h and -4.76% in 7 days. Now it is at $3,829, already below $3,857. That tells me the support from the article is gone and sellers took control. Buyers defended $3,805 for now, but $3,895 is still the wall I need to see reclaimed. The macro side is still heavy to me. Stronger US inflation, rising Treasury yields and a firmer dollar have brought back talk of more Fed tightening. Gold lost more than 4% in the week and is struggling to get back above $4,000. Since gold pays no interest, higher yields make it more expensive to hold. Friday's softer producer price reading gave some relief, but it has not changed the bigger trend. The backing side is still solid to me. Tether reported 827,417.63 oz of physical gold at Sep 30, exactly matching the 827,417.63 XAUT in circulation, valued near $3.44B, stored in Switzerland. KPMG checked the bars and gave an unqualified opinion on the 2025 statements. That strengthens the backing story for me, but it does not protect XAUT from a fall in gold's market price. Derivatives are still heavy. Futures OI is near $789.7M, about 27% of a $2.89B market cap, funding is still positive near +0.0128%. Spot and futures net flows are both negative. That tells me leverage is still high even while capital is leaving. For me $3,805 is the floor that must hold. That is the 24h low. If we lose it with a 15m close below, downside continues. If we hold $3,805 and reclaim $3,857, then $3,895 opens, that is the old range top. A close above $3,895 and then $3,900 would be the first sign of stabilization for me. A sustained move back above $4,000 would improve the recovery case. My plan is simple. I am not buying $3,829 in the middle after this break. If we hold $3,805 and close above $3,895, I look long toward $3,900 and $4,000, stop below $3,805. If $3,805 breaks, I step aside, short only on confirmed close below, stop above $3,895. Risk 1 to 2% only, 5x to 10x isolated max. I want spot confirmation, not just a leveraged bounce. Tell me, does $3,805 hold or does it break? Comment HOLD if $3,805 holds, BREAK if $3,805 breaks. Tap $XAUTUSDT to trade this $3,805 test, trade on this same coin #WSOT2026 #WSOTShowYourAITradeToEarn10USDT #JensenHuangExitTestsNvidiasAILeadership #USPPITestsTheHigherForLongerTrade #USInflationRunsHotAndRateHikeBetsRise @BitRase @BlockchainMaster @RichardWyckoff @RichardWyckoff @RoYoK @IBLOLO @Kiran @Mus Invest @BybitX @Bybit Learn

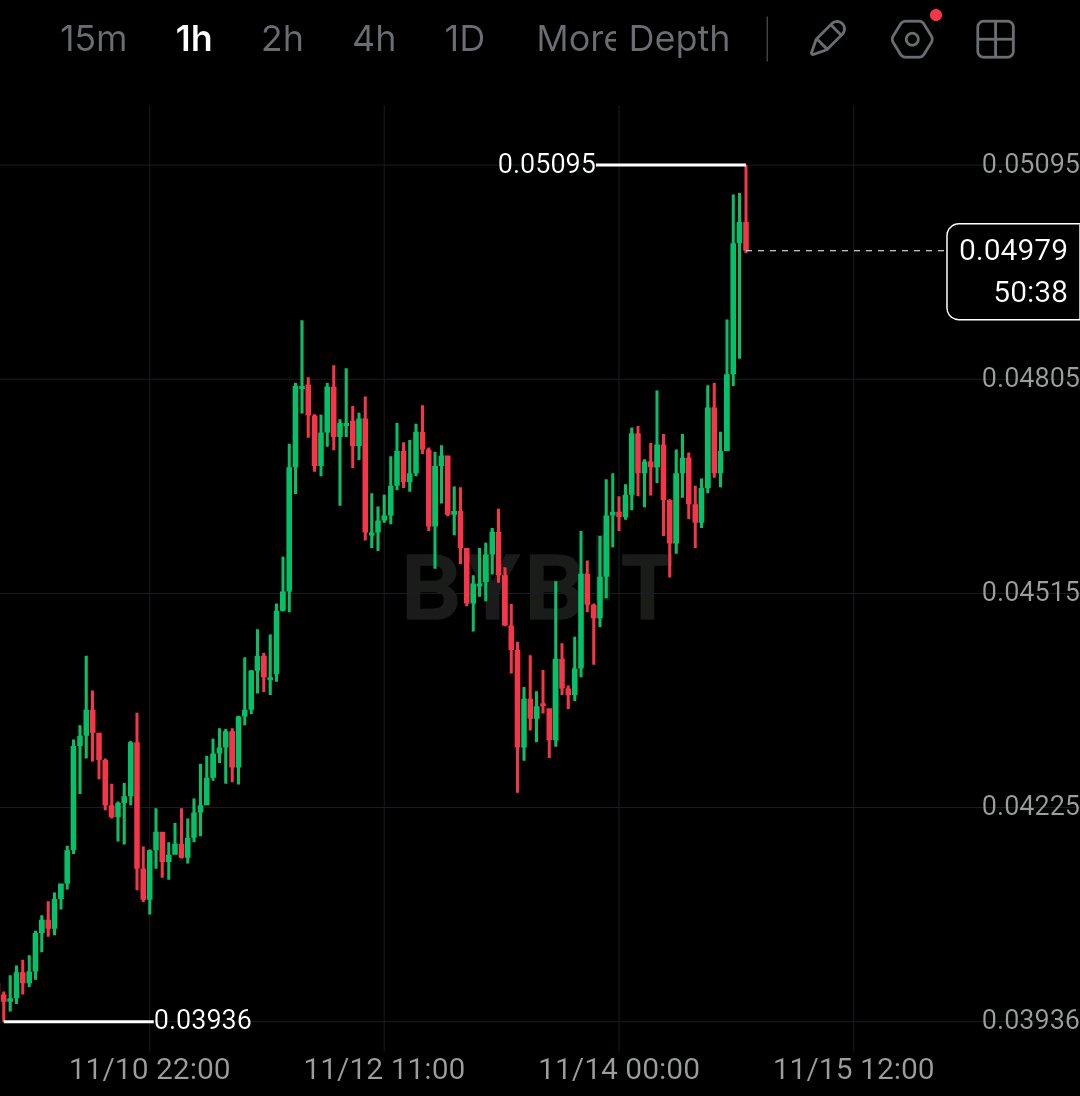
$NIGHTUSDT at $0.05038 after it broke $0.048 and tapped $0.05057, and tonight will decide if $0.048 holds as support or $0.04355 comes back I saw NIGHT at $0.0469, up 7.2% in 24h and 16.8% in 7 days. Now it is at $0.05038, already above $0.04794 and above $0.048. That tells me buyers finally took the resistance that was blocking this recovery after the Nov 13 pullback. My bigger picture has not changed. NIGHT is still about 60% below its Dec 2025 high near $0.119. So this is a recovery inside a bigger downtrend, not a full reversal yet. The story I like is Midnight building privacy with selective disclosure, letting users and institutions protect sensitive info while proving specific facts when needed. That positioning is real to me, but long term it still needs developer adoption, real apps, and sustained network activity, not just narrative. The part I am watching carefully is derivatives. OI is about $26.5M, up 11.1% in 24h, while funding is around -0.0323%. Futures volume is about $48.9M against spot volume about $14M, about 3.5x. That tells me shorts are still paying longs while price rises. That can squeeze higher, but it also means leverage is building. If spot demand fades, a failed breakout can reverse fast. Supply is also on my mind. About 16.61B NIGHT circulate out of 24B max, leaving about 7.39B outside circulation, about 30.8% of max. Future distribution still has to be absorbed by demand. For me $0.048 is now the floor that must hold. That was resistance, now it must act as support. If we hold $0.048 and close above $0.05057, then momentum stays with buyers. If we lose $0.048 with a 1h close below, $0.04355 opens fast, that is the prior range low. My plan is simple. I am not buying $0.05038 in the middle after this spike. If we hold $0.048 and close 1h above $0.05057, I look long, stop below $0.048. If $0.048 breaks, I step aside, short toward $0.04355 only on confirmed close below. Risk 1 to 2% only, 5x to 10x isolated max. I want spot confirmation, not just a leveraged squeeze. Tell me, does $0.048 hold as support or does $0.04355 come back? Comment HOLD if $0.048 holds, BREAK if $0.04355 comes. Tap $NIGHTUSDT to trade this $0.048 test, trade on this same coin. #WSOT2026 #WSOTShowYourAITradeToEarn10USDT #JensenHuangExitTestsNvidiasAILeadership #USPPITestsTheHigherForLongerTrade #USInflationRunsHotAndRateHikeBetsRise @BybitX @Bybit Learn @612 Ceros @SignalX @Demon - Trader @GhostWriter @VietnexusCrypto @James @PRADO @BitRase
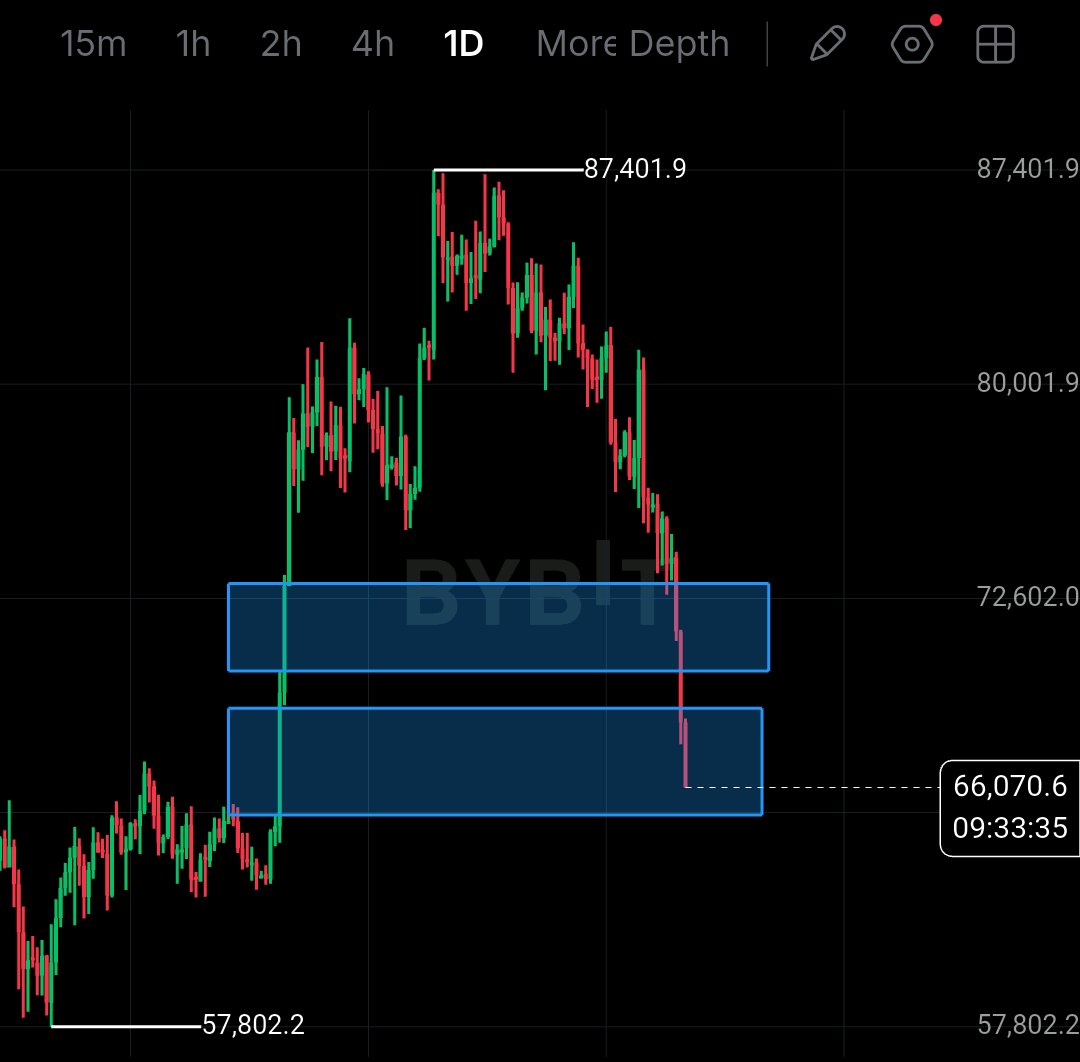
$BTCUSDT at $66,172 after it lost $69,494 high and fell to $66,116 low, and tonight will decide if $66,116 holds or $62,272 comes next I saw BTC open weak and get sold straight to $66,116. That is the new low for today and right under yesterday's breakdown. Now it is at $66,172, stuck just above the low. That tells me sellers are still in control, buyers are just slowing the fall. My bigger picture has not changed. On the 1D chart we topped at $87,401.9, then we lost the upper blue box, then we lost $68,554.8, and now we are inside the lower blue box. On the 1W chart we are still far below $126,195.5 high and still above $48,974.0 low. So this is still a clean downtrend on daily, not a bottom. For me $66,116 is the floor that must hold tonight. If we lose it with a 1D close below, $62,272 opens fast, that is the 1D low from August. On the upside $69,494 is the wall, that is today high. Break and hold above $69,494 with volume and $72,602 opens, then $74,837. My plan is simple. I am not buying $66,172 in the middle. If we hold $66,116 and close 1D above $69,494, I look long toward $72,602, stop below $66,116. If $66,116 breaks, I step aside, short toward $62,272 only on confirmed close below. Risk 1 to 2% only, 5x to 10x isolated max. This one is moving fast, I am keeping size small. Tell me, does $66,116 hold tonight or does $62,272 come next? Comment HOLD if $66,116 holds, BREAK if $62,272 comes. Tap $BTCUSDT to trade this $66,116 test, trade on this same coin #WSOT2026 #WSOTShowYourAITradeToEarn10USDT #JensenHuangExitTestsNvidiasAILeadership #USPPITestsTheHigherForLongerTrade #BTC #ByXIMPACT @BybitX @Bybit Learn @612 Ceros @BitRase @RoYoK @Kiran @Jiji715
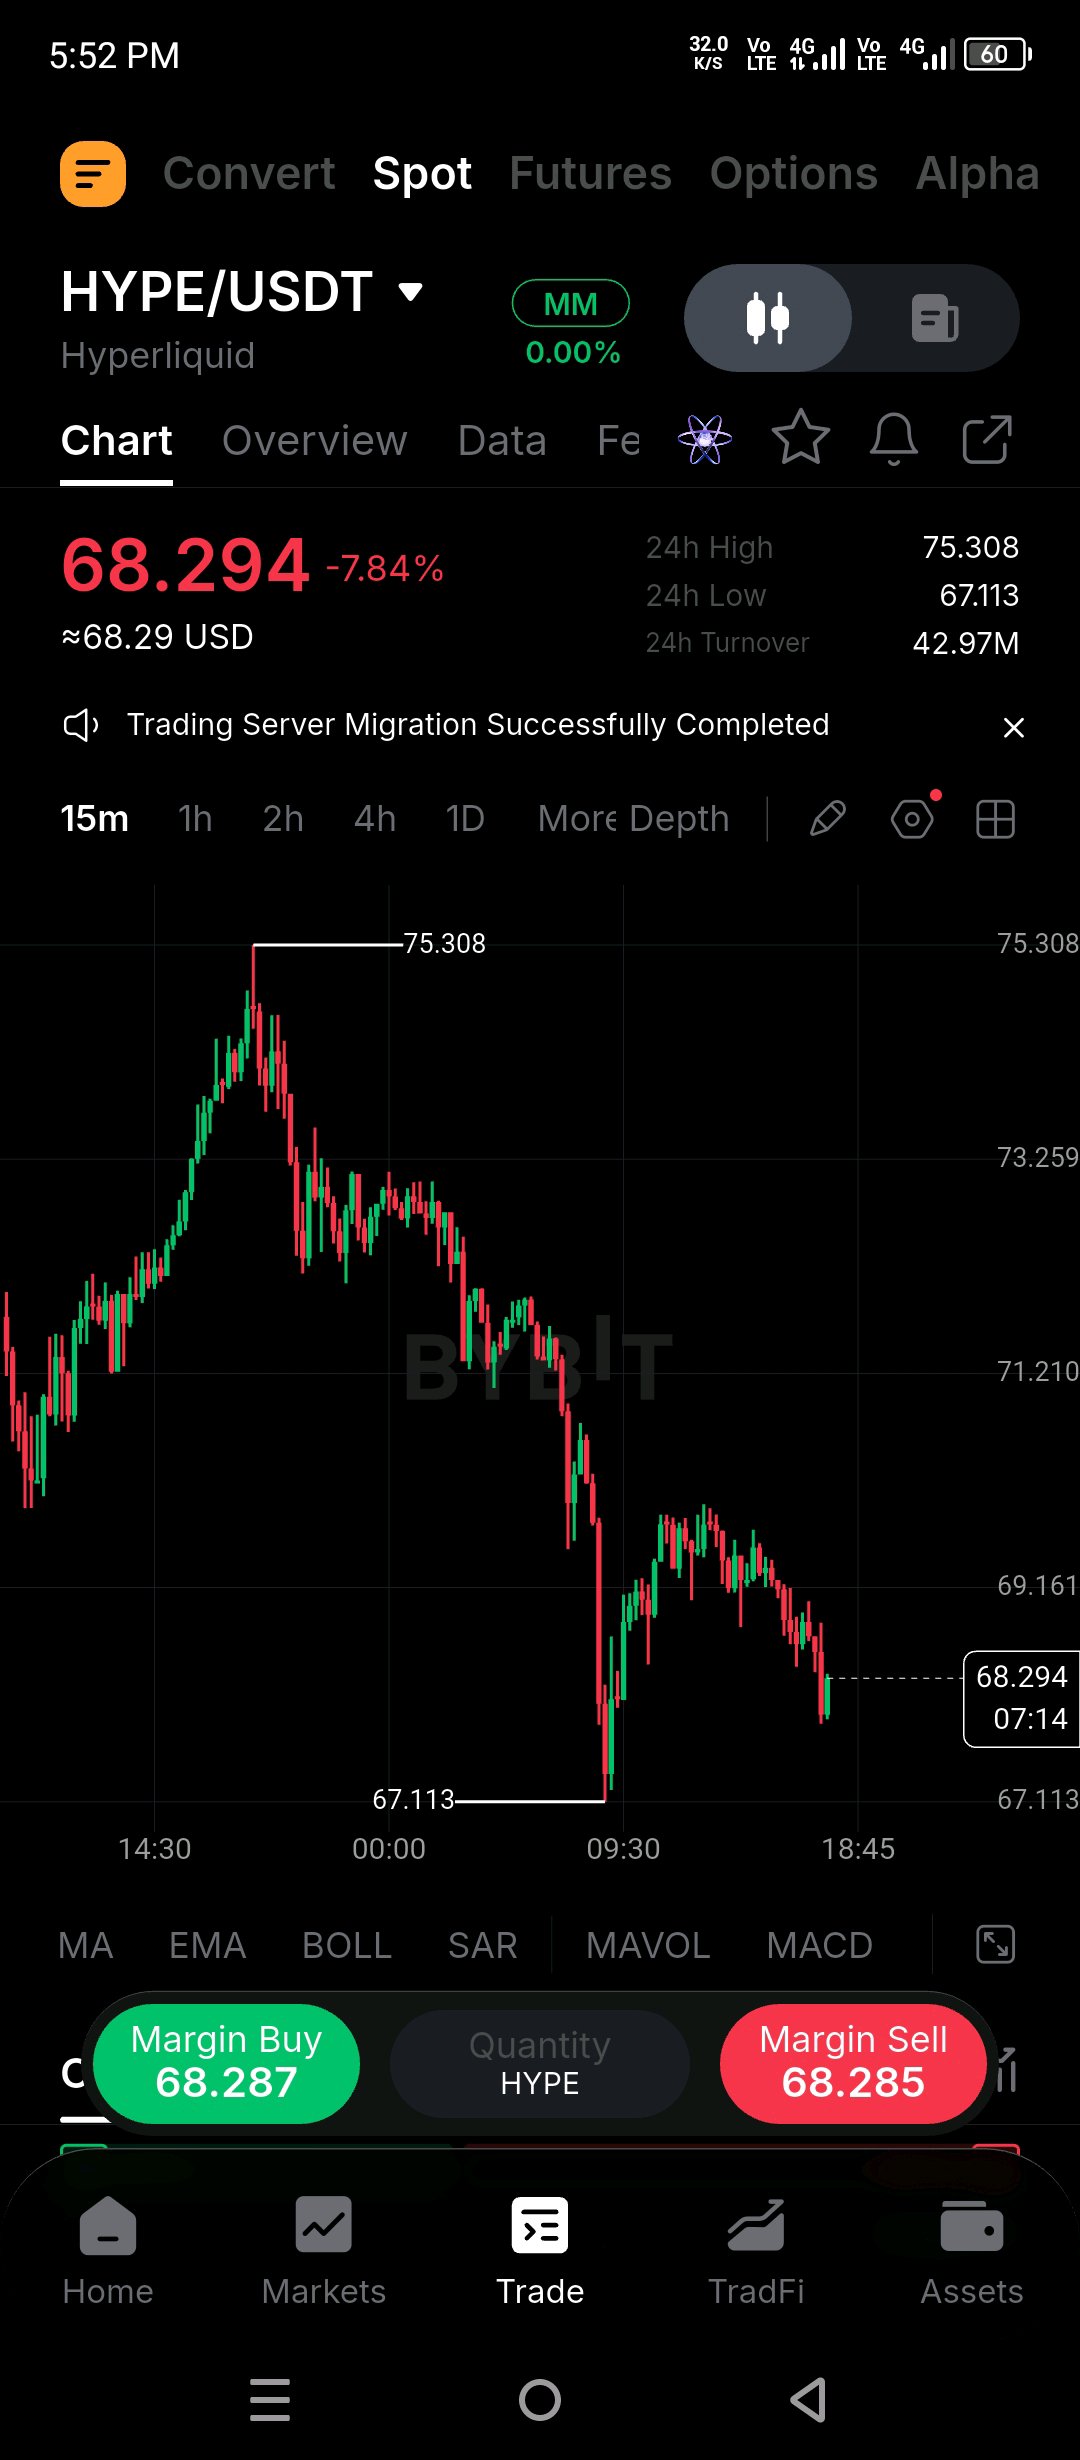
$HYPEUSDT at $68.31 and the business is making money but price is not listening I saw HYPE at $70.13, about 28.8% below its September record $97.96. That is not a small dip, that is a real correction. Buyers defended $69.62, but $75.19 is still the wall I need to see reclaimed. The fundamental side looks stronger than the chart to me. In the last 30 days Hyperliquid made about $90.5M in fees and $69.3M in protocol revenue. Its Assistance Fund spent about $58M buying 832,900 HYPE in that same period. That is real market demand to me, not just a story. But TVL fell 10.2% to $7.56B. That tells me capital is not expanding with the revenue engine. The part I am weighing carefully is supply. About 237.7M HYPE circulate out of 1B max. The next core contributor unlock is about 9.92M HYPE on Dec 6. Buybacks support demand, but they do not guarantee price goes up. That future supply has to be weighed against the Fund's ongoing buying. Derivatives are still heavy. Perp OI is near $2.63B, funding is still positive near 0.0029% per 8h. Leverage is still substantial, so a sharp move through support can accelerate liquidations in either direction. For me $69.62 is the floor that must hold. That is the 24h low area. If we lose it with a close below, $67.22 opens, that is the recent 30 day low. If we hold $69.62 and reclaim $75.19, then $80 opens. A recovery in TVL with continued Fund buying would make that $80 case stronger for me. My plan is simple. I am not buying $68.31 in the middle. If we hold $69.62 and close above $75.19, I look long toward $80, stop below $69.62. If $69.62 breaks, I step aside, short toward $67.22 only on confirmed close below. Risk 1 to 2% only, 5x to 10x isolated max. Tell me, does $69.62 hold or does $67.22 come next? Comment HOLD if $69.62 holds, BREAK if $67.22 comes. Tap $HYPEUSDT to trade this $69.62 test, trade on this same coin. #WSOT2026 #WSOTShowYourAITradeToEarn10USDT #JensenHuangExitTestsNvidiasAILeadership #USPPITestsTheHigherForLongerTrade #USInflationRunsHotAndRateHikeBetsRise @BybitX @Bybit Learn @SignalX @612 Ceros @GhostWriter @Demon - Trader @BitRase @BlockchainMaster @RichardWyckoff
$DOGEUSDT because it looks cheap, I am watching it because it is back in the same zone where the next big decision will be made I saw DOGE on the daily at $0.06588, sitting inside my green zone after a long fall. What matters to me is not just the price, it is how we got here. Long downtrend, break above the old descending line, a recovery try toward $0.10, then a complete loss of that momentum. That failed recovery tells me something important. Breaking a trendline alone is not enough. The market already proved that. My long term plan is built on behaviour, not on prediction. I am accumulating spot slowly in this area, but I am not calling this a confirmed bottom. I want to see DOGE stop making weak recoveries and start holding higher levels for longer. For me the first real proof would be a sustained recovery back through $0.10. If that happens, then I will judge if structure can expand toward $0.20. Only after those steps do my higher refs $0.43659 and $0.48573 become relevant to me. They are long term references, not promises and not immediate targets. My invalidation is different from a short term trade. I am not using leverage here, and I am not putting a tight stop on one daily candle. If DOGE loses the green accumulation area and starts holding below it, I will stop adding and reassess, I will not average down blindly. For my short term futures trade, I am watching $0.06299. If we hold $0.06299 and close above $0.06668, I look long toward $0.10, stop below $0.06299. If $0.06299 breaks, I step aside, short toward $0.06299 breakdown only on confirmed close below. Risk 1 to 2% only, 5x to 10x isolated max. My advantage here is not knowing the exact bottom. It is being willing to build exposure only while the larger structure gives me a reason to keep doing it. Tell me, do you think $0.06299 holds and $0.10 comes back, or does the green zone break? Comment HOLD if $0.06299 holds, BREAK if green zone breaks. Tap $DOGEUSDT to trade this $0.06299 green zone, trade on this same coin. #WSOT2026 @BybitX
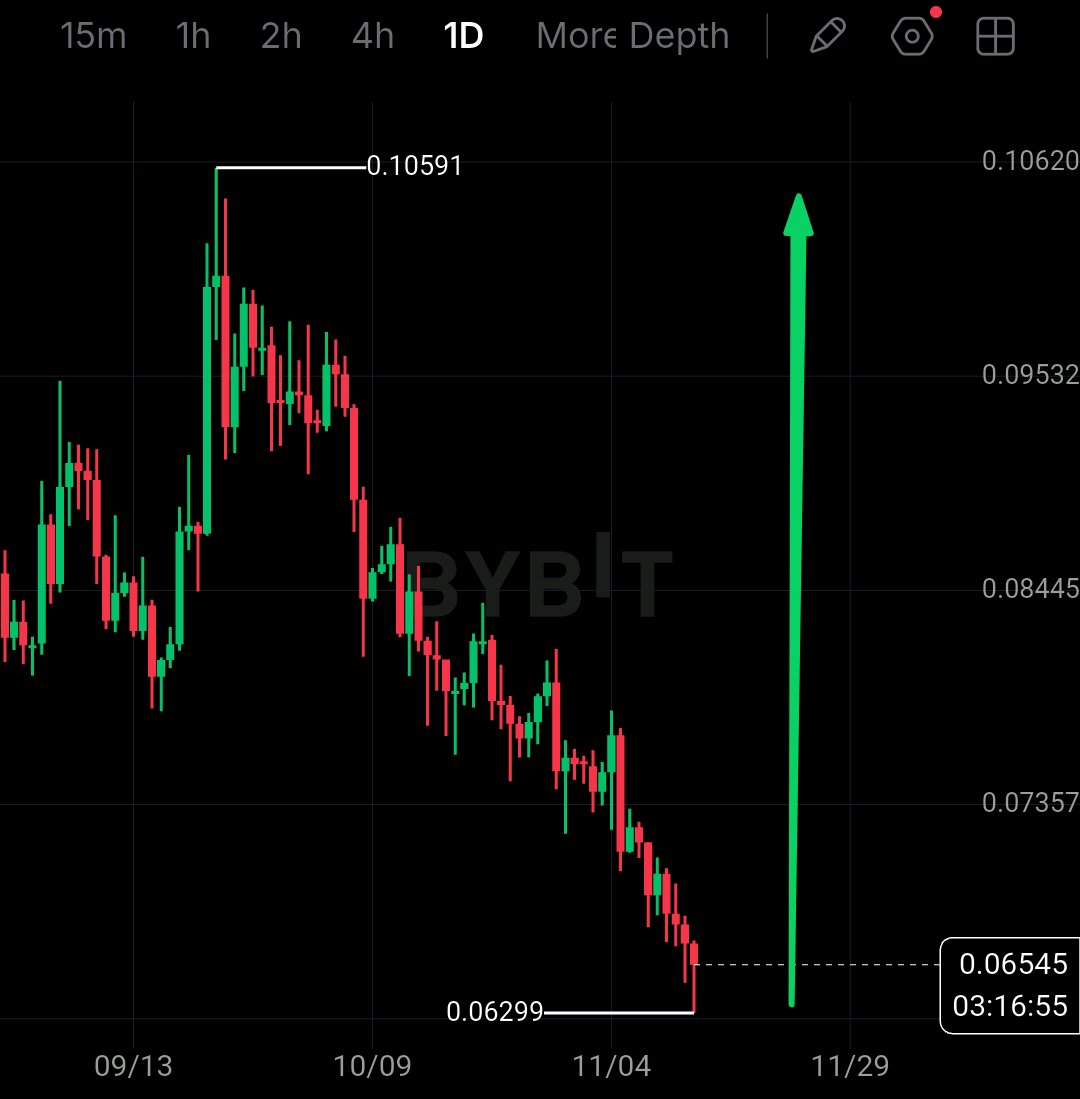
$DOGEUSDT because it looks cheap, I am watching it because it is back in the same zone where the next big decision will be made I saw DOGE on the daily at $0.06588, sitting inside my green zone after a long fall. What matters to me is not just the price, it is how we got here. Long downtrend, break above the old descending line, a recovery try toward $0.10, then a complete loss of that momentum. That failed recovery tells me something important. Breaking a trendline alone is not enough. The market already proved that. My long term plan is built on behaviour, not on prediction. I am accumulating spot slowly in this area, but I am not calling this a confirmed bottom. I want to see DOGE stop making weak recoveries and start holding higher levels for longer. For me the first real proof would be a sustained recovery back through $0.10. If that happens, then I will judge if structure can expand toward $0.20. Only after those steps do my higher refs $0.43659 and $0.48573 become relevant to me. They are long term references, not promises and not immediate targets. My invalidation is different from a short term trade. I am not using leverage here, and I am not putting a tight stop on one daily candle. If DOGE loses the green accumulation area and starts holding below it, I will stop adding and reassess, I will not average down blindly. For my short term futures trade, I am watching $0.06299. If we hold $0.06299 and close above $0.06668, I look long toward $0.10, stop below $0.06299. If $0.06299 breaks, I step aside, short toward $0.06299 breakdown only on confirmed close below. Risk 1 to 2% only, 5x to 10x isolated max. My advantage here is not knowing the exact bottom. It is being willing to build exposure only while the larger structure gives me a reason to keep doing it. Tell me, do you think $0.06299 holds and $0.10 comes back, or does the green zone break? Comment HOLD if $0.06299 holds, BREAK if green zone breaks. Tap $DOGEUSDT to trade this $0.06299 green zone, trade on this same coin. #WSOT2026 @BybitX
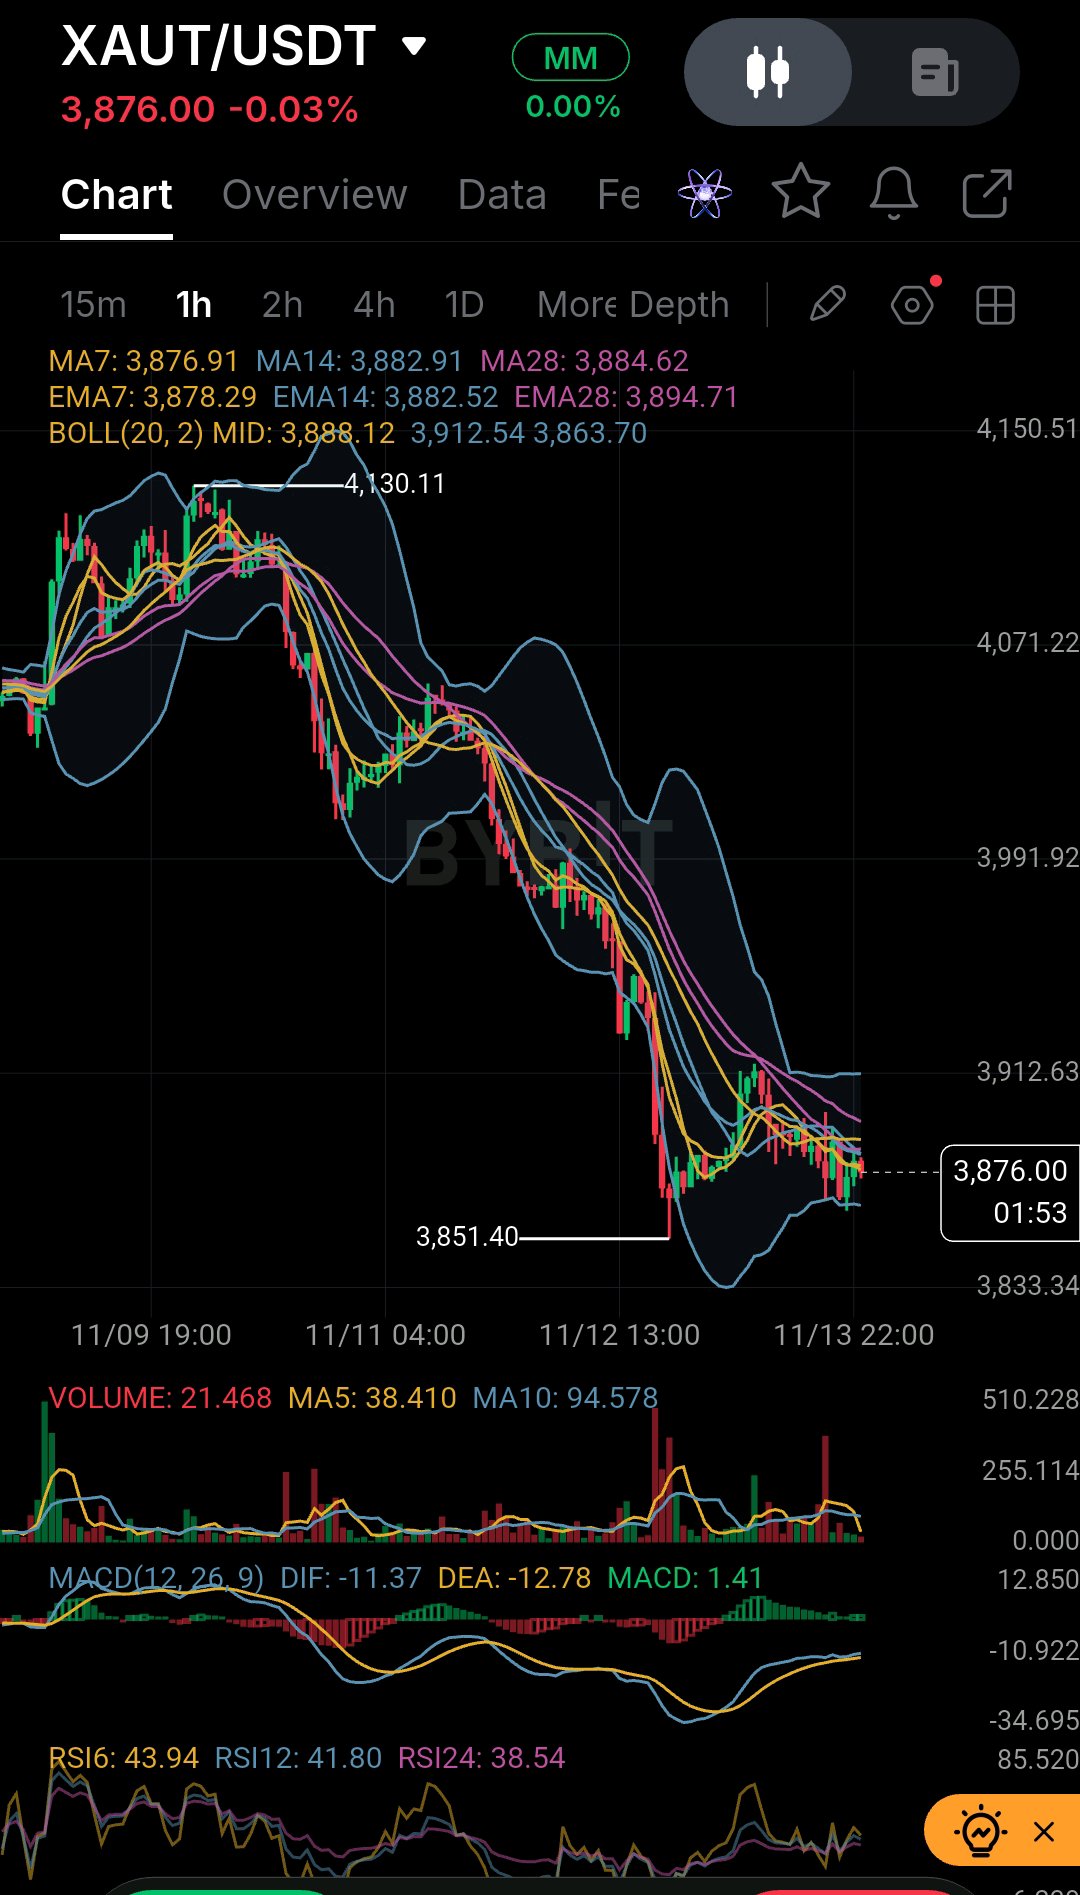
I am watching $XAUTUSDT at $3,881 after it bled to $3,861 and I think selling just dried up I saw XAUT fall hard to $3,861.78. That was a heavy bleed. Now it is back at $3,881.31, clawing its way up. Selling pressure looks dry to me, buyers are starting to show up again. I am checking the 1h chart carefully. MACD is showing a bullish crossover for me, DIF -11.65, DEA -13.11, fresh green histogram. That tells me bears are losing grip. RSI6 is at 49.45, perfectly neutral. It is not overbought, it is not oversold, it is just balanced. But I am not calling a reversal yet. Price is still trapped below my EMA cluster $3,883 to $3,896. SAR at $3,892.77 is sitting right above as a ceiling. Until we reclaim that ribbon, this is just a floor forming, not a breakout. For me $3,861.78 is the floor that must hold. That swing low is holding strong for me. If we lose it, my idea is wrong. My stop I marked is below $3,850. If bears breach $3,850, I eject immediately, no hesitation. My plan is simple. I am holding my bag from lower accumulation. If we hold $3,861.78 and close above $3,892.77, I look long toward $3,916.18, stop below $3,850. If $3,861.78 breaks, I step aside, short toward $3,850 only on confirmed close below. Risk 1 to 2% only, 5x to 10x isolated max. Tell me, are you holding your XAUT through this accumulation? Comment HOLD if $3,861 holds, BREAK if $3,850 comes. Tap $XAUTUSDT to trade this $3,861 floor, trade on this same coin. @BybitX @Bybit Learn @612 Ceros @SignalX @BitRase @BlockchainMaster @RichardWyckoff @RoYoK #WSOT2026 #WSOTShowYourAITradeToEarn10USDT #JensenHuangExitTestsNvidiasAILeadership #USPPITestsTheHigherForLongerTrade #USInflationRunsHotAndRateHikeBetsRise
$HYPEUSDT at $71.85 and my 0.786 Fib just changed my short term view I saw HYPE fall from $97.087 straight down to $69.526. That was a long downtrend, I am not ignoring that. But on the 4H chart something interesting is developing for me now. Price bounced from my 0.786 Fib at $71.200. At the same time MACD is printing a bullish crossover, DIF -1.204, DEA -1.392, histogram turning positive. That tells me sellers are losing control, momentum behind the down moves is fading. RSI is also improving for me. RSI6 is at 48.90, crossing above RSI12 at 43.80 and RSI24 at 41.07. This is early improvement, not confirmation of a full reversal. I am not calling a full trend flip yet. I am now watching $72.259, that is my 1.0 Fib resistance. If buyers reclaim it and make a higher low, that would be my first real sign of improving structure. Then $80.266 opens, then EMA200 at $80.240 and $85.215. My plan is clear. My entry I marked is $71.851. My stop is $69.400, below the low. My target is $85.215. That is about 18.60% upside against 3.41% downside, about 5.45 to 1. If we move through $69.400, my idea is wrong, I will not widen the stop just because I am expecting a reversal. I have taken my position because I believe this setup offers a good opportunity for the defined risk. I am not bringing back my old $100 prediction. This is a separate recovery trade. Tell me, does $72.259 reclaim or $69.400 break first? Comment UP if $72.259 reclaims, DOWN if $69.400 breaks. Tap $HYPEUSDT to trade this $71.20 Fib bounce, trade on this same coin #WSOT2026 #USInflationRunsHotAndRateHikeBetsRise #SanDiskAnnounces8For1StockSplit #AnthropicIPOTestsTheAIBoom #BitcoinHitsTwoMonthLowAfterUSMidterms @BybitX @Bybit Learn @612 Ceros @SignalX @Demon - Trader @GhostWriter @James @PRADO @BitRase @BlockchainMaster
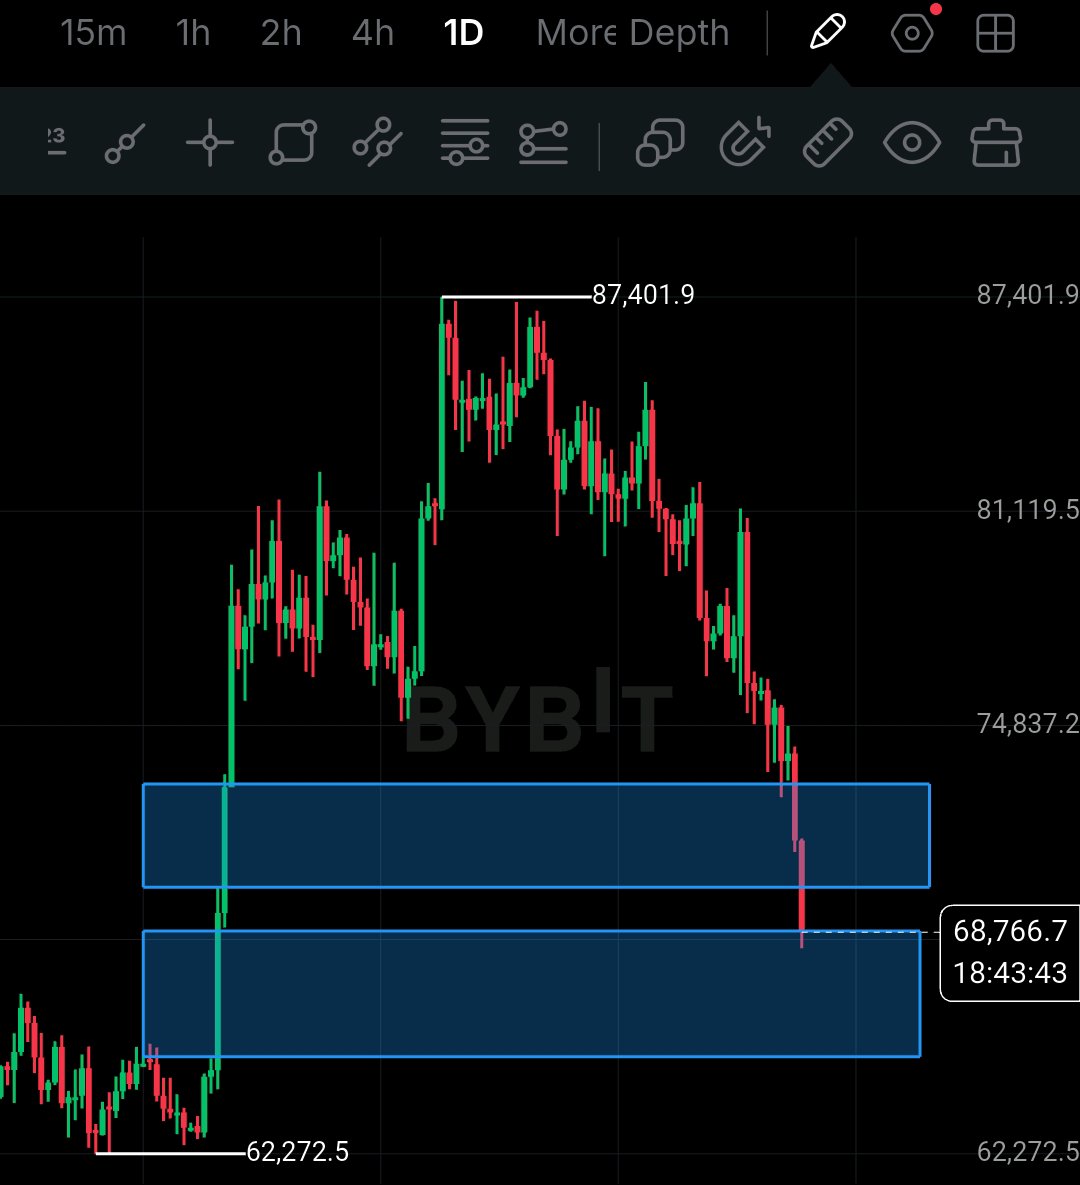
I marked 2 FVGs on $BTCUSDT and price just fell into my 2nd one Live Bybit: $BTC $68,726.5 -6.61% | H $73,920.5 L $68,300.0 | Turnover 779.17M I saw BTC fall from $87,401.9 straight down. My first FVG was around $71,000 to $73,496. Price came back into it, failed to hold it, and broke straight through. That was my signal that sellers were still in control. Now price is at $68,726.5, sitting inside my 2nd FVG. This is the zone I marked as my last demand area on 1D. This is where I want to see a reaction. I am not buying blindly here. An FVG is not a guarantee, it is just a gap where price moved too fast and left no trading behind. Sometimes price fills it and bounces, sometimes it goes straight through it. For me $68,300 is the floor that must hold. That is the 24h low and the bottom of my 2nd FVG. If we lose it with a daily close below, the FVG fails and $59,590 opens, that is my big low. On the upside $73,496 is the wall, that is my 1st FVG top. Break and hold above $73,496 and $80,449 opens. My plan is simple. I am not buying $68,726 in the middle. If we hold $68,300 and close 1D above $73,496, I look long toward $80,449, stop below $68,300. If $68,300 breaks, I step aside, short toward $59,590 only on confirmed close below. Risk 1 to 2% only, 5x to 10x isolated max. This is a big level, I am keeping size small. Tell me, does my 2nd FVG hold or does $59,590 come next? Comment HOLD if $68,300 holds, BREAK if $59,590 comes. Tap $BTCUSDT to trade this $68,300 test, trade on this same coin @BybitX @Bybit Learn @612 Ceros @SignalX @Demon - Trader @BitRase @BlockchainMaster @RichardWyckoff @RoYoK @IBLOLO #WSOT2026 #USInflationRunsHotAndRateHikeBetsRise #SanDiskAnnounces8For1StockSplit #AnthropicIPOTestsTheAIBoom #BitcoinHitsTwoMonthLowAfterUSMidterms
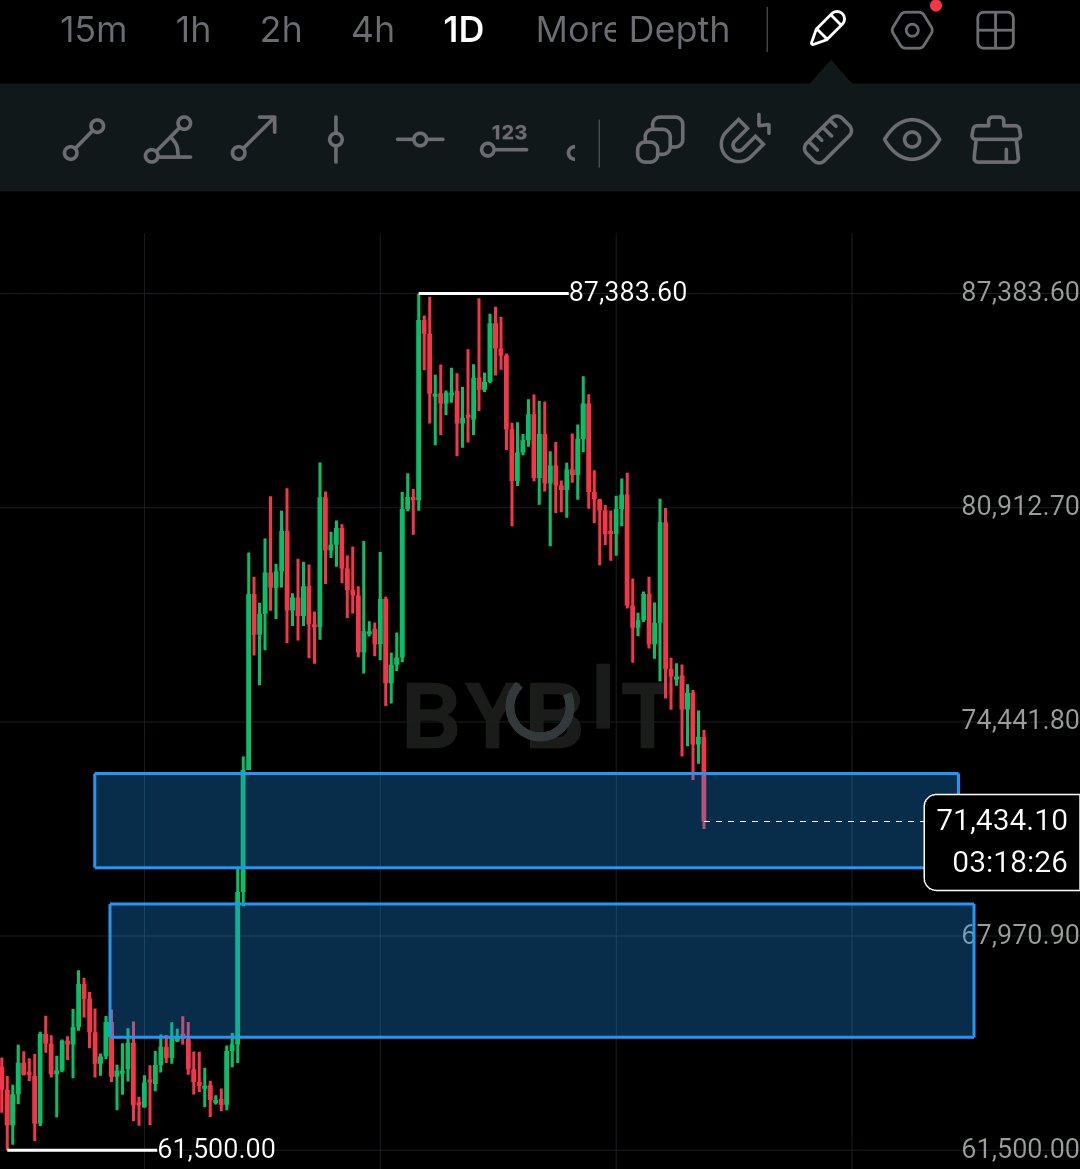
$BTCUSDT at $71,449 and it just fell into my blue box. I saw BTC fall from $87,383 straight to $71,205. That is not a normal dip, that is a full breakdown. Now it is at $71,449, sitting right inside my top blue box. That box is my first demand zone. I am looking at the bigger picture too. 7 days is -5.88% and 30 days is -13.90% and 1 year is -29.49%. This is still a downtrend, not a bottom. I have seen this before, every small bounce gets sold. For me $71,205 is the floor that must hold. That is the 24h low. If we lose it with a daily close below, the top blue box fails and $64,933 opens, that is my second blue box. On the upside $74,783 is the wall, that is the 24h high. Break and hold above $74,783 and $80,205 opens. My plan is simple. I am not buying $71,449 in the middle. If we hold $71,205 and close above $74,783, I look long toward $80,205, stop below $71,205. If $71,205 breaks, I step aside, short toward $64,933 only on confirmed close below. Risk 1 to 2% only, 5x to 10x isolated max. This is a big level, I am keeping size small. Tell me, does $71,205 hold or does $64,933 come next? Comment HOLD if $71,205 holds, BREAK if $64,933 comes. Tap $BTCUSDT to trade this $71,205 test, trade on this same coin. #WSOT2026 #USInflationRunsHotAndRateHikeBetsRise #SanDiskAnnounces8For1StockSplit #AnthropicIPOTestsTheAIBoom #BitcoinHitsTwoMonthLowAfterUSMidterms @BybitX @Bybit Learn @612 Ceros @SignalX @Demon - Trader @GhostWriter @BitRase @RichardWyckoff @RoYoK
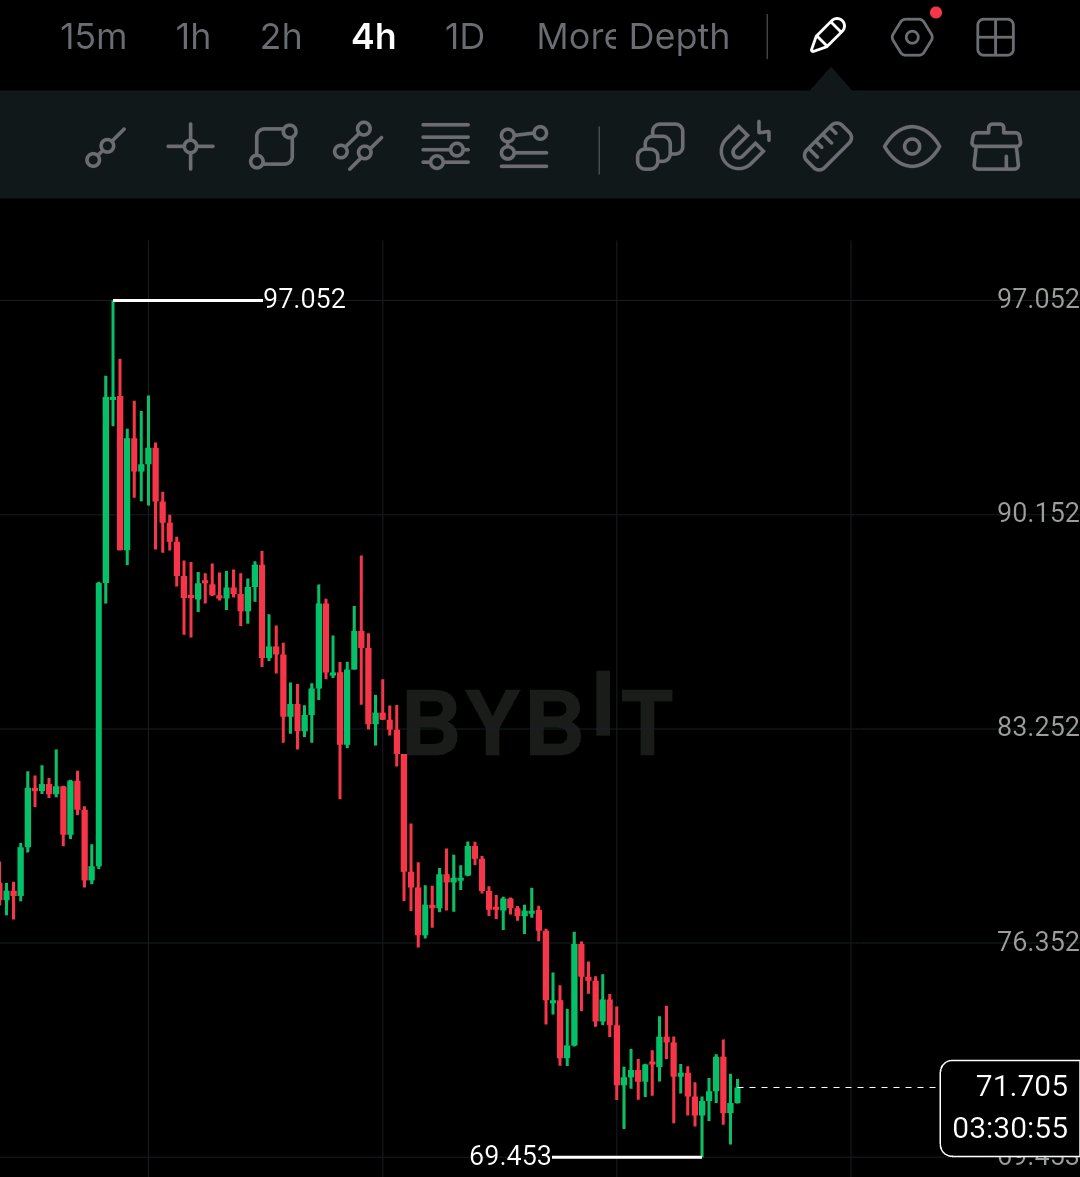
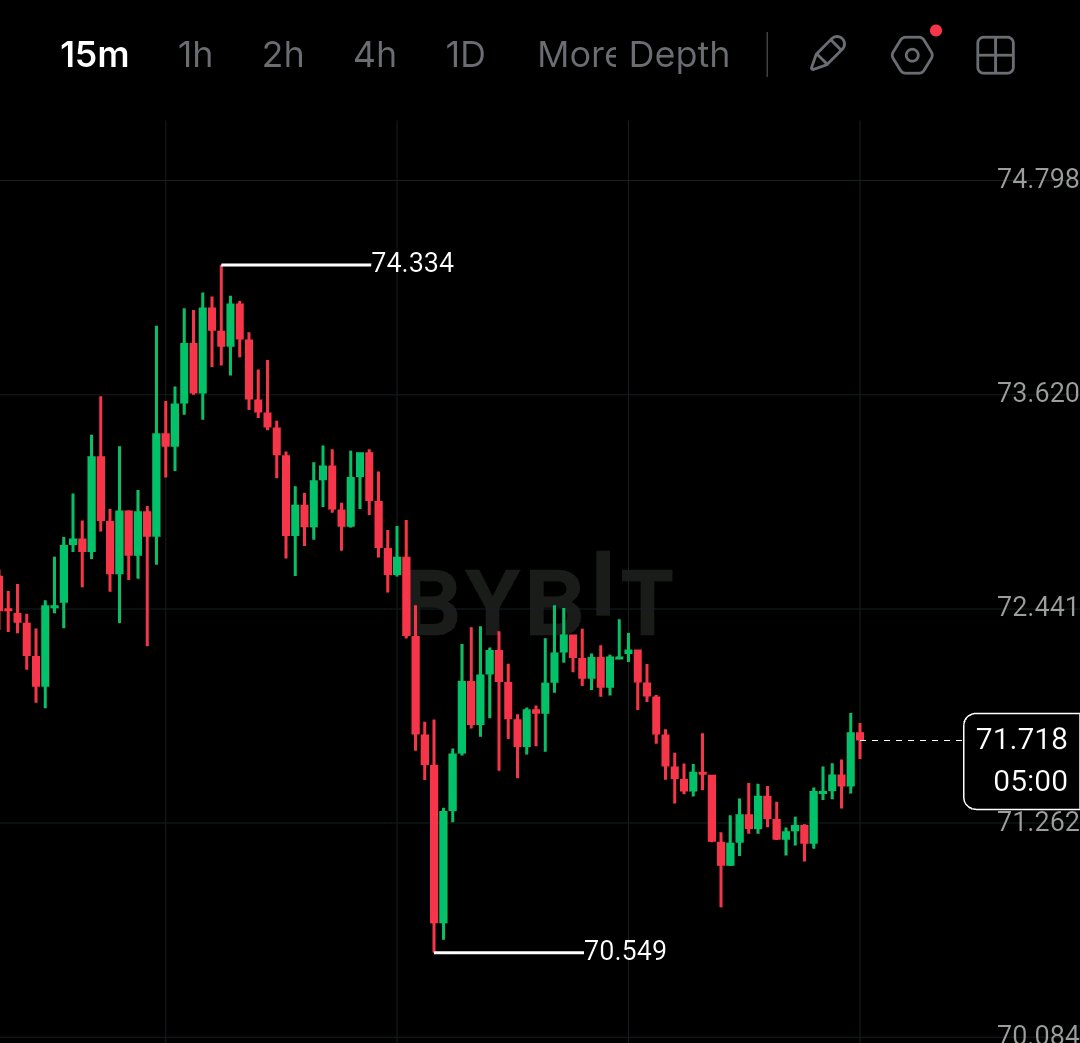
$HYPEUSDT at $71.71 and this is the weirdest contradiction I have seen I saw HYPE get listed on Upbit on Nov 10, in KRW, BTC and USDT. That should have pumped it. It did not. Price is still at $71.71, down 6.02% in 7 days and 26.5% below its September ATH $97.98. The listing gave it more buyers, but the market cared more about selling pressure than new access. I am looking at the business side and it is strong. In the last 30 days Hyperliquid made about $89.58M in fees and $68.82M in protocol revenue. That revenue goes into the Assistance Fund which buys HYPE on the open market. So more trading should mean more buying. But I am not blind, that buyback only works if trading stays strong. The derivatives side is what worries me. Futures volume is about 7.5x spot volume. OI is near $3.23B. Funding is still positive at 0.0094%, longs are still paying. About 65% of recent liquidations came from longs. That tells me longs are still crowded, and spot is not leading yet. For me $70.58 is the floor that must hold. That is immediate support. If we lose it with a close below, the next leg down opens fast. On the upside $74.38 is the wall. Break and hold above $74.38 with real spot volume and $78.00 opens. My plan is simple. I am not buying $71.71 in the middle. If we hold $70.58 and close above $74.38, I look long toward $78.00, stop below $70.58. If $70.58 breaks, I step aside, short toward $70.58 breakdown only on confirmed close below. Risk 1 to 2% only, 5x to 10x isolated max. Tell me, does $70.58 hold or does $74.38 reclaim first? Comment HOLD if $70.58 holds, BREAK if $70.58 breaks. Tap $HYPEUSDT to trade this $70.58 test, trade on this same coin. @shuja246
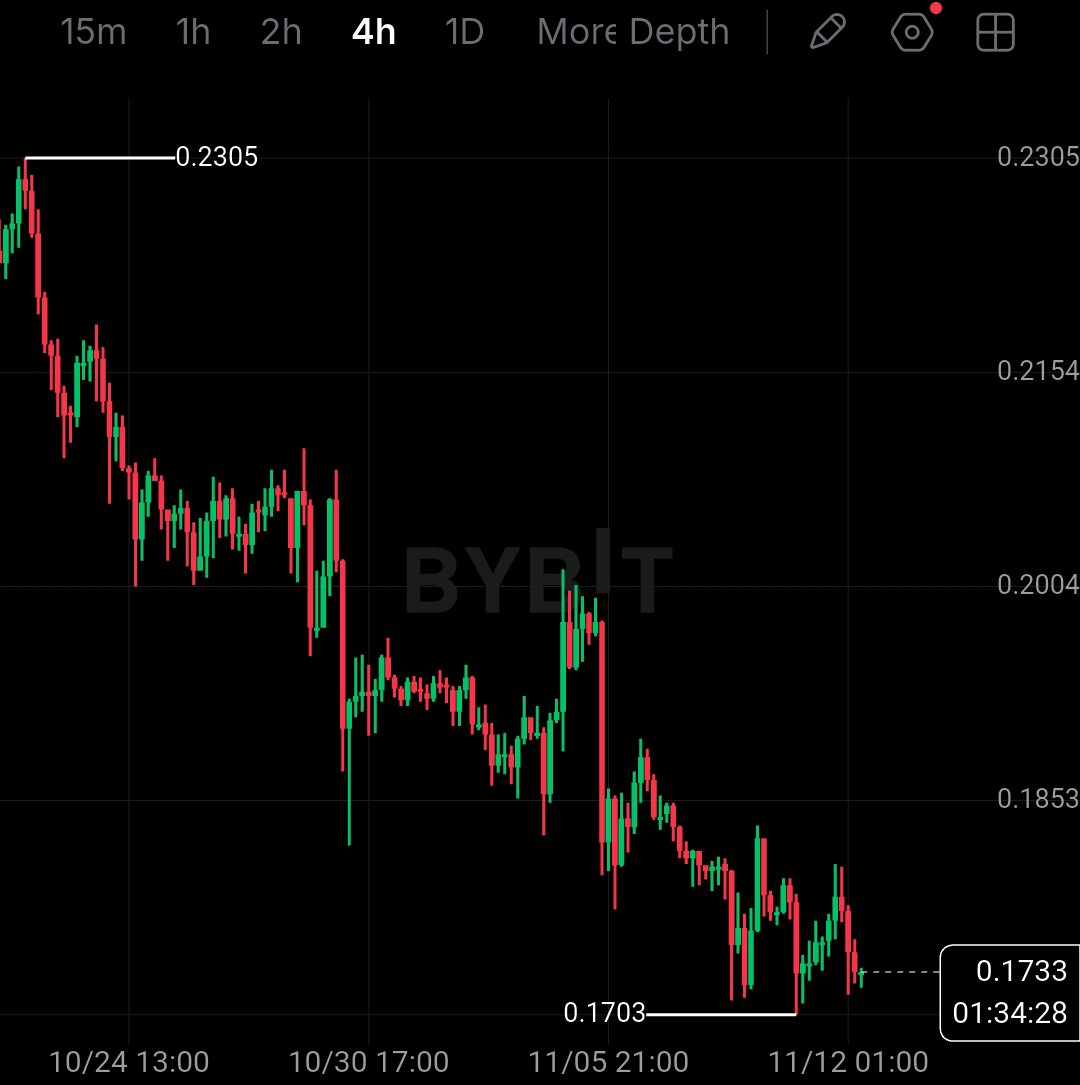
$ADAUSDT at $0.1733 and price and RSI are telling me two different stories I saw ADA make lower lows on price, but RSI is making higher lows. Price is going down, momentum is getting weaker. That is a divergence I am watching. RSI is at 39.89, still below its average near 42.74, so I am not blindly confident yet. I need to see buyers recover $0.1800 first. Without that, this divergence means nothing to me. My plan is clear. My entry reference is $0.1734. My stop is $0.1653. My target is $0.1993. That is about 14.94% upside against 4.67% risk, about 3.20 to 1. If we hold $0.1734 and close above $0.1800, then $0.1993 opens up. If $0.1653 breaks, my idea is wrong. Tell me, do you think $0.1800 reclaims or $0.1653 breaks? Comment UP if $0.1800 reclaims, DOWN if $0.1653 breaks. Tap $ADAUSDT to trade this $0.1734 test, trade on this same coin. @BybitX @Bybit Learn #WSOT2026
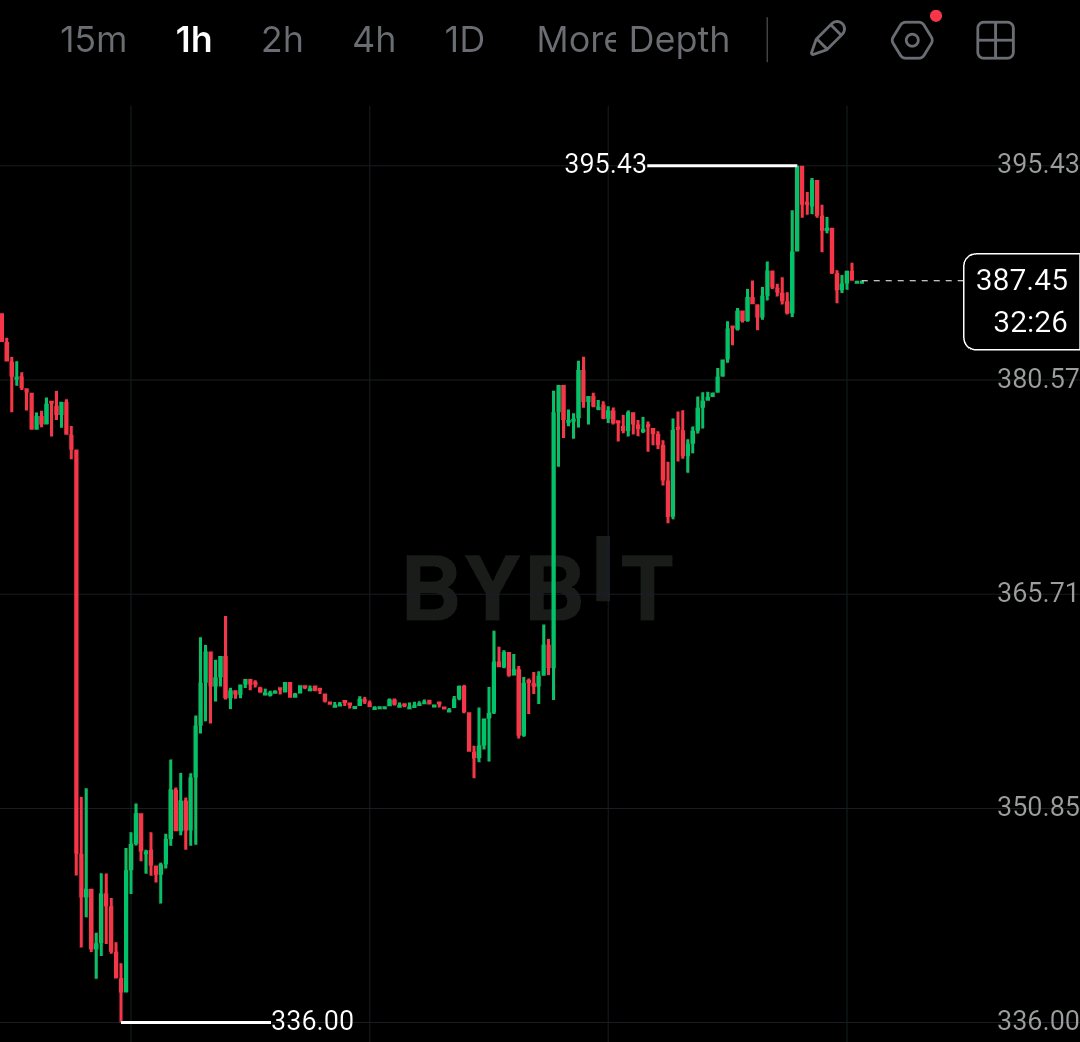
$TSLAXUSDT at $387.45 and $395.43 is the only level that matters, I saw TSLAX pump from $354.11 straight to $395.43 and then get rejected. That $395.43 was the top everyone was watching. Now it is at $387.45, trying to hold above $384.03. I am not calling this a breakout yet. For me $384.03 is the floor that must hold. That is the 24h low. If we lose it with a close below, $370.64 opens fast, that is the 15m low. On the upside $395.43 is the wall. Break and hold above $395.43 and $414.55 opens, that is the 4h high. My plan is simple. I am not buying $387.45 in the middle. If we hold $384.03 and close above $395.43, I look long toward $414.55, stop below $384.03. If $384.03 breaks, I step aside, short toward $370.64 only on confirmed close below. Risk 1 to 2% only, 5x to 10x isolated max. This is tokenized Tesla, it moves like the stock, I am keeping size small. Tell me, does $395.43 break or $384.03 break first? Comment UP if $395.43 breaks, DOWN if $384.03 breaks. Tap $TSLAXUSDT to trade this $384.03 to $395.43 test, trade on this same coin. #WSOT2026 #USInflationRunsHotAndRateHikeBetsRise #BitcoinHitsTwoMonthLowAfterUSMidterms #AITechSelloffErases2Point5TrillionFromNasdaq100 #DeutscheBankLaunchesDigitalAssetCustody @Kiran @Mus Invest @Jiji715 @Annnn @PRADO @JonyDong 509 @RoYoK @Bybit Learn @BybitX
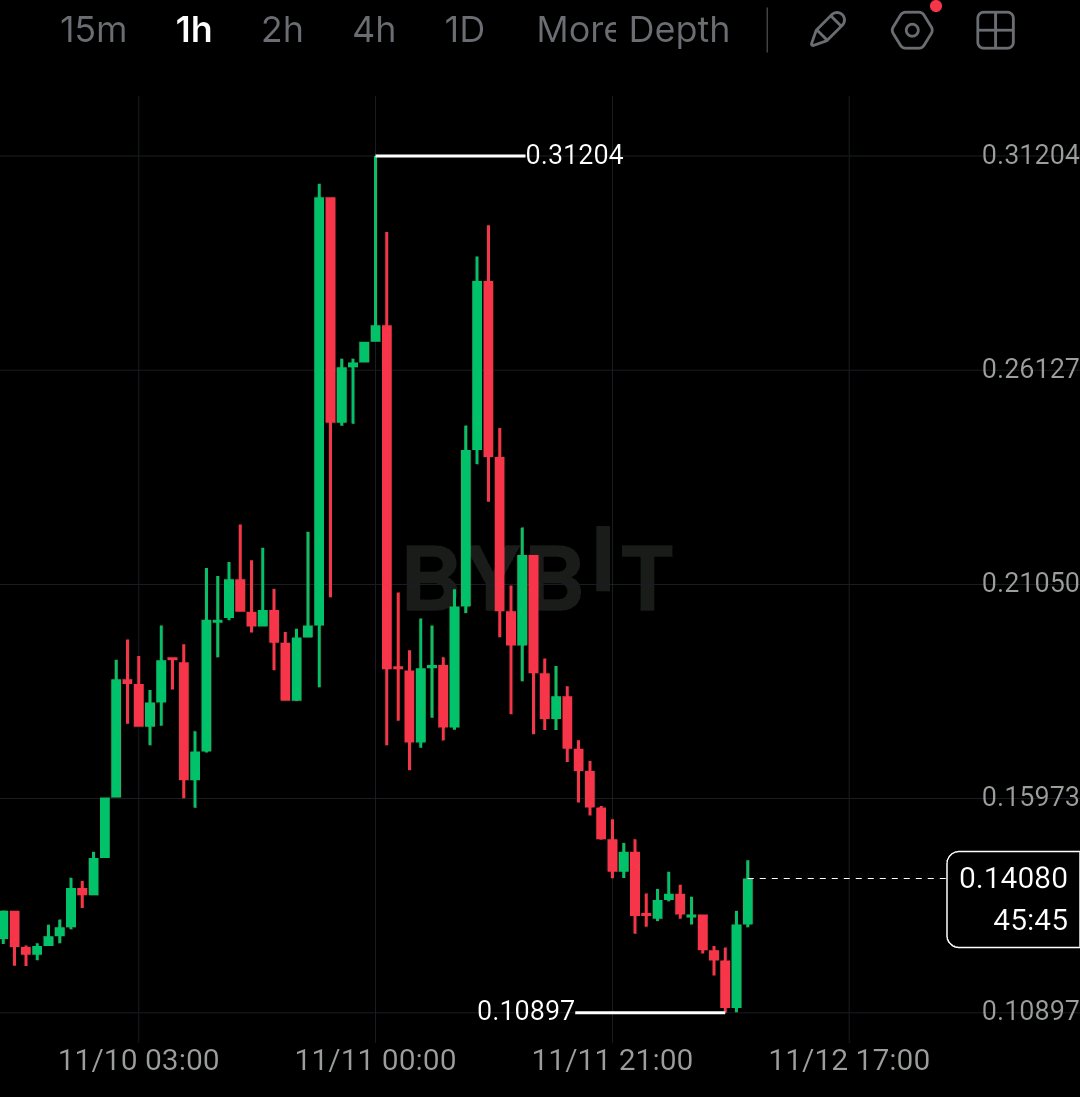
$INITUSDT at $0.1426 after a -54% crash and I am not buying this bounce yet I saw INIT pump straight to $0.39500 and then dump to $0.11046 in the same day. That is not a normal move, that is a pump and dump. Now it is at $0.14264, trying to hold. That bounce looks green, but I have seen this trap before. I am not calling a bottom just because we bounced from $0.11046. For me $0.11046 is the floor that must hold. That is the 24h low. If we lose it with a close below, $0.09623 opens fast. On the upside $0.15883 is the first wall. Break and hold above $0.15883 and $0.18296 opens. My plan is simple. I am not buying $0.1426 in the middle. If we hold $0.11046 and close above $0.15883, I look long toward $0.18296, stop below $0.11046. If $0.11046 breaks, I step aside, short toward $0.09623 only on confirmed close below. Risk 1 to 2% only, 5x to 10x isolated max. This coin just moved -54% in a day, I am keeping size small. Tell me, does $0.11046 hold or does $0.15883 reclaim first? Comment HOLD if $0.11046 holds, BREAK if $0.09623 comes. Tap $INITUSDT to trade this $0.11046 test, trade on this same coin. @BybitX @Bybit Learn @612 Ceros @SignalX @Demon - Trader @RoYoK @IBLOLO #IMPACTbyTrade #USPayrollsAndRateDecisionsDriveMacroWeek #AnthropicIPOTestsTheAIBoom #PiecesOf8 #WSOT2026 #USInflationRunsHotAndRateHikeBetsRise