Keffeel
93333Like140Shares773Fans1Follow
"We don't predict the future, we master the art of reading its data. Where the noise ends, my strategy begins to transform volatility into stable numbers."
"We don't predict the future, we master the art of reading its data. Where the noise ends, my strategy begins to transform volatility into stable numbers."
⚠️ $ETH: INSTITUTIONAL MONEY IS LEAVING ETFs, BUT EXCHANGE RESERVES ARE FALLING TOO — WHAT IS REALLY HAPPENING? Ethereum is facing a challenging market environment, but there is more to this situation than a simple price decline. As of November 15, ETH is trading around the $1,800 area after experiencing significant selling pressure. What makes this situation particularly interesting is the contrast between institutional fund outflows and declining exchange reserves. Let's look beyond the candles and examine the bigger picture. 🔴 1. THE MARKET IS UNDER PRESSURE Ethereum has been moving lower alongside Bitcoin and the broader cryptocurrency market. Several factors are contributing to the weakness: - Higher interest-rate expectations. - Marketwide selling pressure. - Forced liquidations in derivatives markets. - Weak institutional demand through spot ETH ETFs. This suggests that the current decline is not necessarily caused by a new fundamental problem within Ethereum itself. 📉 2. INSTITUTIONAL FLOWS: A WARNING SIGNAL One important development is the approximately $398.9 million in net outflows recorded by US spot Ethereum ETFs between November 9 and November 13. This indicates that institutional investment products experienced meaningful selling pressure during that period. However, ETF outflows should not automatically be interpreted as proof that long-term confidence in Ethereum has disappeared. They are one part of a much larger market picture. 📊 3. THE EXCHANGE RESERVE PARADOX Here is another development worth watching. Ethereum reserves on Binance have reportedly declined to approximately 2.9 million ETH, reaching their lowest level in nearly five years. This creates an interesting contrast: - ETF outflows indicate pressure on institutional investment demand. - Declining exchange reserves indicate that fewer ETH are held in exchange-labelled wallets. Could this reflect longer-term withdrawals and reduced immediately available exchange supply? Possibly. But exchange withdrawals do not automatically prove accumulation or fresh buying. This is precisely why on-chain data needs to be interpreted carefully. ⚡ 4. THE TECHNICAL LEVELS THAT MATTER Based on the November 15 market analysis, these are the key areas I am monitoring: Support zone: $1,790–$1,814 Holding this area could allow ETH to attempt a recovery. First recovery resistance: $1,838–$1,868 A sustained reclaim of this zone would improve the short-term technical outlook. Critical downside reference: $1,712 A breakdown below the support structure could expose ETH to another significant test. These are monitoring levels, not guaranteed targets. 🧠 5. WHAT WOULD CHANGE MY MARKET VIEW? I would become more constructive if: - ETH maintains support around $1,790–$1,814. - Price reclaims $1,838–$1,868. - Spot buying activity improves. - ETF outflows begin to stabilize. - Derivatives positioning becomes healthier. On the other hand, a sustained breakdown below support, accompanied by increasing selling pressure, would invalidate the short-term recovery scenario. 🎯 6. A DISCIPLINED APPROACH Rather than buying simply because ETH has declined, I would separate potential exposure into conditional stages: 1. Observe whether support holds and selling pressure weakens. 2. Look for confirmation through price recovery and stronger participation. 3. Evaluate additional exposure only after resistance is reclaimed. Total exposure should be determined by a predefined risk limit. If support fails, the correct response is to reassess the thesis rather than automatically increase exposure. 🔥 MY BIGGER PICTURE Ethereum is currently facing two competing forces. On one side, institutional ETF outflows and marketwide liquidations are creating pressure. On the other, declining exchange reserves raise an interesting question about the movement and availability of ETH supply. Neither development alone determines the next market direction. The real confirmation must come from price action, liquidity, institutional flows, and sustained demand. I believe the coming sessions will be important in determining whether Ethereum can stabilize or whether sellers still have more room to push. What is your interpretation of ETH right now? Are we witnessing a temporary liquidity-driven correction, or is the market entering a deeper bearish phase? Let's discuss the data, not just the predictions. $ETHUSDT $ETHUSDC #ByXIMPACT

Source: Crypto News Roundup | Date: November 2026 | Asset: $XRP Headline: Beyond the Price: The Real Story Happening on the XRP Ledger Right Now 📰⚡ Price action is one thing, but the fundamental developments on the XRP Ledger tell a completely different story. While the market deals with short-term volatility, the network itself is experiencing a massive surge in real-world utility. Here is my real-time context on the latest news driving the ecosystem. 📊 Real Trading Context (The Fundamental Data): · Explosive Network Activity: According to XRPScan data, the XRP Ledger just hit new November highs. Batch transactions reached 1.962 million on November 3, and Ticket usage peaked at 1.553 million on November 7. More impressively, active accounts increased by 128%, and payment volume surged by 137% in a single 24-hour window. · Institutional Trust Reaffirmed: SBI Holdings Chairman Yoshitaka Kitao publicly reaffirmed his confidence in XRP on November 12, responding to community concerns with a simple "YES". SBI has been using XRP for cross-border payments since 2021 and launched an XRPL validator in May 2024. · Technical Upgrades Incoming: The XRP Ledger is scheduled to deploy version 3.5.0 on December 3, which includes a permanent fix for occasional slow ledger close times that appeared in October. Additionally, Ripple partnered with Privy (Stripe-owned) to bring embedded programmable wallets to the XRPL, supporting both XRP and RLUSD. 💼 My Spot Perspective (Long-Term View): I am not here to chase a 5% candle. These news items confirm that the infrastructure is growing regardless of the price. The surge in batch transactions is a direct signal of institutional adoption (custodial transfers, cross-border settlements). · My Action: I am monitoring the price near the $1.00 psychological level (recently dipping to $0.89) as a potential accumulation zone for my spot portfolio. · What I am watching: The whale wallets. Data shows that wallets holding 1M+ XRP recently hit a yearly high of 2,147, indicating that large holders are accumulating during this dip. The price is noisy, but the network is growing. Are you paying attention to the fundamentals or just the candlesticks? 👇 $XRPUSDT $XRPUSDC #ByXIMPACT

🩸 $BTC Bleeds to $62K: The 5 Macro Factors Creating a Liquidity Vacuum. (And Why CZ is Buying). Panic is in the air. **$BTC** just wicked down to a brutal $62,006, and retail traders are getting liquidated across the board. But while the crowd is panicking, Binance founder CZ just dropped a masterclass in market psychology on X. He stated clearly: "I didn't sell. I only bought; I made regular daily purchases." He even joked that his stablecoin DCA (Dollar Cost Averaging) might be the reason for the drop. As a professional Spot trader, I don't react to the red candles; I analyze the mechanics behind the move. Here is the breakdown of the 5 factors CZ highlighted and how I am trading this liquidity vacuum. 🔍 CZ’s 5-Point Breakdown of the Drop: 1. The Anthropic IPO Liquidity Drain: Investors are selling risk assets to free up cash for the massive Anthropic IPO ($64.35B offering, pricing on Nov 18th, trading Nov 19th). Capital is rotating. 2. Massive ETF Outflows: Spot Bitcoin ETFs saw 7 consecutive days of outflows totaling **$1.91 billion** (with $1.42B leaving BlackRock’s IBIT). Spot ETH ETFs lost another $592 million. 3. Security & Infrastructure FUD: The recent Binance attack, emptying iPhone-linked wallets, Chrome vulnerabilities, and Microsoft outages have shaken retail confidence. 4. Fed & Macro Pressures: High US inflation has revived fears of another rate hike. Rising bond yields and a strong dollar are actively draining liquidity from risk assets. 5. Political Uncertainty: Fears that crypto policy might tighten following the US midterm elections. 🧠 The "Smart Money" Psychology: Notice the dichotomy. While retail is selling in fear of the 5 factors above, CZ is DCA'ing with stablecoins. He explicitly stated that the crypto sector will continue to grow in the medium to long term. This is the difference between trading on emotion and trading on structural reality. 🎯 My Actionable Spot Execution Plan (Navigating the Dip): I am not catching this falling knife blindly. I am adopting CZ's mindset but using strict technical confirmation. I trade strictly Spot, meaning I have zero liquidation risk while the market finds its bottom. · The Waiting Game: I am not buying the current price. The ETF outflows and the upcoming Anthropic IPO will keep pressure on the market until at least Nov 19th. · My Accumulation Zone: I have laddered limit buy orders sitting at the deep macro support levels (the $60,000 - $61,500 zone). If the IPO liquidity drain sweeps the lows, I want to be there to catch the wick. · My First Target (TP1): $65,000 (Reclaiming the psychological level and local resistance). I will scale out a portion here. · My Hard Invalidation: If Bitcoin prints a daily close below $58,000, the macro structure is severely broken, and we are likely heading into a deeper bear cycle. I will hold my USDT and wait. 💡 Let's Build a Real Community (ByX IMPACT): Liquidity vacuums are terrifying, but they create generational entry points for Spot traders. CZ is buying the dip; the question is, are you going to panic sell, or are you going to manage your risk and scale in? Are you buying this $62K BTC dip, or waiting for the Anthropic IPO to pass before entering? Let’s discuss real Spot strategies below. 👇 $BTCUSDT $BTCUSDC #ByXIMPACT

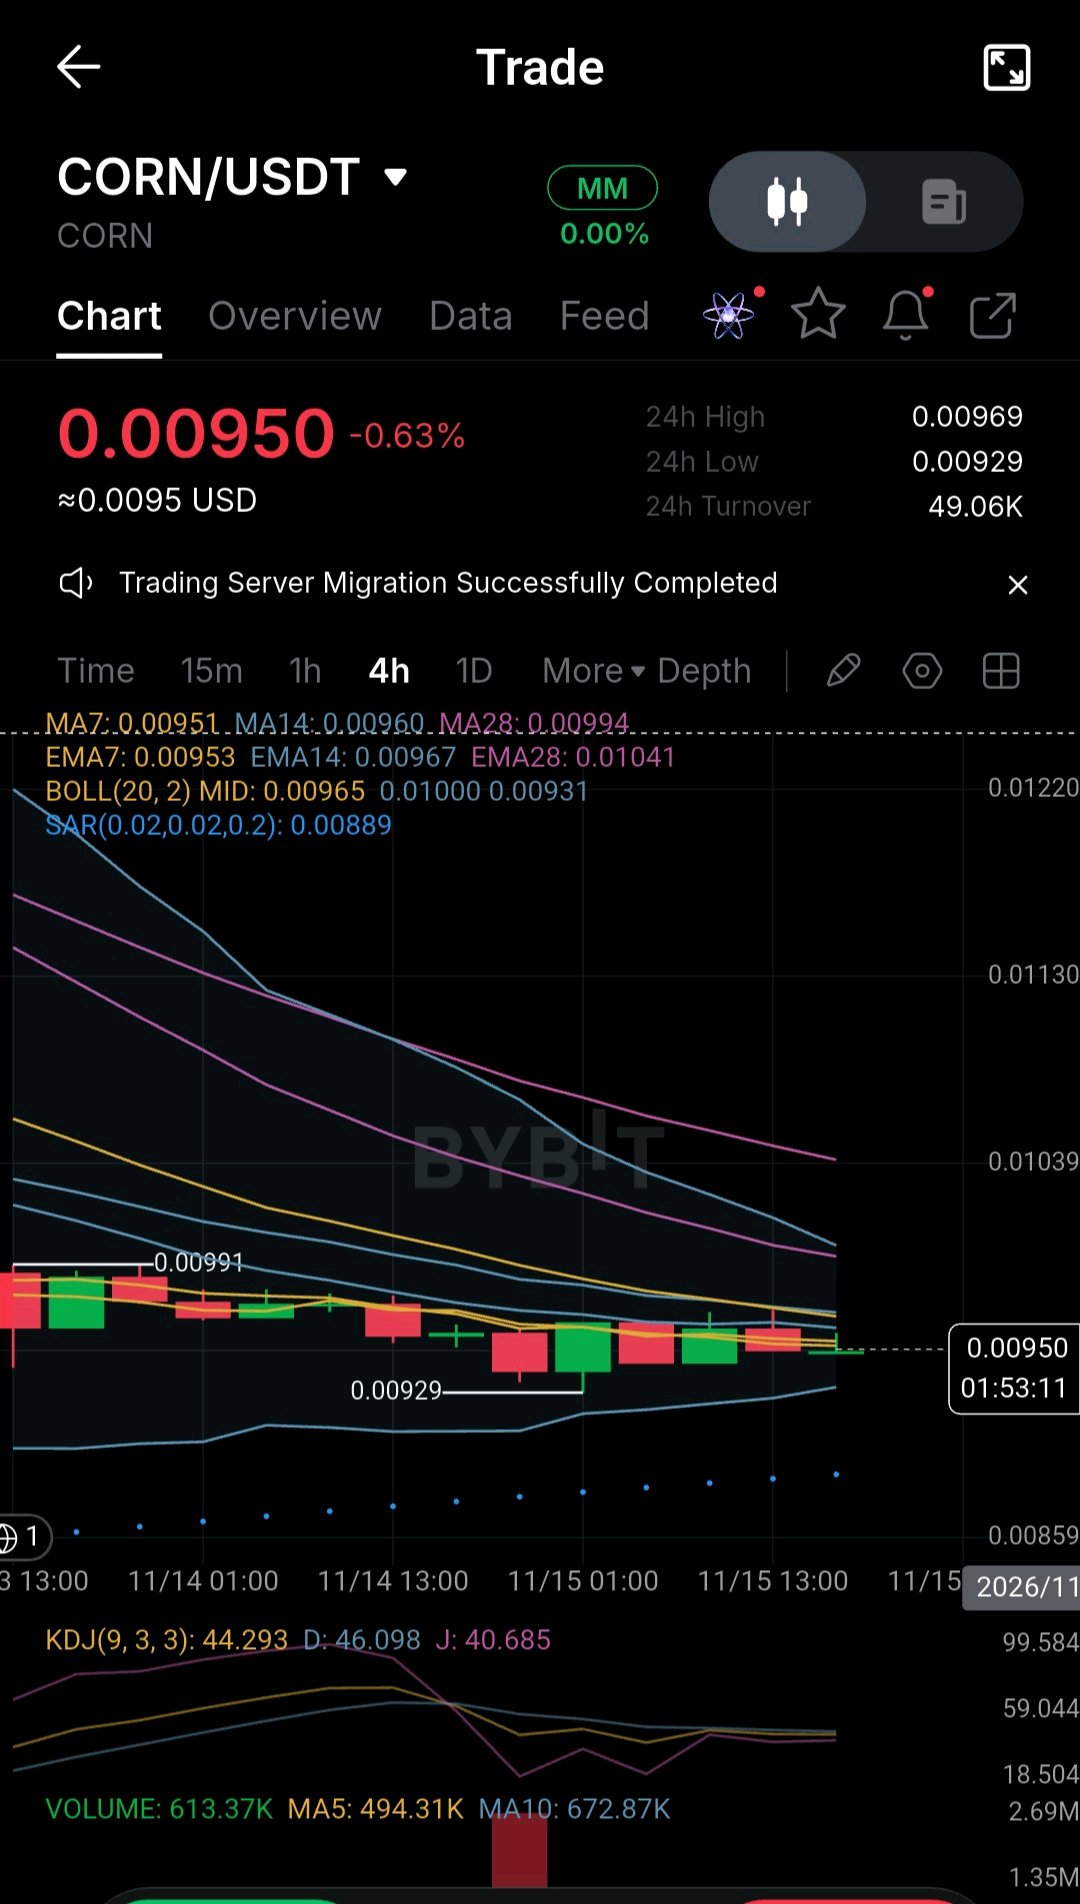
⚠️ $CORN: THE MARKET IS LOSING MOMENTUM — IS THIS A BASE FORMATION OR THE CALM BEFORE ANOTHER DROP? Sometimes the most important market signals appear when price stops moving aggressively. That is the situation I am watching on CORN/USDT. After a period of downward pressure, price is now moving within a relatively narrow range around $0.00950. But there is an important distinction between a market stabilizing and a market actually reversing. Let's examine the evidence on the 4H chart. 📉 1. THE BEARISH STRUCTURE HAS NOT DISAPPEARED CORN is currently trading around $0.00950, down approximately 0.63% according to the displayed market data. The moving averages remain above the current price: - MA7: $0.00951 - MA14: $0.00960 - MA28: $0.00994 The exponential averages tell a similar story: - EMA7: $0.00953 - EMA14: $0.00967 - EMA28: $0.01041 This arrangement shows that the broader short-term structure remains under pressure. The recent sideways movement is interesting, but it is not enough to declare a bullish reversal. 🔬 2. THE BOLLINGER BANDS REVEAL AN IMPORTANT BATTLE ZONE Current readings: - Upper Band: $0.01000 - Middle Band: $0.00965 - Lower Band: $0.00931 Price is trading below the middle band and relatively close to the lower boundary. For me, the $0.00960–$0.00965 region is the first important recovery test. A sustained reclaim of this area would suggest that buyers are beginning to regain some control. A move toward $0.00994–$0.01000 would provide a stronger test of the recovery. ⚡ 3. MOMENTUM IS STILL NEUTRAL TO WEAK The KDJ indicator currently shows: - K: 44.293 - D: 46.098 - J: 40.685 K remains slightly below D. This means there is no confirmed bullish crossover in the displayed readings. I would rather wait for a clearer improvement in momentum than interpret every small green candle as a reversal signal. 📊 4. VOLUME: A MIXED PICTURE The displayed volume readings are: - Current Volume: 613.37K - MA5: 494.31K - MA10: 672.87K Volume is above its five-period average but remains below its ten-period average. This suggests some recent trading activity, but not yet a convincing expansion in participation. A sustained recovery should ideally be accompanied by stronger buying volume. 🎯 5. MY TWO SCENARIOS FOR CORN Bullish scenario: Price reclaims $0.00960–$0.00965, maintains that area, and subsequently challenges $0.00994–$0.01000 with stronger volume. That would improve the stabilization thesis. Bearish scenario: Price fails to reclaim the middle Bollinger Band, then breaks below $0.00931–$0.00929. Such a move would weaken the current range structure and suggest that sellers remain in control. The SAR reading at $0.00889 is another technical reference to monitor, not a guaranteed downside target. 🧠 6. A DISCIPLINED SPOT APPROACH I would not treat the current price as an automatic buying opportunity. A conditional approach would involve: - First stage: Wait for evidence that selling pressure is easing and support is holding. - Second stage: Consider confirmation only after price reclaims $0.00965 with improving volume. - Third stage: Evaluate further exposure only if the $0.00994–$0.01000 resistance zone is convincingly recovered. The total exposure should be determined in advance according to individual risk limits. If price breaks below $0.00929, the stabilization thesis needs to be reassessed rather than averaging down automatically. 🔥 MY FINAL TAKE CORN is currently showing a market that has slowed down after downward pressure, but slowing momentum is not the same as a confirmed recovery. The most important evidence will come from the reaction around $0.00965 and whether buyers can eventually challenge $0.01000. I am watching the structure, not chasing the candles. What do you think comes next for CORN: a genuine stabilization phase or another breakdown below support? Let's discuss the levels and the evidence. $ZAMAUSDT $TRXUSDT #ByXIMPACT

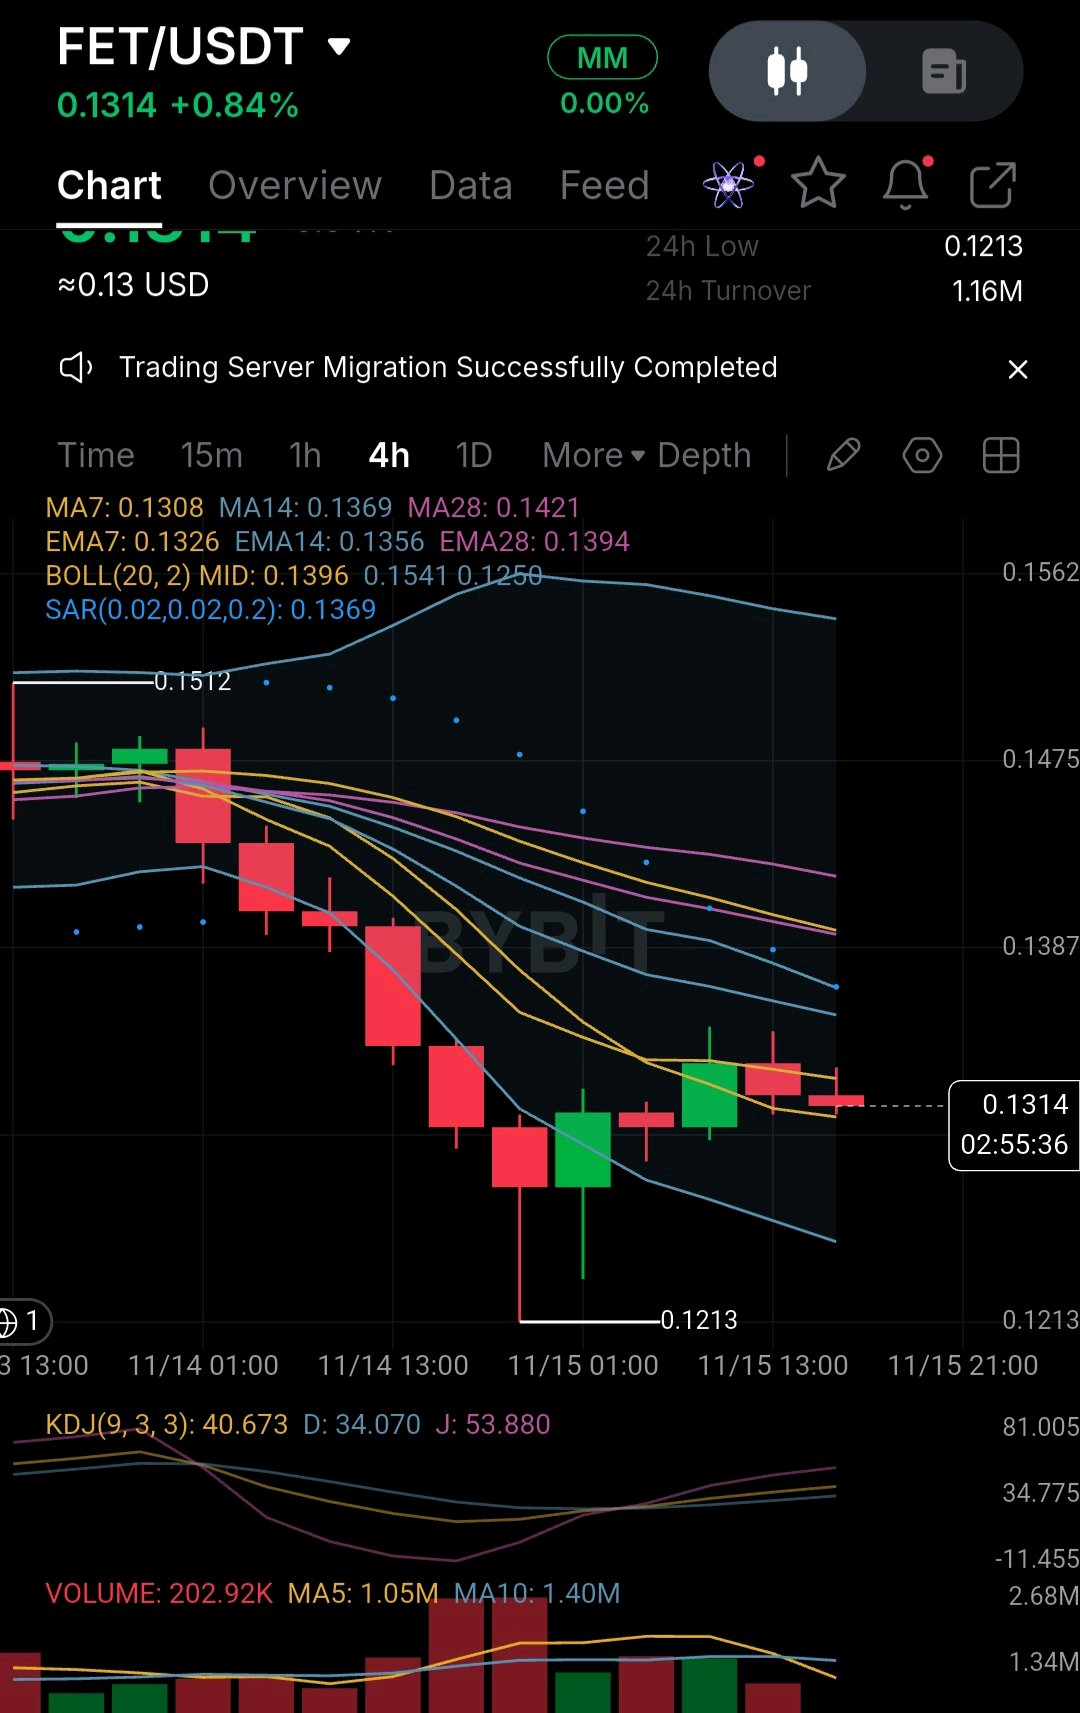
⚠️ $FET: THE SELL-OFF HAS SLOWED, BUT IS THE RECOVERY STRONG ENOUGH TO CHANGE THE TREND? Not every green candle signals a bullish reversal. And that is exactly why the current FET/USDT structure deserves a closer look. After a significant decline toward $0.1213, FET has started showing signs of a short-term recovery. Buyers are attempting to regain control, but the bigger technical picture still presents several challenges. Let's examine what the 4H chart is actually revealing. 🔎 THE FIRST CLUE: A RECOVERY INSIDE A WEAK STRUCTURE FET is currently trading around $0.1314. The price has moved slightly above its MA7 at $0.1308, which is an encouraging short-term development. However, the broader moving averages remain above the current price: - MA14: $0.1369 - MA28: $0.1421 - EMA14: $0.1356 - EMA28: $0.1394 This tells us something important: short-term buyers are becoming more active, but the medium-term structure has not yet recovered. 📊 THE REAL TEST: CAN BUYERS RECLAIM RESISTANCE? There are several technical areas worth monitoring: - $0.1356–$0.1369: The first important resistance zone. - $0.1396: The Bollinger middle band and a key recovery level. - $0.1421: The MA28 resistance. A sustained move above these areas would gradually improve the technical outlook. Until then, the recovery should be treated with caution. ⚡ MOMENTUM IS IMPROVING, BUT CONFIRMATION IS MISSING The KDJ indicator currently shows: K: 40.673 D: 34.070 J: 53.880 With K above D, short-term momentum is showing signs of improvement. This could support further recovery, but momentum indicators can turn quickly when buying pressure is weak. 📉 THE VOLUME PROBLEM One of the most interesting details is trading volume. Current volume: 202.92K MA5 Volume: 1.05M MA10 Volume: 1.40M Participation remains relatively weak compared with the displayed volume averages. This makes the current recovery less convincing. A stronger move accompanied by expanding volume would provide better evidence that buyers are genuinely returning. 🛡️ WHAT IF THE RECOVERY FAILS? The downside levels deserve equal attention. The $0.1250 area is an important technical reference based on the lower Bollinger Band. Below that, $0.1213 represents the recent visible low. A breakdown below these areas would weaken the recovery scenario and suggest that sellers may still have the upper hand. 🎯 MY MARKET PERSPECTIVE I am not treating this move as a confirmed trend reversal. What I see is an asset attempting to recover after a significant sell-off, while important resistance levels remain overhead. The next phase will depend on three things: 1. Whether FET can reclaim $0.1369. 2. Whether buying volume starts expanding. 3. Whether price can eventually recover the $0.1396–$0.1421 zone. The most important question is not how much FET has bounced. It is whether buyers can sustain that bounce. What is your interpretation of FET right now: an early recovery opportunity, or simply a temporary pause in the broader downtrend? Let's focus on price action, volume, and confirmation rather than assumptions. $FETUSDT $FIGHTUSDT #ByXIMPACT

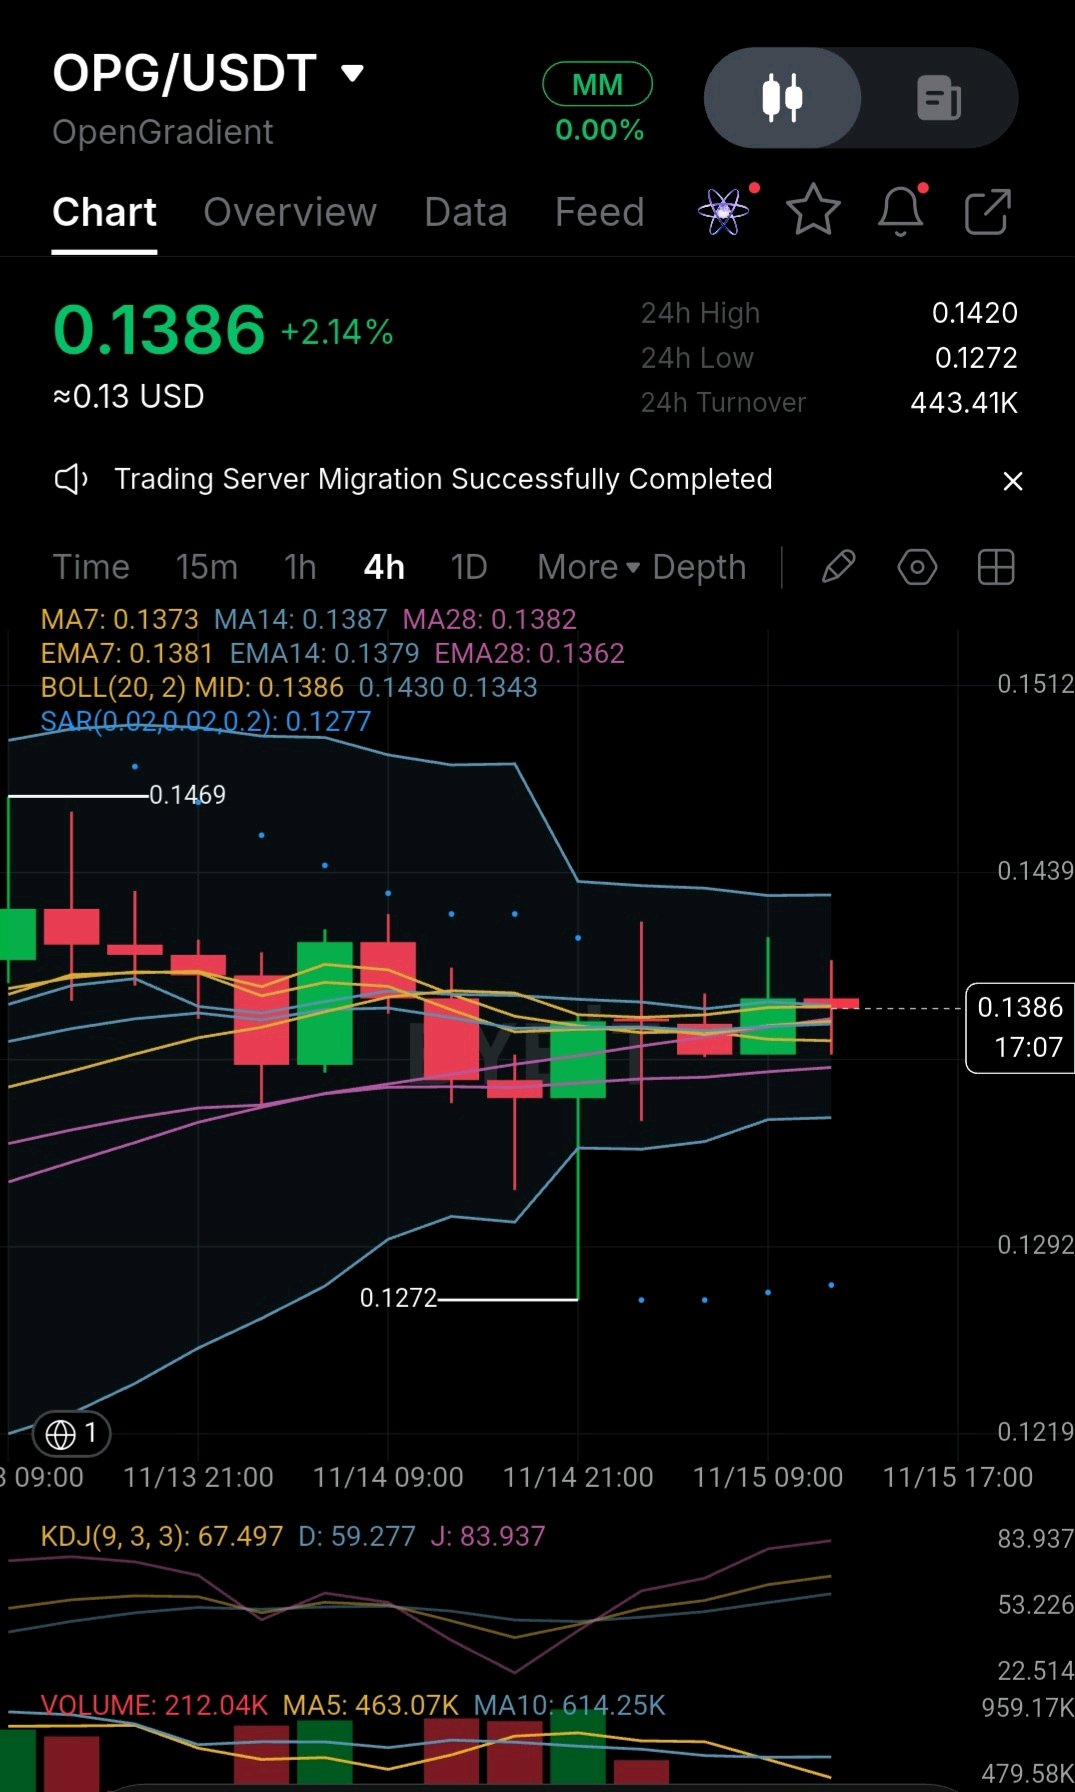
🚀 $OPG: ACCUMULATION BEFORE THE NEXT MOVE? WHAT THE 4H CHART IS REALLY TELLING US! The OpenGradient ($OPG) chart is showing an interesting situation that deserves attention. Rather than assuming that a short-term price increase automatically signals a bullish reversal, I want to examine what the technical indicators are actually showing and what needs to happen next. 📊 1. THE CURRENT MARKET STRUCTURE On the 4-hour chart, $OPG is trading around $0.1386, with a displayed 24-hour gain of 2.14%. The moving averages are tightly clustered: - MA7: $0.1373 - MA14: $0.1387 - MA28: $0.1382 The exponential moving averages are also relatively close: - EMA7: $0.1381 - EMA14: $0.1379 - EMA28: $0.1362 This clustering suggests a period of short-term consolidation, where the market is attempting to establish its next direction. However, consolidation alone does not prove accumulation or guarantee an upward breakout. 📈 2. BOLLINGER BANDS: THE KEY PRICE BOUNDARIES The Bollinger Bands currently show: - Upper Band: $0.1430 - Middle Band: $0.1386 - Lower Band: $0.1343 Price is trading close to the middle band. A confirmed move above $0.1420, followed by a sustained break above $0.1430, could strengthen the bullish scenario. On the other hand, losing the $0.1343 area would weaken the current stabilization thesis and increase the possibility of another downward move. ⚡ 3. KDJ: SHORT-TERM MOMENTUM IS IMPROVING The current KDJ readings are: - K: 67.497 - D: 59.277 - J: 83.937 K is above D, suggesting improving short-term momentum. However, the elevated J reading also means traders should remain alert to a possible momentum slowdown. This is an encouraging signal, not independent confirmation of a bullish trend reversal. 📉 4. VOLUME: THE CONFIRMATION THAT IS STILL NEEDED The displayed trading volume is approximately 212.04K. Meanwhile: - MA5 Volume: 463.07K - MA10 Volume: 614.25K Current volume is below both reference averages. This is important because a breakout without stronger participation can struggle to sustain itself. I would therefore prefer to see expanding volume accompanying any move above resistance before treating it as a meaningful bullish breakout. 🎯 5. THE LEVELS I AM WATCHING Bullish confirmation: A sustained move above $0.1420, followed by a stronger breakout above $0.1430 with increasing volume. First downside warning: A loss of $0.1343, which would weaken the current consolidation structure. Major reference support: $0.1272, the recent low visible on the chart. These are monitoring levels, not guaranteed price targets. 🧠 6. WHAT WOULD INVALIDATE THE BULLISH THESIS? The bullish stabilization scenario would become weaker if: - Price breaks below $0.1343 and fails to recover it. - Selling pressure increases alongside expanding volume. - The short-term moving averages turn downward again. - Price fails repeatedly to reclaim the $0.1386–$0.1387 area. A break below $0.1272 would represent a more significant deterioration of the structure shown in this chart. 🔥 MY CONCLUSION I believe $OPG is approaching an important decision zone. The improving KDJ readings and the proximity of the moving averages suggest that short-term stabilization is possible. But the lack of strong volume confirmation means I would not call this a confirmed bullish breakout yet. The next move matters less than the evidence behind it. I will be watching resistance, volume expansion, and whether support continues to hold before drawing a stronger conclusion. Do you think $OPG is preparing for a bullish breakout, or is this simply temporary consolidation before another correction? Let's discuss the evidence, not just the predictions. $OPGUSDT $BBSOLUSDT #ByXIMPACT

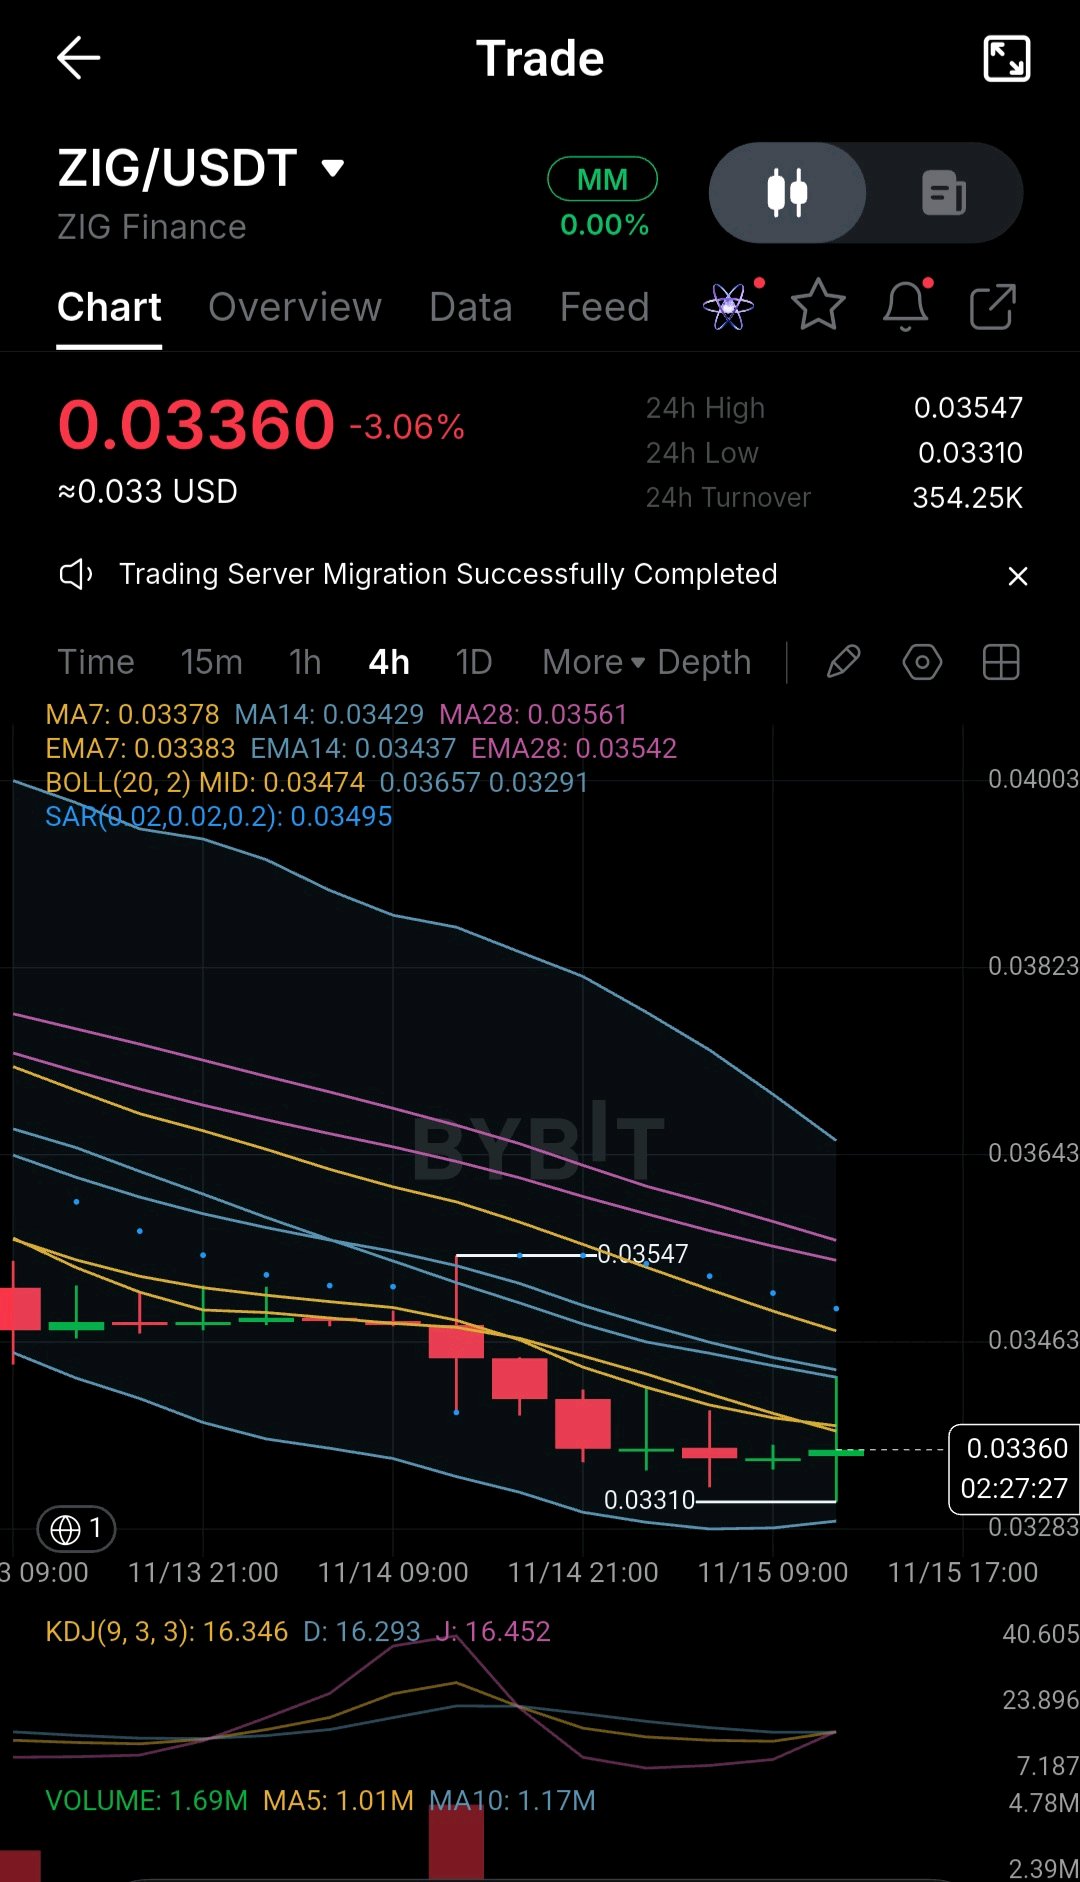
Asset: $ZIG/USDT (ZIG Finance) Headline: $ZIG 4H Analysis: The Volatility Flatline - A Testable Spot Accumulation Thesis 💤🎯 📊 Real Trading Context (The Evidence): Looking at the 4H chart, $ZIG is currently in a state of extreme price compression at 0.03360. The asset is experiencing severe market apathy. · Trend: The structure remains bearish as price trades below the MA7 (0.03378) and MA14 (0.03429). · Momentum: The KDJ indicator is completely flatlined at the bottom (J-line at 16.45), indicating absolute seller exhaustion. · Support: The recent structural low at 0.03310 is holding, but buying volume is practically non-existent. 💼 My Spot Trading Thesis (Triggers & Invalidation): Instead of blindly catching a falling knife in a dead market, I am setting a trap with strict, testable conditions. · Trigger 1 (The Deep Value Trap - 50% Allocation): I have a Limit Buy order set at the absolute recent floor of 0.03310. If market makers execute a liquidity wick down to this level, I will acquire my spot position at a discount. · Trigger 2 (The Wake-Up Confirmation - 50% Allocation): I will only deploy the remaining capital if a 4H candle closes firmly above the short-term resistance at MA7 (0.03378), confirming that buyers have finally returned. 🛑 Thesis Invalidation: This accumulation thesis is strictly invalidated if the price prints a 4H candle close below 0.03290 (the lower Bollinger Band). If this occurs, the floor has collapsed, and I will cancel all orders and wait for a completely new market structure to form. ⏳ The "Do Nothing" Scenario: If the price continues to chop sideways in this dead zone between 0.03310 and 0.03378 without triggering either condition, I will do absolutely nothing. Holding stablecoins during flat markets is the most profitable strategy. When volatility dies, that's when smart money prepares. Are you waiting for the $ZIG wake-up confirmation, or setting limit orders for the wick? 👇 $ZIGUSDT $ASTERUSDT #ByXIMPACT

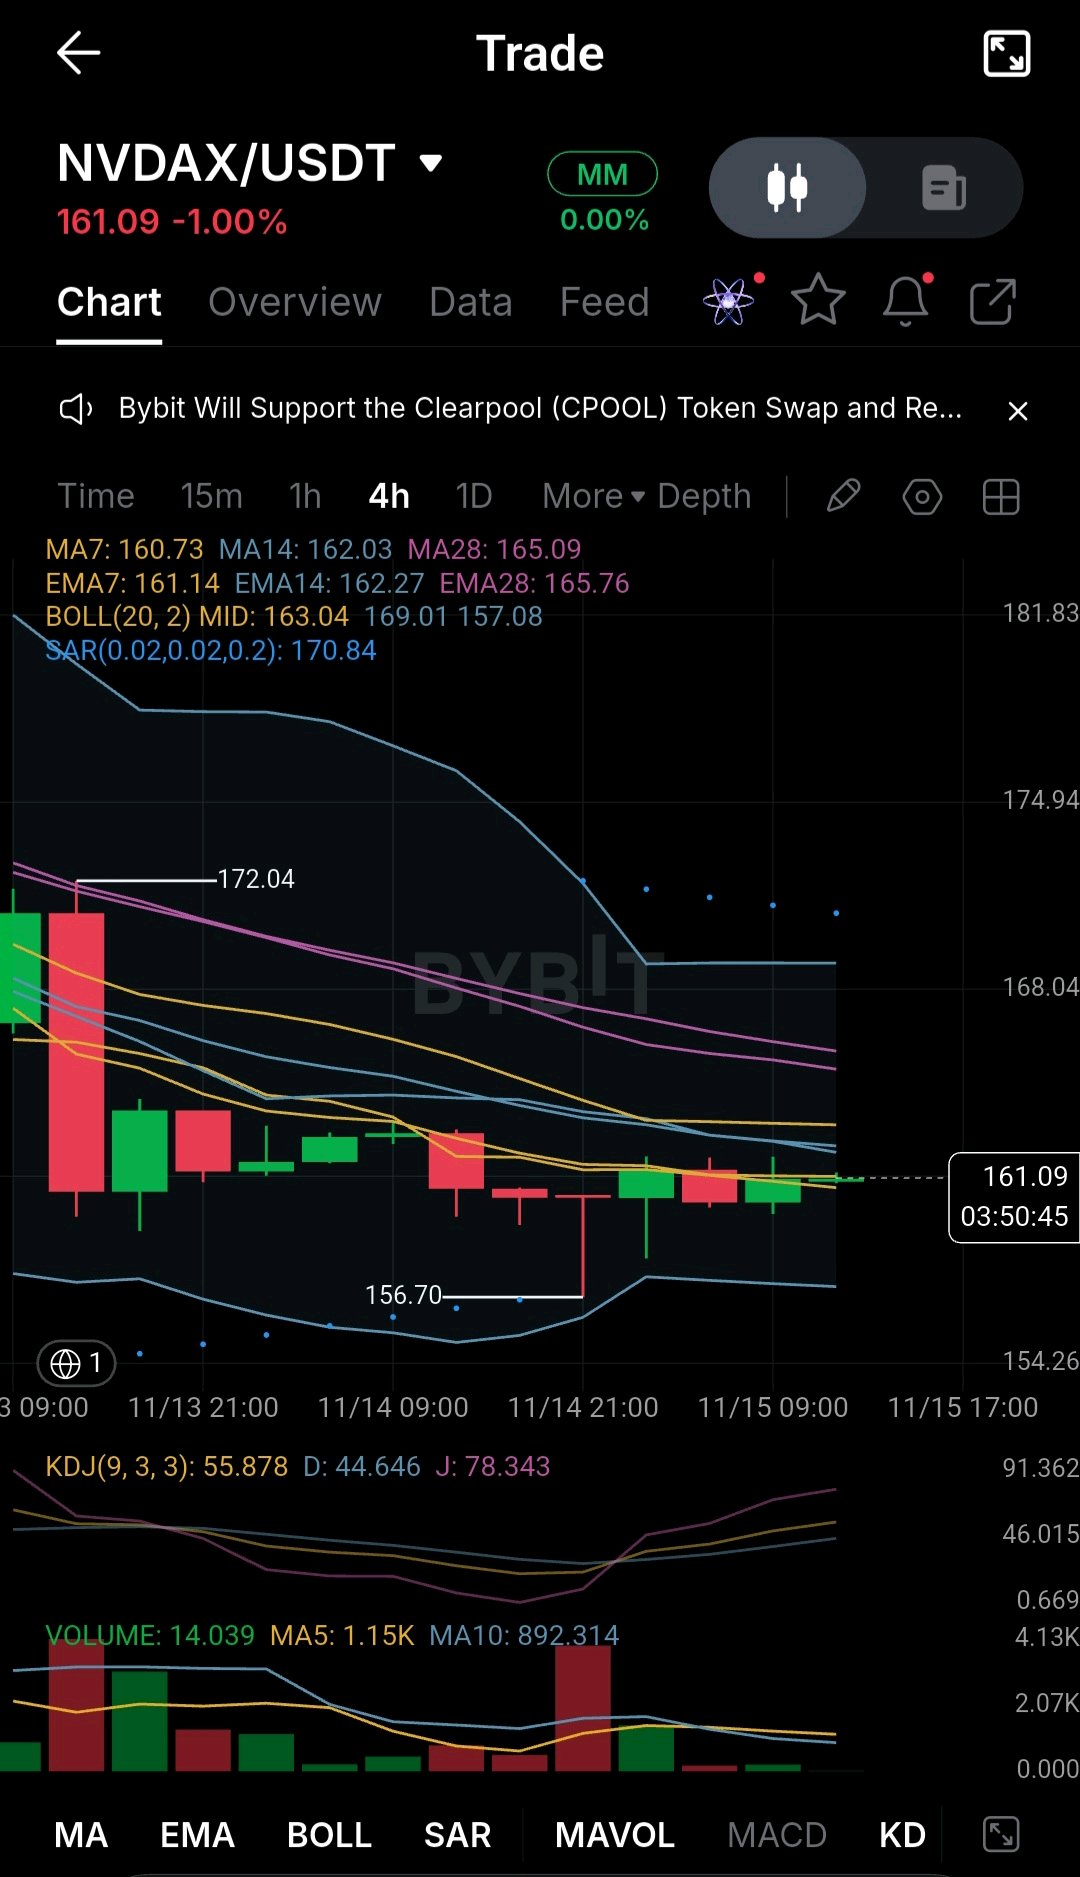
$NVDAX 4H: The Tech Coil! My Staged Spot Entry for Tokenized Nvidia 🧠📊 Most altcoins are pure speculation, but $NVDAX is different—it’s exposure to the world’s leading AI company, wrapped in a token. Looking at the 4-hour chart, the price is currently compressed at 161.09. We are seeing a classic "coiling" phase. Here is my real-time context and how I am using a staged spot entry strategy. 📊 Real Trading Context (The Tension Zone): · The Technical Battle: The price is trapped under a dense ceiling of moving averages (MA14 at 162.03, MA28 at 165.09). The Parabolic SAR (170.84) confirms the broader short-term trend is still down. · The Solid Floor: Despite the bearish MAs, look at the structure. The recent low at 156.70 is holding perfectly. The price is refusing to make a lower low, which means sellers are exhausted. · The Momentum Divergence: Look at the KDJ indicator. The J-line has hooked up sharply to 78.3, crossing the D-line. This shows that despite the low price, short-term buying momentum is secretly building. 💼 My Spot Strategy (Asymmetric Staged Entry): I am strictly Spot trading here. Because this is a tokenized tech stock, I am playing the long game with a tiered approach. · Tier 1 (Starter Position - Now): I am deploying 25% of my intended spot allocation right here at 161.00 - 161.50. The risk-to-reward is favorable because my stop reference is tight (below 156.70). · Tier 2 (Confirmation Add): I will add another 50% to my position ONLY if we see a 4H candle close above the MA14 (162.03). That confirms the reversal. · Tier 3 (Deep Value Add): If the market dips and we retest the 156.70 - 157.00 zone, I will deploy my remaining 25%. · Targets: My first spot profit-taking zone is the mid-Bollinger Band at 163.04, followed by the MA28 at 165.09. I am using crypto to buy real tech value on a discount. How are you playing the $NVDAX coil? 👇 $NVDAXUSDT $AAPLXUSDT #ByXIMPACT

🤖 THE AI AGENT ECONOMY: WHY THE FUTURE OF CRYPTO COULD BE BUILT AROUND AUTONOMOUS MACHINES! I believe we are approaching a major transformation at the intersection of Artificial Intelligence and blockchain technology. Until now, AI has primarily been used to answer questions, analyze information, and automate everyday tasks. But the next stage could be much bigger: AI agents capable of operating independently, purchasing services, managing resources, and executing digital payments. Imagine millions of autonomous agents communicating with one another, buying computing power, accessing data, and paying for services without requiring human approval for every individual transaction. This is where cryptocurrency could become an essential part of the digital economy. Why does crypto matter? Traditional payment systems were designed mainly for human transactions. AI agents, however, may need to execute thousands of tiny payments in real time. Blockchain networks and stablecoins could provide programmable payments, faster settlement, and global access to digital services. One of the developments worth watching is Coinbase's x402 protocol, which explores automated payments for accessing APIs, data, computing resources, and other digital services. It represents an important step toward machine-to-machine commerce. Stablecoins could also play a major role because autonomous systems need predictable payment units rather than assets exposed to significant price volatility. Several crypto infrastructure projects deserve attention in this emerging sector: - NEAR Protocol (NEAR): Blockchain infrastructure and AI-oriented applications. - Artificial Superintelligence Alliance (FET): Decentralized AI and autonomous agent ecosystems. - Virtuals Protocol (VIRTUAL): AI agent creation and digital economic coordination. - World (WLD): Digital identity and human verification. - Chainlink (LINK): Reliable data and interoperability infrastructure. - Render (RENDER): Decentralized computing resources that could support growing AI workloads. However, I believe we must look beyond token prices and market hype. The real question is which projects can attract genuine users, generate sustainable demand, and become essential infrastructure. There are also important challenges involving cybersecurity, digital identity, unauthorized spending, regulation, and accountability. Autonomous agents will need secure wallets, spending limits, verified permissions, and reliable payment systems before widespread adoption becomes realistic. MY CONCLUSION I believe the convergence of AI and crypto could introduce an entirely new category of blockchain users: autonomous software agents. The next phase of digital adoption may not be driven exclusively by people using wallets. It could also involve machines exchanging value, purchasing resources, and participating in a global digital economy. The biggest opportunity may therefore lie not simply in AI-related tokens, but in the infrastructure that enables autonomous machines to transact securely. 🔥 WHAT'S YOUR VIEW? Will AI agents become major users of blockchain networks? Could stablecoins become their preferred payment method? And which project is best positioned to benefit from this transformation: NEAR, FET, VIRTUAL, LINK, or a new player? $FETUSDT $LINKUSDT #ByXIMPACT #AITechSelloffErases2Point5TrillionFromNasdaq100

🏛️ The Institutional RWA Supercycle Just Went Sovereign: Breaking Down the Czech National Bank’s DLT Bond Issuance. While retail traders were staring at 15-minute candles and getting chopped up, the macro landscape just shifted beneath our feet. The Czech National Bank (CNB) just issued its first koruna-denominated bonds on a blockchain ledger via CSD Prague (the first entity to receive an EU DLT Pilot Regime license). They tested the full lifecycle—transfers, interest, repo—with near-instantaneous settlement. Why does this matter to us? Because it validates the Tokenization Supercycle. When central banks and sovereign entities start using DLT rails, it’s no longer a crypto narrative; it’s a structural shift in global finance. 🔍 The Real-World Asset (RWA) Beneficiaries: When sovereign wealth moves on-chain, it doesn’t use meme coins. It uses institutional infrastructure. Here is where I am positioning my Spot capital to capture this flow: · $ONDO (Ondo Finance): The undisputed leader in tokenized real-world assets (like US T-bills). As central banks tokenize sovereign debt, Ondo’s infrastructure is a primary candidate for institutional adoption. · $LINK (Chainlink): The ultimate interoperability layer. For these DLT bonds to interact with legacy banking systems and other blockchains (like the euro-denominated bond the CNB tested), institutional-grade oracles and CCIP (Cross-Chain Interoperability Protocol) are mandatory. · $XRP & $XLM (Cross-Border Settlement): The CNB specifically mentioned a focus on central bank money and making assets more liquid. This ties directly into the long-term thesis of institutional cross-border settlement layers. 🎯 My Actionable Spot Execution Plan (Macro Positioning): I don't trade sovereign adoption with 100x leverage on a Tuesday afternoon. I build positions. · The Accumulation Thesis: I am treating any macro dip in $ONDO** and **$LINK as an institutional "order block." These are assets with deep liquidity and real institutional backing. · My Entry Strategy: I am setting scaled limit buy orders at the major daily support levels (e.g., the mid-Bollinger Band or the 50-day MA). I want to accumulate during periods of market-wide fear, not FOMO. · My Take Profit: I am looking for a structural shift. I will scale out 30% of my spot bag at local psychological resistance levels, but I am keeping a core position for the long-term RWA narrative. · My Invalidation: If the broader crypto market enters a deep liquidity winter, these tokens will bleed too. I keep a hard mental stop loss below my cost basis and maintain a strong USDT reserve to buy further dips. 💡 Let's Build a Real Community (ByX IMPACT): The CNB's Governor explicitly stated that settlement should rely on central bank money, not private instruments. This is a massive signal. The infrastructure is being built right now. Are you positioning your Spot portfolio for the RWA tokenization narrative? Which of these tokens do you believe captures the most institutional value? Let’s discuss serious macro strategies below. 👇 $LINKUSDT $XRPUSDT #ByXIMPACT


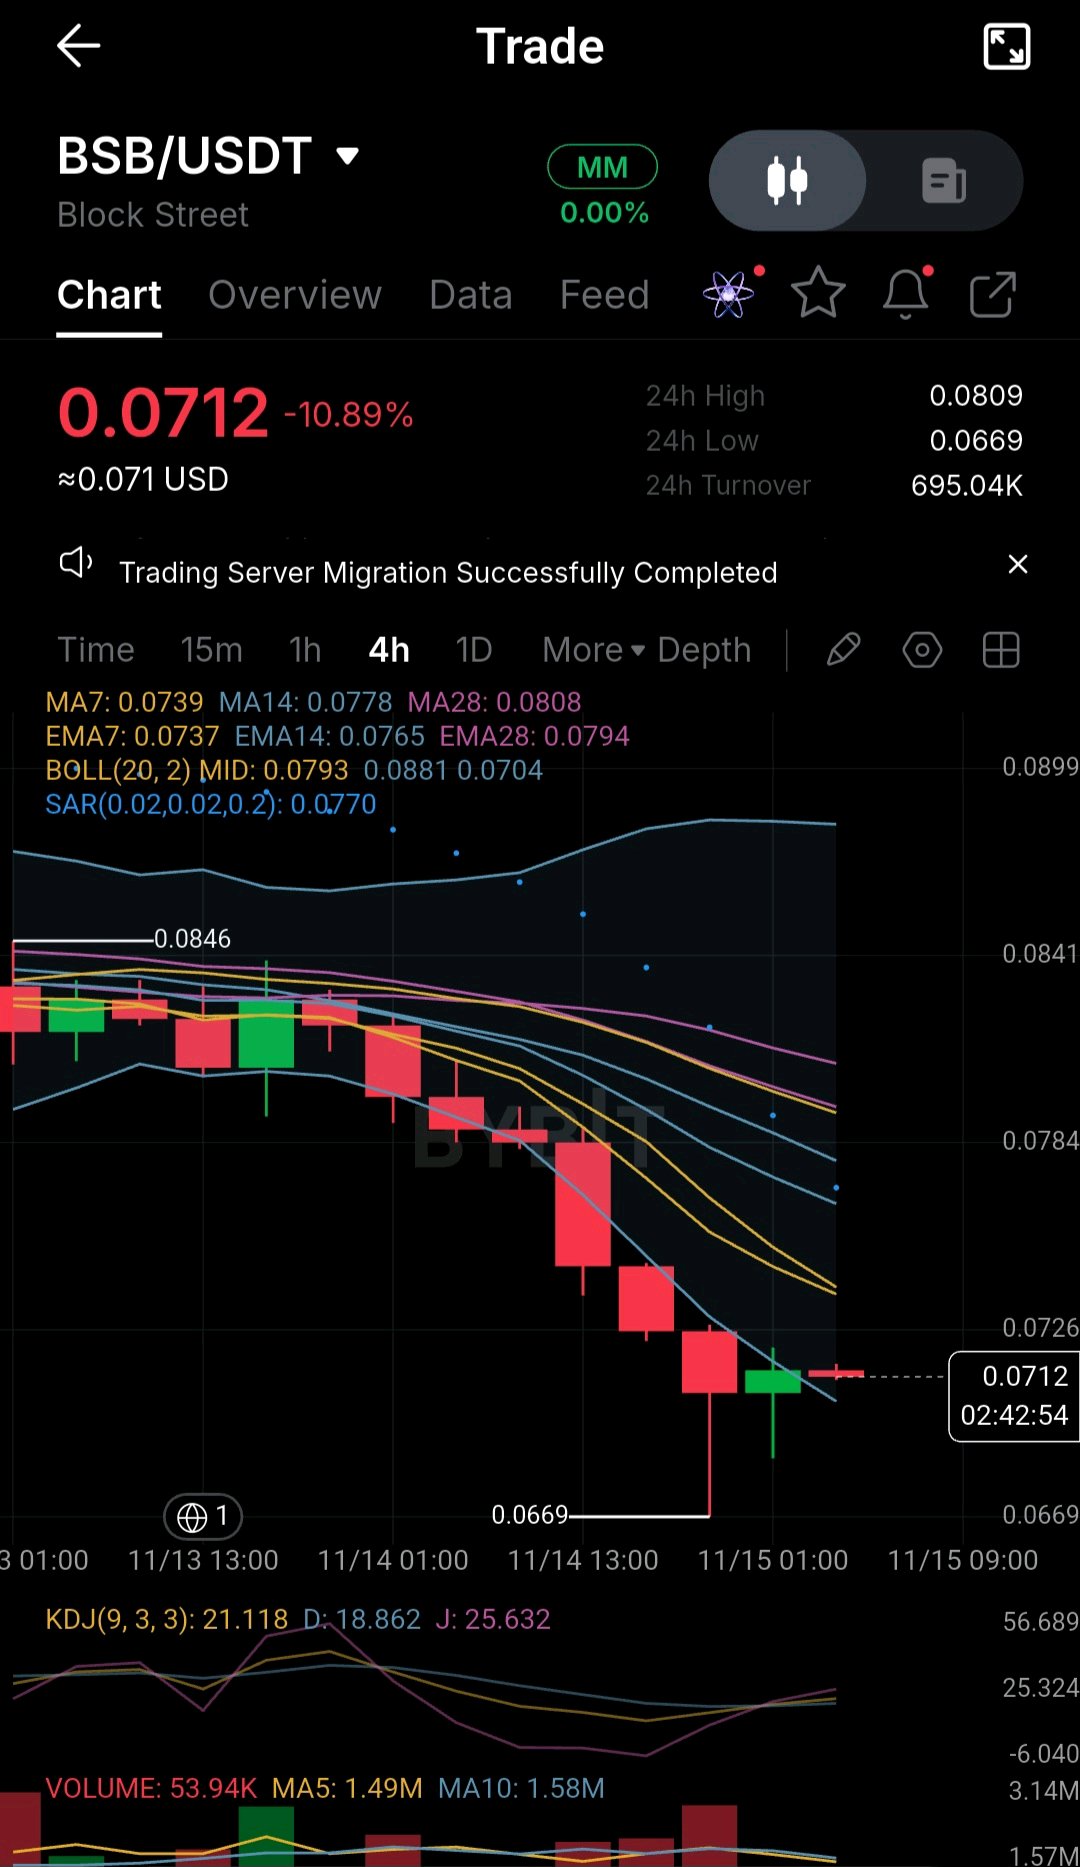
$BSB 4H Analysis: A Brutal Dump! Why I Refuse to Catch This Falling Knife 🩸🛑 Look at this chart. $BSB just experienced a violent freefall, dropping from 0.0846 straight down to a low of 0.0669, currently hovering at 0.0712 (-10.89%). It’s a bloodbath. But while retail traders panic or try to blindly catch the bottom, my spot capital is sitting safely on the sidelines. Here is my real-time context and why I am strictly waiting. 📊 Real Trading Context (The Anatomy of the Dump): · The Trend is Broken: The price is miles away from all major moving averages. The MA7 (0.0739), MA14 (0.0778), and MA28 (0.0808) are fanning out downwards. This is a severe bearish structure. · The Volume Capitulation: This is the most critical data point. Look at the volume bars at the bottom. We had massive red bars pushing the price down. But the recent green candle has virtually zero volume (53K compared to the 1.49M average). This means the selling has exhausted itself, but there is absolutely no buying pressure to push it back up. · Oversold: The KDJ indicator is at rock bottom (J-line at 25.6). However, in a freefall, oversold conditions can remain oversold for a long time. 💼 My Spot Strategy (The No-Buy Zone): I am strictly a Spot trader. I don't use leverage, but that doesn't mean I gamble my stablecoins on falling charts. · My Action: I am NOT buying at 0.0712. This is a "No-Buy Zone." Buying a chart with this much downward momentum and no volume support is a high-risk gamble. · My Trigger to Buy: I will only consider deploying my spot capital if I see one of two things: 1. A 4H candle closing firmly back above the MA7 (0.0739) with a massive spike in green volume. 2. A clear "Double Bottom" or consolidation base forming above the 0.0669 support level over the next few days. · My Philosophy: In spot trading, cash is a position. I don't need to catch the absolute bottom. I just need to buy when the risk is mathematically favorable. $BSBUSDT Let the knife hit the floor and stop bouncing before you pick it up. Are you waiting for $BSB to stabilize, or did you catch the falling knife? 👇 #ByXIMPACT

What is happening... the Bitcoin Price Falls 14% in a Week to $65,000 as Weekend Selling Breaks Friday’s Low Bitcoin price crashed about 14% over the past week and was trading near $65,200 on Saturday morning after sliding to about $65,000, according to Bitcoin Magazine Pro data. The move broke below Friday’s low of about $67,555 and marked the weakest level since mid-August, as weekend trading extended a selloff that has followed a stronger dollar and a fully priced December Federal Reserve rate hike. A week ago, on Nov. 7, bitcoin was trading near $75,750. The decline steepened after Nvidia chief executive Jensen Huang resigned on Thursday, a shake-up that caused AI stocks to sell off which could potentially be responsible for sending bitcoin below $72,000. It slipped toward $71,000 by Thursday evening, then crashed to about $67,555 around midnight Eastern on Friday, its lowest level since August, before recovering toward $69,800 in the morning. A brief pop above $70,000 after the producer-price report faded, and the bitcoin price spent Friday afternoon pinned below $70,000, near $68,900. Selling resumed Friday evening and carried into the mid-$66,000s. Bitcoin briefly steadied overnight near $67,000, then sold off again after 8 a.m. ET Saturday, reaching that $65,500 low in the 10 a.m. hour and taking out Friday’s trough. A stronger dollar and higher yields still weigh on the bitcoin price The Labor Department said Friday that the Producer Price Index for final demand rose 0.3% in October, short of the 0.4% increase economists had expected. On an unadjusted basis, the index was up 6.5% from a year earlier, the largest 12-month rise since November 2022. The slightly cooler monthly figure lifted bitcoin above $70,000 for only minutes. Bond traders were unconvinced. The 10-year Treasury yield climbed as high as 5.17% on Friday, a four-week high, and closed at 5.15%. The U.S. dollar index held at a 19-month high, its strongest level since April 2025. Boston Fed President Susan Collins said Friday that “soon, some additional tightening of Fed monetary policy may be appropriate,” and San Francisco Fed President Mary Daly said policymakers will, “in all likelihood, raise interest rates.” Higher rates raise the cost of holding an asset that pays no interest, and a stronger dollar has weighed on the bitcoin price for much of November. Traders fully priced a quarter-point hike at the Fed’s Dec. 8-9 meeting, CME FedWatch data show. Chip stocks offered no cushion. The iShares Semiconductor ETF fell more than 3% on Friday, and Advanced Micro Devices dropped more than 8%. The Nasdaq 100 closed down 1.22%. U.S. stock and bond markets are closed Saturday, but those levels still frame the weekend session. Nvidia is due to report third-quarter results on Tuesday under interim CEO Colette Kress, the first earnings release since Huang stepped down. $BTCUSDT #ByXIMPACT

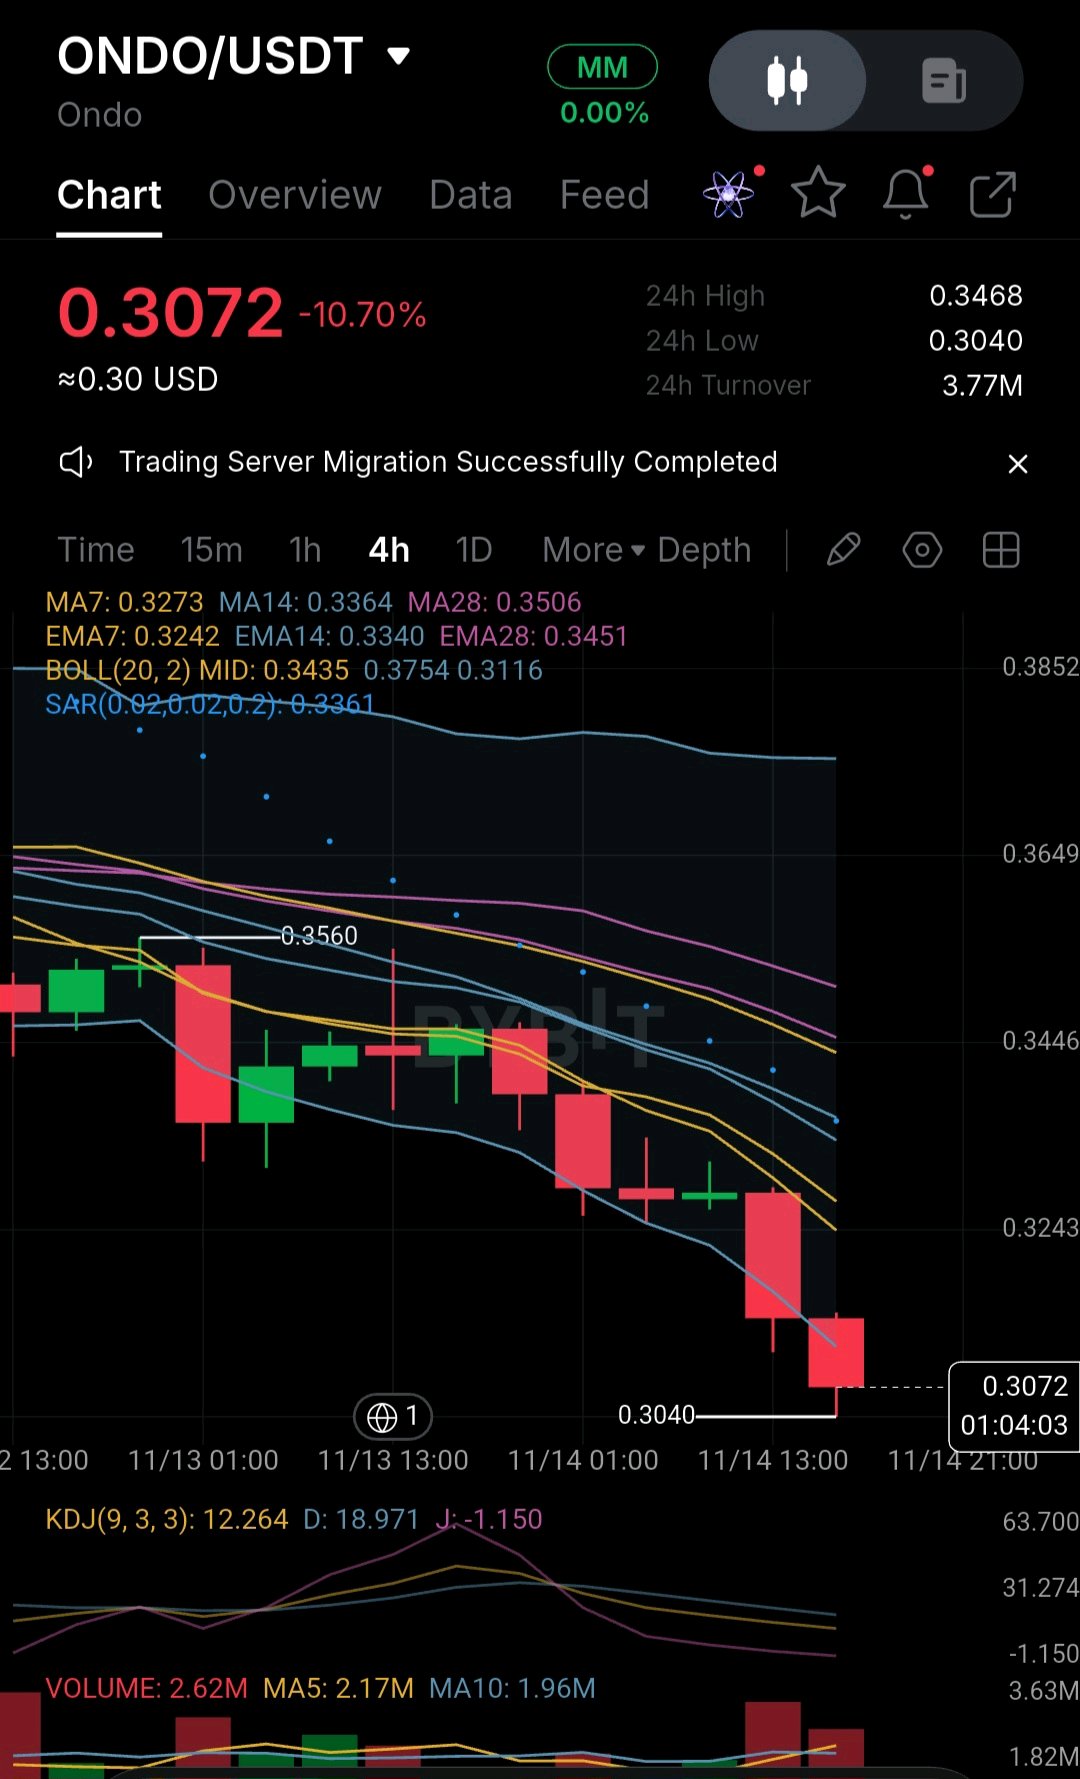
🚨 ONDO ($ONDO) FACES A SHARP CORRECTION — IS THIS A BUYING OPPORTUNITY OR A WARNING SIGN? The ONDO market is experiencing significant selling pressure, with the price dropping 10.70% to $0.3072 on the 4-hour timeframe. But the chart is showing something traders shouldn't ignore. 👀 📉 Market Signals: - Price is trading below all major moving averages. - EMA alignment confirms strong bearish momentum. - Bollinger Bands show expanding downside pressure. - KDJ has entered deeply oversold territory, suggesting a possible exhaustion of selling pressure. - Trading volume has increased during the latest decline. 🎯 Price Zones to Monitor: 🔹 Immediate Support: $0.3040 🔹 First Recovery Target: $0.3243 🔹 Key Resistance: $0.3435 🔹 Major Resistance: $0.3560 ⚡ Two Scenarios Ahead: 🟢 Bullish: Holding $0.3040 and reclaiming $0.3243 could trigger a technical rebound. 🔴 Bearish: Losing $0.3040 may expose ONDO to another leg down. 🔥 Oversold conditions can create opportunities, but they do not guarantee a reversal. Confirmation is everything! Let's hear your prediction: Will ONDO defend $0.30 and bounce back, or are we about to see another major drop? $ONDOUSDT $XRPUSDT #ByXIMPACT #WSOT2026

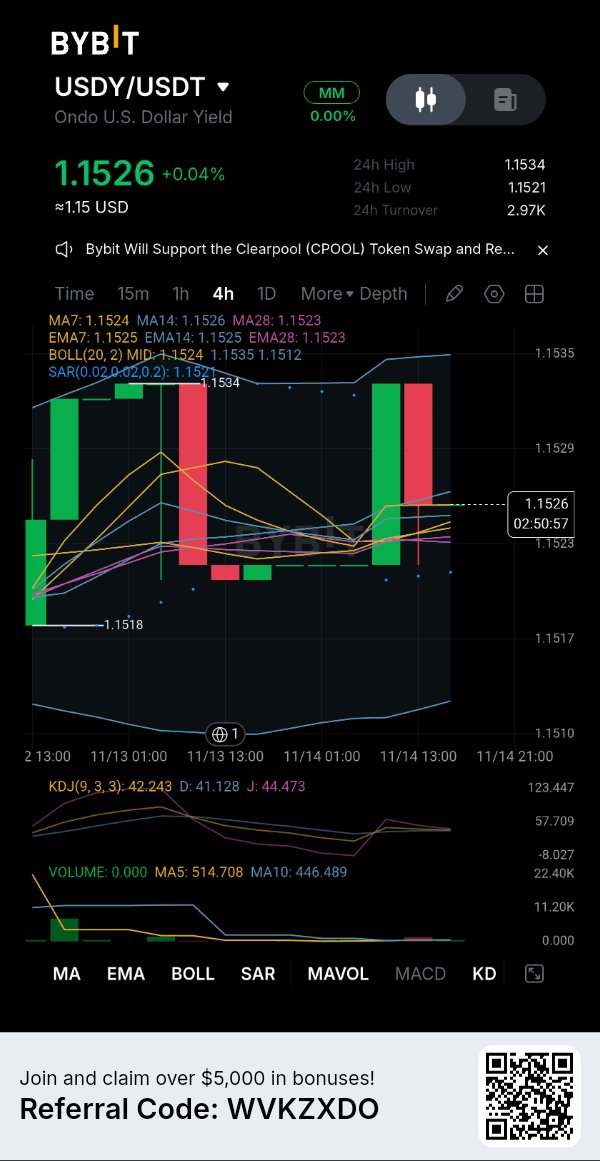
💵 USDY: A Different Kind of Crypto Opportunity — Stability or Hidden Potential? While most crypto assets are driven by sharp market swings, Ondo U.S. Dollar Yield (USDY) is attracting attention for a different reason. 📊 Market Snapshot: - Current Price: $1.1526 - 24H Change: +0.04% - 24H High: $1.1534 - 24H Low: $1.1521 - 24H Turnover: $2.97K 🔍 What Does the 4H Chart Reveal? - Price is holding within a very narrow trading range. - Moving averages are tightly clustered around the current price. - Bollinger Bands indicate relatively limited volatility. - KDJ shows balanced momentum without a strong directional signal. 🎯 Important Levels to Watch: - Support: $1.1521 - Immediate Resistance: $1.1534 - A breakout beyond this range could provide a clearer short-term direction. 💡 The Bigger Picture: USDY is not behaving like a typical high-volatility altcoin. Its price stability and yield-oriented nature make understanding the underlying asset especially important. ⚠️ Always research the token's structure, redemption conditions, and associated risks before making a decision. What interests you most about USDY: its yield potential or its stability in a volatile crypto market? 👇 $USDYUSDT #ByXIMPACT
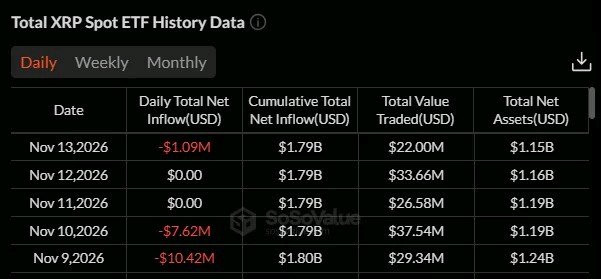
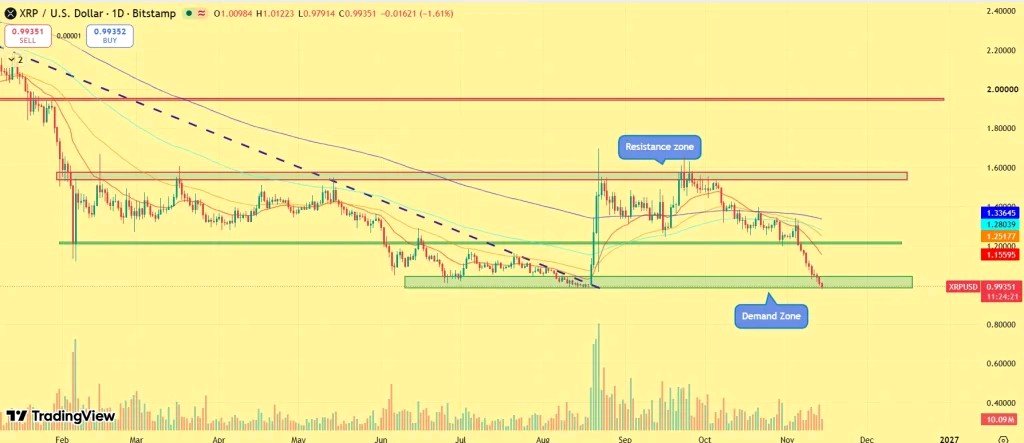
📉 $XRP Below $1: The Retail Panic vs. Whale Accumulation Paradox 🐋📊 Real Trade. Real Insight. The psychological barrier has been broken. $XRP has slipped below $1.00 to $0.99, triggering a wave of panic. The data shows $19.13M in ETF outflows and $16.9M in derivatives liquidations. Retail traders are capitulating. But here is the insight smart money is trading on: despite the bloodbath, on-chain data confirms large holders (whales) are quietly accumulating. This is a classic market paradox. When retail gets liquidated, whales build positions. How do we trade this? 🔍 Technical Insight: The Extreme Oversold Condition: The daily RSI has crashed to a staggering 21.5. For context, any reading below 30 is oversold, but 21.5 is historically a rare, extreme capitulation zone that often precedes a violent relief bounce. The critical demand zone is now firmly at **$0.95**, while the $0.80 region remains the ultimate macro bear target if this floor cracks. 💼 Spot Trade Execution (The Laddered Limit Strategy): Because we are playing an extreme oversold bounce in a bearish structure, I am not using market orders. I am using Laddered Spot Limit Orders. • Entry Zone: I am placing limit orders between $0.95 and $0.98. I am catching the wicks, not the green candles. • Take Profit 1 (TP1): $1.05 (The immediate psychological recovery). • **Take Profit 2 (TP2):** $1.20 (The heavy structural resistance where the breakdown started). • Invalidation Point: A firm daily close below **$0.94**. If the $0.95 demand zone fails, the next stop is $0.80. I will cut the position immediately and wait in stablecoins. ⚖️ Risk Management (The Spot Advantage): This is a 100% Spot trade with zero leverage. While futures traders were liquidated for millions, my spot bags have no liquidation price. I am allocating exactly 3% of my portfolio to this specific setup. I am buying the fear, but I am sizing my position so that if $0.80 hits, it barely scratches my account. 👇 Do you think the whales are right to accumulate here, or will $XRP break the $0.95 support and head to $0.80? Drop your thoughts below! 👇 $XRPUSDT $ETHUSDT #ByXIMPACT


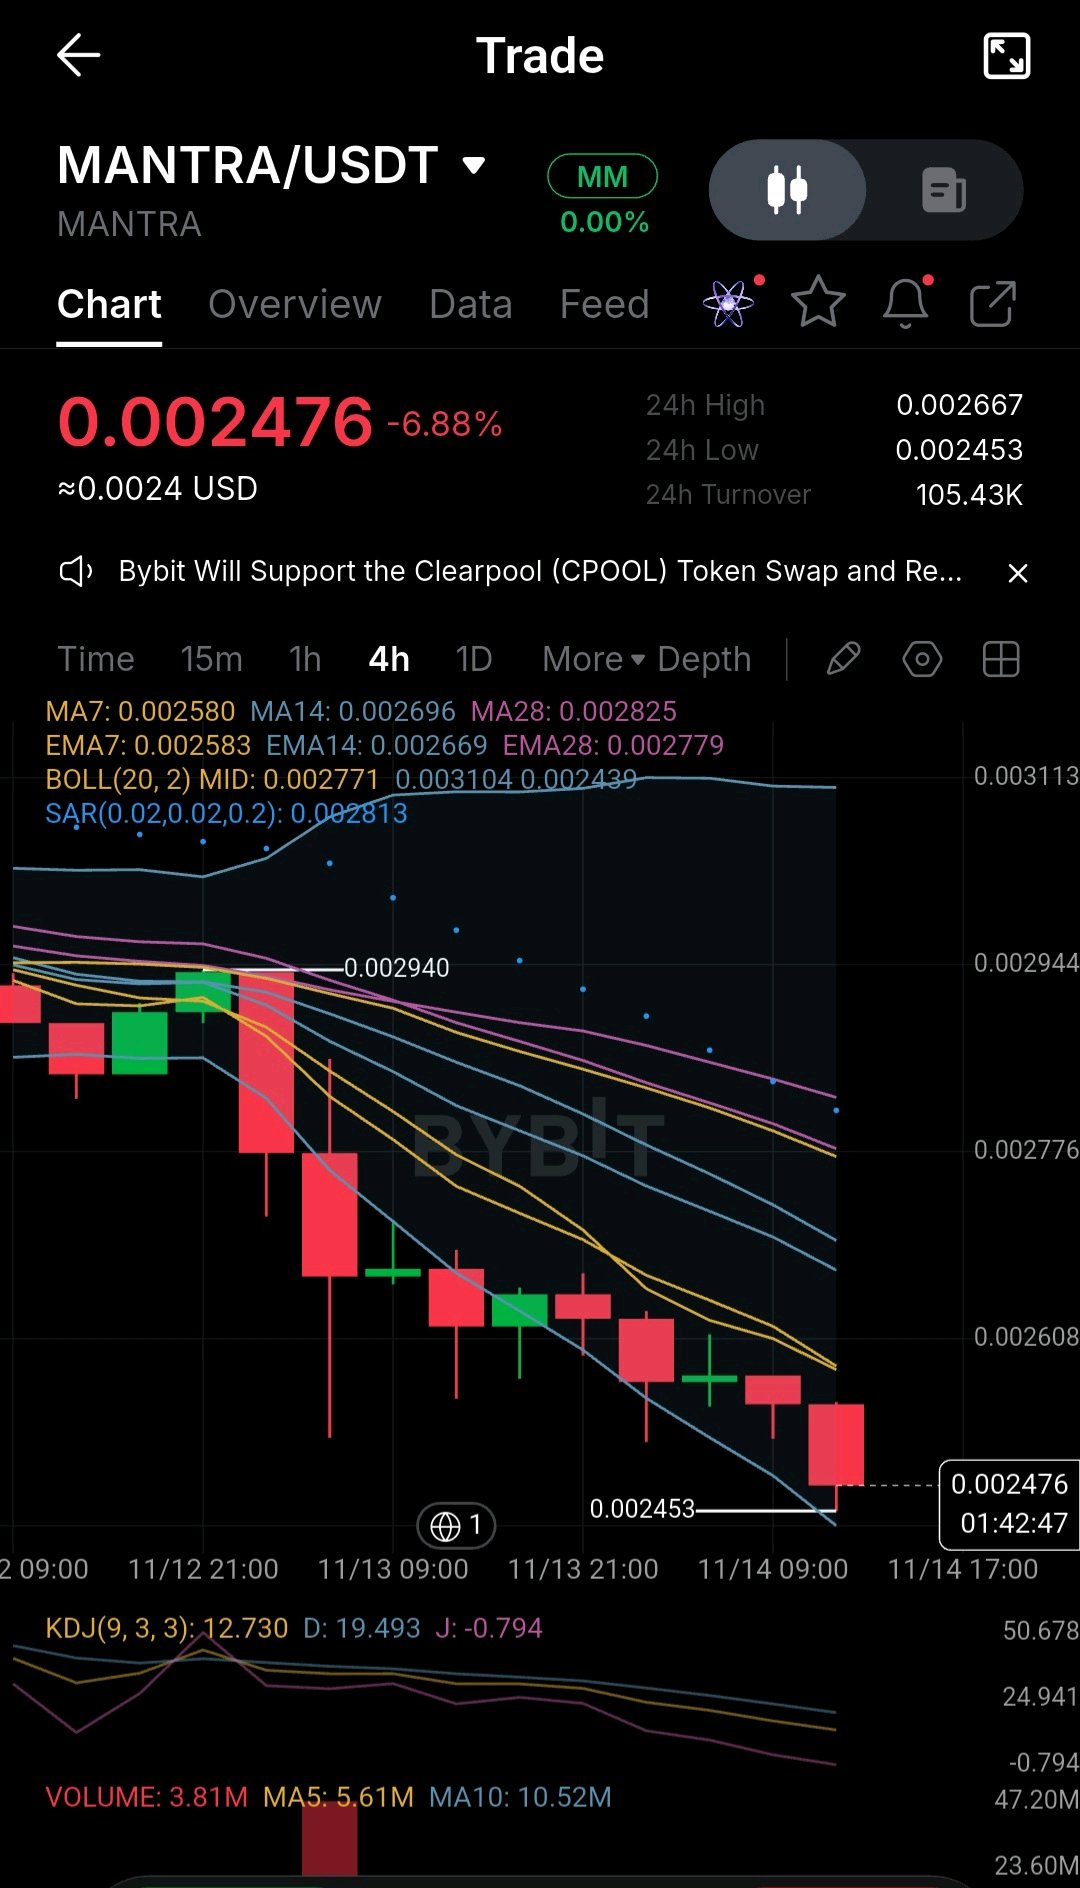
🩸 $MANTRA / USDT (4H): The Negative KDJ Anomaly. Why I Am Refusing to Catch This Falling Knife. Take a look at this 4-hour chart for $MANTRA. It is a brutal sight. We are down another -6.88%, sitting at 0.002476, and the chart is aggressively bleeding out. But look at the very bottom of the screen. The KDJ J-line is sitting at a mathematically extreme -0.794. Retail traders see a negative oscillator and immediately market-buy, thinking the bounce is guaranteed. As a Spot-only trader, I am here to tell you why buying right now is a massive trap, and how I am protecting my capital. 🧠 The "Oversold" Illusion: Just because an indicator is oversold doesn't mean the price can't go lower. Look at the volume profile on the recent red candles—it is massive. This is capitulation. Whales are dumping, and retail is panicking. If I buy at 0.002476, I am literally catching a falling chainsaw. 🔍 The Structural Reality: · The Overhead Wall: Every single moving average (MA7, MA28, EMA28) is fanned out and pointing straight down, acting as a heavy ceiling. The closest resistance is the MA7 at 0.002580. · The SAR Anchor: The Parabolic SAR dots are hovering way up at 0.002813. The bears are in absolute control. · The True Floor: The current 24h low is 0.002453. We are sitting right on top of it. If this breaks, there is no support below. 🎯 My Professional Spot Execution Plan (The Waiting Game): I do not trade based on hope. I trade based on confirmed structure. Here is my strict plan: · Condition 1 (The Safe Long): I will only start accumulating Spot if I see a 4H candle close decisively back above the MA7 (0.002580). This proves the immediate selling pressure has been absorbed. · Condition 2 (The Deep Value Bid): If the market wants to sweep the lows again, I have a passive limit order sitting at 0.002400. I want to buy the extreme panic wick, not the current drift. · My First Target (TP1): 0.002667 (The 24h high and the mid-Bollinger Band). I will scale out 30% of my bag here. · My Hard Invalidation: If we get a 4H close below 0.002400, the floor is gone. I will cancel my bids and wait for the market to establish a completely new base. 💡 Let's Build a Real Community (ByX IMPACT): Amateurs buy the dip and pray. Professionals wait for the trend to shift. The negative KDJ tells me the selling is exhausted, but the lack of buying volume tells me the whales aren't ready yet. I am letting the market come to me. Are you trying to catch this falling knife on $MANTRA, or are you waiting for a confirmed reversal candle like I am? Let’s discuss real Spot strategy below. 👇 $MANTRAUSDT $PIEVERSEUSDT #ByXIMPACT

#ByXIMPACTThe market is currently experiencing heavy turbulence, with Bitcoin breaking below the 67,000 dollar mark and billions in liquidations occurring across the board. While retail traders panic and look at short-term charts, institutional capital is quietly rotating into a completely different narrative. The new trend is not about hype or speculative roadmaps; it is about real revenue and token buybacks. This is the most significant structural shift we are seeing right now. According to recent data, crypto protocols have generated over 11 billion dollars in revenue this year. The numbers reveal a shocking reality: among the top revenue-generating protocols, those with active buyback mechanisms have averaged a 62 percent gain year-to-date. Meanwhile, protocols without buybacks have averaged a 31 percent loss. This massive 93 percent performance gap proves that the market has matured. It now demands real business models and sustainable cash flow. I am applying this exact insight to my spot trading strategy. I am focusing on assets like Jupiter (JUP) and World Liberty Financial (WLFI). Jupiter has implemented a massive 70 million dollar buyback program, and WLFI is linking stablecoin economics directly to token value. These are the protocols capturing real value. Instead of chasing green candles or buying blindly during this market dip, I am placing spot limit orders at major structural support levels, such as the 200-day moving average. I am buying businesses, not just tickers. My risk management remains strict. This is a 100 percent spot play with zero leverage. I am allocating 5 percent of my portfolio to this specific thesis. My take profit strategy involves scaling out as these revenue-backed protocols continue to outperform the broader market during the next relief rally. The invalidation point for this trade is a clear structural breakdown in the protocol's revenue or a halt in their buyback execution. If the core fundamentals change, the thesis is dead. Are you still trading based on social media hype, or have you transitioned to revenue-backed assets? Which protocol do you believe has the strongest buyback model right now? Let me know in the comments. $BTCUSDT $BTCUSDC

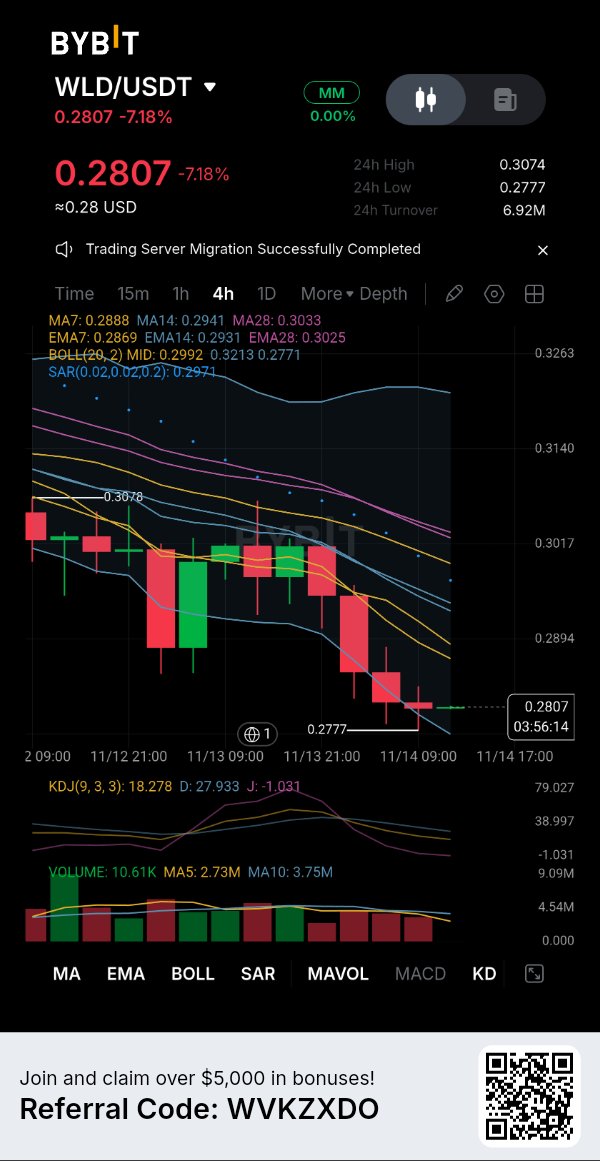
⚠️ WORLDCOIN ($WLD) UNDER HEAVY SELLING PRESSURE — IS A REVERSAL NEAR? Worldcoin is facing a challenging market session, with WLD trading at $0.2807, down 7.18% on the 4-hour chart. 📉 Technical Breakdown: - Bearish momentum remains dominant, with price trading below the major moving averages. - EMA and MA indicators continue pointing downward. - KDJ is deep in oversold territory, suggesting selling pressure may be stretched. - Price is hovering near the recent low of $0.2777, making this an important support zone. 🎯 Critical Price Levels: 🔹 Immediate Support: $0.2777 🔹 First Resistance: $0.2894 🔹 Major Resistance: $0.2992 🔹 Stronger Resistance: $0.3074 🚀 Bullish Possibility: Holding above $0.2777 and reclaiming $0.2894 could create room for a relief bounce. 🔻 Bearish Risk: A confirmed breakdown below $0.2777 could expose WLD to further downside. 👀 The Big Question: Is WLD preparing for a recovery, or will sellers push it to new lows? Share your thoughts below! 👇 $WLDUSDT $MNTUSDT #ByXIMPACT

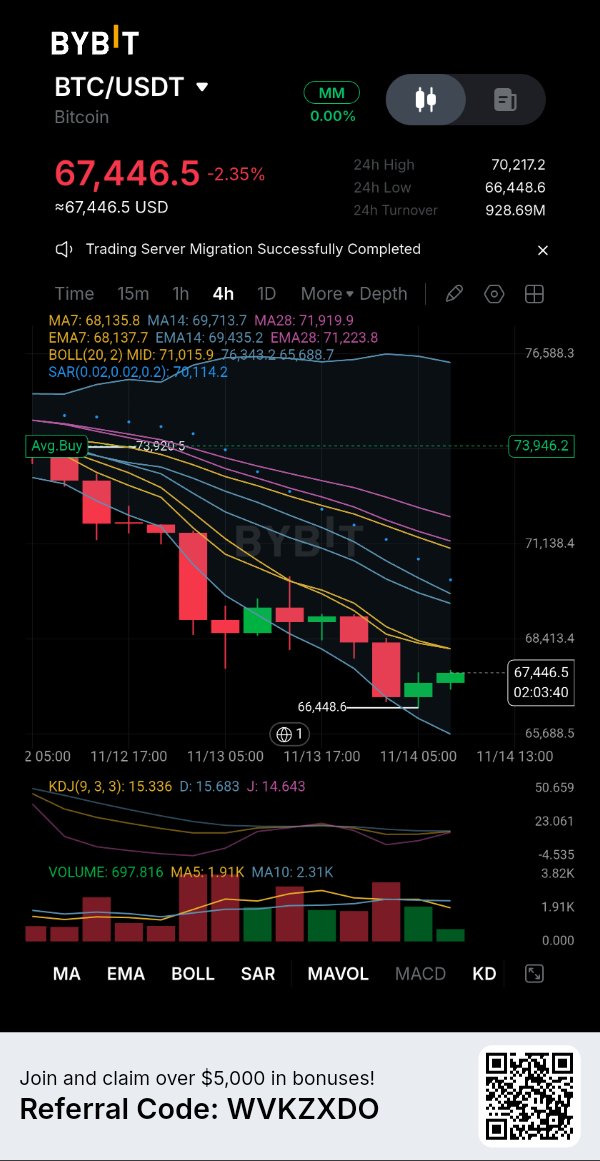
₿ BITCOIN AT A CRITICAL TURNING POINT! Is a Rebound Coming or Is More Downside Ahead? 🔥 Bitcoin is facing strong selling pressure, currently trading at $67,446, down 2.35% on the 4-hour timeframe. 📊 What Does the Chart Tell Us? - The overall trend remains bearish. - Moving averages continue to reflect selling pressure. - KDJ is approaching oversold territory, potentially opening the door for a technical rebound. - Price is attempting to stabilize after reaching a low of $66,448. 🎯 Key Levels to Watch: - Major Support: $66,448 - First Resistance: $68,413 - Next Resistance Zone: $69,700 – $70,200 🚀 Bullish Scenario: A strong recovery above $68,400 could improve the chances of a short-term rebound. ⚠️ Bearish Scenario: A breakdown below $66,448 could trigger another wave of selling. 💡 Don't let market volatility control your decisions. Patience, discipline, and risk management matter most! Your Opinion: Is this Bitcoin dip a buying opportunity, or are we heading toward a deeper correction? 👇 $BTCUSDT $ETHUSDT #ByXIMPACT

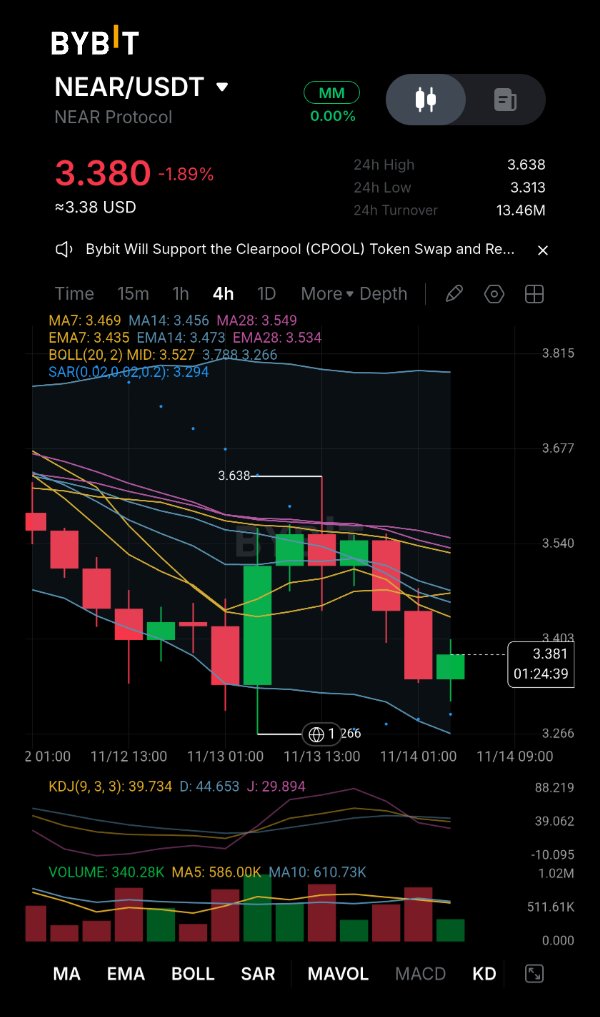
$NEAR 4H Analysis: The Weight of Overhead Supply! My Strict Patience Protocol ⏳🛡️ Look at the NEAR 4-hour chart. We have a market that is trying to breathe, but it's being suffocated by the ceiling above it. The price bounced from the 3.266 lows and is currently hovering at 3.380. While some see a recovery, I see a heavy wall of overhead supply. Here is my real-time context and why my stablecoins remain untouched for now. 📊 Real Trading Context (The Technical Reality): · The MA Ceiling: The price is trapped far below a dense cluster of moving averages. The MA7 (3.469), MA14 (3.456), and MA28 (3.549) are all sloping downwards. This is a classic bearish alignment. Until the price reclaims at least the MA7, the trend is firmly down. · Volume Dry-Up: This is a critical observation. Look at the bottom volume bars. The current volume (340K) is drastically lower than the moving average (586K). A bounce with declining volume means buyers lack conviction. It’s a low-energy environment. · Momentum Still Weak: The KDJ indicator is hovering at low levels (J-line at 29.8) but hasn't printed a strong bullish crossover yet. The Parabolic SAR (3.294) is acting as a very minor short-term floor, but it's fragile. 💼 My Spot Strategy (Strict No-Buy Zone): I am strictly a Spot trader. My capital is a weapon, and I don't fire it blindly. · My Action: I am not buying at 3.380. The risk-to-reward ratio of buying right under a heavy resistance cluster is mathematically poor. · My Trigger to Buy: My thesis will only change if I see a 4H candle close decisively above the MA14 at 3.456 with a spike in volume. That would be the first real sign of a structural shift. · My Value Zone: If the market shakes out the remaining weak hands and drops, I have my Limit Buy orders waiting near the recent absolute bottom at 3.260 - 3.280. · My Targets (If triggered): I would aim for the mid-Bollinger Band at 3.527 as a first spot profit-taking zone. Don't confuse a low-volume bounce with a trend reversal. Are you trying to catch this $NEAR knife, or waiting for structural confirmation? 👇$NEARUSDT #ByXIMPACT