CoinGru
4863Like0Shares153Fans424Follow
Crypto Trader | Technical Analyst 📊 Reading Charts, Not Hype. Discipline • Strategy • Risk Management
Crypto Trader | Technical Analyst 📊 Reading Charts, Not Hype. Discipline • Strategy • Risk Management
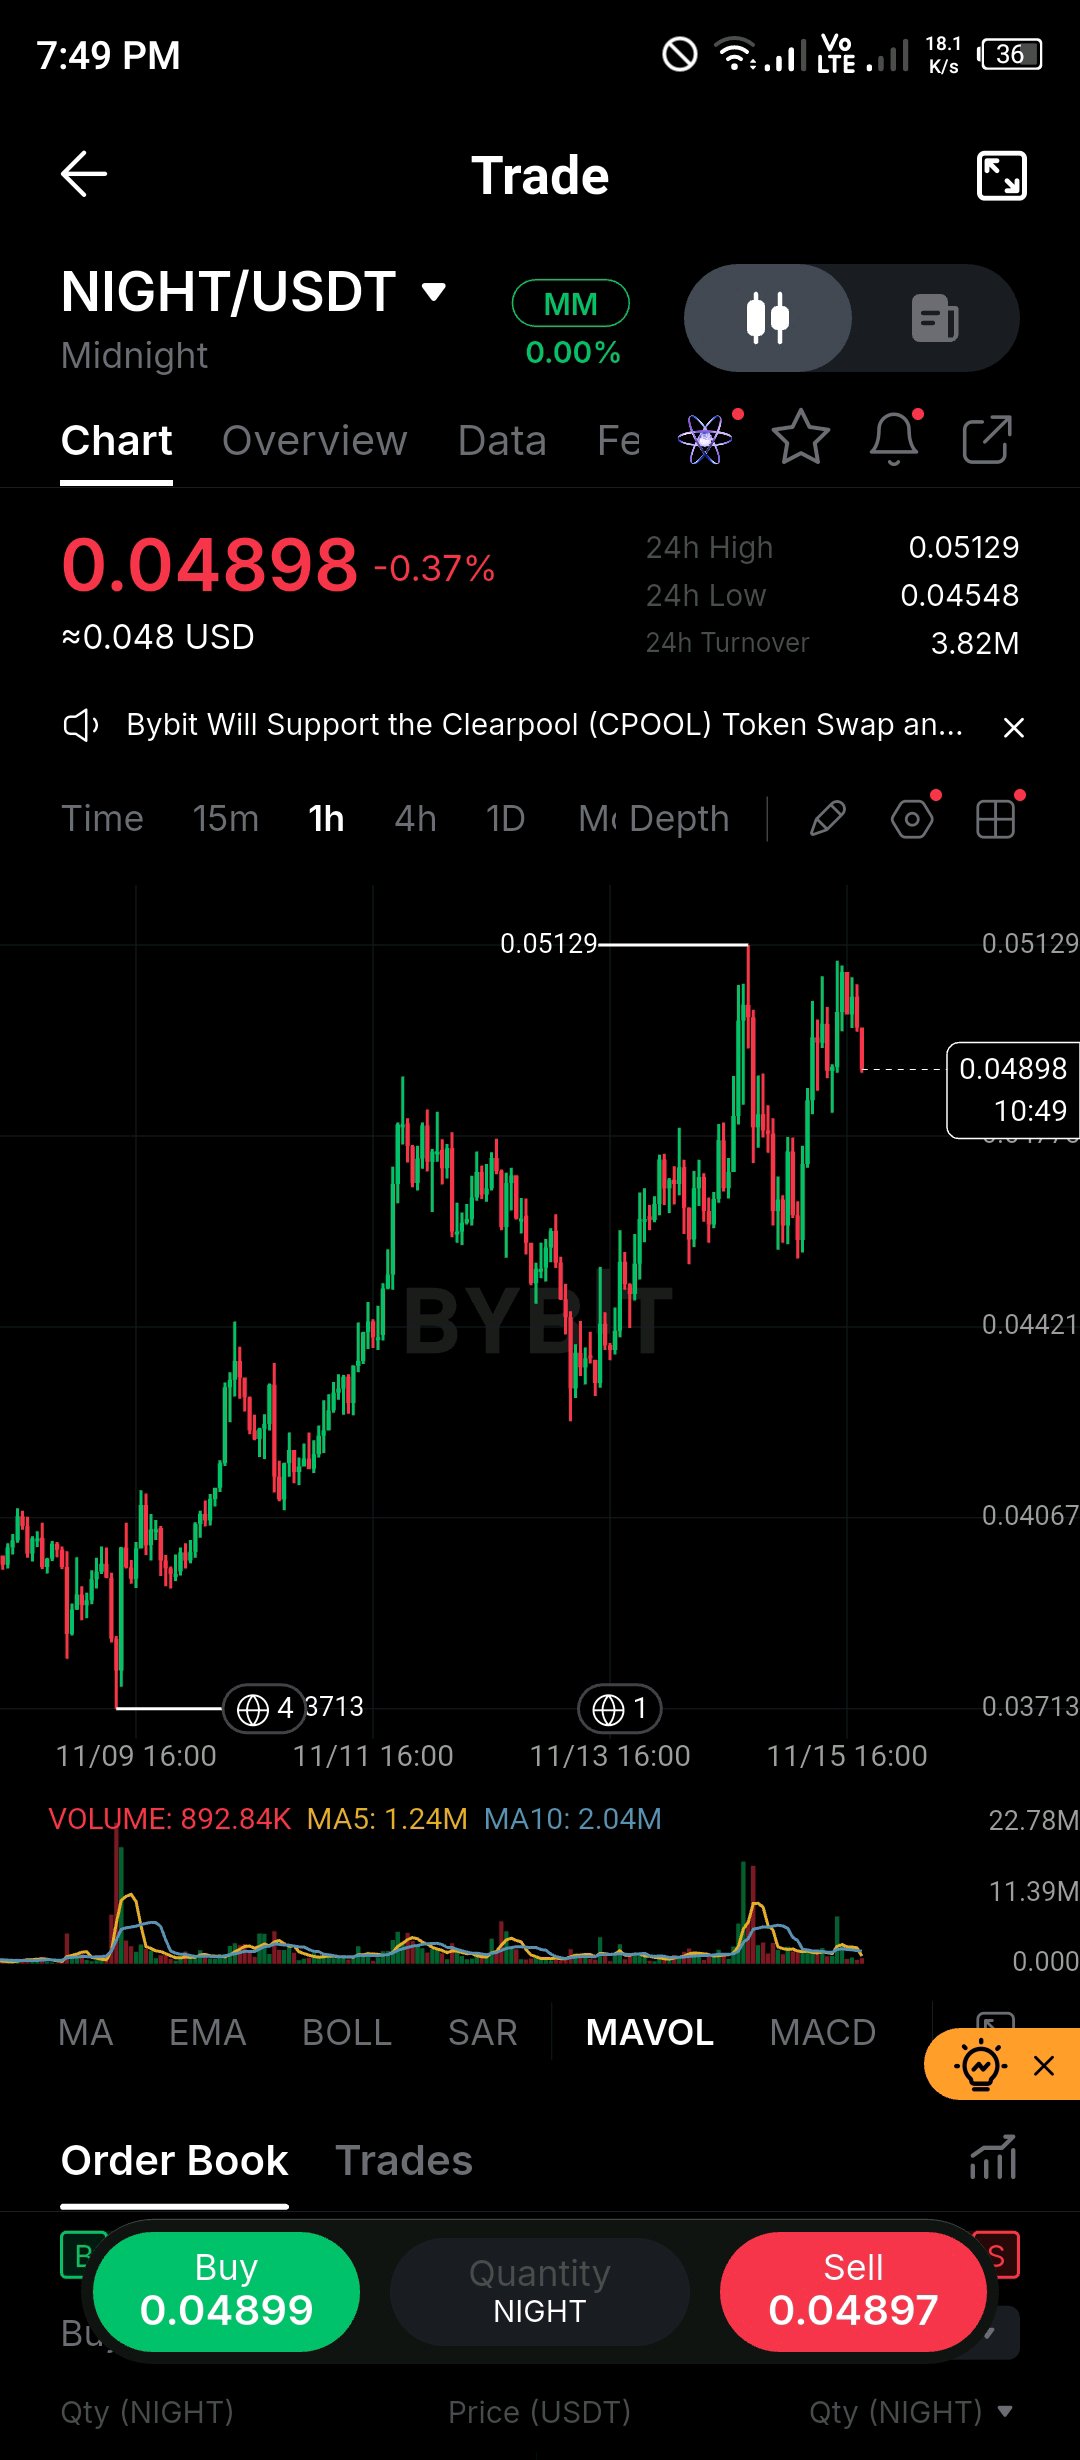
$NIGHT is approaching a critical decision point, and I’m paying close attention to how price reacts around the $0.05000 psychological barrier. What initially caught my attention is the strong recovery from the $0.03713 region, followed by a series of higher price swings. Buyers have clearly improved the market structure, but the latest candles suggest that upside momentum is encountering resistance near the recent $0.05129 high. Currently trading around $0.04898, NIGHT is showing a relatively small decline of 0.37%. Looking at the 1-hour chart, the broader structure remains bullish, with price recovering from previous pullbacks and pushing toward higher levels. However, the rejection around $0.05129 deserves attention. Sellers have responded near this area, creating short-term uncertainty about whether buyers have enough strength to extend the rally. The $0.05000 level is the first psychological resistance I’m watching. A convincing 1-hour close above it could bring another attempt toward $0.05129. If buyers break that high with expanding volume, the next potential upside areas could develop around $0.05300 and $0.05500. These are conditional projection levels, not confirmed resistance zones. Volume is another important detail. Current volume is approximately 892.84K, while the displayed MA5 and MA10 volume averages are 1.24M and 2.04M respectively. This suggests that recent participation is relatively weak compared with those averages. I would prefer to see stronger buying activity before trusting another breakout attempt. On the downside, I’m monitoring the $0.04800–$0.04700 area as an approximate near-term support zone. Losing this region could expose $0.04548, followed by the more significant structural support around $0.04421. A deeper breakdown could bring $0.04067 into focus. My strategy here is to avoid chasing price directly beneath resistance. I want to see either a confirmed breakout above $0.05129 followed by a successful retest, or a controlled pullback that shows buyers defending support. A sustained move below $0.04421 would significantly weaken my bullish outlook. One limitation is that EMA, RSI and MACD values are not displayed in this screenshot, so I won't pretend to have confirmation from indicators that aren't available. My overall view remains cautiously bullish while NIGHT holds its recent higher-low structure, but the next move depends on how convincingly buyers handle $0.05000–$0.05129. I would rather wait for confirmation than mistake another resistance rejection for the beginning of a fresh rally. $BTCUSDT$NIGHTUSDT #ByXIMPACT
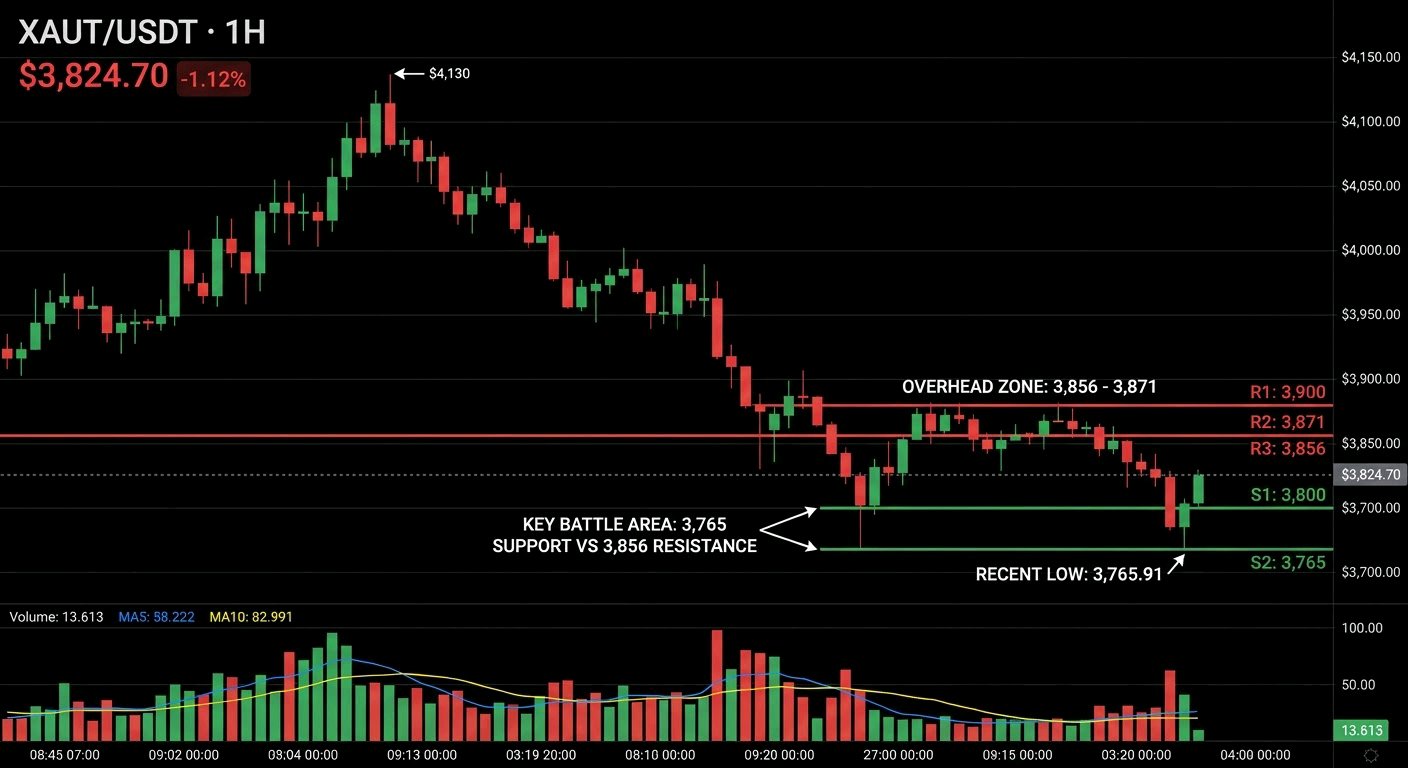
XAUT/USDT is showing a market that has lost considerable upside momentum and I’m more interested in how sellers behave around the recent low than in this small recovery Gold has been under sustained pressure on the 1-hour chart with price falling from the $4,130 region toward $3,765 The latest bounce is worth watching but I wouldn't interpret it as a confirmed reversal just yet XAUT is currently trading around $3,824.70 down approximately 1.12% What stands out to me is the sequence of lower highs and lower lows Every recovery attempt has struggled to regain previously lost ground suggesting that sellers have maintained control throughout this decline The $3,856–$3,871 area is now an important overhead zone while the recent low at $3,765.91 represents the immediate downside boundary Looking at the current price action $3,856 is the first resistance I want to see buyers reclaim Above that $3,900 becomes another important psychological and structural hurdle A sustained move beyond $3,900 would improve the recovery outlook potentially opening a path toward $3,948 and eventually $4,039 On the downside I'm keeping $3,800 and $3,765 in focus If sellers push price below $3,765 with convincing volume another bearish expansion could develop exposing the $3,720 region as a potential next area of interest However if buyers defend this low and establish higher lows the current recovery could gain traction Volume also deserves attention The displayed volume averages MA5 at 58.222 and MA10 at 82.991 are above the latest reported volume of 13.613 This suggests that the current rebound needs stronger participation before I would consider it convincing EMA positioning RSI MACD and Fibonacci readings aren't visible so I won't manufacture indicator signals My preferred approach is patience I would look for a confirmed reclaim of $3,856 before considering a long opportunity with a protective stop below the confirmed higher low Alternatively a rejection near resistance followed by a break of $3,800 could offer a bearish setup targeting $3,765 Any entry should be based on confirmation and a sensible risk to reward ratio The key battle for XAUT is now between the $3,765 support and the $3,856 resistance Until buyers recover that resistance I remain cautious about calling this a trend reversal The next decisive hourly candles could reveal whether this is the beginning of a meaningful recovery or simply another pause in the broader decline $XAUTUSDT $BTCUSDT ll#ByXIMPACT
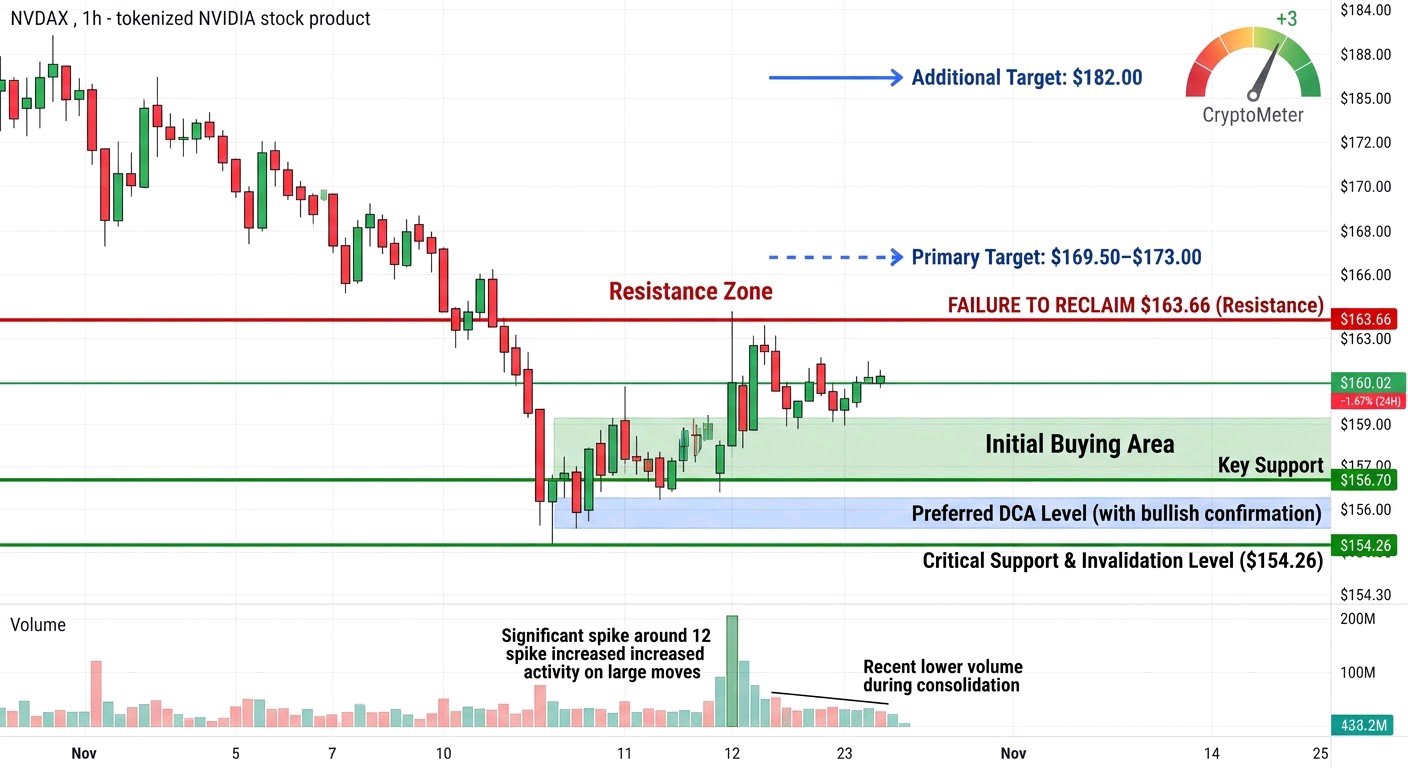
NVDAX IS STRUGGLING TO RECLAIM $163 — WILL BUYERS DEFEND THE $156 SUPPORT ZONE? Market Context I'm keeping a close eye on NVDAX because the chart is showing a clear shift in momentum. At the time of the Bybit screenshot, NVDAX was trading around **$160.02**, down 1.67% over 24 hours. The 24-hour trading range stands between $156.70 and $163.14, with approximately $1.16M in turnover. The broader picture remains under pressure after a substantial decline from the $188–$192 region. NVDAX represents NVIDIA through a tokenized stock product, so its price action also needs to be considered alongside the underlying equity market.# Price Action The 1-hour chart is showing a bearish market structure. Sellers have repeatedly established lower highs, while several attempts to recover have failed to produce a sustained bullish breakout. One important detail is the recent reaction around $154.26. Buyers stepped in aggressively from that area, triggering a recovery toward the $170 region. However, the rebound lost momentum, and price returned toward $160. Currently, NVDAX is consolidating below the $163.66 resistance area. This suggests that buyers have not yet regained meaningful control. # Volume Analysis Trading activity increased during some of the major downward and recovery candles, particularly around the sharp move near November 12. However, the latest consolidation does not yet demonstrate convincing buying pressure. I want to see expanding volume alongside a resistance breakout before treating this as a genuine reversal. ### My Trading Plan - **Initial Buying Area:** $157.00–$159.00 - **Preferred DCA Level:** $154.30–$156.00, only after bullish confirmation. - **First Resistance:** $163.66 - **Primary Target:** $169.50–$173.00 - **Additional Target:** $182.00 - **Key Support:** $156.70, followed by $154.26. - **Invalidation Level:** Sustained 1-hour acceptance below $154.26. These are technical planning zones, not guaranteed execution prices. ### Continuation Scenario For a stronger recovery, NVDAX needs to reclaim $163.66 with a convincing 1-hour candle close and increasing volume. If buyers achieve that, the next areas I'm watching are $169.50, $173.00, and potentially $182.00. A sustained move above $173 would provide a stronger indication that the bearish structure is beginning to weaken. ### What Could Go Wrong? The biggest concern is another rejection around $163.66. If sellers push price below $156.70, attention shifts toward $154.26. A decisive breakdown beneath $154.26 could expose further downside liquidity and weaken the recovery thesis. I would avoid blindly averaging down because a lower price does not automatically mean a better entry. My Perspective NVDAX is approaching an important decision zone. The recovery from $154.26 shows that buyers are still willing to defend lower prices, but they haven't demonstrated enough strength to reverse the broader trend. My focus is on two levels: $163.66 for bullish confirmation and $154.26 for downside invalidation. I'm interested in the recovery, but I won't confuse a temporary bounce with a confirmed trend reversal. Let the price prove its direction before committing capital. CryptoMeter +3 #ByXIMPACT $NVDAXUSDT $METAXUSDT
🚨🇨🇿 **BREAKING: A CENTRAL BANK JUST TOOK ANOTHER MAJOR STEP INTO THE BLOCKCHAIN ERA! The Czech National Bank (CNB) has officially issued its first tokenized bonds using blockchain-based Distributed Ledger Technology (DLT). And this development is much bigger than it might initially appear. Here's what makes this move particularly interesting: 🔥 1. First-Ever Blockchain Bond Issuance On November 10, 2026, the CNB announced that it had successfully tested its first tokenized koruna-denominated bonds, marking a historic milestone for the institution. 🔥 **2. Real Financial Transactions, Not Just Theory** The central bank tested: - Bond issuance and transfers. - Purchases and sales against payment. - Interest payments. - Repo transactions using bonds as collateral. Transactions settled almost instantly, demonstrating the potential for significantly faster financial markets. 🔥 3. Major Institutions Were Involved The operation used DLT infrastructure operated by the Czech Central Securities Depository, with Česká spořitelna participating as the commercial banking counterparty. Each test bond had a nominal value of CZK 10,000, with transaction volumes in the tens of thousands of koruna. 🔥 4. Bitcoin Was Already Part of the Experiment Here's the detail many people might overlook. Approximately one year earlier, the Czech National Bank launched a digital asset test portfolio exploring Bitcoin, a USD stablecoin and tokenized deposits. Now, it has expanded its experiments into tokenized securities and blockchain-based financial infrastructure. 🔥 **5. The Bigger Vision: 24/7 Financial Markets** The CNB believes DLT could enable securities transactions around the clock, reduce administrative costs, accelerate settlement and automate financial operations. Governor Aleš Michl also emphasized that central bank money should remain at the core of settlement rather than relying on private money such as stablecoins. **MY TAKE:** This is the development worth paying attention to. A central bank isn't simply discussing blockchain anymore. It's testing how the technology can work inside real financial operations. Bitcoin opened the door to a new financial architecture. Tokenization could be the next major chapter. Imagine traditional bonds, securities and institutional financial transactions operating on digital infrastructure around the clock. We're watching traditional finance move closer to blockchain technology, one major step at a time. **THE BIG QUESTION: If more central banks follow this path, how large could the tokenized financial market become? National Bank +2 $BTCUSDT #ByXIMPACT

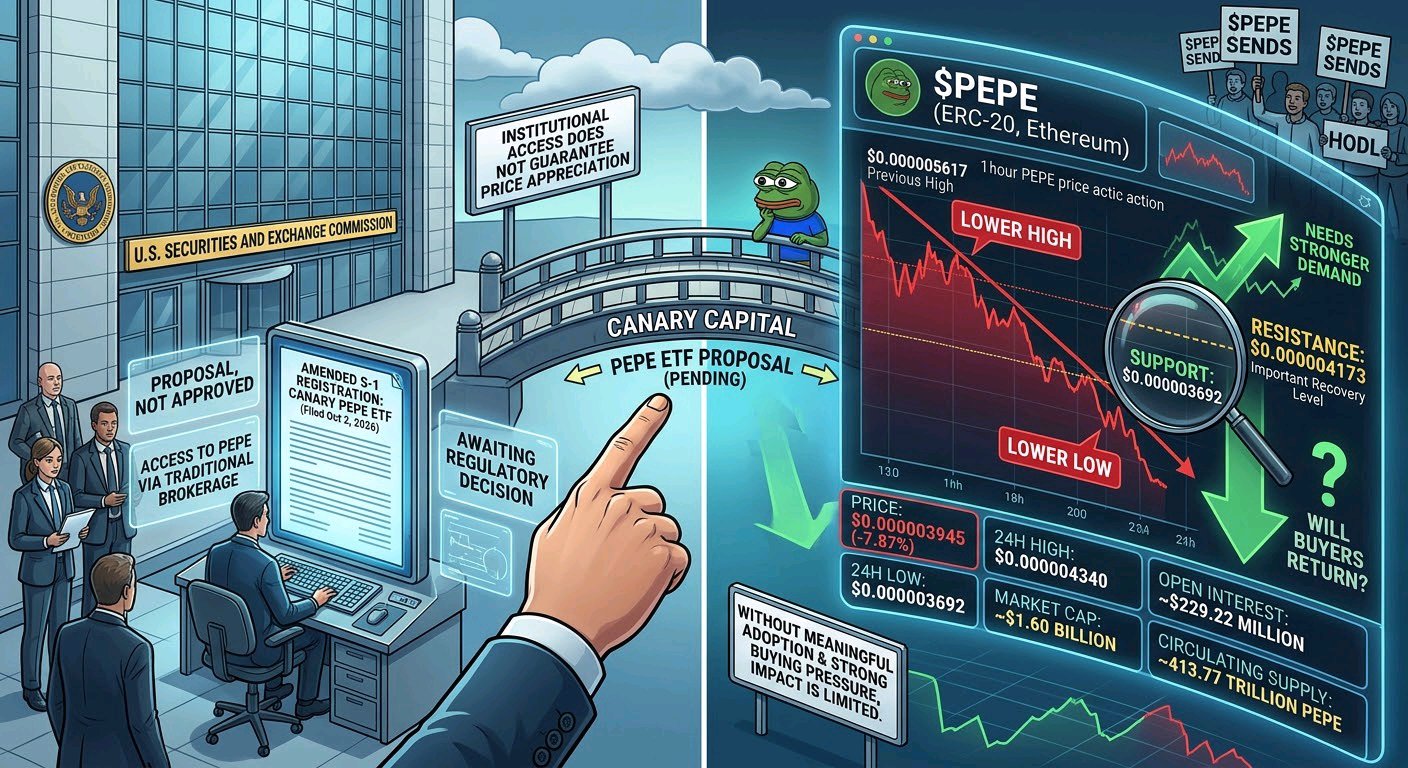
What happens when a meme coin starts attracting attention from traditional financial markets, but its price continues struggling to hold important support? That's exactly the situation I'm watching with $PEPE. One of the most interesting developments is Canary Capital's proposed PEPE ETF. The company filed an amended S-1 registration statement with the SEC on October 2, 2026, outlining a fund designed to provide investors with exposure to PEPE through a traditional brokerage account. The proposal aims to hold PEPE directly, potentially creating another route for institutional and traditional-market participation. However, there is an important distinction: this is still a proposal, not an approved or actively trading ETF. The biggest detail here is the possibility of expanding PEPE's accessibility beyond crypto-native exchanges. If approved and launched, the product could introduce additional demand channels, although actual inflows would determine its market impact. Here are the numbers behind the market: • Chart price: $0.000003945 • 24-hour change: -7.87% • 24-hour high: $0.000004340 • 24-hour low: $0.000003692 • Market capitalization: Approximately $1.60 billion • Spot volume: Approximately $143.73 million • Futures volume: Approximately $469.80 million • Open interest: Approximately $229.22 million • Circulating supply: Approximately 413.77 trillion PEPE. Now look at what this development brings. PEPE operates as an ERC-20 token on Ethereum, benefiting from Ethereum's established infrastructure and exchange compatibility. However, it is important to recognize that PEPE does not currently offer substantial native utility or a traditional application-driven ecosystem. Its value remains heavily influenced by community participation, market sentiment, liquidity and speculative demand. Looking ahead, the proposed ETF's SEC registration process is an important potential catalyst. There is no confirmed approval or launch date. From a trading perspective, the 1-hour chart tells a different story. PEPE has established lower highs and lower lows since reaching approximately $0.000005617. The $0.000003692 area is immediate support, while $0.000004173 is an important nearby recovery level. A sustained move above that resistance could improve short-term momentum. Of course, institutional accessibility does not guarantee price appreciation. Without meaningful adoption, sustained demand and stronger buying pressure, even positive developments may have limited impact. My view: PEPE has an opportunity to strengthen its position through broader market accessibility, but the chart still needs to prove that buyers are returning. Will the proposed ETF become a meaningful catalyst for PEPE, or does this market need stronger demand before another recovery can begin? $PEPEUSDT #WSOT2026 #ByXIMPACT
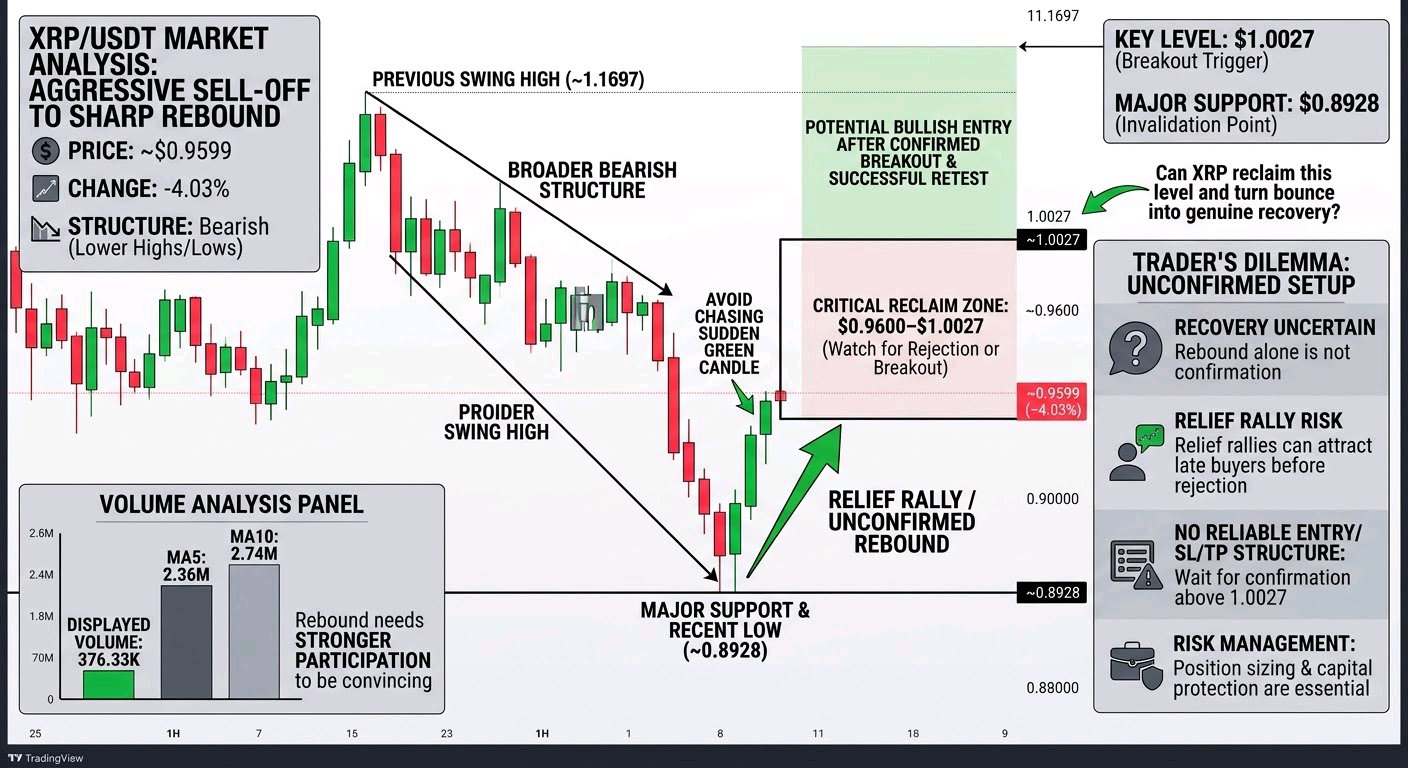
I’m watching XRP closely because the latest 1-hour move shows an interesting reaction after an aggressive sell-off. Price has bounced sharply from the $0.8928 area, but I’m not convinced this recovery is strong enough to signal a full trend reversal yet. XRP/USDT is currently trading around $0.9599, down approximately 4.03%. The broader market structure remains bearish, with consecutive lower highs and lower lows since the previous swing high near $1.1697. Sellers have maintained control throughout the decline, and the recent drop toward $0.8928 highlights how quickly downside pressure can accelerate. The green rebound is encouraging, but buyers still need to prove they can sustain it. One detail worth monitoring is volume. The displayed volume is 376.33K, while MA5 stands at 2.36M and MA10 at 2.74M. This suggests the rebound needs stronger participation before I would consider it a convincing recovery. The $0.9600–$1.0027 region is an important area to watch, with the recent low at $0.8928 acting as major nearby support. I would avoid chasing the sudden green candle. After such a sharp decline, relief rallies can attract late buyers before another rejection occurs. For now, I don't see enough information to establish a reliable entry, stop-loss, or take-profit structure with an accurate risk-to-reward ratio. My preference is to wait for a confirmed breakout and successful retest above $1.0027 before considering a bullish opportunity. Failure to hold the rebound, followed by renewed selling toward $0.8928, would keep the bearish scenario relevant. Risk management remains essential. A recovery candle alone is not confirmation, and protecting capital matters more than catching every move. The big question: Can XRP reclaim $1.0027 and turn this bounce into a genuine recovery, or are sellers preparing another move lower? $XRPUSDT $SOLUSDT #ByXIMPACT
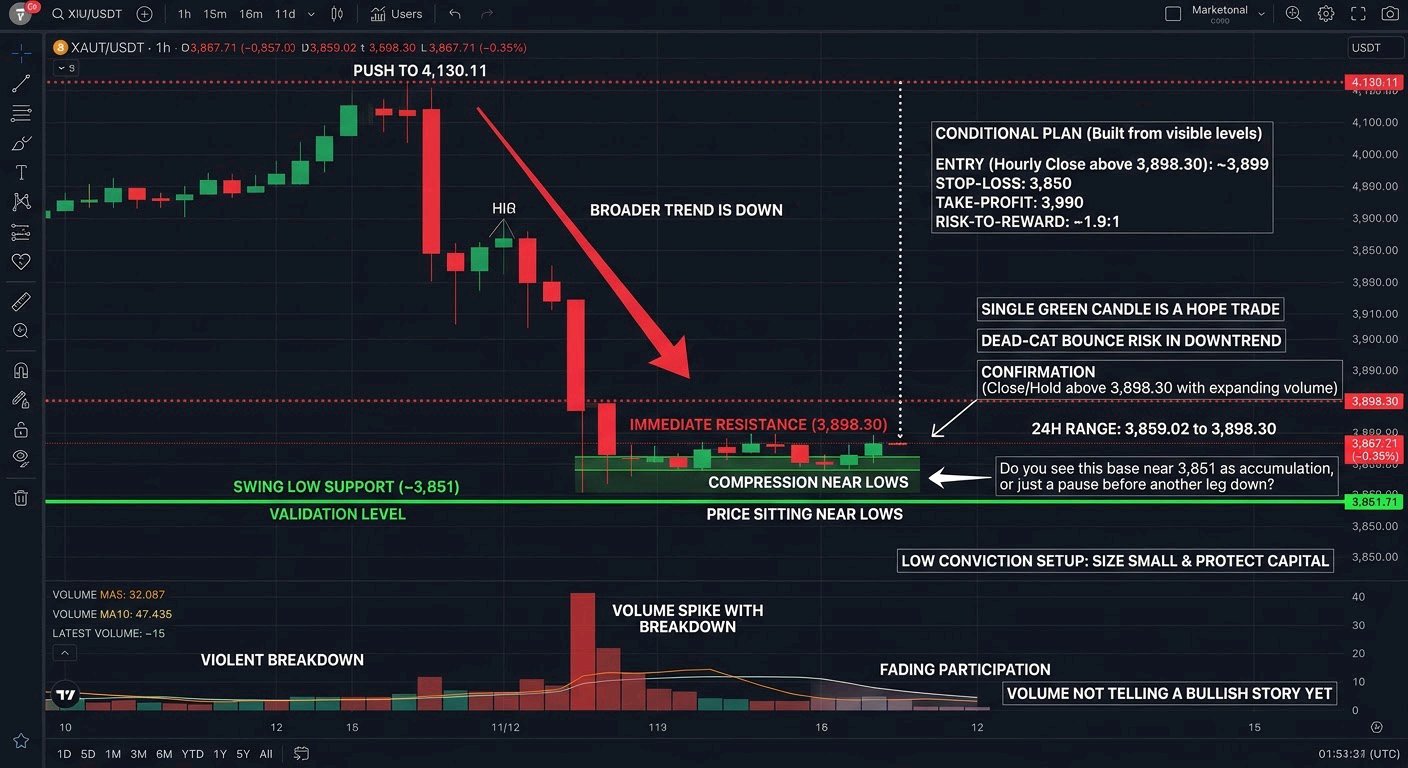
What caught my eye on the XAUT/USDT 1h chart is how violently the structure broke down, and how quietly price is now sitting near the lows. After the push to 4,130.11, sellers took over and price dropped roughly 250 points in a few sessions. The broader trend is still down. The bounce around 11/12 produced a lower high, then faded again. Price now trades at 3,867.71, down 0.35% on the day, with a 24h range of 3,859.02 to 3,898.30. The swing low sits near 3,851, just under today's range. The small candles hugging that area look like compression, not a confirmed reversal. Volume is not telling a bullish story yet. The spike came with the breakdown, and recent bars are thin, with the volume MA5 at 32.087 sitting below the MA10 at 47.435. That points to fading participation, not fresh buying. I'm not treating that as a signal in either direction, just a reason for patience. A single green hourly candle off the lows is exactly the kind of thing that pulls people in early. Without a close above resistance, that's a hope trade, and in a downtrend it's easy to get caught buying a dead-cat bounce. My conditional plan, built only from visible levels: Entry: only after an hourly close above 3,898.30, say around 3,899. Stop-loss: below the swing low, near 3,850. Take-profit: 3,990 as the first target. That's about 49 points of risk for 91 of reward, roughly 1.9:1. Confirmation would be a hourly close and hold above 3,898.30 with volume expanding. The setup is invalid on a break below 3,851, which would put the lows at risk again. This is a low-conviction setup in a downtrend, so size small and protect capital first. Do you see this base near 3,851 as accumulation, or just a pause before another leg down? $XAUTUSDT $BTCUSDT #WSOT2026 #ByXIMPACT
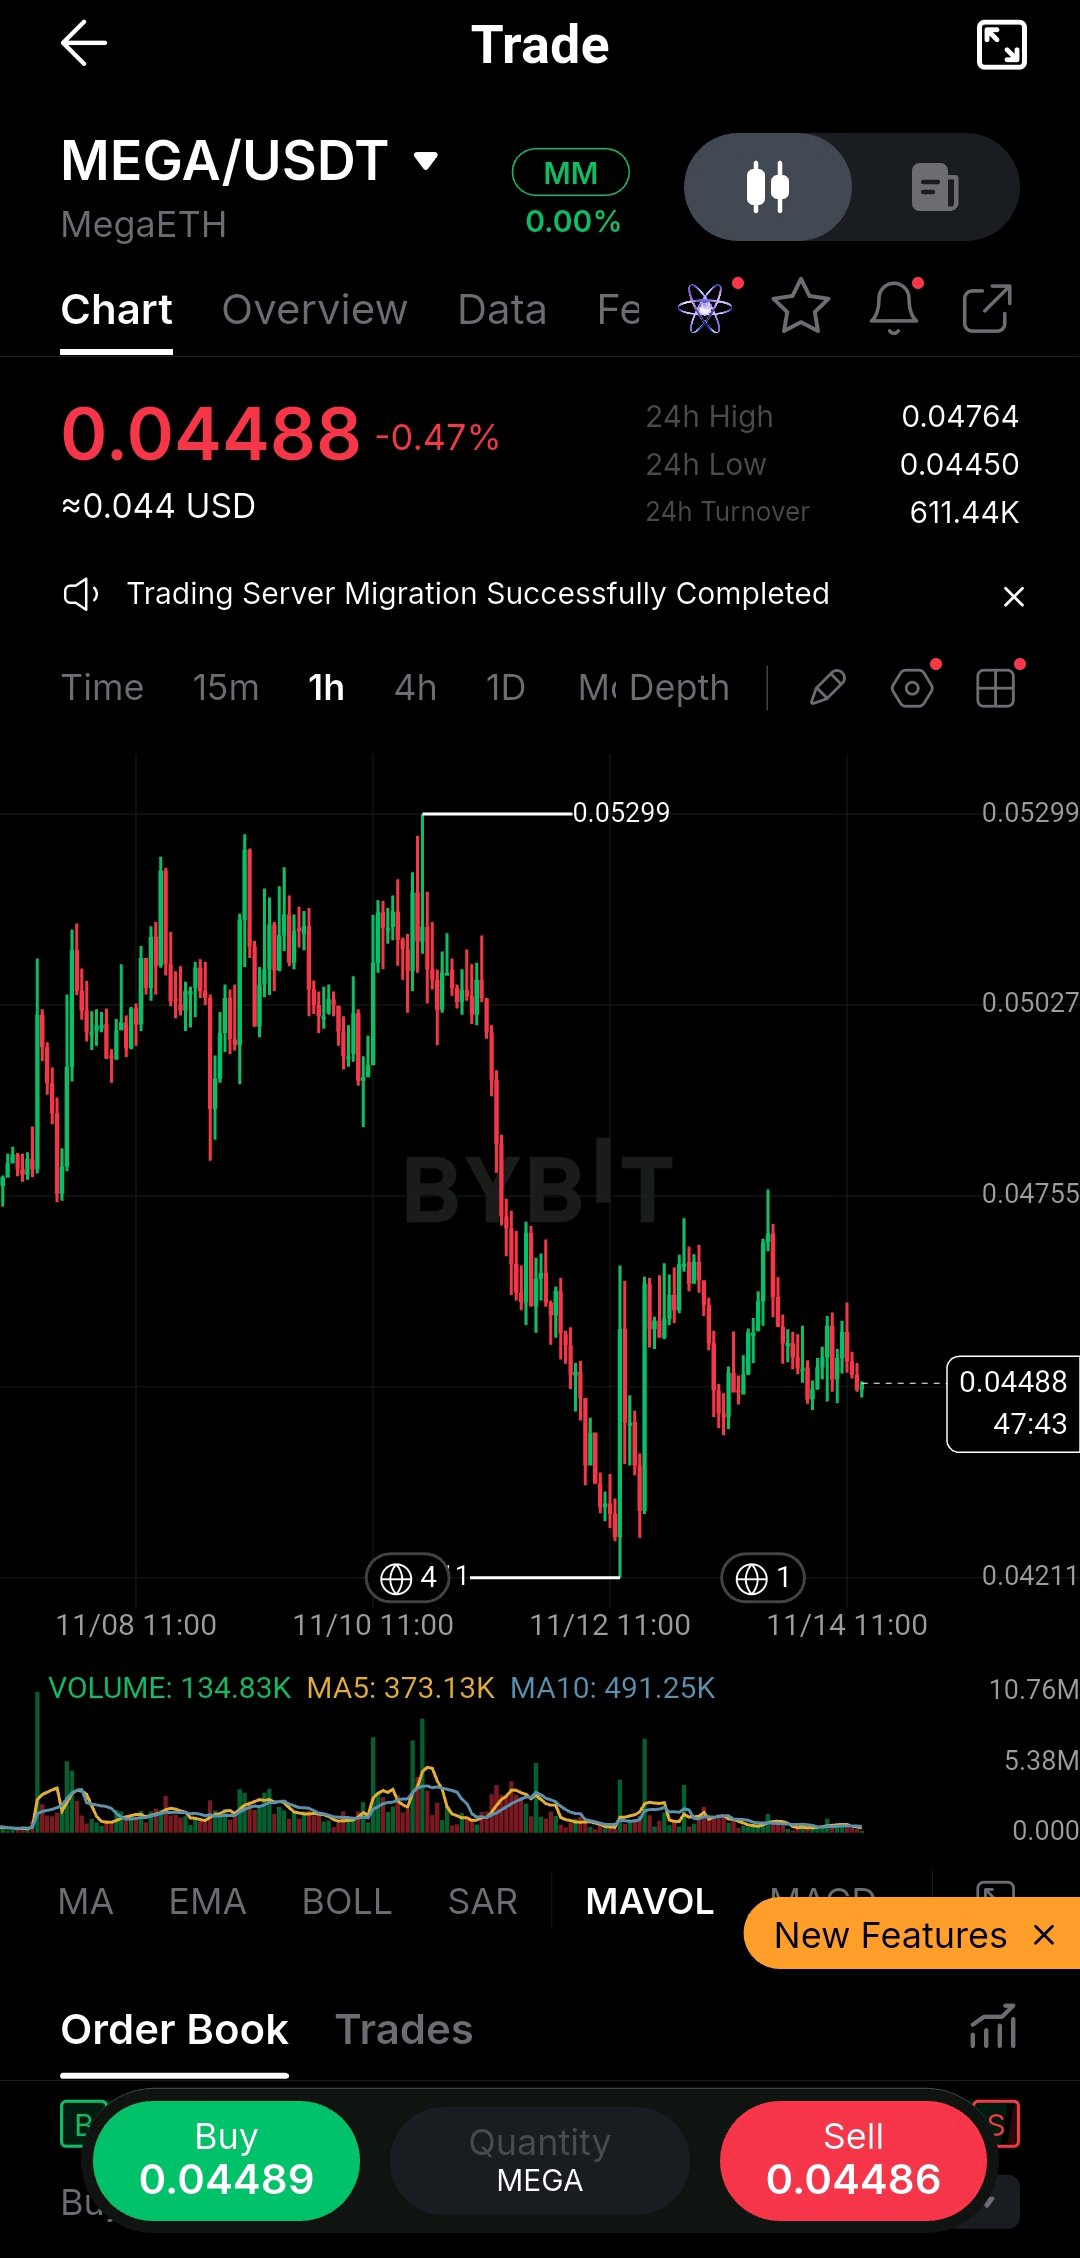
I keep coming back to this MEGA/USDT 1h chart because of how quiet it has gone after such a violent move. Price is sitting at 0.04488, down about 0.47% on the day, and the candles have tightened noticeably. The broader picture is a clear downtrend from the 0.05299 high. Sellers pushed price hard to the 0.04211 low around 11/12, and the bounce since then has only reached roughly the 0.0476 area, which lines up with the 24h high of 0.04764. That is a lower high, so the recovery has not changed the structure yet. The 24h low of 0.04450 is the support price is hovering just above. On the indicators, current volume of 134.83K is well below its MA5 (373.13K) and MA10 (491.25K). The last candle is still forming, but the bounce has clearly come on fading participation. That reads as compression. It can resolve in either direction, and low volume alone confirms nothing. I would not chase any sudden green candle here. A single hourly spike into thin volume and overhead supply can reverse quickly, and entering without confirmation turns a setup into a guess. If I trade it, the idea is a conditional long. Entry zone is 0.04450 to 0.04490, only after a hold of support. My stop is 0.04400, below the 24h low. Targets are 0.04755 and 0.05027, both visible chart levels. Measured from the top of the zone at 0.04490, the risk is 0.00090, giving about 2.9:1 to the first target and about 6:1 to the second. Confirmation would be a strong hourly close back above 0.04490 with volume rising toward its averages. A clean hourly close below 0.04450, and especially below 0.04400, invalidates the idea. This is uncertain, the trend is still down, and protecting capital comes before any target. Size the position so the stop is a small, acceptable loss. Do you see this as a base forming above 0.04450, or just a pause before another test of the 0.04211 low? $MEGAUSDT $BTCUSDT #ByXIMPACT
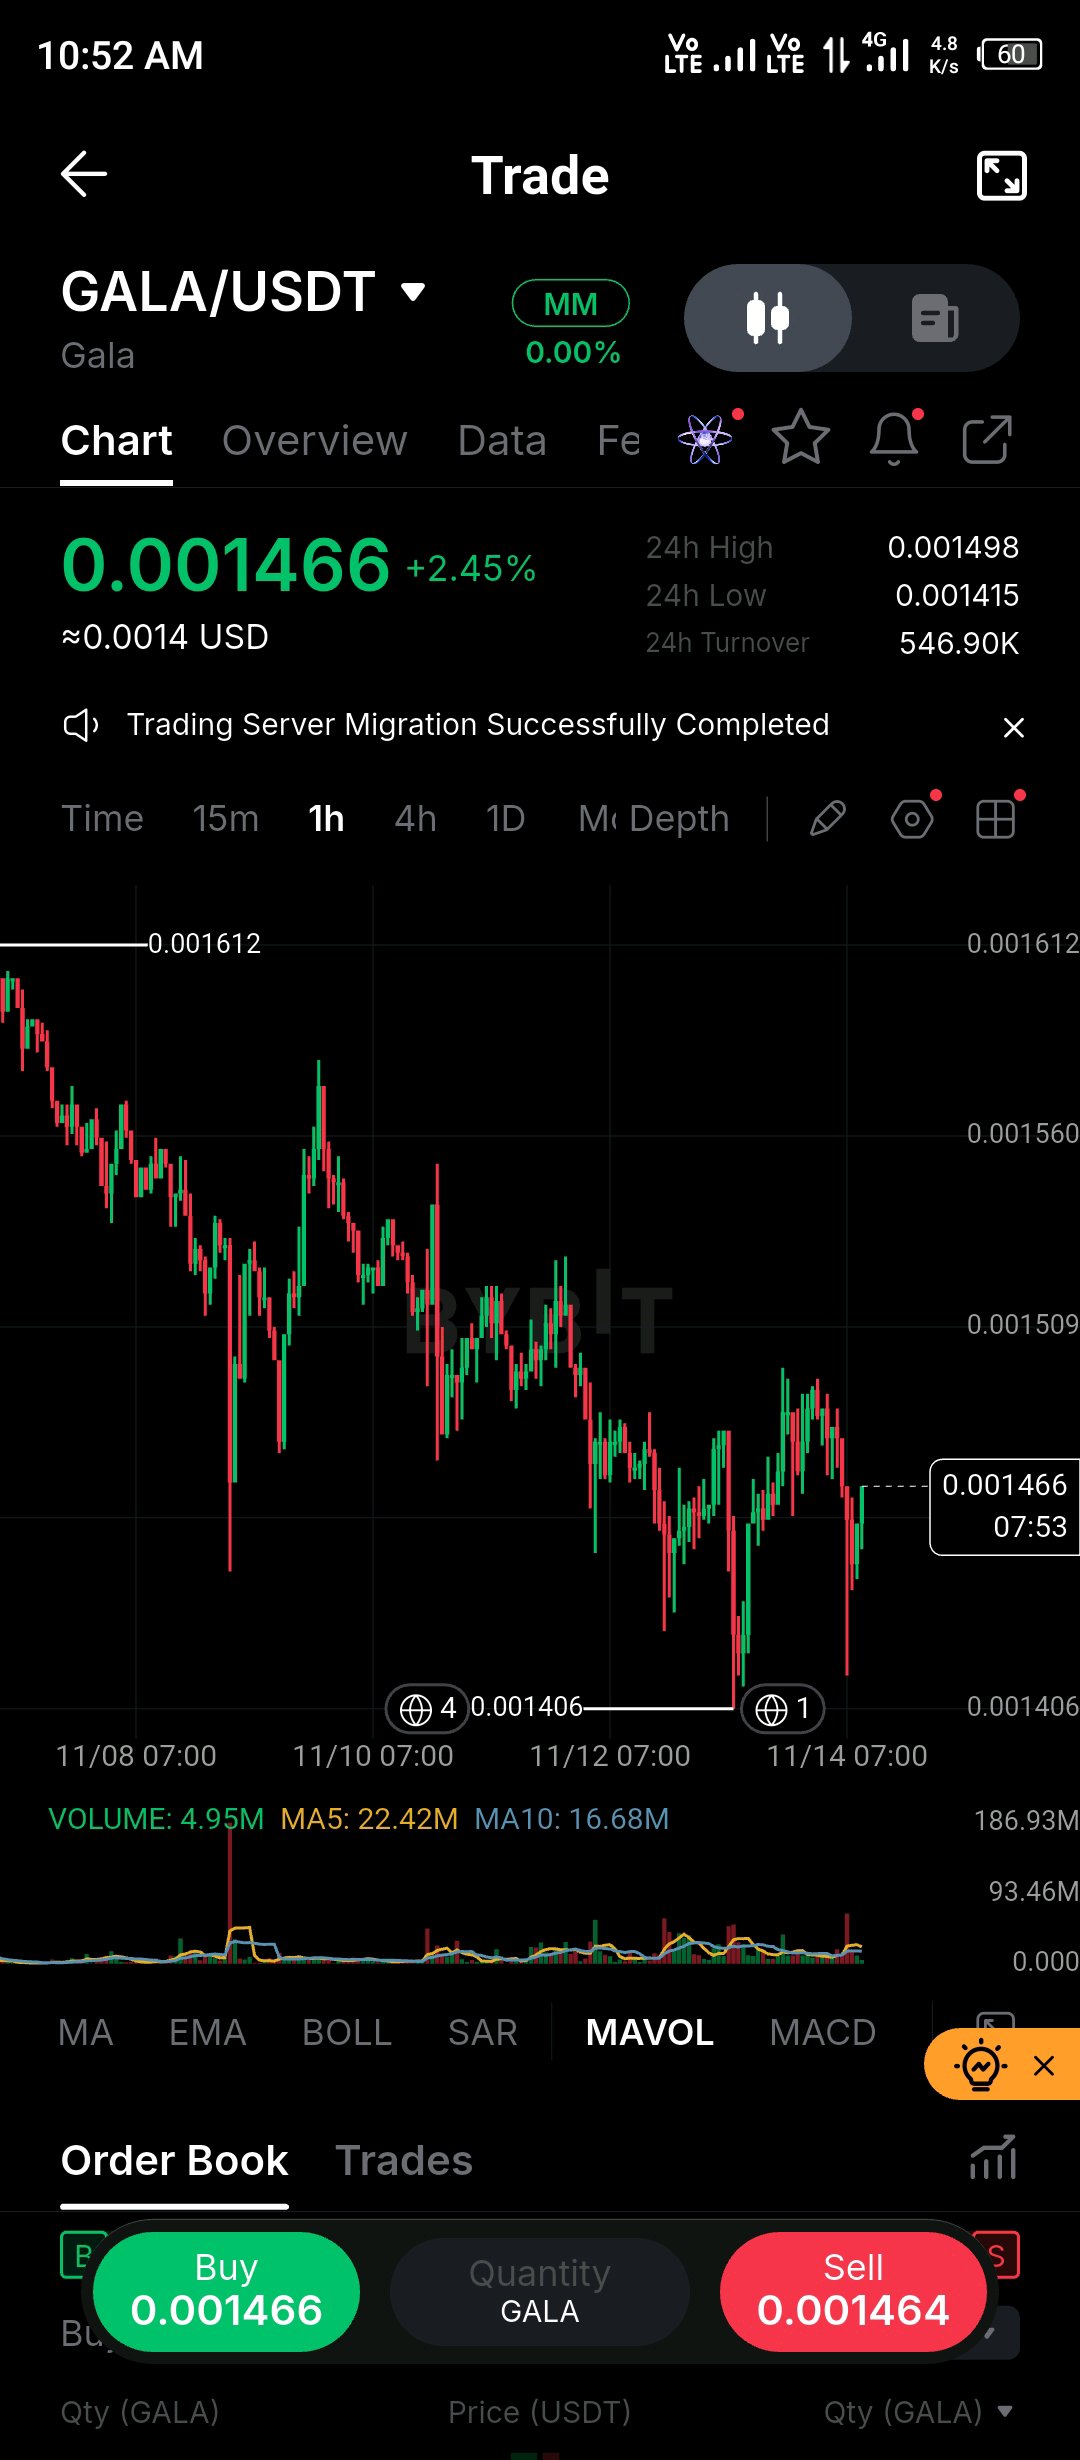
I’m watching GALA/USDT closely because the 1-hour chart is showing an interesting battle between sellers and buyers. The price has started recovering from recent lows, but I’m not convinced that the broader bearish structure has changed just yet. GALA is currently trading around $0.001466, up approximately 2.45%. The 24-hour high stands at $0.001498, while the low is $0.001415. Looking at the broader chart, price has been making lower highs since the $0.001612 region. The recent dip toward $0.001406 attracted buyers, suggesting that demand is still present around these lower levels. From a technical perspective, the market is attempting to stabilize after sustained selling pressure. However, the current volume reading of 4.95M remains below both the MA5 volume of 22.42M and MA10 volume of 16.68M. That makes me cautious about treating this recovery as a confirmed bullish reversal. My immediate focus is the $0.001450–$0.001466 area for potential bullish reactions, while $0.001415 and $0.001406 remain important downside support zones. On the upside, $0.001498 is the first resistance to watch, followed by the $0.001509 region. A stronger recovery could eventually bring $0.001560 into focus. I would avoid chasing green candles here. A convincing 1-hour close above $0.001498, supported by stronger volume and a successful retest, would improve the bullish case. Failure to hold $0.001415 could expose the recent $0.001406 low again. There is no confirmed entry, stop-loss, or reliable risk-to-reward setup from the available chart alone, so I would rather wait than manufacture trading levels. What do you think: is GALA preparing for a genuine recovery, or is this simply another temporary bounce within its downtrend? $GALAUSDT #ByXIMPACT
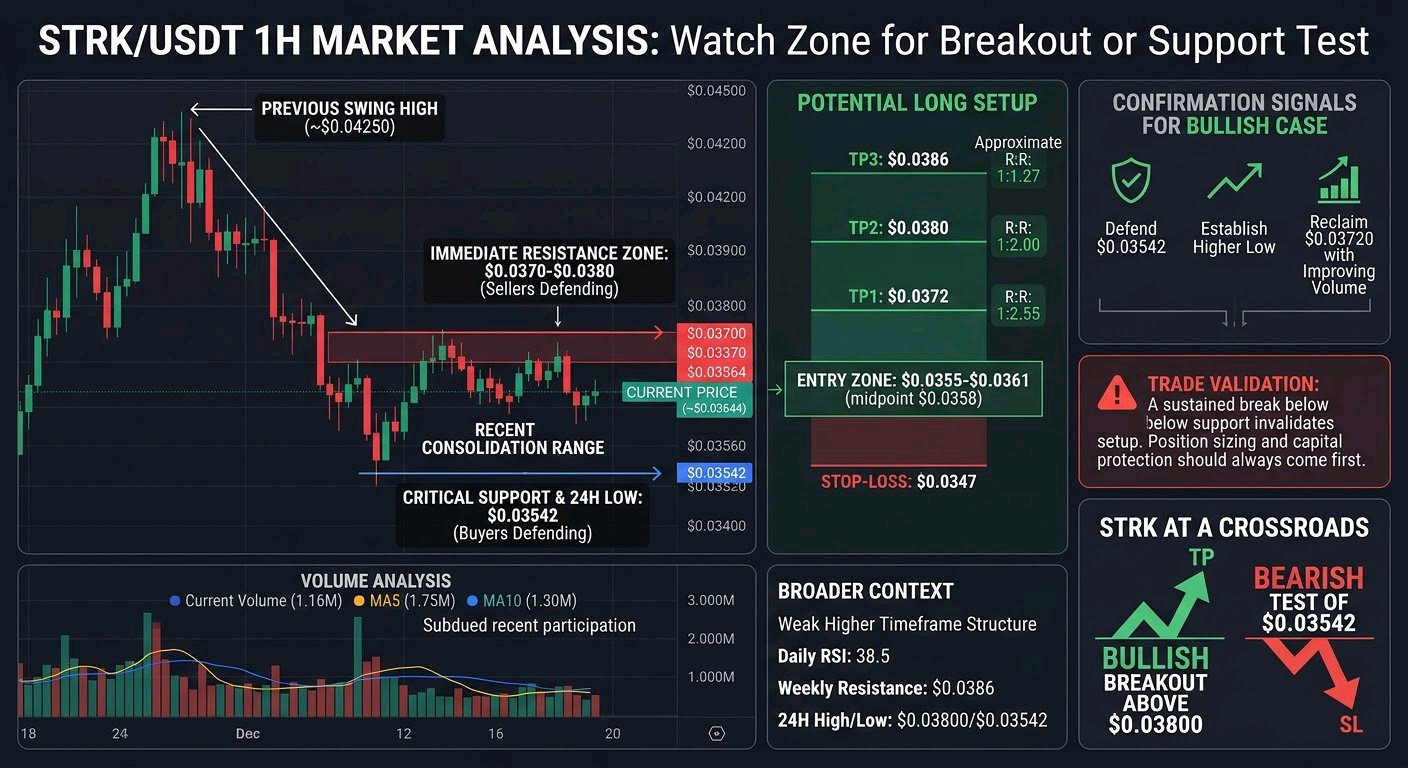
I’m watching STRK closely because, despite the latest bounce, the chart still hasn’t given a convincing signal that buyers have regained control. What caught my attention is how price continues to struggle around the $0.0370–$0.0380 region after repeatedly defending the lower support area. On the 1-hour timeframe, STRK/USDT is trading around $0.03644, while the visible 24-hour high and low stand at $0.03800 and $0.03542. The broader structure remains under pressure, with price declining from the previous swing high near $0.04250. Recent candles suggest consolidation, but a genuine trend reversal is not confirmed yet. Volume currently shows 1.16M, compared with the MA5 volume of 1.75M and MA10 volume of 1.30M. This indicates that recent participation is relatively subdued. External market data also shows a weak higher-timeframe structure, with daily RSI around 38.5 and resistance near $0.0386. Support around $0.0354 remains important. I wouldn't chase a sudden green candle here. STRK needs stronger buying volume and a confirmed breakout before a more aggressive bullish position makes sense. Potential Long Setup: Entry Zone: $0.0355–$0.0361 Stop-Loss: $0.0347 TP1: $0.0372 TP2: $0.0380 TP3: $0.0386 Using the $0.0358 entry midpoint, the approximate risk-to-reward ratios are 1:1.27, 1:2.00 and 1:2.55 respectively. For confirmation, I want to see STRK defend $0.03542, establish a higher low and reclaim $0.03720 with improving volume. A sustained break below support would invalidate this bullish setup, while acceptance above $0.03800 could strengthen recovery prospects. This remains a conditional trade idea, not a guaranteed outcome. Position sizing and capital protection should always come first. My question: Will STRK finally break above $0.03800, or are sellers preparing another test of $0.03542? $STRKUSDT $SOLUSDT #ByXIMPACT
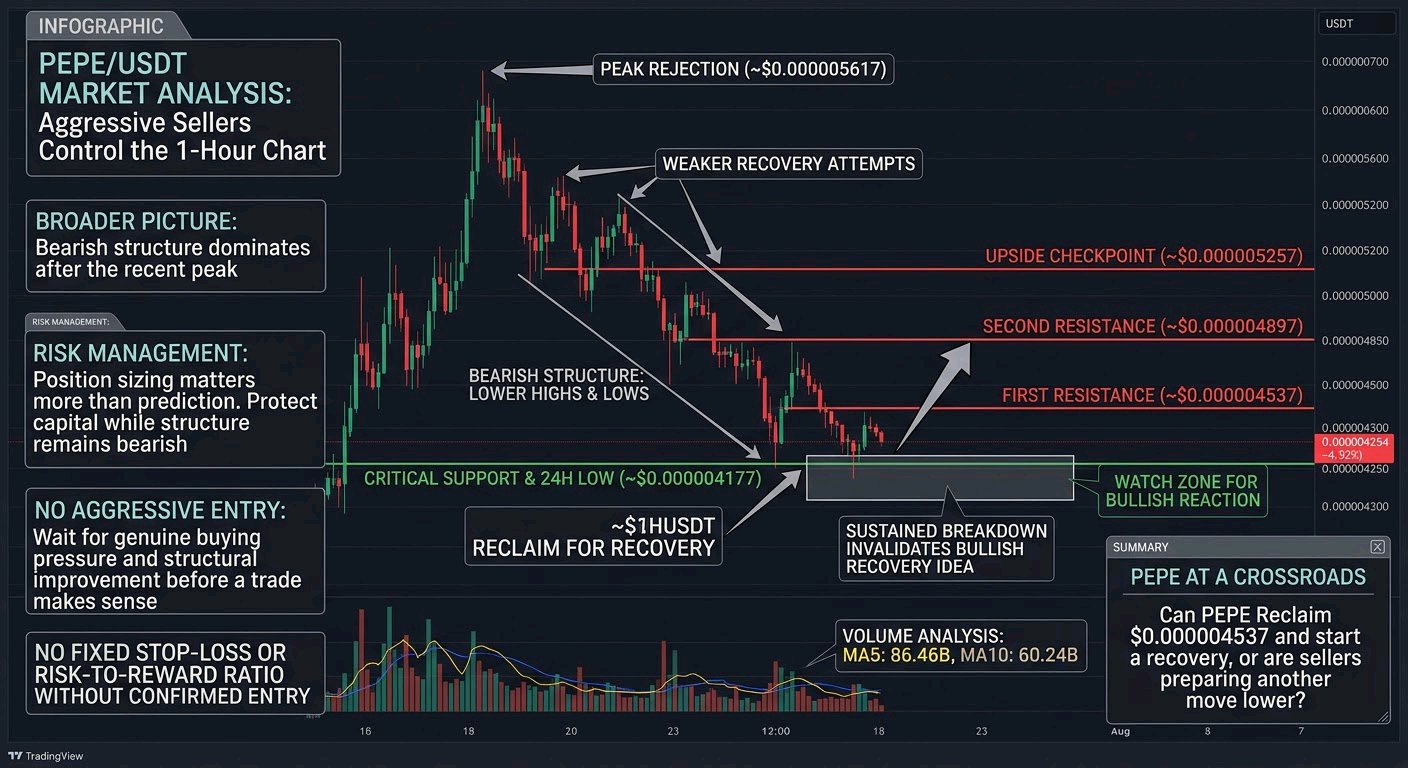
What concerns me most about PEPE right now is how aggressively sellers have controlled the 1-hour chart after the rejection near $0.000005617. The recovery attempts have been getting weaker, and every bounce seems to attract fresh selling pressure. I’m watching the current support area closely because the next reaction could determine whether buyers are finally ready to defend this decline. PEPE/USDT is trading around $0.000004254, down approximately 4.92% in the displayed session. The chart shows a clear bearish structure, with lower highs and lower lows developing after the recent peak. The immediate 24-hour low sits at $0.000004177, while the recent high is $0.000004647. Buyers have attempted several recoveries, but none has established a convincing reversal yet. Technically, $0.000004537 is the first important resistance, followed by $0.000004897. A stronger recovery could bring $0.000005257 into focus. On the downside, $0.000004177 is the critical support to monitor. The volume panel shows MA5 at 86.46B and MA10 at 60.24B, although these are volume averages, not price moving averages. I wouldn't chase a sudden green candle here. PEPE needs genuine buying pressure and a confirmed structural improvement before an aggressive entry makes sense. My preferred approach is to watch for a bullish reaction around $0.000004177–$0.000004254, followed by a reclaim of $0.000004537. Potential upside checkpoints are $0.000004897 and $0.000005257. A sustained breakdown below $0.000004177 would invalidate the bullish recovery idea. No fixed stop-loss or risk-to-reward ratio is justified without a confirmed entry. For now, patience matters more than prediction. Protecting capital is essential while the broader structure remains bearish. Do you think PEPE can reclaim $0.000004537 and start a recovery, or are sellers preparing another move lower? $PEPEUSDT $ARBUSDT #ByXIMPACT
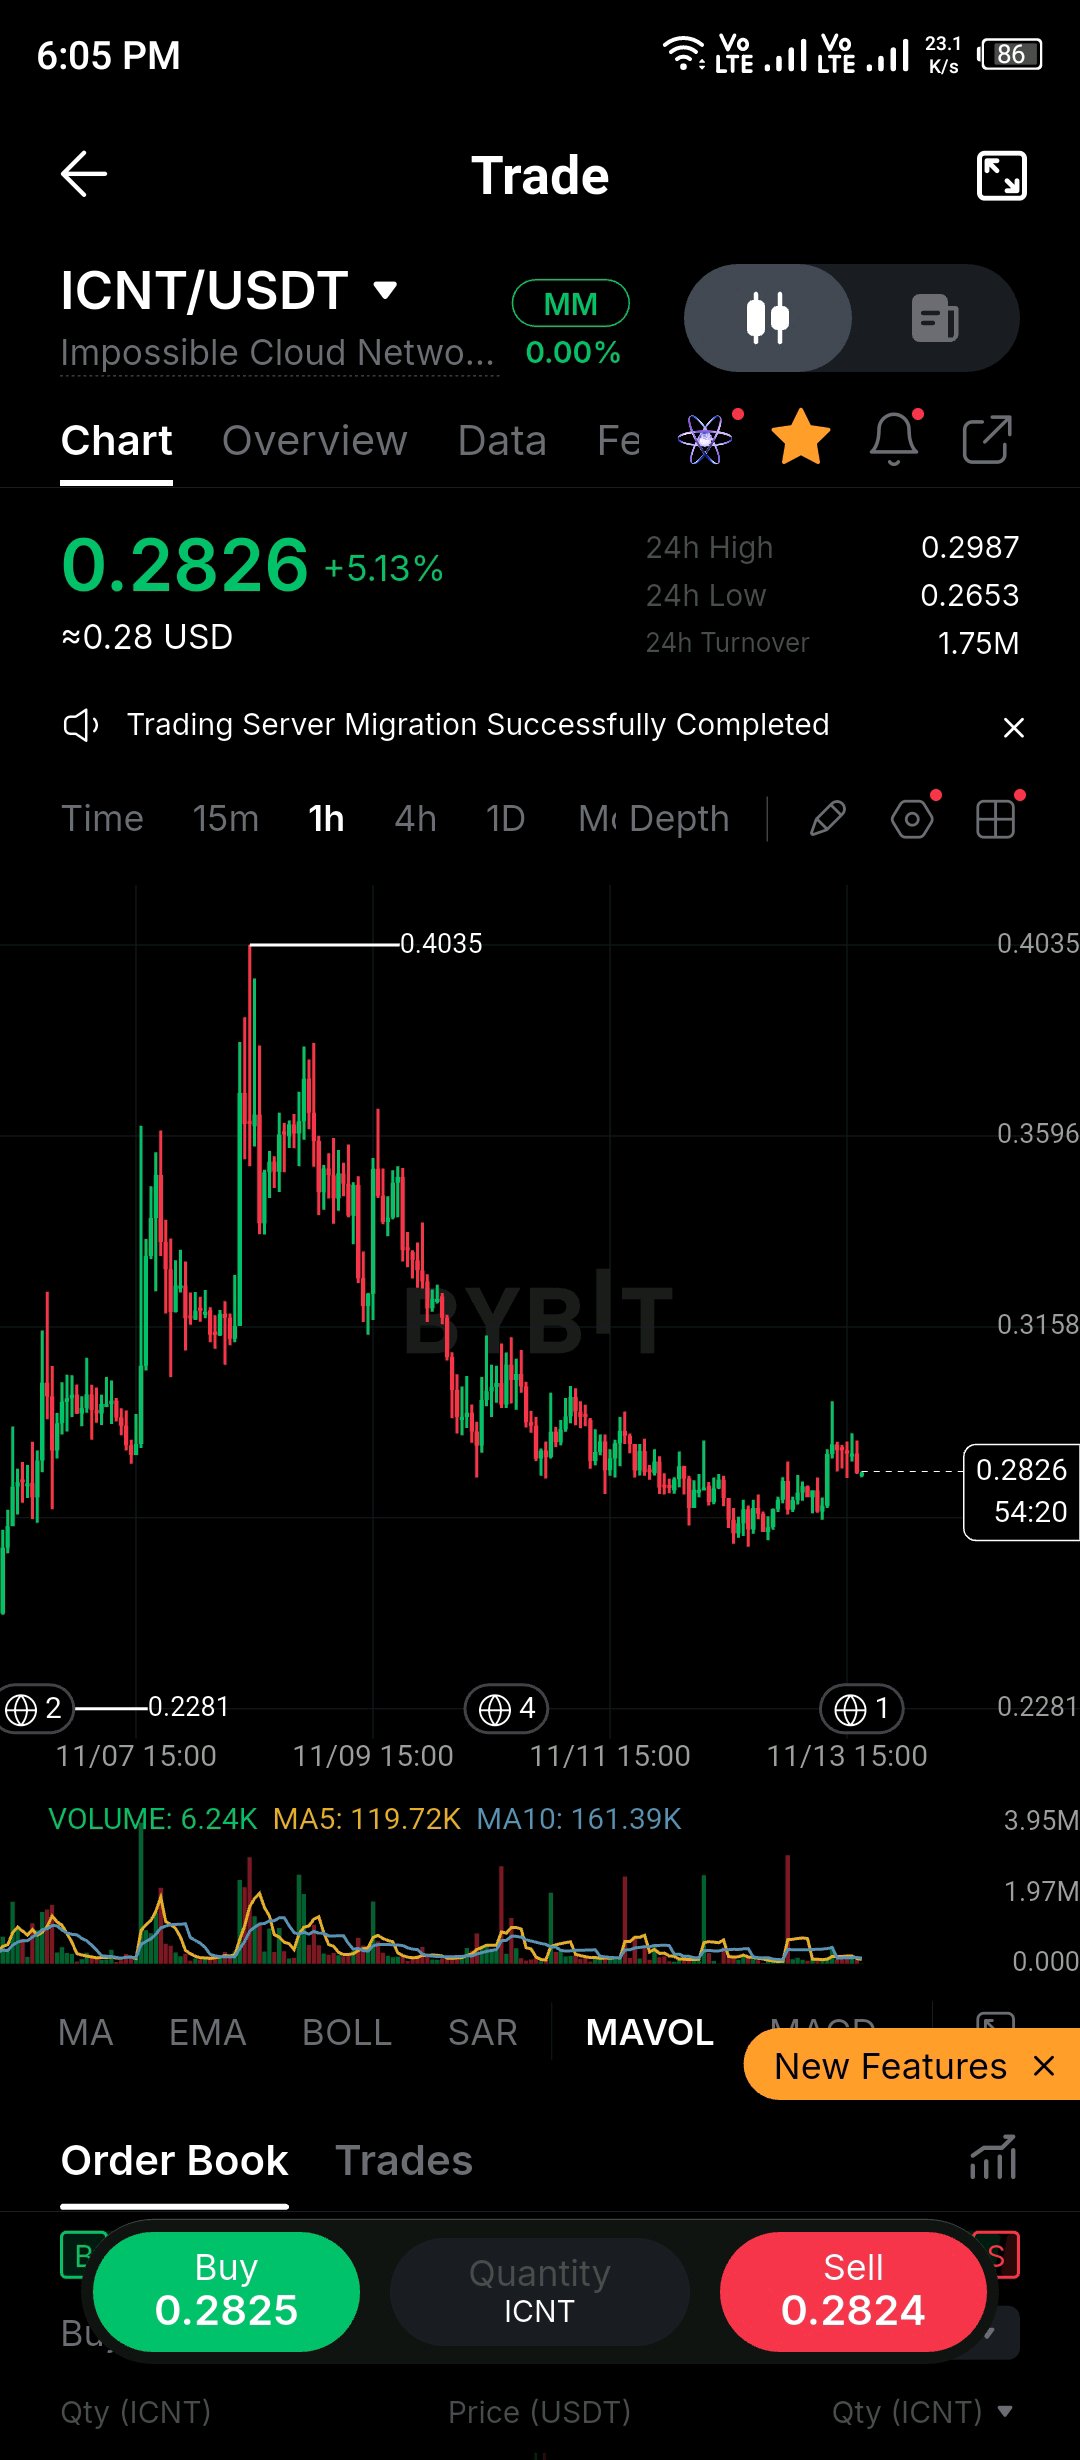
ICNT/USDT on the 1h caught my eye because this bounce looks quiet compared with the drop that came before it. Price sits at 0.2826, up 5.13% on the day, after a long slide from the 0.4035 high. The low on this view is 0.2281. Since the peak, the structure has been lower highs and choppy, overlapping candles. Over the last 24 hours price has ranged between 0.2653 and 0.2987, so the market is compressing in a fairly tight band. That looks like stabilization, not yet a confirmed recovery. Volume tells a cautious story. The current reading is 6.24K against a MA5 of 119.72K and a MA10 of 161.39K. The latest bar is still forming, but participation has clearly faded since the sell-off and the earlier rally. Moves without volume support are easy to fade. Visible resistance sits at 0.2987, then 0.3158 and 0.3596. This is where I'd avoid FOMO. A green candle inside a range is not a breakout, and buying near the top of the band forces a wide stop or a sloppy one. The screenshot doesn't show an entry or targets, so these levels are my own, taken from the chart. Entry zone: around 0.2990, after a 1h close above 0.2987 and a retest. Stop-loss: 0.2650, just under the 24h low. Target: 0.3596. Risk is about 0.0340 and reward about 0.0606, roughly 1.8R. The 0.3158 level is closer, but it offers only about 0.5R, so I'd treat it as a place to trim, not a full target. Confirmation is an hourly close above 0.2987 with volume expanding toward its averages. Invalidation is a close below 0.2653, which would put a retest of 0.2281 back on the table. None of this is certain. Protecting capital matters more than catching every move, so keep size small. Do you read this as a base forming above 0.2653, or just a pause before another leg down? $ICNTUSDT $SOLUSDT #ByXIMPACT
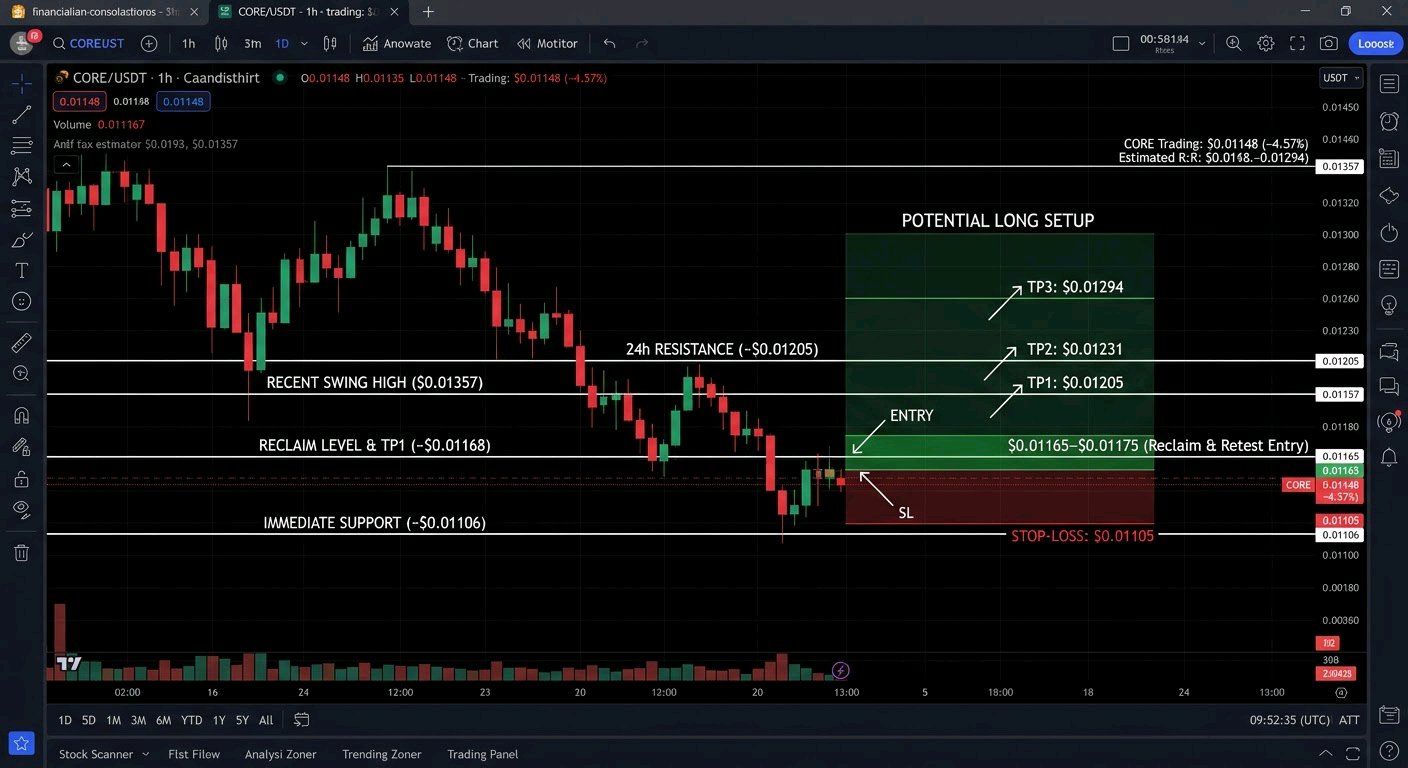
I’m watching CORE/USDT closely because the 1-hour chart is showing something important: despite a small bounce from the recent lows, buyers haven't yet demonstrated enough strength to change the broader structure. CORE is trading around $0.01148, down approximately 4.57%. The chart shows a clear sequence of lower highs and lower lows, with the recent swing high near $0.01357 and immediate support around $0.01106. The 24-hour resistance sits near $0.01205. For now, sellers still have the advantage, although the latest recovery suggests buyers are attempting to defend the bottom. One detail worth considering is the tokenomics. CORE has a maximum supply of 2.1 billion tokens, with approximately 1.5 billion currently circulating according to CoinMarketCap. Its official emission model extends over 81 years, with block rewards gradually decreasing by 3.61% annually. The protocol also incorporates a DAO-governed transaction-fee burning mechanism. CORE serves as the network's gas, governance and staking utility token. These fundamentals provide a longer-term supply narrative, but they cannot independently reverse bearish price action. On the technical side, $0.01106 is the level I wouldn't ignore. A breakdown could expose CORE to further downside, while reclaiming $0.01168 would be an early indication that momentum is improving. The displayed volume is around 107K, and I would prefer stronger participation behind any recovery. I'm not interested in chasing a random green candle here. My preferred approach is waiting for confirmation. Potential Long Setup: - Entry: $0.01165–$0.01175 after reclaim and retest - Stop-loss: $0.01105 - TP1: $0.01205 - TP2: $0.01231 - TP3: $0.01294 - Estimated R:R: Up to approximately 1:1.9, using a $0.01170 entry. A sustained move above $0.01168 with increasing volume would strengthen this setup. Losing $0.01106 would invalidate the bullish idea. Position sizing matters, especially in a weak market. Protecting capital is more important than catching every move. Do you think CORE can reclaim $0.01205, or are sellers preparing another move toward fresh lows? $COREUSDT #WSOT2026 #ByXIMPACT
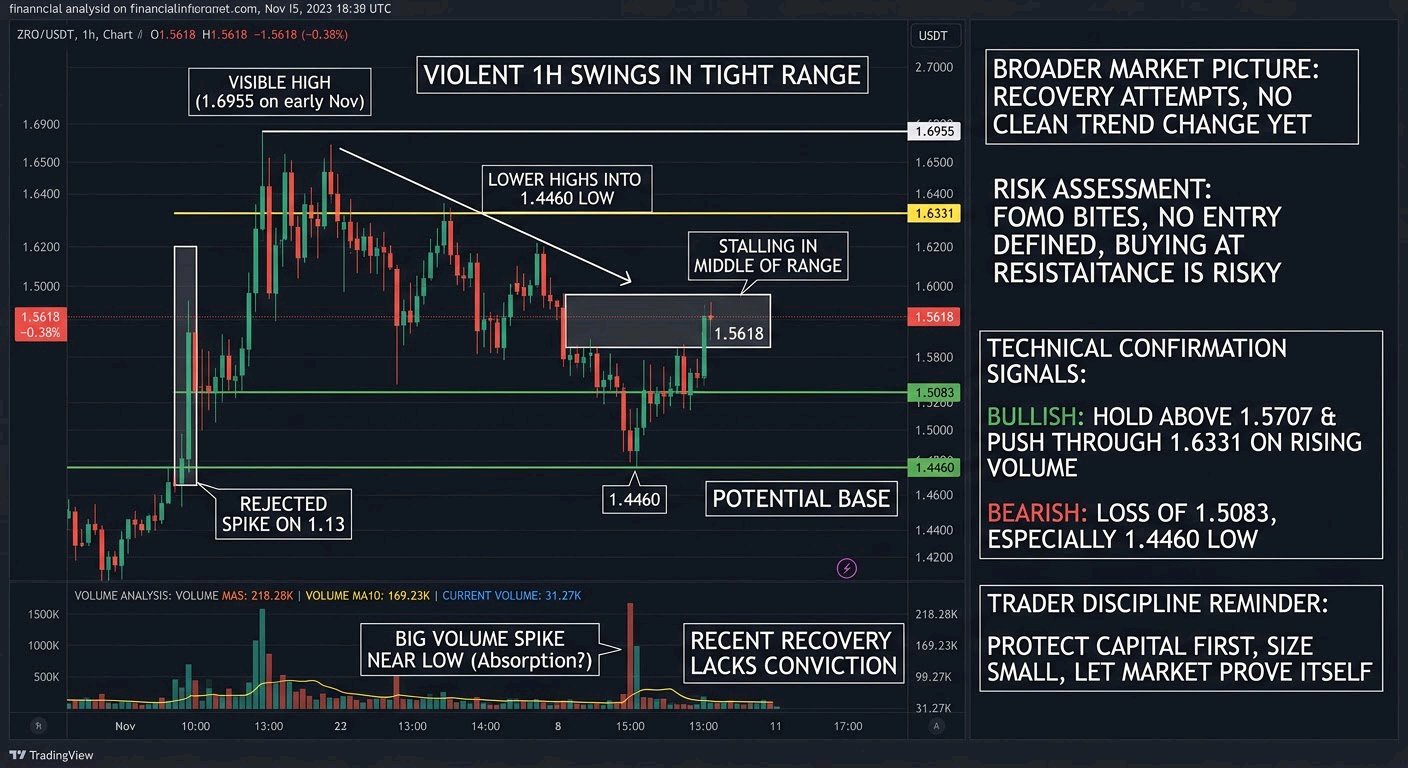
The first thing that caught my eye on ZRO/USDT is how violently the 1h chart has swung inside a fairly tight range. Price is sitting at 1.5618, down 0.38% on the day, after rejecting a spike on the 13th. Zooming out, the structure still looks heavy. The visible high is 1.6955 from early November, and the sequence since then has been lower highs into a low at 1.4460. The bounce off that low has been decent, but price is now stalling in the middle of the range. The 24h range of 1.4852 to 1.6193 shows the same thing. That is recovery attempts without a clean trend change yet. On the technicals, I'm not leaning on price MAs here since none are shown, but the volume tells a story. The big volume spike came around the low, which looks like capitulation or heavy absorption. Since then, current volume at 31.27K sits well below the volume MA5 (218.28K) and MA10 (169.23K), so the recent move up lacks conviction. Resistance sits near 1.6331 and then 1.6955. Support is 1.5083 first, then the 1.4460 low. This doesn't guarantee anything, but it does suggest buyers aren't fully in control. This is exactly where FOMO bites. A single green hourly candle into thin volume can easily turn into another rejection wick, as we saw on the 13th. Chasing without confirmation usually means buying right at resistance. I haven't defined an entry, stop, or targets here, so I won't quote a risk-to-reward ratio. I'd only build one after confirmation. A hold above 1.5707 and a push through 1.6331 on rising volume would strengthen the case for a recovery. A loss of 1.5083, and especially 1.4460, would invalidate it and shift the bias back down. This is an uncertain setup. Protect your capital first, size small, and let the market prove itself. Do you see the 1.4460 low as a real base, or just a pause before another leg down?$ZROUSDT $BTCUSDT #ByXIMPACT
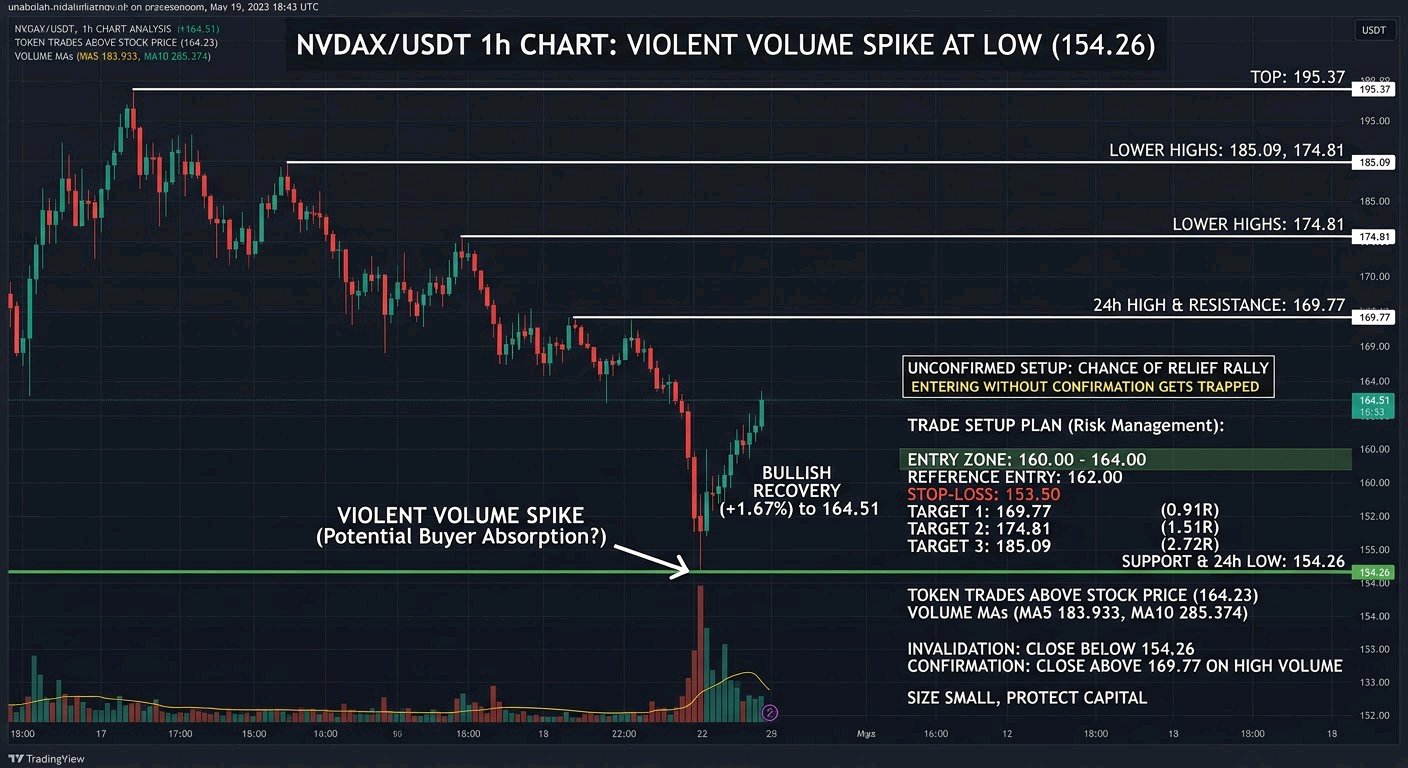
Guys What caught my eye on the NVDAX/USDT 1h chart is how violently the volume spiked right at the 154.26 low. After a long slide, that kind of activity usually tells me something changed, even if it doesn't confirm a reversal. The broader picture is still bearish. Price topped near 195.37 earlier in the week, then stair-stepped lower through a series of lower highs. The bounce toward 185 got sold, and the next leg down dumped price to 154.26. Now it sits at 164.51 (+1.67%), a small recovery, with the 24h high at 169.77. The token trades slightly above the underlying stock price of 164.23, so there's no big premium to worry about. Technically, the picture is messy. The volume MAs on my chart (MA5 183.933, MA10 285.374) only describe volume, not price, so I'm not using them as trend signals. What matters is structure: 154.26 is support, and 169.77 is the first resistance. Above that, 174.81 and 185.09 are the next areas where sellers previously showed up. Price is compressing in a tight range just under 165, which tells me the market is undecided. I'm not chasing this bounce. One green candle after a sharp selloff can easily be a relief rally that fades into the first resistance. Entering without confirmation is how traders get trapped near local highs. Here's the setup I'm watching, using only levels visible on the chart: Entry zone: 160 to 164, reference entry 162 Stop-loss: 153.50, below the 154.26 low Targets: 169.77, 174.81, 185.09 Risk-to-reward from 162: about 0.91R, 1.51R and 2.72R I'd want price to hold above 160 and then close an hourly candle above 169.77 with healthy volume. A close below 154.26 invalidates the idea completely. This is uncertain, the trend is still down, and protecting capital comes first. Size small. Do you see that volume spike at the low as real buyer absorption, or just a liquidation flush before another leg down? $NVDAXUSDT $BTCUSDT #ByXIMPACT
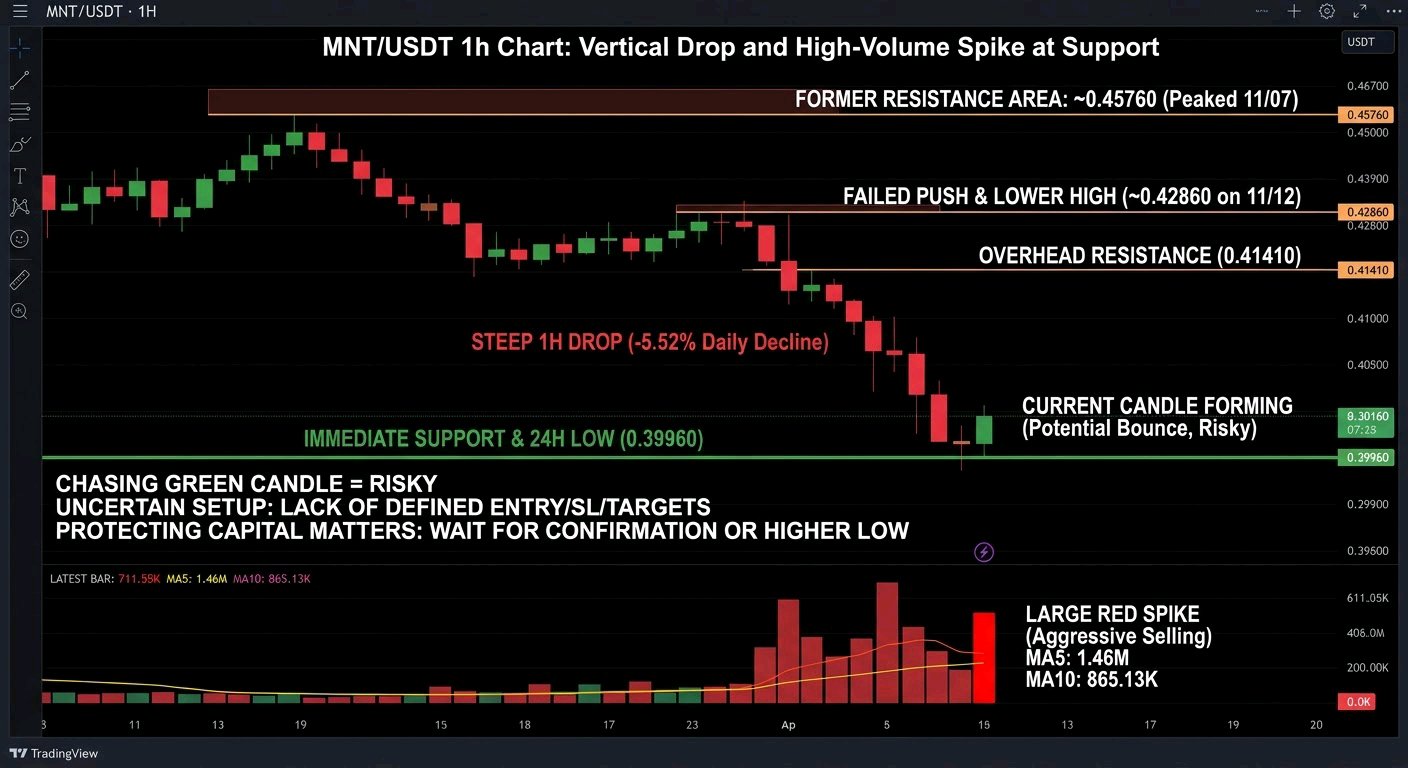
I noticed how MNT/USDT just fell off a cliff on the 1h chart. After a choppy bounce, price dropped almost in a straight line to 0.40200, and the final candle printed on a huge volume spike. The broader picture is a rally that peaked at 0.45760 on 11/07 and has been fading since. A second push into the same area failed, and price then made a lower high around 0.4286 on 11/12 before breaking down. The 24h range is 0.43390 to 0.39960, so price is sitting right on the low after a 5.52% daily decline. That is weakness, not recovery. On volume, the latest bar reads 711.55K against a MA5 of 1.46M and a MA10 of 865.13K. The large red spike at the bottom is clearly visible, which looks like aggressive selling, though the current bar is still forming, so I wouldn't lean on that reading too hard. No price moving averages were displayed, so I'm only working with horizontal levels. The 0.39960 low is the immediate support, with 0.41410 and 0.42860 as the nearest overhead resistance. Chasing a green candle here is risky. After a vertical drop, the first bounce often just relieves oversold conditions before sellers return, and entering without confirmation means buying into a falling market with no defined invalidation. I'm not posting a specific entry, stop-loss, or targets. Nothing on the chart gives me those numbers, and I won't invent them or quote a risk-to-reward ratio without them. What would strengthen a bounce idea is a hold above 0.39960, a higher low, and a reclaim of 0.41410 on rising buy volume. A clean break and close below 0.39960 would invalidate any recovery thesis. This setup is uncertain, and protecting capital matters more than catching the bottom. Keep size small and let price confirm. Do you see 0.39960 as a real floor, or is this just a pause before a deeper leg lower?$MNTUSDT #ByXIMPACT
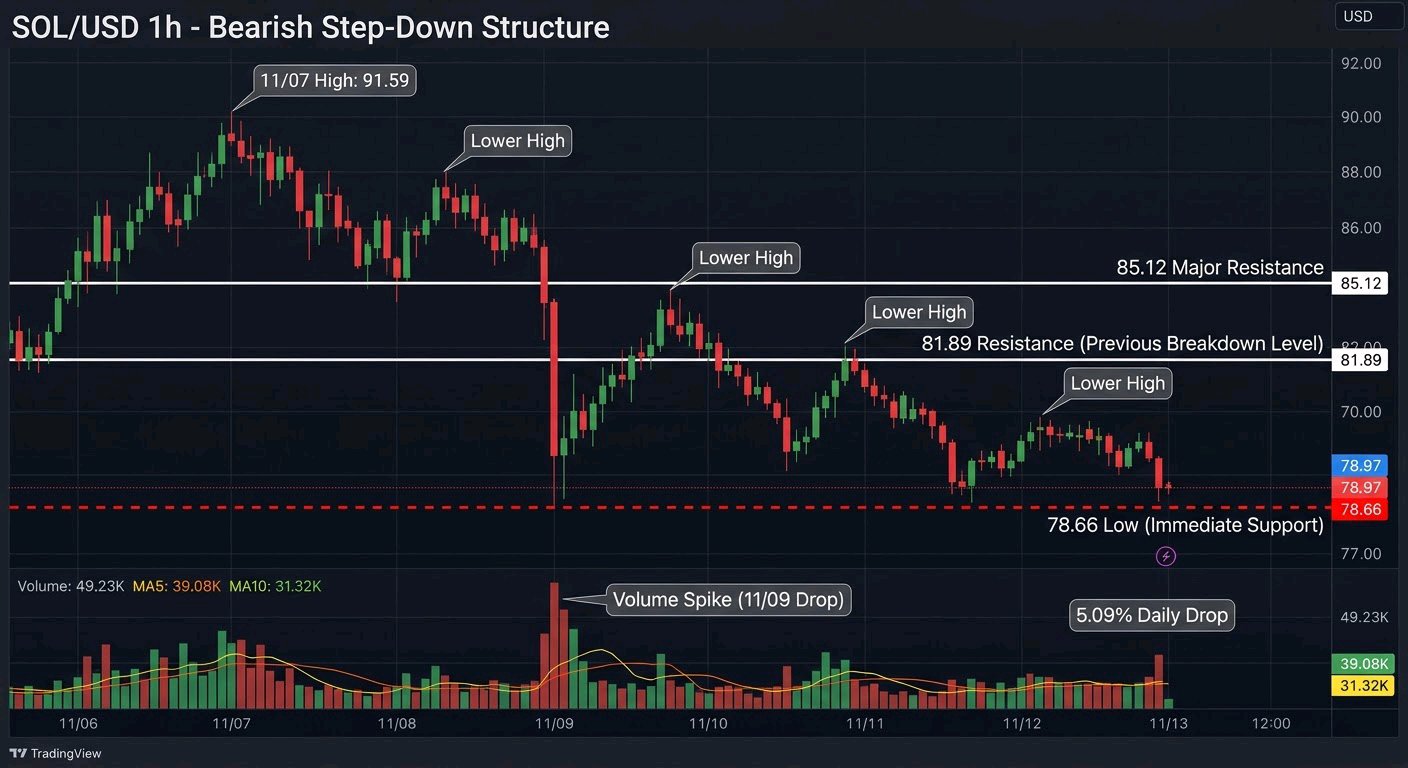
The SOL 1h chart caught my eye because of how cleanly it has stepped down. Price has gone from the 91.59 high on 11/07 to 78.97 now, and the bounces along the way have all been sold into. The structure is clearly bearish for now. Each rally has produced a lower high, and the last leg broke below the 11/11 lows with almost no pullback. The 24h range is 83.49 to 78.66, and price is sitting just above the low after a 5.09% daily drop. I don't see a recovery structure yet, only a market that keeps pressing toward support. On the indicators, volume reads 49.23K against a MA5 of 39.08K and a MA10 of 31.32K. That means current selling volume is above its recent averages, which suggests real participation behind the move rather than a drift. The volume spike during the earlier drop on 11/09 shows the same pattern. No price moving averages were shown, so I'm not reading any beyond volume. The 78.66 low is the immediate support, and the horizontal levels at 81.89 and 85.12 are the nearest overhead resistance. This is where FOMO becomes dangerous. After a drop like this, one green candle can look like a reversal, but a bounce into 81.89 without a higher low or a volume shift is just a bounce. Buying it early means paying for hope. I'm not giving a specific entry, stop, or target here, since I'd only be guessing, and I won't quote a risk-to-reward ratio without real numbers. What I'd watch is a hold above 78.66, then a reclaim of 81.89 with improving buying volume. A clean break below 78.66 would invalidate any bounce idea. This is uncertain, and protecting capital matters more than catching the exact bottom. Size small and let price prove itself. Do you think 78.66 holds as a base, or is this just a pause before the next step lower? $SOLUSDT $BTCUSDT #ByXIMPACT
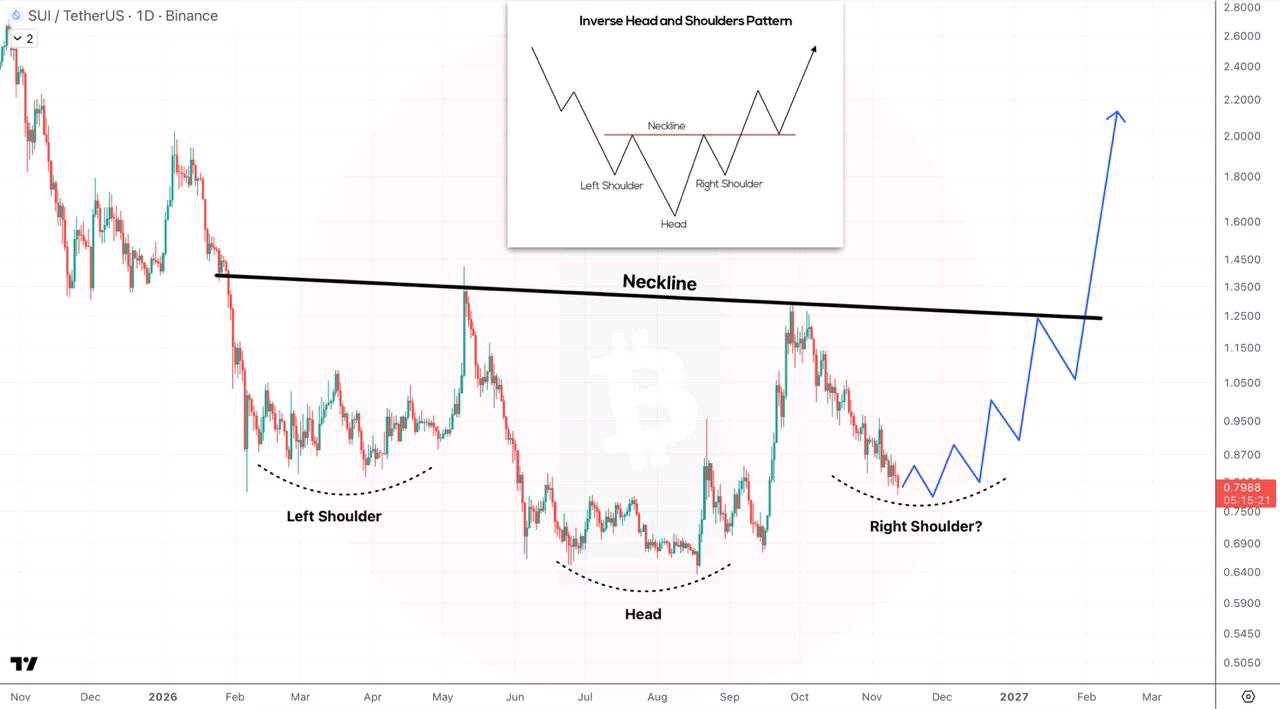
What if Sui’s next growth phase is driven less by blockchain speed and more by how easily millions of people can actually use its ecosystem? That is the opportunity I’m watching with $SUI. One of Sui’s most important developments is its collaboration with Samsung to bring USDC on Sui into Samsung Wallet. Announced on October 8, 2026, the integration is designed to make stablecoin access and transfers easier for eligible users across Samsung’s U.S. Galaxy device ecosystem, potentially reaching around 82 million devices. The important detail here is distribution. Sui is not simply trying to attract more developers or compete on transaction speed. It is working to connect blockchain infrastructure with products that everyday users already understand. If this integration generates recurring stablecoin transfers, it could create meaningful demand for Sui's network infrastructure. Here are the numbers behind this development: • SUI price: approximately $0.80 • 24-hour performance: approximately -6% • Market capitalization: approximately $3.30 billion • 24-hour spot volume: approximately $74 million • 24-hour futures volume: approximately $463 million • Open interest: approximately $486 million • Circulating supply: approximately 4.14 billion SUI • Maximum supply: 10 billion SUI • DeFi TVL: approximately $411 million • Stablecoin market capitalization: approximately $544 million Market figures are approximate and reflect November 13, 2026 data snapshots. Now look at what this development brings: Sui's ecosystem has several important advantages: 1. **Object-centric architecture:** Its unique data model allows independent transactions to be processed efficiently, supporting applications that need high throughput. 2. **Move programming language:** Designed with resource safety in mind, Move provides developers with tools for building financial applications and digital asset infrastructure. 3. **Stablecoin infrastructure:** USDC integration creates another route for payments, transfers, and onchain financial activity. 4. **DeFi expansion:** Sui already supports decentralized exchanges, lending protocols, derivatives, and other financial applications. 5. **SUI token utility:** SUI is used for network gas fees, staking, and participation in the network's economic and governance mechanisms. The next major catalyst is whether these integrations translate into actual usage. Samsung Wallet's USDC rollout, alongside the expansion of Hashi's Bitcoin-backed financial infrastructure and institutional partnerships, could strengthen Sui's position in payments and onchain finance. Another development worth watching is Sui's October 7 throughput demonstration. Sui Tunnels processed 40,614,180 transactions per second in a live test, with the results independently verified by CertiK. This demonstrates the potential of its offchain payment-channel technology, although it should not be confused with ordinary mainnet transaction throughput. My perspective is that Sui is gradually building a broader identity. It wants to become infrastructure for payments, digital assets, DeFi, and potentially machine-to-machine transactions. That gives the ecosystem several possible demand drivers beyond speculative trading. Of course, ecosystem expansion does not automatically translate into a higher SUI price. Samsung integration usage, sustainable DeFi growth, network fees, token demand, and the remaining supply schedule will all matter. With approximately 41.4% of the maximum supply currently circulating, future token unlocks also deserve attention. I believe the bigger question is no longer just how fast Sui can process transactions. It is whether the network can turn that technical capacity into consistent economic activity. If millions of users eventually interact with Sui through familiar payment applications, could $SUI become one of the more important infrastructure assets in the next generation of onchain finance? Research sources: Sui +4 $SUIUSDT $ETHUSDT #ByXIMPACT

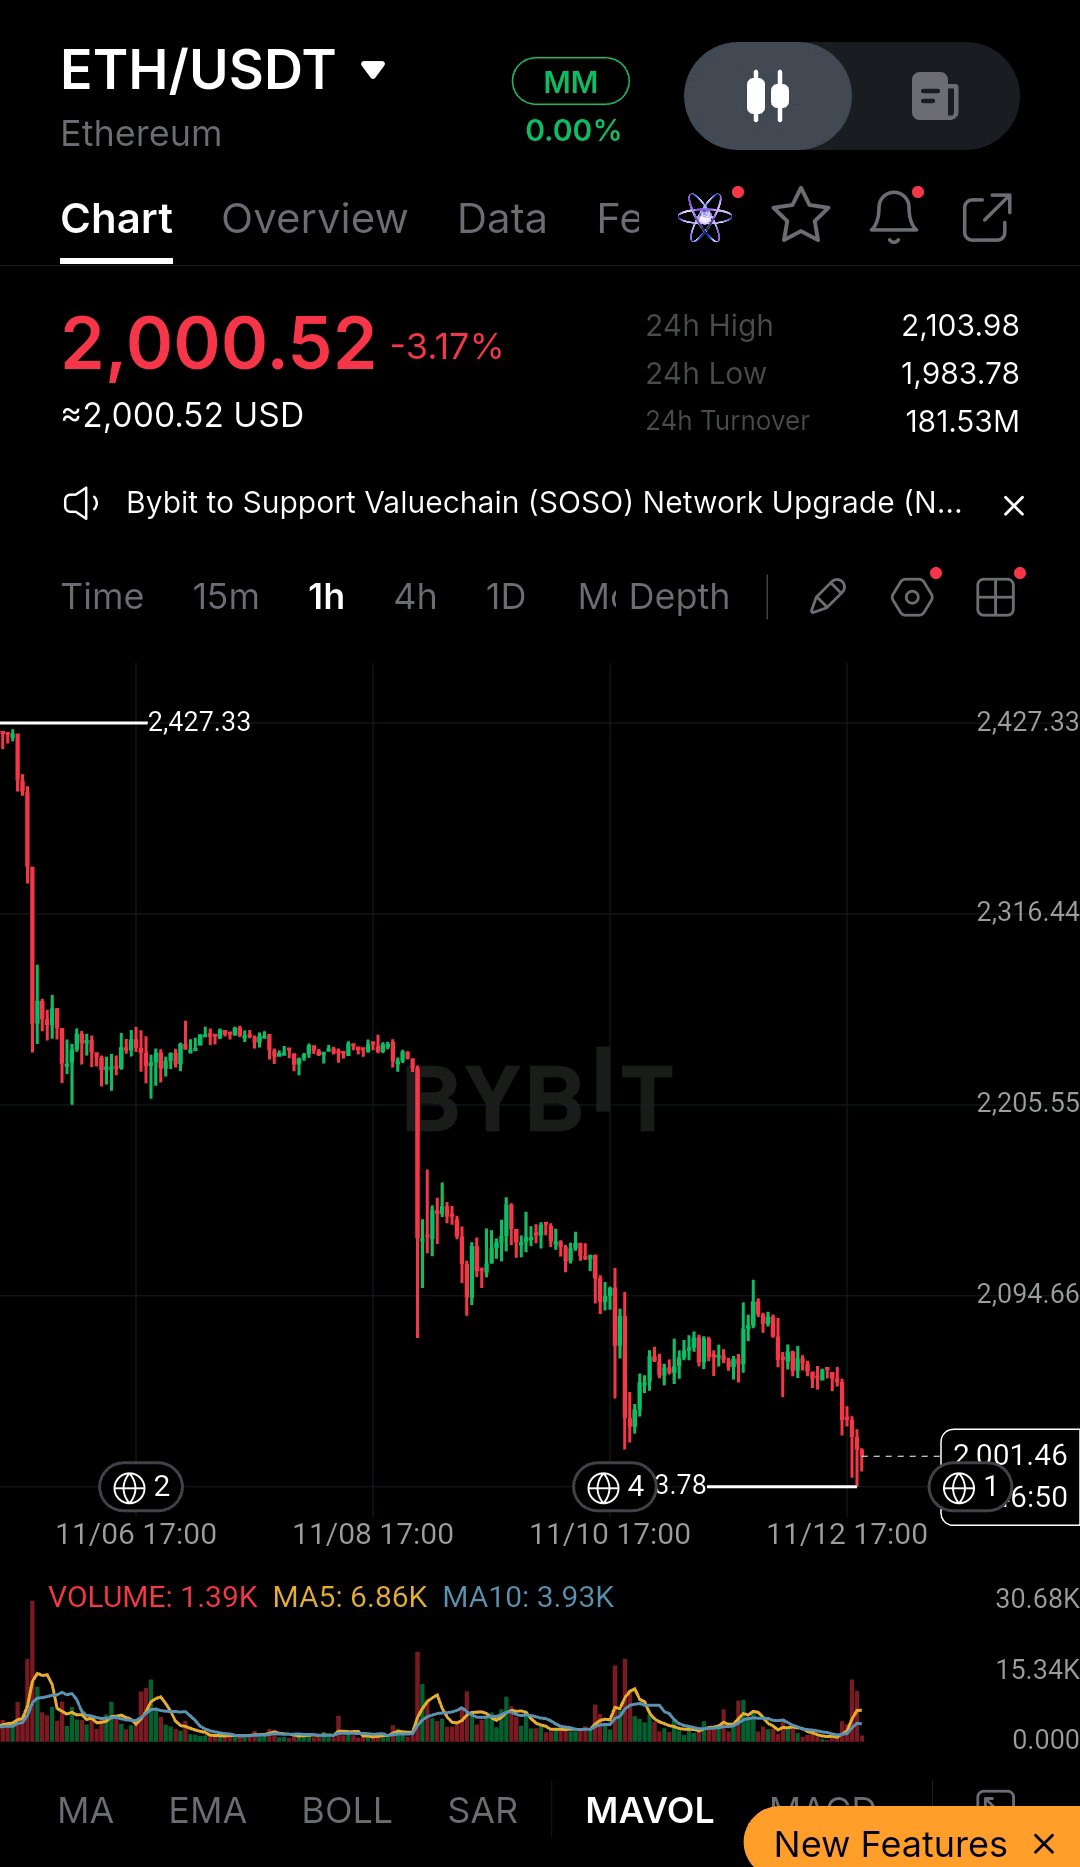
ETH/USDT — Sellers Are Pressuring $2,000, But One Level Matters Now Ethereum is approaching a critical area, and I don't think this is the place to make an emotional trading decision. ETH is trading around **$2,000.52**, down approximately **3.17%**, while the latest 1-hour structure continues to favor sellers. What concerns me most is the sequence of lower highs and lower lows. After losing the $2,205 region, ETH attempted to stabilize, but the recovery toward $2,094 failed to produce a meaningful reversal. Sellers stepped back in, pushing price toward the recent **$1,983.78 low**. My technical view: The $1,983–$2,000 zone is the immediate area I'm watching. A decisive 1-hour close below $1,983.78 could open the door to another downside leg. On the other hand, buyers need to reclaim $2,094.66 and overcome the nearby $2,103.98 resistance before I start taking a recovery seriously. The visible volume reading is 1.39K, compared with MA5 at 6.86K and MA10 at 3.93K. Participation is relatively subdued in this snapshot. MACD, RSI, SAR, and EMA readings aren't displayed, so I'm not going to assume their signals. My execution strategy: I'm avoiding aggressive dip-buying while the bearish structure remains intact. For a potential long, I'd rather see ETH reclaim $2,094–$2,104, followed by a successful retest. Any bullish recovery idea becomes invalid if price breaks and holds below $1,983.78. For existing short positions, I'd focus on protecting profits instead of chasing the move directly into support. Upside objective: $2,094 → $2,104 → $2,205, provided buyers regain control. ETH is at an important decision point. Do you expect buyers to defend $2,000, or are we heading toward another leg lower? #ETH #Ethereum #CryptoTrading #TechnicalAnalysis $ETHUSDT $BTCUSDT #ByXIMPACT
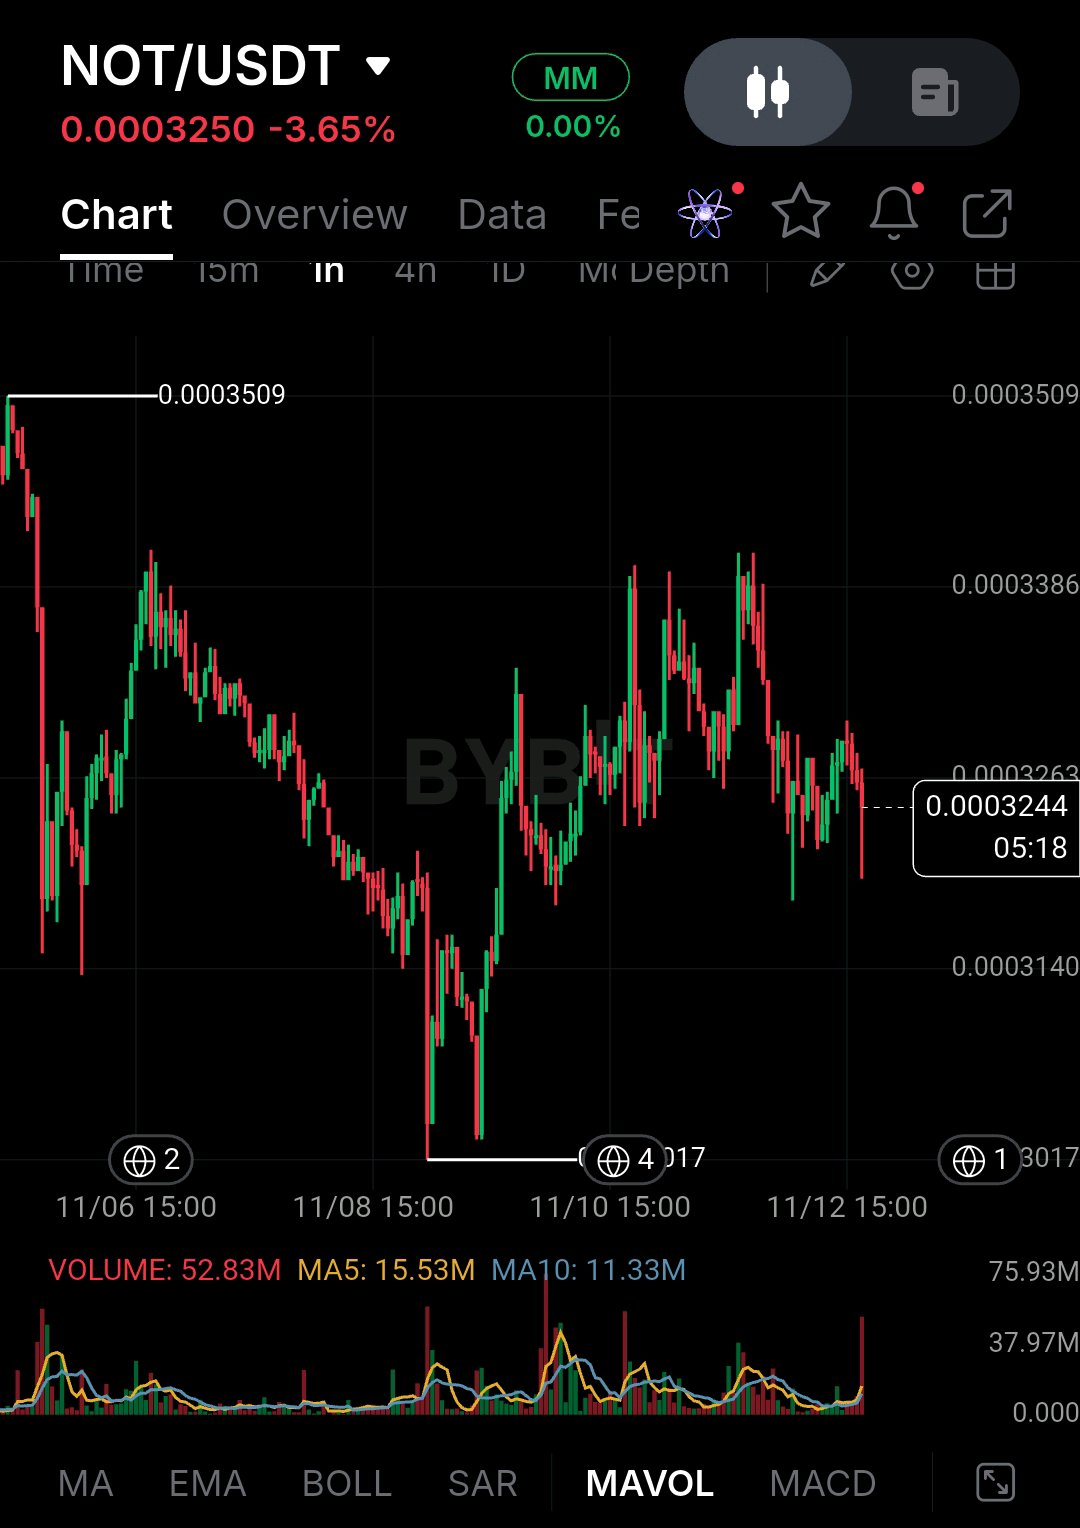
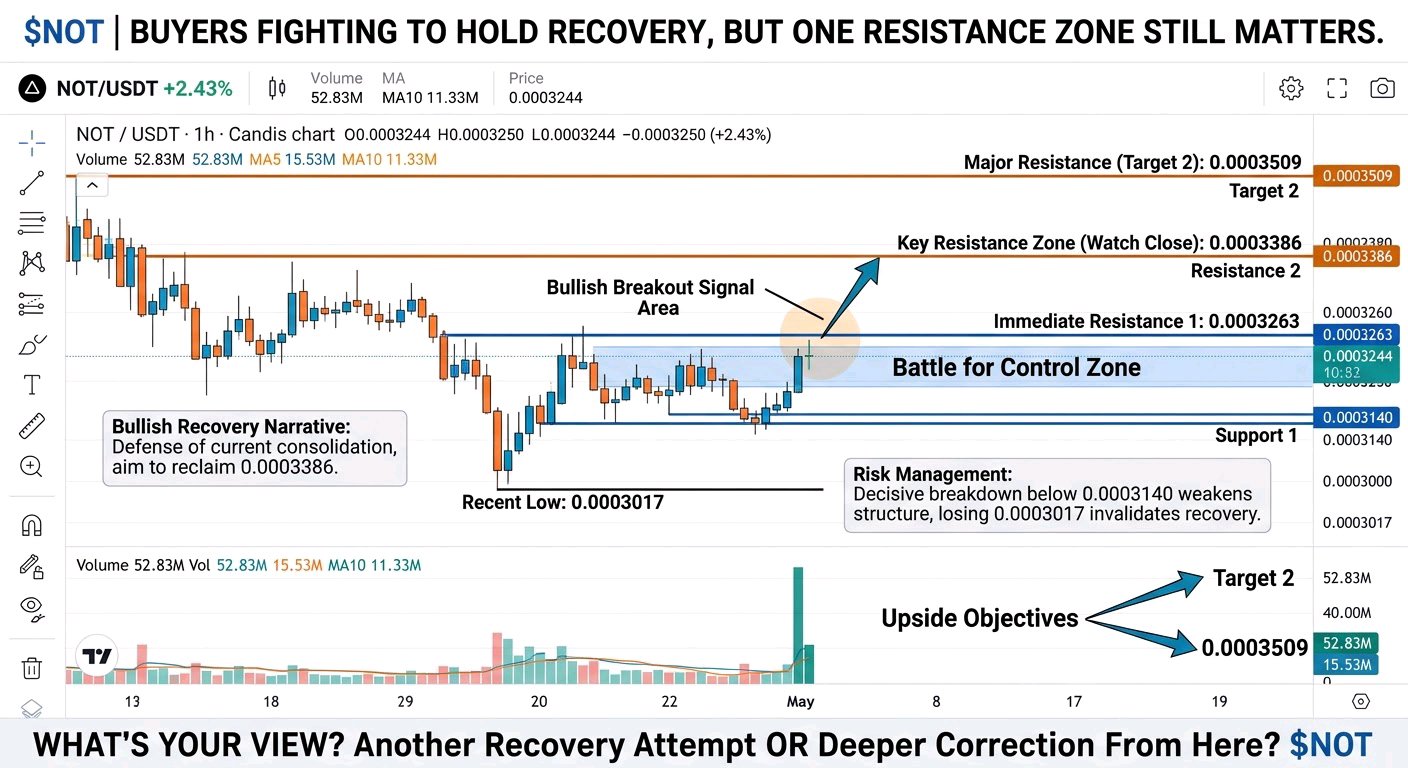
$NOT | Buyers Are Fighting to Hold the Recovery, But One Resistance Zone Still Matters. I’m watching NOT/USDT closely because the chart is showing an interesting battle between buyers and sellers. After dropping from the 0.0003509 region toward the 0.0003017 low, NOT managed to recover, but the latest candles suggest that bullish momentum is not fully established yet. Market Structure: On the 1H chart, price is trading around 0.0003244–0.0003250. The recovery from the recent low was encouraging, but sellers stepped in again near the 0.0003386 resistance area. Since then, price has struggled to establish a sustained upward move. Buyers are attempting to defend the current consolidation, while sellers are still applying pressure around the short-term resistance. Technical Reality Check: One detail I wouldn't ignore is the latest volume spike, with reported volume reaching 52.83M, compared with MA5 volume of 15.53M and MA10 volume of 11.33M. This suggests increased trading activity during the latest move, although volume alone does not confirm direction. RSI, MACD, SAR and EMA readings are not visible in this screenshot, so I won't assume their signals. My Execution Strategy: I'm keeping 0.0003140 on my watchlist as an important nearby support. If buyers defend this region and push price back above 0.0003263, I would look for a stronger recovery toward 0.0003386. However, I don't want to chase a green candle without confirmation. A sustained breakout above resistance would make the bullish setup more convincing. Important Levels: - Support 1: 0.0003140 - Support 2: 0.0003017 - Resistance 1: 0.0003263 - Resistance 2: 0.0003386 - Major Resistance: 0.0003509 Risk Management: A decisive breakdown below 0.0003140 would weaken the recovery structure. Losing 0.0003017 would invalidate the current bullish recovery thesis. I'd rather protect capital than hold onto a setup after its structure has failed. Upside Objective: My first upside objective is 0.0003386. If NOT clears that level with convincing volume, the next area I'm watching is 0.0003509. For now, patience matters more than prediction. What's your view on $NOT? Are you expecting another recovery attempt or a deeper correction from here? $NOTUSDT $BTCUSDT #ByXIMPACT