
KAZ_0
4046Like0Shares65Fans31Follow
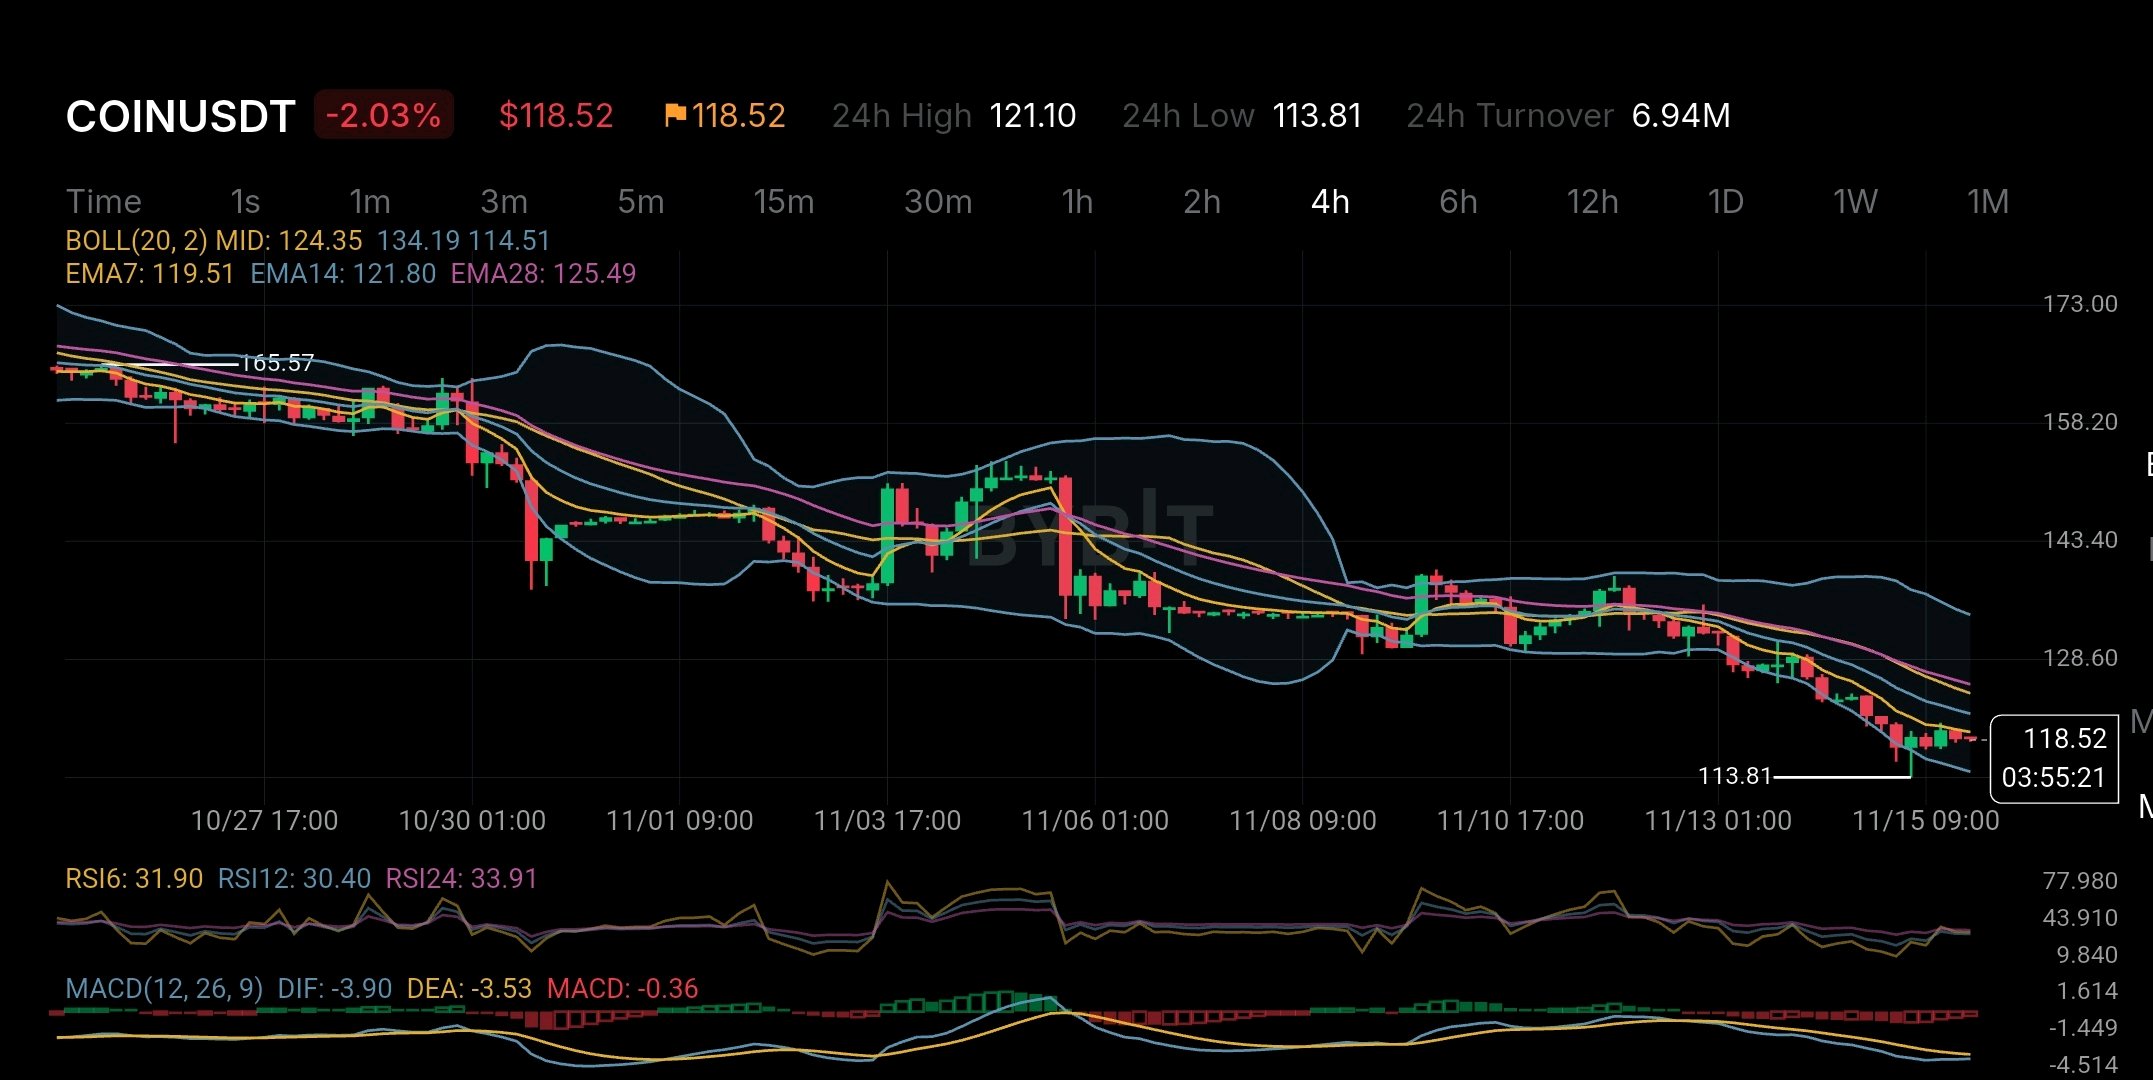
Coinbase reported $718.7 million in net income for Q3 2026. But there is one detail behind that profit that investors should not ignore. Its adjusted net income was only $77.7 million. The difference came mainly from a $715 million gain on crypto assets held for investment. This means the headline profit looks much stronger than the company's adjusted operating performance. There is another important detail. Coinbase generated $1.22 billion in Q3 revenue which was down 35% compared with the same period last year. Transaction revenue fell 44% to $590.2 million. This shows how much Coinbase still depends on activity in the crypto market even as it expands into other businesses. There is a positive side too. Subscription and services revenue reached $570.2 million and represented around 49% of total net revenue. Prediction markets also crossed $200 million in annualized revenue. This diversification could make Coinbase more resilient when crypto trading activity slows down. But the stock market is not ignoring the risks. Looking at the 4-hour COINUSDT chart price is around $118.52 after a steady decline from the $165 area. The price is trading below EMA7 at $119.51 EMA14 at $121.80 and EMA28 at $125.49. All three moving averages are pointing to selling pressure. RSI readings are close to 30 which suggests that sellers have pushed the market into an oversold area. However oversold does not automatically mean a reversal is coming. The MACD is also still negative which means bearish momentum has not clearly disappeared. The $113.81 area is an important nearby support to watch. If buyers defend this zone and price moves back above $121.80 the market could start showing signs of recovery. On the other hand a clean break below $113.81 could open the door to another leg down. One more thing traders should understand: COINUSDT on Bybit is a perpetual contract tracking Coinbase stock. It does not provide actual shares ownership voting rights or dividends. For me the biggest takeaway is this. Coinbase is building new revenue streams beyond crypto trading but its latest earnings show that headline profits can still be heavily influenced by crypto market gains. The real question is whether its growing recurring businesses can become strong enough to support the company even when the crypto market stops helping. #WSOTShowYourAITradeToEarn10USDT #ByXIMPACT
One thing about SUI that many investors may be missing is that more network activity doesn't always mean more value for the token. And this is something worth looking at. According to the latest available data Sui handled around 73.39 million transactions in 24 hours with nearly 70,268 active addresses. Its DeFi ecosystem also had around $363–375 million in TVL. These numbers look good but there is another side to the story. Daily network fees were reported at around $4,511 while applications on Sui generated about $55,000 in revenue. These are two different things but they raise an important question: If people are using the Sui network so much how much of that activity actually creates value for SUI holders? Sui has some strong technology behind it. It uses the Move programming language a unique object-based system and the Mysticeti consensus protocol to make transactions faster and more efficient. That's a clear advantage. But good technology alone doesn't guarantee a higher token value. For SUI holders the important thing is whether more network users will create more demand for the token through transaction fees staking and ecosystem growth. There is also the supply issue. SUI has a maximum supply of 10 billion tokens but not all of them are currently in circulation. More tokens will enter the market over time which could create selling pressure if demand doesn't grow enough. Looking at the 4-hour chart the situation is still weak. SUI is trading below EMA7 EMA14 and EMA28. MACD is also negative while RSI is around 35. This shows that sellers still have control. A recovery is possible but the chart has not confirmed a trend reversal yet. For me the biggest question about SUI is not how fast its network can process transactions. It's whether that growing activity can create real and lasting demand for the SUI token. A network can become popular but the real test is whether its token benefits from that popularity. $SUIUSDT #IMPACTbyTrade

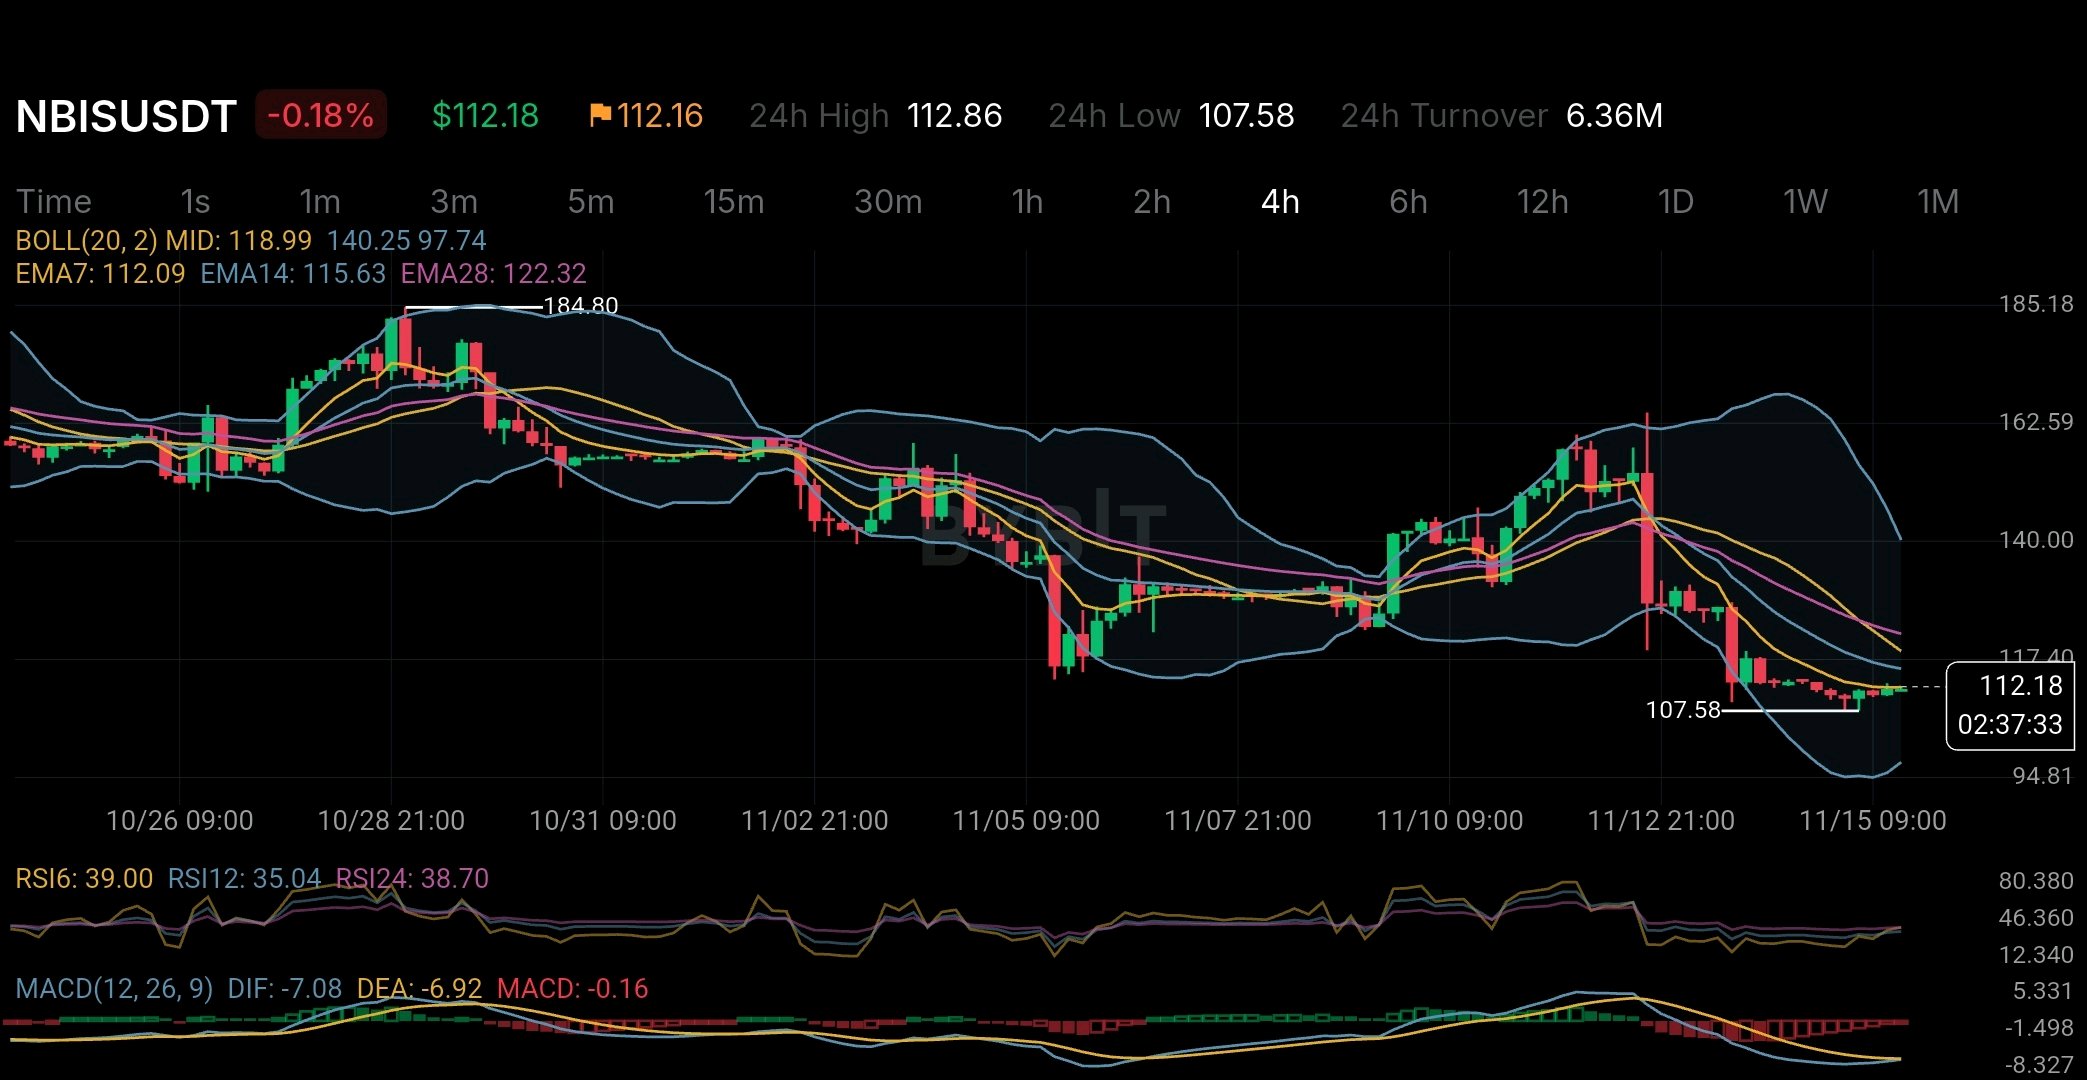
Nebius just reported 571% year-over-year revenue growth. But one detail in its latest results deserves more attention than the headline. Not all of that growth came from its traditional AI cloud business. Nebius reported $980.8 million in Q3 2026 revenue. Approximately $325 million was non-recurring revenue from the initial rollout of its asset-light infrastructure partnership model. Here is why that matters. Under this model partners finance own and operate the data centers. Nebius contributes its infrastructure architecture software stack hardware expertise and customer relationships. This is an interesting strategic shift. Instead of financing every GPU and data center itself Nebius can expand its global AI cloud footprint using infrastructure funded by external partners. The potential advantage is substantial: more computing capacity without carrying the entire capital burden. But there is another side to the equation. Nebius spent approximately $7.3 billion on property equipment and intangible assets in Q3 alone. Its nine-month investment in these assets reached approximately $15.4 billion. Meanwhile operating cash flow from continuing operations was negative $273 million during Q3. That creates an important distinction between revenue growth and financially sustainable growth. The asset-light model could improve capital efficiency over time but investors still need to see how much recurring revenue it generates how profitable those partnerships become and whether customer demand justifies the infrastructure being deployed. There is also a competitive challenge. Nebius operates against established cloud giants and specialized AI infrastructure providers such as CoreWeave. Access to GPUs electricity data center capacity and financing can determine who captures the next phase of AI demand. The market chart adds another dimension. In the November 15 snapshot NBISUSDT trades around $112.18 on the four-hour timeframe. The price remains below the 14 and 28 EMAs while RSI readings around 35 indicate weak momentum. MACD is also slightly negative. This does not establish a reversal. It shows that market sentiment has not yet caught up with the company's reported growth. One important clarification: NBISUSDT on Bybit is a USDT-settled perpetual contract tracking Nebius Group's stock not a conventional crypto token with independent blockchain tokenomics. The real question surrounding Nebius is not whether AI infrastructure demand exists. It is whether the company can convert enormous demand and investment into durable profitable cash flows before the cost of expansion becomes a bigger problem than growth itself. #ByXIMPACT
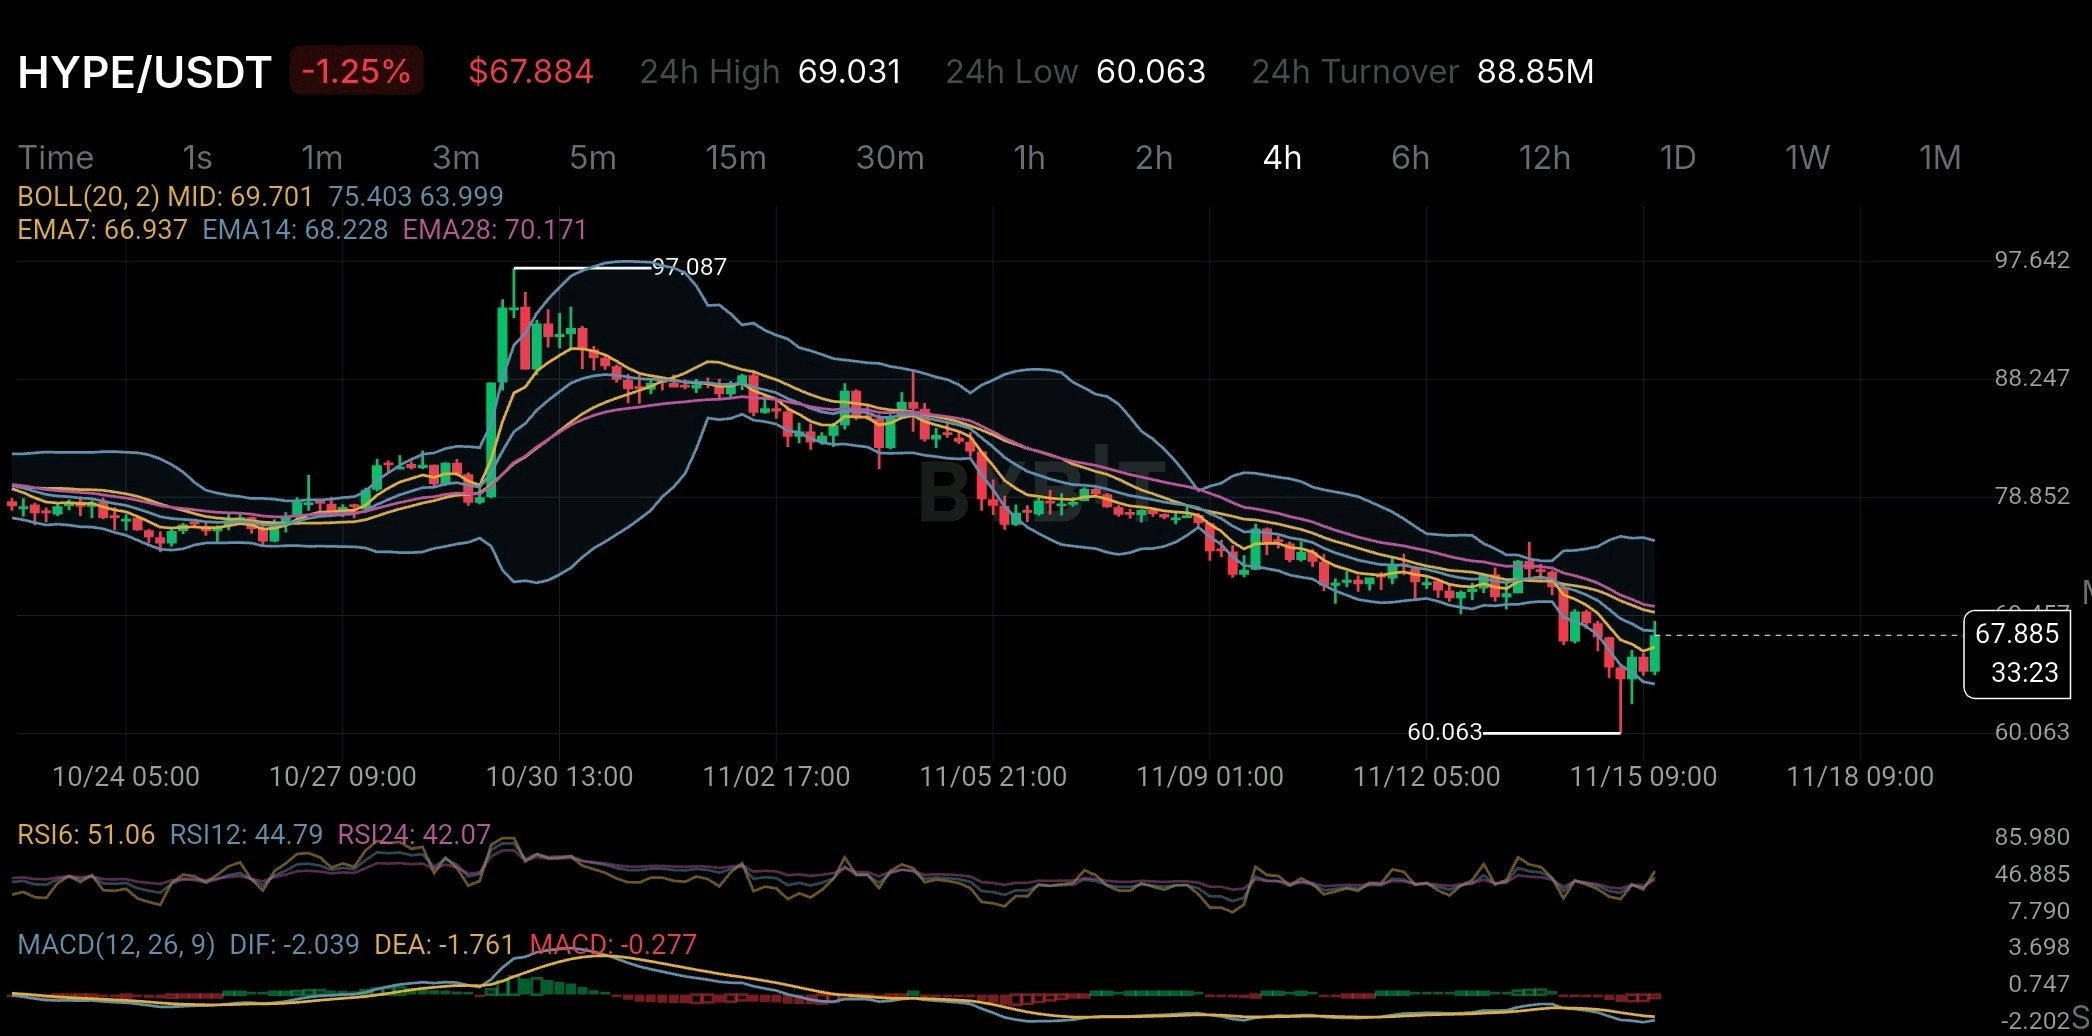
HYPE has something that many crypto tokens don't: a system that uses trading fees to buy HYPE tokens and burn them permanently. But despite this system the price has still dropped from around $97 to $60 on the 4-hour chart. This is something worth looking at more closely. One of the most interesting parts of Hyperliquid is its Assistance Fund. According to its official documents trading fees are used to buy HYPE tokens through this fund. The tokens collected are then permanently burned. The numbers are important. A September 2026 SEC filing reported that 99% of protocol fees went to the Assistance Fund. By September 8 around 47.1 million HYPE tokens had been bought and permanently removed from circulation. That's equal to 4.7% of the original supply. This connects the platform's trading activity directly to HYPE demand. More trading can generate more fees. More fees can mean more HYPE purchases and fewer tokens in circulation. But there is one important thing to understand: Token burns do not guarantee a higher price. They create buying demand but they cannot stop the price from falling. If investors sell more HYPE than the fund buys the price can still go down. Market conditions liquidity and investor sentiment also play a major role. The chart shows this clearly. HYPE recently dropped to $60.063 before recovering to around $67.884. However the price is still below EMA14 at $68.228 and EMA28 at $70.171 on the 4-hour chart. MACD is also still negative which means the overall downward trend has not clearly ended. The recent recovery is a positive sign but it is too early to call it a trend reversal. For investors the most important thing is not just how many HYPE tokens are burned. What matters is whether the demand created by real platform activity can become stronger than the selling pressure. HYPE has an interesting advantage because its token demand is connected to actual platform activity rather than depending only on hype. But even a strong token-burning system cannot guarantee a higher market price. The real challenge for HYPE is simple: Can actual platform demand become stronger than the pressure from people selling their tokens? $HYPEUSDT #ByXIMPACT

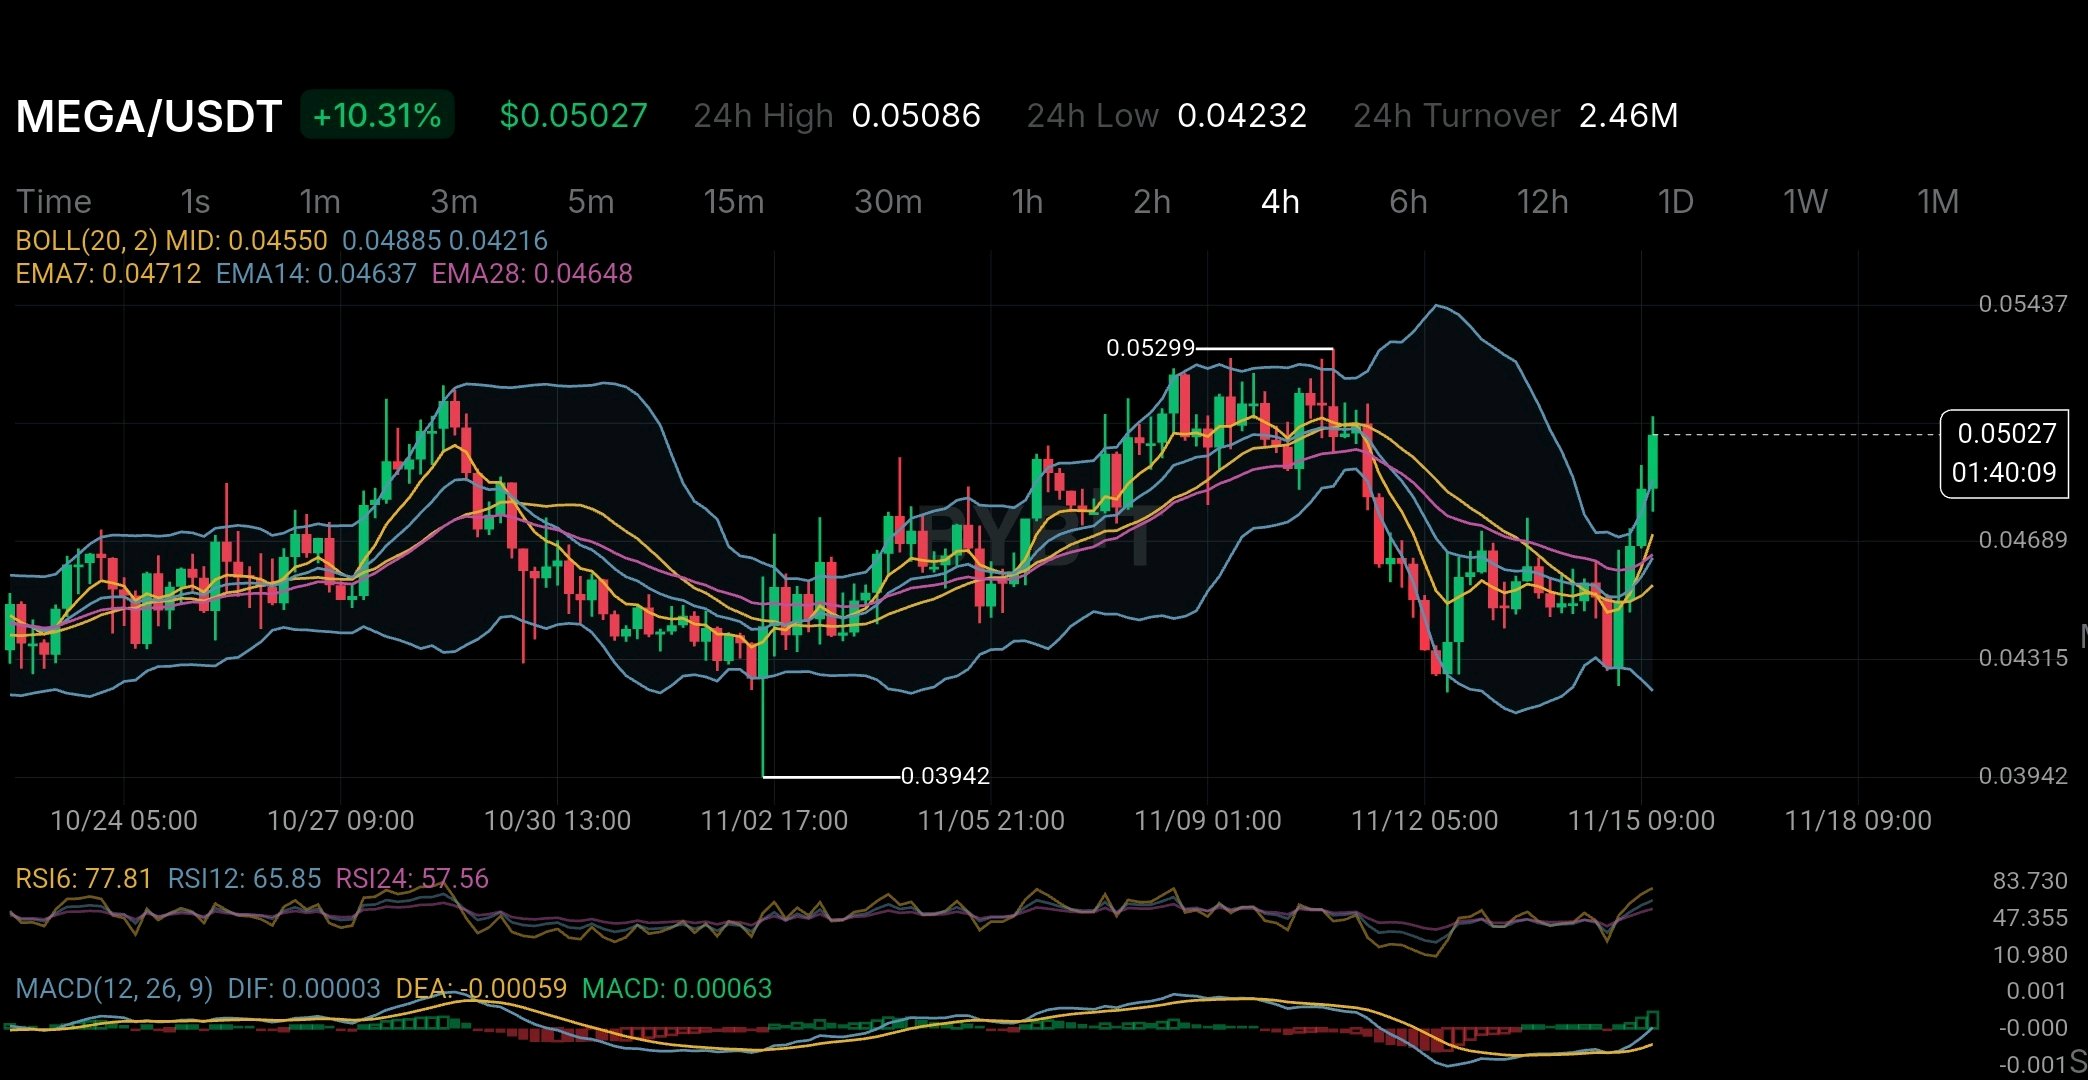
MEGA is up 10.31% but there is something happening behind the scenes that deserves more attention than the price increase. MegaETH seems to be changing its plans. On November 10 the team announced a $30 million treasury investment to build new products. The first big project is a decentralized AI marketplace expected to launch in December. The idea is simple. Instead of using just one AI provider developers could choose between different providers and compare their prices speed and performance. But there is something interesting here. MegaETH started with one main goal: building a fast Ethereum Layer 2 network. Now the team wants to do more than just build blockchain technology. It also wants to create useful products on top of that network. So why is this happening? There are some numbers worth looking at. According to CoinDesk's November 14 report MegaETH's DeFi TVL had dropped to around $8.8 million from its previous high of more than $245 million. That is a big drop. It shows that the project still needs to attract more users and money into its ecosystem. Another important update came on November 13 when MEGA announced a 20% reduction in its workforce. The changes affected teams working on blockchain development wallets and ecosystem support. This does not mean the project is failing. But it does show that the team is changing its priorities. MEGA's token supply is also worth watching. According to its official token distribution information around 53% of the total supply is set aside for KPI-based rewards. In simple words tokens are distributed based on how well the network meets certain goals instead of following only a fixed release schedule. This approach connects token rewards with the growth of the ecosystem. However there is something investors should understand. A growing project does not always mean a more valuable token. Holding MEGA does not give investors direct ownership of the company or guarantee them a share of its revenue. This becomes even more important now that the team is moving into the AI space. Now let's look at the 4-hour chart. MEGA is trading around $0.05027 with a 10.31% gain. The price has moved above the upper Bollinger Band at $0.04885 while RSI6 is at 77.81. MACD has also turned positive which shows that buying momentum is getting stronger. But there is one thing to be careful about. RSI is already high so the price could face a pullback after this strong move. For me the real story is not just the AI idea or today's price increase. It is whether MegaETH can turn its new plans into real users and activity. The AI marketplace could open a new growth opportunity for the project. But the real test will be whether this growth also creates real value for MEGA holders. A strong project needs more than a good idea. It needs results that people can actually see. $MEGAUSDT #IMPACTbyTrade
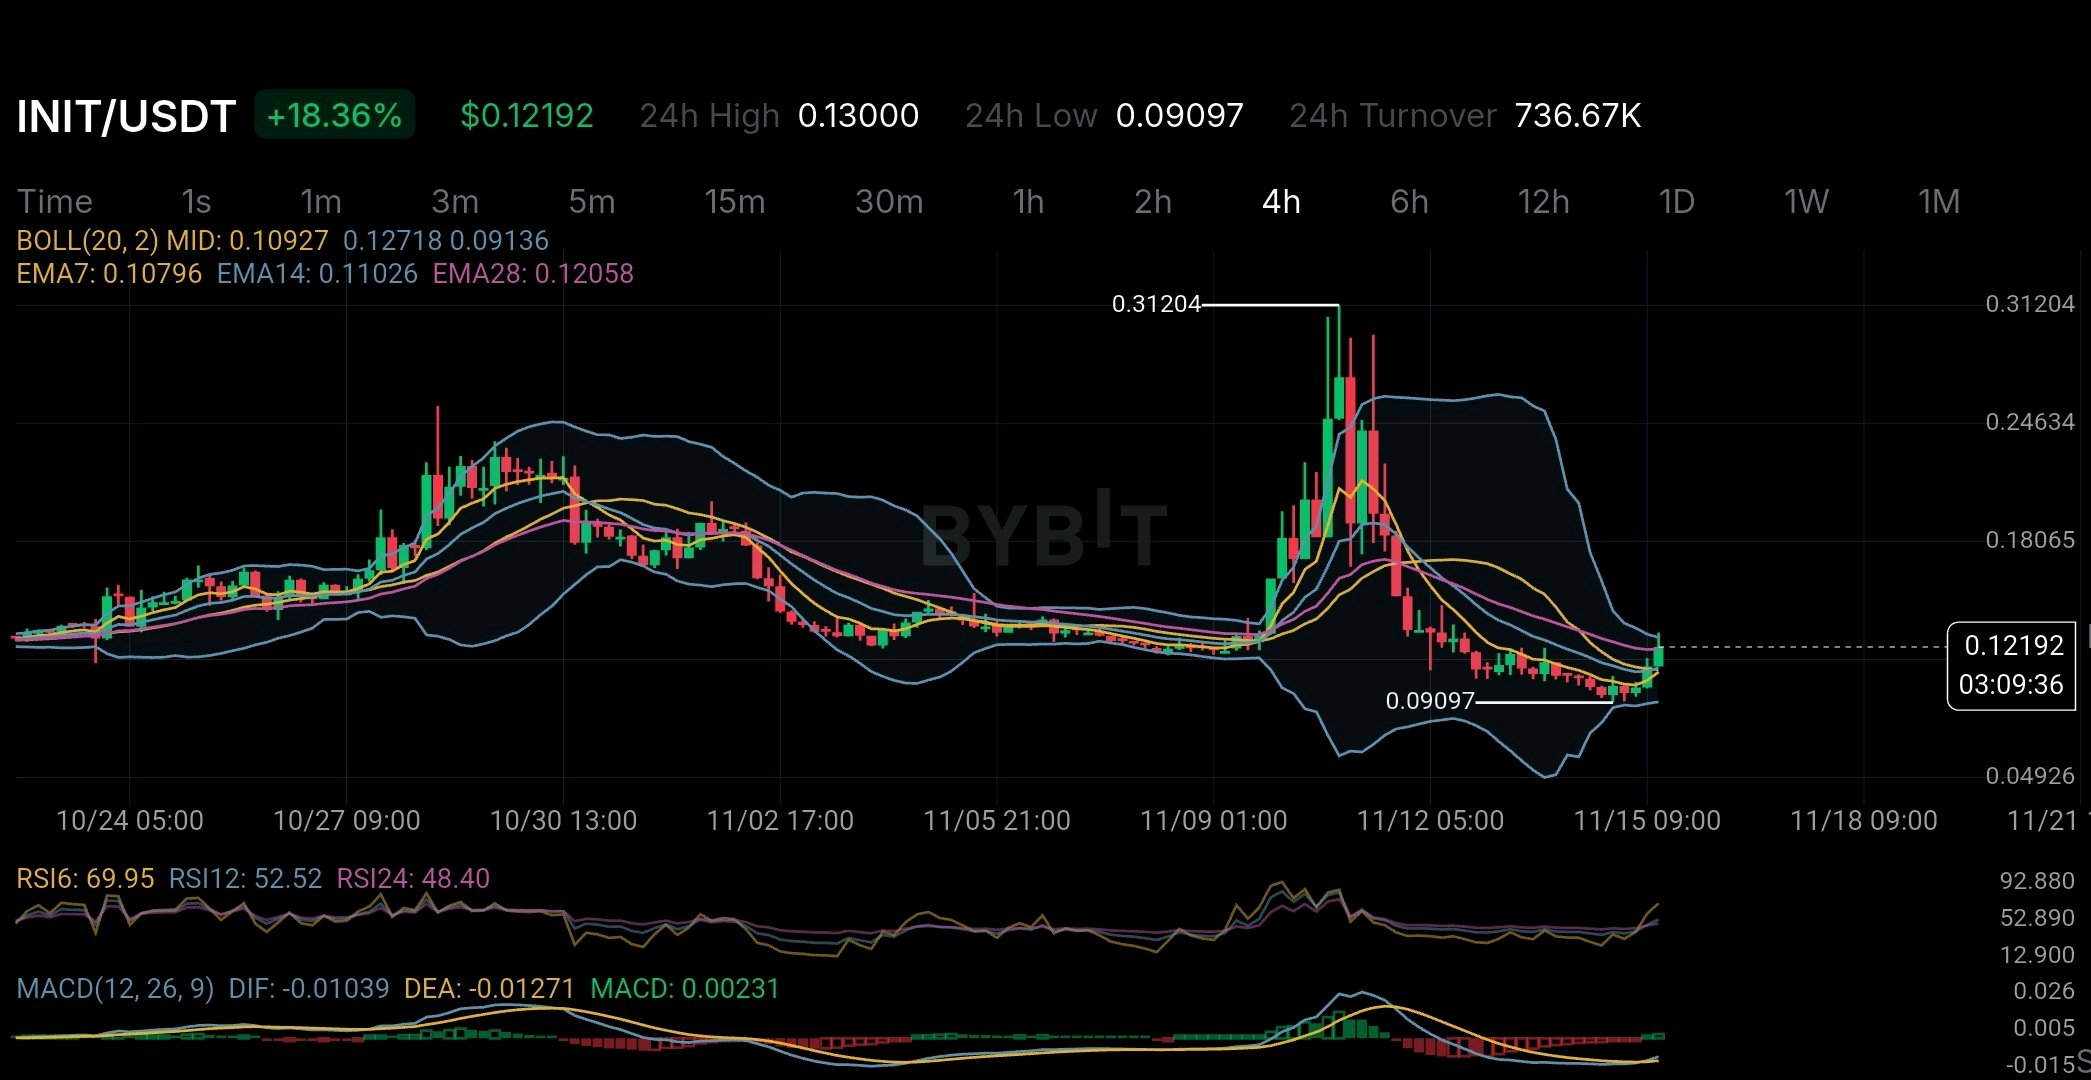
INIT is up 18.36% on the 4H chart but there is something important happening with its token supply. The main thing to understand is that unlocked tokens and tokens actually available in the market are not always the same. Here is the bigger concern. According to DefiLlama's November 10 analysis around 96 million INIT tokens were already vested but were not included in the circulating supply. It also reported an annual inflation rate of 57.28%. There is another thing worth watching. DefiLlama's market data showed average futures trading volume of around $90.5M compared to only $19.9M in spot volume. Open interest was also close to 77% of market cap. Funding was negative which means short traders were paying long traders. This makes the current rally interesting. The price could be rising partly because short traders are closing their positions rather than because of strong buying in the spot market. On the 4H chart INIT has moved above its EMA levels and MACD has turned positive. But RSI6 is already close to 70 which means the short-term move may be getting overheated. I would like to see stronger spot buying before trusting this recovery. A price pump is one thing. Keeping that price strong while more tokens enter the market is a completely different challenge. The big question is whether INIT can maintain this momentum when supply pressure increases. $INITUSDT #IMPACTbyTrade
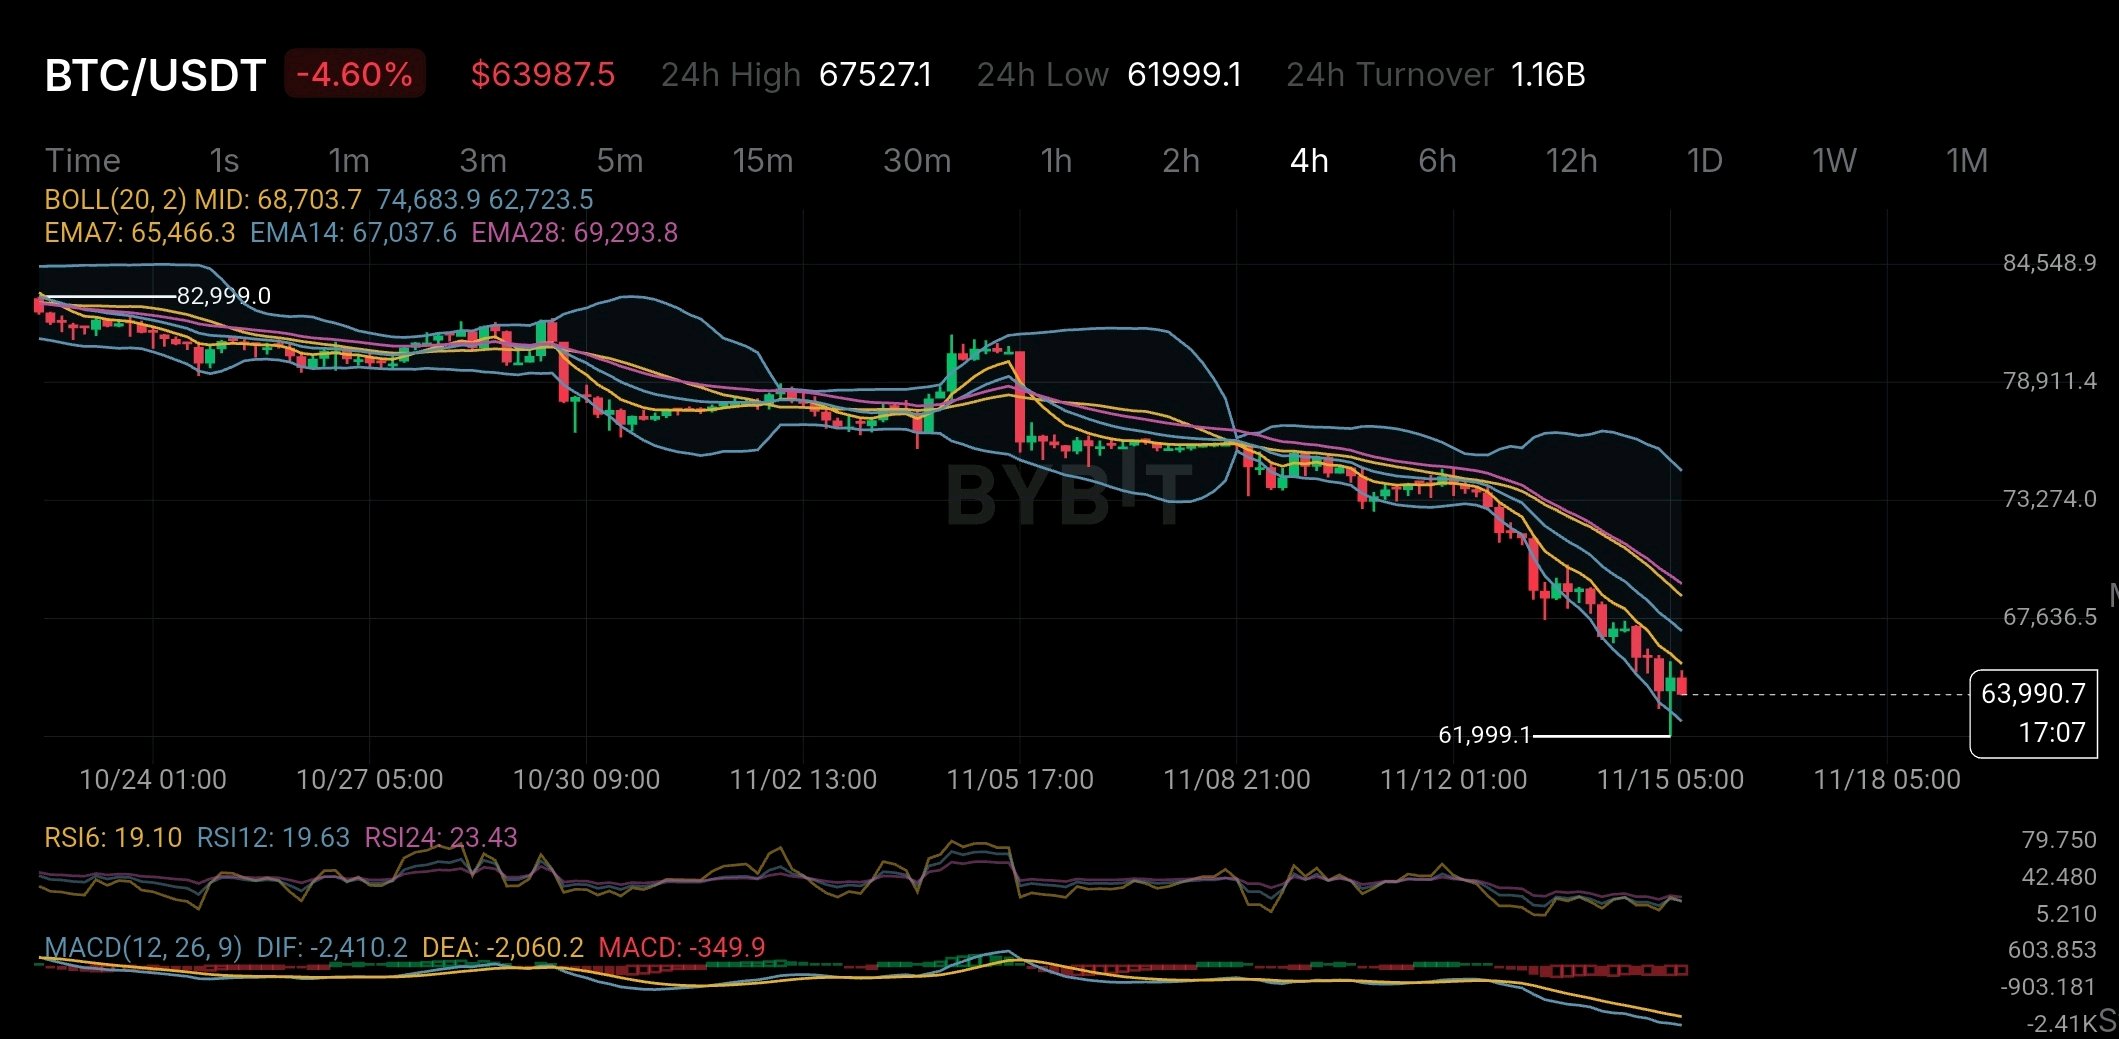
Bitcoin is showing more weakness than a normal price drop. What worries me is how quickly buyers have lost control on the 4-hour chart. BTC is trading around $63,987 after dropping nearly 4.6%. It also recently touched $61,999. One thing I noticed is that all the momentum indicators are looking weak. RSI is around 19–23 and BTC is trading below the 7 14 and 28 EMAs. MACD is also showing negative momentum. This tells me that sellers are still in control. But the very low RSI also makes me think about one thing. Are sellers getting tired or is another drop coming? For me the bigger concern is not just the chart. It is the demand from big investors. US spot Bitcoin ETFs have seen around $2.3 billion in money flowing out during November so far. Nine out of the first ten trading sessions were negative. Another important detail is that the crypto market saw around $1.64 billion in liquidations within 24 hours on November 13. Most of these losses came from traders who were using leverage to bet on higher prices. So this drop is not only about weak chart signals. A stronger US dollar and expectations of higher interest rates are also putting pressure on risky assets like Bitcoin. The main level I am watching is $61,999. If BTC breaks below this support with strong selling pressure then we could see another move down. But if buyers defend this level and BTC starts moving back above the short-term EMAs then a recovery bounce could happen. I also think the low RSI is worth watching. It could lead to a quick bounce but it does not mean the bottom is confirmed. Bitcoin still has a maximum supply of 21 million coins. Its block reward is also 3.125 BTC after the 2024 halving. But there is one important thing to understand. Limited supply does not guarantee higher prices when buyers are not coming into the market. That is what I am watching right now. Bitcoin's long-term supply has not changed but demand in the short term is getting weaker. The big question is whether buyers will step in around $62K or whether Bitcoin needs another drop before finding a stable bottom. $BTCUSDT #IMPACTbyTrade
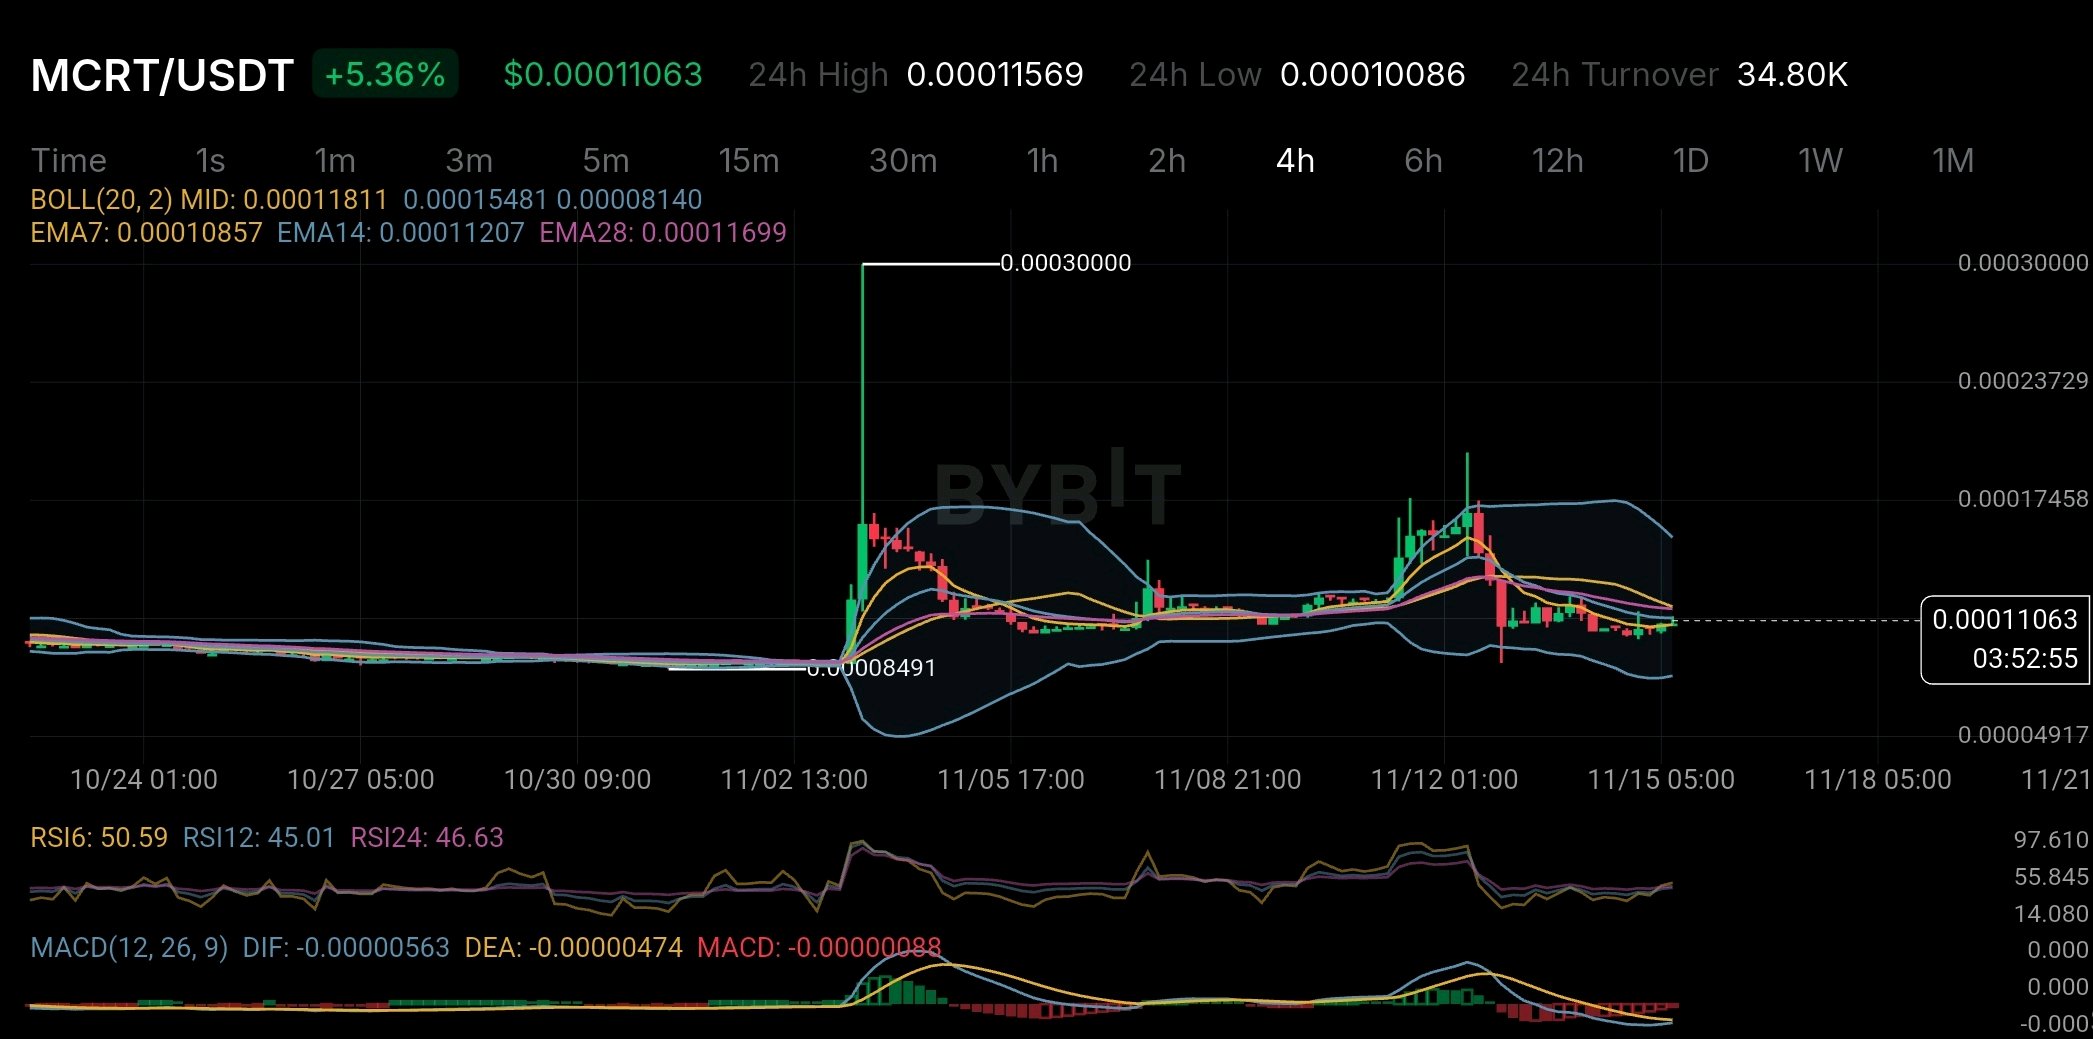
MCRT is showing some recovery on the 4H chart but I'm still not sure buyers are fully in control. Price is currently around $0.00011063 after a 5.36% gain. But there are a few things I want to see before getting too bullish. One thing that caught my attention is the token supply. MagicCraft has a maximum supply of 10 billion MCRT. According to its official tokenomics there is no token burning system. Around 43.5% of the supply was set aside for gaming and ecosystem growth while another 12% was allocated to pledging rewards. This means future token releases and real demand are important to watch. I also noticed a big difference in circulating supply data. The official website estimated around 8.4 billion MCRT in October 2026 while CoinGecko shows around 5.038 billion circulating tokens and 7.2 billion total supply. These numbers may come from different reporting methods but the difference is still worth watching. Now looking at the chart MCRT is still below EMA14 and EMA28. The Bollinger middle band is around $0.00011811. RSI is near neutral and MACD is still negative. For now this looks more like price trying to settle down rather than a clear trend reversal. I'm watching the $0.000112-$0.000118 area. MCRT needs to move above this zone to show better strength. On the downside $0.000100 is an important support level to watch. Personally I want to see buyers push the price above the moving averages before getting too confident. A green candle is good but the bigger question is whether real demand from the game can support the token over time. $MCRTUSDT #IMPACTbyTrade
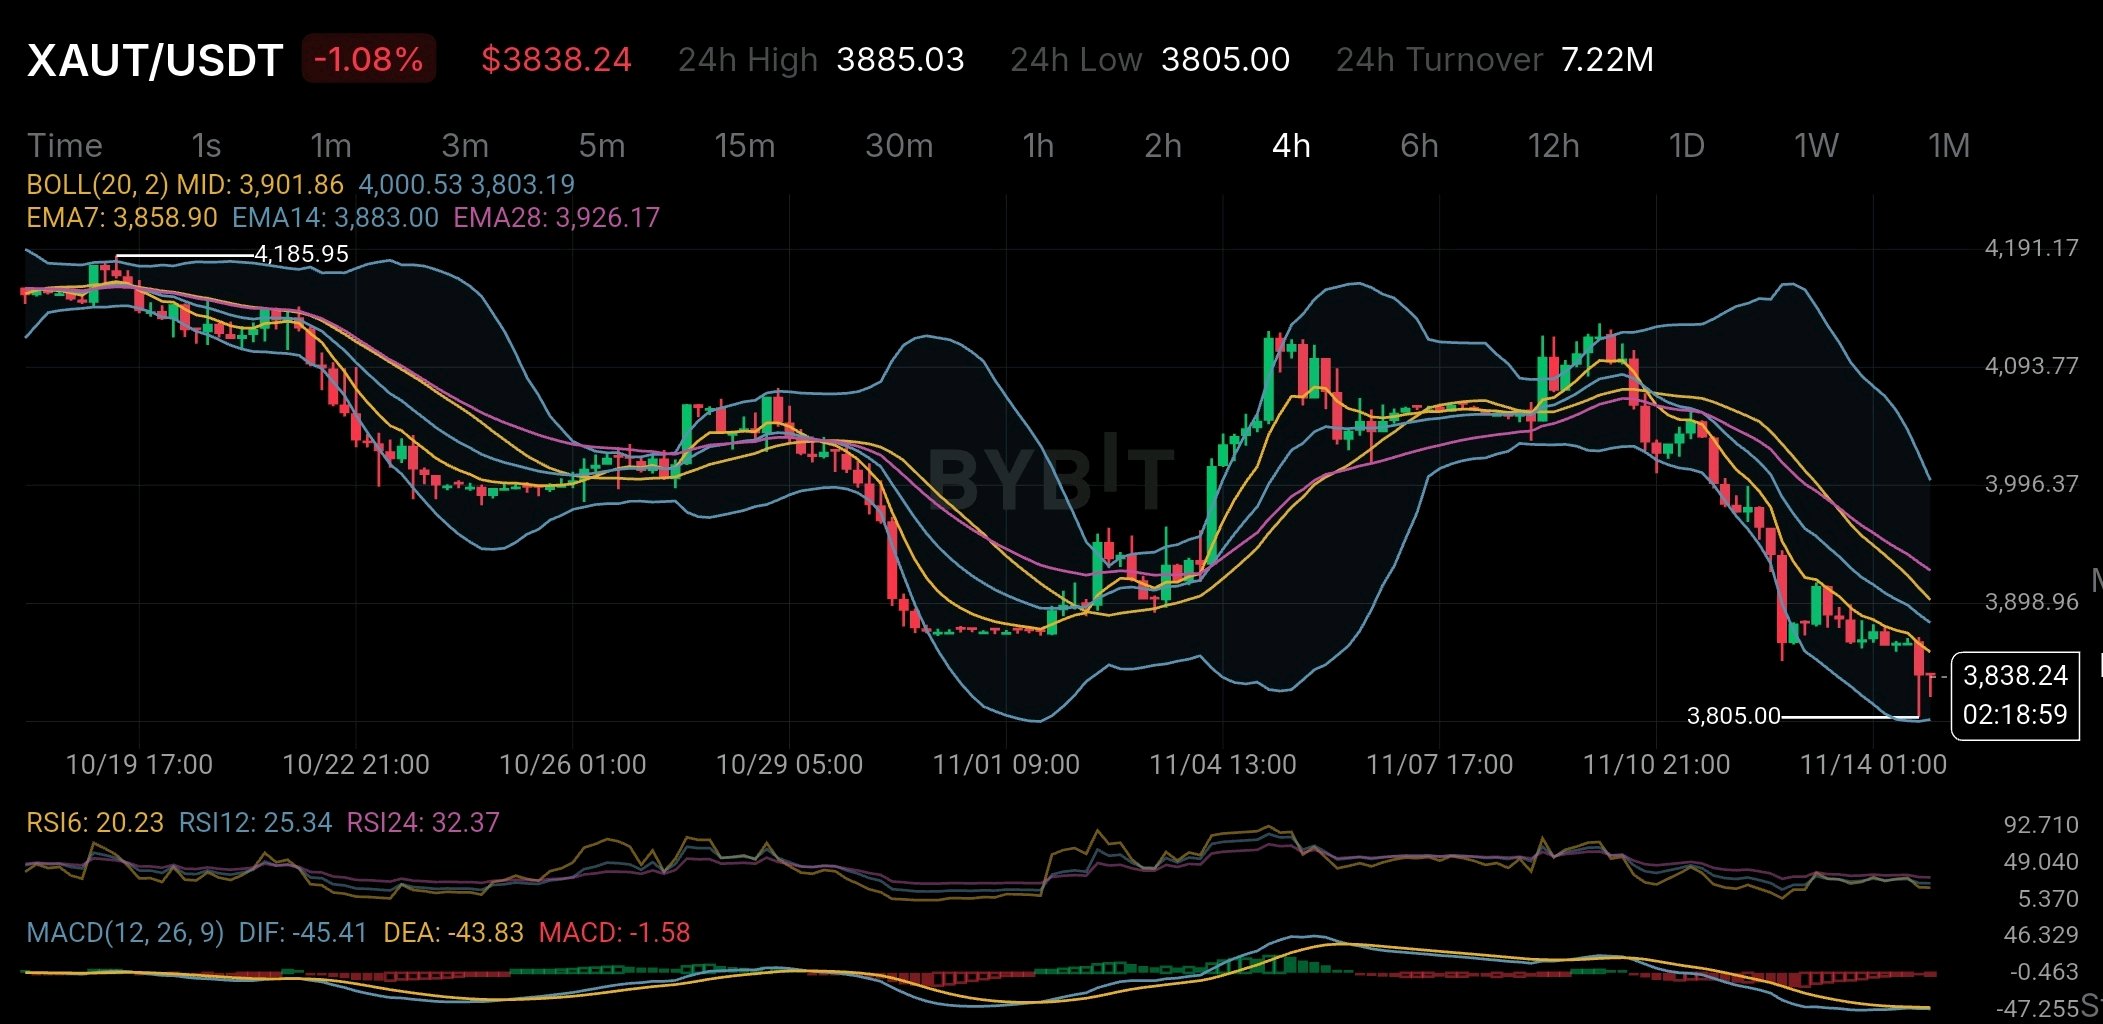
One thing I find interesting about XAUT is that its gold backing isn't the only thing investors should be looking at. I've been studying Tether Gold and there's a detail in its reserve figures that caught my attention. According to the September 30 2026 reserve report Tether had minted 827417.63 XAUT backed by the same amount of physical gold in fine troy ounces. But here's something worth looking at. Out of those tokens 709323.66 had already been sold while 118093.97 were held by a related entity and listed as available for sale. That's roughly 14.3% of the minted supply. I don't see this as an immediate red flag because those tokens are also covered by the reported gold reserves. Still I think it's important to understand the difference between total minted supply and the amount already circulating in buyers' hands. There's also something else people don't always consider. Owning XAUT doesn't mean you can easily walk in and collect physical gold whenever you want. Redemption comes with KYC requirements fees and delivery arrangements in Switzerland. So there's a bit more to owning tokenized gold than simply holding a token in your wallet. Now looking at the 4H chart XAUT is trading around $3,838.24 and the short-term picture isn't looking very strong. Price is sitting below EMA7 at $3,858.90 EMA14 at $3,883 and EMA28 at $3,926.17. RSI6 is around 20.23 which shows heavy selling pressure while MACD is still negative. The $3,805 level is the support I'm keeping an eye on. If buyers step in around this area we could see some recovery. But I don't want to call it a trend reversal until price starts moving back above the EMAs. Personally I still find XAUT an interesting way to get gold exposure through blockchain. But I wouldn't look at gold backing alone when evaluating it. Supply liquidity and the actual process of redeeming physical gold matter just as much. That's the part I think investors should pay more attention to. $XAUTUSDT #ByXIMPACT

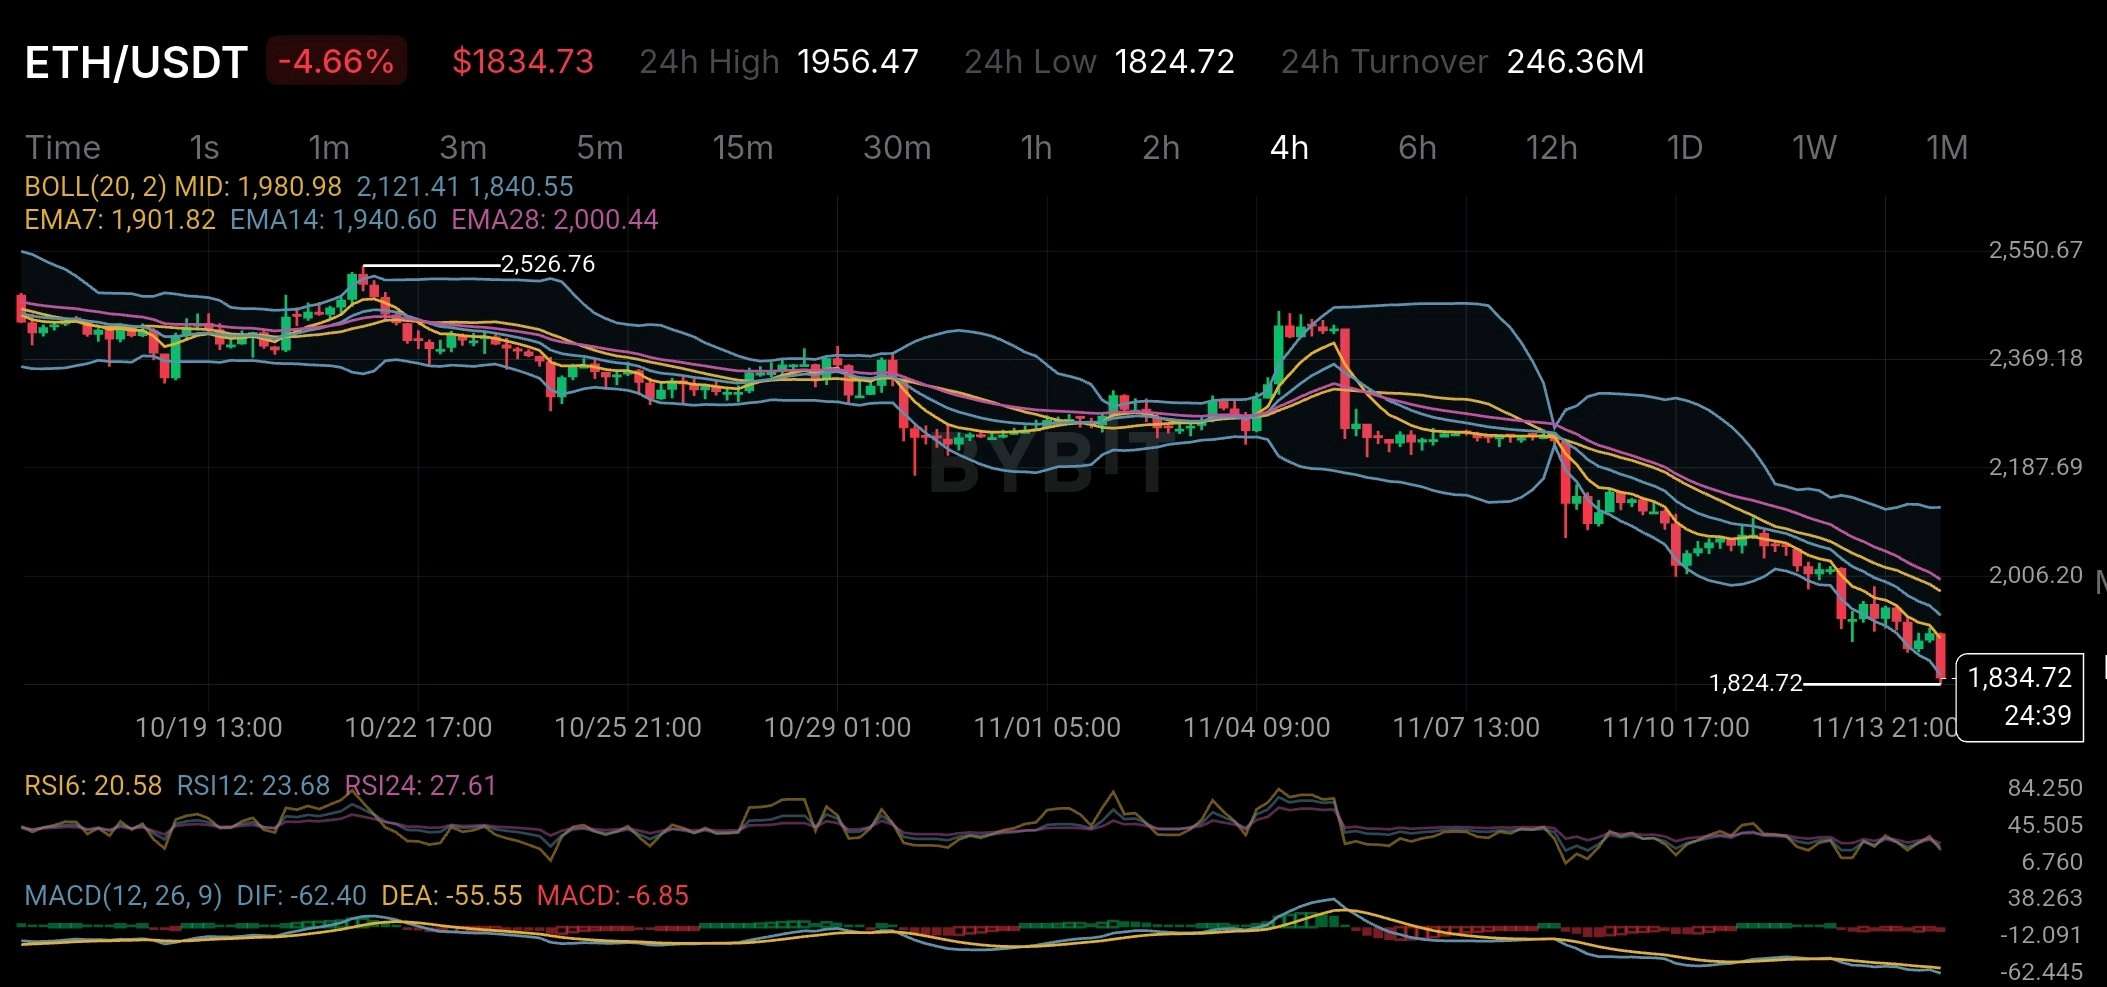
Ethereum is looking seriously oversold on the 4-hour chart. But there is something traders should be careful about before calling a bottom. ETH is trading around $1,834 and the overall trend is still pointing down. Look at the moving averages. EMA 7 is at $1,901 while EMA 14 sits at $1,940 and EMA 28 is around $2,000. Price is below all three. This shows that sellers are still in control and the market hasn't given us a clear sign of a trend reversal yet. But there is an interesting part of the chart. RSI 6 has dropped to 20.58 while RSI 12 is at 23.68 and RSI 24 is at 27.61. All three are below 30. That tells us selling has been quite aggressive. At these levels a short-term bounce wouldn't be surprising. However being oversold doesn't mean price has to reverse immediately. The MACD is also still negative. DIF is at -62.40 while DEA is at -55.55. So for now momentum is still weak. There is another side of Ethereum that deserves attention. ETH is often described as a deflationary asset because transaction fees are burned through the EIP-1559 mechanism. But that doesn't mean its supply is always shrinking. According to the latest available figures for November 14 approximately 89,721 ETH was issued over the previous 30 days while only 2,934 ETH was burned. This resulted in net issuance of around 86,787 ETH. That's an important difference. Ethereum burns ETH when users pay base fees. But when network activity is low fewer fees are burned while validator rewards continue adding new ETH to circulation. This means Ethereum's deflationary story depends heavily on network demand. A growing ecosystem doesn't automatically make ETH deflationary. Looking back at the chart ETH is also trading close to the lower Bollinger Band around $1,840. The recent low of $1,824.72 is another level worth watching. A move above $1,901 could be the first sign of improving momentum. Beyond that $1,940 to $2,000 remains an important resistance zone. For now I'm watching both price action and supply dynamics. ETH may be oversold but the bigger question is whether buying demand can return strongly enough to change the trend. $ETHUSDT #ByXIMPACT

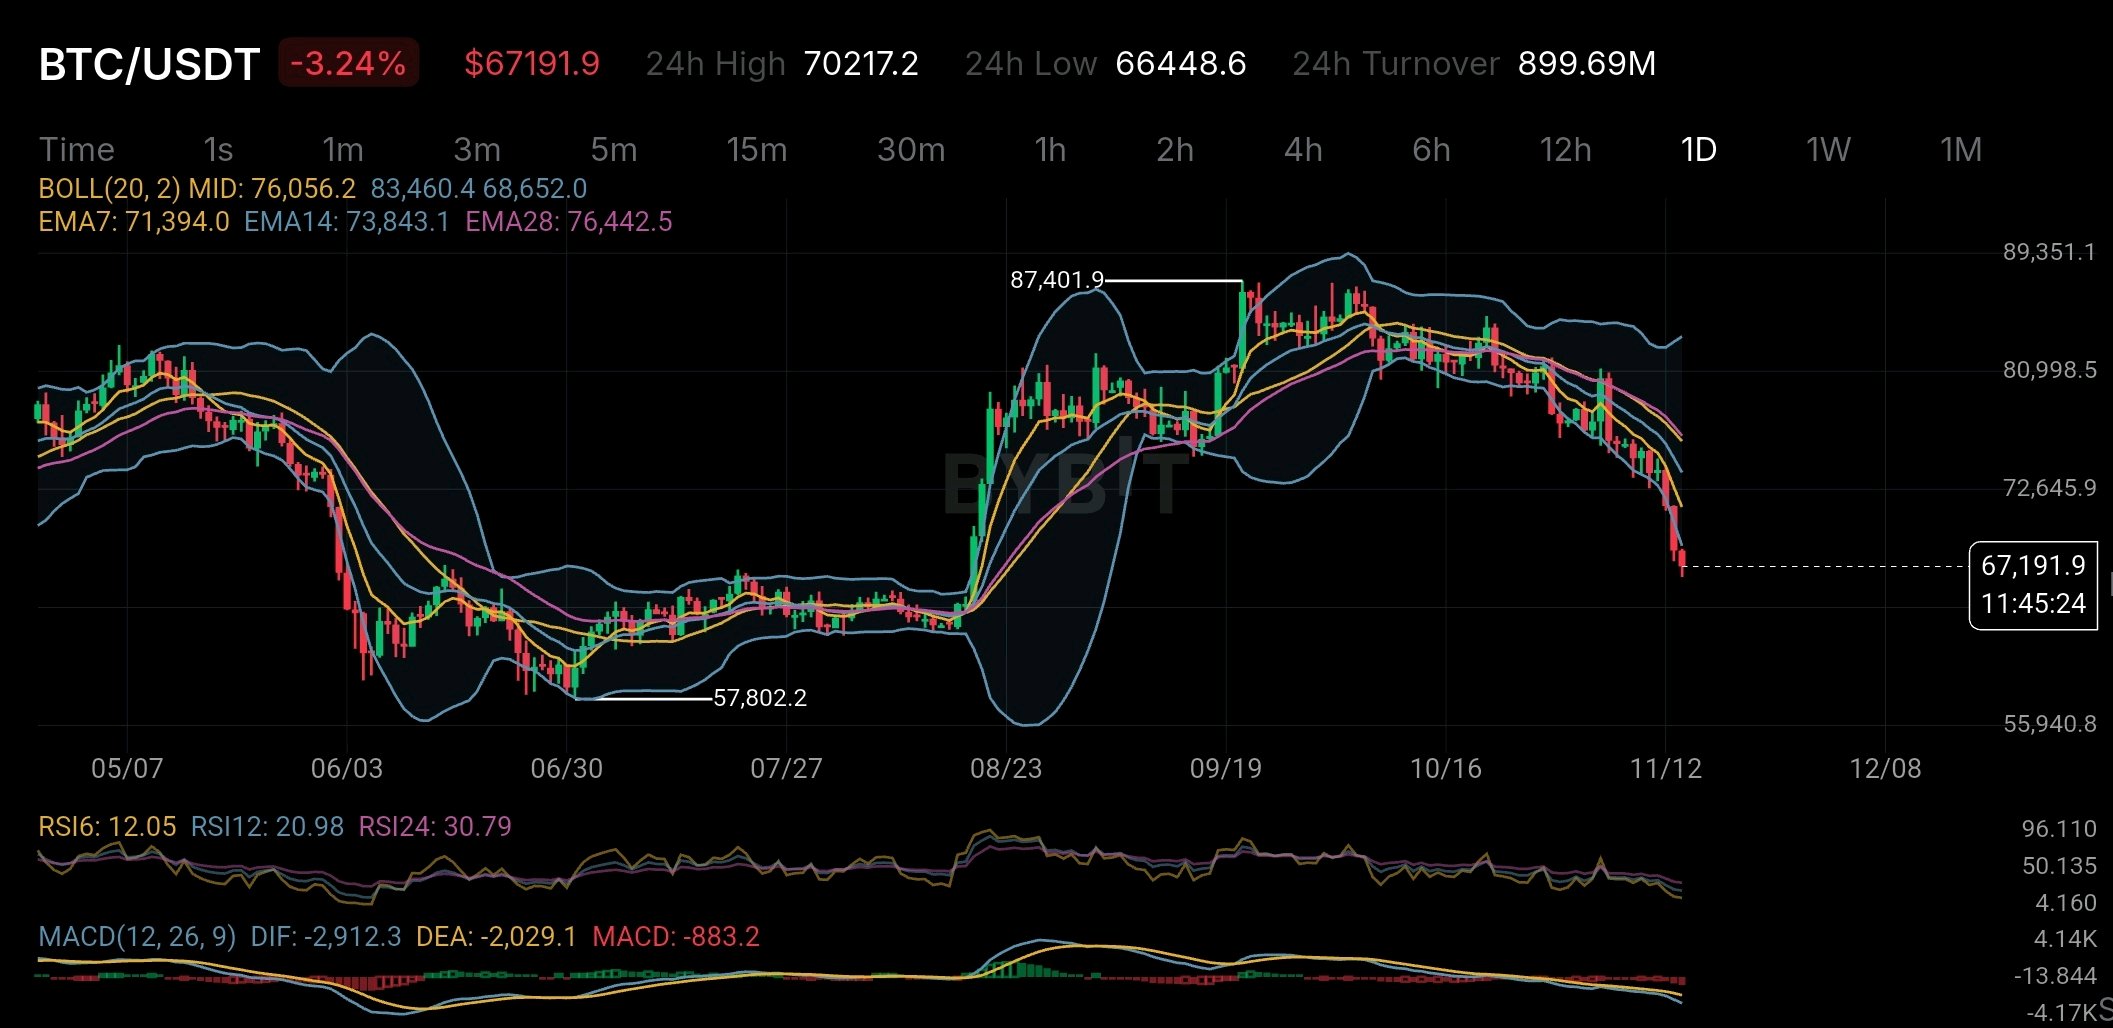
Bitcoin is now deeply oversold but that doesn't necessarily mean the bottom is in. BTC is trading around $67,191 down more than 3% on the day. What caught my attention isn't just the price drop. It's how weak the daily indicators have become. The RSI readings are unusually low. RSI(6) is sitting at 12.05 RSI(12) at 20.98 and RSI(24) at 30.79. These levels suggest that sellers have been in control for quite some time. But here's where things get interesting. Many traders see an oversold RSI and immediately start looking for a buying opportunity. The problem is that oversold conditions can last much longer than expected especially when the broader trend is still pointing down. And Bitcoin's current chart isn't showing much strength. The price is trading below all three exponential moving averages: EMA7: $71,394 EMA14: $73,843 EMA28: $76,442 This tells us that short- medium- and longer-term momentum are all under pressure. The MACD isn't offering much comfort either. Both the DIF and DEA remain in negative territory while the histogram is also negative. Another important level to watch is the Bollinger Band midpoint around $76,056. BTC is trading considerably below it showing just how far price has moved away from its recent average. Still I wouldn't rule out a relief bounce. When selling becomes this aggressive short-term recoveries are possible. But a bounce alone doesn't mean the trend has changed. The recent low around $66,448 is worth watching. If buyers manage to defend this area BTC could attempt a recovery. If that support fails further downside pressure cannot be ignored. For now I'm more interested in seeing buyers step in than trying to predict an exact bottom. One thing is clear: Bitcoin is deeply oversold but the overall trend remains weak. Sometimes the hardest part of trading isn't finding a good entry. It's knowing the difference between a falling market and a market that's finally ready to recover. $BTCUSDT #ByXIMPACT #WSOTShowYourAITradeToEarn10USDT #WSOT2026

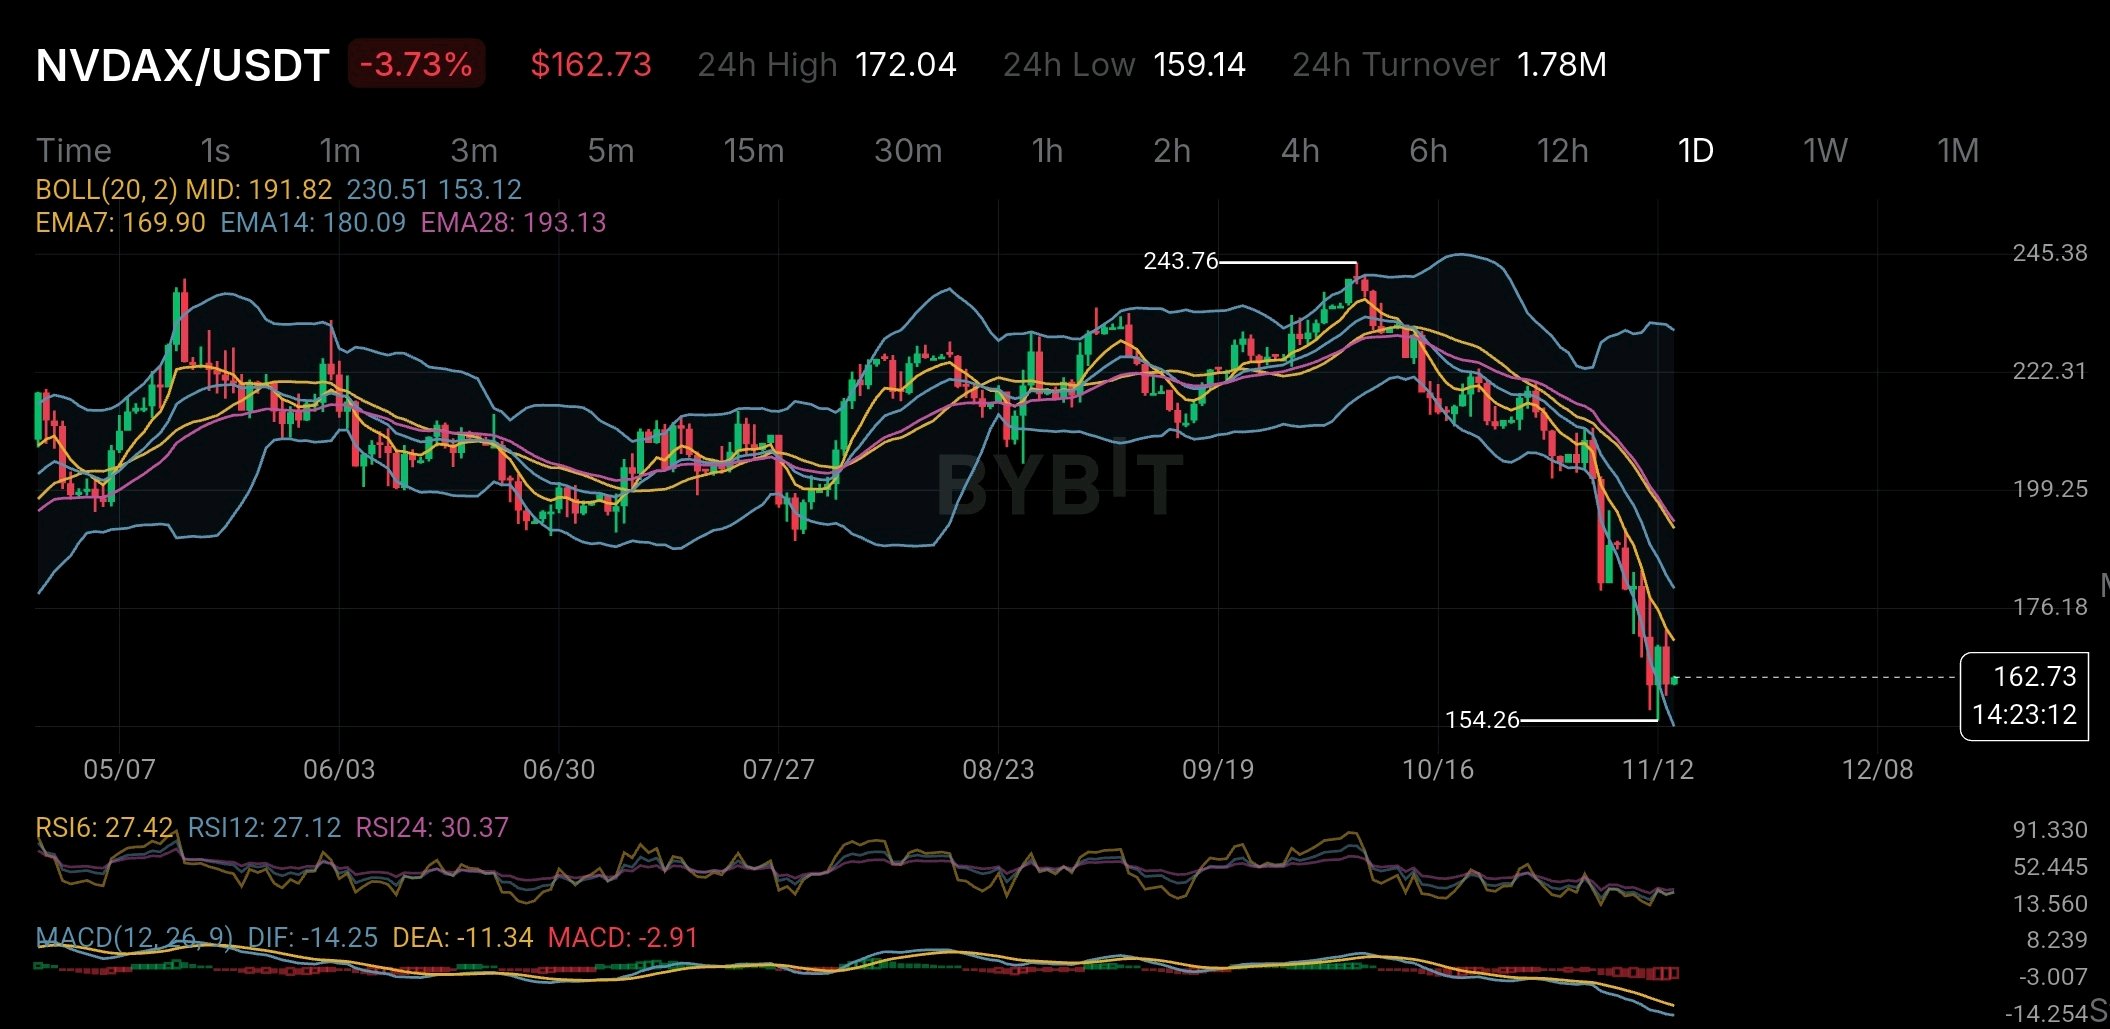
NVDAX is falling sharply but there is something about this token that many traders may not fully understand. At $162.73 NVDAX is down 3.73% on the daily chart. RSI6 is at 27.42 while RSI12 is at 27.12. Both readings show strong selling pressure. Price is also below all three major EMAs. EMA7 is at $169.90 EMA14 at $180.09 and EMA28 at $193.13. The chart looks weak. But the bigger story is not just about the price. NVDAX is a tokenized version of NVIDIA stock issued through Backed Finance. It is designed to follow NVIDIA's share price and is intended to be backed 1:1 by actual NVIDIA shares held in custody. Sounds simple. But there is an important difference. Buying NVDAX does not mean you own NVIDIA shares. According to Bybit's official xStocks terms holders do not receive shareholder voting rights or direct ownership of the company. They also do not receive dividends directly. Any dividend value may instead be reflected through an adjustment to the token's multiplier. There is another detail worth understanding. Bybit provides the trading platform but it does not issue or hold the underlying shares. The tokens are issued and redeemed by Backed Finance. Bybit also clearly states that it does not guarantee redemption liquidity or fair market pricing. It also says it does not independently verify or monitor the underlying collateral. This creates an important difference between owning a traditional NVIDIA share and holding NVDAX. You get exposure to NVIDIA's price through a blockchain-based token but you also take on issuer and custody risks. Now look at the chart again. NVDAX has fallen close to its recent low of $154.26. The price is also near the lower Bollinger Band at $153.12. A short-term bounce is possible but the negative MACD and downward EMA structure suggest that sellers are still in control. The $154 area is worth watching. A break below it could bring more selling pressure while a recovery above $170 would be an early sign of improving momentum. NVDAX offers an interesting way to access traditional stocks through crypto markets. But investors should remember one thing: Getting exposure to a company's share price and actually owning its shares are two very different things. $NVDAXUSDT #ByXIMPACT

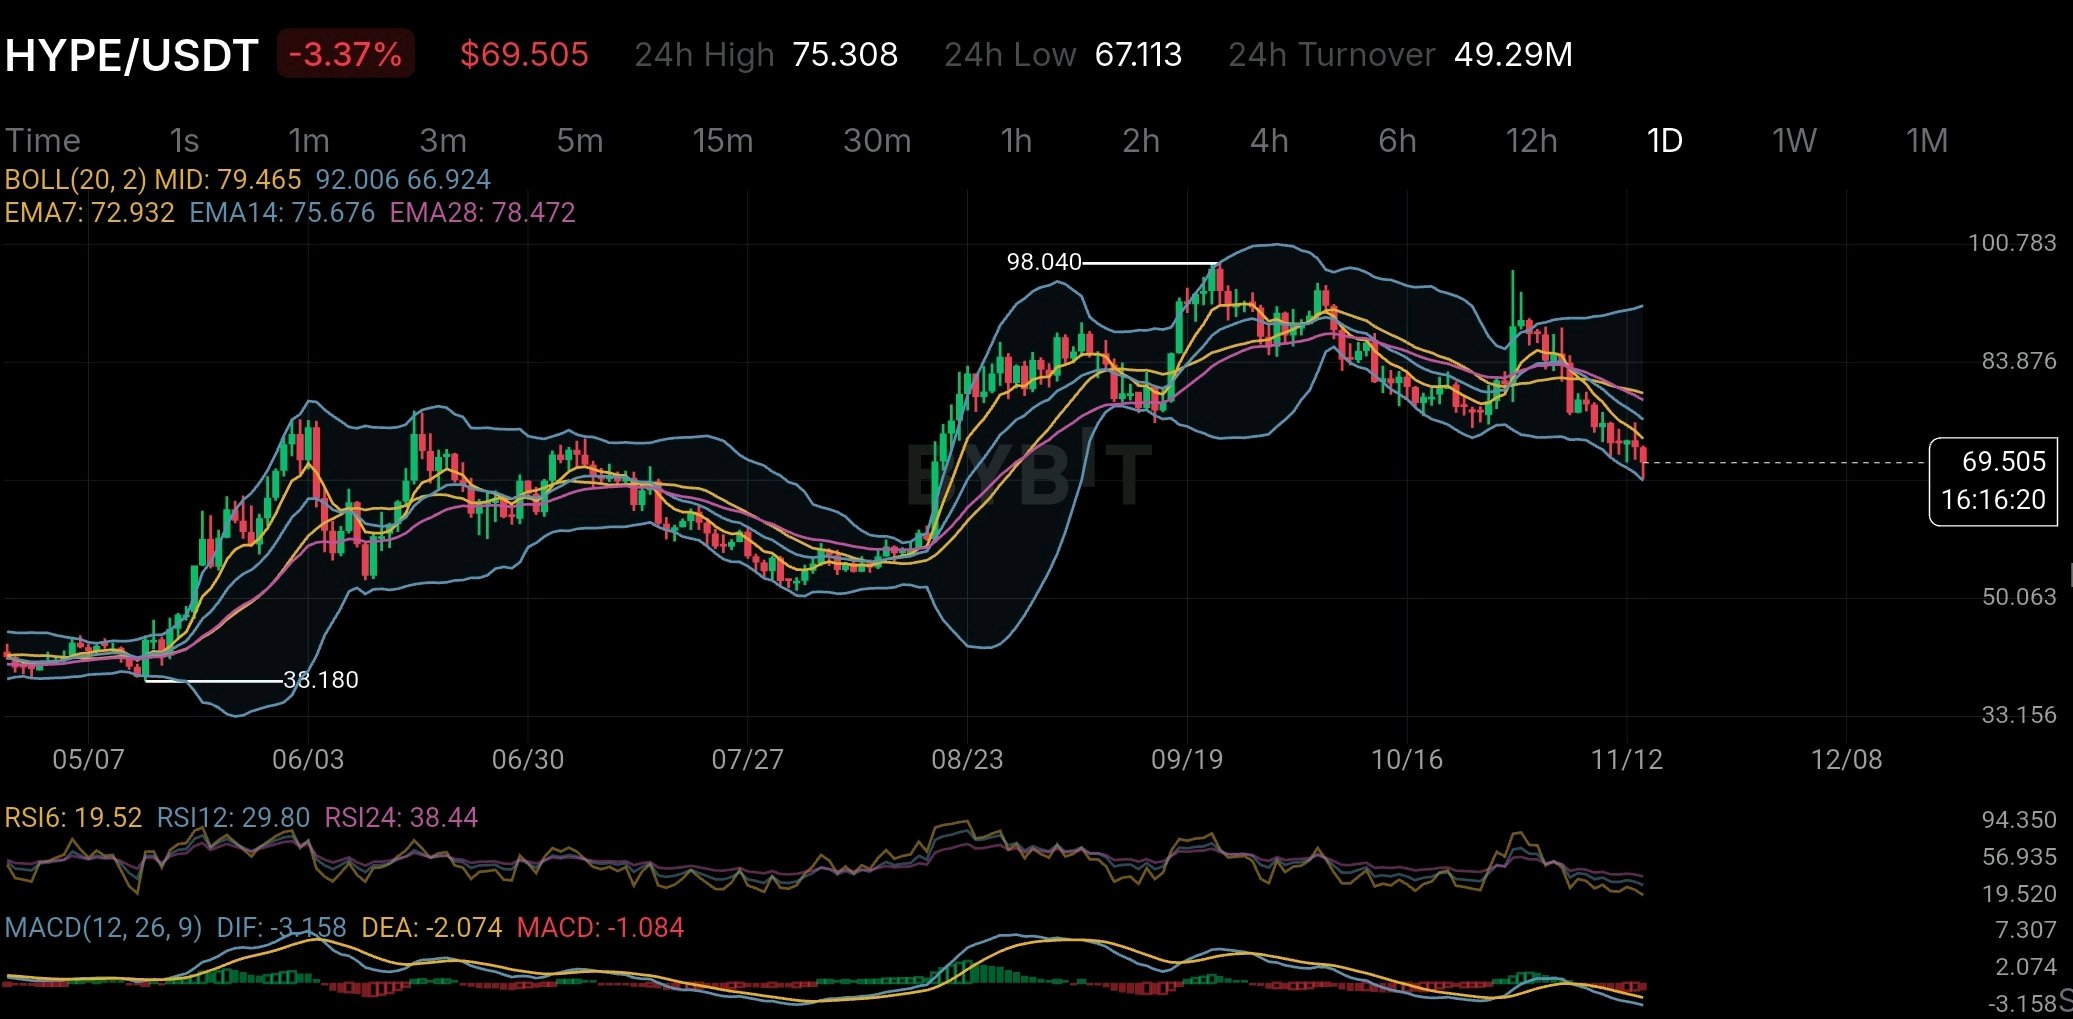
HYPE has already removed nearly 50 million tokens from circulation through its buyback mechanism. Yet there is another supply factor that investors should not ignore. The real question is whether HYPE's token burns can keep pace with the supply that has yet to enter the market. Hyperliquid has one of the more interesting token economics models in the crypto market. According to its November 2026 investor disclosures approximately 99% of protocol fees are directed toward the Assistance Fund. That fund purchases HYPE directly from the open market and permanently removes acquired tokens from circulation. The disclosed buybacks had reached approximately 48.3 million HYPE by October 28 2026. That is a meaningful amount. It creates a direct connection between trading activity and token demand. When the exchange generates more fees the mechanism has more capital available to purchase HYPE. But here is the part that deserves more attention. HYPE originally had a maximum supply of 1 billion tokens. Even after accounting for approximately 50 million tokens removed through buybacks and network fee burns the remaining supply structure still contains substantial future distribution. The November disclosures show approximately 410 million HYPE allocated to future emissions and community rewards and another 61 million allocated to the Hyper Foundation. There are also 238 million tokens allocated to core contributors. This creates an interesting contradiction. HYPE has a genuine mechanism that creates recurring market demand and reduces available supply. However the long-term supply picture cannot be understood by looking at burns alone. The pace of future emissions matters just as much. If protocol revenue continues growing the buyback mechanism could become an important structural advantage. But if emissions and unlocked allocations grow faster than actual demand the positive effect of those purchases could become less significant. The chart is also showing a different side of the story. HYPE is trading around $69.50 on the daily timeframe after falling from the September high near $98. Price is below EMA 7 at $72.93 EMA 14 at $75.67 and EMA 28 at $78.47. Daily RSI 6 is near 19.52 which indicates heavily oversold short-term momentum. That makes the current weakness interesting but it does not confirm a reversal. Sellers still have control of the visible trend. For me the most important metric to watch is not simply how many HYPE tokens get burned. It is whether real protocol revenue can consistently absorb the supply entering circulation. A strong buyback mechanism can support a token's economics but sustainable demand must eventually do more than compensate for new supply. That is the real test for HYPE. Sources: Hyperliquid Strategies November 5 2026 disclosures and HYPE daily chart provided. $HYPEUSDT #ByXIMPACT

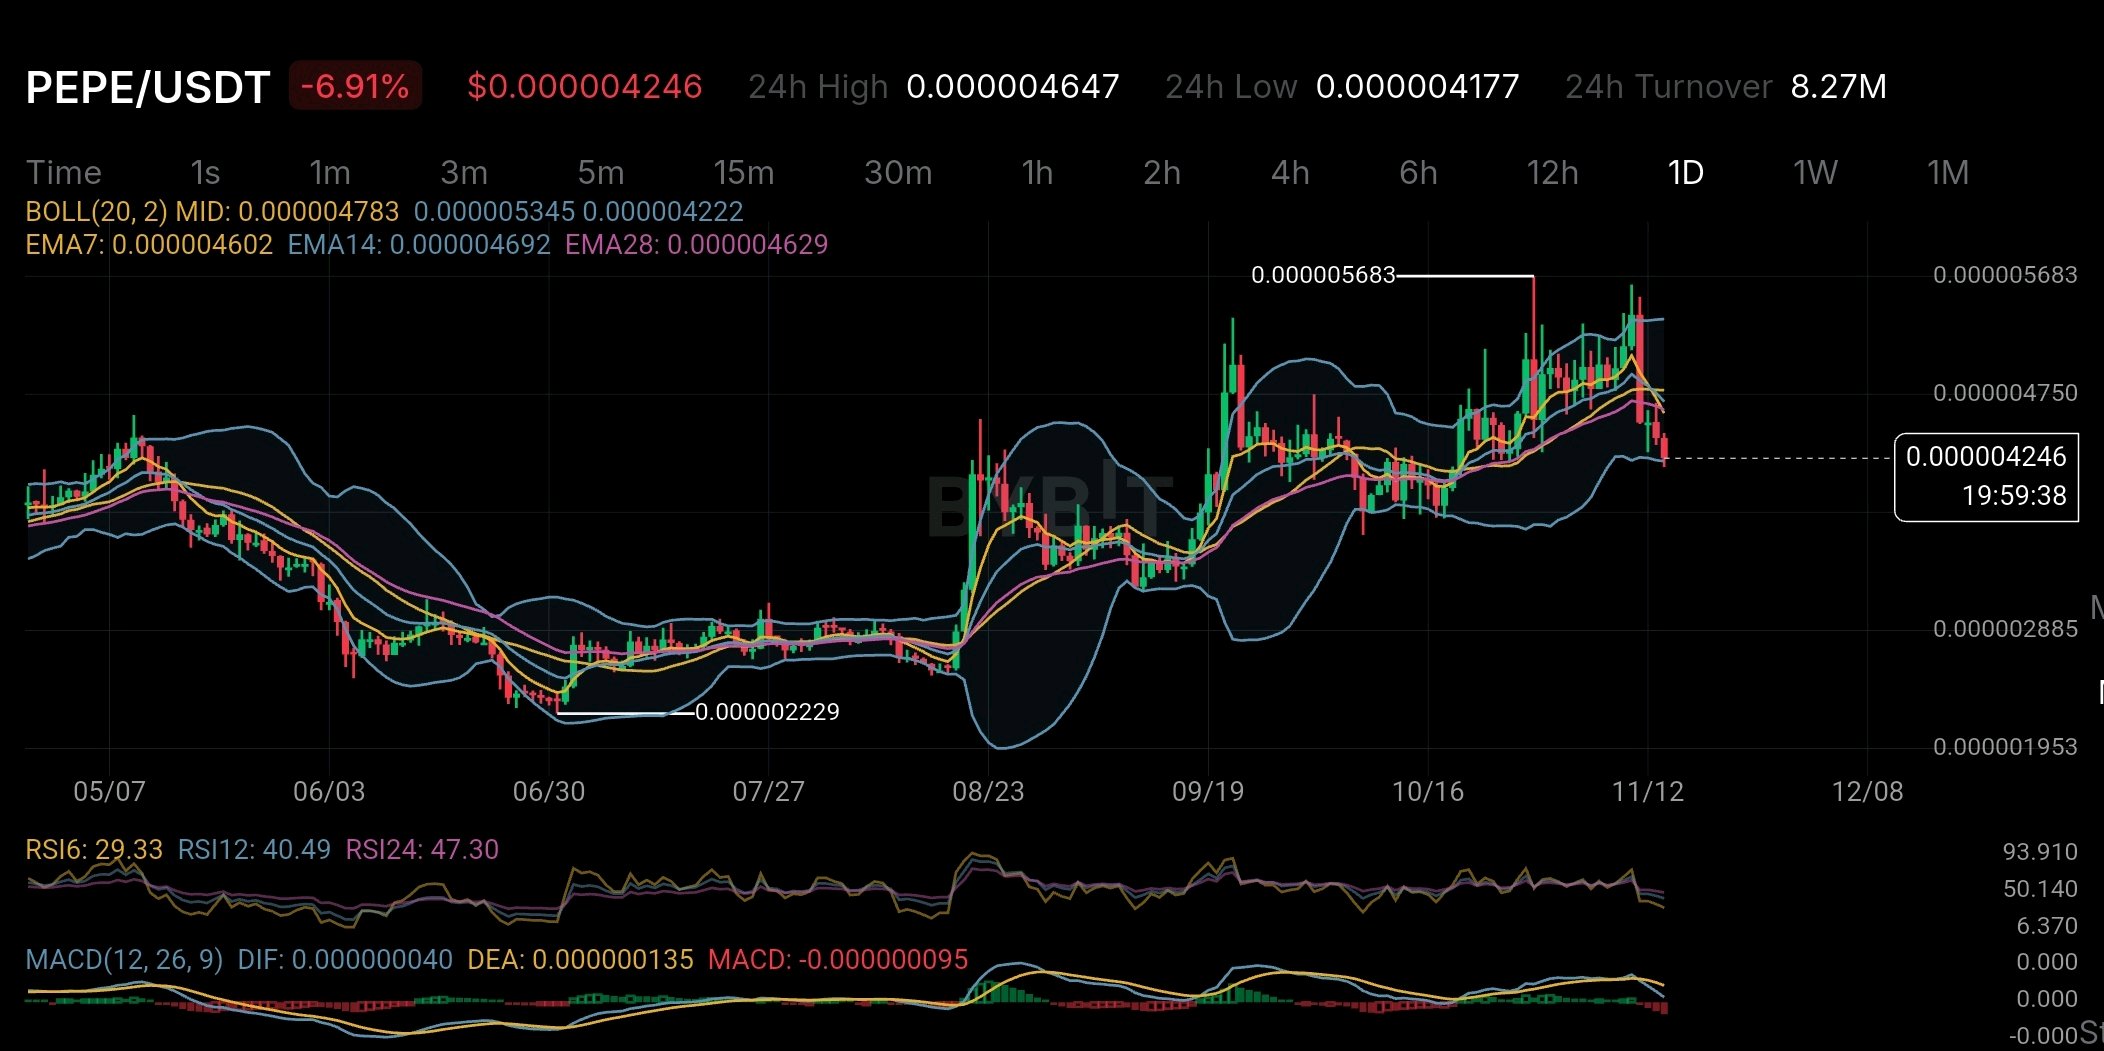
PEPE has almost no scheduled unlock pressure left but that doesn't mean its supply is completely free from selling risk. There is an important detail hidden in its distribution history that deserves more attention. According to Canary Capital's April 2026 SEC filing PEPE has no formal vesting or unlock schedule with approximately 98.4% of its original supply already circulating as of January 2026. Sounds positive right? But here is the interesting part: the same filing reports that the 10 largest wallet addresses held around 41% of circulating supply. Interestingly 11 of the top 15 addresses belonged to exchanges meaning raw wallet concentration does not necessarily represent 15 giant individual holders. Still unknown ownership across multiple wallets remains a genuine risk. Now look at the daily chart. PEPE is trading around $0.000004246 down 6.91%. Price has slipped below EMA7 EMA14 and EMA28 while RSI6 sits near 29.33. MACD has also turned negative. This suggests selling pressure is currently stronger although the low RSI leaves room for a short-term relief bounce. The key distinction is that PEPE doesn't face a traditional vesting-unlock calendar but concentrated holdings and sentiment-driven demand can still create serious selling pressure. For PEPE the bigger question isn't just how many tokens are unlocked. It's who controls the supply that can actually reach the market. $PEPEUSDT #ByXIMPACT

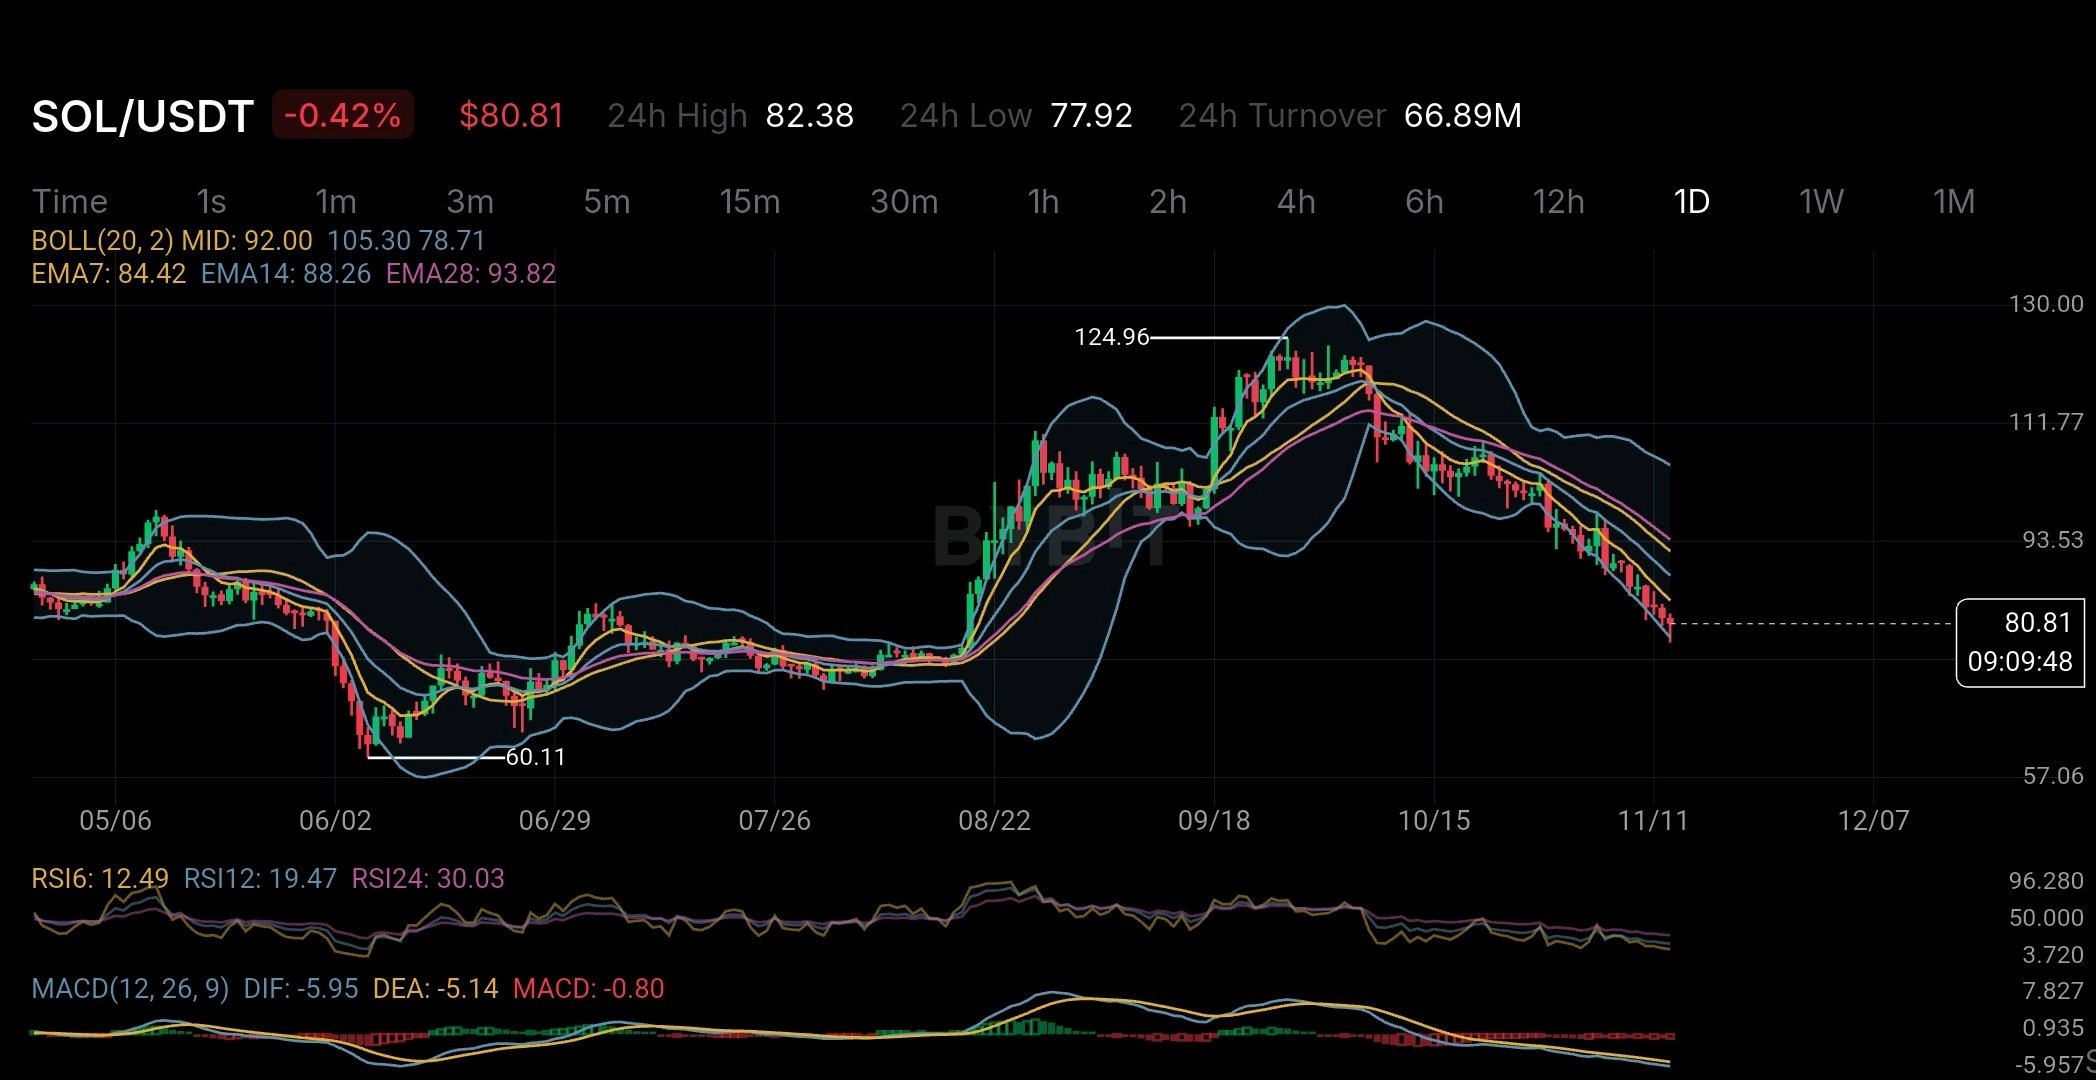
SOL looks oversold right now but there is something bigger happening behind its price that investors should understand. At around $80.81 SOL's daily RSI has dropped to 12.49. This is a very low level. The price is also below all three major EMAs: EMA7 at $84.42 EMA14 at $88.26 and EMA28 at $93.82. A price bounce could happen soon. But being oversold does not mean the bottom is confirmed. One thing that makes Solana interesting is how its token supply works. Unlike projects that release large amounts of tokens at certain times SOL adds new tokens regularly through staking rewards. These rewards help validators keep the network running and secure. Solana started with an 8% yearly inflation rate. This rate was planned to decrease by 15% every year until it reached 1.5%. But something important has changed. In August 2026 Solana approved SGP-0002. This change increases the yearly reduction in inflation from 15% to 30%. The aim is to reach the 1.5% inflation target around 2029 instead of 2032. This is good news for long-term holders because fewer new SOL tokens will enter the market over time. But there is another side to the story. Blockworks' Q3 2026 research reported that around 441.3 million SOL was staked. Staking rewards were worth approximately $495 million during the quarter. Almost all of these rewards came from newly created tokens rather than transaction fees. This is something investors should pay attention to. Staking rewards may look like free money but they are not. When new SOL enters the market it can reduce the value of existing holders' share if they are not staking. Even people who stake need to understand how much of their reward is simply covering this effect. Now let's look at the chart again. SOL is getting close to the $78–80 area. Its lower Bollinger Band is around $78.71. RSI shows that selling pressure is very high. However the downward EMAs and negative MACD show that the overall trend is still weak. A recovery is possible but the indicators have not confirmed a trend change yet. For Solana reducing inflation is a good step. But the real challenge is to bring in more users and generate more fee income so the network does not have to depend so much on creating new tokens. A blockchain becomes stronger when people use it because it provides real value not just because it gives them rewards. $SOLUSDT #ByXIMPACT

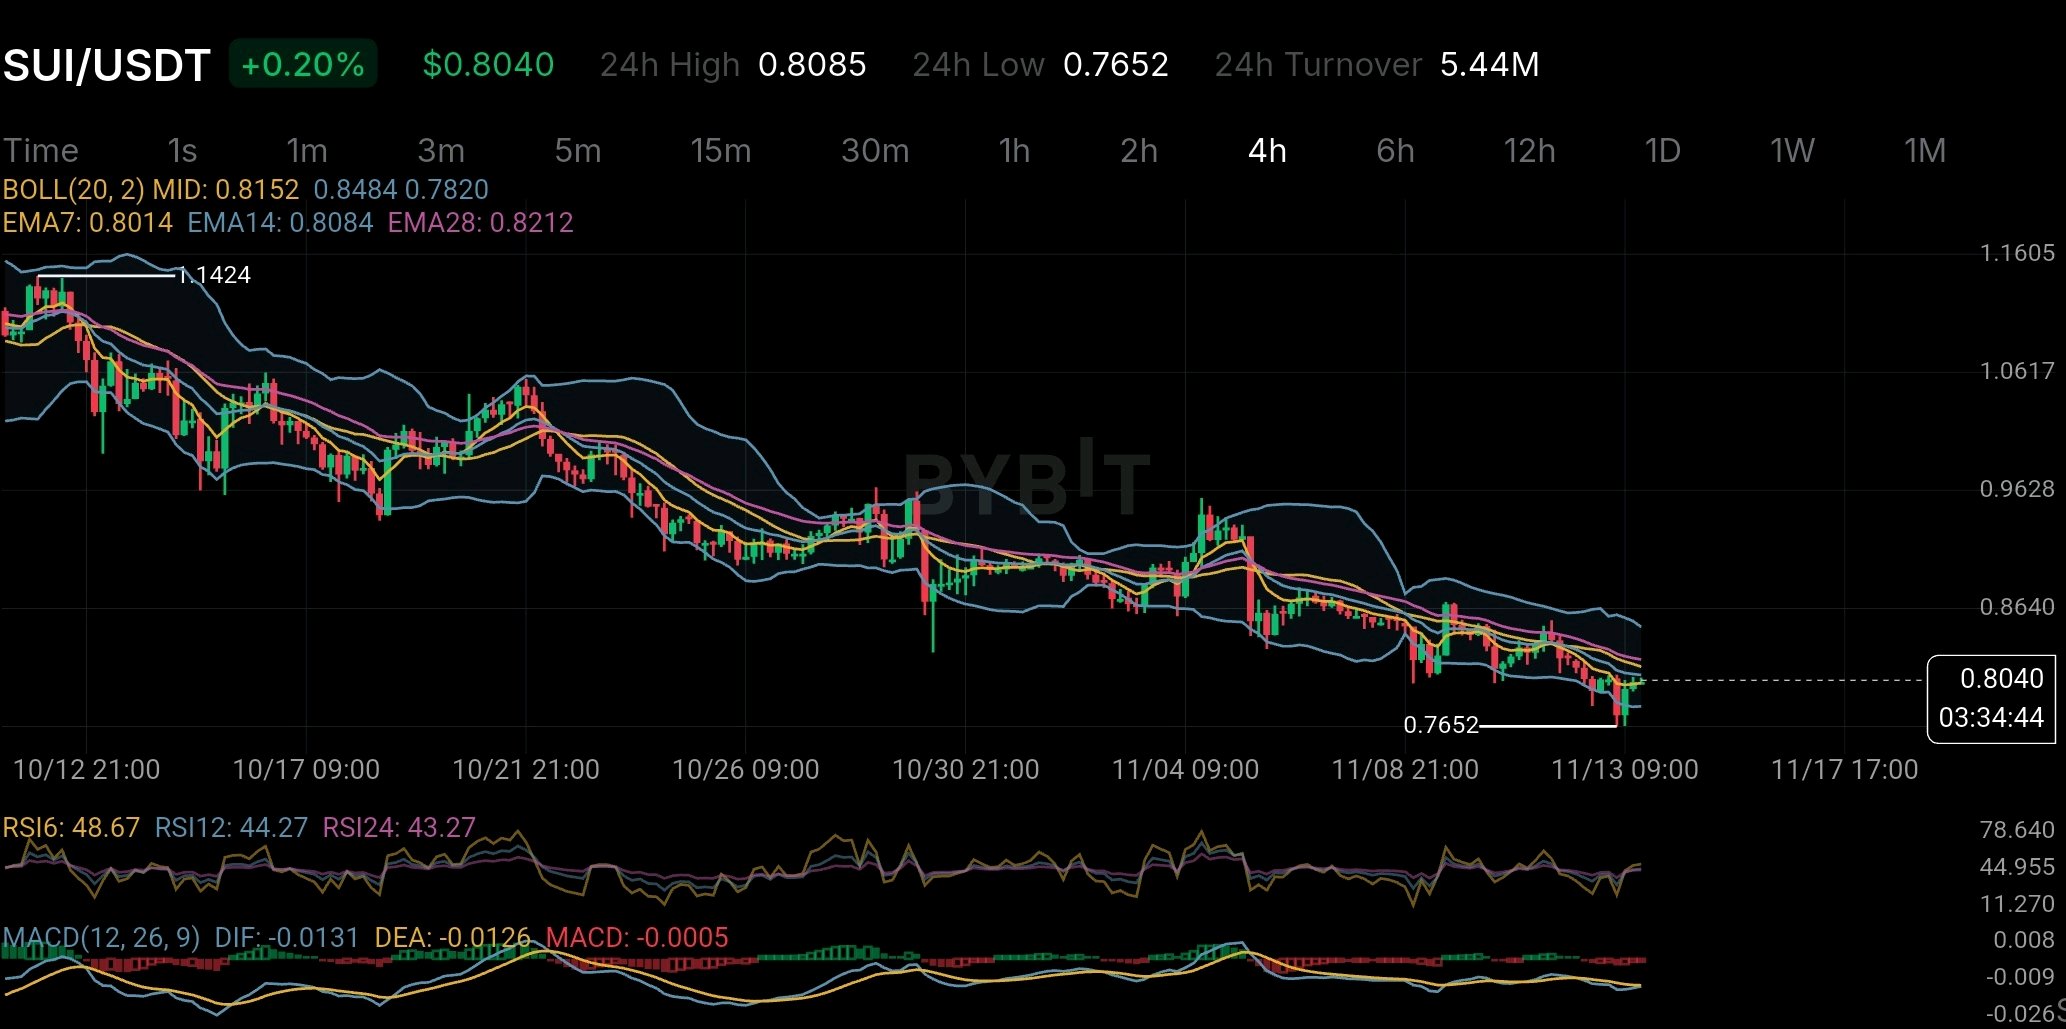
Sui is processing nearly 60 million transactions a day yet its network fees tell a surprisingly different story. That contrast deserves more attention than another discussion about SUI's price. According to DefiLlama's November 13 data Sui recorded approximately 59.43 million transactions in 24 hours while generating just $2,668 in chain fees. Meanwhile applications across the ecosystem generated around $142,283 in fees. The distinction matters. Sui's architecture is designed for high-throughput low-cost transactions. That is a genuine competitive advantage for applications requiring frequent on-chain activity. But transaction volume alone doesn't establish economic value. The bigger question is how much of that activity creates sustainable demand for SUI itself. The token is required for gas staking and governance but network usage does not automatically translate into proportional token value capture. The chart adds another concern. At $0.8040 SUI remains below its 14-period and 28-period EMAs on the 4H timeframe. RSI is recovering toward neutral but MACD remains slightly negative. So there are two separate things to watch: whether network activity becomes economically meaningful and whether buyers can reclaim the declining moving averages. Sui may be winning the throughput argument. The longer-term test is whether that success translates into stronger economic demand for its native token. $SUIUSDT #IMPACTbyTrade

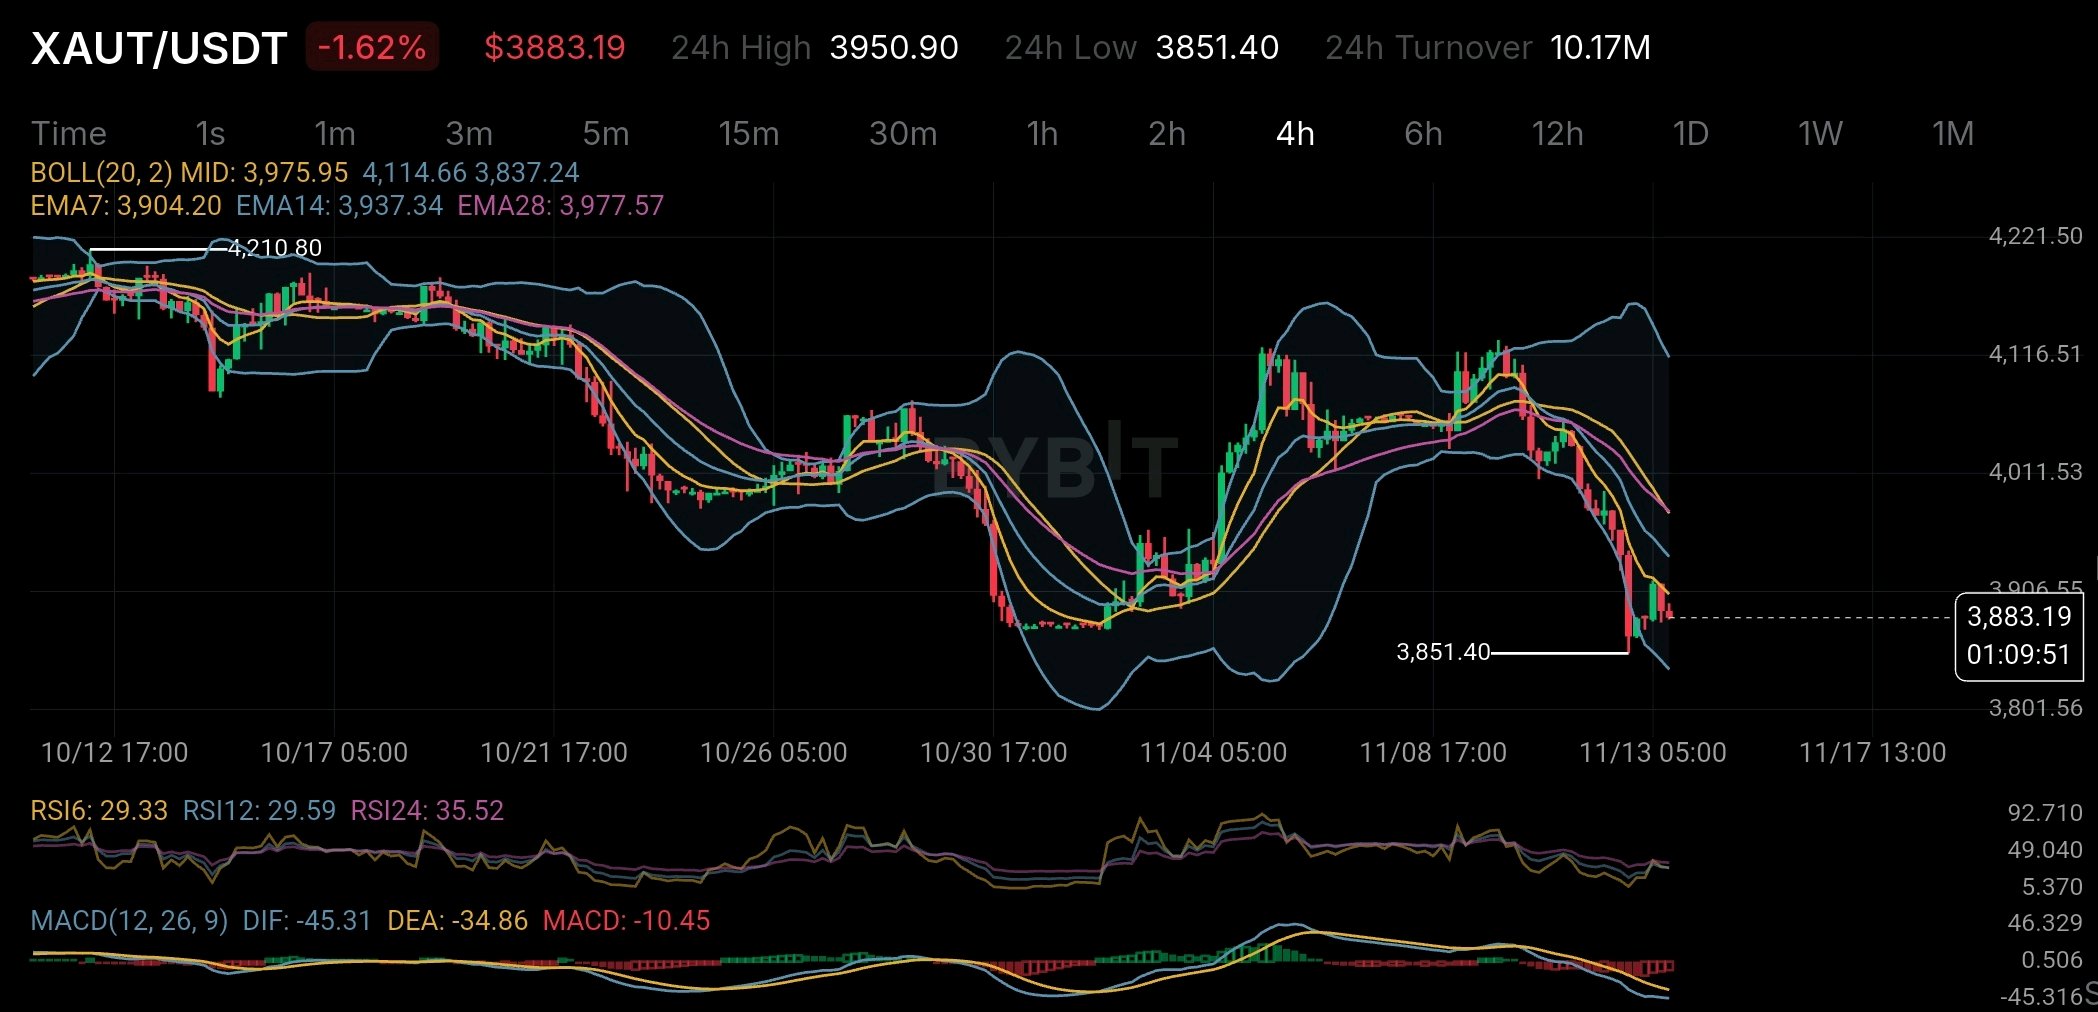
I've been looking at XAUT, and one thing caught my attention beyond the recent price action. Tether Gold's September 30, 2026 reserve report showed 827,417.63 XAUT backed by exactly 827,417.63 fine troy ounces of physical gold. That looks straightforward, but there's another detail worth watching. Out of the total minted supply, 709,323.66 XAUT had been sold, while 118,093.97 tokens were still available for sale through Alpha Group Commodities, a related entity. That's roughly 14.3% of the minted supply. I'm not saying this means selling pressure is coming. But I do think it's something holders should keep in mind. Available supply matters, especially when demand starts changing. On the verification side, KPMG recently completed an independent audit of the issuer's 2025 financial statements, while BDO's September 2026 reserve assurance confirmed the gold backing at that reporting date. Now, looking at the 4H chart, things aren't particularly strong. XAUT is trading around $3,883, below all three EMAs: EMA7, EMA14 and EMA28. RSI is hovering near 29, and MACD remains negative. Momentum is clearly bearish for now. The RSI suggests oversold conditions, but that alone isn't enough to call a reversal. Personally, I'd be watching two things: how gold demand develops and whether the available XAUT supply becomes a factor. Having physical gold behind a token is one thing. Understanding the supply dynamics behind it is another. That's what I think deserves more attention. $XAUTUSDT #IMPACTbyTrade

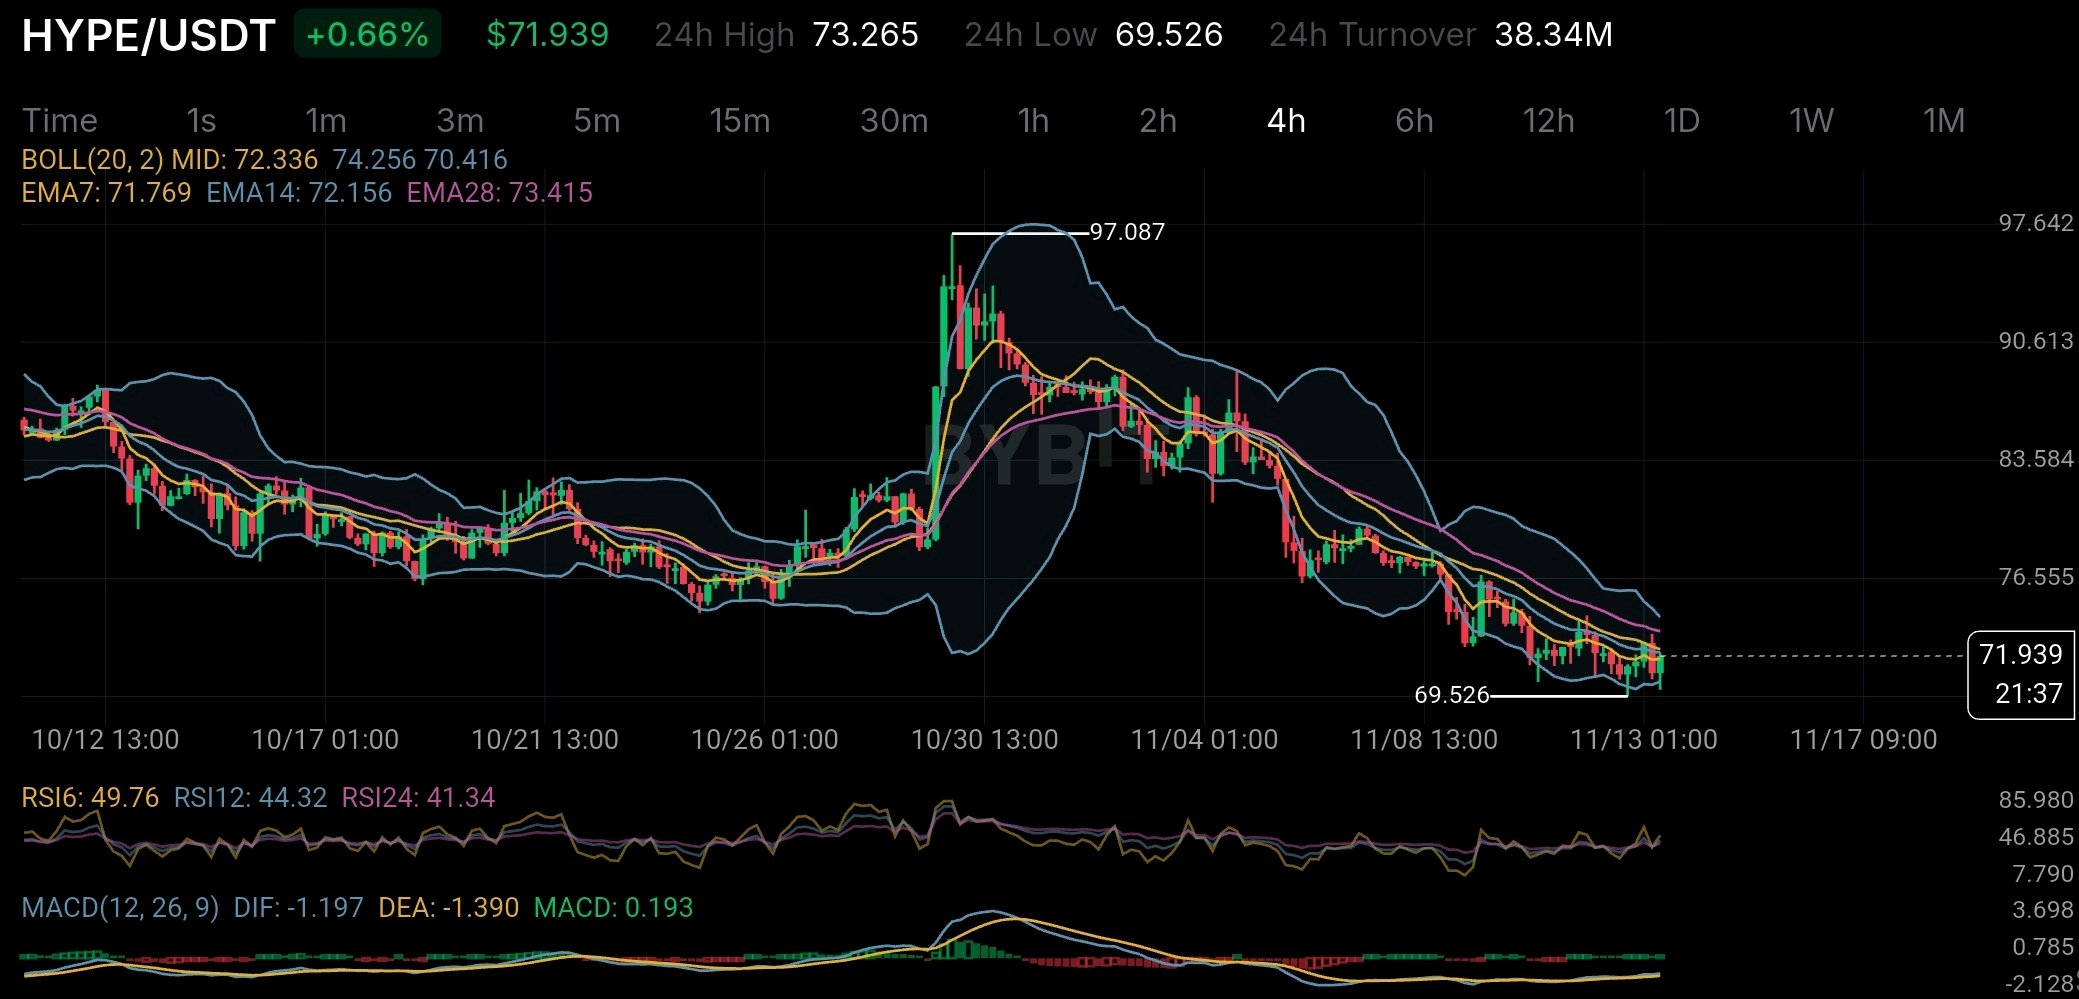
One thing I find interesting about HYPE is that its buyback and burn mechanism is actually tied to the activity happening on Hyperliquid. But there's another side of this story that I think traders shouldn't ignore. According to Hyperliquid's September 2026 SEC filing 99% of protocol fees go to the Assistance Fund which uses those funds to buy HYPE from the open market. By September 8 around 47.1 million HYPE had been permanently burned. That's roughly 4.7% of the original 1 billion supply. That's a meaningful amount and it creates a direct link between platform activity and demand for the token. More trading activity means more fees which can lead to more HYPE purchases and burns. Sounds positive right? There's just one thing worth keeping in mind. HYPE has a maximum supply of 1 billion tokens. Around 38.9% is allocated to future community emissions and rewards while another 23.8% goes to core contributors. So while the burn mechanism helps reduce supply it doesn't mean selling pressure will simply disappear. New tokens and future emissions still matter. Looking at the 4-hour chart HYPE is trading around $71.94 still below EMA14 at $72.16 and EMA28 at $73.42. The Bollinger midline is also sitting around $72.34. The recent low at $69.526 is the level I'm watching for support. There are a couple of encouraging signs. RSI is starting to recover and the MACD histogram has turned slightly positive. Selling pressure may be easing but I'm not ready to call this a trend reversal yet. My trade setup: I'm watching the $72.3–$73.4 zone for a possible bullish breakout. I would prefer to see a solid 4H candle close above this area before considering a long entry. If the breakout holds and price successfully retests this zone then $76.55 is my first upside level to watch followed by $83.58. On the other hand $69.526 is the key support. A breakdown below this level would invalidate my bullish recovery setup and make me reconsider the trade. I don't want to chase a green candle here. Confirmation matters more than trying to catch the exact bottom. Long term I think the real question is simple: can Hyperliquid generate enough economic activity to keep buyback demand ahead of new supply entering the market? Because burning tokens is one thing. Maintaining demand while emissions continue is a completely different challenge. That's what I'll be watching with HYPE. Not just the burn numbers but whether the actual business activity can support the token over time. $HYPEUSDT #IMPACTbyTrade

Bitcoin is facing a combination that deserves more attention than an oversold RSI: aggressive long liquidations and weakening institutional demand. Looking at the BTC/USDT 4-hour chart, the selling pressure is difficult to ignore. BTC is trading around $68,823, down 6.66%, after touching $67,563. The price has broken below the lower Bollinger Band at $69,738, while EMA 7, EMA 14 and EMA 28 are all sitting above the market. But the technical picture is only half the story. According to available derivatives data, Bitcoin experienced roughly $352 million in liquidations over 24 hours, with approximately $346 million coming from long positions. That's a massive imbalance. It suggests leveraged buyers were caught on the wrong side, and forced selling likely accelerated the decline. There's another detail worth watching: institutional flows. US spot Bitcoin ETFs recorded six consecutive days of net outflows through November 12, totaling approximately $1.49 billion. When leveraged traders are being forced out while ETF investors are withdrawing capital, the market loses two potential sources of buying support simultaneously. This is why I wouldn't treat an extremely low RSI as an automatic buying signal. The 4-hour RSI readings are particularly stretched: RSI 6 is 5.54, RSI 12 is 15.01 and RSI 24 is 24.78. A relief bounce wouldn't be surprising, but oversold conditions can persist during strong downtrends. For me, $67,563 is the immediate level to watch. A sustained breakdown could expose BTC to another leg of selling. On the recovery side, $70,900 and $72,100 are important EMA resistance areas. Reclaiming them would be an early sign that sellers are losing control. The bigger question is whether fresh spot demand returns after this liquidation wave. Bitcoin doesn't necessarily need more leveraged buyers right now. It needs buyers willing to absorb actual selling pressure. An oversold market can produce a bounce. But only sustained demand can build a recovery. $BTCUSDT #IMPACTbyTrade

ONDO is approaching a supply event that I think the market needs to pay more attention to. The next major token unlock is scheduled for January 18, 2027, and the amount involved is pretty significant. According to Tokenomics.com, around 1.71 billion ONDO tokens are expected to enter circulation on that date. That's 17.1% of the maximum supply and an estimated 35.1% of the current market cap. Here's what caught my attention: only around 48.7% of ONDO's 10 billion maximum supply is currently circulating. The rest is still subject to the vesting schedule. But there's more to this than just another token unlock. The upcoming distribution is allocated roughly 46.3% to the community, 38.6% to the foundation and 15.1% to private investors. That breakdown matters because unlocked tokens don't automatically mean selling pressure. Some could go toward ecosystem development, while others might eventually find their way onto exchanges. I also think there's something investors should understand about ONDO itself. According to its official documentation, ONDO is mainly a governance token for the Ondo DAO and Flux Finance. Being part of a growing real-world asset sector doesn't automatically mean token holders own the underlying tokenized assets or receive their yields. Now, looking at the chart, ONDO is trading around $0.3327 on the supplied 4-hour timeframe, down 6.75%. Price is below EMA7, EMA14 and EMA28, while RSI6 is around 16.72. That's deeply oversold in the short term, but it doesn't necessarily mean a reversal is coming. The overall structure is still showing lower highs and lower lows. There's another thing worth watching: derivatives activity is considerably higher than spot activity. CoinGlass reported roughly 3.8 times more futures volume than spot volume on November 13, alongside heavy long liquidations. My concern isn't that ONDO lacks a strong RWA narrative. It's whether demand for the token can keep up with the growing circulating supply while the market is already under pressure. An oversold RSI can lead to a bounce, but it doesn't fix a supply imbalance. For me, the real test isn't just whether buyers can defend $0.33. It's whether genuine demand can keep pace with the tokens entering circulation. $ONDOUSDT #IMPACTbyTrade