Goma Goma
7023Like0Shares211Fans85Follow
crypto analyst
crypto analyst
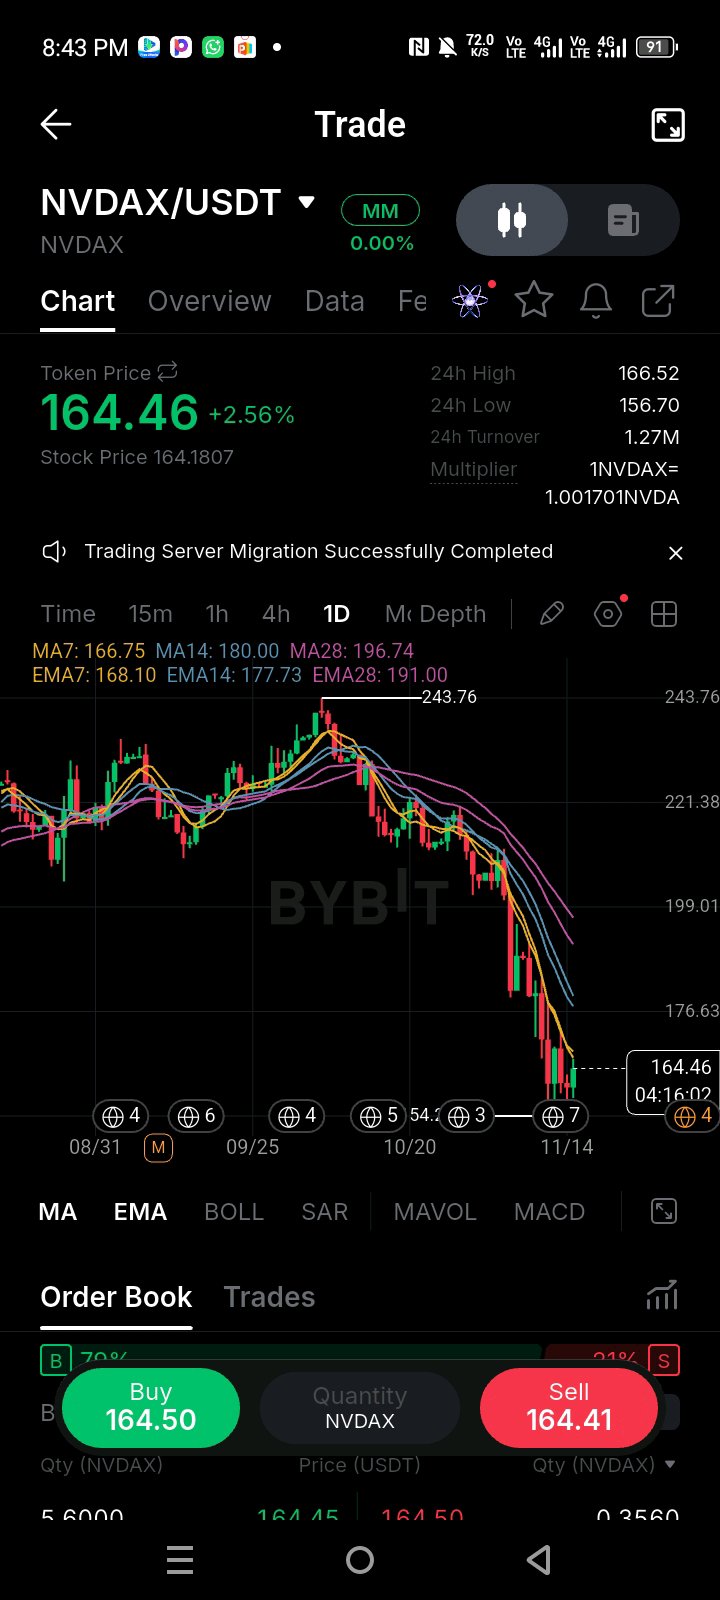
$NVDAXUSDT is trying to find a base after that brutal drop from 243, but the daily chart is flashing a warning sign. What caught my attention is the current price action: we are bouncing to 164.46, but we are running straight into the 7 EMA at 166.75. Look at the order book—there’s 70% buy pressure, yet the price is stalling. That’s a classic sign of absorption. My read here is that this is a weak relief bounce inside a heavy downtrend. The price is completely trapped below the 14 and 28 EMAs, which are sloping down hard. The 70% buy wall might look bullish on paper, but if it can't push price through the 7 EMA, the sellers will eventually eat through it. Key Levels: Resistance: 166.75 (7 EMA), 177.73 (14 EMA) Support: 156.70 (recent daily low) My Trade Plan: Bias: SHORT (Conditional) Entry: $165.00 – $168.00 (Fading the bounce right into the 7 EMA) Confirmation: I want to see a rejection wick or a bearish engulfing candle on the 4H chart right at this 166 level. If buyers step in and close a daily candle above 170 with volume, I step aside. Invalidation: $177.50 (A clean daily break above the 14 EMA kills the immediate bearish momentum). TP1: $156.70 (Retest of the recent low) TP2: $145.00 (Next major liquidity void) R:R: ~1:2.4 based on the stated levels. Why I'm taking this setup: Bounces into the first moving average after a steep drop are often the safest short entries. The buy pressure is trapped, and the trend is still firmly down. Selling this resistance gives us a tight stop and a clear path back to the lows. What would change my mind? If price reclaims 170 and flips the 7 EMA into support, the short thesis is dead. I’d wait for a higher low to form and look for a reversal trade. Until then, the bounce is just a setup for the next leg down. Are you fading this bounce at the 7 EMA, or waiting to see if 156 holds for a spot entry? #ByXIMPACT #WSOT2026 $BTCUSDT
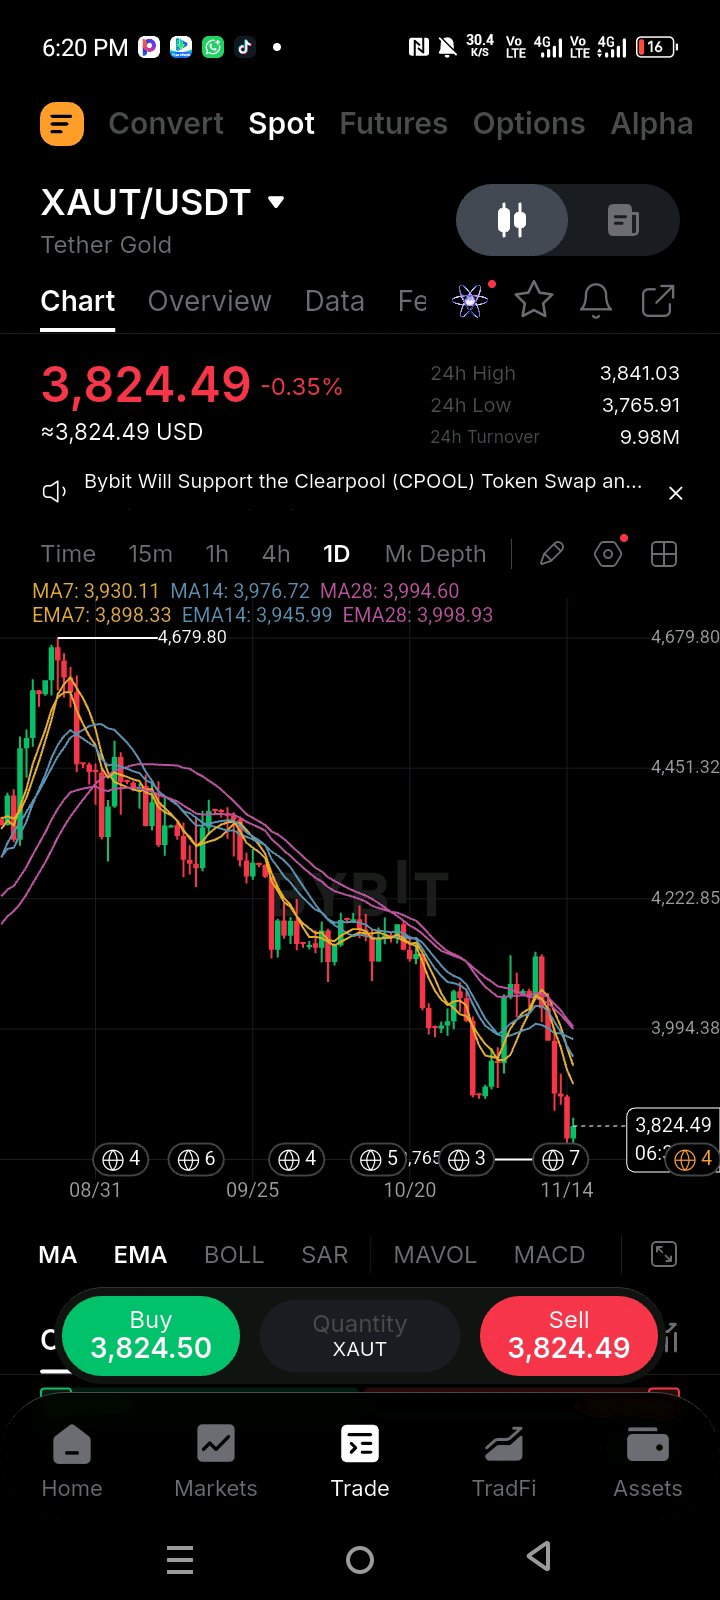
Gold is at 3,824, down about 18% from the 4,679.80 high, but the day's candle is what I'm watching. Price swept to 3,765.91, then recovered roughly 78% of the day's 75-point range. Every average is still overhead and falling: EMA7 at 3,898, MA7 at 3,930, EMA14 at 3,946 and MA14 at 3,977. Price is about 4.4% under the MA28. My read: a buyer showed up at the low, and that's all I can say so far. It isn't a trend change. A market this stretched under its averages often snaps back toward the nearest one, but then it usually rolls over again. I'm treating this as a short bounce trade, not a bottom call, and I'd size it small because it goes against the trend. Key Levels: Resistance: 3,841 (24h high), ~3,850 (former floor), 3,898 (EMA7), 3,930 (MA7) Support: 3,766 (24h low), 3,700 (round number) My Trade Plan: Bias: LONG (Conditional, countertrend) Entry: 3,800 – 3,830 (a dip that holds above the flush low) Confirmation: today's daily candle closes above 3,810, and the next dip holds above 3,790 with no new low Invalidation: 3,755 (a daily close below the flush low means the bounce failed) TP1: 3,898 TP2: 3,977 R:R: ~1:1.4 to TP1 and ~1:2.7 to TP2, based on a 3,815 entry. TP1 is mainly for de-risking, since this trade pays at TP2. Why I'm taking this setup: The risk is defined by a clear low, so my stop is only about 60 points away. The targets are averages the market already respects, so I'm not asking for a reversal, only a move back to the mean. If price loses 3,755 I'm out quickly and the loss is small. What would change my mind? A daily close under 3,755. Or a bounce that stalls below 3,850 and rolls over: then I'd stop looking for longs and go back to selling rallies into the 7-day average. Do you trade bounces inside a downtrend, or do you only trade once the trend actually turns? #ByXIMPACT #WSOT2026 $XAUTUSDT
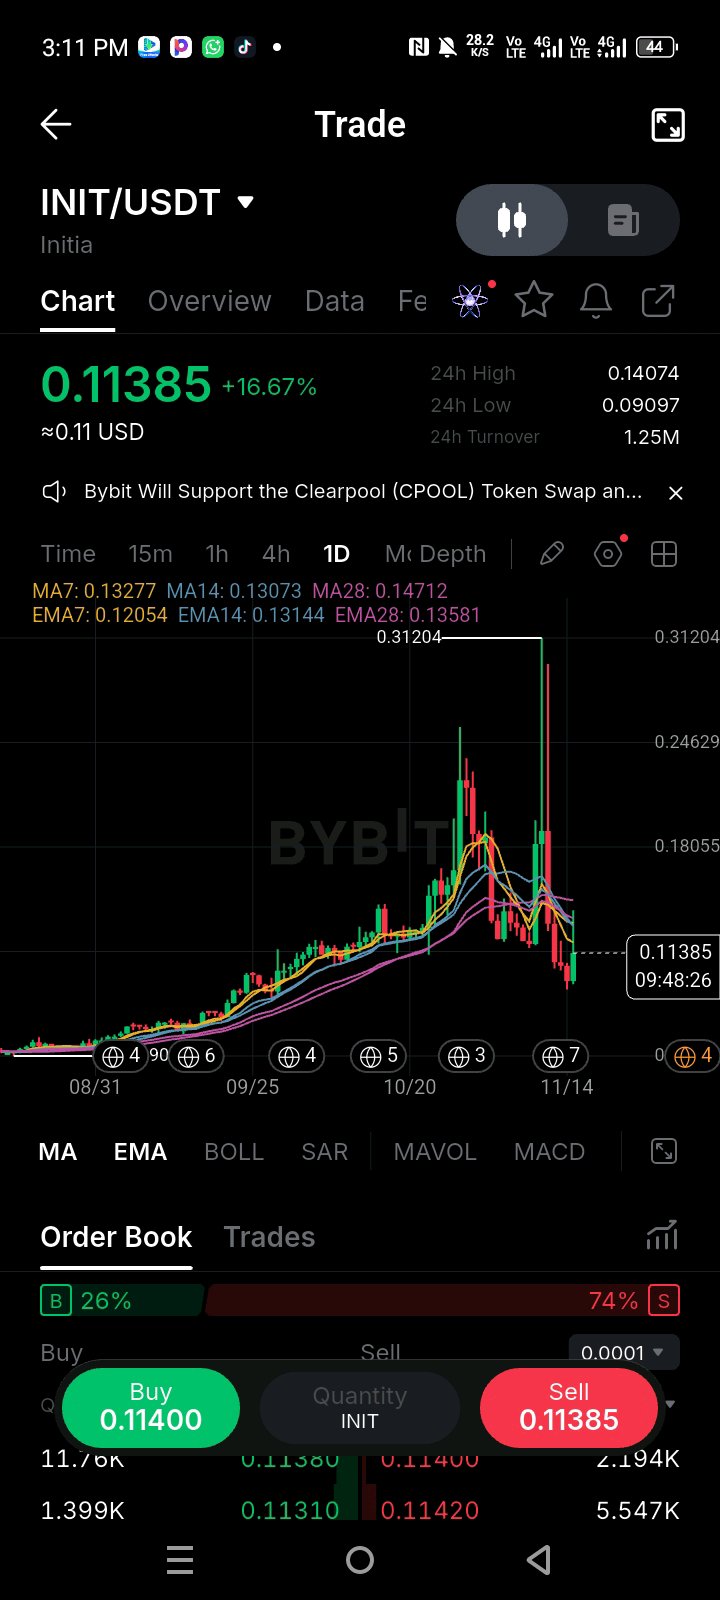
$INITUSDT just printed a massive fakeout, spiking to 0.3120 before completely collapsing back down to 0.1138. What caught my attention isn't just the 16% bounce today, but the sheer damage done to the chart structure. The order book is flashing a heavy 74% sell pressure, meaning the market is stacked against this bounce. My read here is that this is a classic pump-and-dump retracement. The price is currently trapped below the daily EMAs (the 14 EMA at 0.1314 is acting as immediate resistance), and the recent massive upper wick at the top proves sellers are aggressively defending higher prices. The short-term bounce looks like a dead-cat drop, and the overall structure remains extremely vulnerable. Key Levels: Resistance: 0.1314 (14 EMA), 0.1358 (28 EMA) Support: 0.0909 (the recent capitulation low) My Trade Plan: Bias: SHORT (Conditional) Entry: $0.1200 – $0.1280 (Looking for a weak rejection in this zone) Confirmation: I want to see the 4H chart print a lower high. If price pushes into 0.125 and gets slapped down with a bearish engulfing candle, I’m taking the short. Invalidation: $0.1350 (A clean daily close above the 28 EMA means the bears lost control). TP1: $0.1000 (Psychological level) TP2: $0.0909 (Retest of the recent low) R:R: ~1:2.3 based on the stated levels. Why I'm taking this setup: That massive wick to 0.31 followed by a brutal drop means a ton of late buyers are trapped underwater. Every bounce from here is likely to be met with heavy selling as those trapped traders look to break even. The 74% sell pressure in the order book confirms the bearish bias. What would change my mind? If price reclaims the 14 EMA (0.1314) with high volume and the buy side of the order book flips to green, I’m stepping aside. That would mean the market has absorbed the selling, and I’d wait for a new structure to form before shorting again. Are you shorting this bounce into the MAs, or waiting to see if 0.0909 gets swept before looking for a long? #ByXIMPACT #WSOT2026
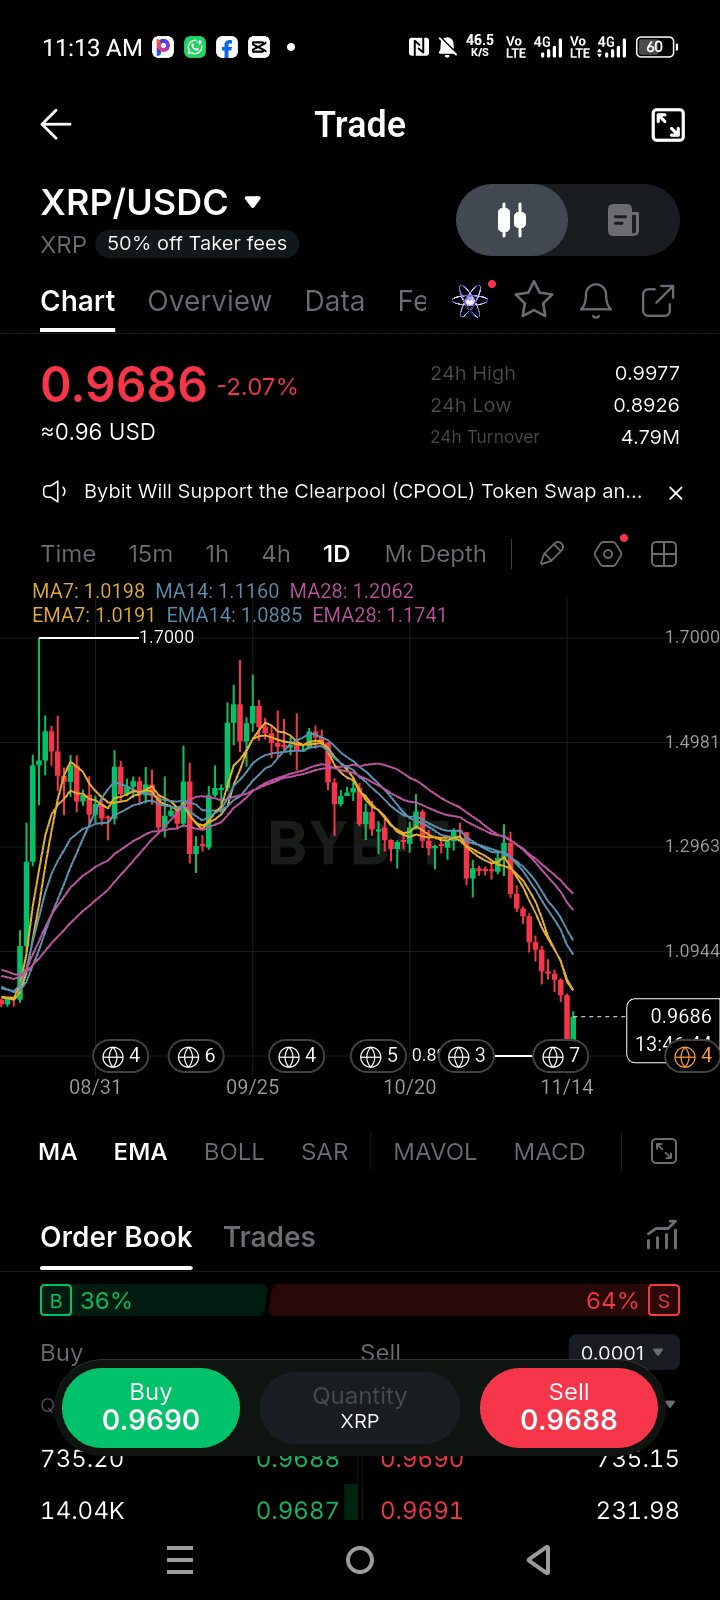
$XRPUSDT is at 0.9686 and sits about 43% below its 1.70 high. The detail that stands out is the last 24 hours. Price swept down to 0.8926, snapped back, and then stalled at 0.9977, just under the round $1 mark. That makes a roughly 12% range with a rejection at a number every trader is watching. The MA7 (1.0198) and EMA7 (1.0191) sit right above it, so the ceiling is stacked: $1 first, then the 7-day averages. My read: the 0.8926 low got bought, but a bounce that can't pass $1 is still a bounce in a downtrend. The averages are lined up bearish (MA7 1.0198, MA14 1.1160, MA28 1.2062) and price is about 20% under the MA28. I'm not guessing the bottom. I want proof that $1 and the 7-day zone have flipped from resistance to support. Key Levels: Resistance: 0.9977 (24h high, just under $1), 1.0191–1.0198 (EMA7/MA7), 1.0885 (EMA14), 1.1160 (MA14) Support: 0.9500 (round number), 0.8926 (24h low) My Trade Plan: Bias: LONG (Conditional, reclaim only) Entry: 1.0000 – 1.0200 (a retest of the $1 / 7-day zone after it breaks) Confirmation: a daily close above 1.0200, then a pullback that holds above 1.0000. If it can't hold $1, there's no trade. Invalidation: 0.9700 (a daily close below it, which puts price back under the level it just reclaimed) TP1: 1.0885 TP2: 1.1160 R:R: ~1:2.0 to TP1 and ~1:2.7 to TP2, based on a 1.0100 entry Why I'm taking this setup: Buying 0.9686 means buying under every average with nothing confirmed. Waiting for the reclaim costs me a few cents of the move, but it puts my stop under a level the market just proved it respects. Both targets are averages that rejected price on the way down, so they're realistic places for the bounce to run into supply. What would change my mind? A daily close below 0.8926. That means the sweep low failed, and I'd stop looking for longs until a new base forms. A hard rejection at 1.02 that prints a lower high also tells me this was a relief bounce, and I'd wait. Does $1 mean anything to you on XRP, or is it just a number? What do you need to see before you buy? #ByXIMPACT #WSOT2026
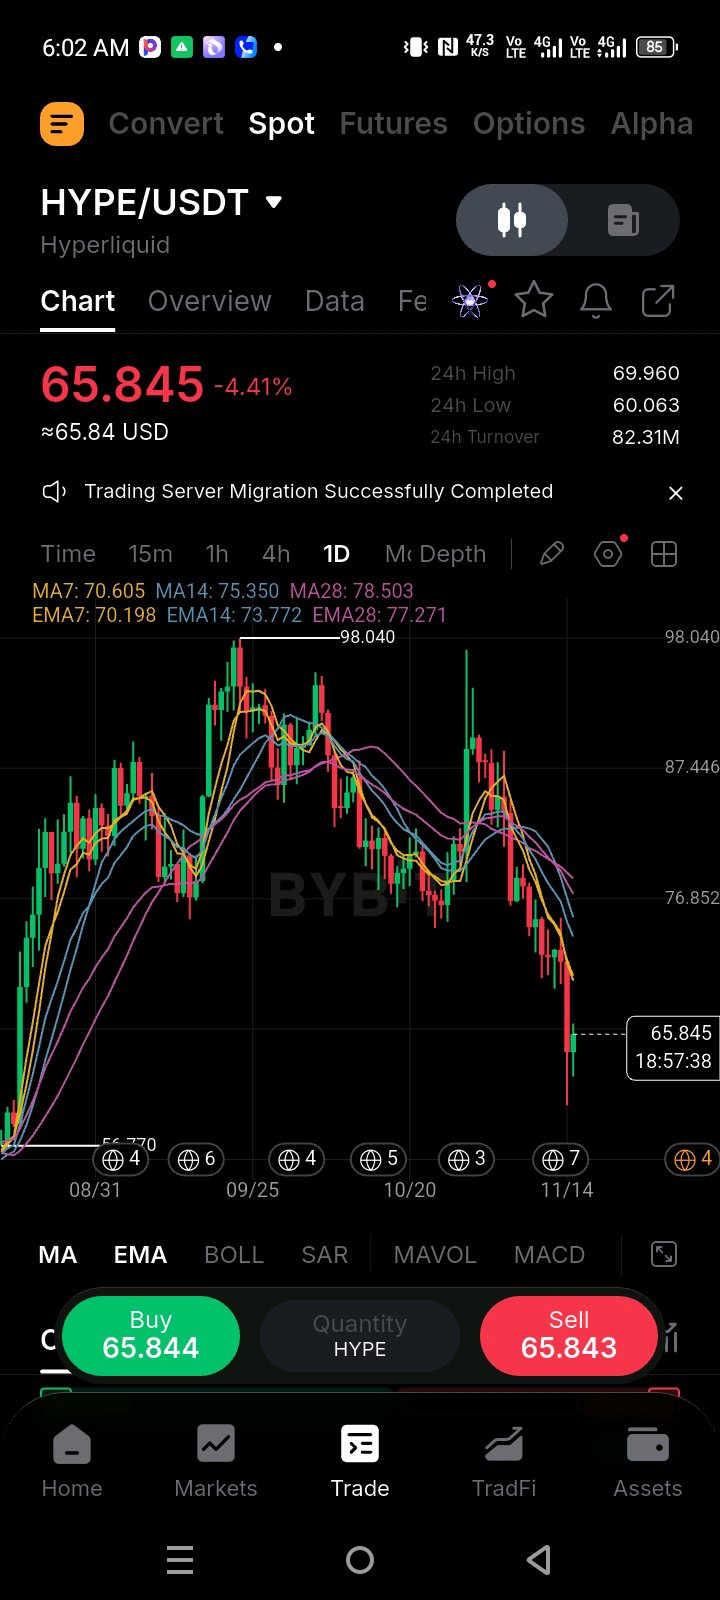
$HYPEUSDT just printed an ugly daily candle, dropping from the 69.96 high straight down to sweep 60.06 before bouncing back to 65.84. What caught my attention is the sheer speed of that flush and the long lower wick it left behind. Price is completely detached from the daily moving averages right now—the 7 EMA is way up at 70.19 and the 28 EMA sits at 77.27. My read here is that this is a violent capitulation move. When a high-beta asset like HYPE dumps this hard in a single session, it usually triggers a wave of forced liquidations. The structure is still technically broken because we are miles below the MAs, but that 60 wick tells me there are buyers waiting in the deep. I am not chasing this bounce blindly, but the setup for a relief trade is taking shape. Key Levels: Resistance: 70.19 (7 EMA), 73.77 (14 EMA) Support: 60.06 (the capitulation wick low) My Trade Plan: Bias: LONG (Counter-trend scalp / Conditional) Entry: $63.00 – $65.00 (Looking to catch a higher low forming above the wick) Confirmation: I need to see the 4H chart print a strong bullish engulfing candle or a clear double-bottom structure above 60. If price just chops sideways and bleeds, I stay out. Invalidation: $59.50 (A clean daily close below this level means the capitulation failed and we are heading much lower). TP1: $70.19 (Retest of the 7 EMA) TP2: $73.77 (14 EMA) R:R: ~1:2.6 based on the stated levels. Why I'm taking this setup: A massive lower wick after a steep sell-off is a classic exhaustion signal. The risk/reward is asymmetric here because our stop is so tight, just under the 60 psychological level. If the market makers have finished sweeping liquidity, this relief bounce could be aggressive. What would change my mind? If price loses 60.06 with high volume, it means the institutions are still distributing and the bottom isn't in. I'd step aside immediately and wait for a completely new base to form lower down. Are you trying to catch this bounce off the 60 wick, or waiting for HYPE to reclaim the 70 EMA before touching it? #ByXIMPACT
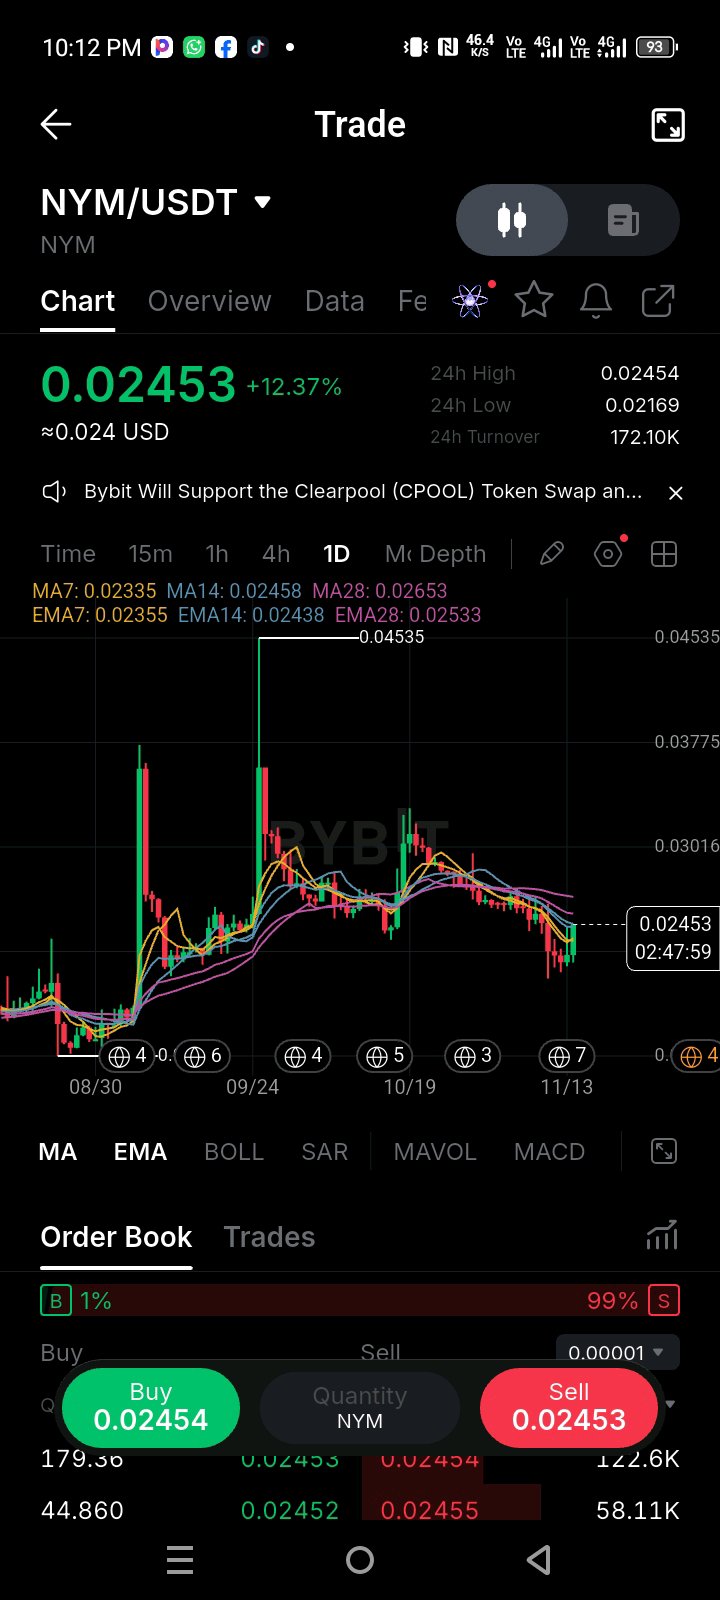
$NYMUSDT is at 0.02453 after a +12.4% day, almost exactly on the MA14 at 0.02458. That's the detail I can't ignore. The candle came off a low of 0.02169, reclaimed the MA7 (0.02335), the EMA7 (0.02355) and the EMA14 (0.02438), and is now pushing into the first average that actually matters. The MA28 (0.02653) and EMA28 (0.02533) are still overhead and falling, so the trend isn't fixed yet. My read: this is a strong reaction, but a reaction isn't a reversal. Turnover is only 172K and the order book is stacked heavily to the sell side, so a thin coin can print a +12% day without much behind it. I don't chase the candle. I need the close above 0.02458, and then a hold there. Key Levels: Resistance: 0.02533 (EMA28), 0.02653 (MA28), 0.0300 (the Oct range high, just under the 0.03016 gridline) Support: 0.02438 (EMA14), 0.02335–0.02355 (MA7/EMA7), 0.02169 (today's low) My Trade Plan: Bias: LONG (Conditional) Entry: 0.0246 – 0.0250 (a retest of the MA14 from above after the close) Confirmation: a daily close above 0.02458, then a pullback that holds it. No close, no trade. Invalidation: 0.0230 (a daily close under the MA7/EMA7 zone, where this candle's body is split in half) TP1: 0.02653 TP2: 0.0300 R:R: ~1:1.0 to TP1 and ~1:2.9 to TP2, based on a 0.0248 entry. TP1 is a spot to bank profit and trail, because this setup pays at TP2. Why I'm taking this setup: The averages are stacked bearish but price just took out three of them in one candle, and the MA14 sits at the exact spot where this has to prove itself. If it holds as support, I'm long a reclaim with a stop under the candle's midpoint, and if it doesn't, I'm out for a small loss. On a coin this thin I'd use limit orders and keep my size small, because the book can move on a few orders. What would change my mind? A daily close back under 0.02438 means the MA14 rejected the bounce and today was a spike into resistance. I'd also back off if the next daily candle shows a long upper wick with very little volume behind it. Do you trust a +12% day on thin turnover, or do you wait for a second green close before you touch it? #ByXIMPACT #WSOT2026
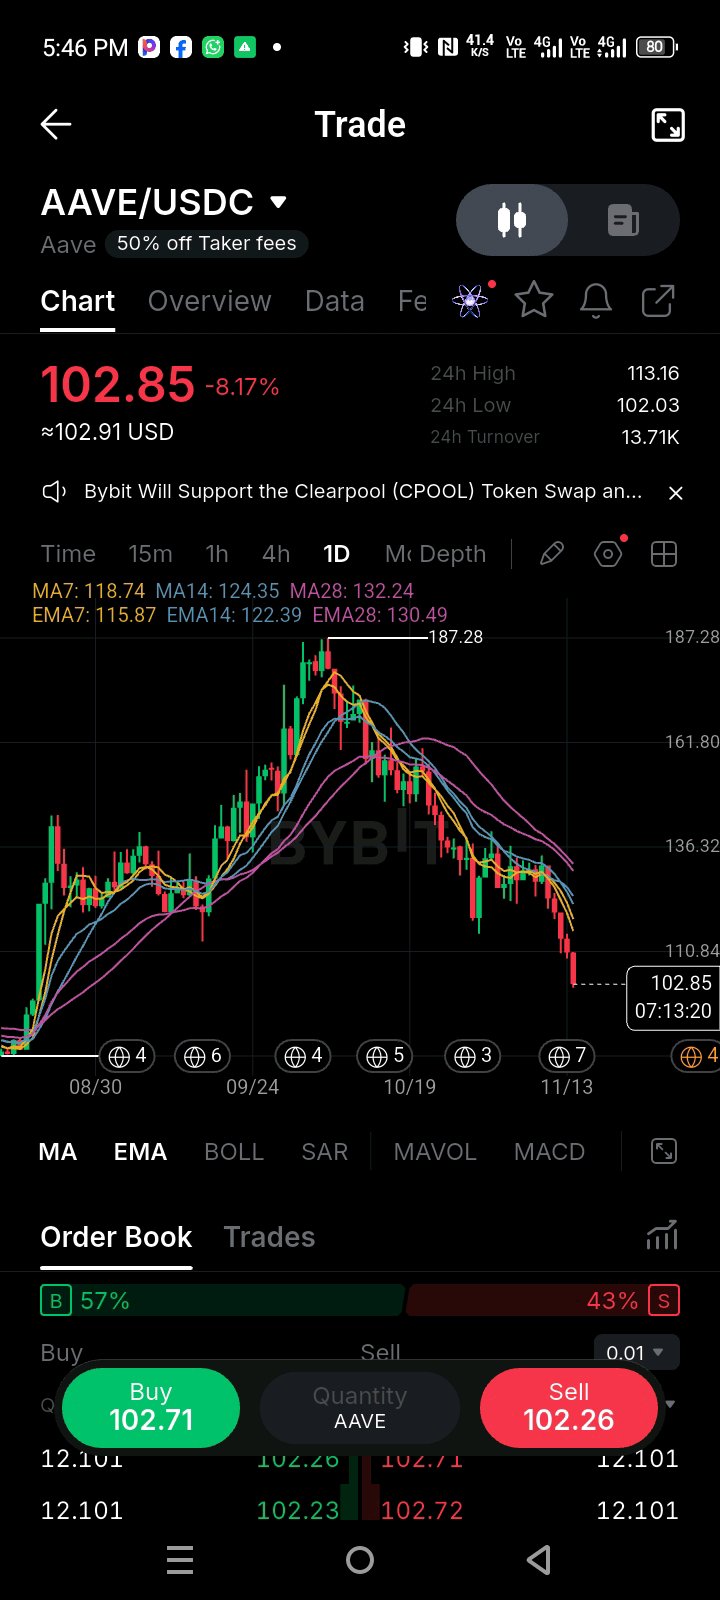
$AAVEUSDT is currently printing an aggressive macro leg down, sliding from the 187.28 cycle peak down to test the 102.85 handle with a -8.17% markdown on the session. Looking closely at the daily moving average structure, the separation is wide and heavy: the MA7 (118.74) and MA14 (124.35) are sloping sharply downward, acting as an active dynamic ceiling, while price tests the critical psychological and structural floor around the 102.00 zone. My read here is that the asset is undergoing an accelerated flush, shaking out remaining late longs. While the momentum is undeniably heavy, severe deviations from the moving average cluster often preface an aggressive consolidation base or a sharp relief mean-reversion, though stepping in without a confirmed structural shift is high-risk. Key Levels: Resistance: $118.74 (MA7 Dynamic Ceiling), $132.24 (MA28 Trend Barrier) Support: $102.03 (24h Low / Immediate Structural Floor), $95.00 (Macro Demand Base) My Trade Plan: Bias: LONG (Conditional Counter-Trend Rebound) Entry: $101.50 – $103.50 (On a confirmed defense and lower-wick absorption of the 102 level) Confirmation: I want to see a high-volume 4H reclaim of the 108.00 pivot or a sharp rejection wick off the 102 floor before scaling any capital in. Invalidation: $101.00 (A clean daily close below this baseline invalidates the support thesis entirely). TP1: $118.74 (MA7 Dynamic Revisit) TP2: $128.50 (Mid-Range Structural Supply) R:R: ~1:2.4 based on the stated levels. Why I'm taking this setup: The intensity of the recent sell-off has pushed price into extreme statistical deviation relative to its daily moving averages, increasing the probability of a corrective bounce as short-term traders take profits near key horizontal support. What would change my mind? If selling volume expands aggressively and price slices through 101.00 on strong momentum, I am stepping completely aside. No catching falling knives in a confirmed trend breakdown. Are you looking to scale into this support retest on AAVE, or waiting for a confirmed daily close back above the moving averages first? #ByXIMPACT #WSOT2026 $BTCUSDT
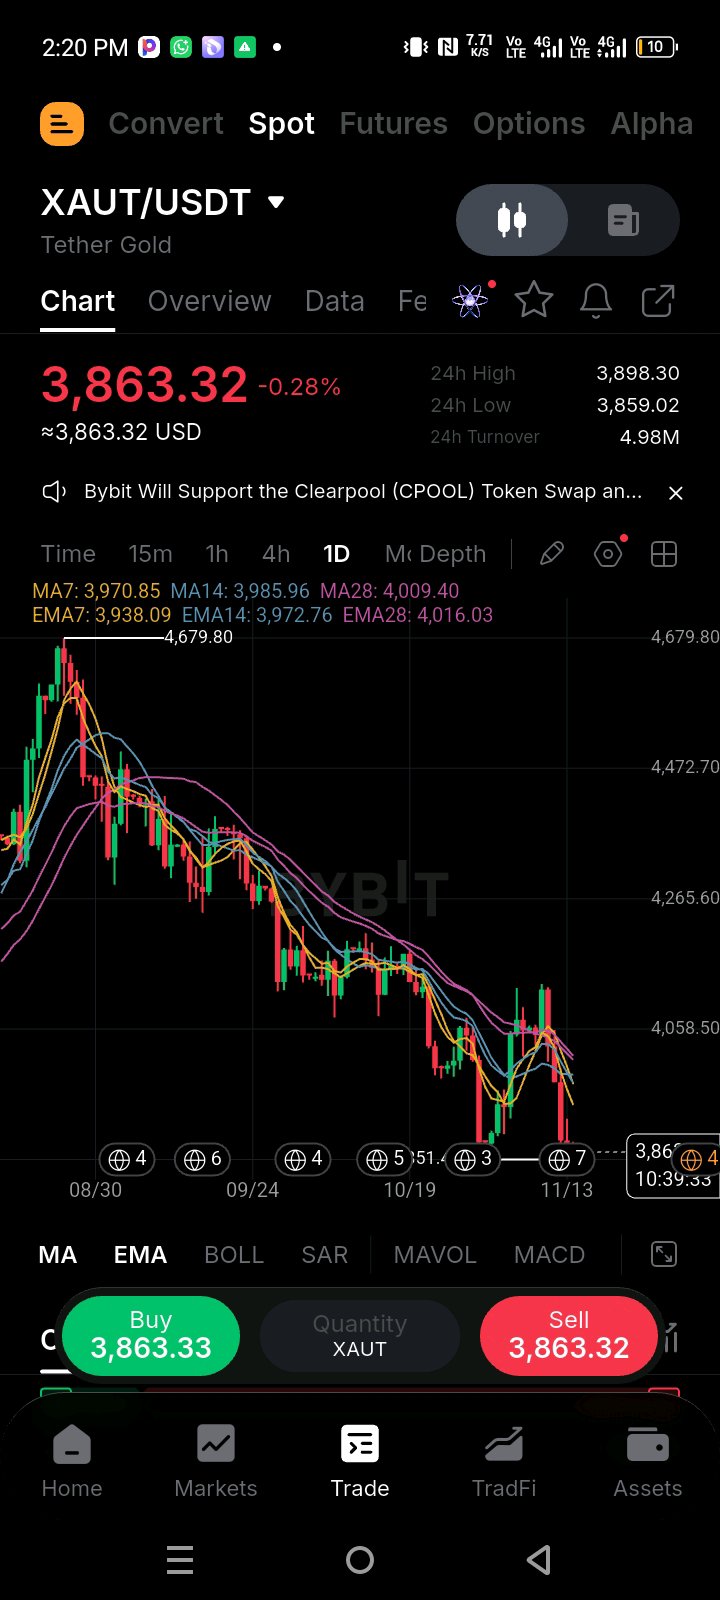
$XAUTUSDT is at 3,863, about 17.5% below the 4,679.80 high. It is only about $12 above the low it set roughly two weeks ago, near 3,851. The bounce between those two lows topped around 4,120 and then rolled over, and the averages are still stacked bearish: MA7 3,971, MA14 3,986, MA28 4,009, with EMA28 at 4,016. Today's candle is small, so sellers haven't pushed through the floor yet. My read: this is a retest of support inside a downtrend, not a reversal. A floor tested twice in two weeks usually decides one way or the other, and I don't want to guess which. So I'm not buying the support or shorting into it. I wait for the daily close. Key Levels: Resistance: 3,898 (today's high), 3,938–3,973 (EMA7/EMA14), 4,009–4,016 (MA28/EMA28), ~4,120 (bounce high) Support: 3,859 (24h low), ~3,851 (prior low) My Trade Plan: Bias: SHORT (Conditional, break and retest only) Entry: $3,830 – $3,850 (a retest of 3,851 from below after it breaks) Confirmation: a daily close under 3,851, then a failed reclaim, meaning price comes back to the level and gets rejected Invalidation: $3,900 (a daily close above today's high kills the short) TP1: $3,720 TP2: $3,585 R:R: ~1:2 to TP1 and ~1:4.3 to TP2, based on a 3,840 entry. Both targets are measured-move projections of the 3,851–4,120 range, since there's no chart level below the low. Why I'm taking this setup: Selling a retest of broken support puts the stop above a level the market has just defended, so I'm not guessing the break in advance. The trend and the averages are already pointing down, and the failed bounce toward 4,120 shows buyers couldn't hold higher prices. If the floor holds, I lose nothing, because I never entered. What would change my mind? A daily close above 3,900, or a sweep below 3,851 that closes back above it. That's a failed breakdown, and I'd flip my attention to a bounce toward the 3,970 averages instead. Does a floor that gets tested a second time within two weeks look stronger or weaker to you? #ByXIMPACT #WSOT2026
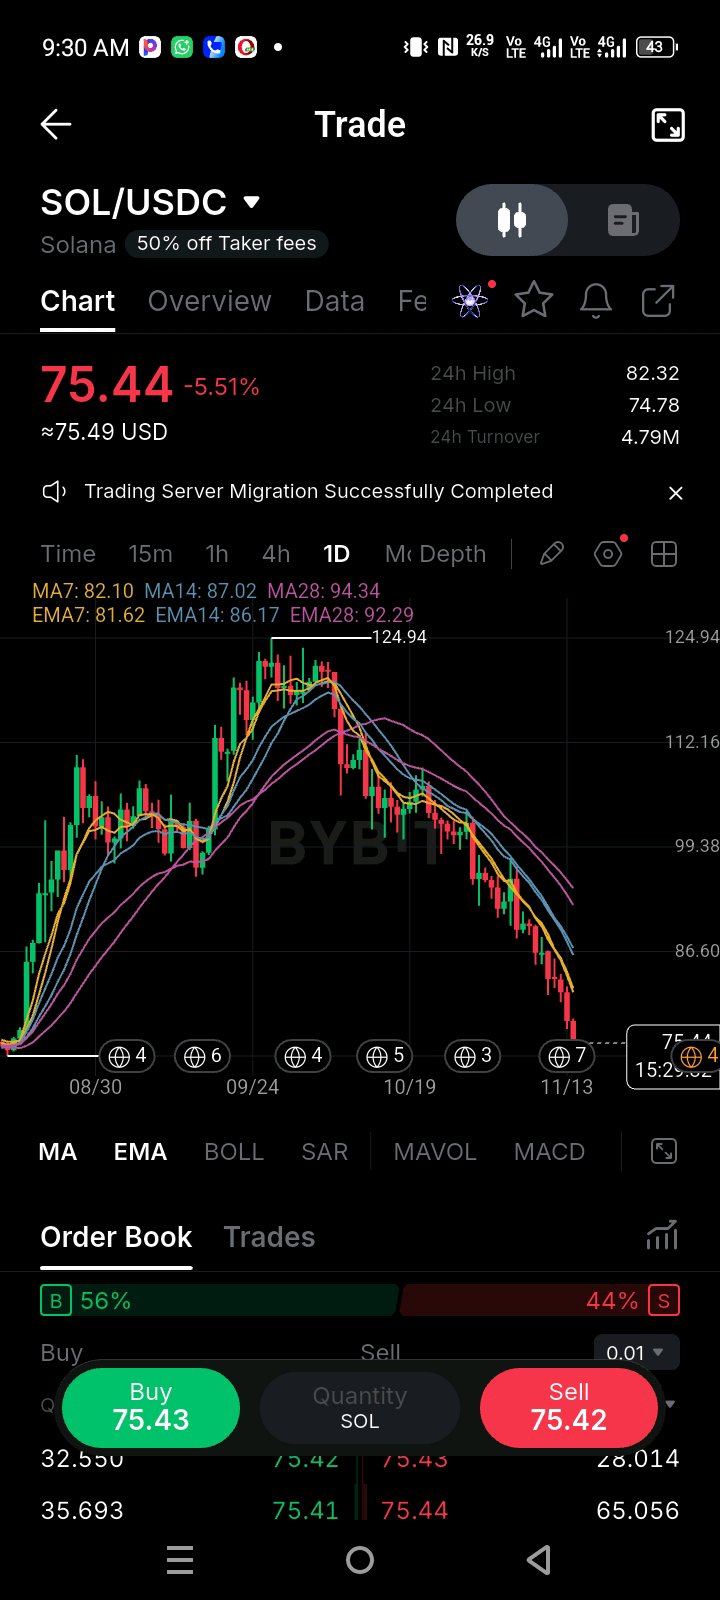
$SOLUSDT has been in a relentless downtrend since the 124.94 peak, and the daily chart is showing zero signs of a real reversal. What caught my attention is the recent price action: we are currently at 75.44, completely rejected by the short-term moving averages. The 7 and 14 EMAs are crossing down hard at 82.10 and 86.17, acting as heavy overhead resistance. The order book is showing 56% buy pressure, but it's failing to hold the price up. My read here is that this is a clear continuation setup. That 56% buy pressure is likely just retail trying to catch a falling knife—it isn't translating into actual price appreciation. The structure remains deeply bearish while we are trading below 82, and I am absolutely not trying to front-run a trend this heavy. Key Levels: Resistance: 82.10 (7 EMA), 92.29 (28 EMA) Support: 74.78 (24h low), 68.00 (next major psychological zone) My Trade Plan: Bias: SHORT (Conditional) Entry: $79.50 – $81.50 (On a weak bounce into the 7 EMA) Confirmation: I want to see a lower high form on the 4H chart. If price pushes up but fails to reclaim 82 and prints a bearish rejection candle, I'm taking the short. Invalidation: $86.20 (A clean daily close above the 14 EMA kills the immediate bearish momentum). TP1: $74.78 (Retest of the recent low) TP2: $68.00 R:R: ~1:2.4 based on the stated levels. Why I'm taking this setup: When a major altcoin like SOL breaks down after a blow-off top, the first relief bounces are almost always sold. The 80–82 zone is where old support flipped to resistance. Selling the retest gives us a tight stop with a clear path down. What would change my mind? If we sweep 74.78 and immediately print a massive bullish engulfing candle with heavy volume, that’s a liquidity grab. In that scenario, I’d cut the short and wait for a higher low to confirm a reversal. Until then, the path of least resistance is down. Are you shorting this bounce into 80, or are you waiting for a daily close above 86 to flip bullish? #ByXIMPACT #WSOT2026 $BTCUSDT
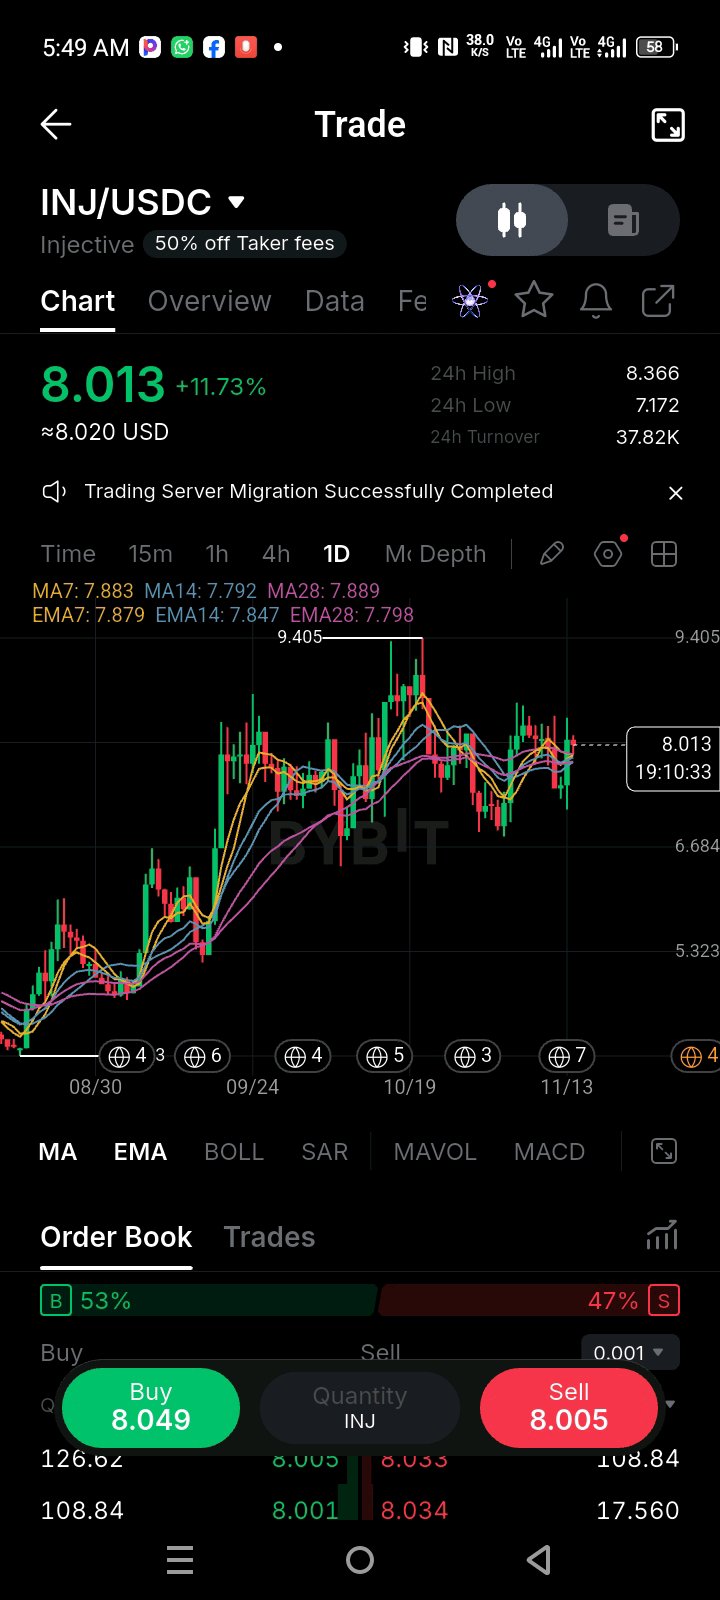
$INJUSDT spent weeks coiling, and every average I track is now stacked inside a band about $0.10 wide: MA14 at 7.79, EMA28 at 7.80, EMA14 at 7.85, EMA7 at 7.88, MA7 at 7.88 and MA28 at 7.89. Today's +11.7% candle ripped from 7.17 to 8.37 and is sitting at 8.01, above the whole cluster. When the averages are this tangled, they mark where the market has been in agreement, and price just left that area. My read: this looks like a push out of balance, but I'm not trusting it yet. The 9.405 peak is still far above, and price at 8.01 is mid-range, which is a bad place to buy. What I care about is whether the cluster flips from a ceiling into a floor. Key Levels: Resistance: 8.37 (today's high), ~9.00 (the zone under the 9.405 peak), 9.405 (range high) Support: 7.80 – 7.89 (the braided averages), 7.17 (today's low) My Trade Plan: Bias: LONG (Conditional) Entry: $7.80 – $7.95 (a pullback into the cluster) Confirmation: a daily candle that dips into the zone and closes back above 7.88 with a lower wick. Without that, I stay out. Invalidation: $7.60 (a daily close below it. That's under the whole cluster and under the midpoint of today's candle.) TP1: $8.37 TP2: $9.00 R:R: ~1:1.8 to TP1 and ~1:4 to TP2, based on a 7.88 entry Why I'm taking this setup: The cluster is where price spent weeks, so a retest that holds makes it support. My stop sits beneath all six averages, so if it's hit, the breakout idea is simply wrong. And today's move is big enough that a hold above 7.88 would show real buyers, not just a one-day spike. What would change my mind? A daily close below 7.60. That puts price back inside the old range with nothing proven, and I'd wait for a new base. If price instead races to 8.37 and rejects hard without ever retesting the cluster, I also skip it and don't chase. Is this a real breakout or a pop in the middle of a range? What would you need to see on the next daily candle to believe it? #ByXIMPACT
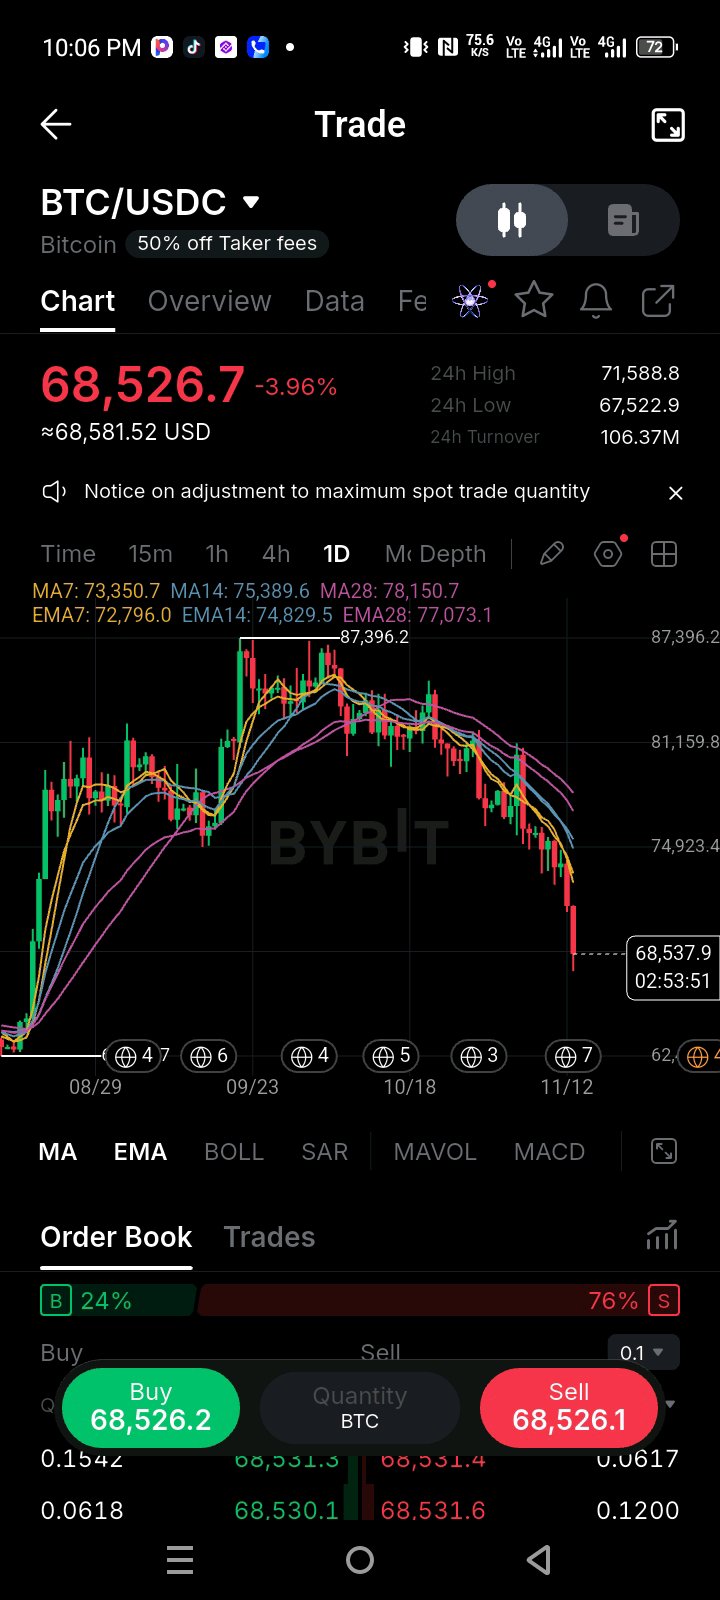
$BTCUSDT dropped from the 87,396 top to 68,526, about 21.6% in a few weeks, and today's candle is a long red body with almost no lower wick. That's what stands out. Price is under every moving average, and the stack is lined up bearish: MA7 at 73,351, MA14 at 75,390 and MA28 at 78,151, all rolling over. My read: this is a trend move, not a dip to chase. A market this far below its averages can snap back hard, but a snap-back into falling averages is usually a place to sell, not a bottom. I'm not shorting the flush itself. The edge is in the retest. Key Levels: Resistance: 71,589 (today's high), 72,796–73,351 (EMA7/MA7), 74,830–75,390 (EMA14/MA14) Support: 67,523 (today's low), then ~62,500 (the prior base on the left of the chart) My Trade Plan: Bias: SHORT (Conditional, on a bounce only) Entry: $72,000 – $73,300 (a retest of the EMA7/MA7 zone) Confirmation: a rejection wick or a bearish daily close under 72,800 after price tags this zone. No candle, no trade. Invalidation: $75,500 (a daily close above the MA14 means the bounce is becoming something bigger) TP1: $67,500 TP2: $62,500 R:R: ~1:1.8 to TP1 and ~1:3.6 to TP2, based on a 72,650 entry Why I'm taking this setup: The averages are stacked and falling, and price is far enough below them that the first real bounce has to run into supply. Waiting for the retest puts my stop above a level the market already respects, so I'm not guessing the top. The order book leaned about 76% sell-side when I took this snapshot, but that moves minute to minute, so I treat it as a footnote and not a signal. What would change my mind? A daily close above 75,500, or several days of price holding above 71.6k with no rejection. Either means sellers are losing control, and I'd dro #ByXIMPACT
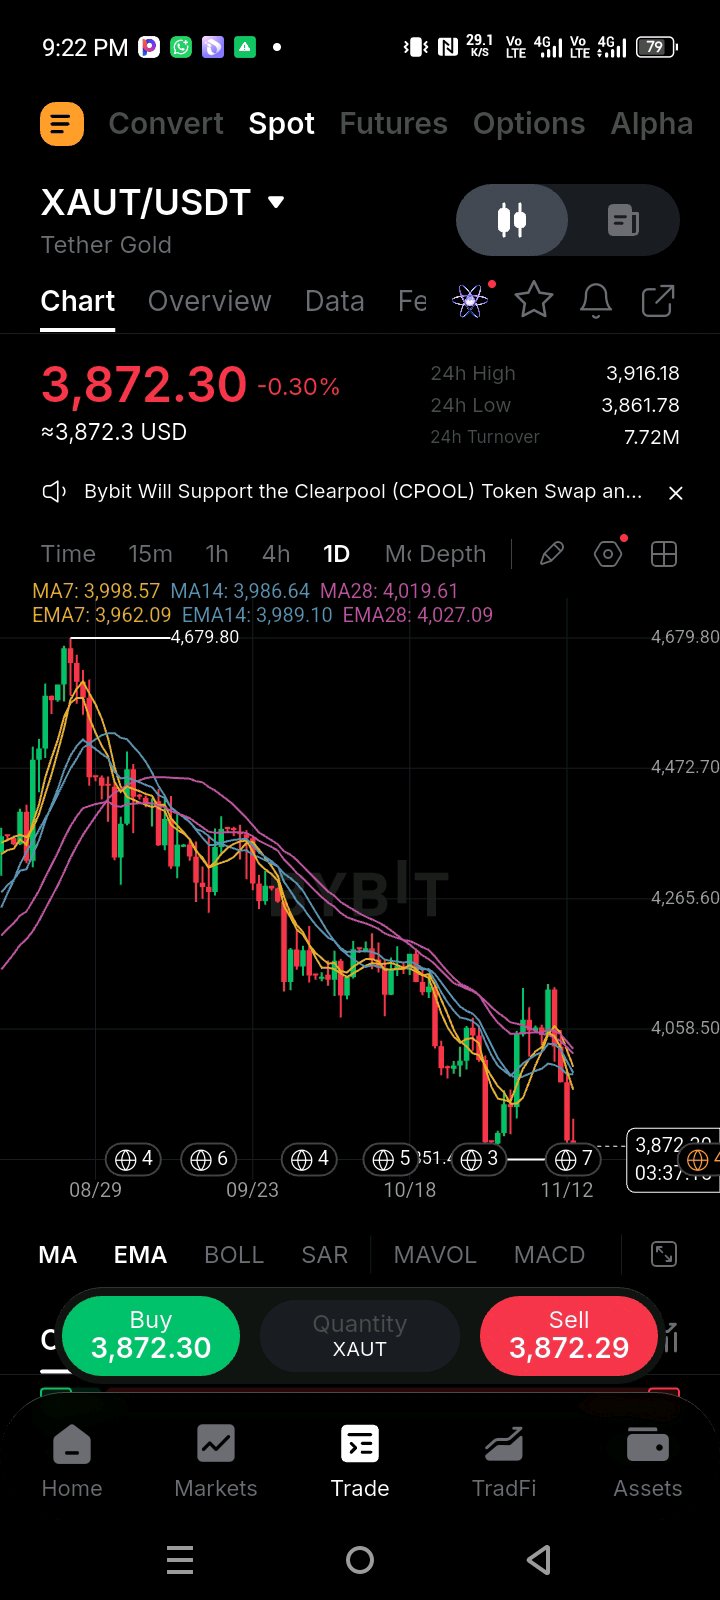
$XAUTUSDT has experienced a severe macro markdown phase, sliding heavily from the 4,679.80 cycle high down to test the current 3,872.30 demand shelf. Price action remains deeply suppressed below the daily moving average cluster (MA7 at ~3,998, MA14 at ~3,986, and MA28 at ~4,019), showing that sellers have maintained absolute control over the medium-term trend structure. My read here is that while the broader trend is undeniably bearish, the magnitude of the recent flush into the 3,860 baseline is stretching seller exhaustion. We are approaching a critical inflection point where a relief mean-reversion could materialize, but catching a falling knife without confirmation is a trap. Key Levels: Resistance: $3,998.57 (MA7 Dynamic Ceiling), $4,019.61 (MA28 Trend Barrier) Support: $3,860.00 (Local Structural Low), $3,750.00 (Deep Macro Demand Floor) My Trade Plan: Bias: LONG (Conditional Counter-Trend Relief) Entry: $3,850.00 – $3,875.00 (On a confirmed defense of the local psychological floor) Confirmation: I need to see a high-volume lower-wick rejection on the daily timeframe or a clean 4H structural reclaim of the 3,920 pivot before scaling any capital in. Invalidation: $3,840.00 (A decisive breakdown below this support invalidates the relief thesis). TP1: $3,998.00 (MA7 Revisit) TP2: $4,150.00 (Mid-Range Supply Pivot) R:R: ~1:2.5 based on the stated levels. Why I'm taking this setup: Extended departures from the daily moving average cloud frequently invite sharp, aggressive mean-reversion bounces when macro structural floors are defended by market participants. What would change my mind? If selling volume expands aggressively and price slices through the 3,840 level on a closing basis, I am entirely stepping aside. No hero bids against accelerating trend continuation. Are you looking to scale into this support retest on tokenized gold, or waiting for a structural shift back above the moving averages first? #ByXIMPACT #WSOT2026
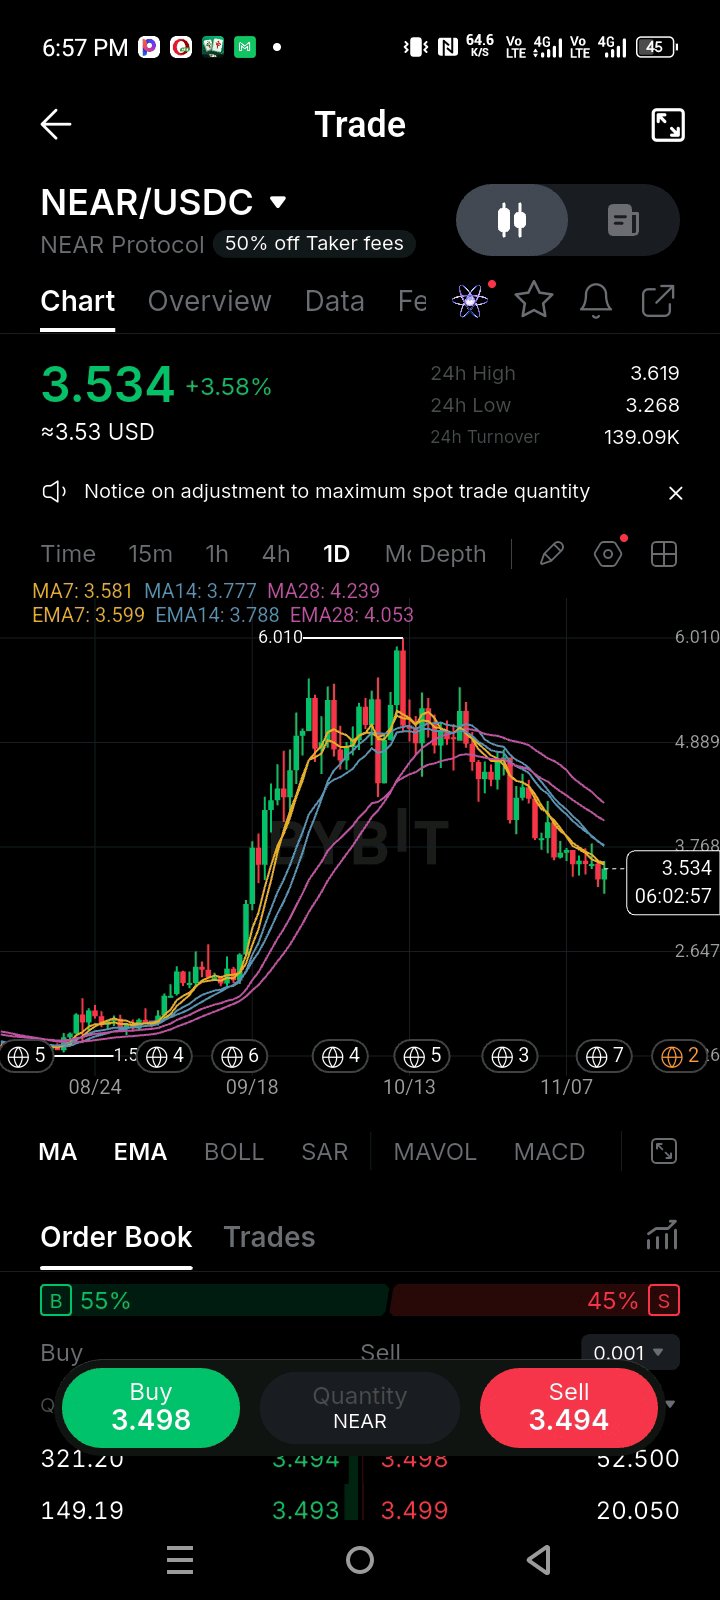
$NEARUSDT is down about 41% from the 6.01 peak, and the daily MAs are still stacked bearish: MA7 at 3.58, MA14 at 3.78, MA28 at 4.24 and still falling. What caught my eye today is the candle itself. Price wicked down to 3.268 and got bought back up to 3.53, so someone defended that low. My read: this is a relief bounce until proven otherwise. Price is still under every average, so one green candle doesn't change the trend for me. At 3.53 I'm sitting mid-range, which is a poor place to enter, so I'm not chasing. Key Levels: Resistance: 3.62 (today's high, MA7/EMA7 zone), 3.78 (MA14/EMA14 cluster), 4.05 (EMA28) Support: 3.27 (today's wick low), then the base where the September impulse started, around 2.6 My Trade Plan: Bias: LONG (Conditional, bounce only) Entry: $3.38 – $3.46 (on a pullback that holds above the 3.27 wick) Confirmation: a rejection wick or a green daily close holding above 3.40 as price tests this zone Invalidation: $3.22 (a daily close below today's low kills the idea) TP1: $3.78 TP2: $4.05 R:R: ~1:1.8 to TP1 and ~1:3.1 to TP2, based on a 3.42 entry Why I'm taking this setup: The sell-off is stretched and today's wick shows real demand at 3.27. That gives me a tight stop under a clear low instead of guessing the bottom. The first target is the 3.78 cluster, the first place this bounce has to prove itself. What would change my mind? A daily close below 3.22. That means the 3.27 defense failed, and I'd step aside and wait for a new base instead of averaging down. A rejection at 3.78 that prints a lower high would also tell me this was only a bounce. Is 3.27 your line in the sand on NEAR, or are you waiting for a daily close above 3.78 before touching it? #ByXIMPACT #WSOT2026
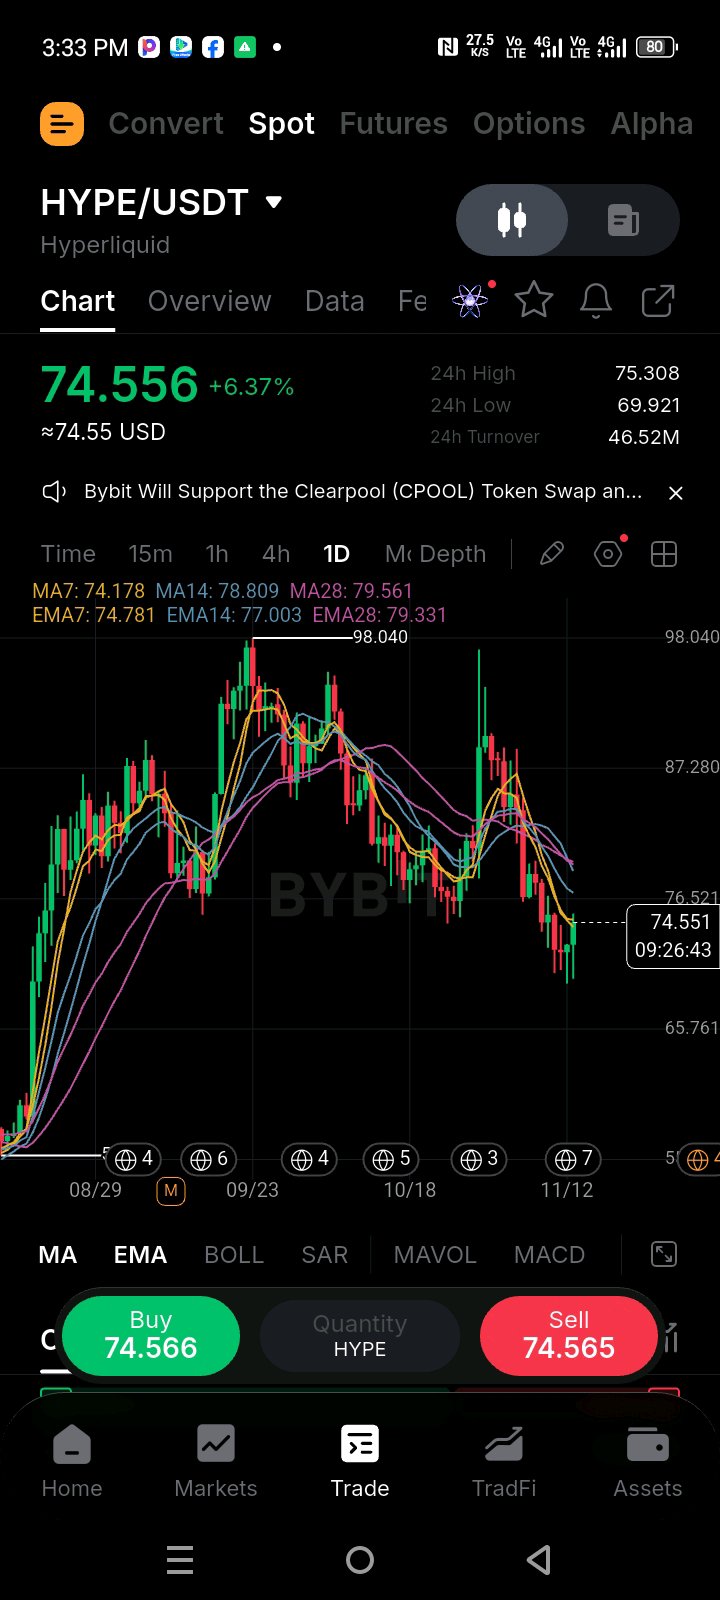
$HYPEUSDT carved out a sharp correction from the 98.04 high down to a local flush near 69.92, but the current daily session is showing a strong reactive recovery of +6.37% up to 74.556. What stands out on the daily chart is how price is interacting with the moving averages—climbing back above the MA7 (74.17), while the MA14 (78.80) and MA28 (79.56) sit overhead as the next major dynamic resistance cluster. My read here is that the asset is attempting a relief bounce and structural stabilization after a heavy cooling-off phase, but it needs to clear the overhead moving average cloud before we can call for a full trend continuation. Key Levels: Resistance: $78.80 (MA14 / Dynamic Supply), $98.04 (Macro High) Support: $74.17 (MA7 Pivot), $69.90 (Local Demand Low) My Trade Plan: Bias: LONG (Conditional Relief Play) Entry: $73.50 – $74.50 (On a minor intraday pullback testing the MA7 support) Confirmation: I want to see a sustained hold above the 74.00 handle with stable volume backing the intraday retests before scaling in. Invalidation: $69.50 (A clean daily break below the local swing low invalidates the recovery thesis). TP1: $78.80 (MA14 Resistance) TP2: $84.50 (Mid-Range Supply Node) R:R: ~1:2.3 based on the stated levels. Why I'm taking this setup: Downside selling pressure has visibly dried up near the 70 psychological and structural floor, and a mean-reversion move back toward the daily moving average cluster offers a clean risk-to-reward window for swing positioning. What would change my mind? If volume completely vanishes and price slips back below 72.00 with impulsive red candles, the buyers have failed to defend the pivot, and I am stepping aside. Are you fading this relief bounce into the moving average overhead, or positioning for a sustained rotation back toward the 80 handle? #ByXIMPACT #WSOT2026
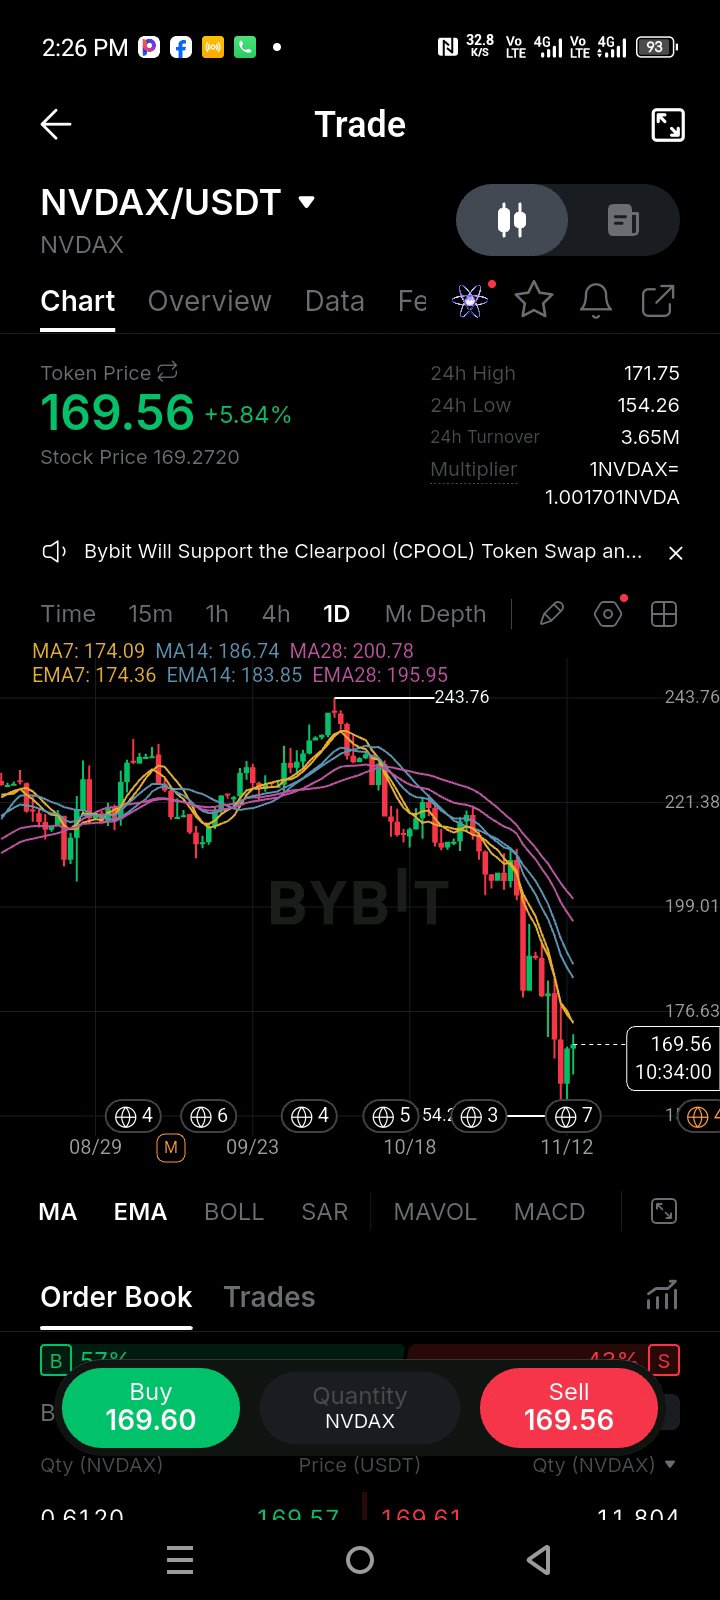
$NVDAXUSDT has been in absolute freefall since the 243 peak, but the daily chart just printed something interesting. What caught my attention is the massive lower wick on the most recent daily candle, bouncing hard from the 154 low to reclaim 169.56. The price got completely destroyed below the 28 EMA (currently way up at 195), but the order book is now showing 57% buy pressure. My read here is that we are seeing a violent short-term capitulation followed by aggressive dip buying. The structure is still technically bearish because we are miles below the moving averages, but that long wick suggests sellers are exhausted for now. I’m not trying to short the bottom of a bloodbath, and I’m not blindly longing a falling knife. Key Levels: Resistance: 174.09 (7 MA), 183.85 (14 EMA) Support: 154.26 (the capitulation wick low) My Trade Plan: Bias: LONG (Counter-trend scalp / Conditional) Entry: $165.00 – $168.00 (On a minor pullback to build a higher low) Confirmation: I need to see the 4H chart print a higher low above 160, followed by a bullish engulfing candle. I want to see the 57% buy pressure hold up and push price back above the 174 local resistance. Invalidation: $154.00 (If we lose the wick low, the capitulation failed and the bleeding continues). TP1: $183.85 (14 EMA retest) TP2: $195.00 (28 EMA) R:R: ~1:2.8 based on the stated levels. Why I'm taking this setup: When a heavy sell-off prints a massive rejection wick into a local low, it often marks a short-term bottom. The risk/reward here is excellent because our invalidation is so tight (just below the wick). If buyers are truly stepping in, they will defend this new base. What would change my mind? If price chops around and forms a weak flag below 165, that’s a bearish continuation pattern. I’d step aside. If we lose 154 with high volume, the bottom is in the rearview mirror and I’ll wait for a completely new structure. Are you playing the bounce off the 154 wick, or waiting for the trend to actually flip above 195? #ByXIMPACT #WSOT2026
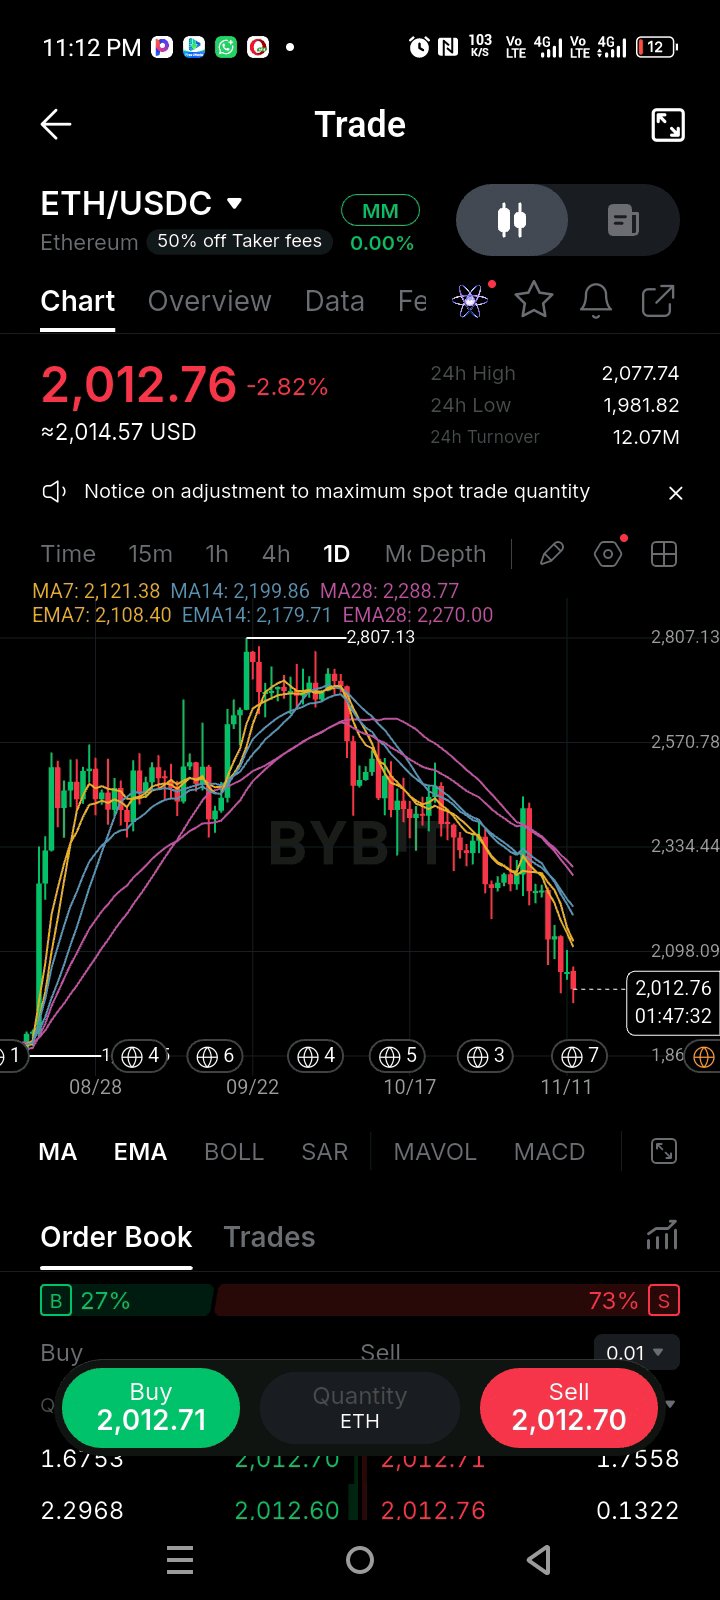
$ETHUSDT is in a severe downtrend since the 2,807 peak, and the daily chart is finally testing a major psychological floor. What caught my attention is the current price action: we are bleeding right through 2,012, with zero support from the moving averages. The 7 and 14 EMAs are sloping aggressively down at 2,121 and 2,199, acting as a heavy ceiling. My read here is that the market structure is deeply bearish. This isn't a healthy pullback; it's a sustained sell-off. The order book confirms this with 73% sell pressure dominating the visible liquidity. I am not trying to catch a falling knife here until we see a clear base form. Key Levels: Resistance: 2,121 (7 EMA), 2,270 (28 EMA) Support: 1,981 (24h low), 1,860 (next major zone) My Trade Plan: Bias: SHORT (Conditional) / Wait for Long Reclaim Entry (Short): $2,080 – $2,120 (On a relief bounce into the 7 EMA) Confirmation: I want to see a weak rejection wick or a bearish engulfing candle on the 4H chart as price tests this zone. If price reclaims 2,200 with volume, I step aside. Invalidation: $2,270 (A clean daily break above the 28 EMA invalidates the bearish continuation). TP1: $1,981 (Retest of the recent low) TP2: $1,860 (Next major liquidity zone) R:R: ~1:2.3 based on the stated levels. Why I'm taking this setup: When a major asset like ETH breaks below a psychological level like 2k, the first bounce is usually sold. The 2,100 zone is where the previous support broke down, so I expect sellers to defend it. Selling the retest offers a tight invalidation with a clear path down. What would change my mind? If price sweeps 1,981 and immediately prints a massive bullish engulfing candle with high volume, that’s a liquidity grab. I’d close the short and wait for a higher low to form before considering a long. Until then, the trend is down. Are you shorting this bounce into 2.1k, or waiting to see if 1,981 holds for a spot entry? #ByXIMPACT #WSOT2026
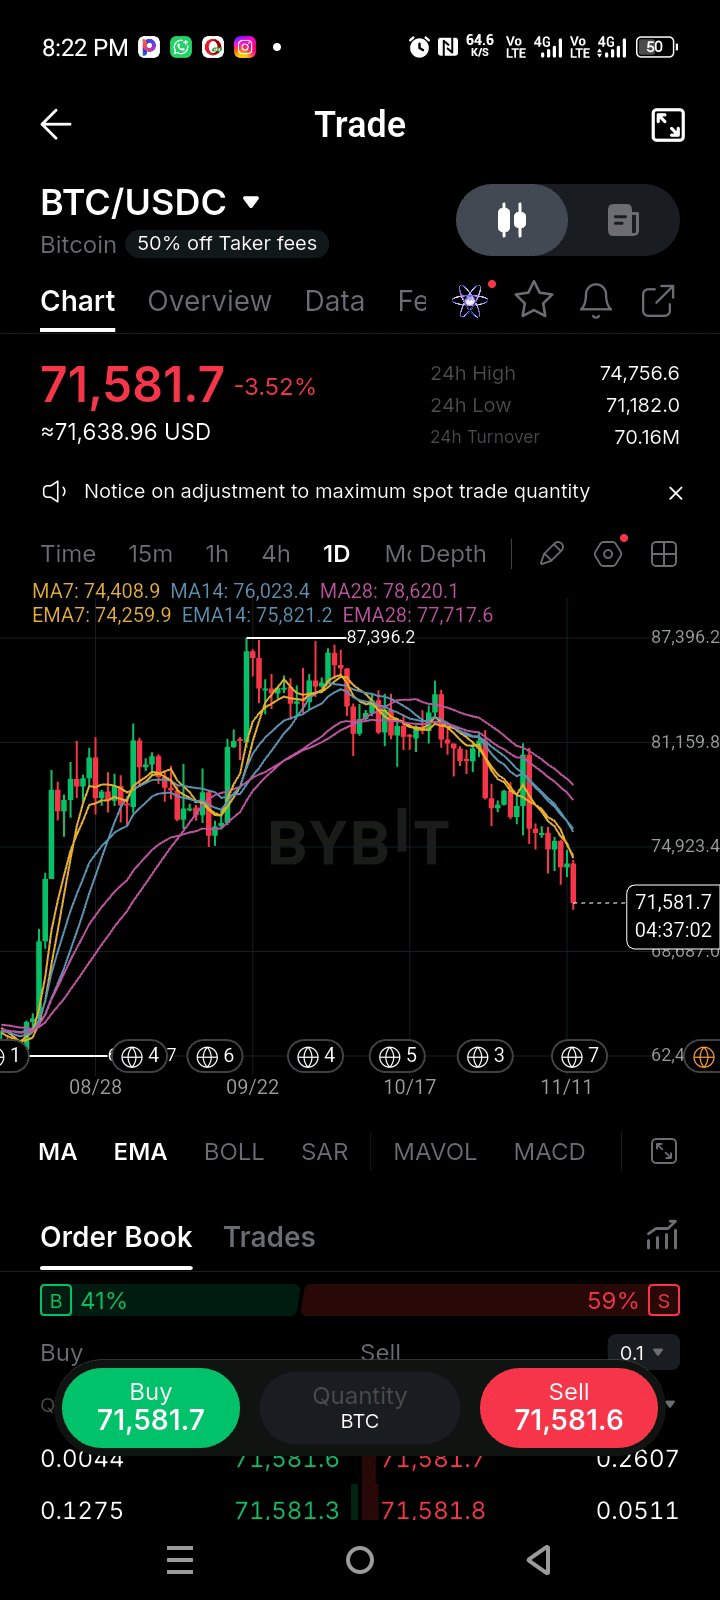
$BTCUSDT has been in a brutal slide since the 87,396 peak, and the daily chart is finally testing a major psychological floor. What caught my attention is how price is reacting right now: we are sitting at 71,581, completely rejected by the short-term moving averages. The 7 and 14 EMAs are crossing down hard at 74.4k and 75.9k, acting as a heavy ceiling. My read here is that the macro structure is heavily damaged. This isn't a shallow dip; the market is hunting for a new base. The order book shows 59% sell pressure, meaning sellers are still dominating the book. I am absolutely not catching this falling knife until we see a clear structural shift. Key Levels: Resistance: 74,409 (7 EMA), 77,717 (28 EMA) Support: 71,182 (24h low), 68,000 (psychological / next major zone) My Trade Plan: Bias: SHORT (Conditional) / Wait for Long Reclaim Entry (Short): $73,500 – $74,400 (On a relief bounce into the 7 EMA) Confirmation: I want to see a weak rejection wick or a bearish engulfing candle on the 4H chart as price tests this zone. If price reclaims 75k with volume, I step aside. Invalidation: $77,700 (A clean daily break above the 28 EMA invalidates the bearish continuation). TP1: $71,182 (Retest of the recent low) TP2: $68,000 (Next major liquidity zone) R:R: ~1:2.5 based on the stated levels. Why I'm taking this setup: When a major asset like BTC breaks down below all major daily moving averages after a high, the first bounce is usually sold. The 74.4k zone is where the previous support broke down, so I expect sellers to defend it. Selling the retest offers a tight invalidation with a clear path down. What would change my mind? If price sweeps 71,182 and immediately prints a massive bullish engulfing candle with high volume, that’s a liquidity grab. I’d close the short and wait for a higher low to form before considering a long. Until then, the trend is down. Are you shorting this bounce into 74k, or waiting to see if 71k holds for a spot entry? #ByXIMPACT #WSOT2026
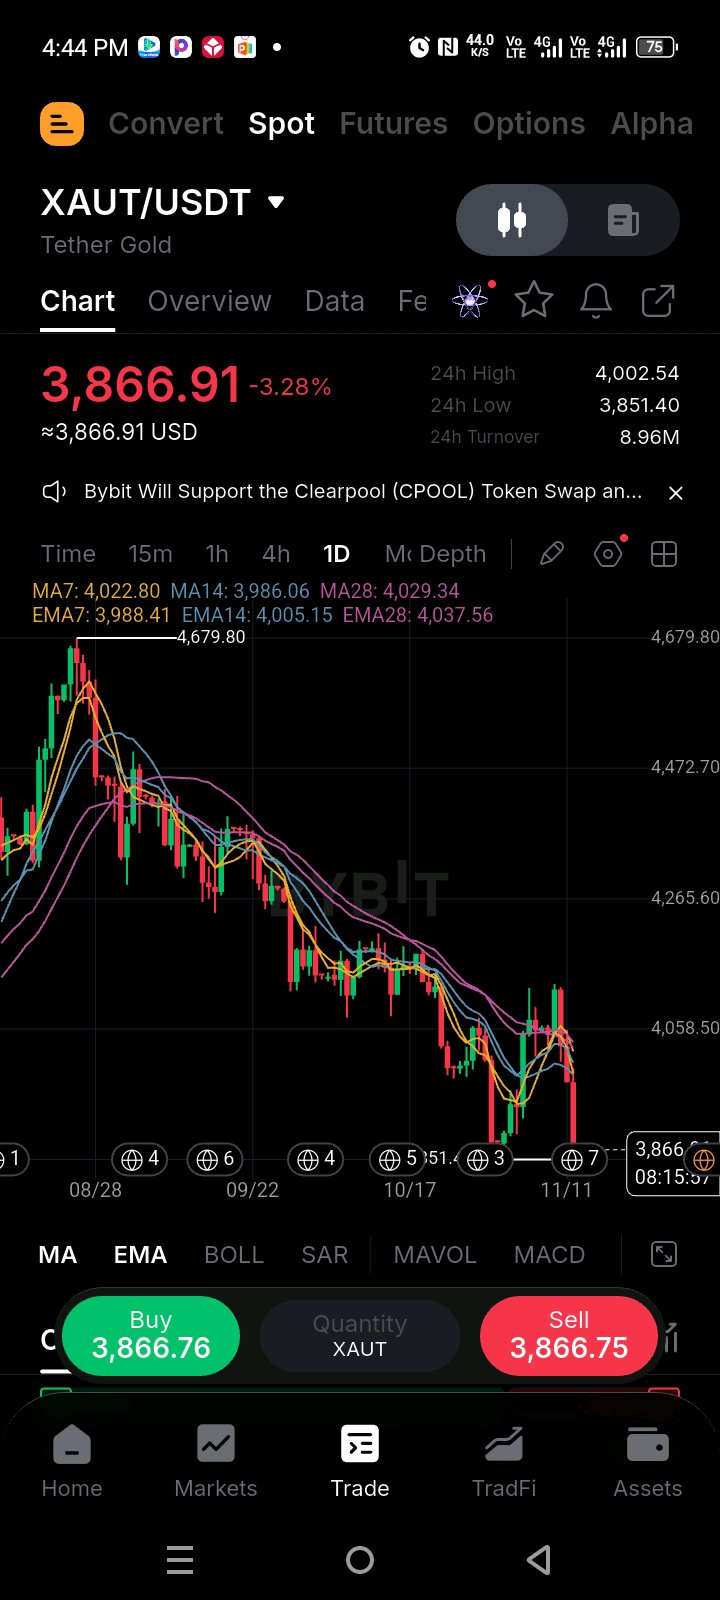
$XAUTUSDT has been in a relentless downtrend since the 4,679 peak, and the daily chart is showing zero signs of a real reversal. What caught my attention is the recent price action: we tried to bounce off the 3,851 lows, but the MA7 and MA14 are crossing down sharply and pushing price back toward the 3,866 level. The 28 EMA is way up at 4,037, acting as a heavy ceiling. My read here is that this is a continuation setup. The recent green candles were just a relief bounce, not a trend change. The structure remains deeply bearish while we are trading below 4,029, and I’m definitely not trying to catch a falling knife on a heavy asset like gold. Key Levels: Resistance: 4,029 (28 EMA), 4,058 (local swing high) Support: 3,851 (recent daily low) My Trade Plan: Bias: SHORT (Conditional) Entry: $3,950 – $4,000 (On a retest of the broken moving averages) Confirmation: I want to see a bearish rejection wick or a lower-high formation on the 4H chart as price tests this zone. I’d also accept a breakdown and retest of 3,850 if the bounce loses momentum. Invalidation: $4,060 (A clean daily break above this level invalidates the bearish thesis). TP1: $3,851 TP2: $3,700 R:R: ~1:2.2 based on the stated levels. Why I'm taking this setup: The trend is clearly down. Pullbacks into the descending moving averages in a strong downtrend usually provide favorable risk/reward. The 3,950–4,000 zone is where the previous support broke down, so I expect sellers to defend it. What would change my mind? If price reclaims 4,060 with high volume and the MA7 crosses back above the MA14, I’m stepping aside. That would signal the sellers are exhausted, and I’d wait for a higher low to form before looking for longs. Are you shorting this bounce into the MAs, or waiting to see if 3,851 holds for a spot entry? #ByXIMPACT
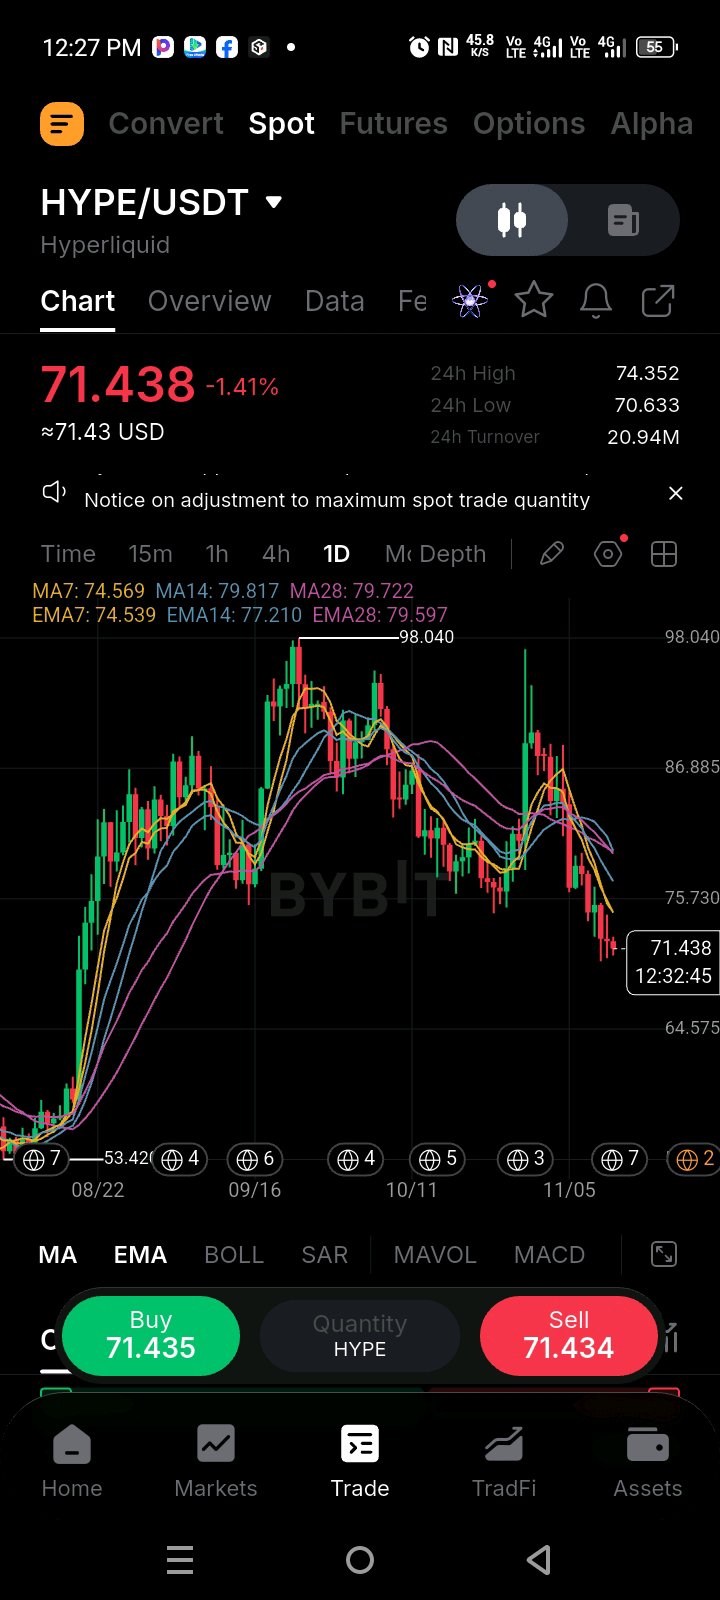
$HYPEUSDT is had a massive run up to 98 but the recent daily candles show heavy distribution. What caught my attention is the latest breakdown: price has sliced straight through the daily EMAs and is currently sitting at 71.43. The MA7 and MA14 are crossing down hard, and the 28 EMA at 79.59 is now acting as heavy overhead resistance. My read here is that the short-term trend has shifted bearish. This isn't a minor pullback anymore; the market is hunting for a new base. The structure remains weak while we are trading below 75.70, and I’m definitely not trying to catch this falling knife. Key Levels: Resistance: 75.73 (previous support turned resistance), 79.59 (28 EMA) Support: 70.63 (recent swing low) My Trade Plan: Bias: SHORT (Conditional) / Wait for Long Reclaim Entry (Short): $73.50 – $75.00 (On a dead-cat bounce into the broken support) Confirmation: I want to see a weak rejection wick or a bearish engulfing candle on the 4H chart as price tests this zone. If price reclaims 76 with volume, I step aside. Invalidation: $79.50 (A clean daily break above the 28 EMA invalidates the bearish continuation). TP1: $70.63 (Retest of the recent low) TP2: $65.00 (Next major liquidity zone) R:R: ~1:2.3 based on the stated levels. Why I'm taking this setup: When a high-flyer like HYPE breaks down below major daily moving averages after a blow-off top, the first bounce is usually sold. The 75.70 zone is a classic flip level (old support becoming new resistance). Selling the retest offers a tight invalidation with a clear path down to the recent lows. What would change my mind? If price sweeps 70.63 and immediately prints a massive bullish engulfing candle with high volume, that’s a liquidity grab. I’d close the short and wait for a higher low to form before considering a long. Until then, the trend is down. Are you shorting this bounce into 75, or waiting to see if 70.63 holds for a spot entry? #ByXIMPACT #WSOT2026
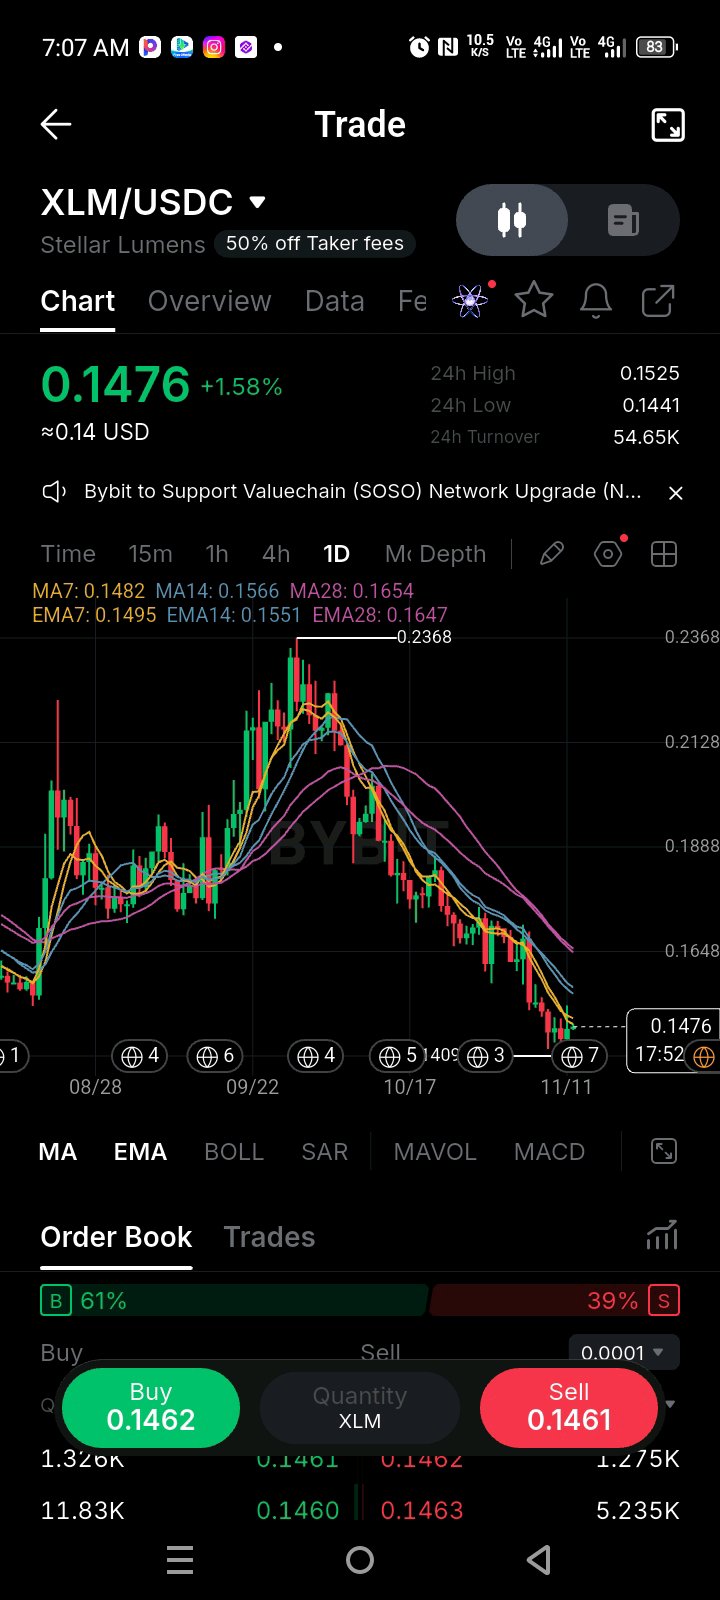
$XLMUSDT is at 0.1476 (+1.58%), about 38% below the 0.2368 peak. Price is 10% under the EMA28 (0.1647) and about 5% under the EMA14 (0.1551), and the gap between the averages has been widening for weeks. That means the trend is still firmly down, and today’s bounce is only a small move inside it. What I’m watching is the EMA7 (0.1495) just above. Price is below it, and so is the MA7 (0.1482). Until the daily closes above that level, I treat every green candle as a bounce, not a reversal. Key Levels: Resistance: 0.1495 (EMA7), 0.1525 (24h high), 0.1551 (EMA14), 0.1647 (EMA28) Support: 0.1441 (24h low), ~0.1409 (swing low) My Trade Plan: Bias: LONG (Conditional, counter-trend, small size) Confirmation: 0.1441 holds and price prints a higher low on the 4H Entry: 0.1445 – 0.1485 Invalidation: daily close below 0.1405 TP1: 0.1551 TP2: 0.1647 R:R: ~1:1.4 to TP1 and ~1:3.0 to TP2, from a 0.1465 entry Why I’m watching this setup: The stop sits just under the swing low, so the risk is small compared with the distance back to the averages. I’m trading a mean-reversion bounce, not calling the downtrend over. What would change my mind? A daily close below 0.1405 means the low has given way, and I step aside until a new base forms. If price instead closes above 0.1495, I’d reassess for a proper reclaim trade. Do you buy a bounce this far below the averages, or wait for a close above the EMA7 first? #ByXIMPACT #WSOT2026