PERROUQ_LTC
Technical analysis and risk management focused professionally
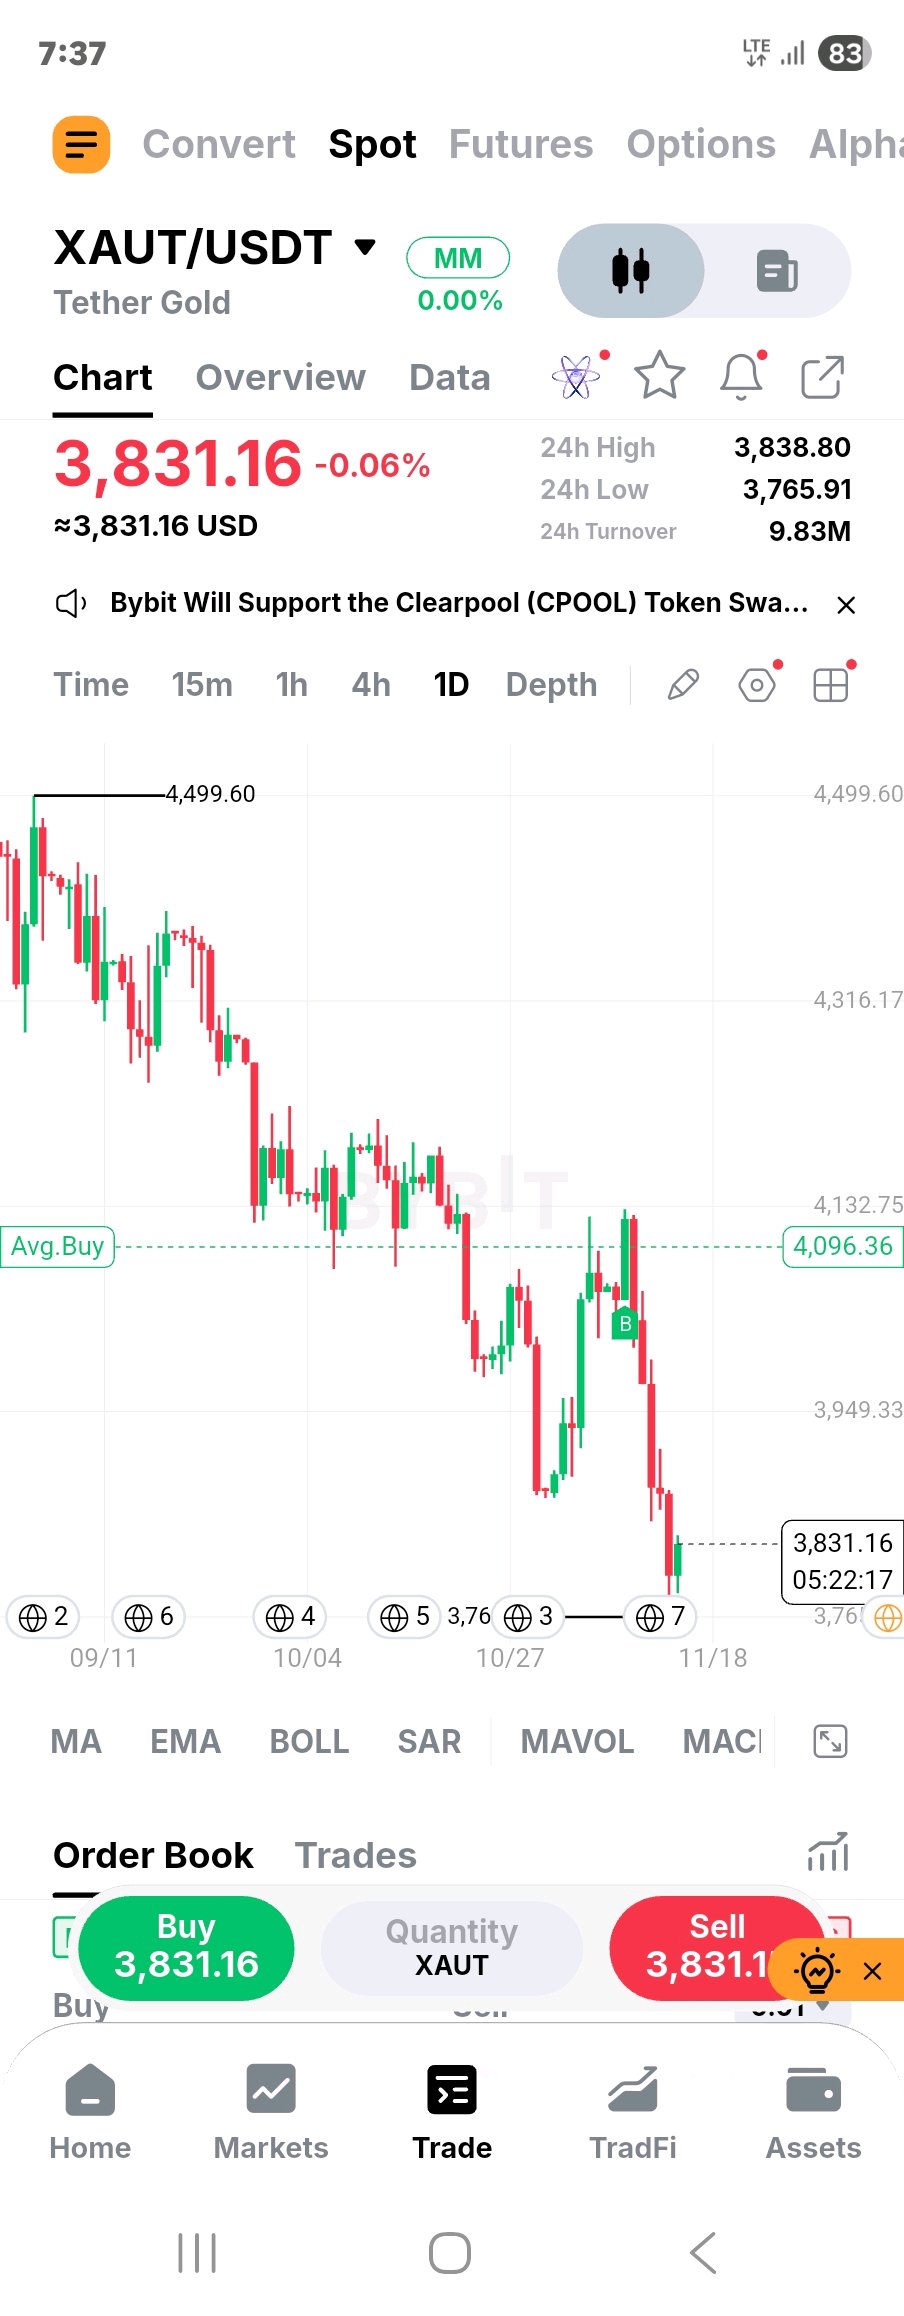
$XAUTUSDT | The Gold Market Is Testing Buyers' Conviction. Gold's daily chart is showing a structure that deserves attention. After trading around $4,500, XAUT has experienced a sustained decline, with lower highs and lower lows dominating the broader price action. The latest move toward $3,766 has attracted some buying interest, pushing price back toward $3,831. However, a bounce from support doesn't automatically mean the sellers have lost control. Here's what I'm watching: $3,765–$3,800: Immediate support zone. Buyers need to defend this area to prevent another leg lower. $3,949: First meaningful recovery hurdle. Reclaiming this level would improve the short-term picture. $4,096–$4,132: A more important resistance region. This area previously attracted selling pressure, making it a key test for any bullish recovery. My market perspective: The daily structure remains bearish until proven otherwise. A sustained move above $3,949 would be an encouraging first signal, while reclaiming the $4,096–$4,132 region would provide stronger evidence that buyers are regaining control. On the other hand, losing the $3,765 support could expose XAUT to further downside. I'm more interested in how price reacts at these levels than in chasing the current bounce. The real question: Is this the beginning of a recovery, or simply a pause before sellers return? I'd like to see the market answer that before taking a directional position. #ByXIMPACT
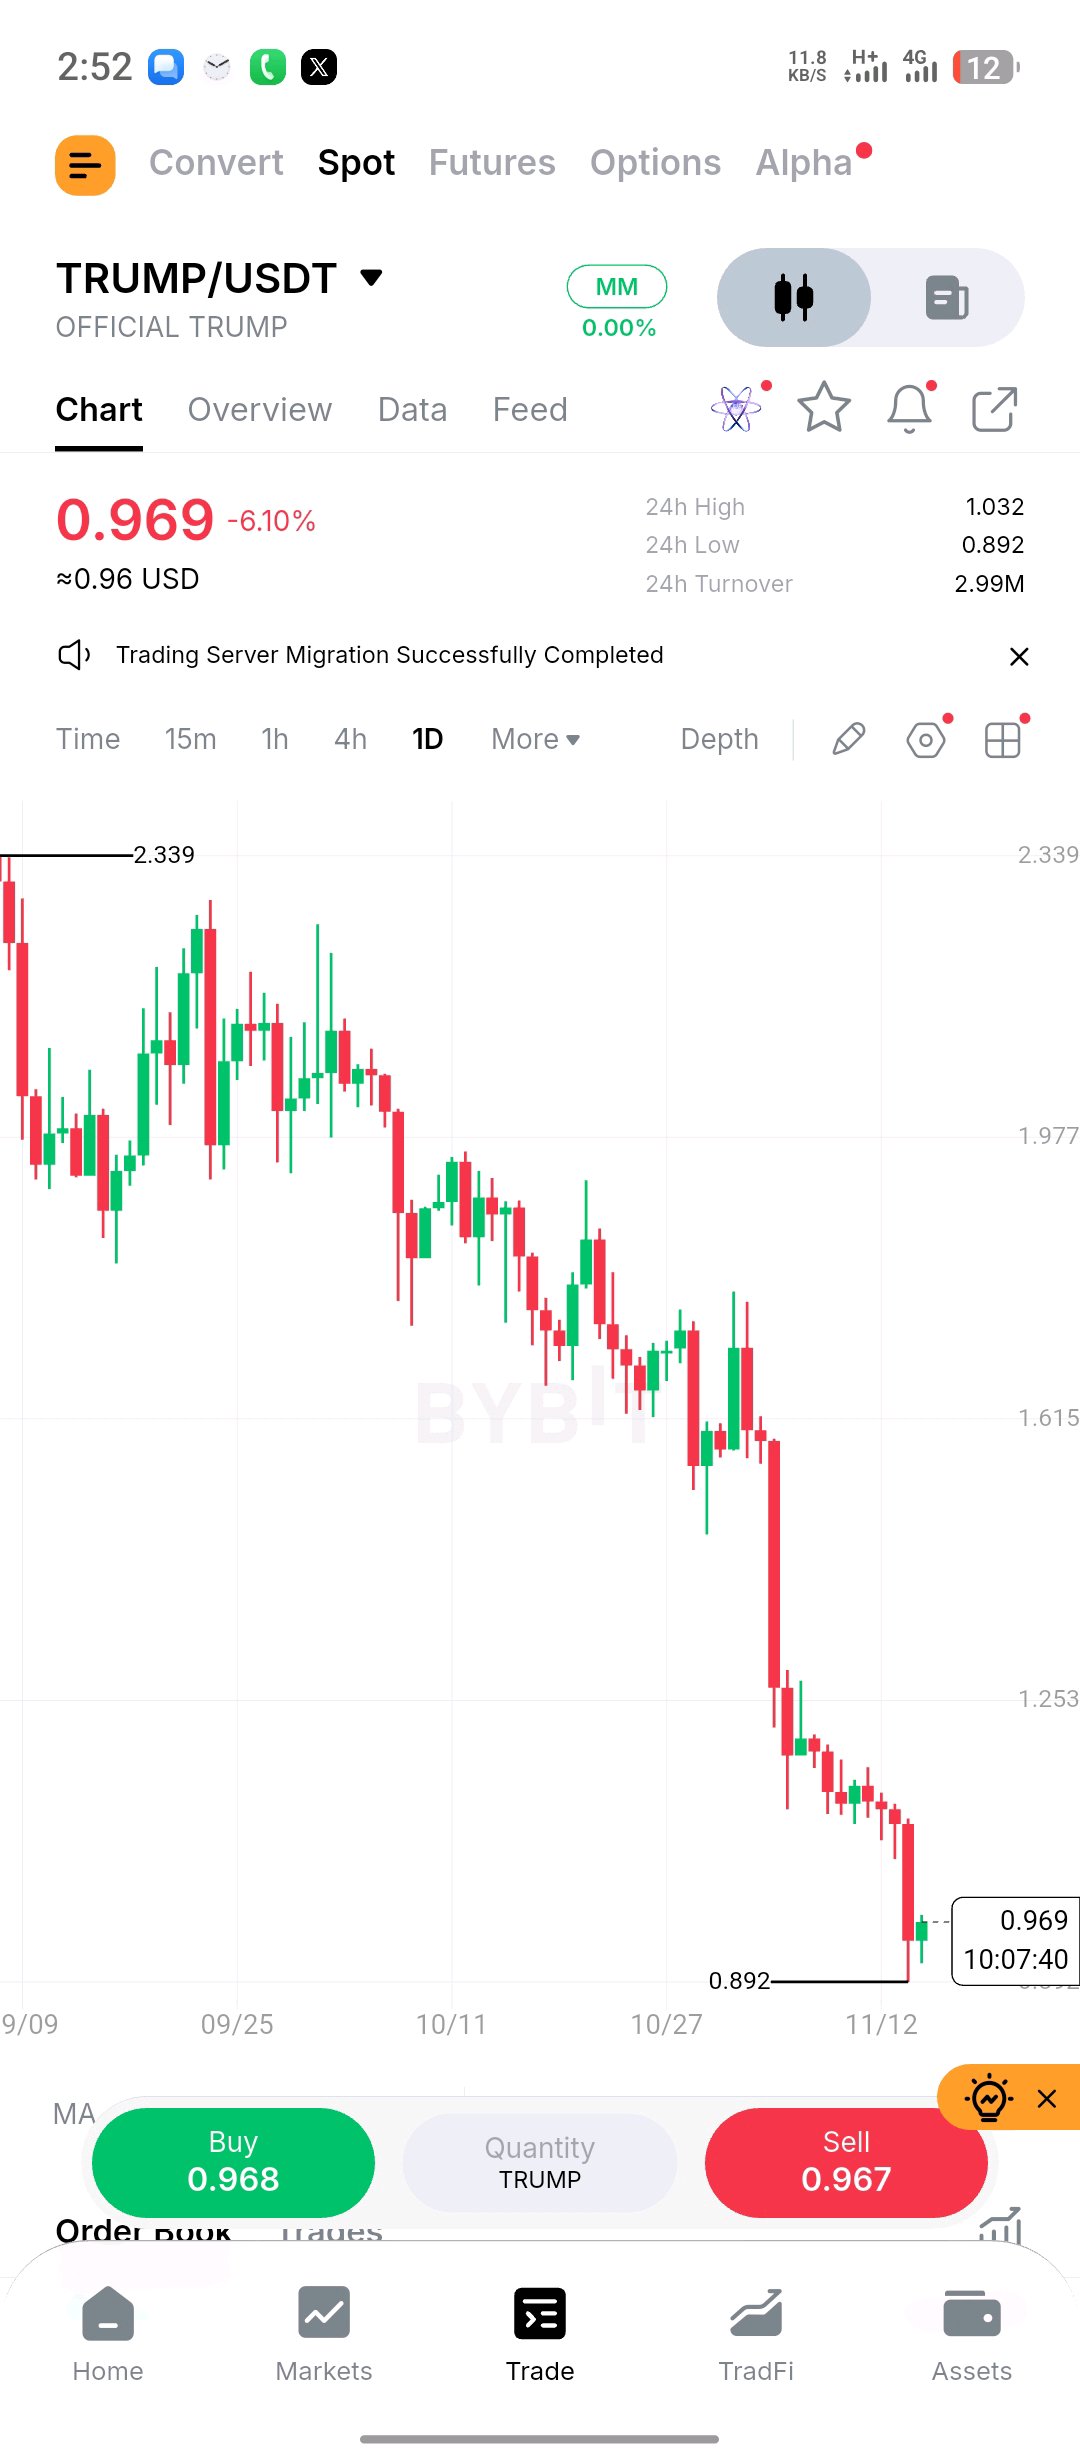
$TRUMPUSDT : When Selling Pressure Becomes Exhaustion, What Comes Next? There's an interesting development on the TRUMP/USDT daily chart. After trading around $2.339 at its previous high, the token has experienced a prolonged decline, with sellers consistently controlling the direction of price. Now trading around $0.969, TRUMP has recently tested $0.892 and produced a small reaction. But here's where I think traders need to be careful. A sharp decline can eventually attract bargain hunters, but lower prices alone don't confirm that sellers have exhausted their strength. I'm watching three areas: $0.892 — The defensive line. This is the recent swing low. If buyers fail to protect it, further downside pressure becomes a possibility. $1.032 — The first recovery test. Reclaiming this level would be an early indication that buyers are becoming more active. $1.253 — The bigger challenge. A sustained move above this region would make the recovery considerably more interesting. What concerns me is the broader structure. TRUMP continues to print lower highs, and buyers haven't yet demonstrated the strength needed to change that pattern. My approach here is simple: don't confuse a reaction with a reversal. I'd rather miss the first part of a recovery than enter based on a signal that hasn't been confirmed. One thing worth discussing: Does TRUMP need another liquidity sweep below $0.892 before a meaningful recovery, or can buyers build a base above the current level? The next few daily candles could provide important clues.#ByXIMPACT
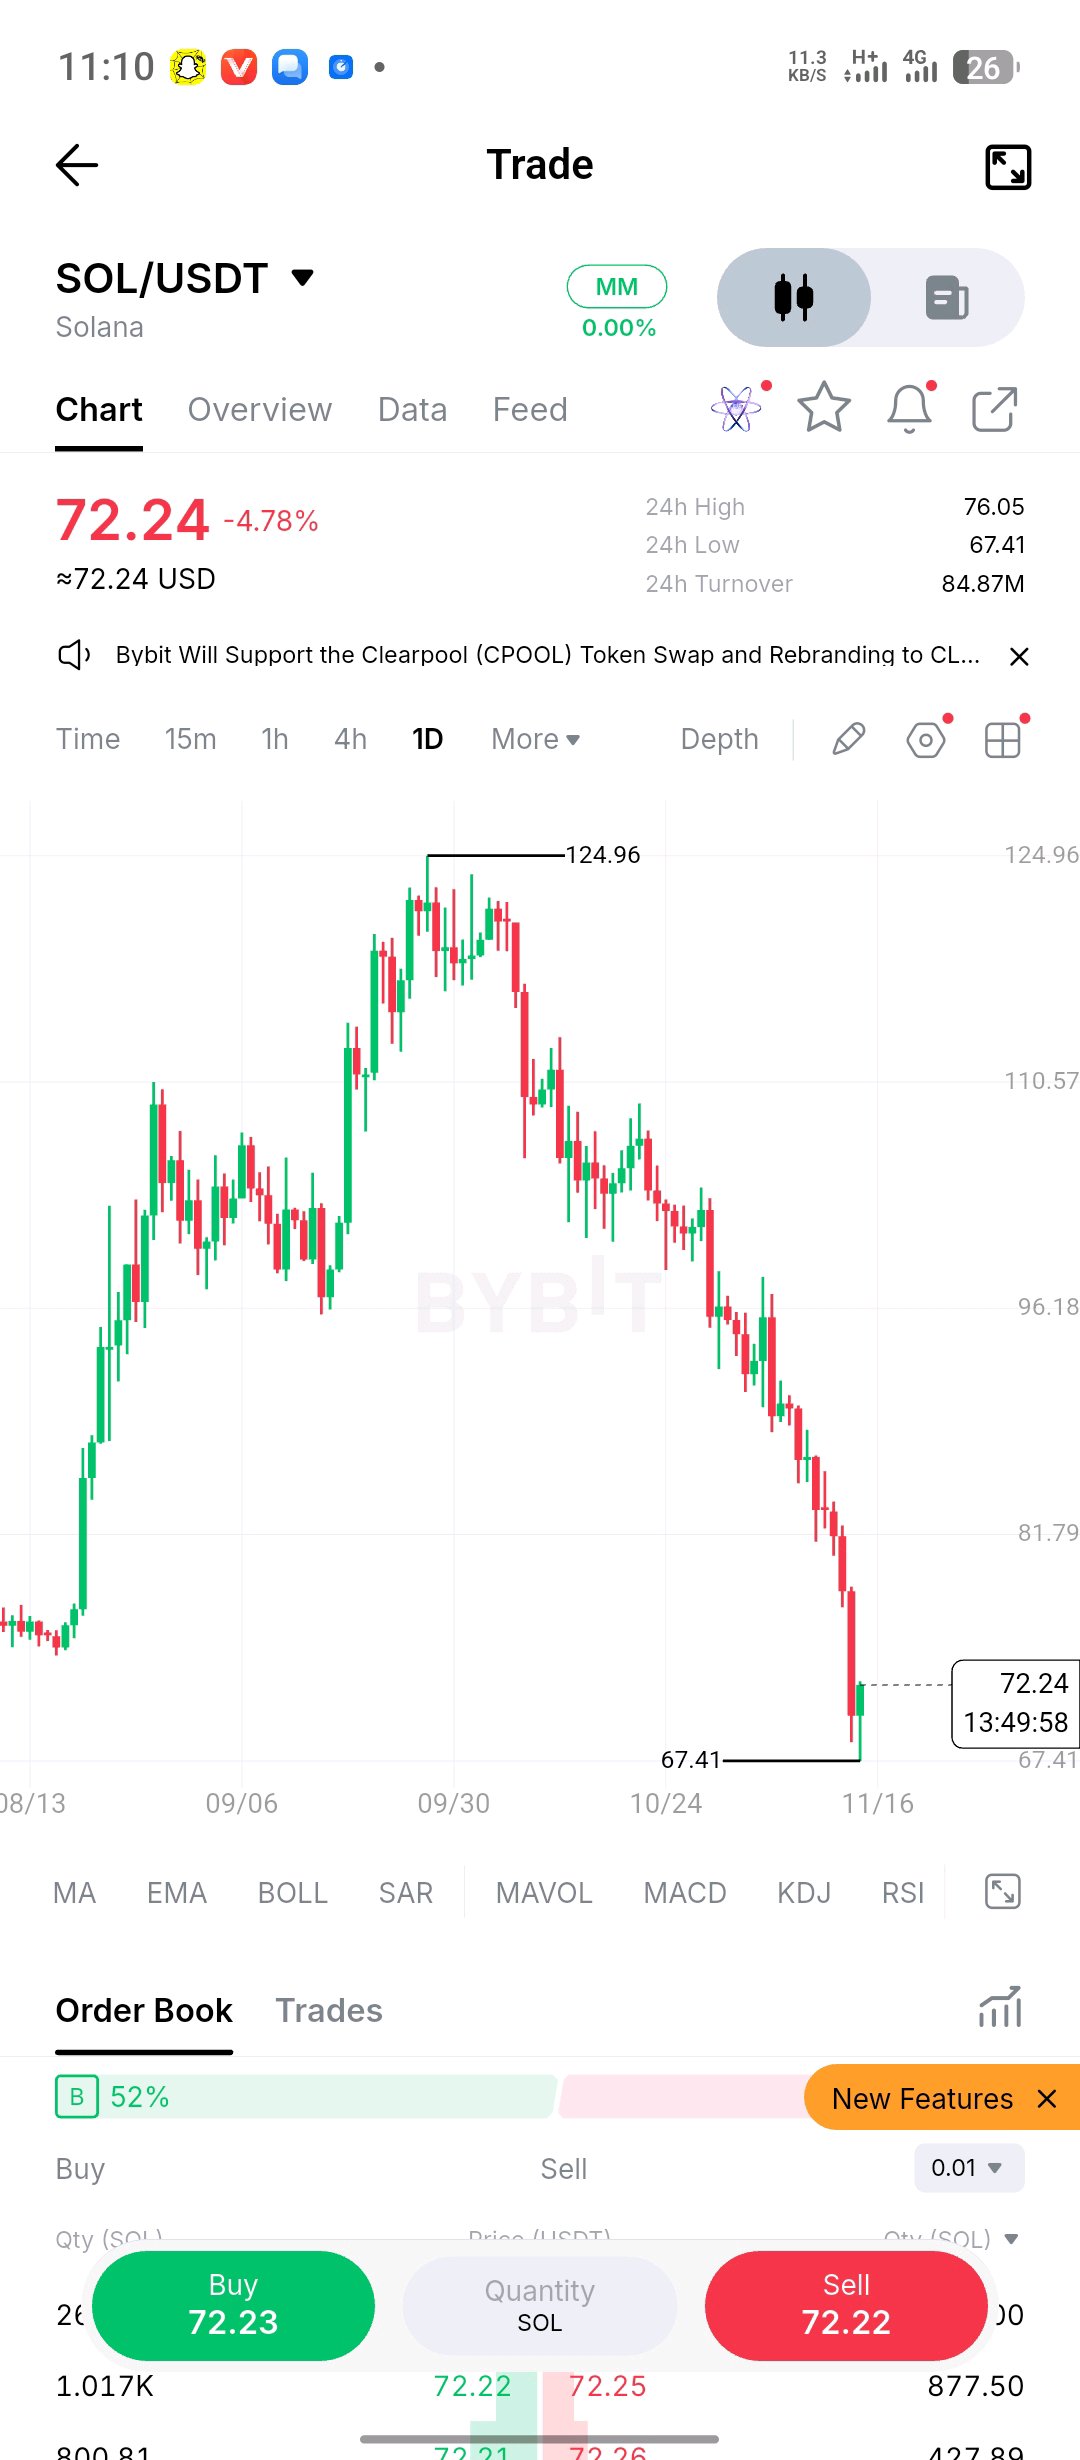
$SOLUSDT : A Small Bounce Doesn't Erase a Much Bigger Problem. Solana has experienced a significant change in market structure. The move from $124.96 to the current $72 region hasn't been an ordinary pullback. The daily chart shows a sequence of lower highs, weakening recoveries and increasingly aggressive selling. But something deserves attention now. SOL recently tested $67.41 and managed to bounce. That reaction is interesting, but I wouldn't interpret it as confirmation that the bottom is in. Here's the situation I'm monitoring: $67.41: The immediate level buyers need to defend. A convincing breakdown could introduce another wave of selling. $76.05: The first important recovery challenge. Reclaiming this area would be an encouraging development. $81.79: A more significant resistance level. Getting back above it would help improve the short-term technical picture. One thing traders should remember: markets can produce impressive relief rallies even while the larger trend remains bearish. For SOL, the priority should be rebuilding structure, not simply recovering a few dollars. I want to see buyers demonstrate consistency, establish a higher low and challenge the resistance levels that previously acted as support. Until then, caution remains justified. Sometimes the most important trading decision isn't finding the perfect entry. It's knowing when the market hasn't given you enough evidence to take one. What do you think SOL needs first: a strong reclaim of $76, or another test of the $67 support before a meaningful recovery?#ByXIMPACT
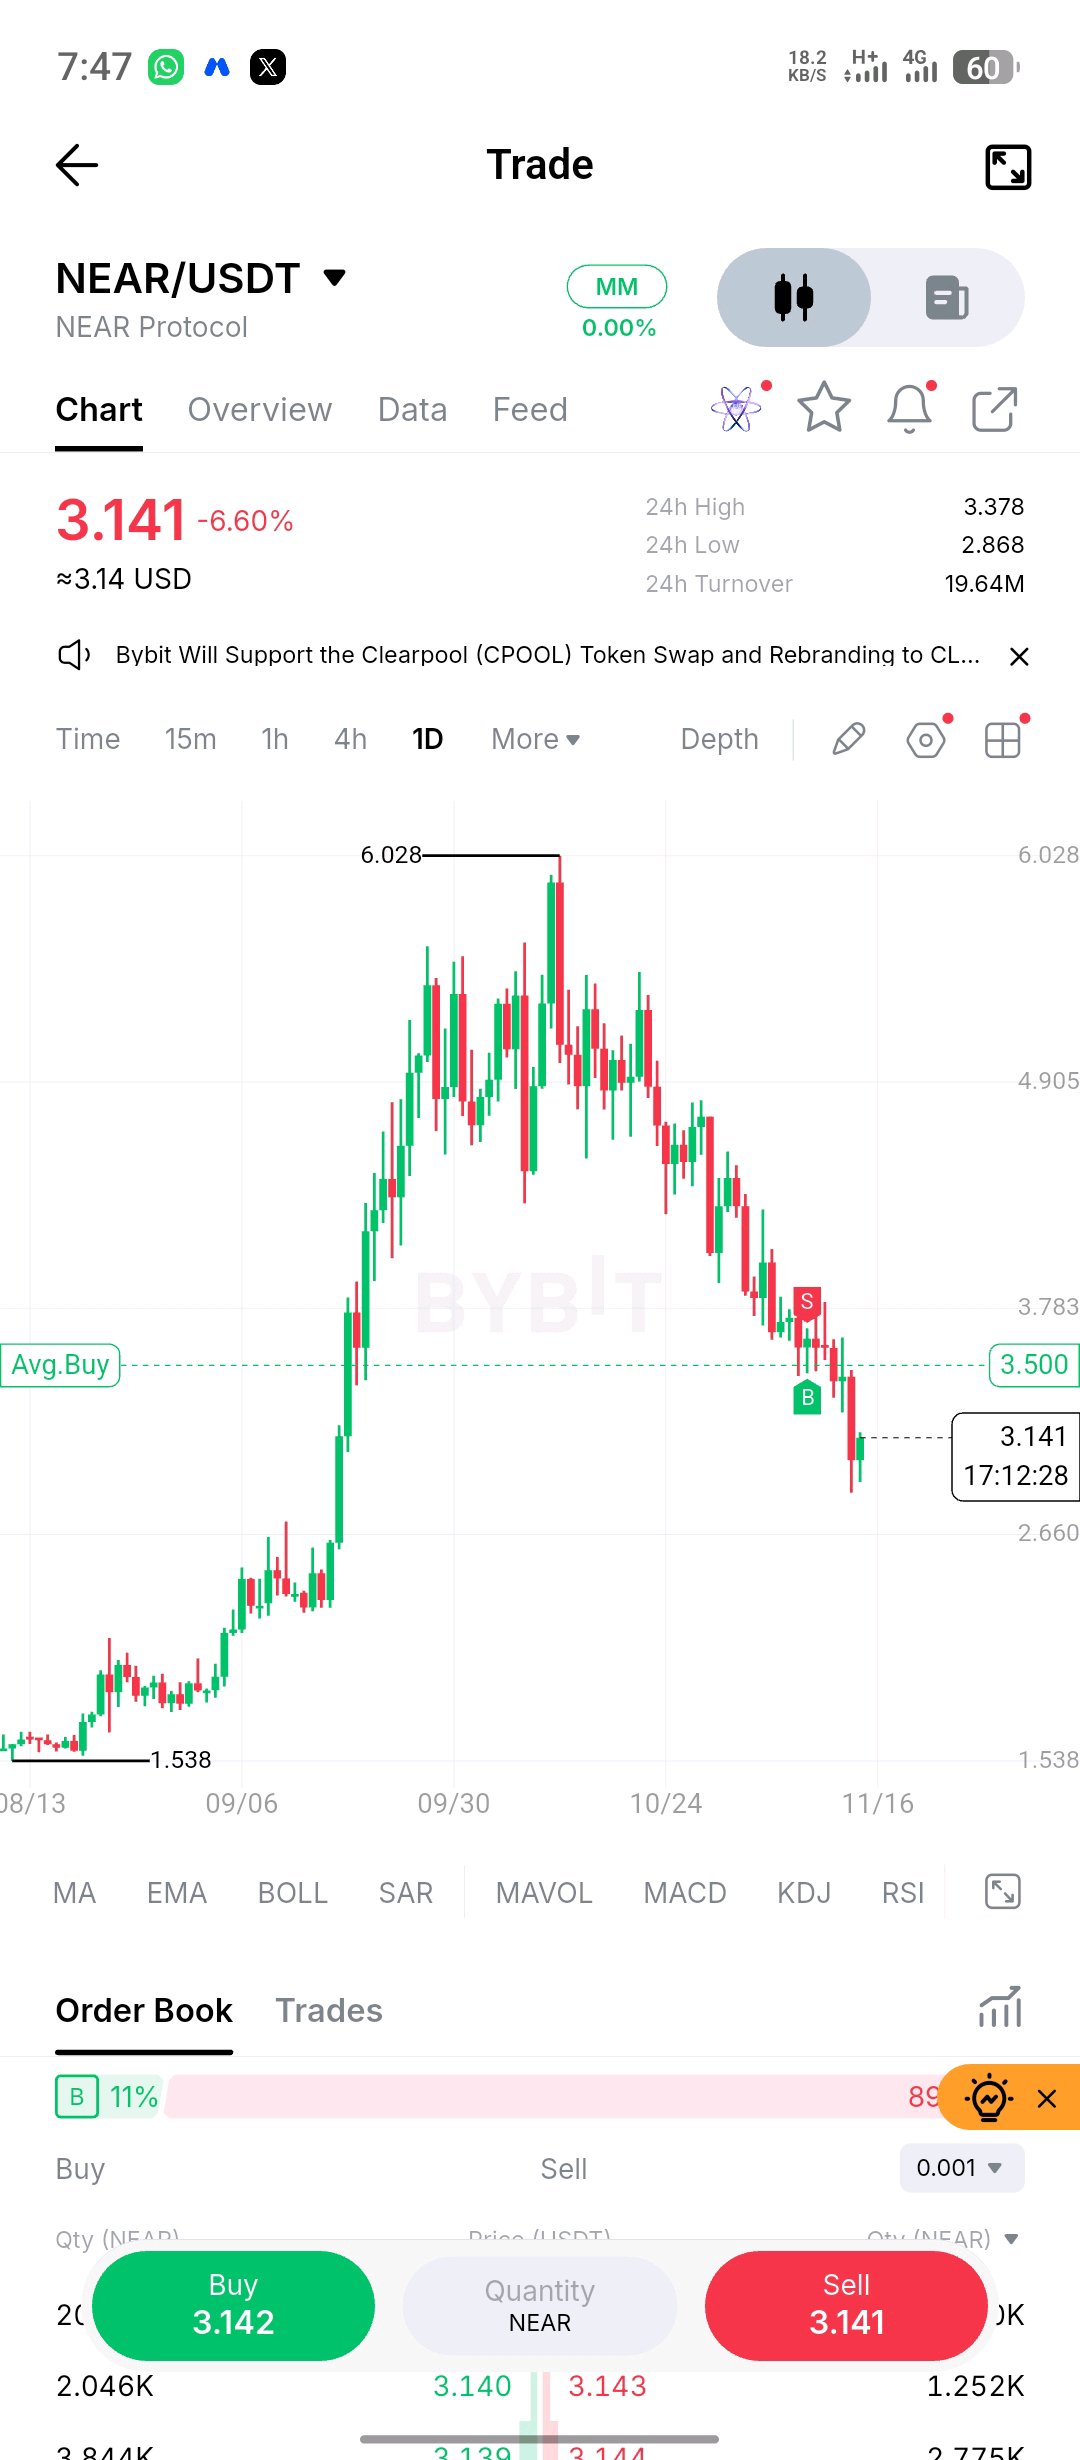
$NEARUSDT Protocol: What Happens After a Rally Loses Its Momentum? NEAR's chart tells an interesting story about market psychology. After climbing from roughly $1.53 to $6.02, the asset entered a sustained correction. What's particularly important is that the decline hasn't been characterized by just one major sell-off. Instead, sellers have repeatedly taken control whenever price attempts to recover. That's a sign worth paying attention to. At around $3.14, NEAR is approaching an important decision area. Here's my current market perspective: The defensive zone: $2.86–$2.90. Buyers recently reacted around this region. If it fails to hold, $2.66 becomes an important downside reference. The recovery challenge: $3.50 is the first level I'd like to see reclaimed. Beyond that, $3.78 could provide a more meaningful test of bullish strength. But there's something traders should avoid here: confusing a bounce with a trend reversal. NEAR doesn't necessarily need another aggressive rally immediately. It first needs to demonstrate that buyers can absorb selling pressure and establish a stronger market structure. Until that happens, the broader bearish setup deserves respect. My takeaway: The next meaningful move will be determined by whether buyers can turn the current support reaction into an actual structural recovery. Are we approaching a potential accumulation phase, or is NEAR still searching for a durable bottom?#ByXIMPACT
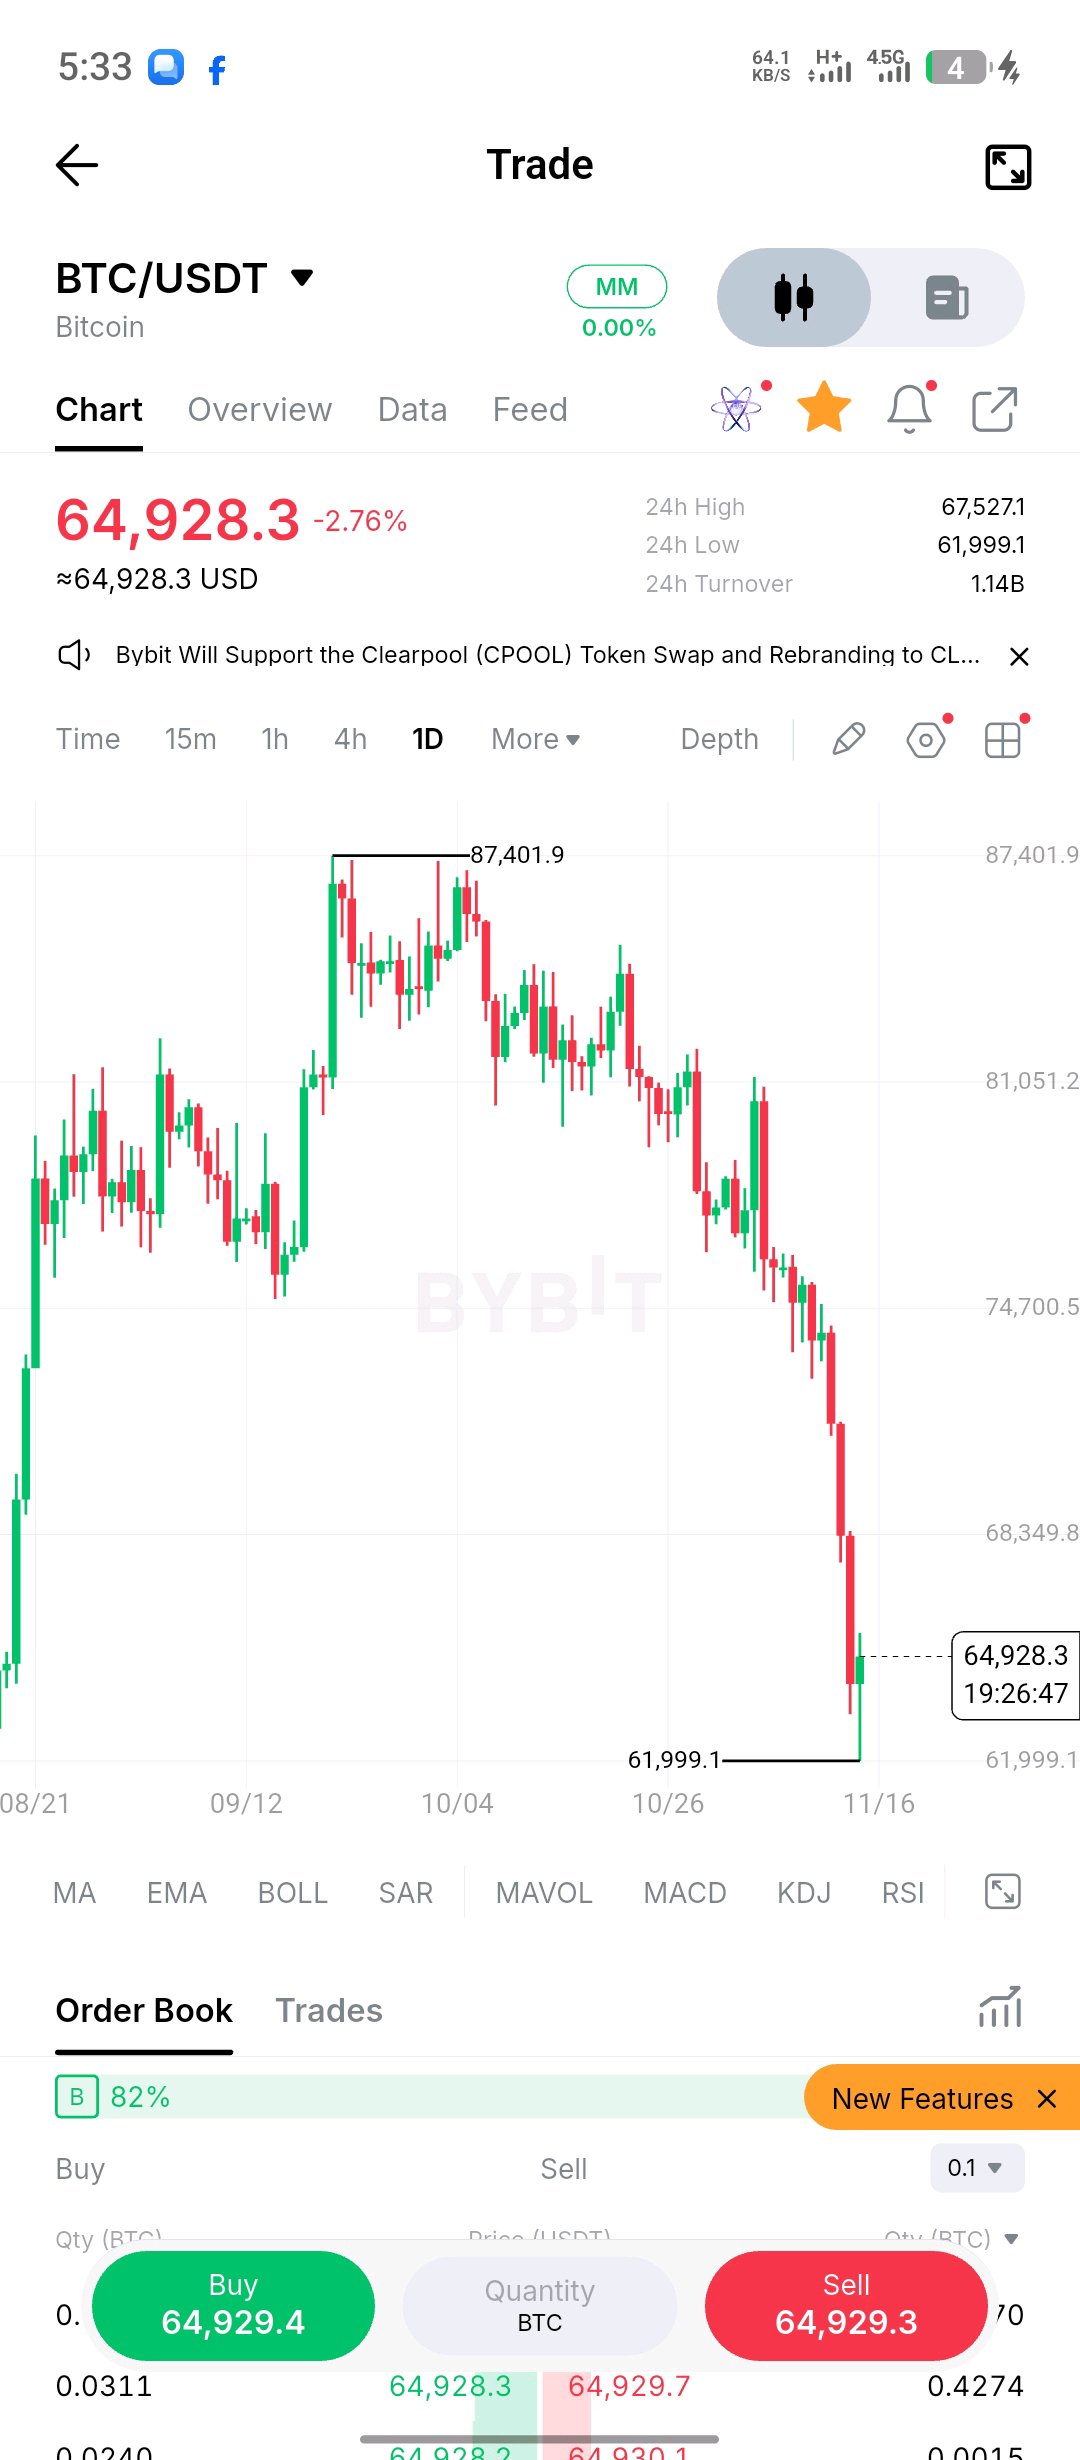
$BTCUSDT BITCOIN'S SELL-OFF IS GETTING SERIOUS — IS $62,000 THE NEXT BATTLEGROUND? Bitcoin is facing renewed downside pressure, with BTC trading around $64,928, down approximately 2.76% on the displayed chart. The daily timeframe reveals a significant deterioration in market structure. What deserves attention is not just the decline itself, but the aggressive rejection of higher prices and the failure of buyers to sustain recovery attempts. TECHNICAL MARKET BREAKDOWN 1. Market Structure BTC has transitioned into a bearish short-term structure, characterized by lower highs and increasingly aggressive selling pressure. 2. Price Action The latest sell-off pushed Bitcoin toward the $62,000 region before a modest recovery. This suggests buyers are attempting to defend the lower levels, but a sustainable reversal is not yet confirmed. 3. Support & Resistance The immediate priority is whether BTC can establish stability above its recent support region or whether sellers will force another breakdown. KEY LEVELS TO WATCH Major Support: $62,000–$62,500 Immediate Resistance: $65,500–$66,000 Major Resistance: $67,400 📉 Downside Scenario: A decisive daily close below $62,000 could expose BTC to another bearish extension. BEARISH INVALIDATION A sustained daily close above $66,000 would weaken the immediate bearish continuation thesis and suggest buyers are beginning to regain control. Until that happens, recovery attempts should be treated cautiously. TRADE STRATEGY & RISK MANAGEMENT My approach is to prioritize confirmation over anticipation. - Avoid chasing aggressive bearish candles. - Watch for a confirmed breakdown below support before considering short exposure. - Monitor rejection around resistance for potential bearish opportunities. - Keep individual trade risk within 0.5–1% of account equity. - Aim for a minimum 1:2 risk-to-reward ratio. - Define stop-loss and invalidation before entering. - Avoid excessive leverage during periods of elevated volatility. A good trader doesn't need to catch every move. The objective is to survive volatility, preserve capital and execute only when the risk is justified. FINAL MARKET OUTLOOK Bitcoin remains vulnerable to further downside while it trades below the immediate recovery zone. However, the reaction around $62,000 could become important in determining whether this is another continuation move or the beginning of a meaningful relief rally. The next daily closes deserve close attention. LET'S DEBATE: Is Bitcoin preparing to break below $62K, or have sellers pushed the market far enough to create a powerful recovery? Are you bearish until $66K is reclaimed, or do you believe this is where buyers finally step in? I want to hear the technical reasoning behind your position. #ByXIMPACT
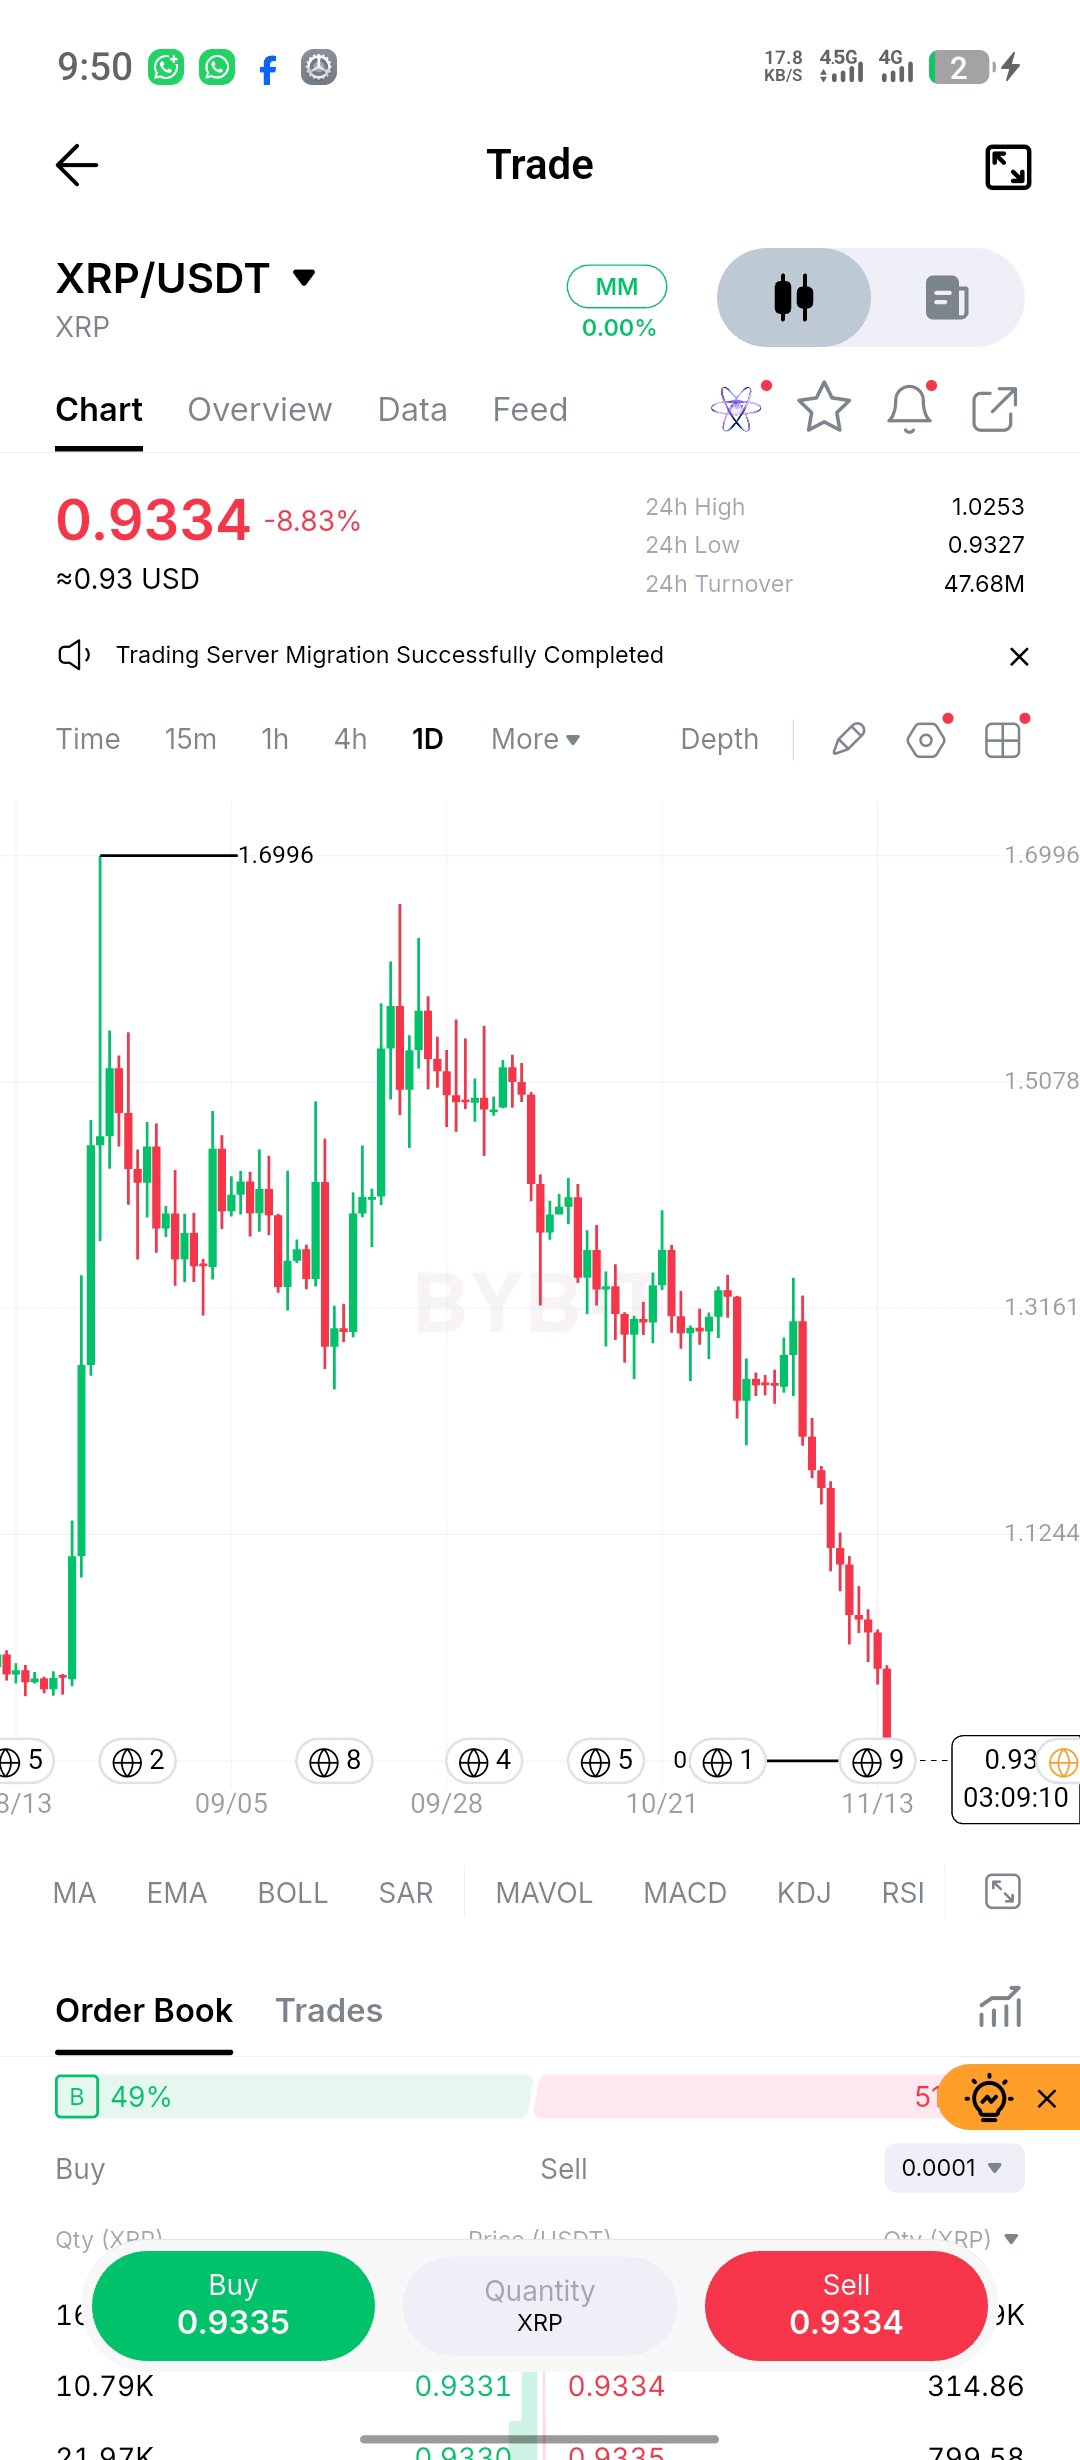
$XRPUSDT UNDER HEAVY SELLING PRESSURE — IS THE MARKET PREPARING FOR ANOTHER LEG DOWN? XRP is showing significant weakness on the daily timeframe, with price currently around $0.9334, following an aggressive decline. What makes this move particularly important is that the broader price structure has progressively weakened. Buyers have repeatedly failed to establish sustained recovery, while sellers continue to push price toward lower levels. TECHNICAL MARKET ANALYSIS 1. Market Structure XRP has developed a sequence of lower highs and lower lows after its previous rally. This indicates a weakening bullish structure and continued bearish control. 2. Price Action The latest bearish candles suggest strong selling participation. The sharp decline also indicates that buyers have struggled to defend previous price levels. 3. Support & Resistance The market is approaching an important support region around $0.90–$0.93. A sustained breakdown below this area could expose XRP to further downside. IMPORTANT LEVELS TO MONITOR Immediate Support: $0.90–$0.93 First Resistance: $1.00–$1.05 Major Recovery Zone: $1.10–$1.15 Bearish Invalidation: A sustained daily close above the $1.05–$1.10 region would significantly weaken the immediate bearish continuation thesis. TRADE EXECUTION & RISK MANAGEMENT My approach is to remain patient rather than chase an extended bearish candle. - Wait for a confirmed support breakdown before considering short exposure. - Alternatively, watch for a rejection near resistance before looking for a bearish entry. - Keep position sizing proportional to account equity. - Risk a maximum of 0.5–1% of trading capital per setup. - Target a minimum risk-to-reward ratio of 1:2. - Always define stop-loss placement before entering. - Avoid excessive leverage and emotional trading. Capital preservation comes first. There is no reason to risk an entire account trying to predict the next candle. PROFESSIONAL MARKET OUTLOOK XRP remains under bearish pressure, but the current decline also brings the possibility of a short-term relief bounce. I would not consider a reversal confirmed until buyers reclaim important resistance and establish a stronger market structure. For now, confirmation matters more than prediction. THE BIG QUESTION: Is XRP preparing to lose the $0.90 support and extend its decline, or are sellers approaching exhaustion? Are you looking for a breakdown opportunity or waiting for a confirmed reversal? Let's discuss the market structure, not just the direction. #ByXIMPACT
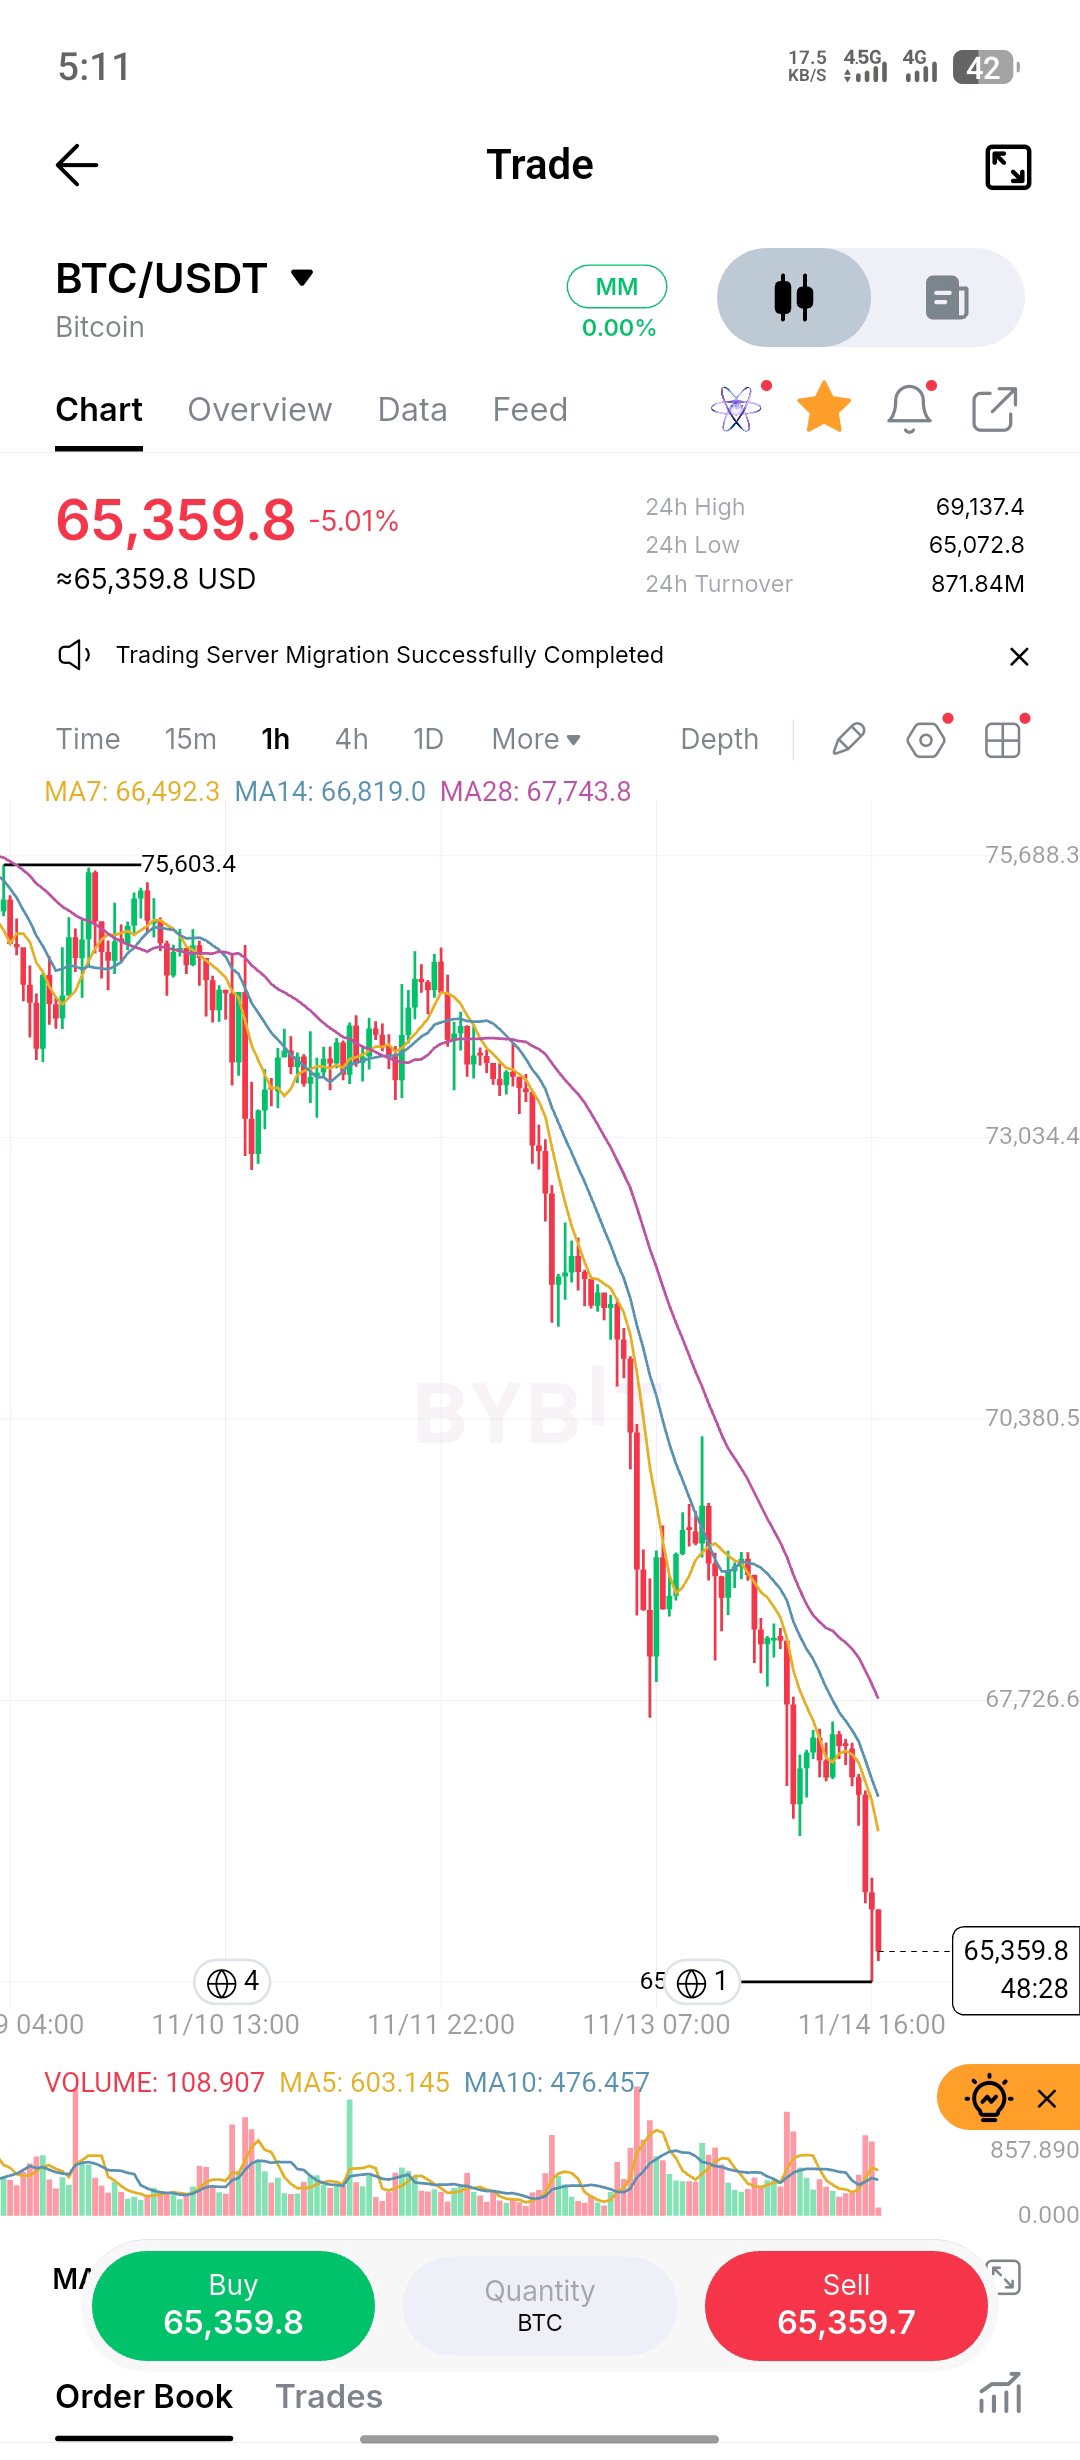
$BTCUSDT BITCOIN UNDER PRESSURE: HOW MUCH LOWER CAN IT GO? Bitcoin's sell-off is becoming increasingly aggressive. Sellers remain in control, but the next move will depend on whether buyers can defend the current support zone. Technical Breakdown • Market structure continues to favor sellers, with lower highs and lower lows. • Moving averages remain bearish and act as overhead resistance. • Selling volume is increasing, suggesting strong downside participation. KEY LEVELS TO WATCH Support: 65,000k — Losing this level could accelerate downside pressure. Resistance: 67,700k — First major recovery hurdle. BEARISH INVALIDATION: 67,700k A sustained 4H candle close above 67,700k would weaken the current bearish setup and suggest buyers are regaining control. Until then, downside pressure remains the dominant scenario. My Take I wouldn't rush to buy this dip just because BTC looks oversold. A reversal needs confirmation, not hope. LET'S SETTLE THE DEBATE: Is Bitcoin preparing for another leg down, or are sellers running out of ammunition? Are you BUYING this weakness or staying SHORT? Drop your reasoning below. #ByXIMPACT
$HYPEUSDT ISN'T SHOWING SIGNS OF STRENGTH YET. THE NEXT MOVE COULD BE DECISIVE. A sharp decline has shifted the balance of power toward sellers, and the latest price action raises an important question: are buyers waiting for a discount, or have they lost confidence in the current market structure? Here's what matters: • Trend: Lower highs and lower lows continue to define the price structure. • Dynamic resistance: The moving averages remain overhead and point downward, making recovery attempts vulnerable to rejection. • Volume: Selling activity has picked up around the latest decline. This deserves attention, although sustained follow-through is needed to confirm continuation. • Critical area: The recent low around 66.80 is the immediate level to monitor. A convincing breakdown could extend bearish pressure. What would change my outlook? I want to see sellers lose momentum, followed by a strong reclaim of the moving-average cluster and a confirmed higher high. Until then, calling a bottom would be premature. My assessment: Bearish continuation remains the higher-probability scenario unless buyers reclaim meaningful resistance. One thing I'm watching closely: whether HYPE can defend its recent low or turns it into another resistance level. What's your interpretation of this move? Is this the beginning of accumulation, or are bulls stepping in too g #ByXIMPACT
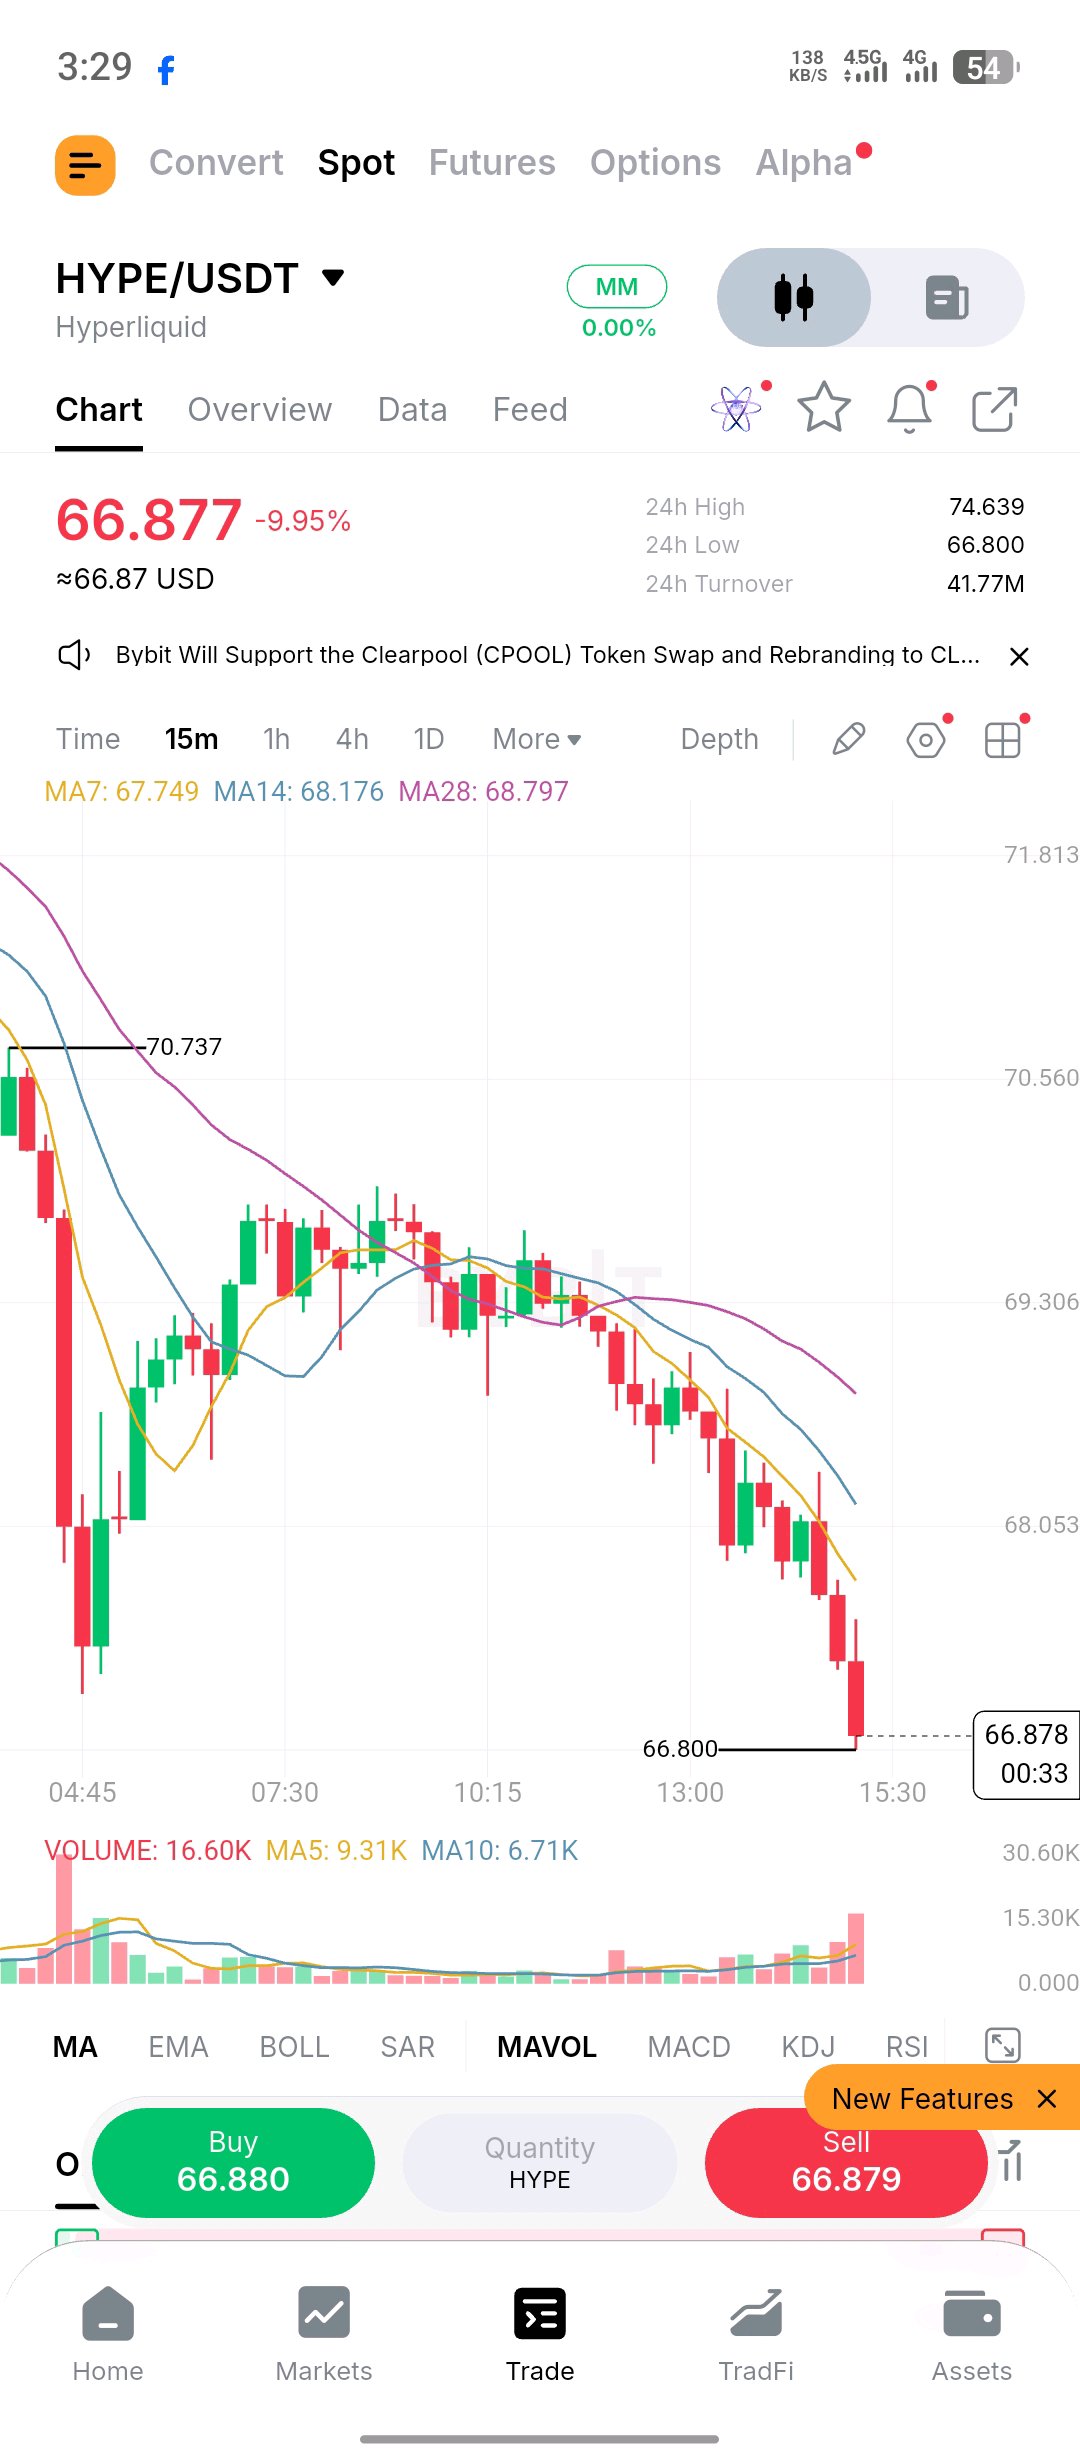
HYPE ISN'T SHOWING SIGNS OF STRENGTH YET. THE NEXT MOVE COULD BE DECISIVE. A sharp decline has shifted the balance of power toward sellers, and the latest price action raises an important question: are buyers waiting for a discount, or have they lost confidence in the current market structure? Here's what matters: • Trend: Lower highs and lower lows continue to define the price structure. • Dynamic resistance: The moving averages remain overhead and point downward, making recovery attempts vulnerable to rejection. • Volume: Selling activity has picked up around the latest decline. This deserves attention, although sustained follow-through is needed to confirm continuation. • Critical area: The recent low around 66.80 is the immediate level to monitor. A convincing breakdown could extend bearish pressure. What would change my outlook? I want to see sellers lose momentum, followed by a strong reclaim of the moving-average cluster and a confirmed higher high. Until then, calling a bottom would be premature. My assessment: Bearish continuation remains the higher-probability scenario unless buyers reclaim meaningful resistance. One thing I'm watching closely: whether HYPE can defend its recent low or turns it into another resistance level. What's your interpretation of this move? Is this the beginning of accumulation, or are bulls stepping in too early? #ByXIMPACT
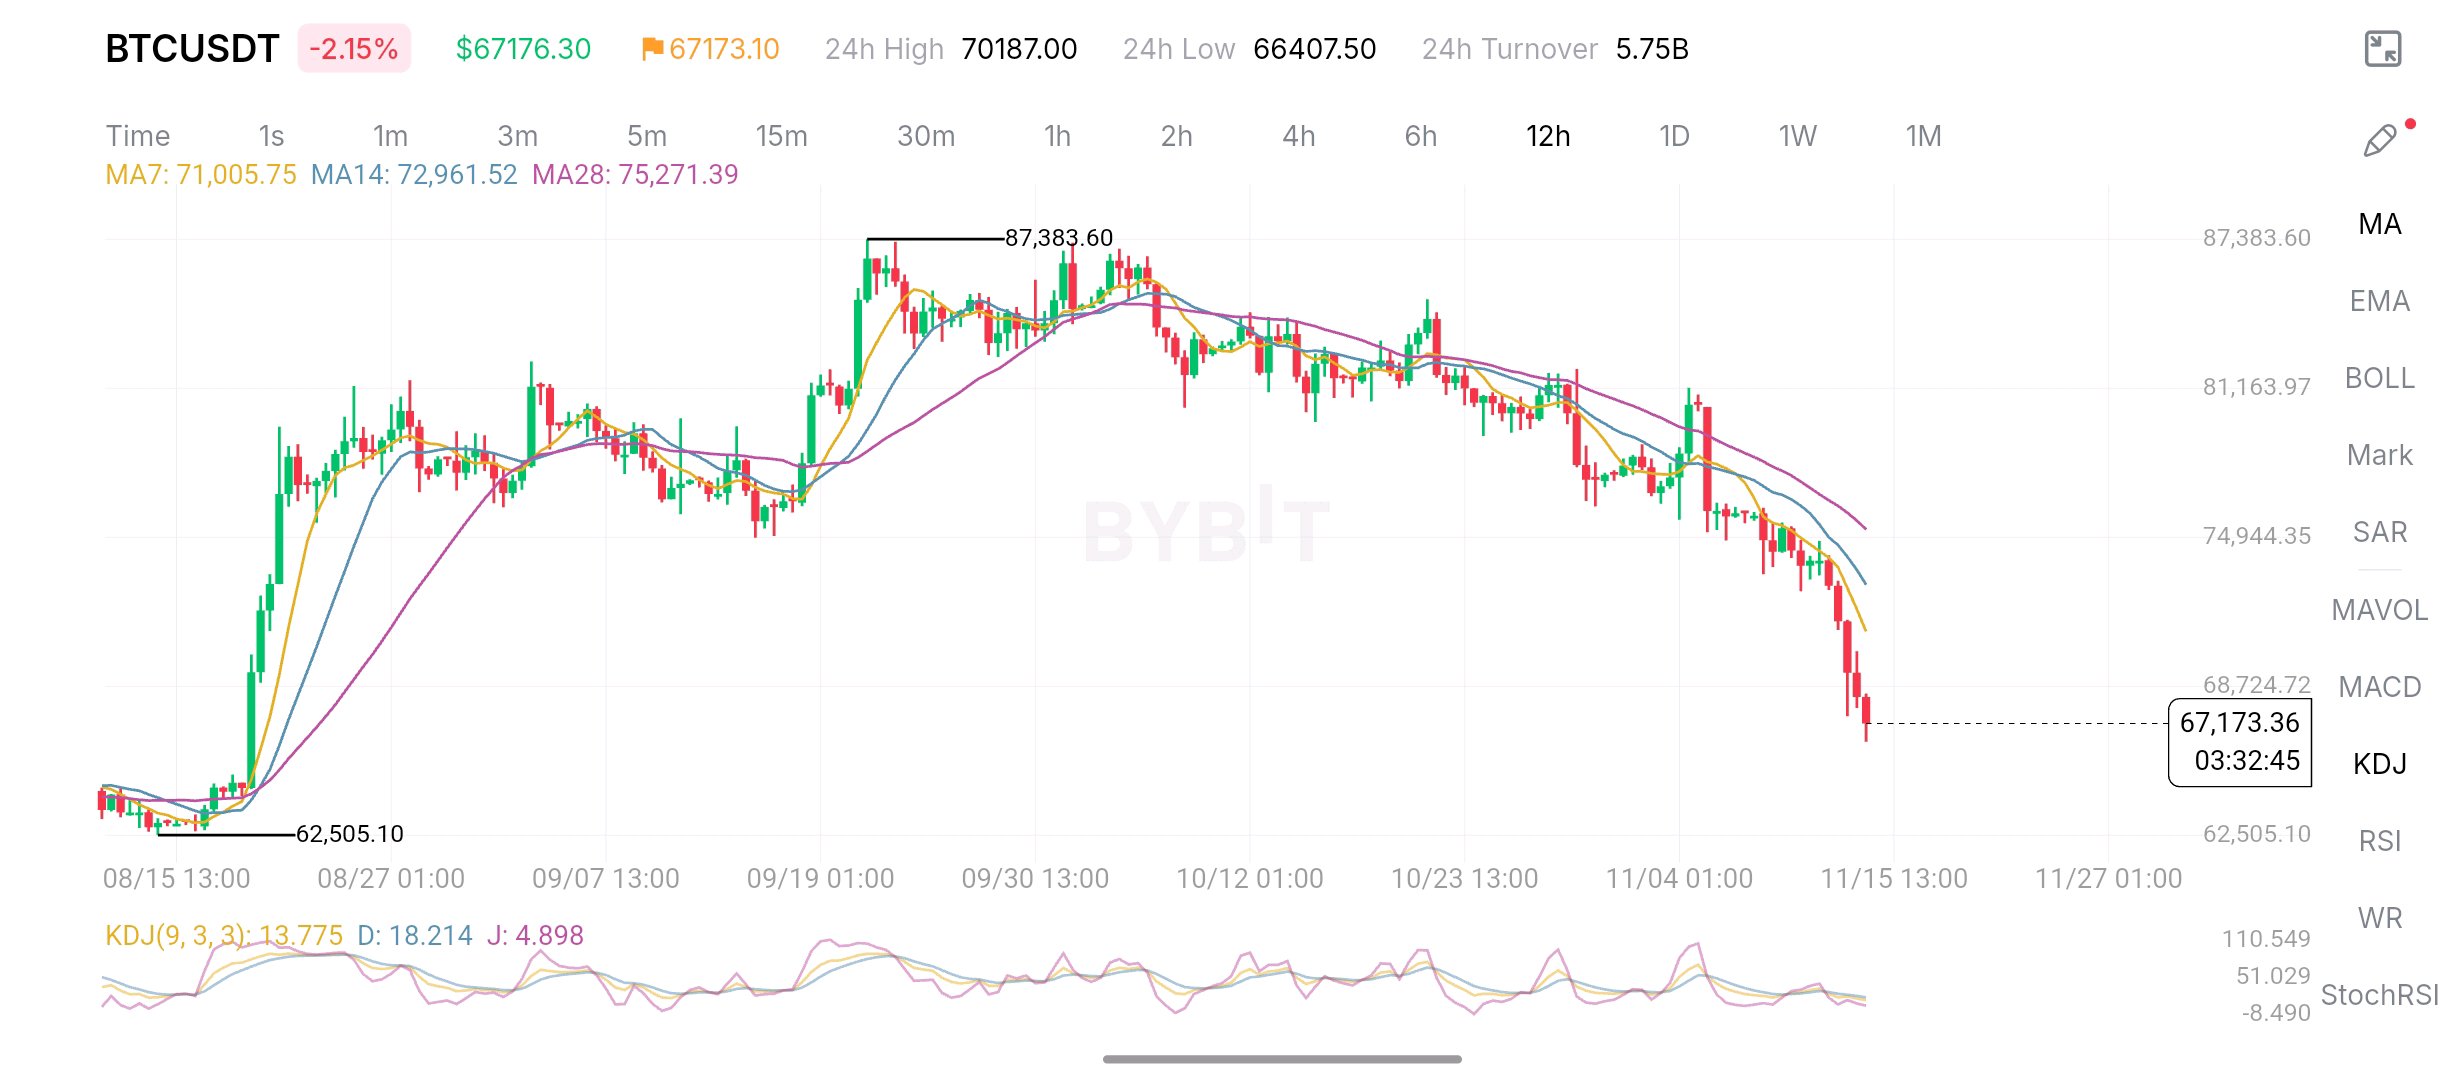
$BTCUSDT : The bears are taking control, and Bitcoin needs to prove otherwise. Looking at the 12H chart, the market structure is becoming increasingly bearish. BTC has been forming lower highs, and the recent selling pressure has pushed price below the major moving averages. What concerns me most is that buyers had several opportunities to regain momentum, but none of those recovery attempts produced a convincing breakout. Now we're seeing another strong wave of selling. My trader's viewpoint: I'm leaning bearish on BTC until the chart gives a genuine reason to change that view. Here's what I'm watching: Support: The 66,400k–66,500k region is an important area to watch. Losing this zone could expose BTC to further downside. Resistance: BTC needs to recover above the nearby resistance and reclaim its moving averages before bulls can start building a stronger case. Bearish confirmation: A sustained break below recent support, followed by continued selling pressure. Bullish confirmation: A strong recovery candle, increasing buying volume, and a confirmed break above the descending moving averages. Personally, I'm not interested in calling a bottom just because Bitcoin has dropped significantly. The trend is still pointing down, and buyers need to demonstrate real strength before I reconsider. Let's hear your opinion: Is Bitcoin preparing for another major correction, or are we getting close to a strong recovery? #ByXIMPACT
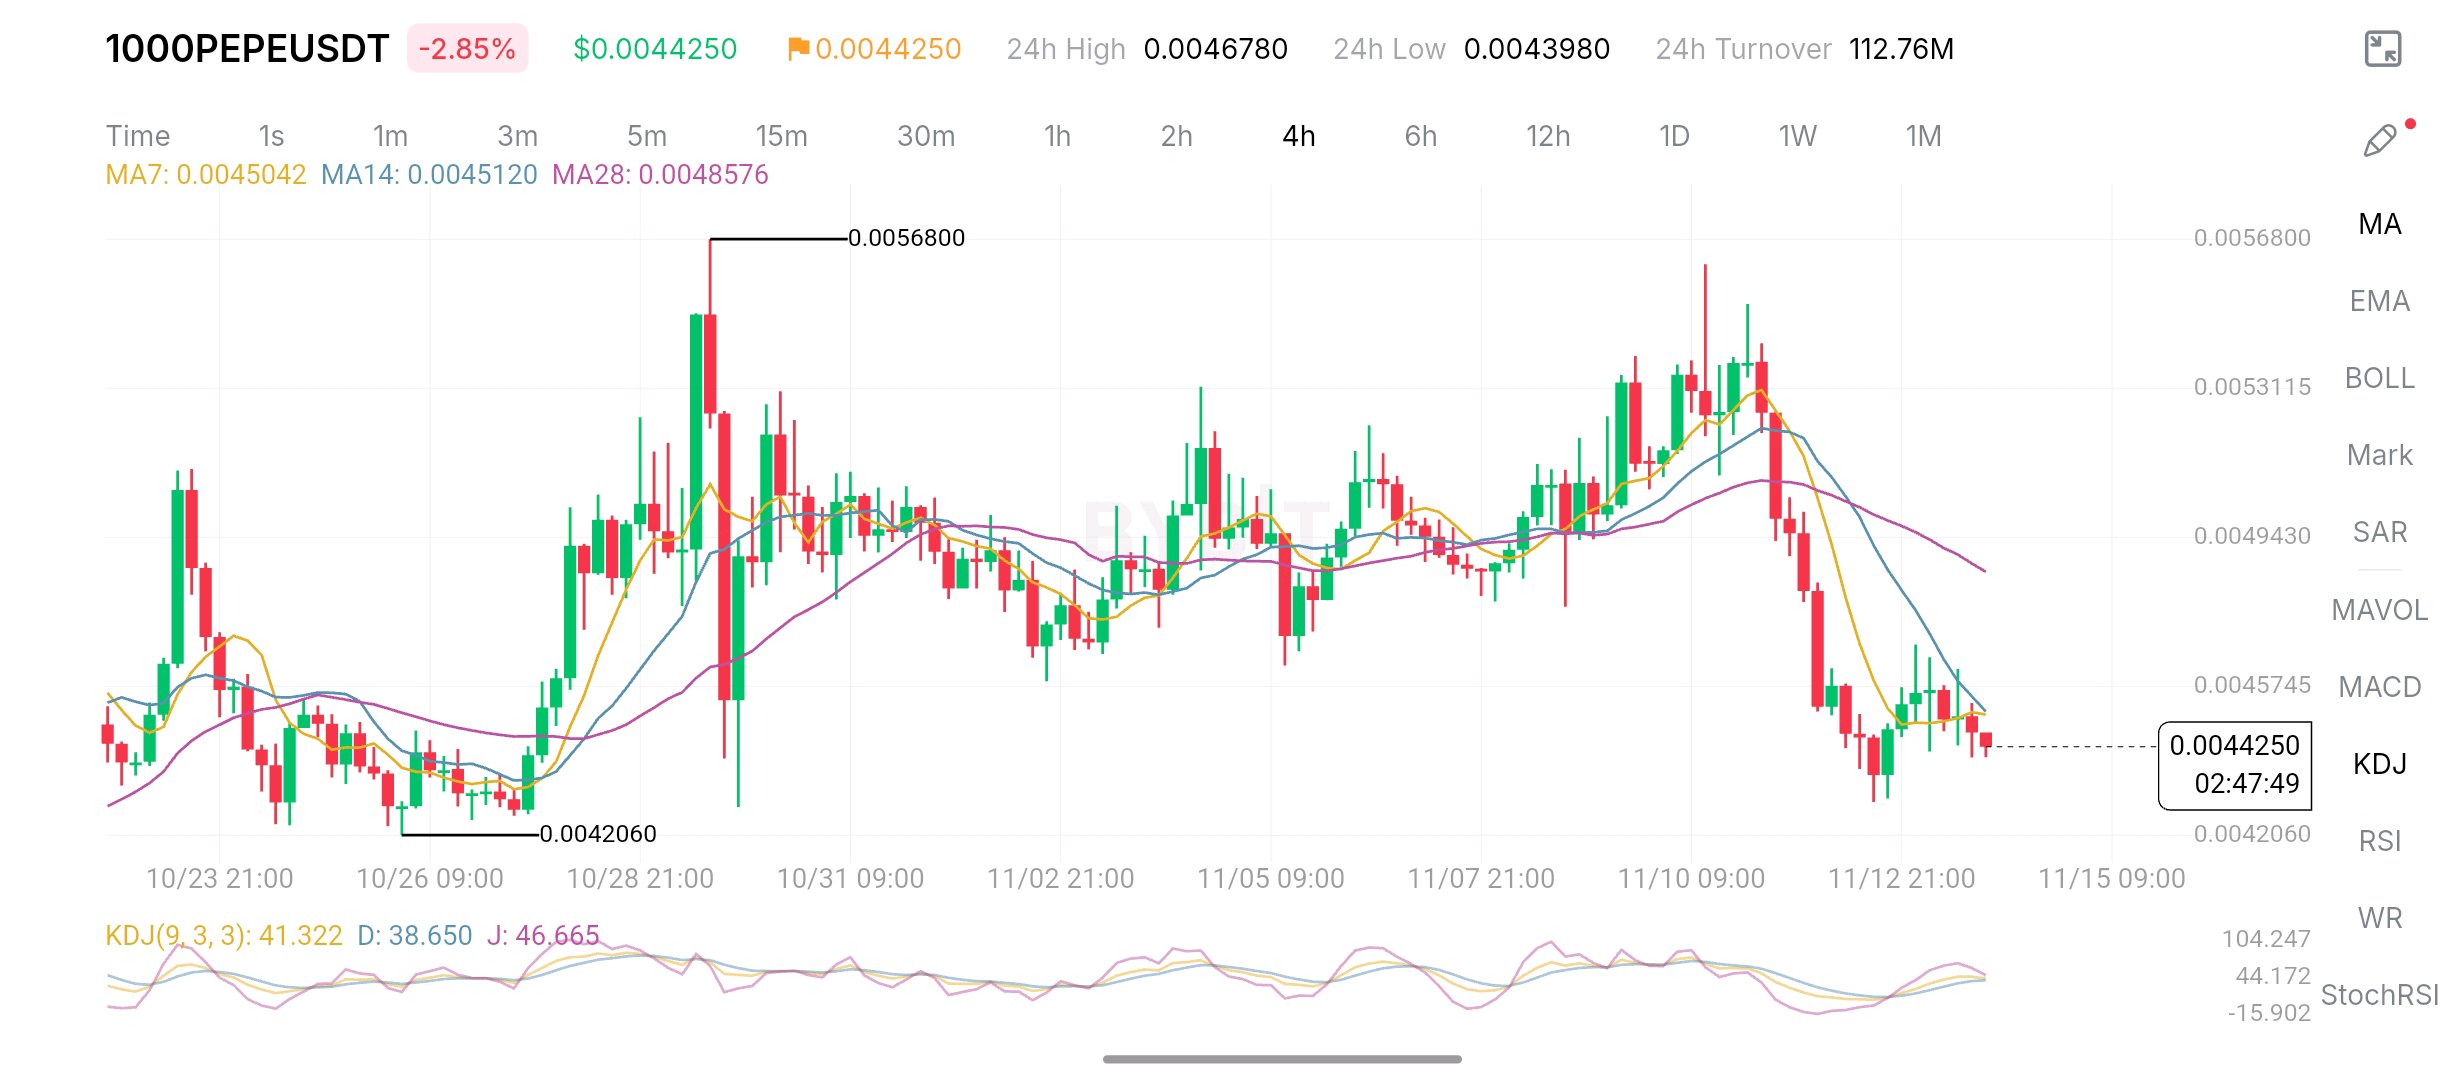
$PEPEUSDT : Buyers are trying to hold the ground, but the bears are still calling the shots. Looking at the 4H chart, PEPE has shifted from sideways movement into a clear bearish move. After failing to sustain its push toward the previous highs, sellers stepped in aggressively and pushed the price lower. What's interesting now is that price is attempting to stabilize around $0.00442, but the recovery remains weak. The moving averages are sitting above the current price, suggesting that selling pressure hasn't completely disappeared. My trader's viewpoint: I'm staying cautious and slightly bearish on PEPE here. I don't see enough confirmation to call this a bottom. Here's what I'm watching: - Support: The $0.00420 area is an important downside level to watch. - Resistance: A recovery toward $0.00455–$0.00465 could face selling pressure. - Bullish confirmation: PEPE needs a strong 4H recovery, increasing buying volume and a reclaim of the moving averages. - Bearish continuation: Losing the recent lows could open the door to another downward move. Personally, I want to see buyers defend this area before considering a bullish setup. Catching falling prices without confirmation is not a strategy. What's your take on PEPE? Is this just a temporary pullback before another rally, or are we preparing for another leg down? #PEPE #1000PEPE #CryptoAnalysis #TechnicalAnalysis #Bybit#ByXIMPACT
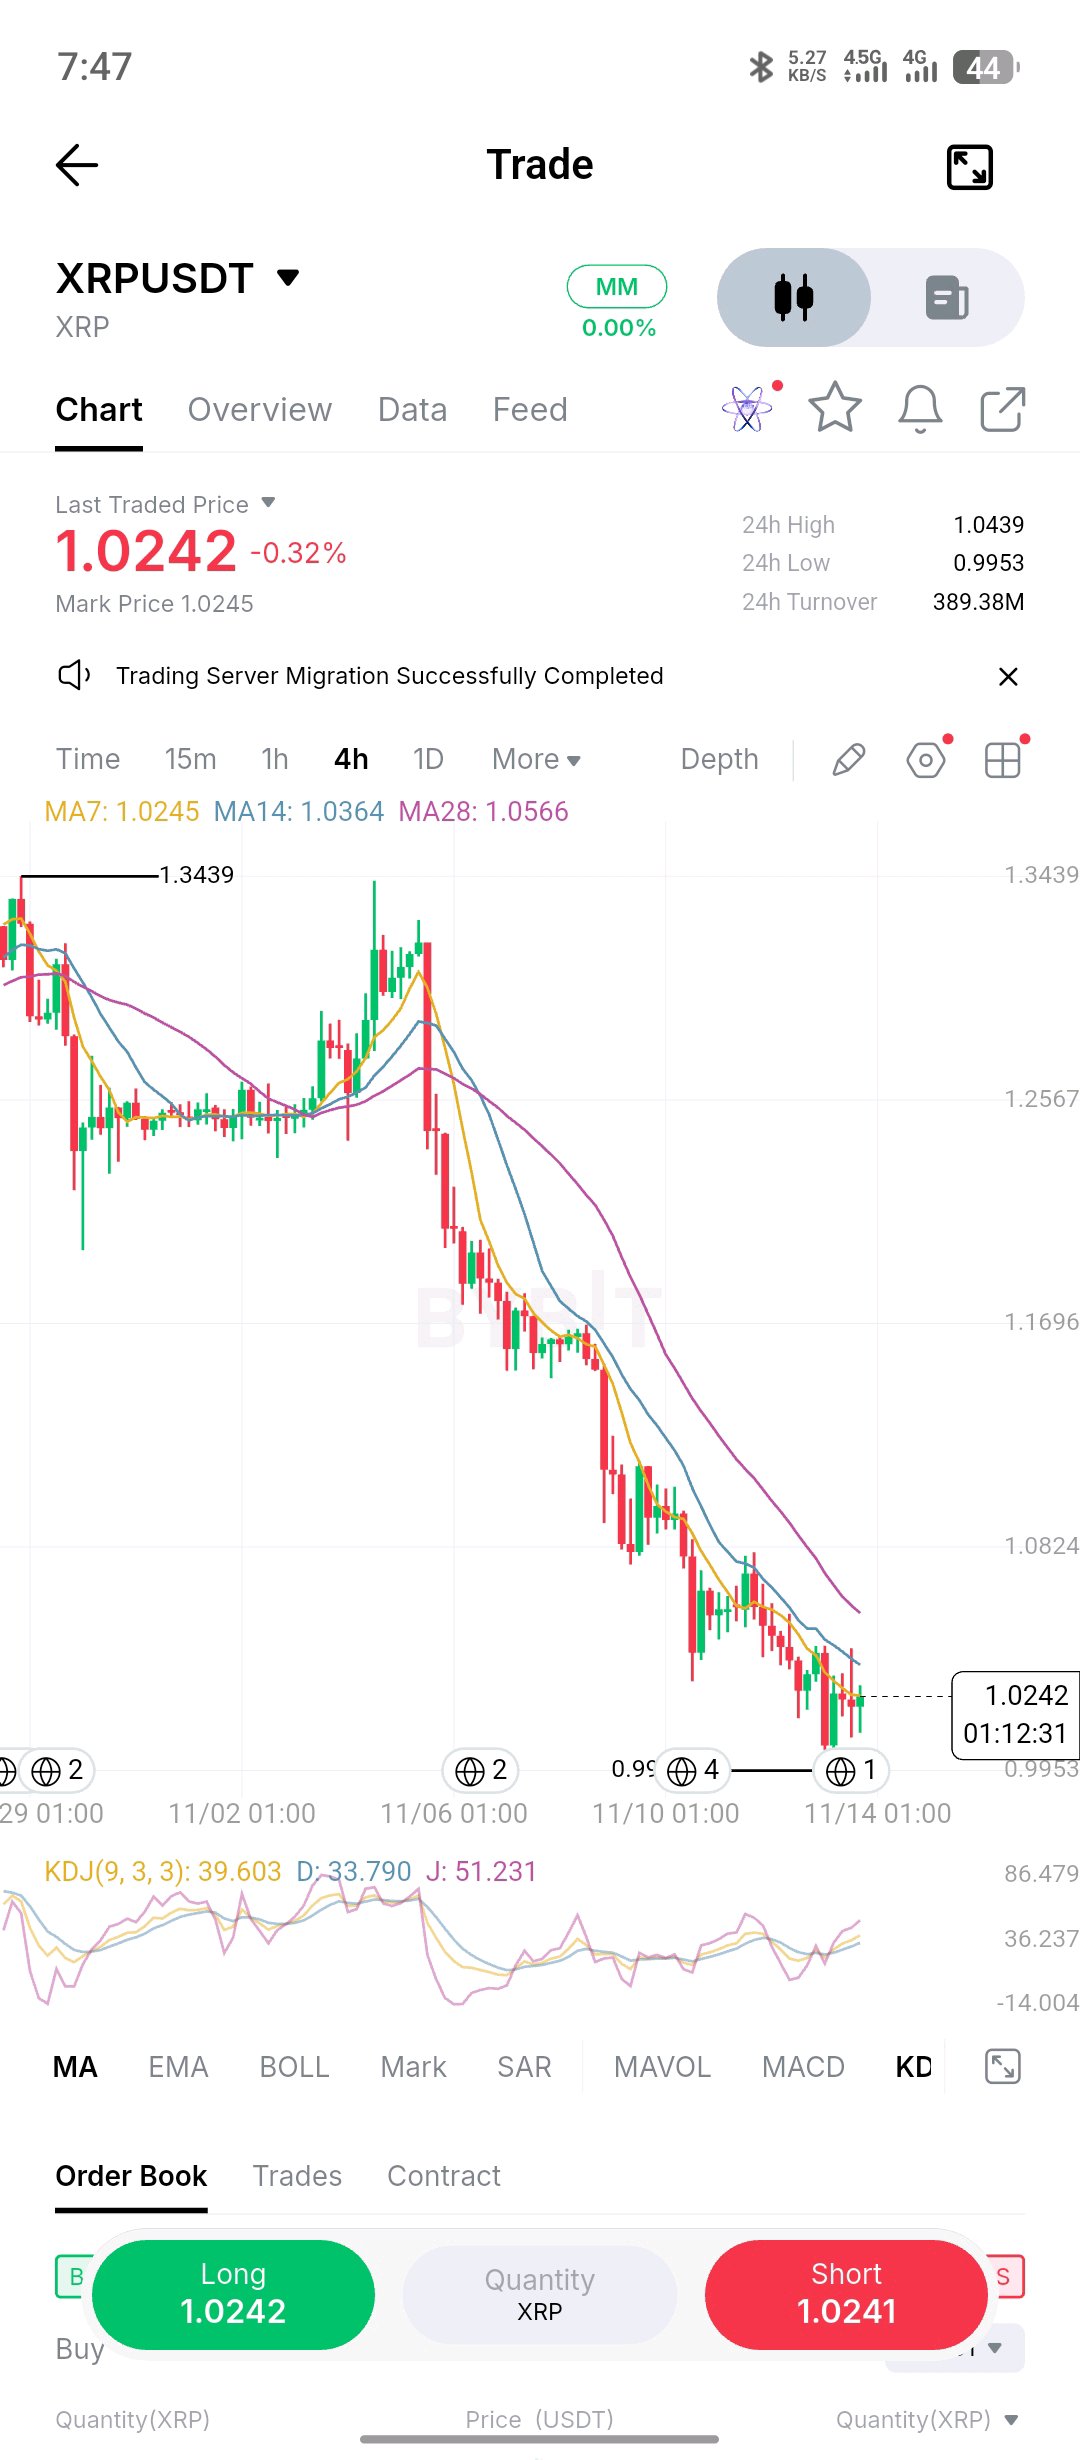
$XRPUSDT is still struggling to find its footing, and honestly, the chart doesn't give me a strong reason to turn bullish just yet. Look at the structure: XRP has been making lower highs and lower lows after that sharp breakdown. Every recovery attempt has been met with selling pressure, and price is still trading below the major moving averages. My trader's viewpoint: I'm leaning bearish until XRP proves otherwise. The current movement looks more like a weak consolidation after a heavy sell-off than a confirmed reversal. Here's what would change my mind: - A strong break above the descending moving averages. - A higher high followed by a higher low. - Increasing buying volume to support the recovery. Until those conditions appear, I wouldn't chase a long position. The key question is: Are we watching XRP prepare for another leg down, or is this the quiet accumulation before a recovery? What's your take? #XRP #XRPUSDT #CryptoTrading #TechnicalAnalysis #Bybit #WSOT2026 #ByXIMPACT
$ETHUSDT | BEARS MAINTAIN MARKET CONTROL Ethereum continues to experience significant selling pressure, with ETH/USDT trading around $1,935.39. Looking at the 4H chart, the overall market structure remains bearish. Price action is consistently printing lower highs and lower lows, indicating that sellers currently have the upper hand. MARKET STRUCTURE & PRICE ACTION The recent bearish impulse has pushed ETH below the psychological $2,000 level, suggesting that buyers are struggling to maintain upward momentum. Price is also trading below the major moving averages, reinforcing the current bearish market structure. The latest downward movement suggests that sellers remain aggressive, although a short-term relief bounce cannot be ruled out. KEY TECHNICAL LEVELS Resistance zones: • $2,000 – Immediate psychological resistance. • $2,035 – Potential supply zone. • $2,060–$2,075 – Major resistance area. Support zones: • $1,900 – Immediate support. • $1,870 – Secondary support. • $1,850 – Potential downside target. BEARISH SCENARIO If ETH fails to reclaim the $2,000 resistance and selling pressure continues, a confirmed breakdown below $1,900 could expose the $1,870–$1,850 support region. BULLISH SCENARIO For buyers to regain control, ETH needs to reclaim $2,000 and establish acceptance above $2,035. A sustained move above $2,075 would provide stronger evidence of a potential market structure shift. MY MARKET PERSPECTIVE My current bias remains bearish until price demonstrates a convincing reversal. However, I am not interested in chasing the downside after an extended selling move. I would rather wait for a retracement, observe the reaction around resistance, and look for confirmation before considering a position. The next move will depend on how ETH reacts around $1,900 and whether buyers can reclaim $2,000. Patience and confirmation remain more important than prediction. What is your perspective? Is ETH preparing for another bearish continuation, or could buyers defend the $1,900 region? #ETH #Ethereum #TechnicalAnalysis #CryptoMarket #TradingStrategy #ByXIMPACT
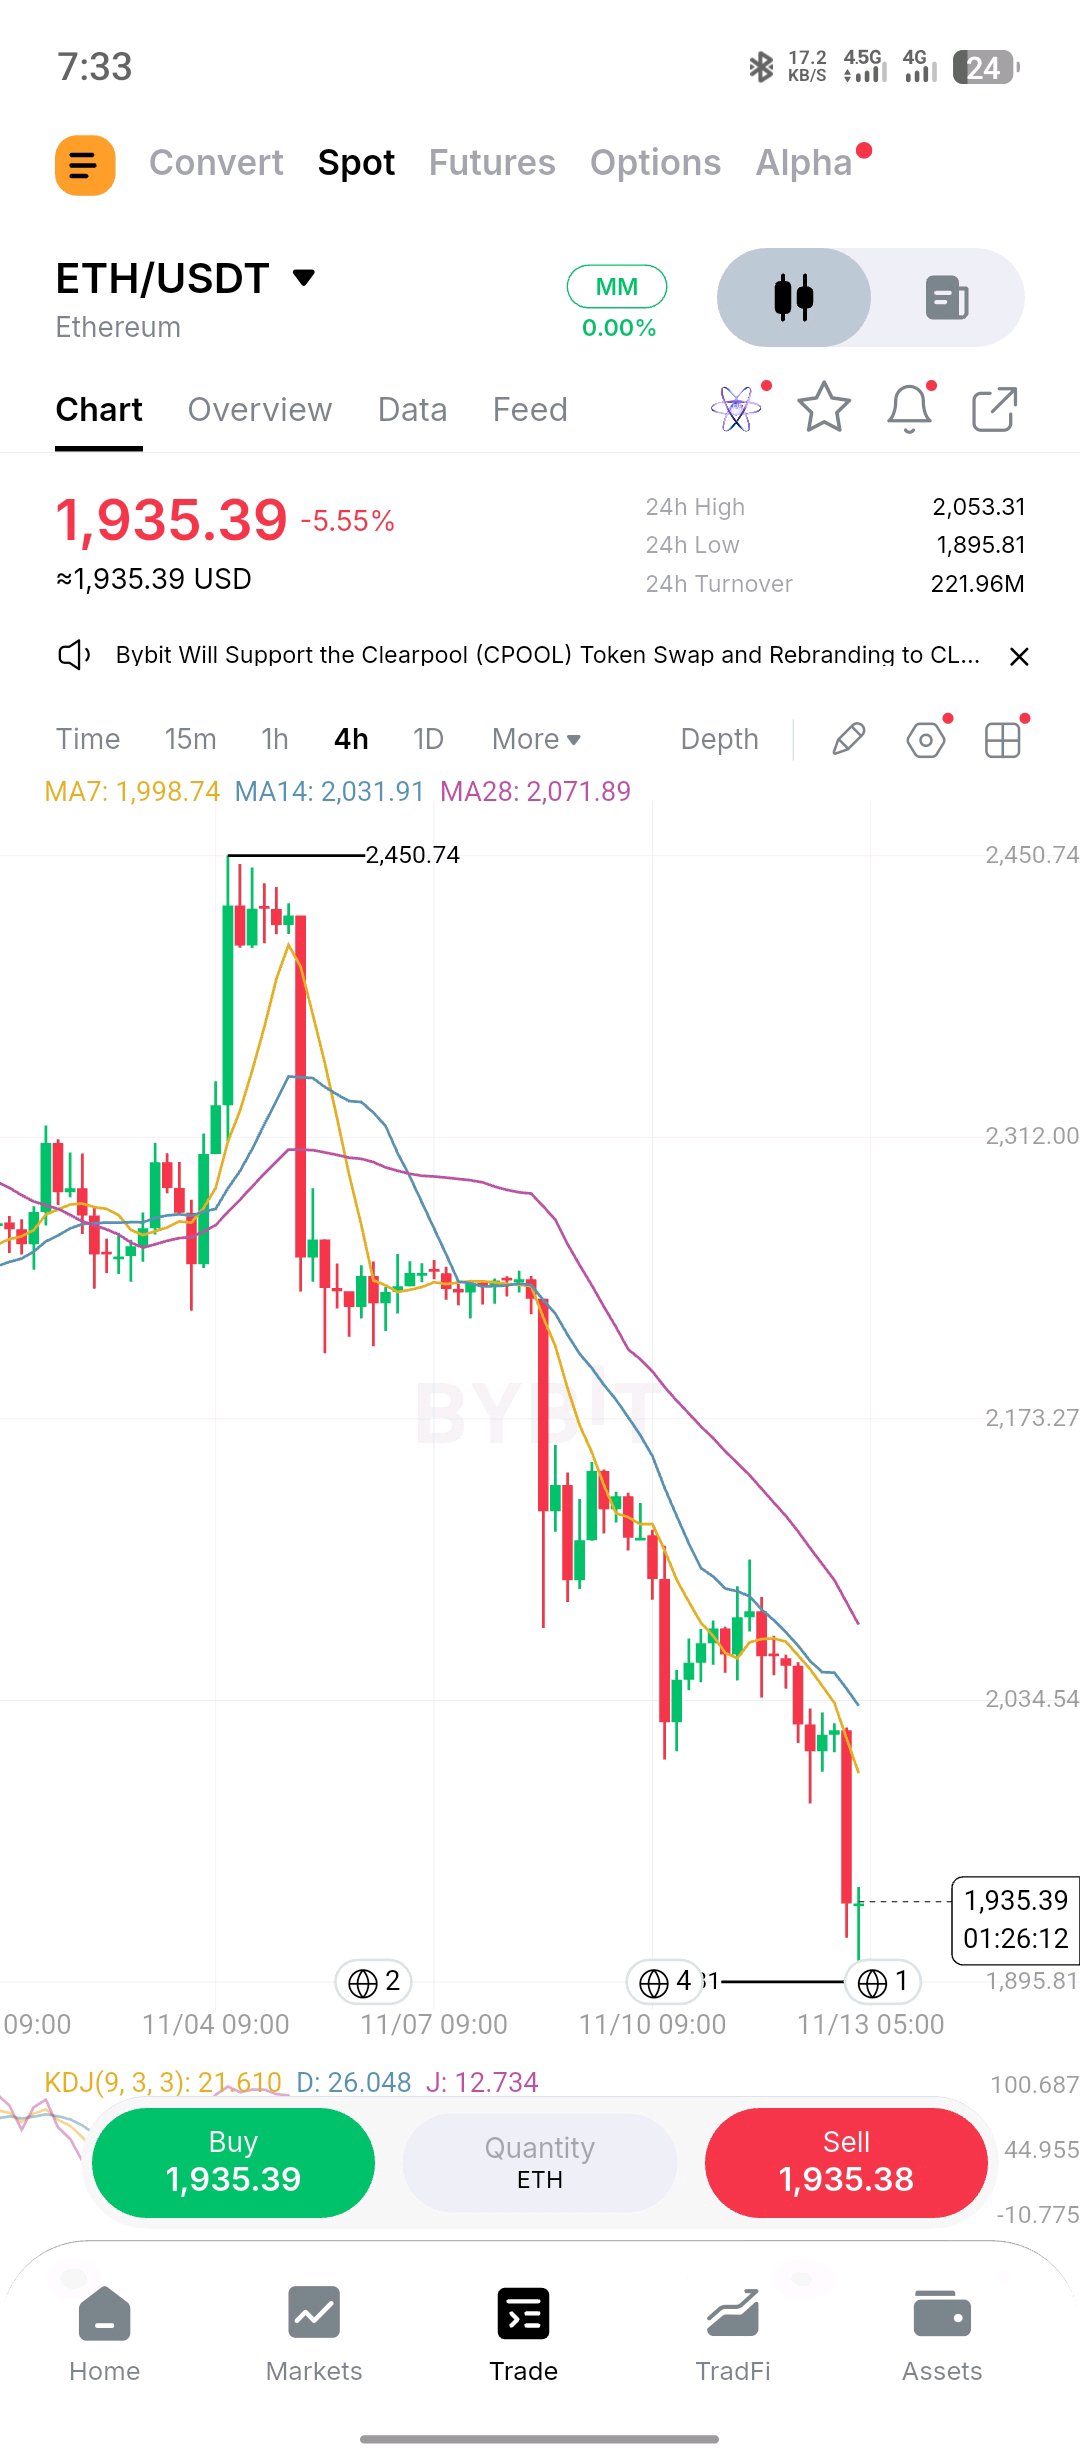
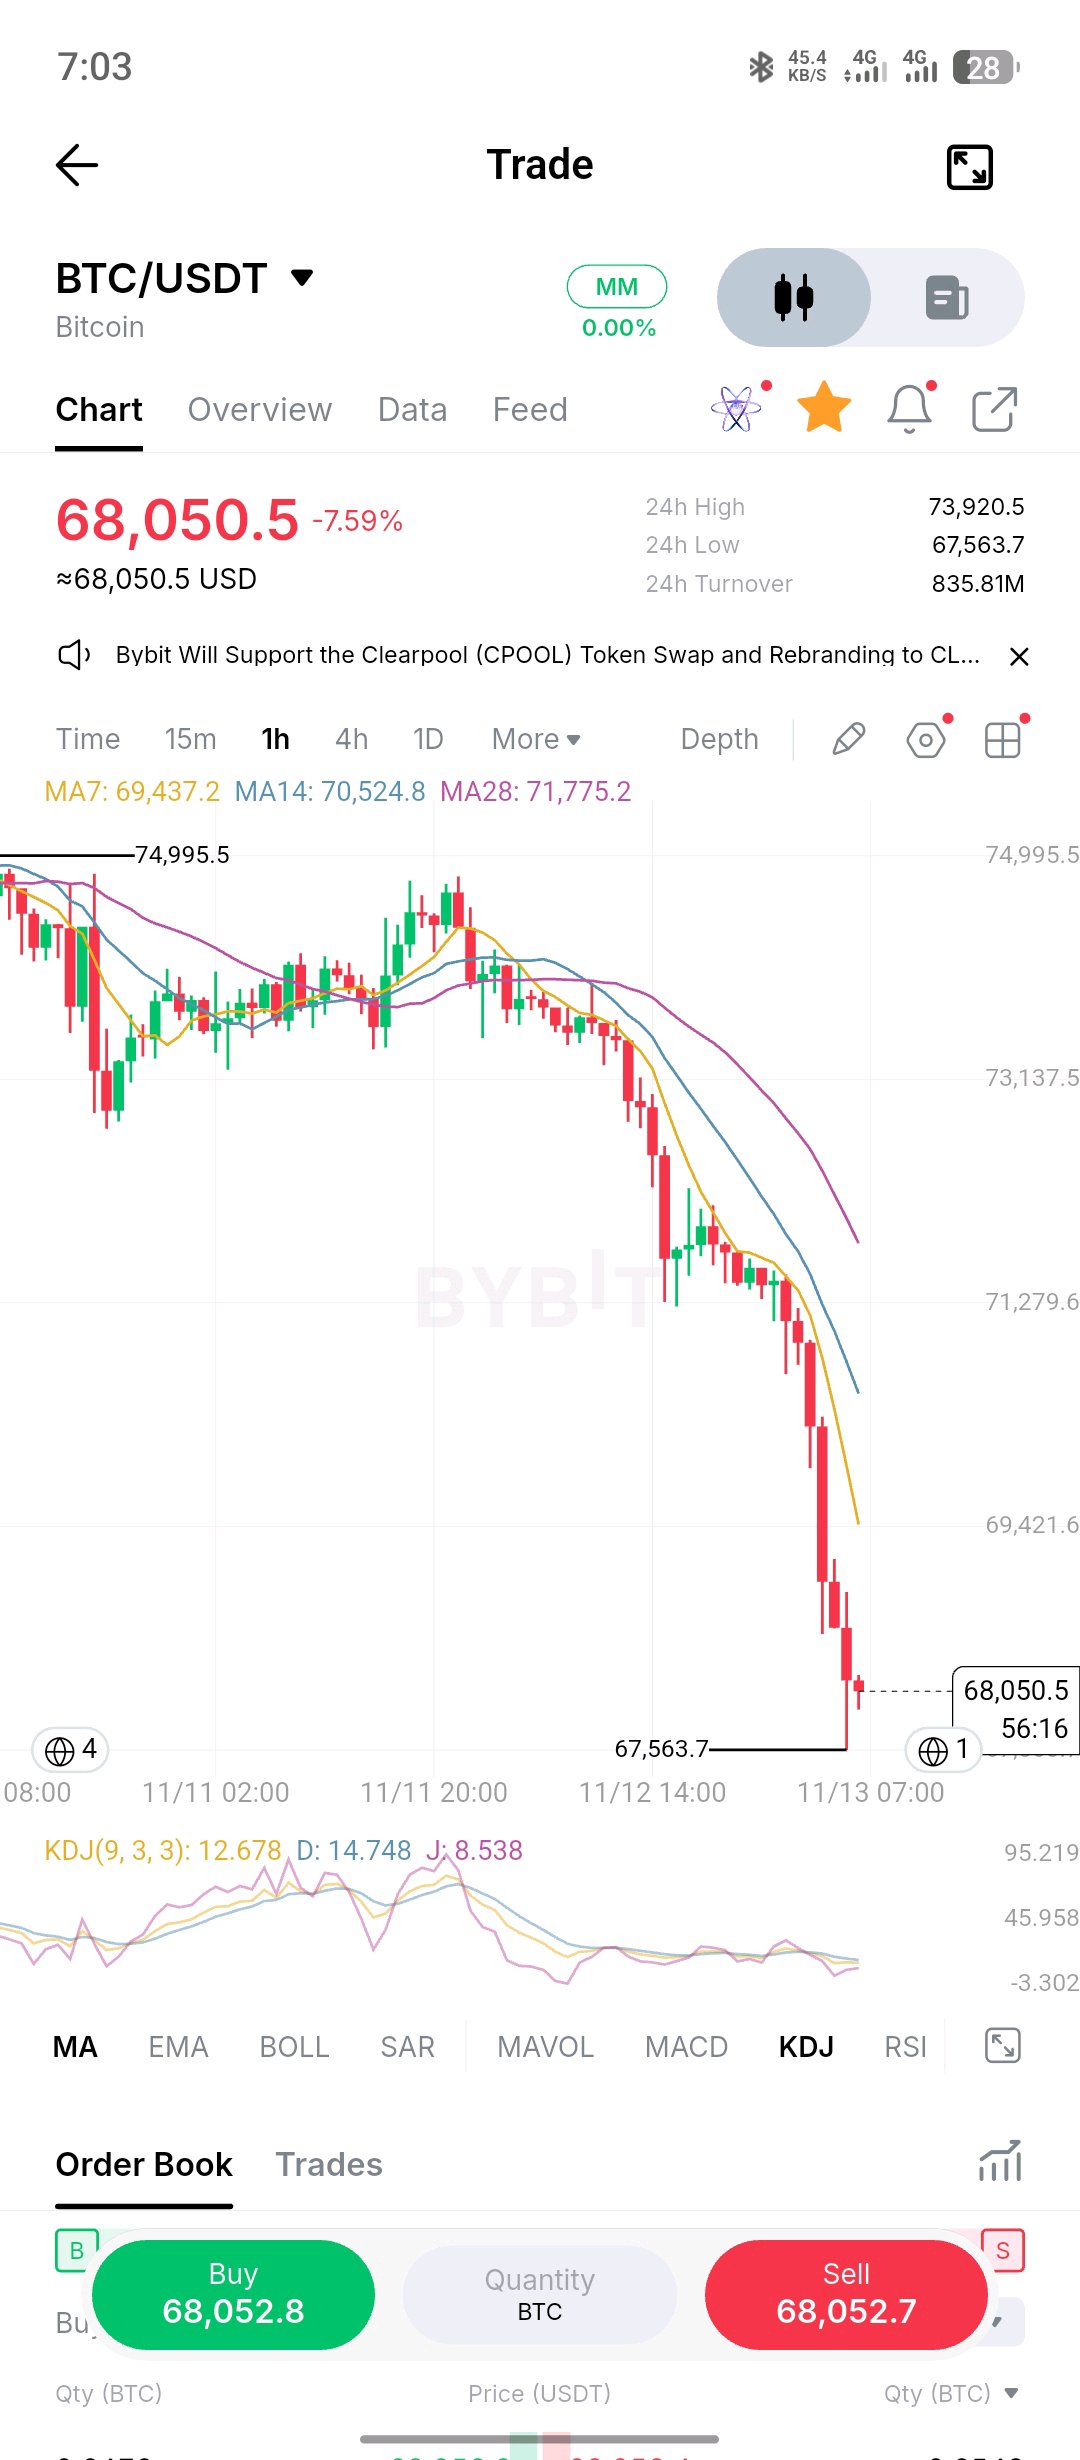
$BTCUSDT The sell-off is accelerating. Who is willing to buy this dip? Bitcoin is trading around $68,050 after a sharp breakdown that has pushed price significantly lower. What stands out on this chart isn't just the red candles. It's the lack of meaningful recovery between selling waves. The structure is heavily bearish: Sellers are dictating the direction. Price continues to print lower highs and lower lows, while the moving averages remain sharply tilted downward. Buyers haven't demonstrated enough strength to challenge that structure. But here's where things get interesting. After such an aggressive decline, chasing shorts becomes increasingly risky. Late sellers could find themselves entering just as the market begins looking for liquidity to fuel a temporary rebound. Three things I'm watching: 1. Whether BTC can establish a base around the current lows. 2. Whether a relief rally gets rejected at the broken structure. 3. Whether buyers can reclaim resistance and produce an actual change in market structure. My trading perspective: I'm respecting the bearish momentum, but I'm not blindly selling into an extended move. A weak recovery followed by rejection could offer a more structured short opportunity. A strong reclaim, on the other hand, would force me to reconsider the bearish thesis. The important distinction is that a bounce doesn't automatically mean a reversal. Question for the community: At these levels, are you waiting for a relief rally to sell, or do you think Bitcoin is approaching an area where buyers could finally step in? Let's discuss the price action, not just the direction. #BTC #Bitcoin #CryptoTrading#ByXIMPACT
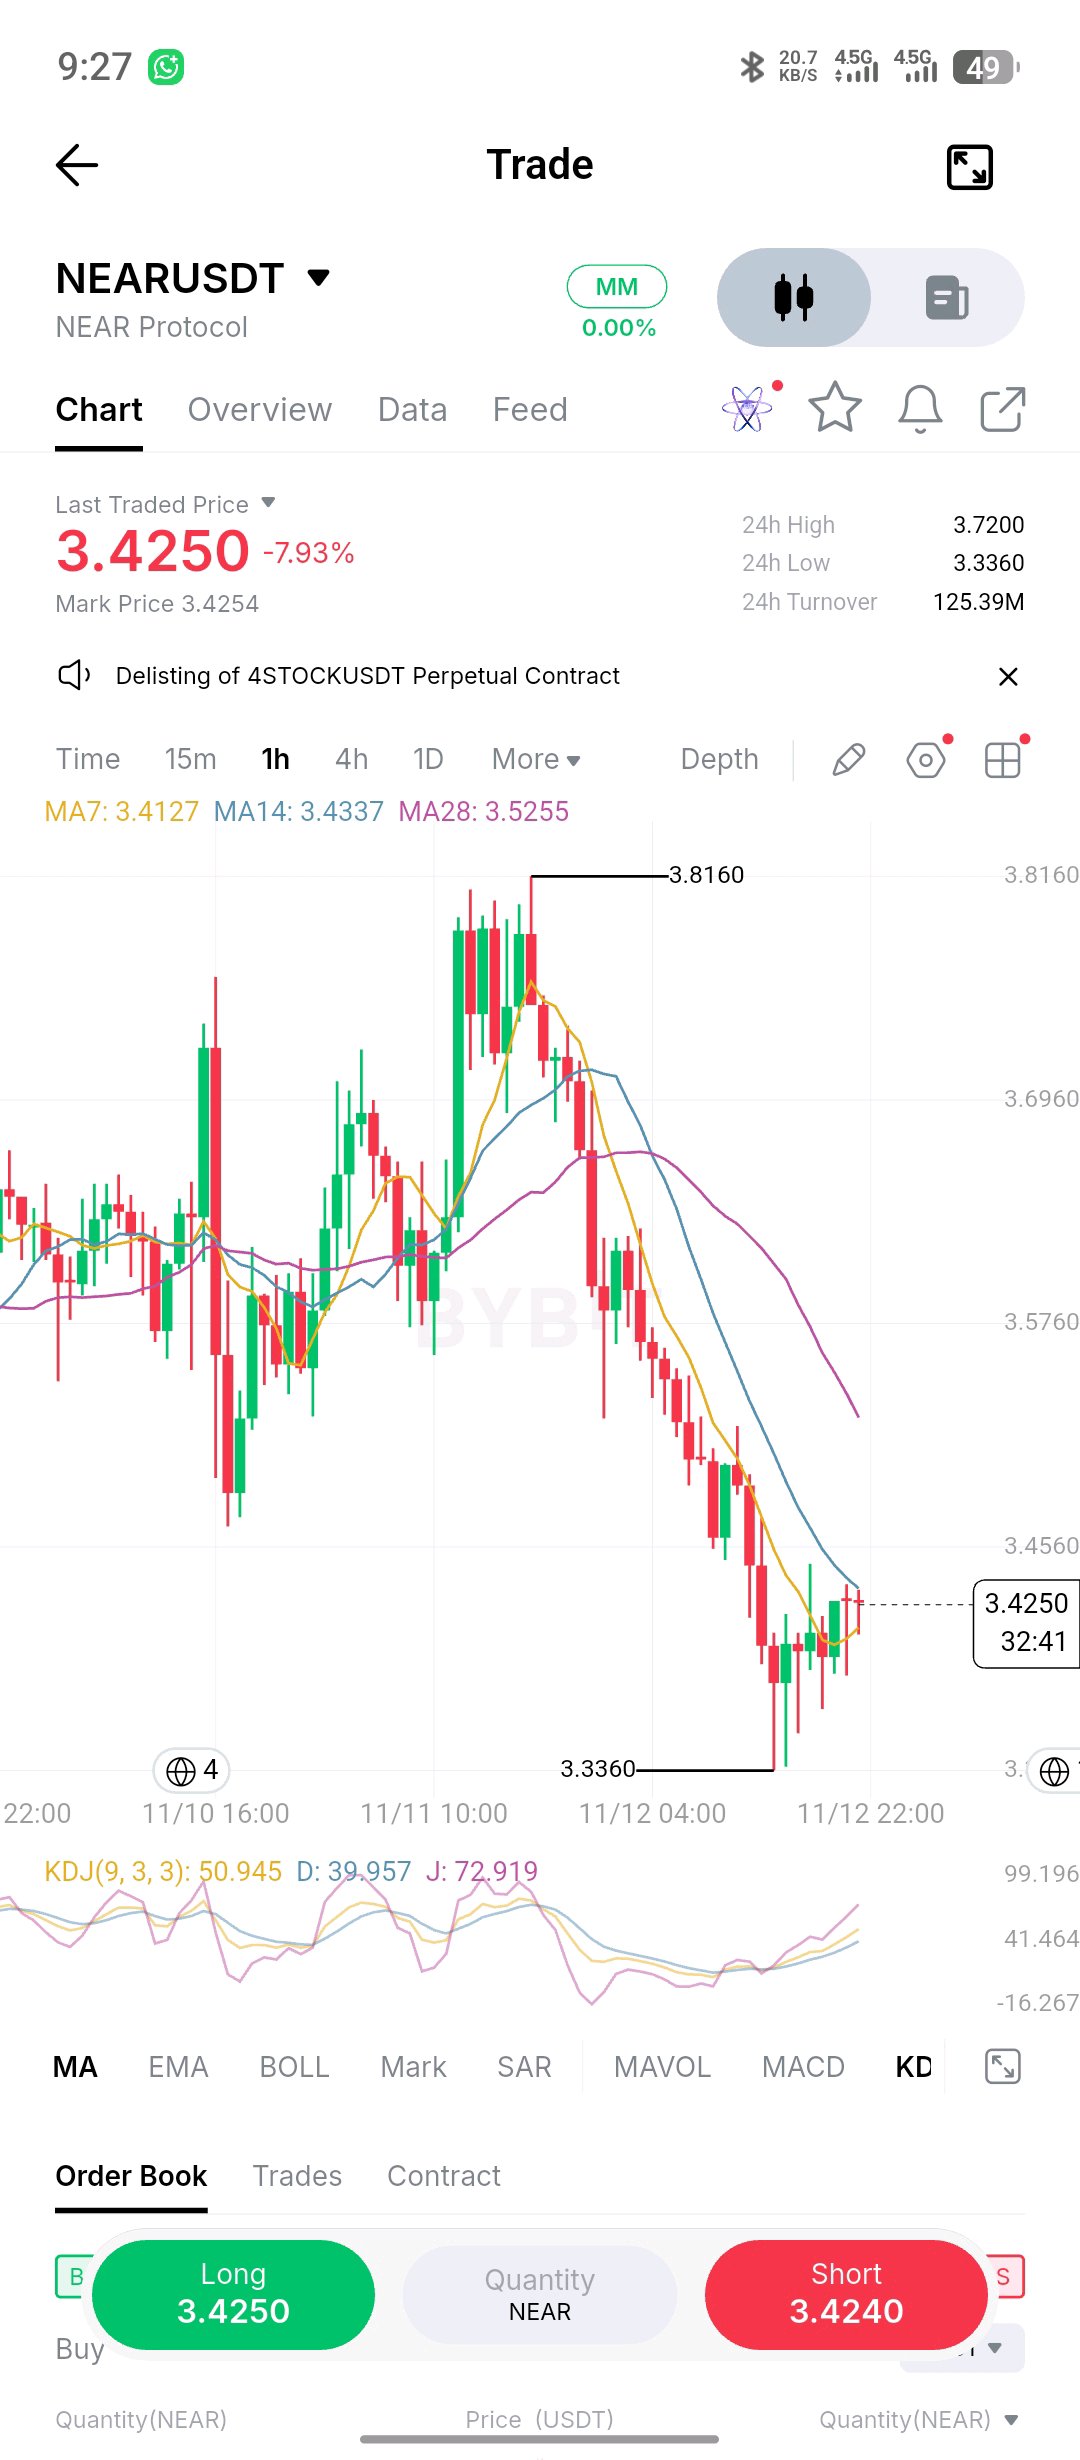
$NEARUSDT | The recovery is facing its first real test. NEAR is trading around $3.425 after a sustained sell-off on the 15-minute chart. What's worth watching here is the behaviour of buyers after that aggressive decline. Price is attempting to stabilize, but the broader structure hasn't changed yet. The moving averages remain tilted downward, suggesting sellers still have control of the short-term trend. Here's the level I'm watching: $3.45–$3.47: The first important resistance zone. If buyers cannot reclaim this area, the current recovery could simply become another lower high before sellers attempt to push price down again. However, there's another possibility. A convincing breakout above $3.47, followed by a successful retest, would suggest that buyers are finally gaining some control. My approach: I'm not interested in chasing either direction. I want to see how price reacts at resistance before committing to a position. One thing traders should remember: after a strong sell-off, not every green candle signals a reversal. Question for NEAR traders: Are we seeing the beginning of a genuine recovery, or is this just a relief bounce before another leg down? #NEAR #CryptoTrading#ByXIMPACT
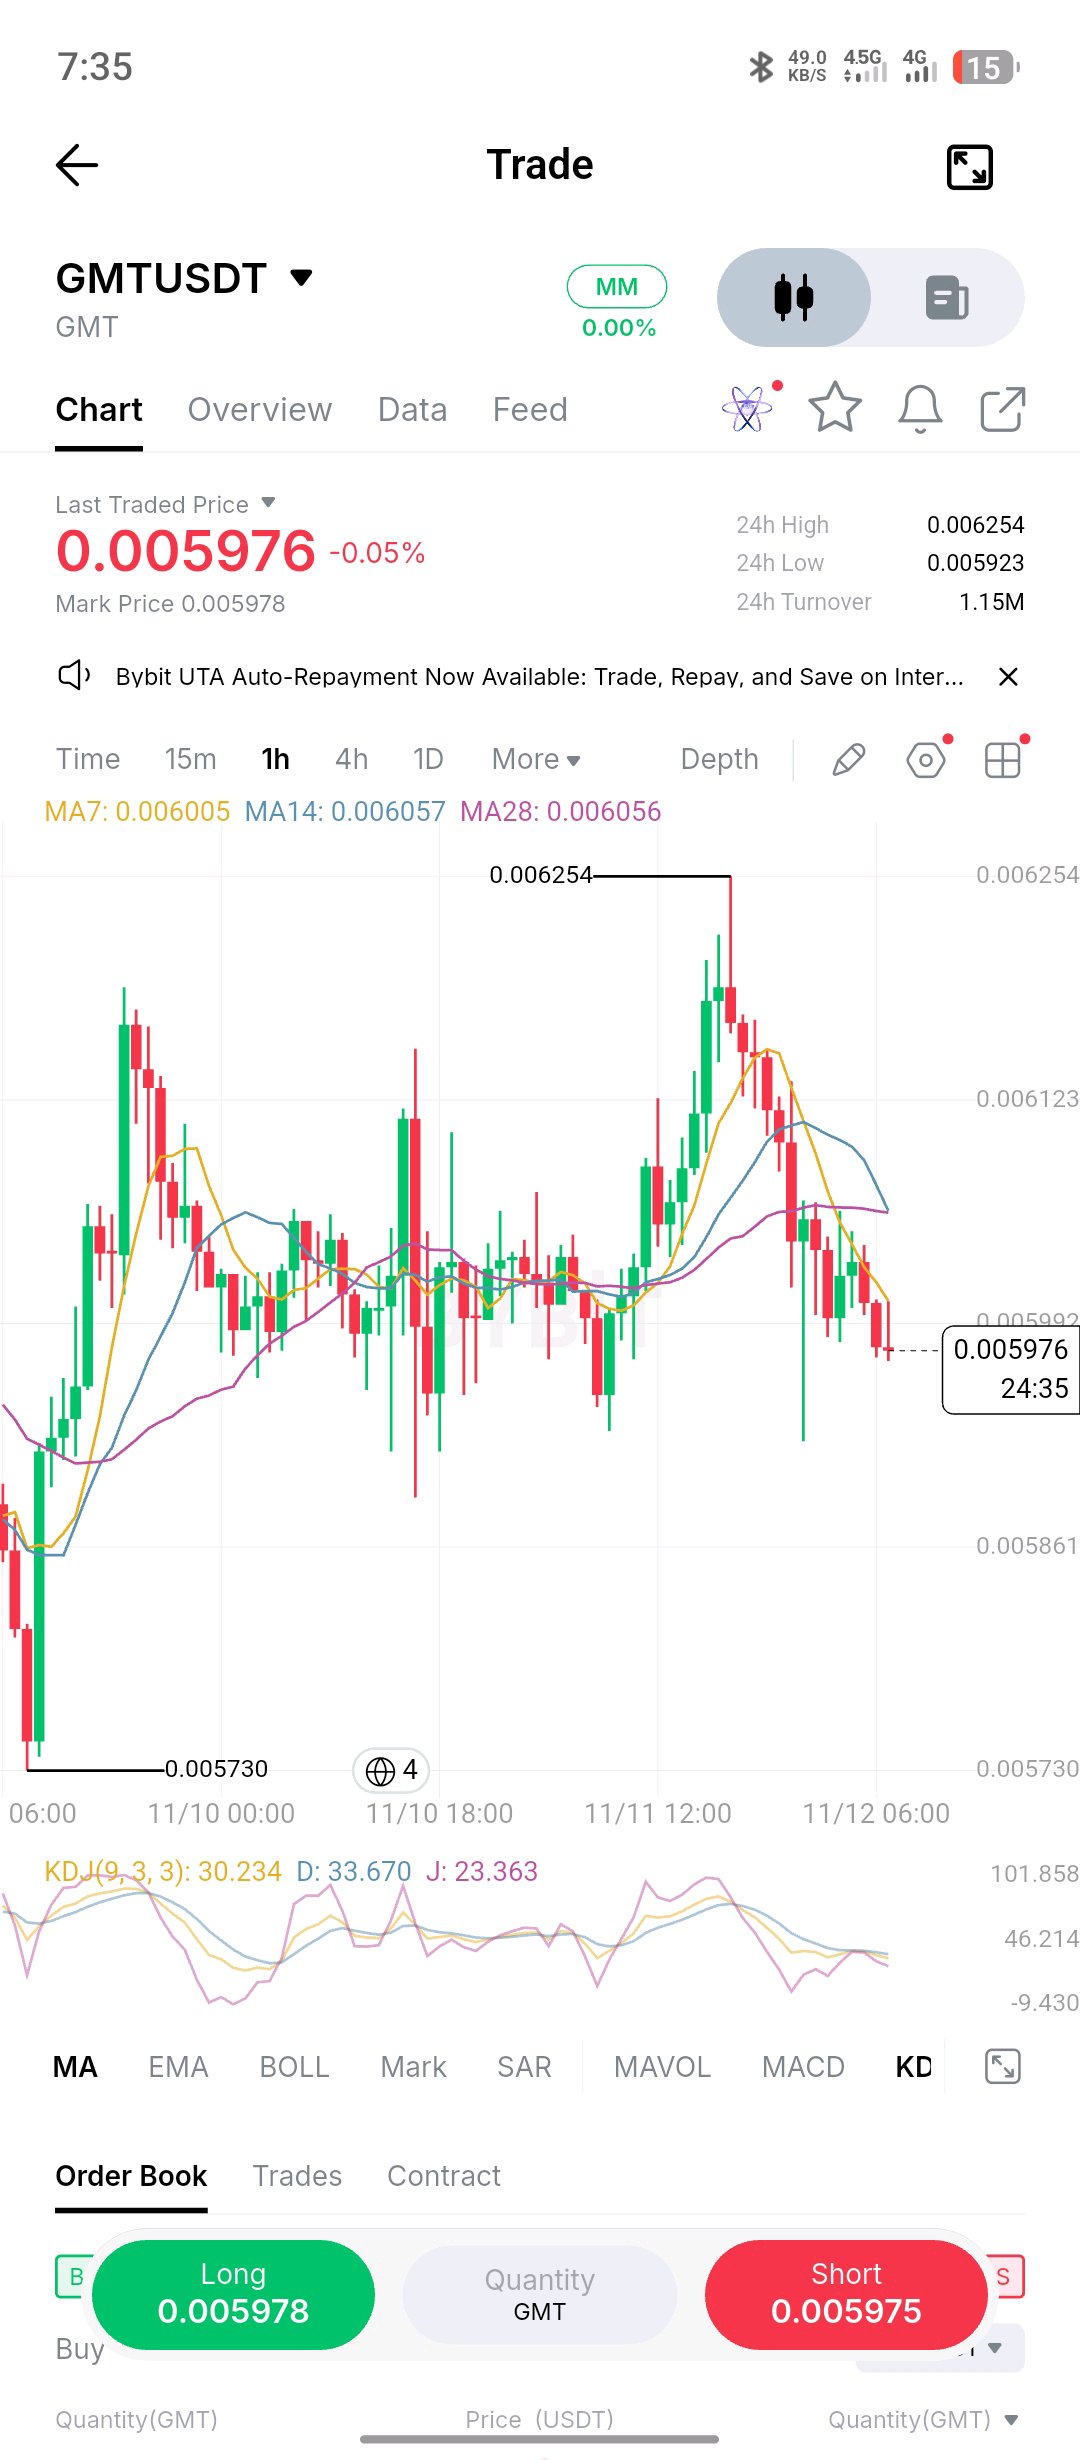
$GMTUSDT HAD A STRONG MOVE UP, BUT SELLERS ARE STARTING TO TAKE BACK CONTROL. GMT is trading around $0.005976, and the latest price action is worth watching. We had a decent push toward the recent high, but buyers couldn't sustain the momentum. Since that rejection, price has been moving lower, with sellers repeatedly stepping in during recovery attempts. What's concerning is that GMT has slipped below its moving averages. The short-term momentum has weakened, and buyers haven't shown enough strength to reverse the current direction. My bias is bearish for now. I'm more interested in seeing how sellers react if GMT attempts another bounce. If price continues getting rejected below the moving averages, I expect further downside pressure. For bulls to change my mind, I want to see a strong reclaim of the moving averages, followed by a higher high and convincing buying volume. I'm not buying simply because GMT has already dropped. I'd rather follow the market's direction than fight it. GMT traders, are you seeing an opportunity to buy this dip, or is the recent rally already losing its strength? #ByXIMPACT
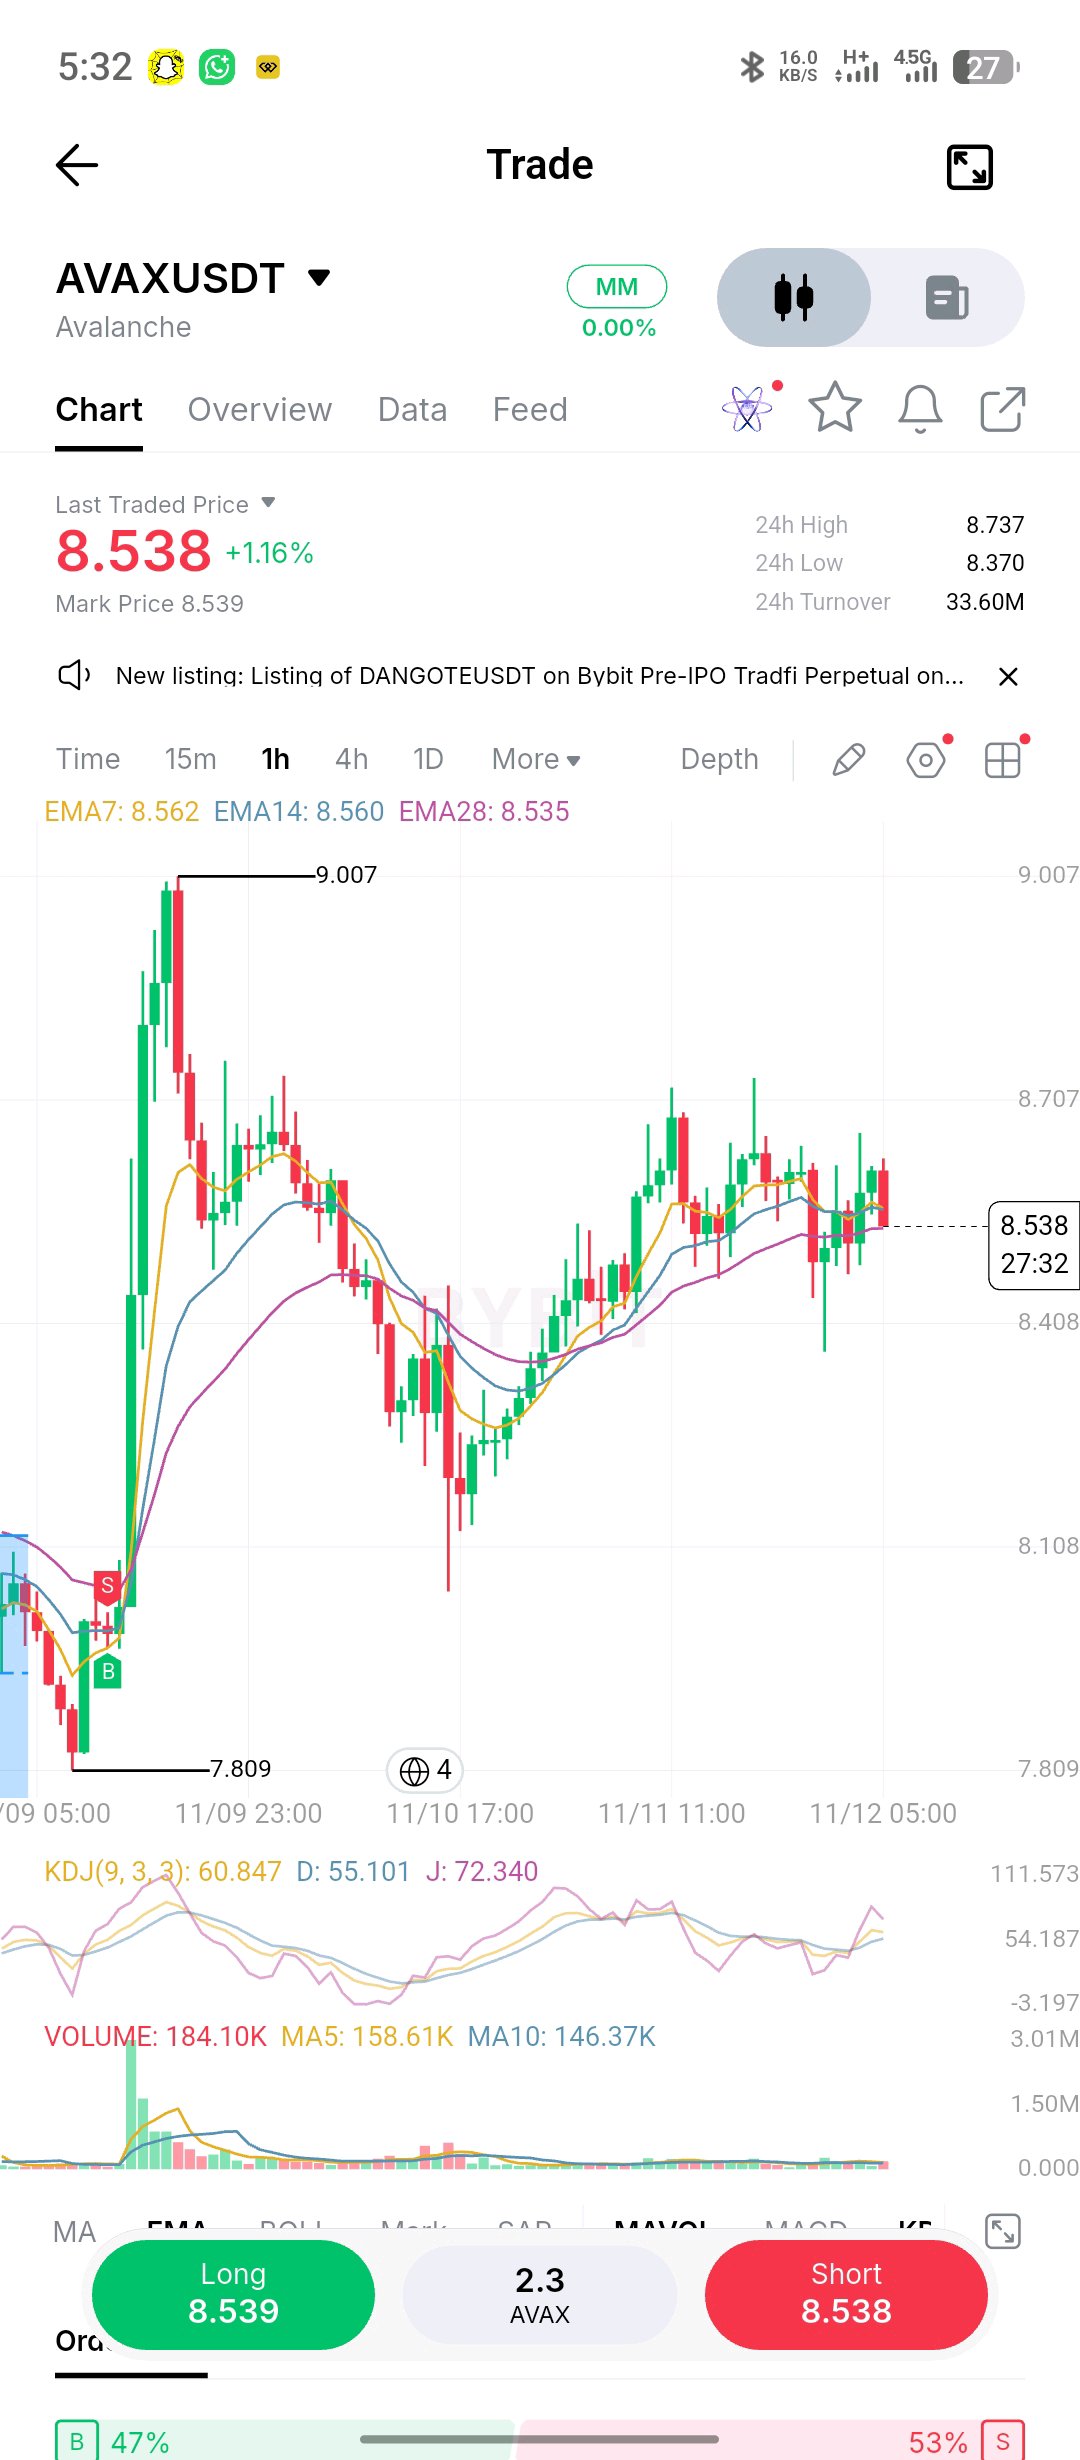
$AVAXUSDT Is No Longer in Expansion Mode. The Market Is Negotiating Its Next Direction. One thing I find interesting about AVAX right now is the transition from aggressive price expansion into a much tighter trading environment. After reaching $9.007, buyers couldn't maintain control. The subsequent correction brought price back toward the $8.10 region, where demand eventually emerged. But the recovery hasn't produced another convincing breakout. Instead, AVAX is building a battleground around $8.50. Here's where the next important decisions could happen: The $8.70–$8.74 region represents the immediate upside obstacle. If buyers can absorb the available supply and establish acceptance above this zone, the market could begin challenging $8.85 and $9.00 again. On the other hand, repeated rejection combined with a loss of $8.37 would suggest that the recovery is becoming vulnerable. Something else deserves attention: the short-term moving averages are converging, indicating that directional momentum has compressed. I'm not treating this compression as an automatic breakout signal. My approach is simple: Let price reveal where genuine demand or supply is strongest. A confirmed move outside the current range offers a more interesting opportunity than trading every fluctuation inside it. Sometimes the best trade is the one you wait for. #ByXIMPACT
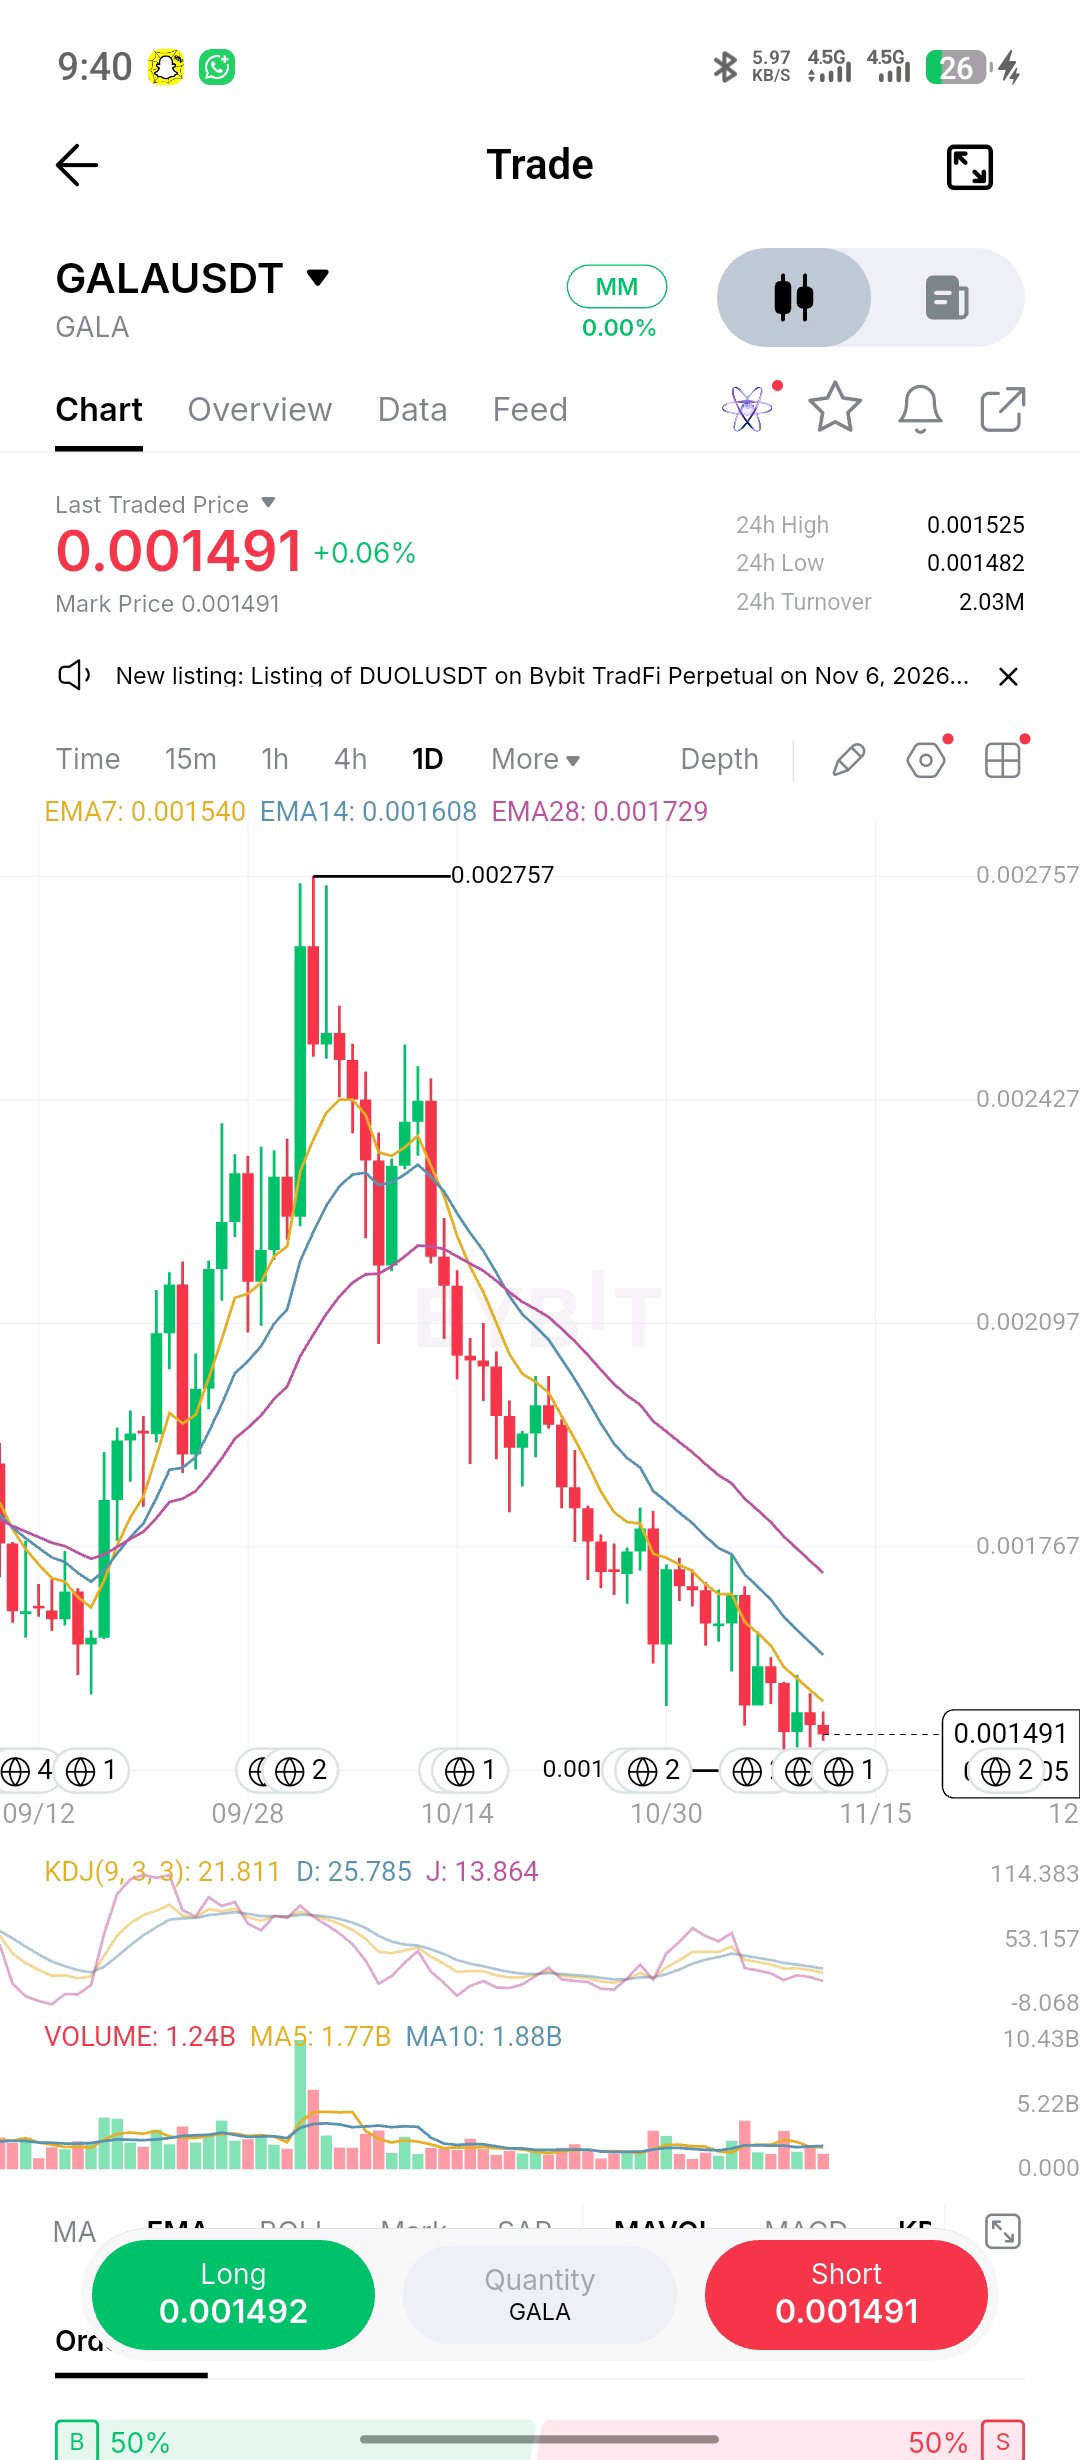
$GALAUSDT is entering a very critical zone on the daily timeframe. After topping out at 0.002757, price has experienced a sustained corrective phase, currently trading near $0.001491. The daily chart shows a clear macro downtrend where price remains pressed well below the moving average resistance stack—specifically EMA7 (0.001540), EMA14 (0.001608), and EMA28 (0.001729). What stands out technically is the compression near the lows. The KDJ indicator shows the J-line down at 13.8, deeply oversold and hovering near historical exhaustion levels. However, oversold conditions alone do not equal a reversal; they simply indicate that selling momentum has been heavy and prolonged. The level I'm watching is the local support floor around the current price area. For any meaningful bullish thesis to form, we need to see stabilization, a decrease in selling volume, and a reclamation of the EMA7 and EMA14 cluster. My take: I am staying patient and neutral on for now. Catching a falling knife in a macro downtrend without structural confirmation is a high-risk trap. I want to see a confirmed higher low and a strong volume breakout above the 0.001600 zone before considering any long exposure. If the current support fails to hold, the path of least resistance remains lower. community, are you seeing signs of accumulation down here, or are you waiting for a definitive trend reversal before stepping in? #GALA #GALAUSDT #CryptoTrading #TechnicalAnalysis #RiskManagement #ByXIMPACT
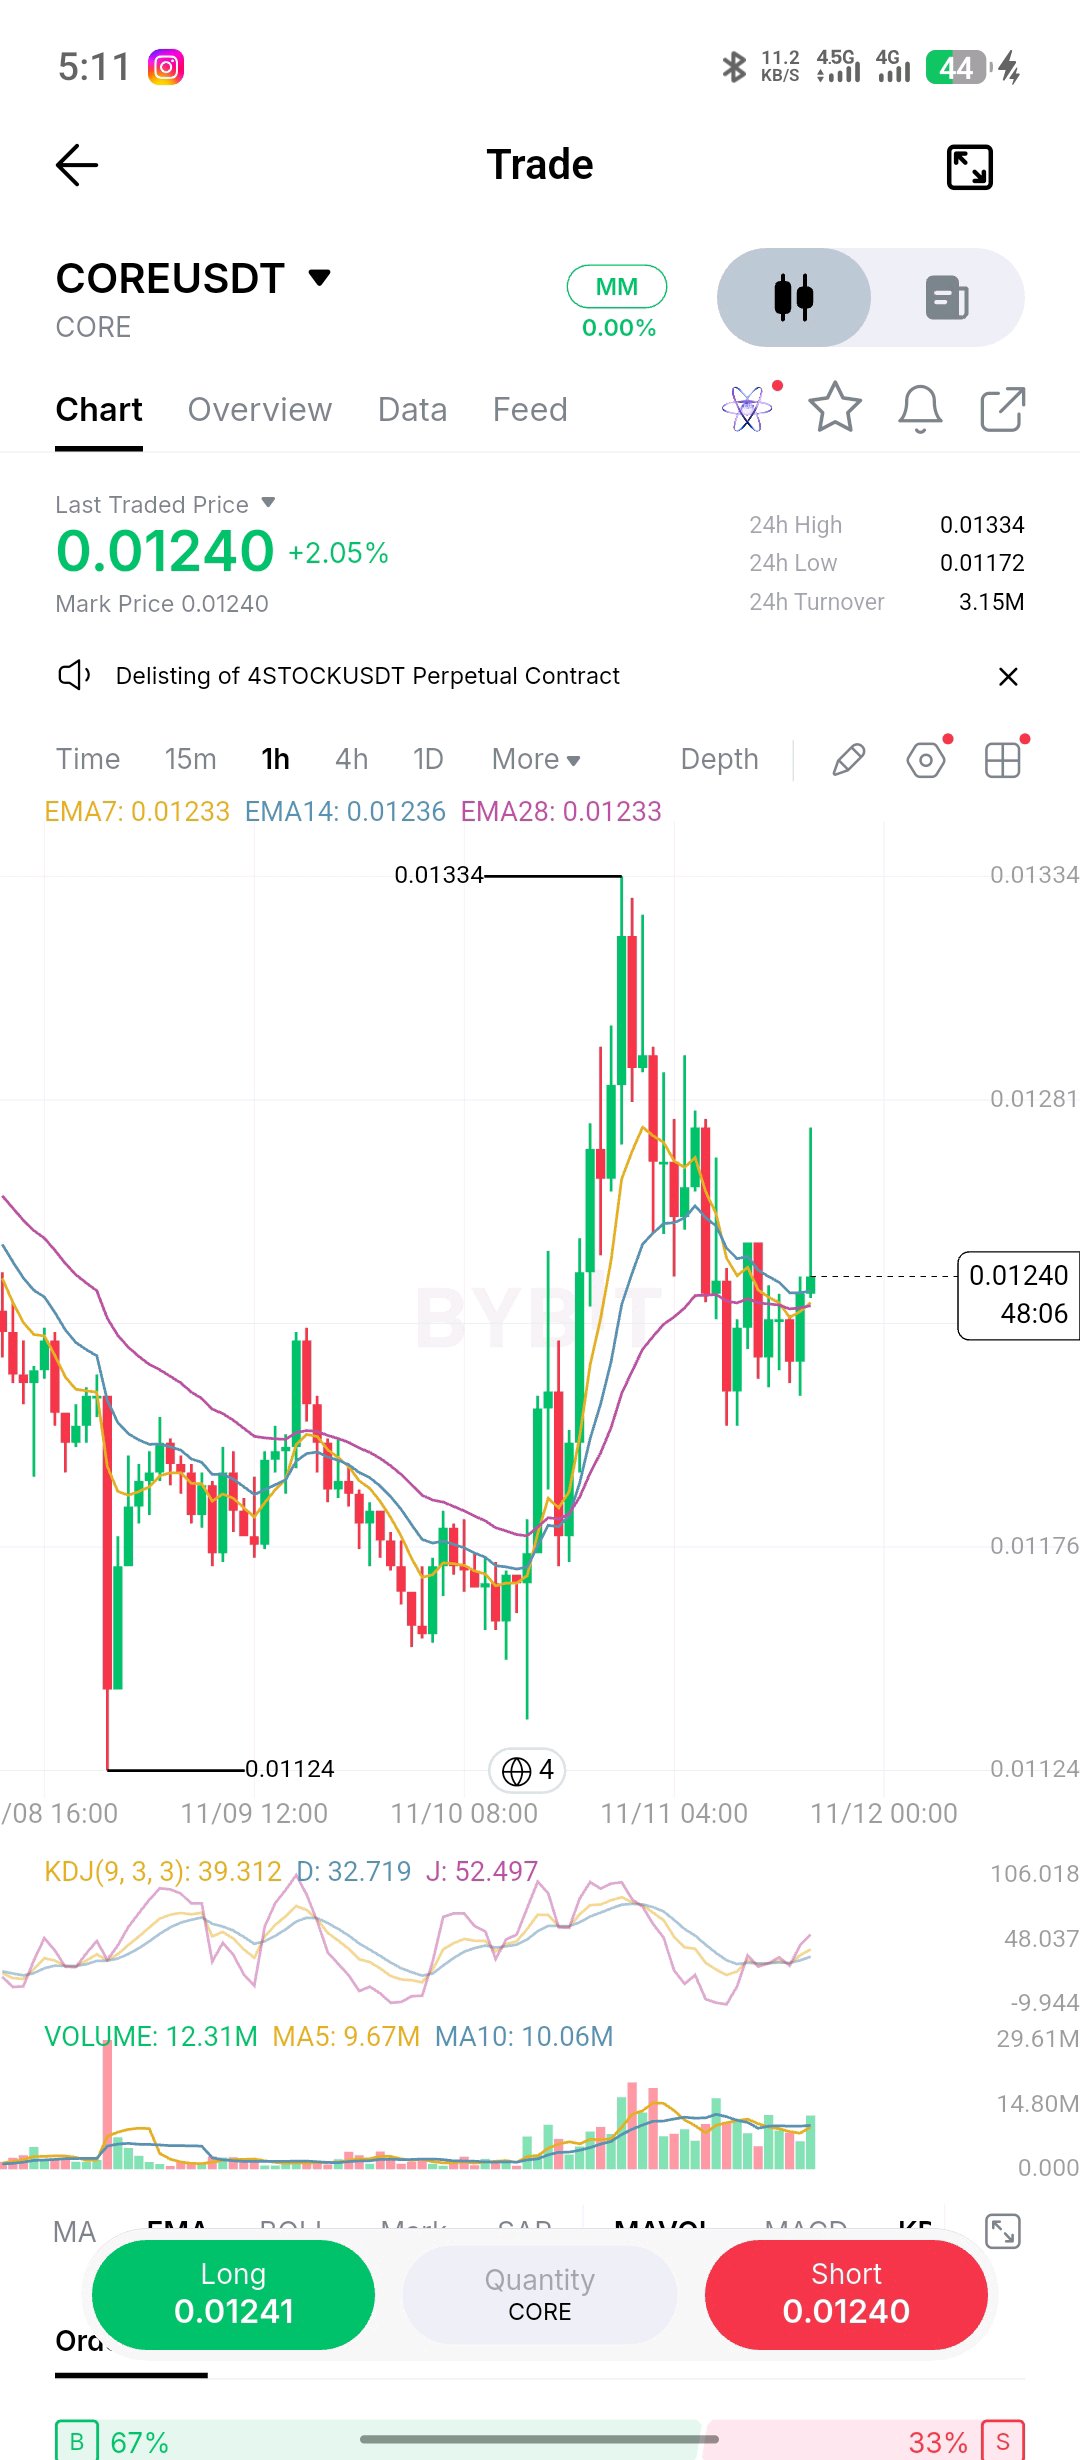
$COREUSDT is starting to look interesting again. After that strong upward move, price pulled back quite sharply, but buyers haven't completely disappeared. We're now seeing some consolidation around $0.01240 as the market tries to find its next direction. What caught my attention is that price hasn't completely given back the gains from the initial rally. Buyers are still trying to defend the recent consolidation area, which gives the bullish side something to work with. The previous high around $0.0133 is the level I'm watching. A clean break above it, preferably supported by stronger buying volume, would be a much better indication that bulls are regaining control. My take: I'm leaning bullish, but I still want confirmation before getting too confident. For me, that means CORE holding its recent support, forming a higher low and eventually breaking above $0.0133 with convincing volume. That would strengthen my bullish outlook. If price loses its current base instead, I'll have to reconsider that bias. I'm watching this one closely. The next move could be interesting. CORE holders, do you think buyers have enough strength to push through the previous high, or will sellers step in again? #ByXIMPACT
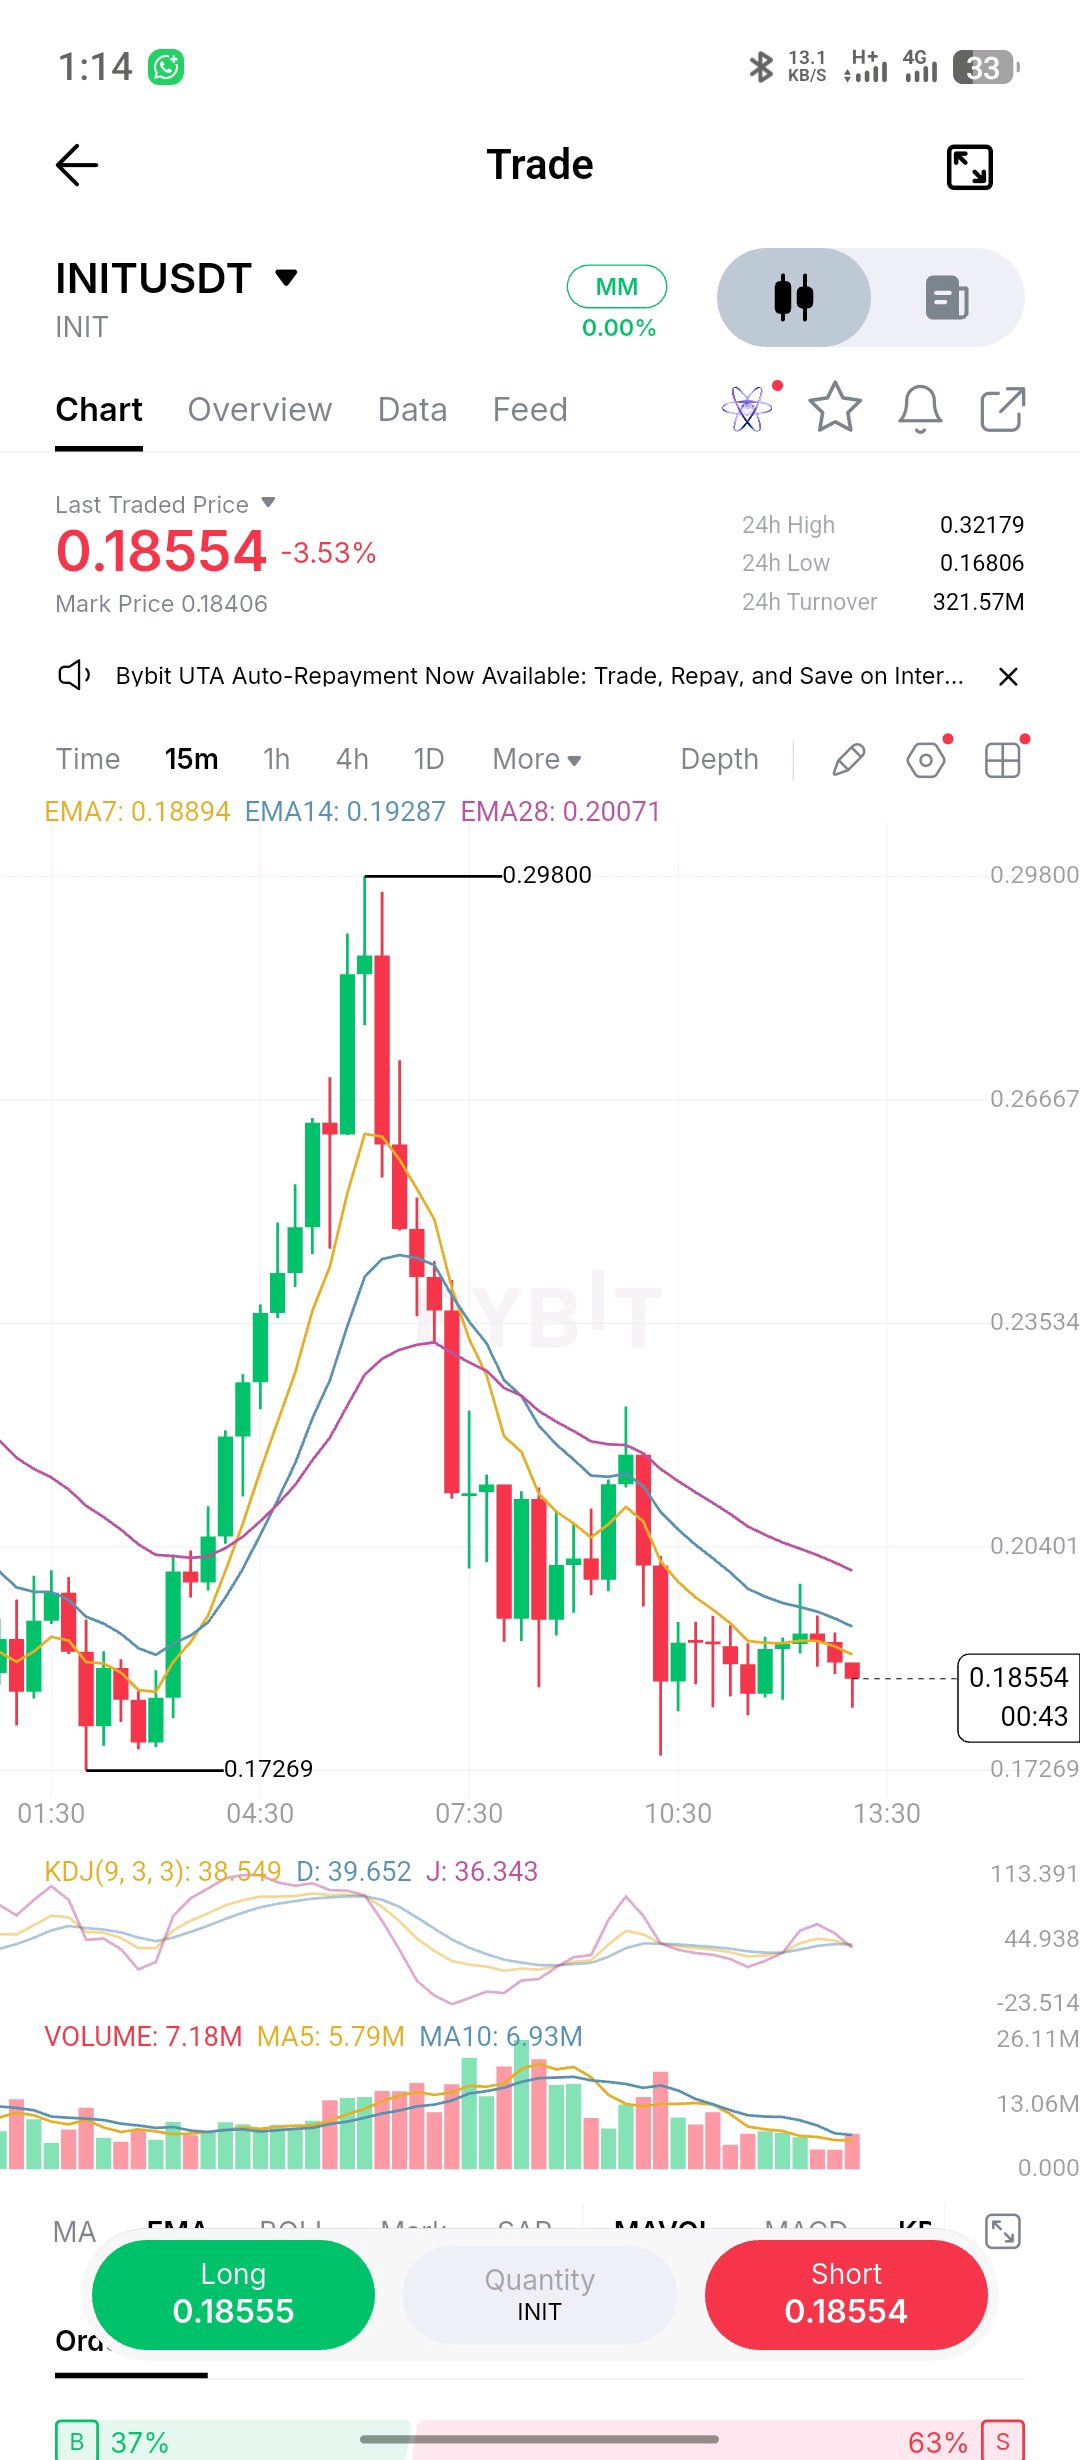
$INITUSDT had an impressive run, but the momentum has clearly cooled off. After pushing up toward $0.235, price faced heavy selling and gave back a large part of that move. It's now hovering around $0.185, and buyers haven't really convinced me that they're ready to take control again. One thing I noticed is that the recent attempts to bounce have been pretty weak. Price is still trading below the moving averages, which tells me sellers haven't completely stepped aside. For now, I'm watching how INJ behaves around $0.18. If buyers manage to defend this area and build some momentum, we could see another recovery attempt. But if that support gives way, things could get uncomfortable for bulls. Personally, I wouldn't rush into anything here. Let the chart give a clearer signal first. What's your take on INJ? Is this just a cooldown after the pump, or are we about to see another leg down? #INJ #Injective #CryptoTrading#ByXIMPACT