
ALMUNAWWARA
755Like0Shares28Fans7Follow
TSLAXUSDT Impulse Breakout & Post-Surge Pullback
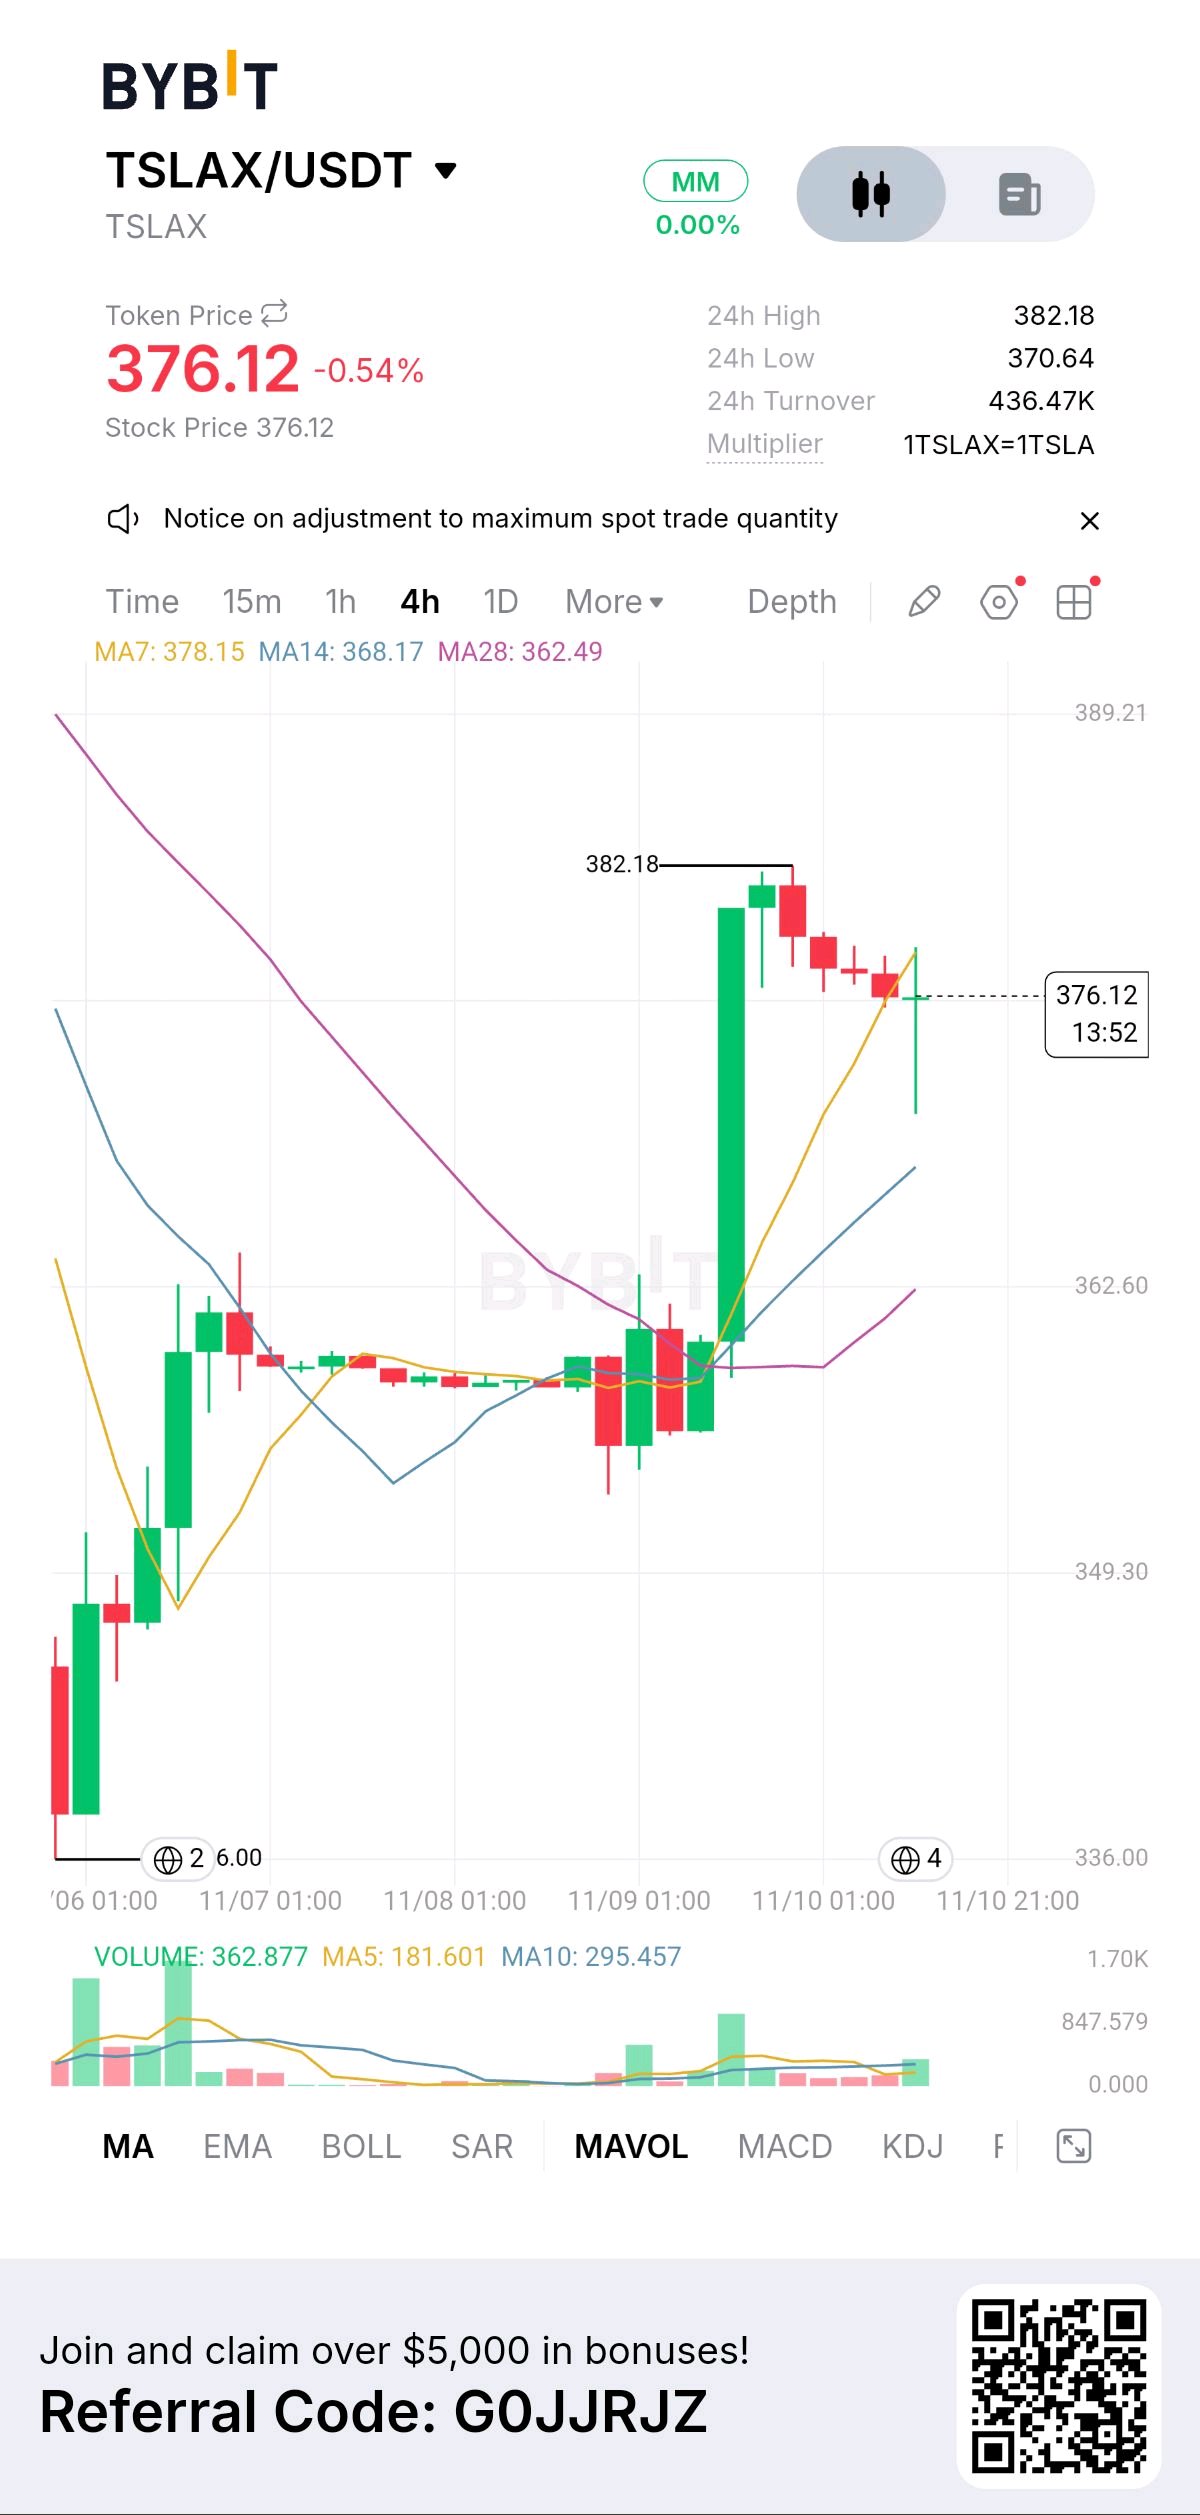
📈 $TSLAXUSDT is experiencing high volatility on the 4-hour timeframe, currently trading at 376.12 (-0.54%). Following a period of sideways consolidation near the 350.00 level, the asset staged a massive impulse breakout, surging to a local high of 382.18 before entering a corrective pullback phase. ▪️ Technical Setup: The asset remains in a clear short-term uptrend, trading above its moving average cluster. Dynamic support is currently being tested at the MA7 (378.15). The steeper MA14 (368.17) and MA28 (362.49) sit well below, highlighting the aggressive nature of the recent upward move and the wide gap between price and longer-term averages. ▪️ Indicators: 24h turnover is robust at 436.47K with a 24h low of 370.64. The volume profile shows a massive, defining green volume spike during the initial breakout candle, confirming heavy buyer interest. However, subsequent candles show waning volume and red consolidation, indicating short-term profit-taking. ▪️ Outlook: The immediate critical level is the 378.15 (MA7). A 4-hour close below this dynamic support suggests a deeper retracement toward the 368.17 (MA14) region to test structural support. Conversely, reclaiming momentum above 382.18 would signal trend continuation. ⚠️ Risk Disclosure: High-volatility markets can experience rapid price swings. This analysis is for educational purposes only and does not constitute financial advice. #ByXIMPACT #WSOT2026 #NovUSCPIWatch #WSOTPicktoEarn10U #USPayrollsAndRateDecisionsDriveMacroWeek

METAXUSDT Parabolic Breakout & High-Level Consol
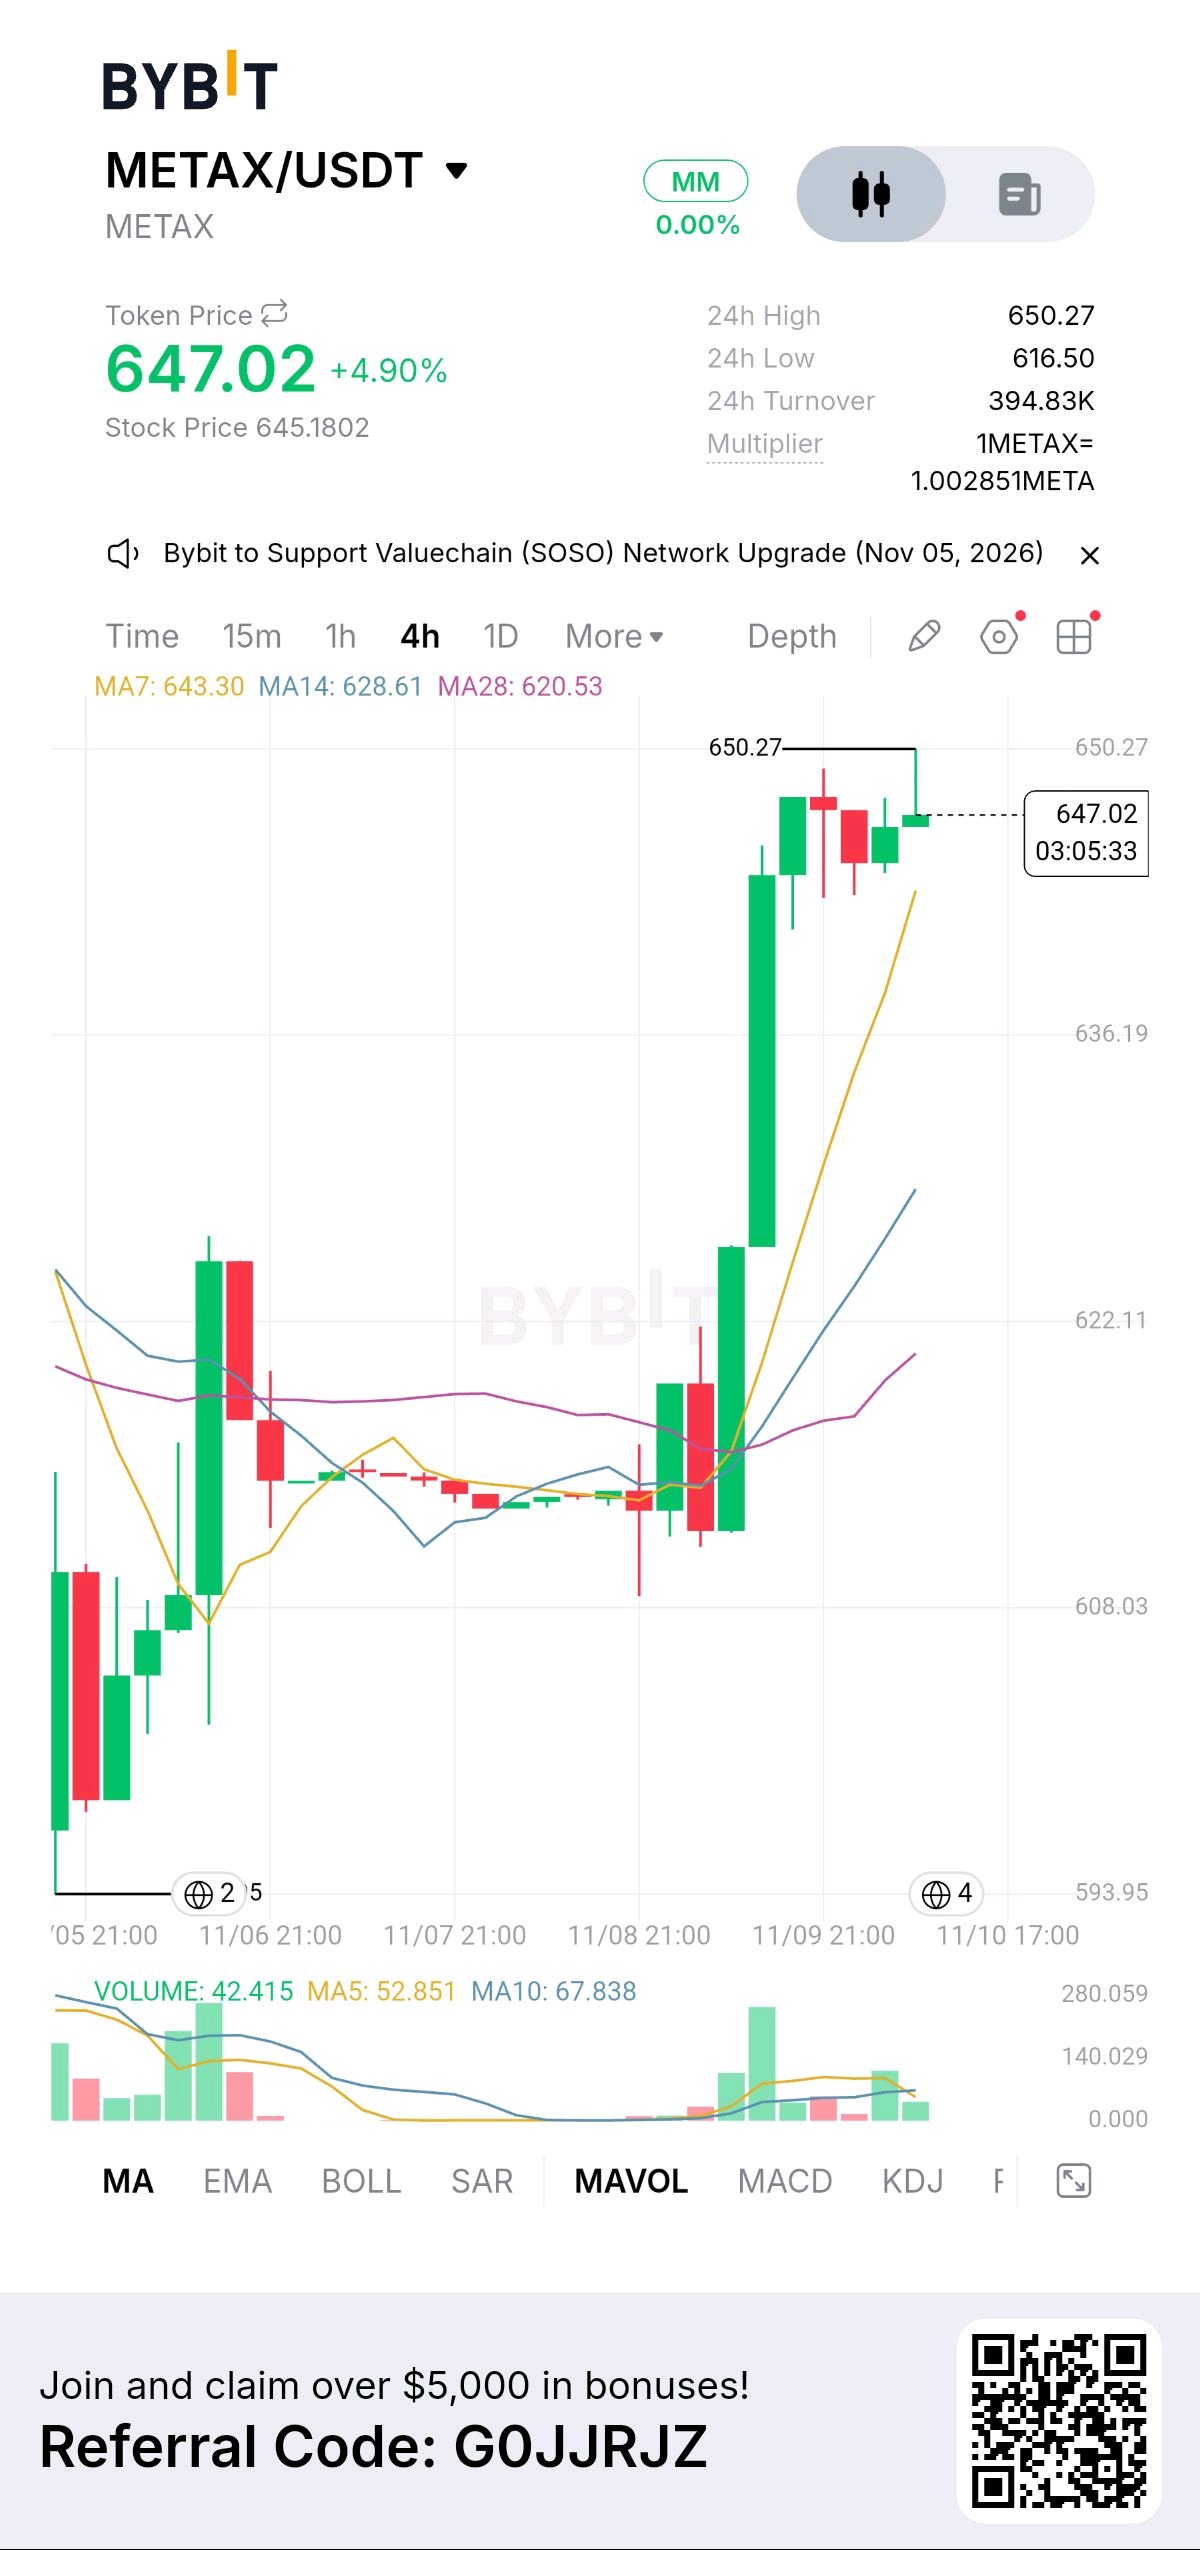
📈 $METAXUSDT is demonstrating massive bullish momentum on the 4-hour timeframe, currently trading at 647.02 (+4.90%). Following a period of tight consolidation around the 610.00 region, the asset staged an explosive breakout, surging to a new 24h high of 650.27 before entering a brief consolidation phase. ▪️ Technical Setup: The asset is trading significantly above its short-term moving average cluster, indicating extreme buyer dominance. Dynamic support is provided by the steeply angled MA7 (643.30), followed by the MA14 (628.61) and MA28 (620.53). The wide separation between the price and the MAs highlights the sheer strength of the current trend. ▪️ Indicators: 24h turnover is robust at 394.83K with a 24h low of 616.50. The volume profile shows a massive green volume expansion during the initial breakout candles, confirming that heavy institutional or whale buying pressure fueled this upward move. ▪️ Outlook: Holding the 643.30 (MA7) dynamic support level is critical to maintain this parabolic structure. A clean 4-hour close above the 650.27 resistance ceiling could trigger an accelerated continuation phase. However, if the price breaks below the MA7, a retest of the deeper MA14 support (628.61) is highly likely as the asset cools off. ⚠️ Risk Disclosure: High-volatility markets can experience rapid price swings. This analysis is for educational purposes only and does not constitute financial advice. #ByXIMPACT #WSOT2026 #WSOTPicktoEarn10U #USPayrollsAndRateDecisionsDriveMacroWeek #BybitAIEvolving

NVDAXUSDT Bottom Formation & Resistance Retest
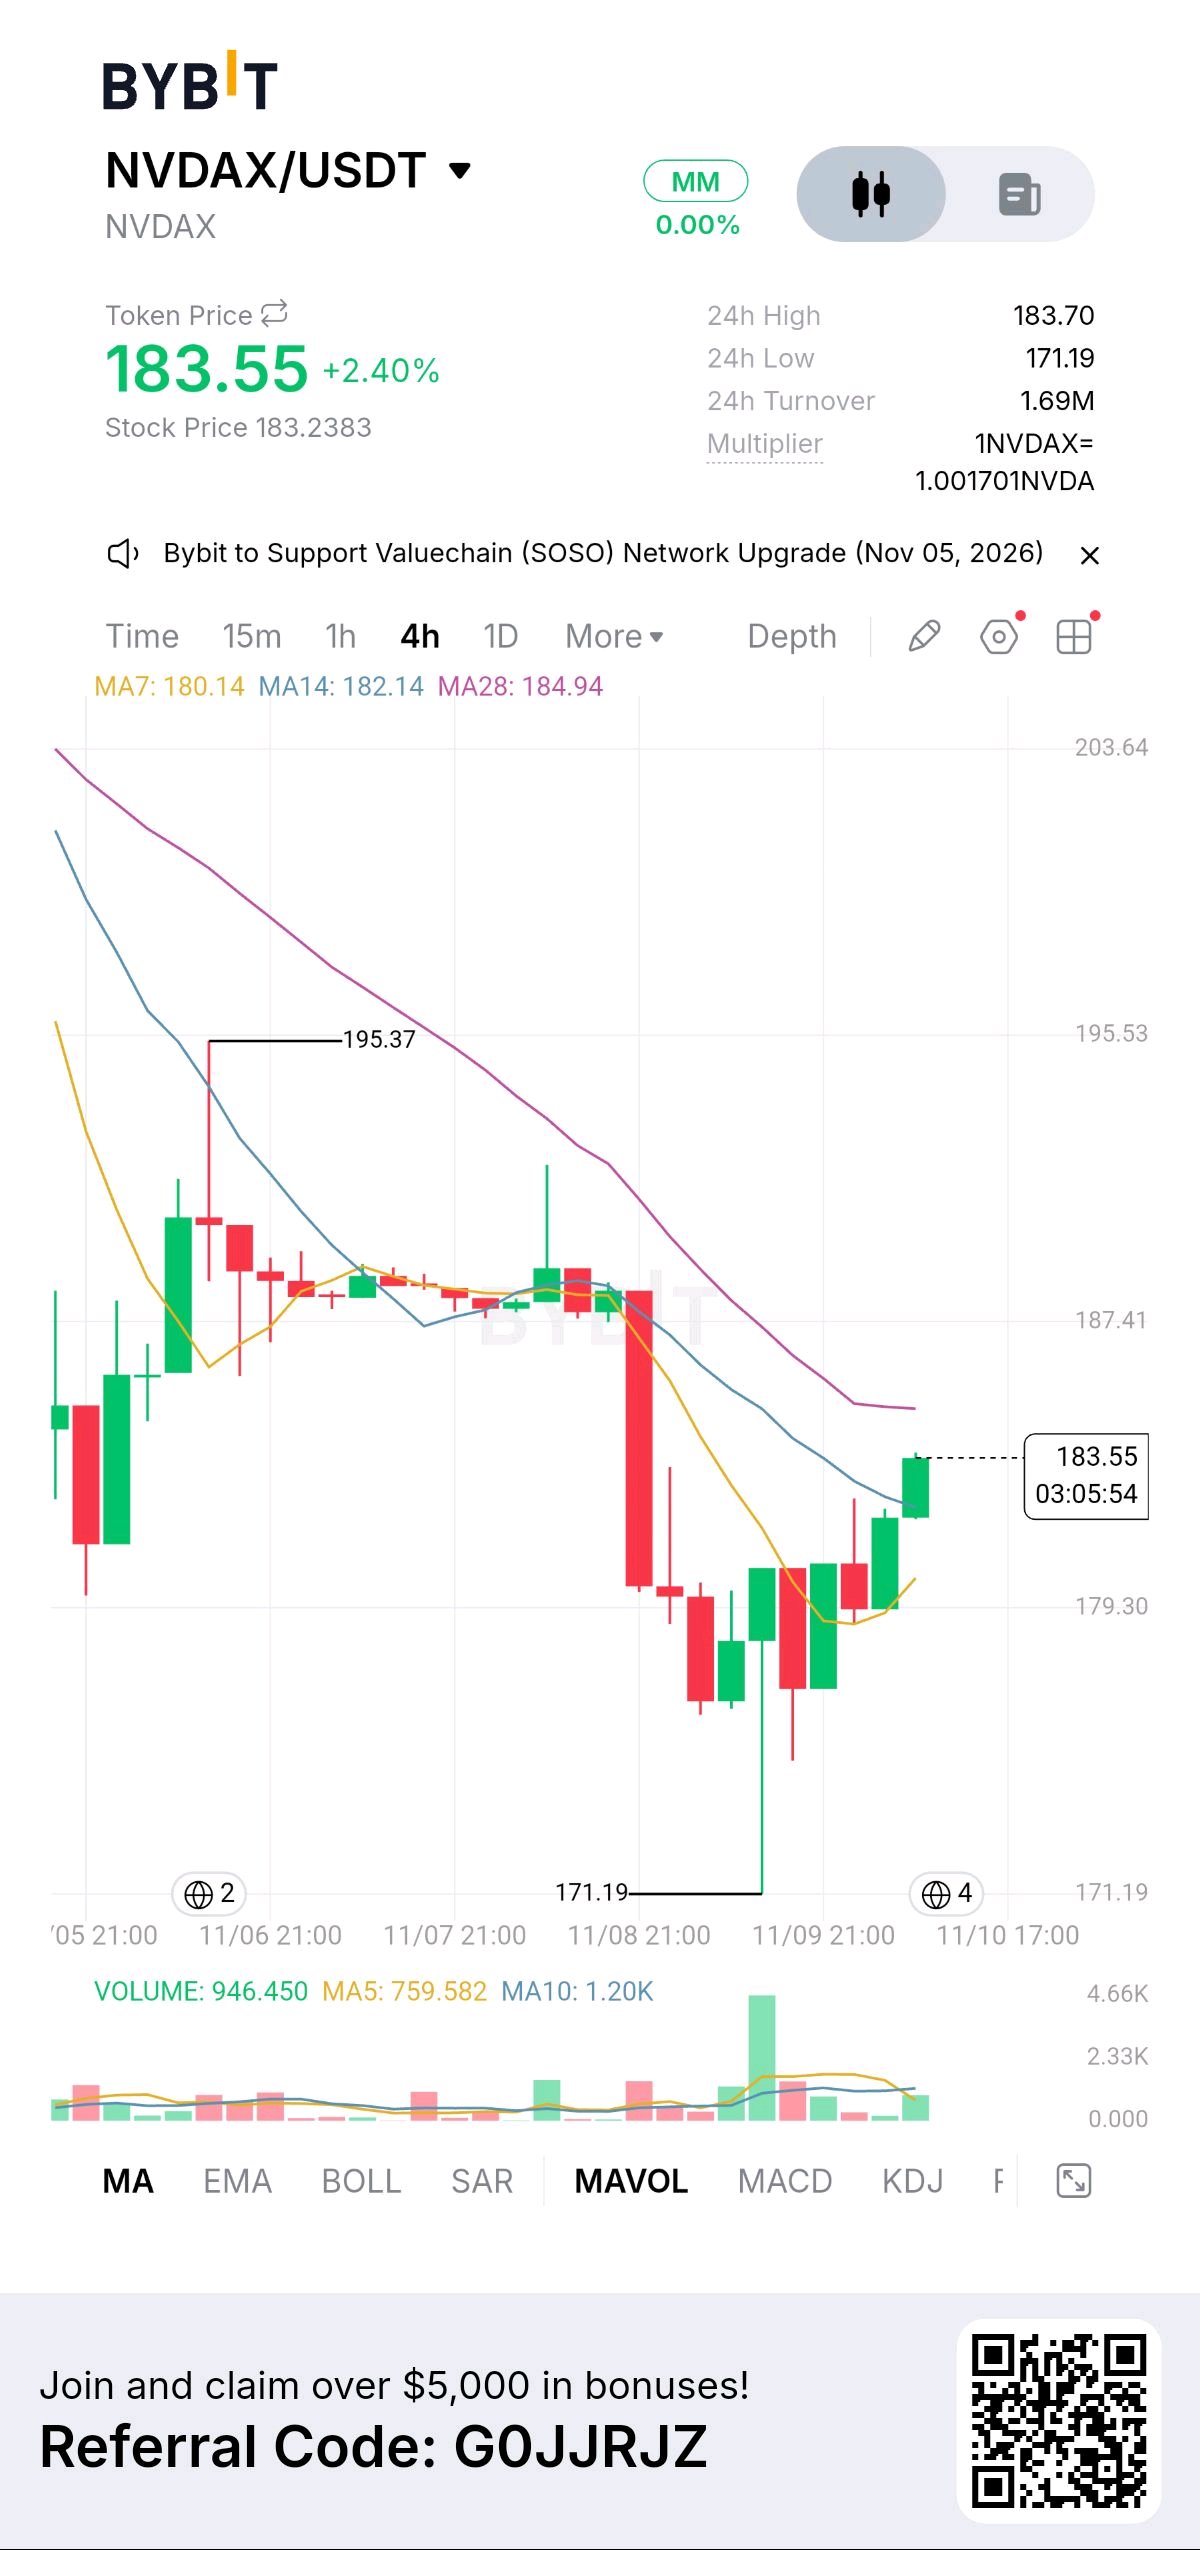
📈 $NVDAXUSDT is showing signs of a potential trend reversal on the 4-hour timeframe, currently trading at 183.55 (+2.40%). After a prolonged downtrend, the asset established a sharp local support floor at 171.19 and has staged a steady recovery, now testing immediate overhead resistance. ▪️ Technical Setup: The asset is attempting to reclaim its short-term moving averages. The price is currently trading above the MA7 (180.14) and MA14 (182.14), but faces immediate pressure from the MA28 at 184.94. The tight cluster of these MAs suggests a consolidation phase before the next major move. ▪️ Indicators: 24h turnover stands at 1.69M with a 24h low of 171.19. The volume profile shows a notable spike in buying volume during the initial bounce from the floor, indicating buyers are actively stepping in to defend the 180.00 psychological level. ▪️ Outlook: A clean 4-hour close above the 184.94 (MA28) ceiling is critical to confirm a bullish continuation toward the previous high of 195.37. Conversely, if rejected here, the price may retest the MA7 dynamic support to build further momentum. ⚠️ Risk Disclosure: High-volatility markets can experience rapid price swings. This analysis is for educational purposes only and does not constitute financial advice. #WSOT2026 #BybitAIEvolving #MidtermsMarketWatch

XAUUSDT Parabolic Surge & Breakout Momentum
$XAUTUSDT $XAU/USDT (Gold) is exhibiting strong intraday bullish momentum on the 15-minute timeframe, currently trading at 4,061.60 (+0.73%). After establishing a local support floor at 4,000.42, the asset has staged an aggressive, parabolic recovery wave, pressing directly against its 24h high at 4,062.73. ▪️ Technical Setup: The asset is trading exceptionally well above its short-term moving average cluster. Dynamic support is provided by the MA7 (4,046.63), MA14 (4,037.33), and MA28 (4,024.01). The steep upward angle and wide separation of these MAs confirm that aggressive short-term buying pressure is entirely dominant. ▪️ Indicators: 24h turnover is massive at 110.61M with a 24h low of 4,000.42. The volume profile shows sustained green expansion throughout the session, indicating that buyers are actively defending higher lows and aggressively stepping into the market above the 4,040 region. ▪️ Outlook: Holding the 4,046.63 (MA7) dynamic support level is critical for the continuation of this trend. A clean 15-minute breakout close above the 4,062.73 resistance ceiling could trigger an accelerated expansion phase. Conversely, a break below the MA7 may signal a short-term cooldown toward the MA14 support. ⚠️ Risk Disclosure: High-volatility markets can experience rapid price swings. This analysis is for educational purposes only and does not constitute financial advice. #IMPACTbyTrade #MyByXTake #MidtermsMarketWatch #FOMCRateDecision
XAGUSDT Uptrend Continuation & Resistance Test
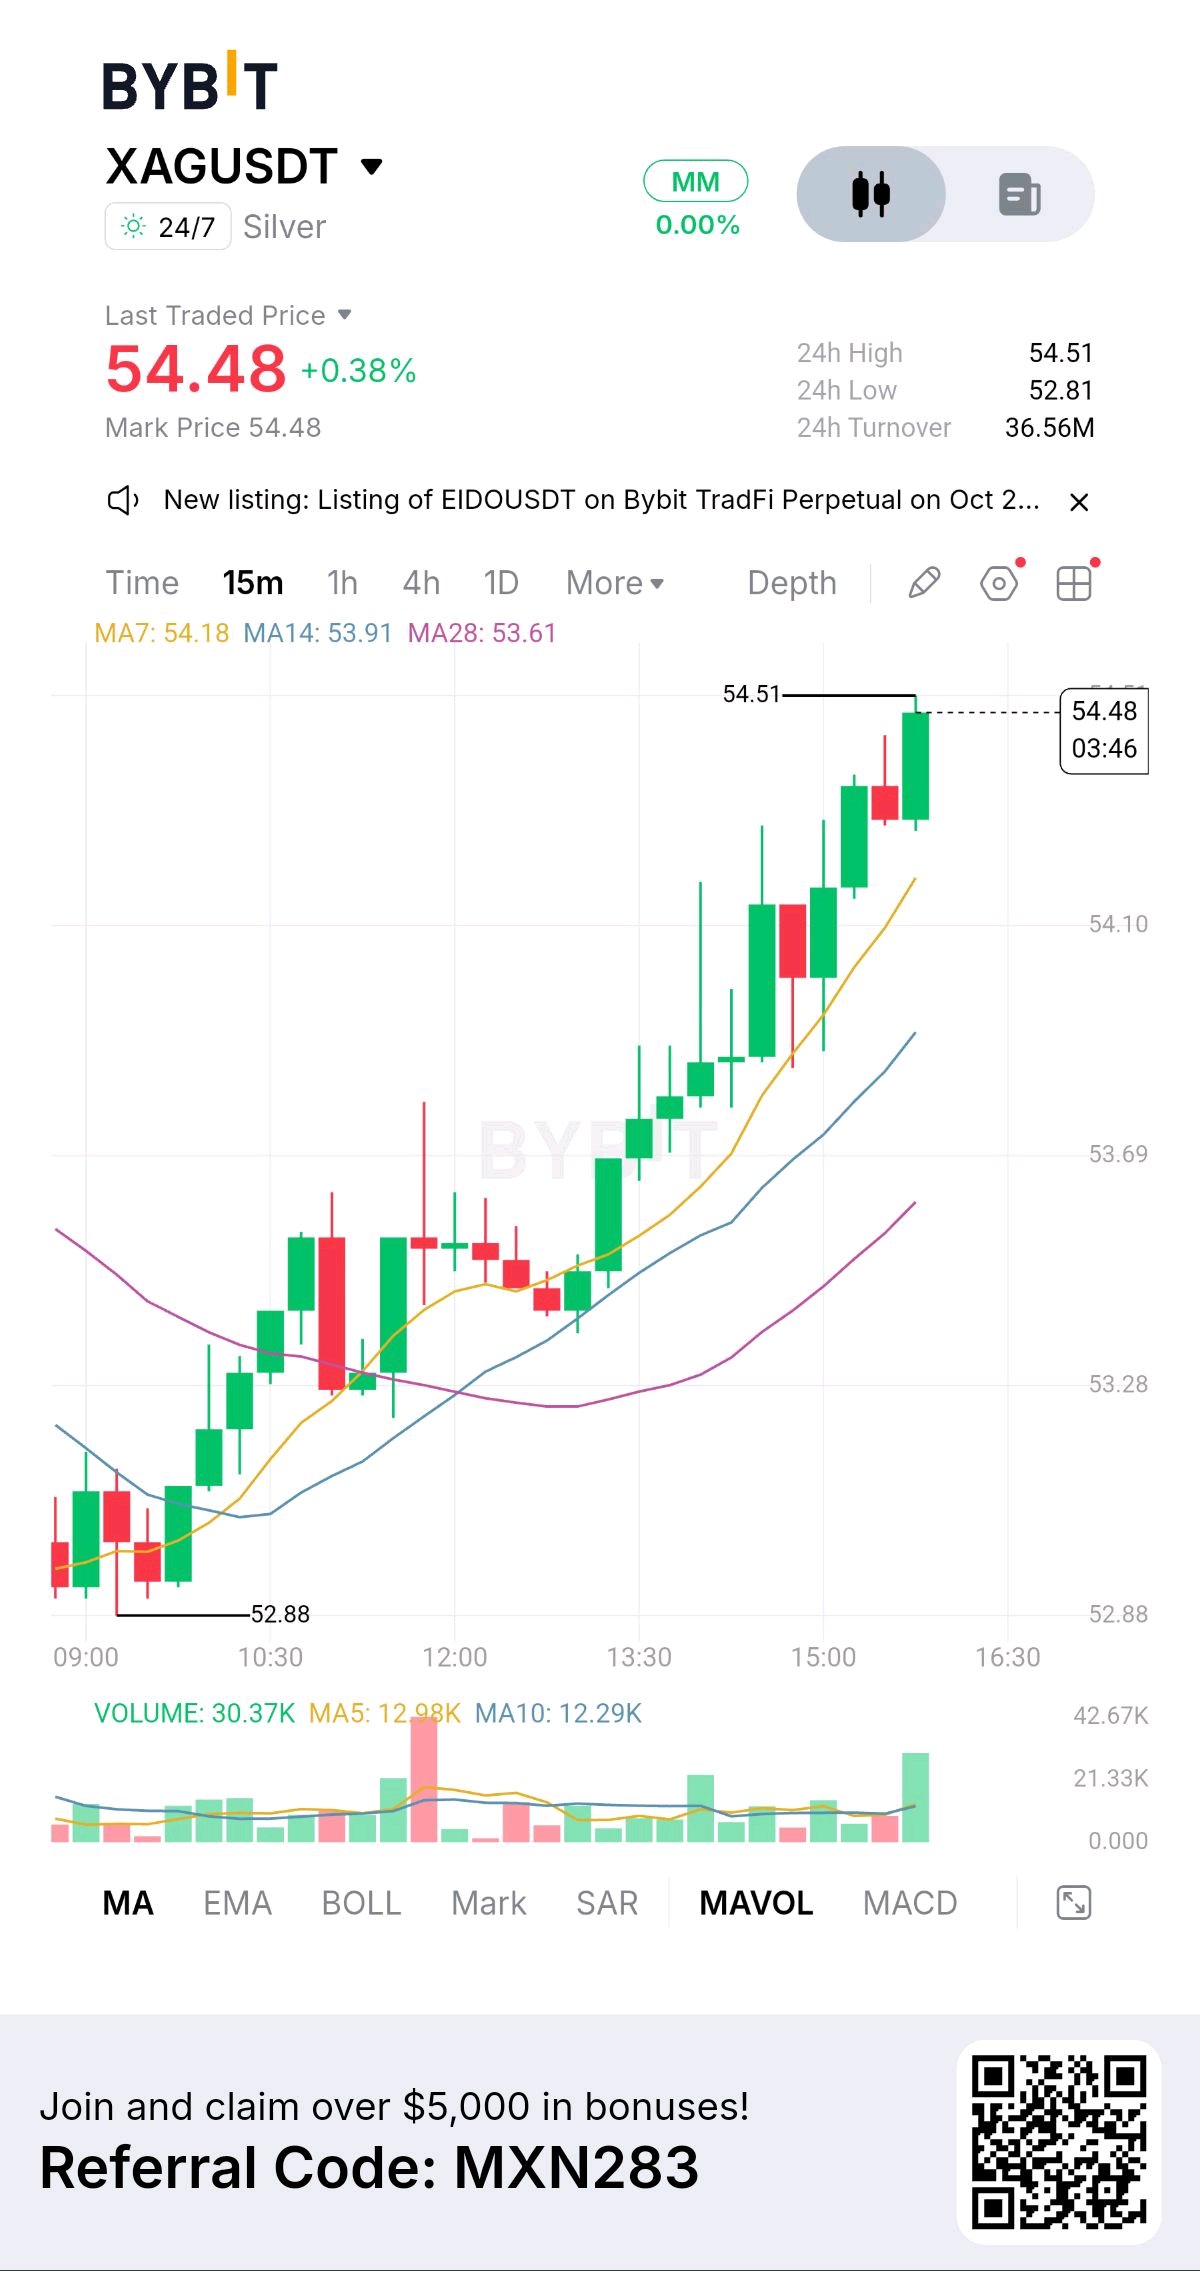
$XAG/USDT (Silver) is displaying strong intraday bullish momentum on the 15-minute timeframe, currently trading at 54.48 (+0.38%). After establishing a solid local support floor at 52.88, the asset has staged a continuous, staircase-like recovery wave, pressing directly against its 24h high and immediate resistance level at 54.51. ▪️ Technical Setup: The asset is trading well above its short-term moving average cluster. Dynamic support is clearly visible, provided by the MA7 (54.18), MA14 (53.91), and MA28 (53.61). The wide separation and steep upward angle of these moving averages confirm that strong short-term buying pressure remains dominant. ▪️ Indicators: 24h turnover stands robust at 36.56M with a 24h low of 52.81. The volume profile reflects steady, consistent green expansion throughout the session, indicating that buyers are actively defending higher lows and stepping in on minor pullbacks above the 54.00 region. ▪️ Outlook: Holding the 54.18 (MA7) dynamic support level is critical for bullish continuation. A clean 15-minute breakout close above the 54.51 resistance ceiling could trigger accelerated momentum. Conversely, a breakdown below the MA7 may lead to a retest of deeper support near the MA28. ⚠️ Risk Disclosure: High-volatility markets can experience rapid price swings. This analysis is for educational purposes only and does not constitute financial advice. #IMPACTbyTrade #MyByXTake #AnthropicS1Filing #Bybit8thAnniversary
The $SPCX V-Shaped Recovery
If you blinked, you missed it. Look at this 15-minute chart for $SPCXXUSDT on Bybit. We saw a violent flush down to 147.00, but the bulls immediately stepped in with massive volume. That huge green candle wiped out the drop and pushed us straight to a new local high at 150.45. This is a classic "V-shape" recovery. The moving averages (MA7, MA14, MA28) are curling up sharply, showing extreme short-term bullish momentum. In fast markets like this, I don't chase the green candles. I'm waiting for a slight pullback to the MA7 (around 149.18) to look for a continuation long. Are you trading the $SPCX volatility today? Let me know your levels! 👇 #IMPACTbyTrade #MyByXTake #AnthropicS1Filing #Bybit8thAnniversary
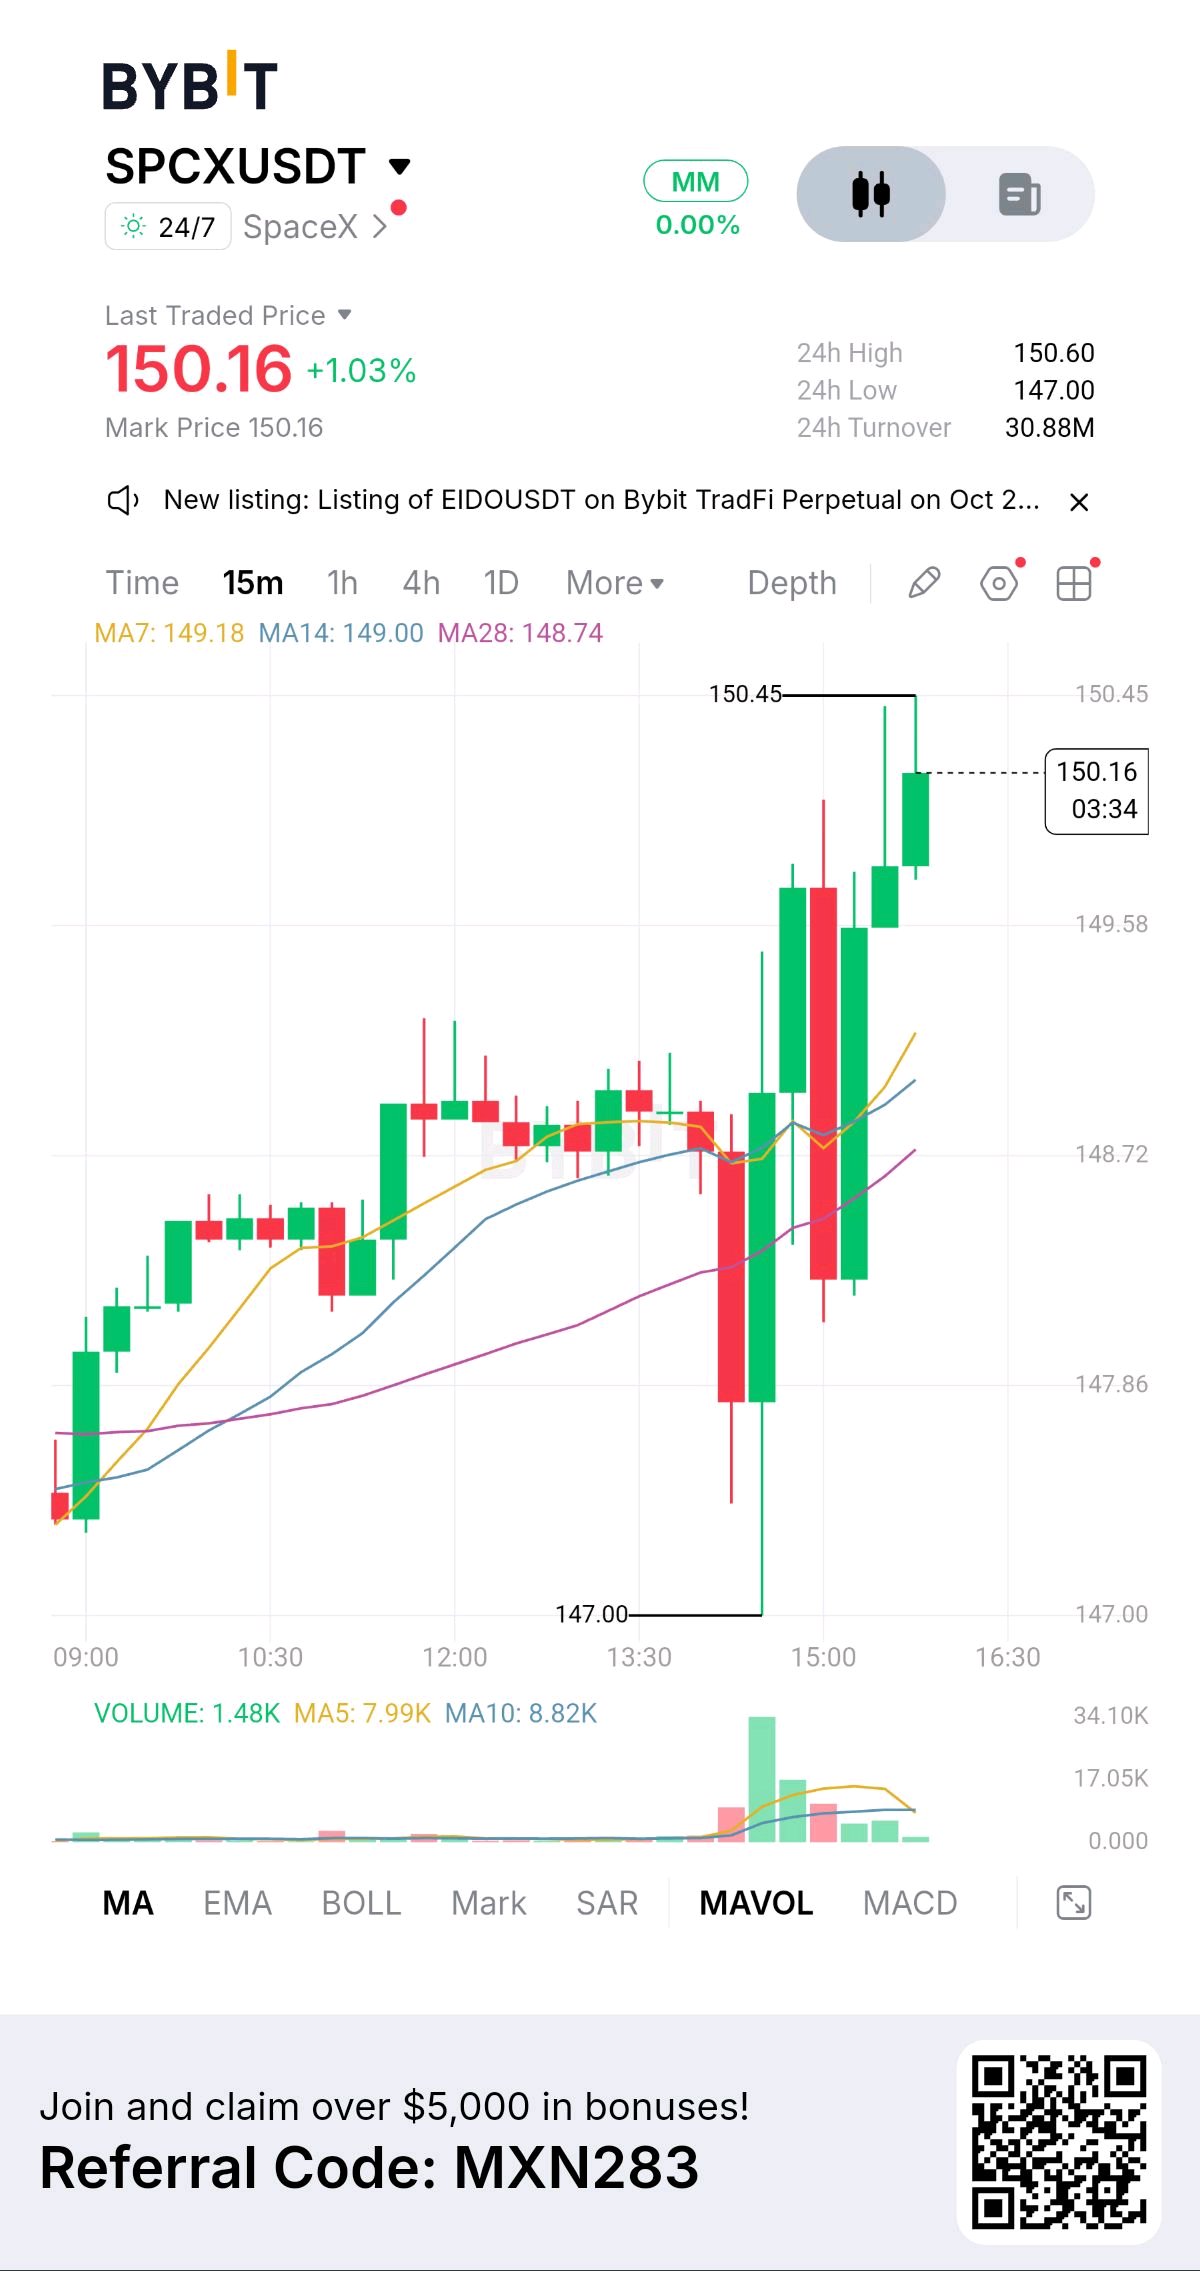
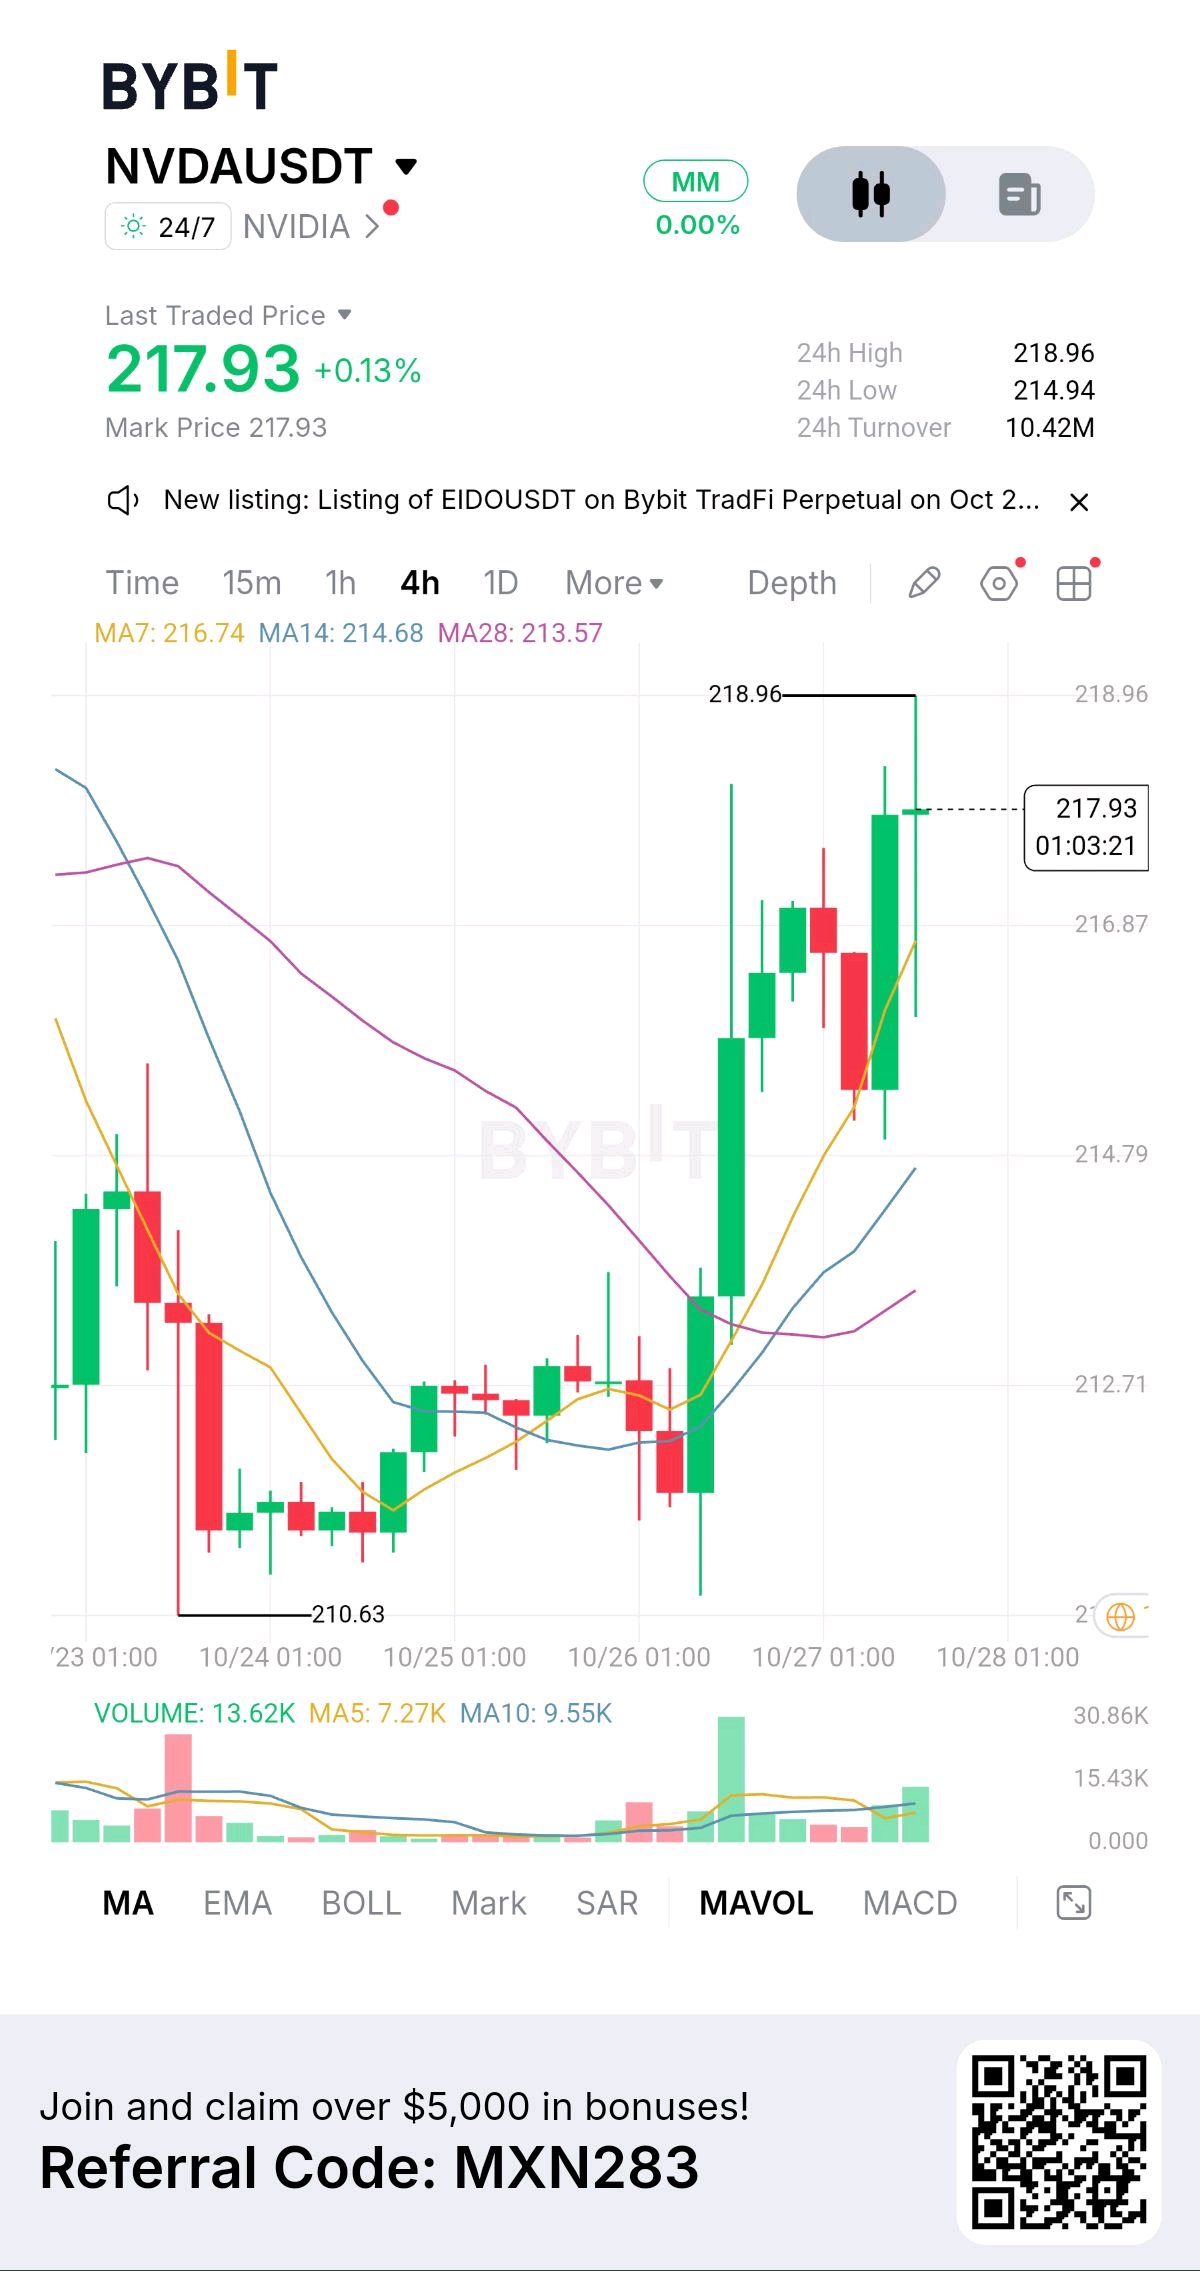
Chart of the Day: The Anatomy of an $NVDA Reversal
Let’s break down this 4H $NVDAXUSDT chart. This is a textbook example of a V-shaped recovery and trend flip. 1️⃣ The Bottom: Price capitulated down to 210.63, shaking out weak hands. 2️⃣ The Shift: We saw a massive green candle with high volume (check the MAVOL at the bottom), signaling aggressive accumulation. 3️⃣ The Alignment: The MAs have now flipped completely. Price is riding above all three (MA7, 14, and 28), which is a classic bullish indicator. We are currently testing the local high at 218.96. If this level breaks, I’ll be looking for a continuation play. However, if we get a pullback to the MA7 (around 216.74), that could also be a prime entry zone for a long position. Real trading requires planning both the upside and the downside. How are you playing this setup? #IMPACTbyTrade #WSOT2026 #MyByXTake
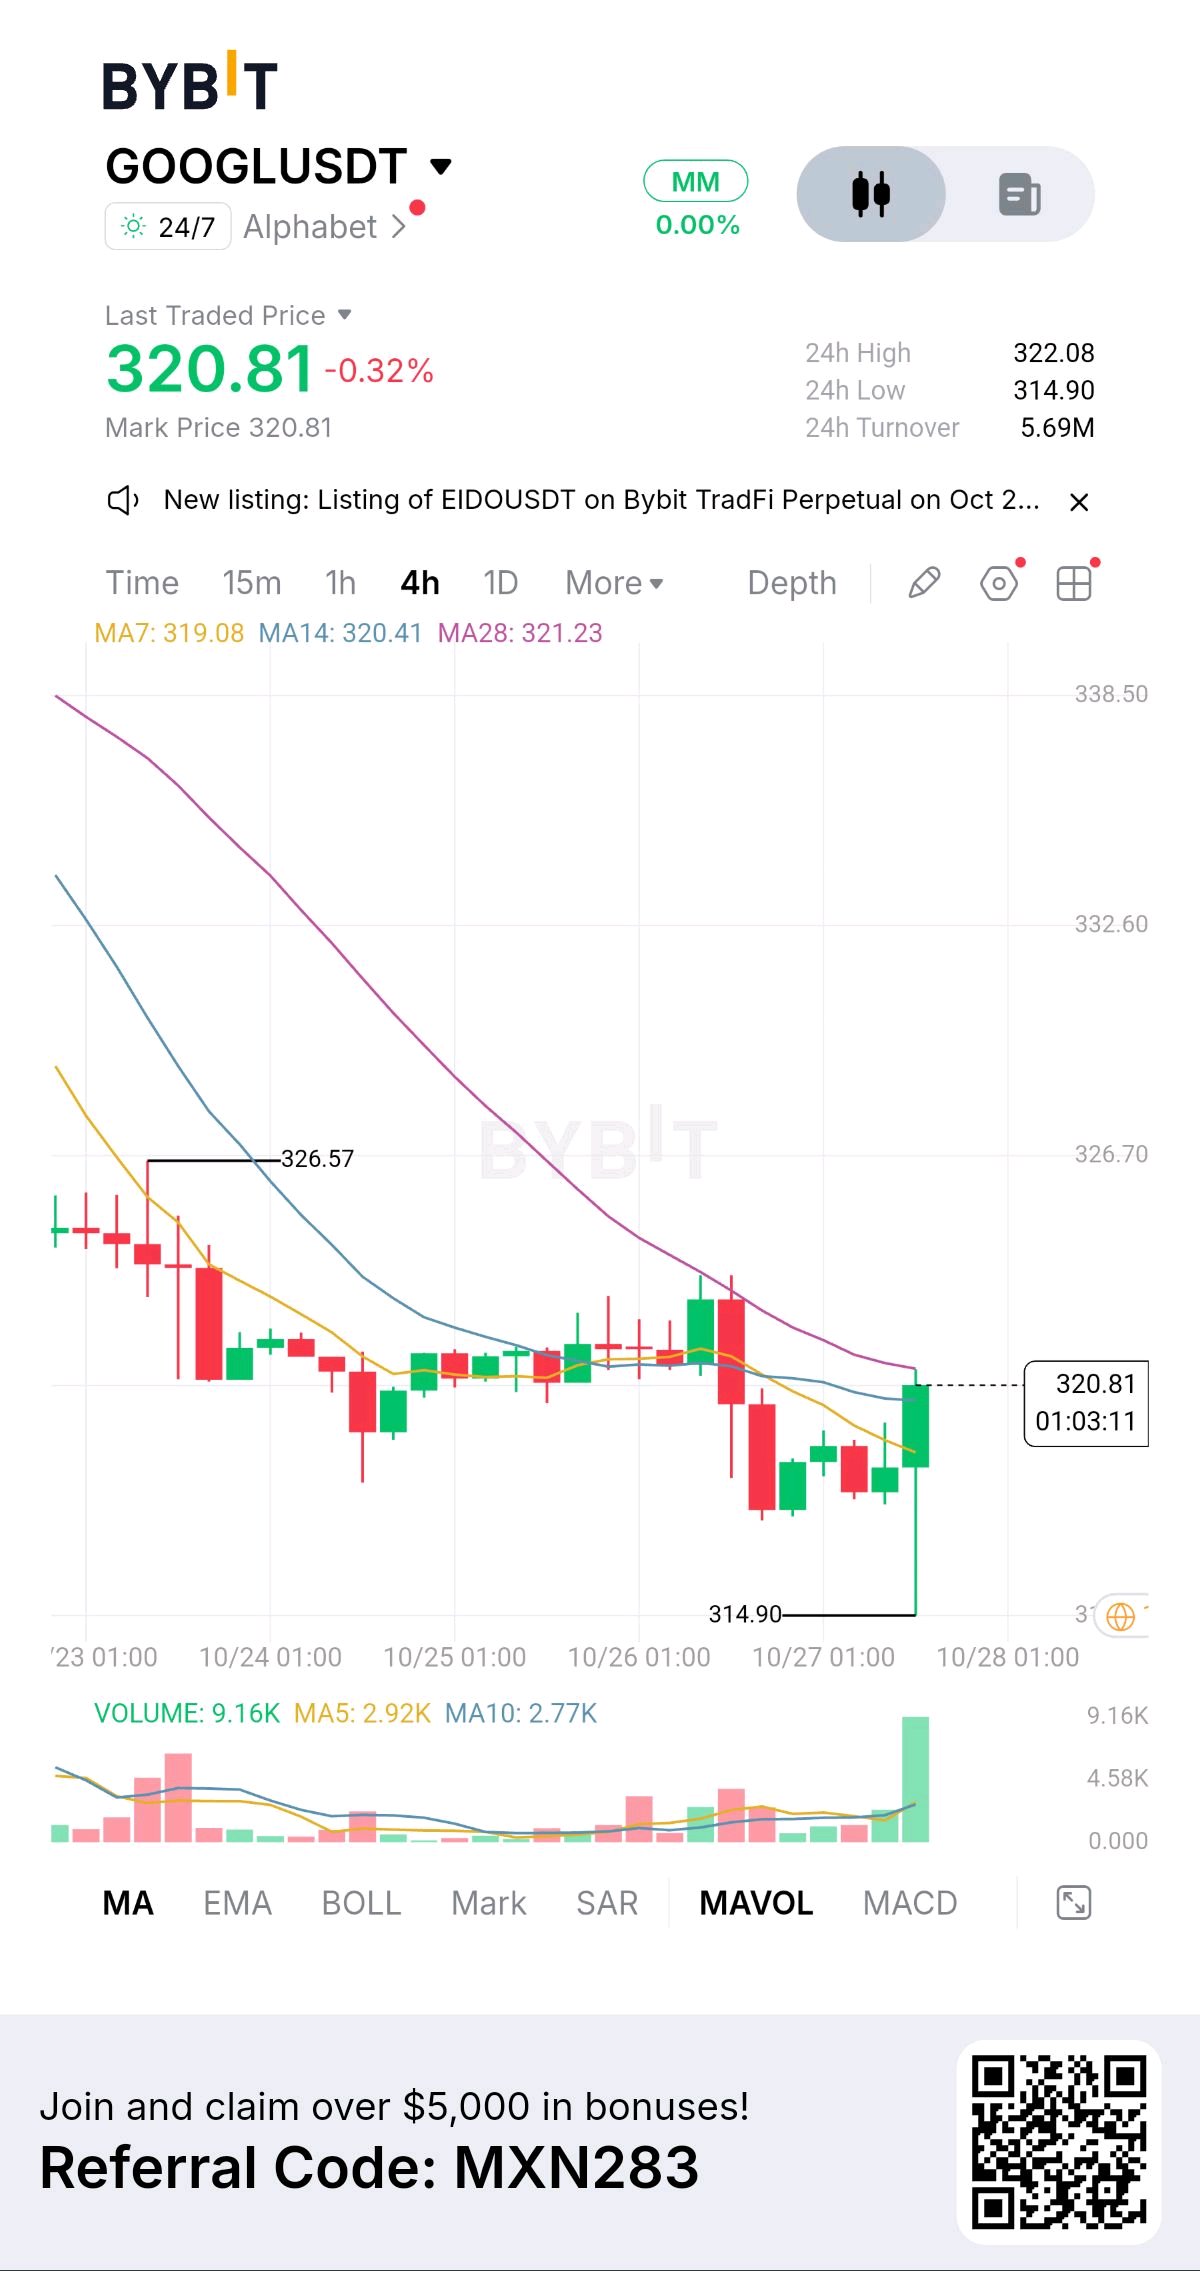
While everyone is focused on Crypto, I’ve been keeping a close eye on TradFi on Bybit. Look at this 4H chart for $GOOGLXUSDT We saw a massive sell-off down to the 314.90 level, but the buyers stepped in aggressively. Notice that massive green volume spike at the bottom? That is exactly the kind of "Real Trading Context" I look for. The price is now pushing back up to test the short-term moving averages (MA7 and MA14). If we can get a solid 4H close above 321.23 (the MA28), I believe we will see a strong continuation to the upside. I’m watching this closely for a breakout play. Are you trading any TradFi assets on Bybit, or are you sticking to crypto? Let me know below! #IMPACTbyTrade #WSOT2026 #MyByXTake
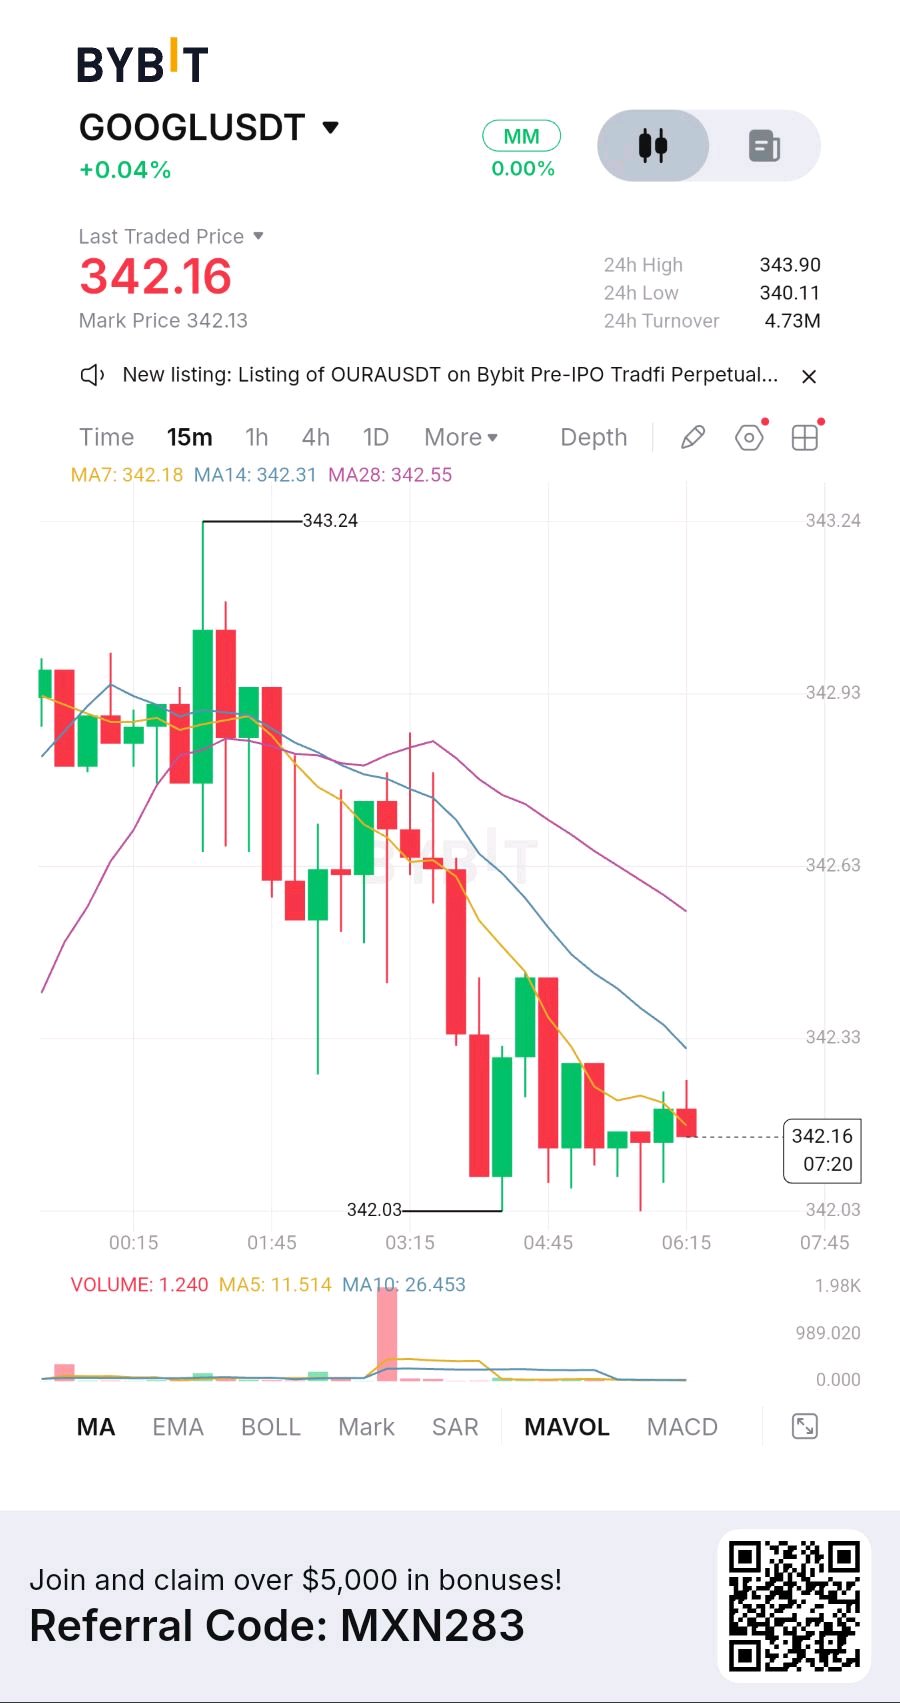
GOOGL at 342.16: Capex Anxiety Overrides Cloud Str
$GOOGLXUSDT on Bybit. Last traded 342.16, up 0.04% on the session. 24-hour range sits between 340.11 and 343.90 and price is pinned right in the middle of that band. The 15-minute chart shows a fading recovery, not a trend. Price spiked to 343.24 early, then drifted lower in a series of red candles, briefly touching 342.03 before settling near 342.16. The moving averages tell the story: MA7 at 342.18, MA14 at 342.31, MA28 at 342.55. Price is trading right on the MA7 but below the 14 and 28, which are stacked overhead as resistance. That is a bearish alignment in the short term. Volume confirms the apathy: the current bar shows 1.240, while MA5 sits at 11.514 and MA10 at 26.453. Participation has dried up completely, and the impulse leg that drove the move to 343.24 has fully faded. The 343.90 high is the immediate ceiling. A clean 15-minute close above that level, with volume expanding, would open the door to continuation. On the downside, the 340.11 session low is the structural floor. A close below the MA cluster would signal momentum has flipped. Funding is neutral at 0.00%, so this is not a crowded-long unwind, just a directional move that has run out of buyers. GOOGLUSDT is a Bybit USDT perpetual tracking Alphabet stock. It is a synthetic equity instrument, not a native crypto token, so the underlying equity story drives everything here. The fundamental backdrop is genuinely split. Q2 revenue hit a record $119.8 billion, up 24% year over year, marking the 12th consecutive quarter of double-digit growth . Google Cloud revenue surged 82% to $24.8 billion, with cloud backlog reaching $514 billion . Nearly 90% of the Fortune 100 now use Gemini Enterprise, and the Gemini app reached 950 million monthly active users . But the market is focused on a different number. Alphabet raised its 2026 capital spending guidance to $195–$205 billion, and free cash flow swung to negative $5.9 billion in Q2 as capex doubled year over year to $44.9 billion . That is the tension the token is pricing. CFO Anat Ashkenazi has signaled further spending increases ahead, and investors are asking whether the AI infrastructure buildout will translate into the kind of operating leverage that justifies the premium . The valuation debate is also live. On a trailing basis, Alphabet trades at roughly 17x earnings, well below the S&P 500's 25x . But that discount is partly an artifact of a $99 billion one-time unrealized gain on its SpaceX stake that ran through the income statement . Strip that out, and the picture looks less cheap on operating earnings . The equity closed at $342.75 on September 28, down 0.34% . The token trades at 342.16, a slight discount that reflects the token market pricing in marginal downside. The next real catalyst is Q3 earnings on October 28, which will be the first report to show whether the capex is translating into the kind of cloud momentum that can sustain the stock . The honest read is that this is a fundamentally strong asset caught in a valuation holding pattern. The cloud growth is real, the backlog is massive, but the cash-flow math is ugly. Setup is neutral-to-bearish while price holds below the 342.31 MA14. A break below 340.11 would put the 338 area in play, while a reclaim of 343.24 with volume would put the highs back in play. Where are you watching for the next entry holding above 342 or waiting for a retest of the 340 low? Drop your level in the comments. #ByXIMPACT
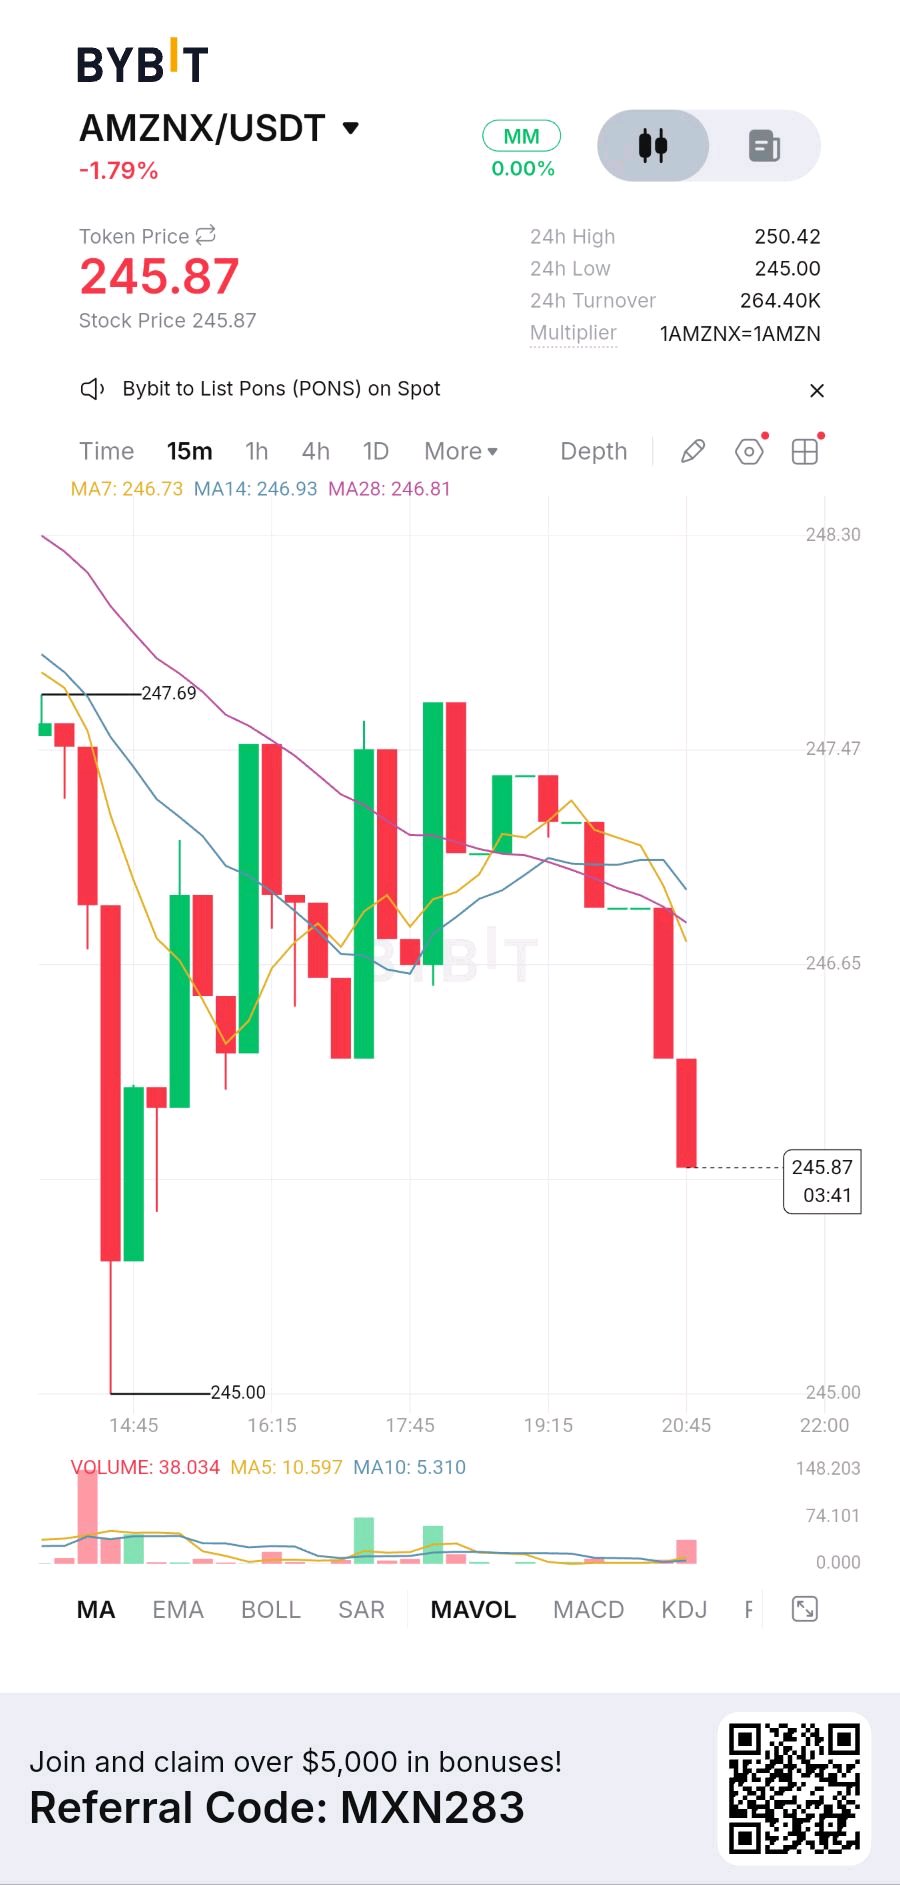
AMZNX at 245.87: Free Cash Flow Breaks Below Zero
$AMZNXUSDT on Bybit. Last traded 245.87, down 1.79% on the session. 24-hour range sits between 245.00 and 250.42 — and that lower band is the level the market just tested. The 15-minute chart shows a clear rejection from the highs. Price spiked to 247.69, then sold off in a series of red candles that took the contract to 245.00 before bouncing to the current 245.87. The moving averages tell the story: MA7 at 246.73, MA14 at 246.93, MA28 at 246.81. Price is trading below all three, with the cluster stacked directly overhead as resistance. That is a bearish alignment, and the market has a clear short-term bias to the downside. The 247.69 high is the immediate ceiling. A clean 15-minute close above it would be required to invalidate the pullback. On the downside, the 245.00 session low is the structural floor. Volume confirms the pressure: the current bar shows 38.034, while MA5 sits at 10.597 and MA10 at 5.310. The red volume bar at the current candle shows active distribution, not accumulation. Funding is neutral at 0.00%. AMZNX is a tokenized tracker issued through Backed Finance, mirroring Amazon.com stock with 1:1 backing. It is a synthetic equity instrument, not a native crypto token, which is why the underlying equity story matters more than the chart here. The fundamental backdrop is genuinely strong on the growth side. AWS revenue growth has accelerated for four straight quarters, hitting 37% in the second quarter . The company is also deepening its AI infrastructure partnerships, including a multi-generation deal with Qualcomm to develop custom silicon for AWS data centers focused on AI inference and high-speed optical connectivity . On the platform side, Amazon Bedrock now supports OpenAI's GPT-6 Astra model, and AWS continues rolling out agentic tools like the Amazon Quick desktop app . But there is a genuine overhang the market is pricing in. Amazon's trailing-12-month free cash flow has turned negative as the company spends heavily on AI infrastructure . The stock has slid around 12% from its record close of $284.02 on August 3, even as the cloud unit accelerates . Analyst sentiment remains split — Bernstein maintained a Buy rating with a $320 price target on September 27, while Rothschild & Co Redburn maintained a Hold rating on the same day . GuruFocus rates the stock as fairly valued on its GF Value metric, with a GF Score of 93/100 reflecting strong fundamentals but noting the cash-flow-negative status makes traditional earnings metrics less meaningful . The token is showing the tension clearly. AMZNX trades at 245.87, while the underlying stock closed at $249.27 on September 25, down 0.62% after a week of choppy action . The token trades at a discount to the equity, which reflects the market pricing in more downside than the stock market is. The near-term setup is bearish while price holds below the 246.73 MA7. A break below 245.00 would put the 244 area in play, while a reclaim of 247.69 with volume would put the token back to neutral. The next real catalyst is Amazon's Q3 earnings on October 29, which will be the first full report to show whether the AI capex is translating into the kind of operating leverage that justifies the premium . The honest read is that this is a post-rally cooldown in a fundamentally strong asset with a genuine cash-flow cloud hanging over it. Where are you watching for the next entry holding above 245 or waiting for a retest of the 246.93 mean? Drop your level in the comments. #ByXIMPACT
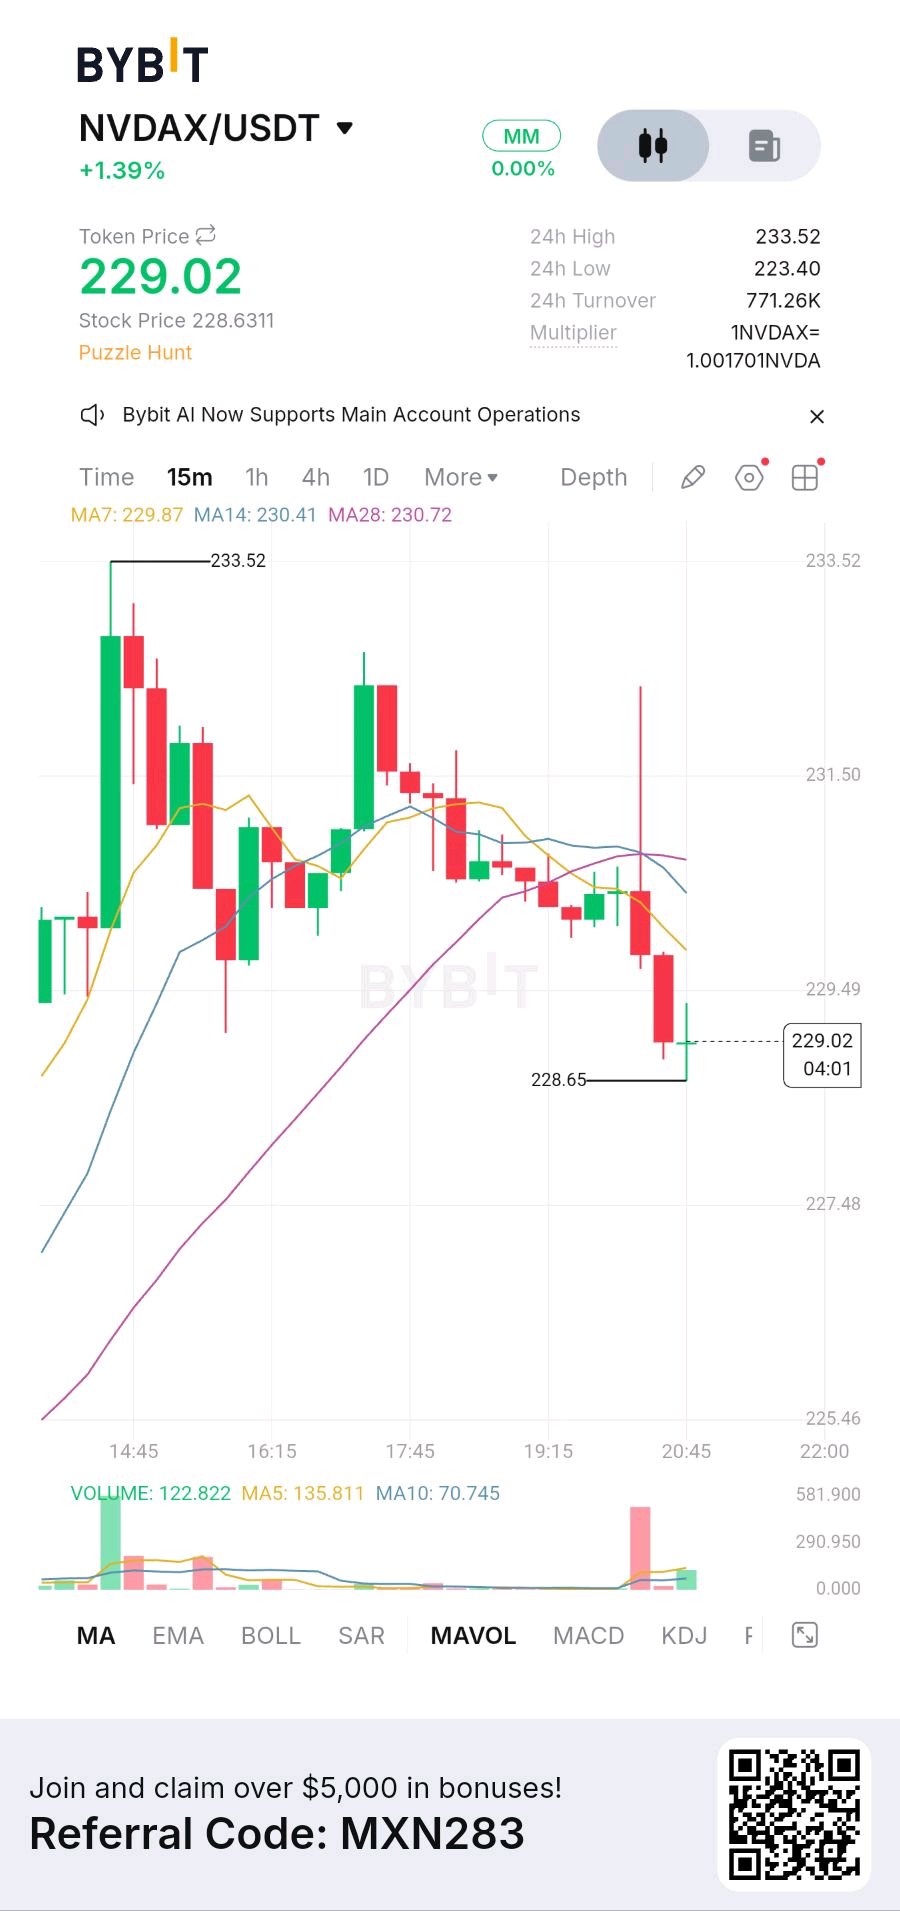
NVDAX at 229.02: Pullback Tests the 228.65 Floor
$NVDAXUSDT on Bybit. Last traded 229.02, up 1.39% on the session. 24-hour range sits between 223.40 and 233.52 and the token has just pulled back hard into the lower half of that band. The 15-minute chart shows a rejection from the highs. Price spiked to 233.52 early, then rolled into a series of lower highs that dragged the contract back to a low of 228.65 before bouncing to the current 229.02. The moving averages tell the story: MA7 at 229.87, MA14 at 230.41, MA28 at 230.72. Price is trading below all three, with the 14 and 28 stacked directly overhead as resistance. That is a bearish alignment in the short term, and the bounce is not yet strong enough to reclaim the cluster. Volume confirms the selling pressure — the current bar shows 122.822, while MA5 sits at 135.811 and MA10 at 70.745. The selloff had real participation, and the red volume spike near 20:45 shows distribution, not accumulation. Funding is neutral at 0.00%. The 233.52 high is the immediate ceiling. A clean 15-minute close above it, with volume expanding, would be required to invalidate the pullback. On the downside, the 228.65 low is the structural floor, and a break below it opens the 227.48 area. The near-term setup is neutral-to-bearish while price holds below the 230.41 MA14. A reclaim of the moving average cluster would put the token back to neutral, but the buyers have not shown they can do that yet. NVDAX is a tokenized tracker issued through Backed Finance, mirroring NVIDIA Corp. stock with 1:1 backing. It is a synthetic equity instrument, not a native crypto token, which is why the underlying equity story matters more than the chart. The fundamental backdrop remains one of the strongest in the market. Q2 fiscal 2027 revenue hit $96.2 billion, up 106% year over year, with data center revenue alone reaching $89 billion — 92.5% of total revenue. Net income came in at $59.68 billion, up 126%, and gross margins held at 75%. Free cash flow for the quarter was $21.34 billion. The product roadmap is relentless: Blackwell Ultra shipments are ramping, and the Vera Rubin architecture ships in the second half of 2026 with a 3nm process, HBM4 memory, and NVLink 6 interconnect. CEO Jensen Huang has publicly backed a forecast that NVIDIA will sell twice as many chips next year as it ships this year, and CFO Colette Kress guided for 70% fiscal 2028 revenue growth. The specific catalyst driving the recent strength is xAI's Colossus 2 expansion. Elon Musk said Colossus 2 currently uses 110,000 NVIDIA GB200 chips and 440,000 GB300 chips, with another 220,000 GB300s due, and the facility is targeting 1 million GPUs by the end of 2026. That is a direct, verifiable demand signal for NVIDIA's data center business. But the stock is not moving in a straight line. NVDA closed at $228.28 on September 25, up 0.31%, after a week that saw the shares swing between $223.40 and $233.52. The token now trades at 229.02, a slight premium to the equity close, reflecting the market pricing in the Colossus 2 news and the broader AI infrastructure cycle. The honest read is that this is a healthy pullback in a fundamentally strong asset, not a broken trend. The extension from the moving averages earlier in the month is being worked off, and the 228.65 floor is the level to watch. A clean break below it would signal a deeper flush toward the 227 area, while a reclaim of the 230.41 MA14 would put the highs back in play. Where are you watching for the next entry holding above 228.65 or waiting for a retest of the 230.41 mean? Drop your level in the comments. #ByXIMPACT
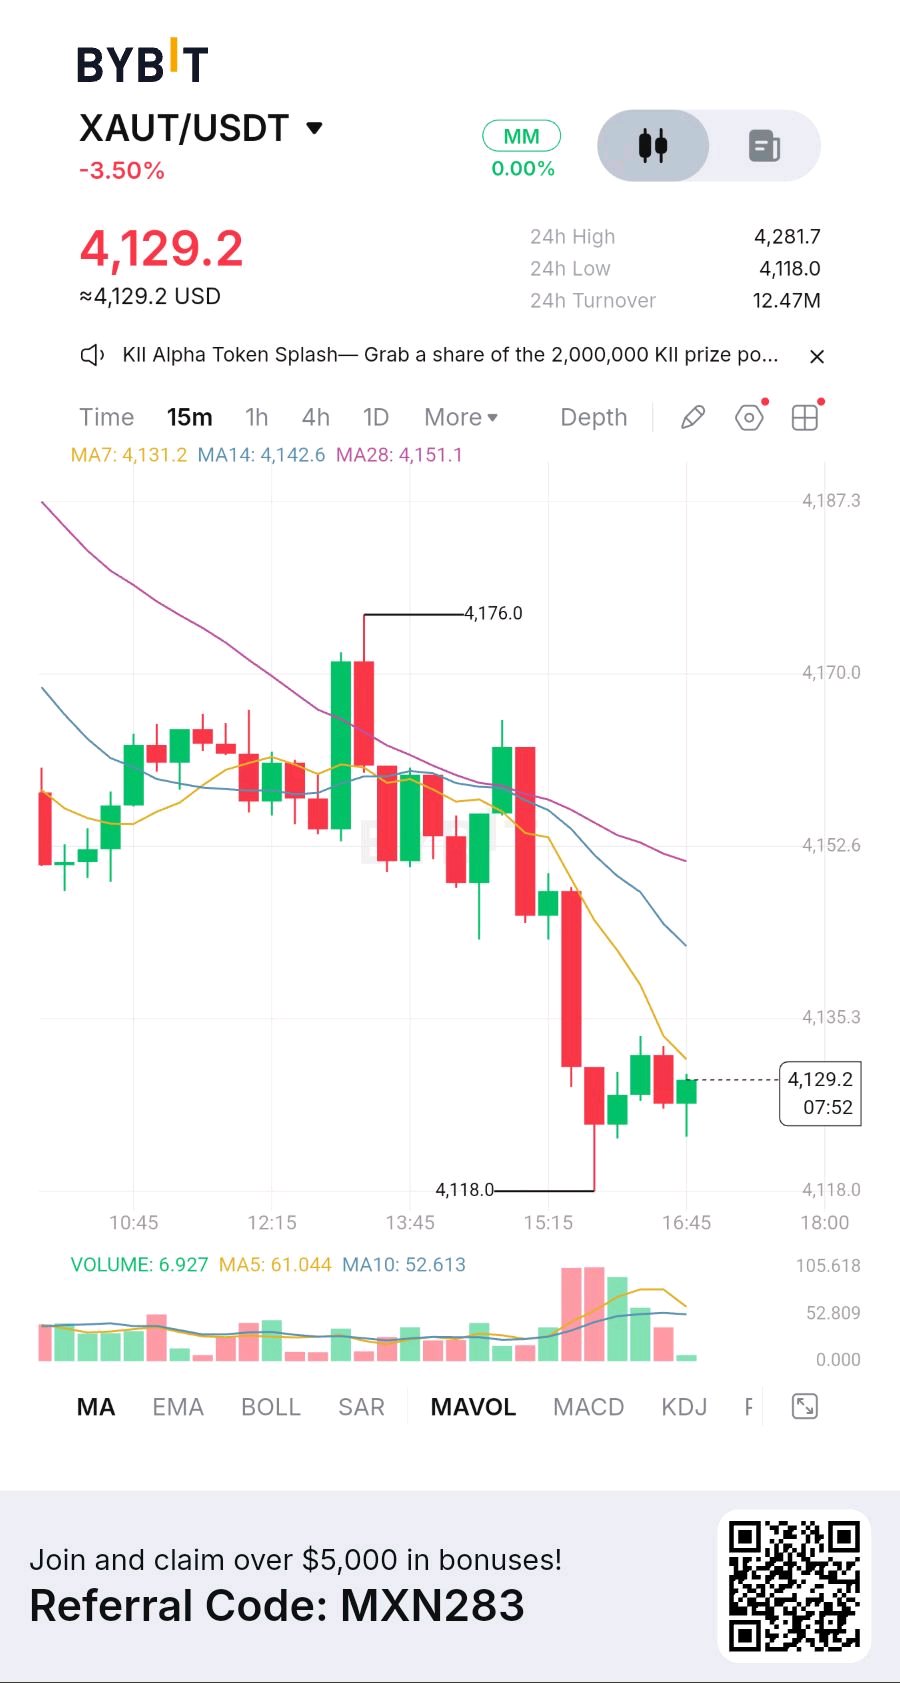
XAUT at 4,129: Hawkish Fed Breaks Gold's Floor
$XAUTUSDT on Bybit. Last traded 4,129.2, down 3.50% on the session. 24-hour range sits between 4,118.0 and 4,281.7 and that lower band is the level the market just tested. The 15-minute chart shows a clean, aggressive downtrend. Price started the session near 4,176.0, then sold off in a series of lower highs and lower lows that took the contract straight through every short-term moving average. The MAs tell the story: MA7 at 4,131.2, MA14 at 4,142.6, MA28 at 4,151.1. Price is trading below all three, with the 14 and 28 stacked directly overhead as resistance. That is a bearish alignment, and the market has a clear short-term bias to the downside. The 4,176.0 high is the immediate ceiling. A clean 15-minute close above it would be required to invalidate the downtrend, and given how violently price rejected that zone, it looks like heavy supply. Volume is the key signal: the current bar shows 6.927, while MA5 sits at 61.044 and MA10 at 52.613. The selloff had real participation, but the current bounce is on thin flow, which means sellers are resting rather than exhausted. On the downside, the 4,118.0 session low is the structural floor. Funding is neutral at 0.00%. XAUT is Tether Gold, where each token represents one troy ounce of physical gold held in Swiss vaults. It tracks spot gold, not crypto sentiment, so the macro picture drives everything here. The dominant force is the Fed. The central bank hiked rates 25 basis points in September and markets are pricing another increase before year-end, which raises the opportunity cost of holding a non-yielding asset like gold. The dollar has pushed to two-month highs, and 10-year Treasury yields have climbed, both of which are direct headwinds for the metal. The second pressure point is positioning. Gold has had a strong run this year, and some of that speculative length is being flushed as real yields rise. The selloff is being driven by macro, not by anything specific to the token itself. The counterweight is structural. Central bank buying remains robust, with the World Gold Council reporting strong sovereign purchases through the year, and that demand does not vanish on a hawkish Fed week. That provides a floor under the metal even as speculative flows retreat. The near-term setup is bearish while price holds below the 4,142.6 MA14. A clean break below 4,118.0 would put the 4,100 area in play, while a reclaim of 4,151.1 with volume would put the token back to neutral. The honest read is that this is a macro-driven pullback in a structurally supported asset not a broken thesis, but not a clean entry either. Where are you watching for the next entry holding above 4,118 or waiting for a retest of the 4,151 mean? Drop your level in the comments. #ByXIMPACT
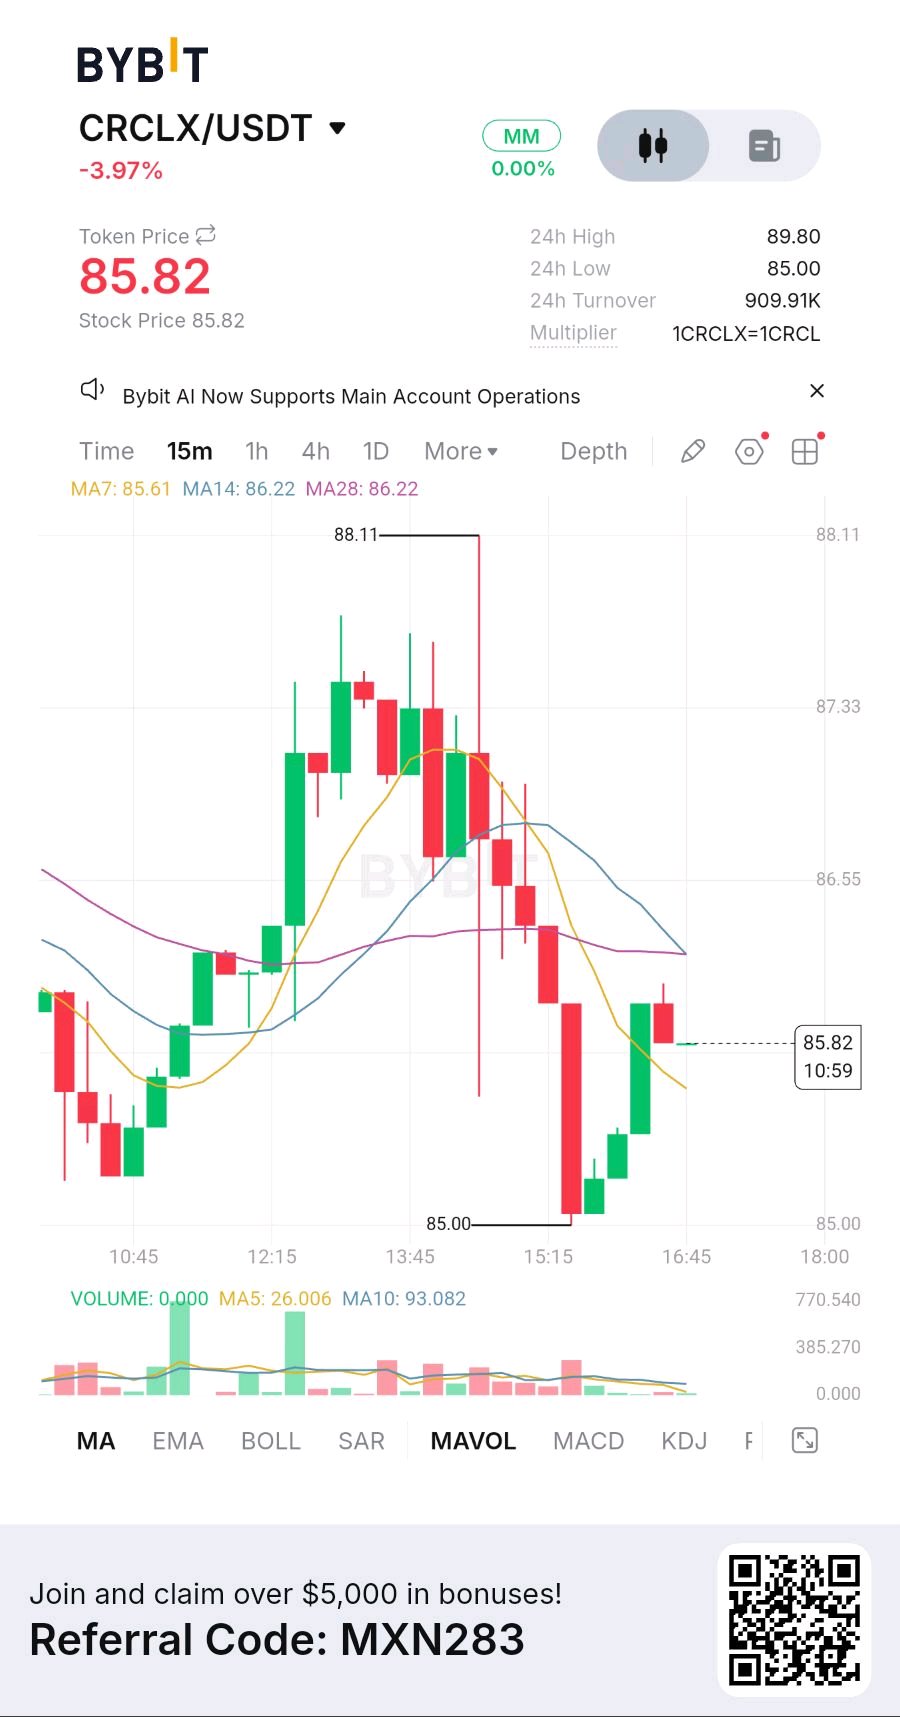
CRCLX at 85.82: Leadership Shakeup Meets Support T
$CRCLXUSDT on Bybit. Last traded 85.82, down 3.97% on the session. 24-hour range sits between 85.00 and 89.80 and that lower band is the level the market is currently testing. The 15-minute chart shows a sharp rejection from the highs. Price spiked to 88.11, then sold off in a series of red candles that dragged the contract straight through every short-term moving average to a low of 85.00. The moving averages tell the story: MA7 at 85.61, MA14 at 86.22, MA28 at 86.22. Price is trading below all three, with the 14 and 28 stacked directly above as overhead resistance. That is a bearish alignment, and the market has a clear short-term bias to the downside. The 88.11 high is the immediate ceiling. A clean 15-minute close above that level would be required to invalidate the downtrend, and given how violently price rejected that zone, it looks like heavy supply. On the downside, the 85.00 session low is the structural floor. Volume is the key signal: the current bar shows 0.000, while MA5 sits at 26.006 and MA10 at 93.082. The selloff had real participation, but the current drift is on thin flow, which means sellers are resting rather than exhausted. Funding is neutral at 0.00%, so this is not a crowded-short unwind, just a directional move that has not yet found a floor. CRCLX is a tokenized version of Circle Internet Group's stock, issued through the xStocks platform backed by Backed Finance. Each token is backed 1:1 by Circle equity, with minting and redemption verified through real-time auditing, and it trades as a synthetic equity instrument tracking the company behind USDC . The fundamental backdrop is genuinely strong. On September 22, Binance announced a $100 million strategic investment in Circle, buying 1,237,011 Class A shares, alongside a new five-year agreement to expand USDC access across emerging markets . Binance agreed not to transfer the shares for up to two years, a lockup that signals long-duration conviction rather than a quick flip . Operationally, USDC ended Q2 with $73.3 billion in circulation, up 19% year over year, while quarterly on-chain transaction volume hit $14.8 trillion, up 151% . The Circle Payments Network reached $14.7 billion in annualized volume, up 76% sequentially, with 175 financial institutions enrolled . But there is a genuine overhang the market is pricing in. On September 25, Circle announced that CFO Jeremy Fox-Geen is stepping down after more than five years, with co-founder P. Sean Neville also resigning from the board . The stock fell 4.30% to close at $89.00 on the news . Both departures were characterized as amicable, and Fox-Geen will remain through December 2026, but the timing — just days after the Binance deal — introduces short-term governance uncertainty . The equity closed at $89.00 on September 25, and the token now trades at 85.82, a meaningful discount that reflects the token market pricing in more downside than the equity market is . The honest read is that this is a post-news cooldown in a fundamentally strong asset, clouded by an unexpected executive transition. The near-term setup is bearish while price holds below the 86.22 moving average cluster. A break below 85.00 would put the 84 area in play, while a reclaim of 86.22 with volume would put the token back to neutral. The management shakeup is a genuine sentiment hit, but the Binance partnership and the USDC growth numbers are not going away. Where are you watching for the next entry holding above 85 or waiting for a retest of the 86.22 mean? Drop your level in the comments. #ByXIMPACT
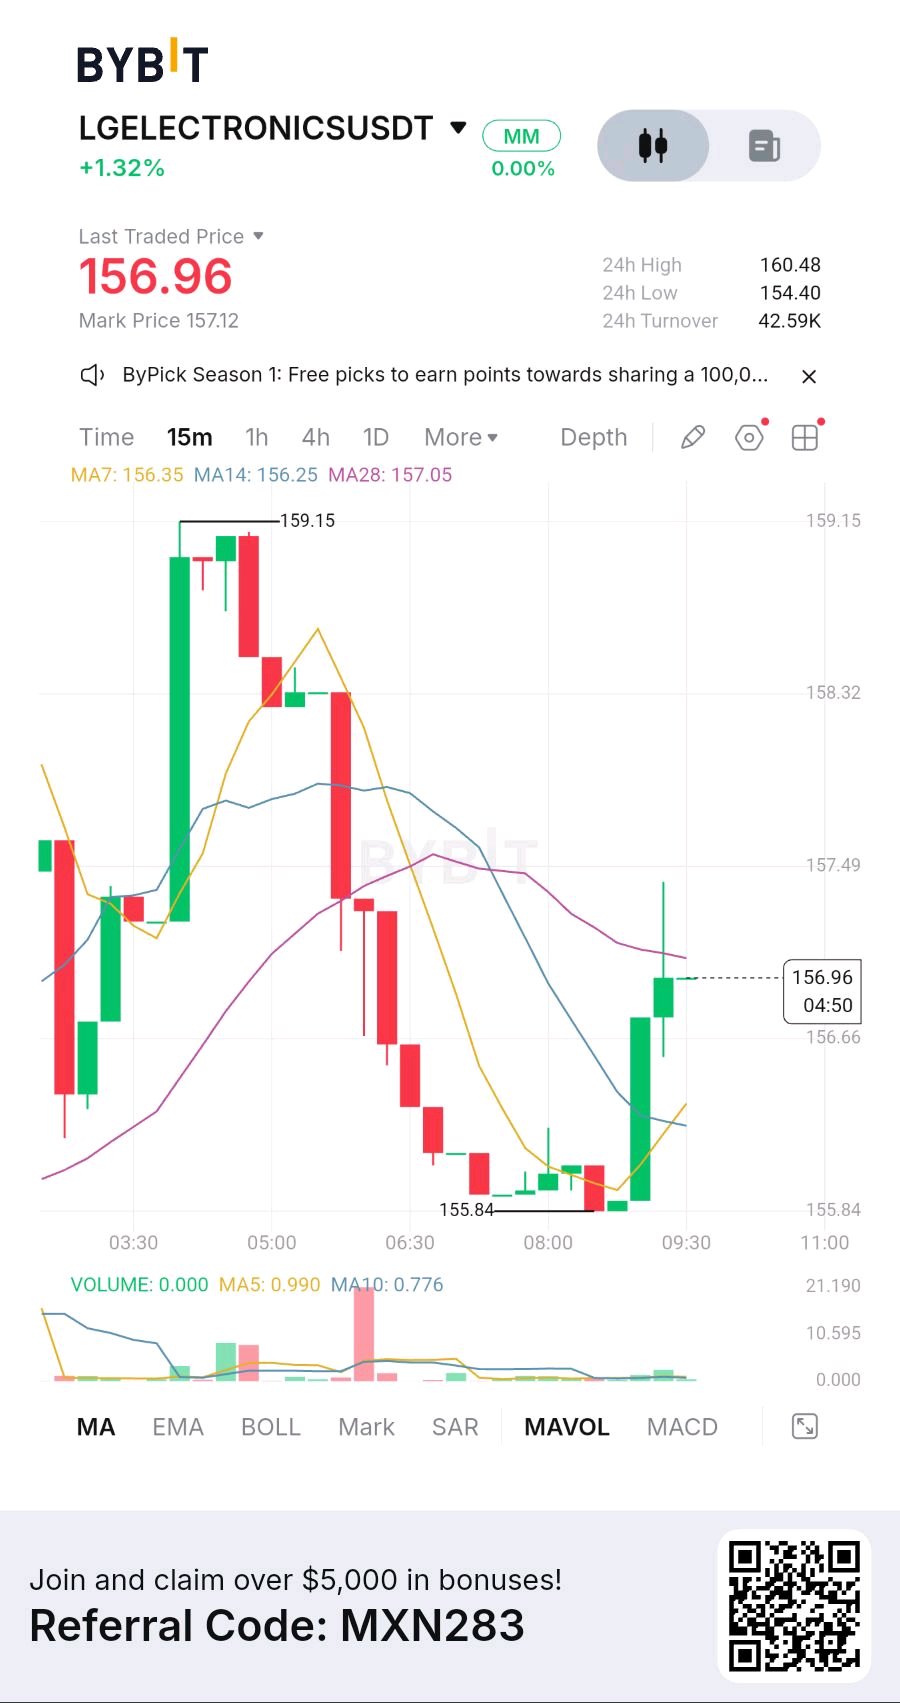
LGELECTRONICS at 156.96: Nvidia's Partner Bump Fad
LGELECTRONICSUSDT on Bybit. Last traded 156.96, up 1.32% on the session. 24-hour range sits between 154.40 and 160.48 and that upper band is the ghost of the spike that just faded. The 15-minute chart shows a vertical expansion followed by a sharp retreat. Price spiked to 159.15 early, then sold off in a series of red candles that dragged the contract back to 155.84 before bouncing to the current 156.96. The moving averages tell the story: MA7 at 156.35, MA14 at 156.25, MA28 at 157.05. Price is trading above the short-term averages but below the 28, which sits overhead as the structural ceiling. That is a mixed alignment the bounce has reclaimed the short-term, but the medium-term is still pressing down. The 159.15 high is the immediate ceiling. A clean 15-minute close above that level, with volume expanding, would open the door to continuation. On the downside, the 155.84 session low is the structural floor, with the MA28 at 157.05 as the first resistance to reclaim. Funding is neutral at 0.00%. Volume confirms the apathy: the current bar shows 0.000, while MA5 sits at 0.990 and MA10 at 0.776. Participation has dried up completely, and the impulse leg that drove the move to 159.15 has fully faded. Now, the chart alone does not explain why this happened. LGELECTRONICSUSDT is a Bybit USDT perpetual contract tracking LG Electronics stock, not a native crypto token. The underlying equity is what moved, and the catalyst was real. On September 27, LG Electronics announced it had been formally registered as a partner in the Nvidia Partner Network (NPN) under the power and cooling category . NPN is Nvidia's official program for companies building on its AI computing platform . The registration gives LG a direct channel to propose its high-efficiency cooling solutions chillers and coolant distribution units (CDUs) to global customers building Nvidia-based AI data centers . LG is the first Korean company to meet Nvidia's specification requirements for 600kW and 1MW CDUs, and its 2.5MW CDU received AI factory spec approval and the "DSX Ready CDU" certification . The company entered the data center cooling market in 2011 and has secured about 600 billion won in orders in the first half of 2026, with cooling solutions expected to account for roughly 20% of its Eco Solution division's revenue starting next year . Securities analysts also flag an expanding Microsoft partnership covering AI data centers, physical AI, and AI transformation . The equity reaction was immediate. LG Electronics closed up 2.63% at 214,500 won on September 28, after rising as much as 5.26% intraday . Affiliates followed: LG Innotek jumped 8.04% and LG Corp rose 1.88% . The token is now trading at 156.96, a discount to the equity's Korean close of 214,500 won a gap that reflects the token's thin liquidity and the lack of arbitrage between the contract and the underlying stock. The honest read is that this is a post-news cooldown in a fundamentally strengthening asset. The Nvidia partner designation is real and the cooling business has genuine revenue traction. But the token has already priced in the headline, and the fading volume suggests the market is digesting, not accumulating. Setup is neutral while price holds above the 156.25 MA14. A reclaim of 157.05 with volume puts 159.15 back in play, while a break below 155.84 would open the 154.40 session low. Where are you watching for the next entry holding above 156 or waiting for a retest of the 155.84 low? Drop your level in the comments. #ByXIMPACT
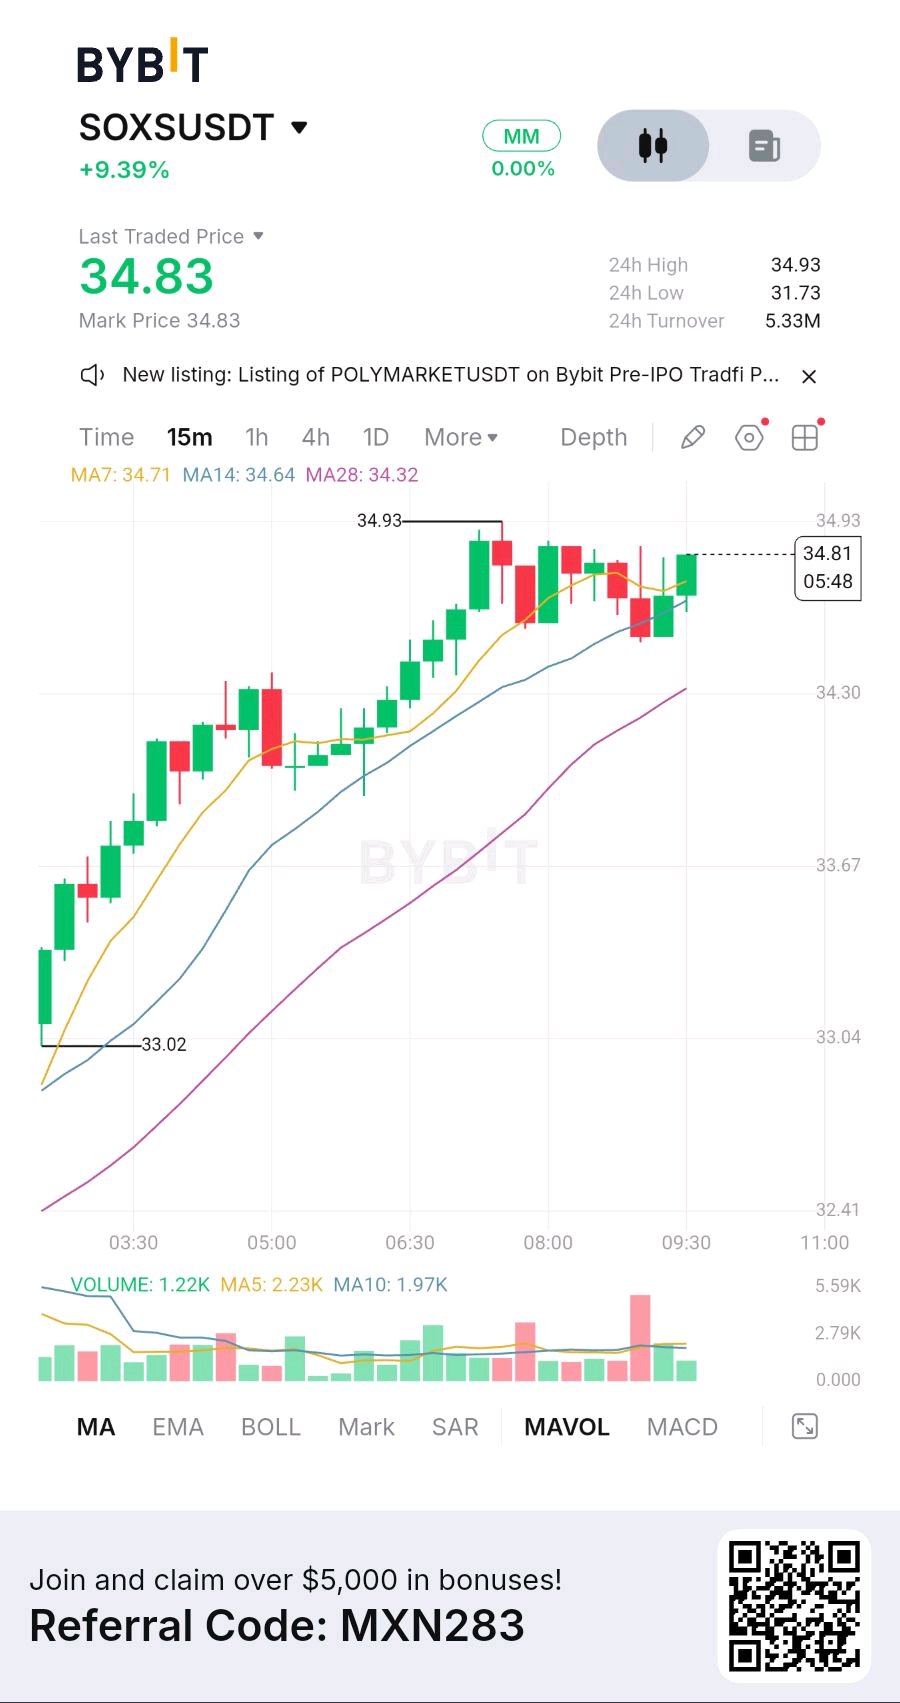
SOXS at 34.83: Bear ETF Rips 9% Against a Fragile
SOXS/USDT on Bybit. Last traded 34.83, up 9.39% on the session. 24-hour range sits between 31.73 and 34.93, and price is pressing right up against that upper band after a clean vertical expansion. The 15-minute chart shows a textbook trend day. Price printed a low at 33.02, then climbed in a series of higher lows and higher highs, clearing MA7 at 34.71, MA14 at 34.64, and MA28 at 34.32 in perfect bullish order. The moving averages are stacked and fanning, which tells you this is a trend, not a bounce. Volume confirms the participation: current bar shows 1.22K, MA5 at 2.23K, and MA10 at 1.97K. The impulse leg had real flow behind it. On the downside, the first dynamic support is the MA7 at 34.71, then the MA14 at 34.64. A 15-minute close below the 34.32 MA28 would signal the trend has exhausted. Funding is neutral at 0.00%, so this is not a crowded-short squeeze — it is genuine directional selling pressure in the underlying. Now, context matters enormously here. SOXS is the Direxion Daily Semiconductor Bear 3X ETF . It is an inverse leveraged instrument designed to move three times the daily inverse performance of the semiconductor index. When it rips 9%, it means the underlying semiconductor complex is getting hit hard. So this chart is not a bullish signal for SOXS as an asset — it is a bearish signal for the entire chip sector. And that signals something specific: the Nasdaq just posted a record close, but underneath the surface, the semiconductor leadership is fracturing. The evidence for that fracture is mounting. BTIG strategist Jonathan Krinsky flagged that the Philadelphia Semiconductor Index is still down 14% from its June highs, and only three names in the index — AMD, Nvidia, and TSMC — are closer to their highs than the index itself . Ten of the 30 components are down more than 30% from their 52-week highs, with GlobalFoundries, KLA, and ON Semiconductor all off over 40% . The average SOX member is down 26% from its peak. Krinsky drew a direct parallel to 2000, noting that after the initial crack in markets, many semiconductor names went on to make new highs while the index itself did not . He explicitly warned that the extreme dispersion and rising number of stats rhyming with 2000 have him remaining cautious over the medium term . That is exactly what this SOXS chart is expressing. The underlying narrative driving the tech rally has been the massive adoption of Meta's Muse AI agent, which validated the AI capex thesis and sparked a rerating across the ecosystem . But the flow data shows institutional money is not uniformly convinced. On September 23, the iShares PHLX SOX Semiconductor ETF sold $1.72 billion in stocks, trimming all 30 of its positions with zero purchases . Intel and AMD saw the largest sales, followed by Micron, Nvidia, and Broadcom . That is not a small rotation that is a full-scale de-risking by a major semiconductor fund. The supply-side pressure is also real. HBM4 demand is squeezing DRAM availability, and Samsung and SK Hynix inventories have fallen below 10 days, with analysts warning 2027 could bring the tightest memory supply on record . DRAM revenue is projected to rise 177% in 2026 as AI demand outpaces supply . Semiconductor equipment lead times have extended to 1.5 to 2 times their normal levels, with some deposition equipment components seeing waits of up to 40 months . The honest read here is that this is a leveraged short instrument expressing a very real medium-term concern, not a temporary blip. The chart shows a clean trend with volume behind it, and the fundamental data widening dispersion, institutional selling, and supply chain bottlenecks supports the idea that the rally in chip stocks is narrower than it looks. But that cuts both ways. SOXS is a 3x daily reset instrument, which means it suffers decay in choppy markets. If the chip complex chops sideways, SOXS bleeds even if the thesis is directionally correct. The near-term setup is bullish while price holds above the 34.32 MA28, but this is a tactical instrument, not a conviction hold. Where are you watching for the next entry holding above 34.71 or waiting for a retest of the 34.32 mean? Drop your level in the comments. #ByXIMPACT $AMZNXUSDT
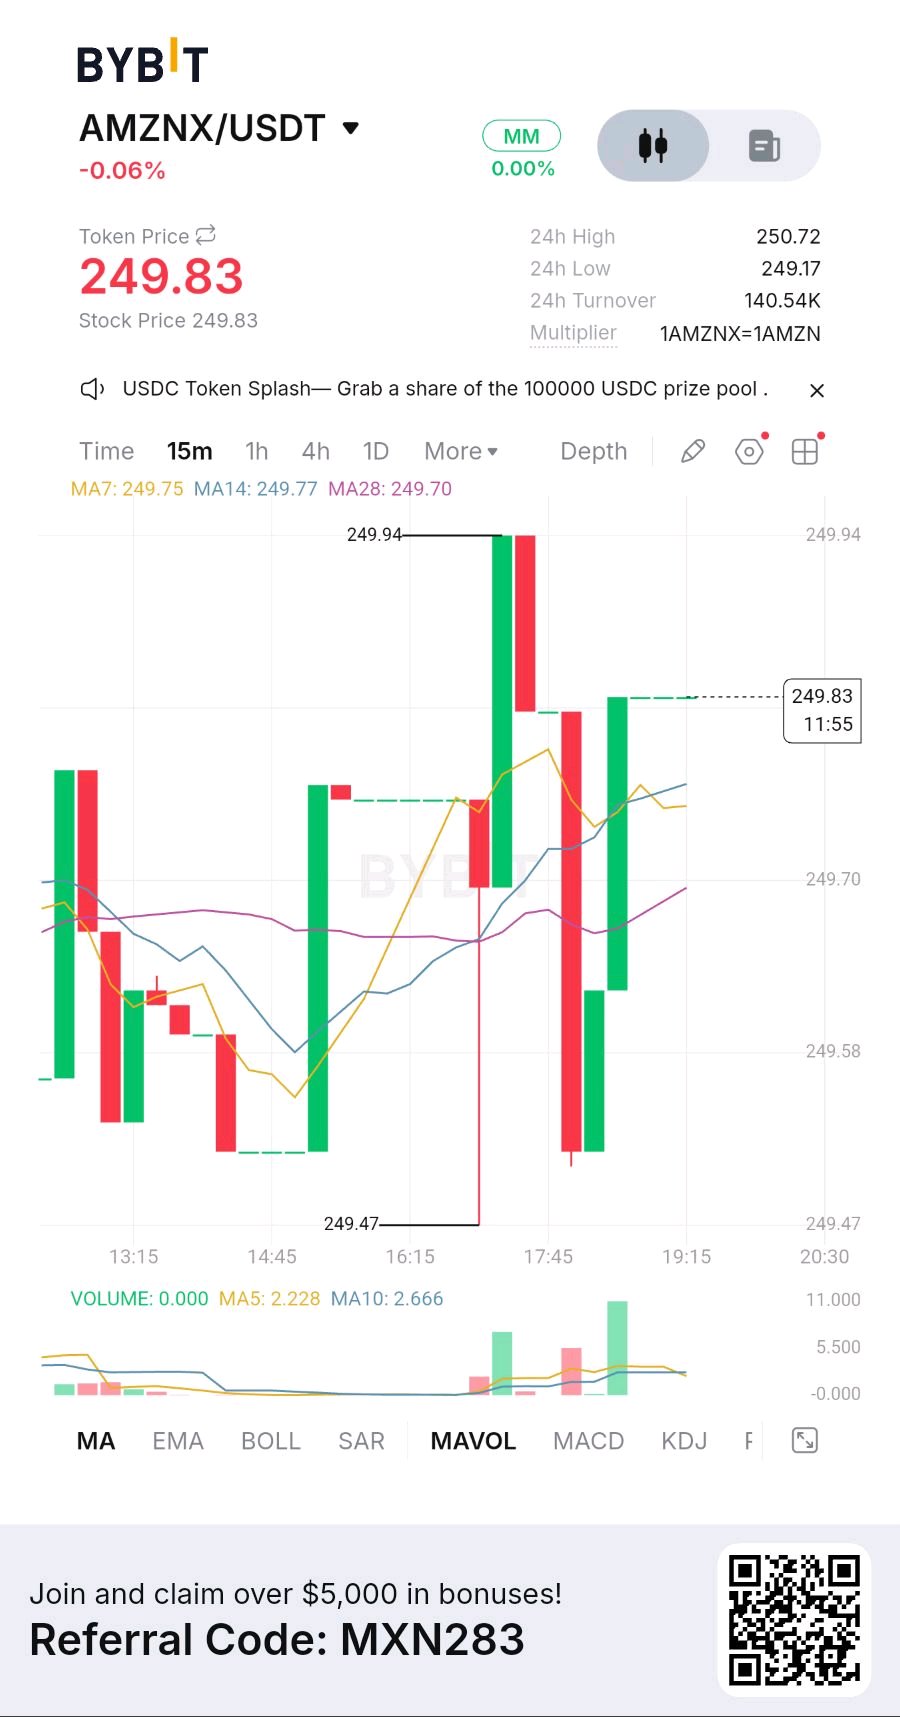
AMZNX at 249.83: Capex Boom or Cash-Flow Trap?
$AMZNXUSDT on Bybit. Token price last traded 249.83, down 0.06% on the session. 24-hour range sits between 249.17 and 250.72 a band so tight it tells you almost nothing about conviction. The 15-minute chart shows a flickering consolidation, not a trend. Price bounced between 249.47 and 249.94 across a handful of candles, and the moving averages tell the story: MA7 at 249.75, MA14 at 249.77, MA28 at 249.70. All three are compressed into a 7-cent band, with price sitting right in the middle. That is a dead zone. No buyers, no sellers, just drift. Volume confirms the apathy: the current bar shows 0.000, while MA5 and MA10 sit barely above zero. The impulse that drove the move to 249.94 has completely faded. The 249.94 high is the immediate ceiling. A clean 15-minute close above it, with volume expanding, opens the door to continuation. On the downside, the 249.47 session low is the structural floor. A loss of the moving average cluster around 249.70 would signal momentum has flipped. Funding is neutral at 0.00%, so this is not a crowded-long unwind — it is just a market waiting for something to happen. AMZNX is a tokenized tracker issued through Backed Finance, mirroring Amazon.com stock with a 1:1 backing. It is a synthetic equity instrument, not a native crypto token, which is why the underlying equity story matters more than the chart here. The fundamental backdrop is genuinely strong, and the Q2 numbers prove it. Revenue hit $200.6 billion, up 20% year over year, while operating income rose 43% to $27.5 billion . AWS grew 36.7% year over year to $42.2 billion — its fastest growth in 18 quarters — with a backlog of $496 billion . The chips business has a $25 billion annualized run rate, and AI revenue also crossed $25 billion, both growing triple digits . AWS also became the first cloud provider authorized to handle NATO RESTRICTED workloads, with 15 regions across NATO countries . The analyst consensus is Strong Buy, with 43 Strong Buy ratings out of 60 analysts and an average price target of $328.22 — implying roughly 31% upside . But here is the overhang the market is pricing in. Amazon raised 2026 capital spending guidance to roughly $220 billion, and trailing-12-month free cash flow turned negative at $7.6 billion despite operating cash flow of $161.4 billion . That is the tension: the AI infrastructure buildout is real and demand is visible into 2028, but the cash conversion is not there yet . One top-ranked investor on TipRanks framed it well Amazon remains one of the best businesses in the world, but that does not make this the most shrewd entry point, with a better entry potentially under $200 over the next 12 to 24 months . The token is showing the tension clearly. AMZNX trades at 249.83, while the underlying stock closed at $249.67 on September 25, up 0.12% . That near-perfect tracking means the token is not diverging from the equity, just reflecting it. The stock has been stuck in a $247–$259 range for weeks, and the token is mirroring that range-bound chop . The near-term setup is neutral while price holds the 249.70 cluster. A reclaim of 249.94 with volume puts 251 in play. A break below 249.47 would put the 248.56 open from September 25 back in play . The honest read is that this is a fundamentally strong asset in a valuation holding pattern, waiting for the capex cycle to either prove itself or break sentiment. Where are you watching for the next entry holding above 249.70 or waiting for the earnings catalyst on October 29? Drop your level in the comments. #ByXIMPACT #BybitAIBestReplies
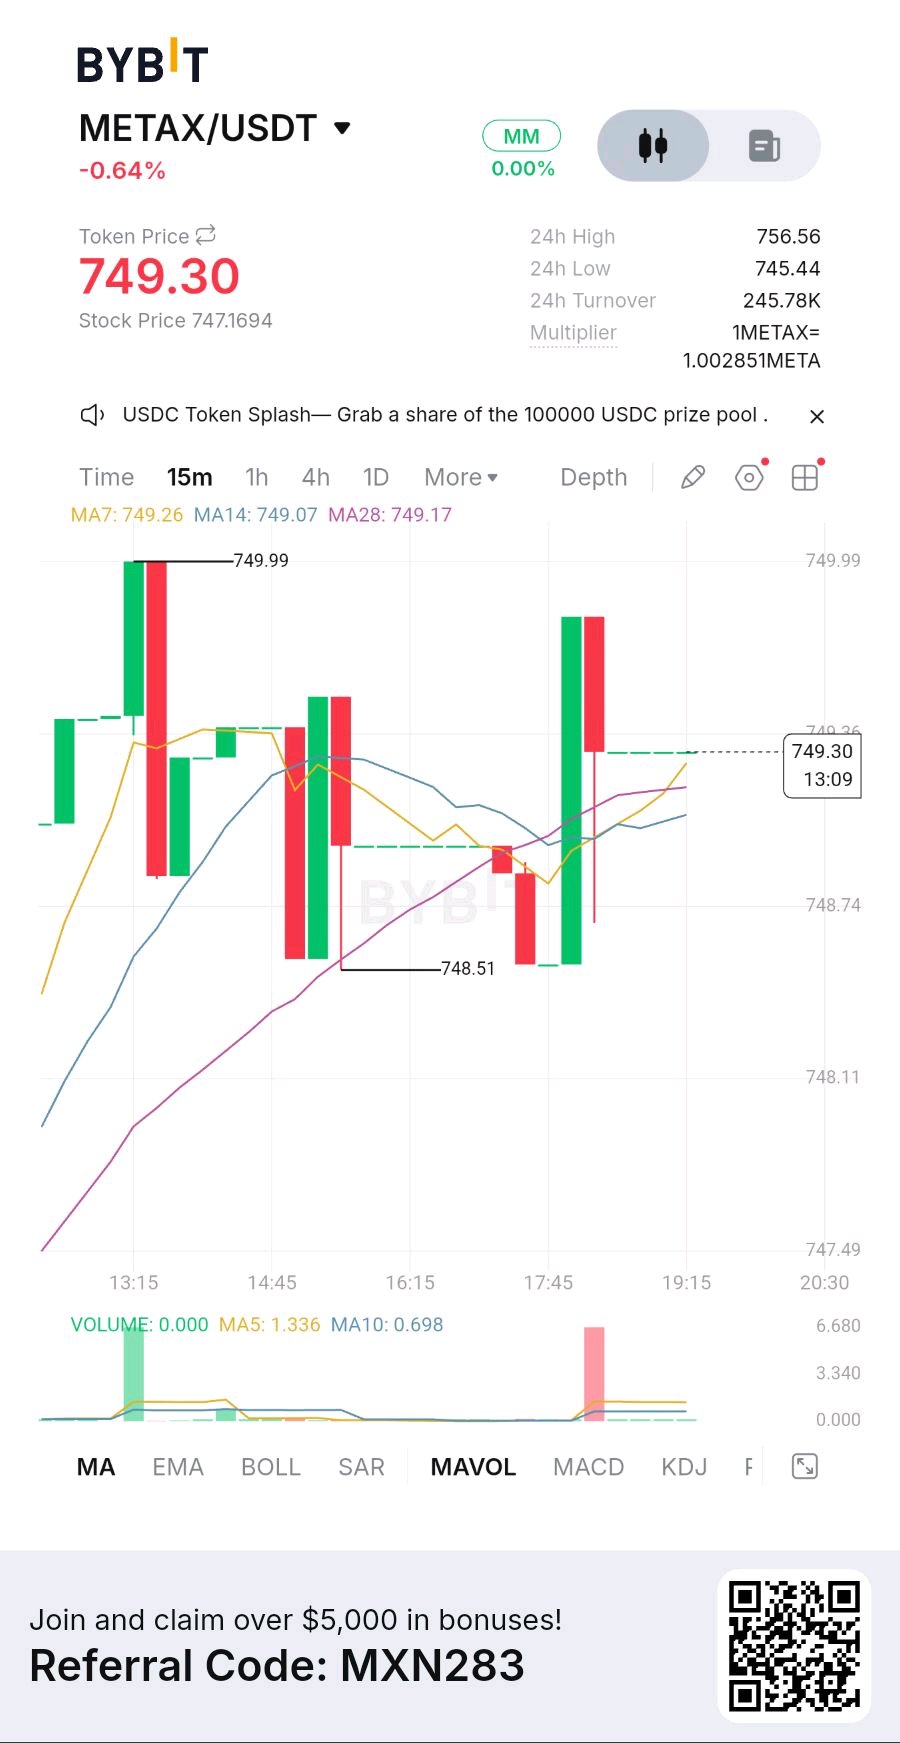
METAX at 749: Muse Rally Meets Reality Check
$METAXUSDT on Bybit. Token price last traded 749.30, down 0.64% on the session. 24-hour range sits between 745.44 and 756.56 — and that upper band is the level the market is currently testing. The 15-minute chart shows a sharp V-shaped recovery that has stalled. Price spiked to 749.99 early, dumped to 748.51, then rallied back to the current 749.30. The moving averages tell the story: MA7 at 749.26, MA14 at 749.07, MA28 at 749.17. All three are compressed into a tight 19-cent band, with price sitting right in the middle. That is a classic dead zone. No clear short-term bias, just drift. Volume confirms it: the current bar shows 0.000, while MA5 sits at 1.336 and MA10 at 0.698. Participation has dried up completely, and the impulse leg that drove the move to 749.99 has fully faded. The 749.99 high is the immediate ceiling. A clean 15-minute close above that level, with volume expanding, would open the door to continuation. On the downside, the 748.51 session low is the structural floor. A close below the MA cluster around 749.07 would signal momentum has flipped. Funding is neutral at 0.00%, so this is not a crowded-long unwind, just a directional move that has run out of buyers. The chart alone does not explain what this asset is. METAX is a tokenized version of Meta Platforms stock, issued through the xStocks platform backed by Backed Finance. Each token is backed 1:1 by Meta equity, with minting and redemption verified through real-time auditing. The multiplier shows 1 METAX equals roughly 1.002851 META. It is a synthetic equity instrument, not a native crypto token. The fundamental catalyst behind the recent move is Muse, Meta’s personal AI agent. The stock has surged 36% in September following the launch, on pace for its best month since July 2013 . Muse debuted on September 8 in the US and September 18 in Canada, and was downloaded 1.8 million times on iPhones in North America within two weeks — compared to 1.3 million downloads for ChatGPT during its first two weeks in May 2023 . JPMorgan raised its price target to $920, calling Muse potentially “the most widely used consumer AI application since ChatGPT” . KeyBanc raised its target to $900 from $780, citing stronger revenue and EPS forecasts . The monetization strategy is taking shape. At Meta Connect on September 23, CEO Mark Zuckerberg outlined plans to eventually take a small fee from transactions completed through the agent. Muse already supports PayPal and has integrations with Walmart, Best Buy, Gap, Sephora, Wayfair, American Eagle, Expedia, and Instacart . The fourth quarter includes the holiday shopping season, which could be the first real test of whether Muse can convert its 3.6 billion daily user base into actual transaction volume . But the bear case is real, and it is the reason the token is stalling. Capital expenditures are expected to approach $140 billion this year, nearly double 2025’s $70 billion . Q2 free cash flow shrank to $784 million, and net income fell 14% year over year even as revenue grew 28% . Amazon blocked Muse from using its site, accusing the agent of failing to identify itself and storing customers’ login details . Oppenheimer found that only 8% of Americans would trust Meta to store their passwords for other apps, compared to 30% for Google . The token is showing the tension clearly. METAX trades at 749.30, while the underlying stock closed at $751.66 on September 25, down 3.33% from the prior session’s high of $777.59 . That near-perfect tracking means the token is not diverging from the equity, just reflecting it. The pullback from the $777 area is a normal cooldown after a 36% monthly rally. The near-term setup is neutral-to-bearish while price holds below the 749.99 high. A break below 748.51 would put the 745.44 session low back in play, while a reclaim of 749.99 with volume would put the highs back in play. This is a post-rally cooldown in a fundamentally strong asset with genuine execution risk. Where are you watching for the next entry holding above 749 or waiting for a retest of the 745.44 low? Drop your level in the comments. #ByXIMPACT #BybitAIBestReplies
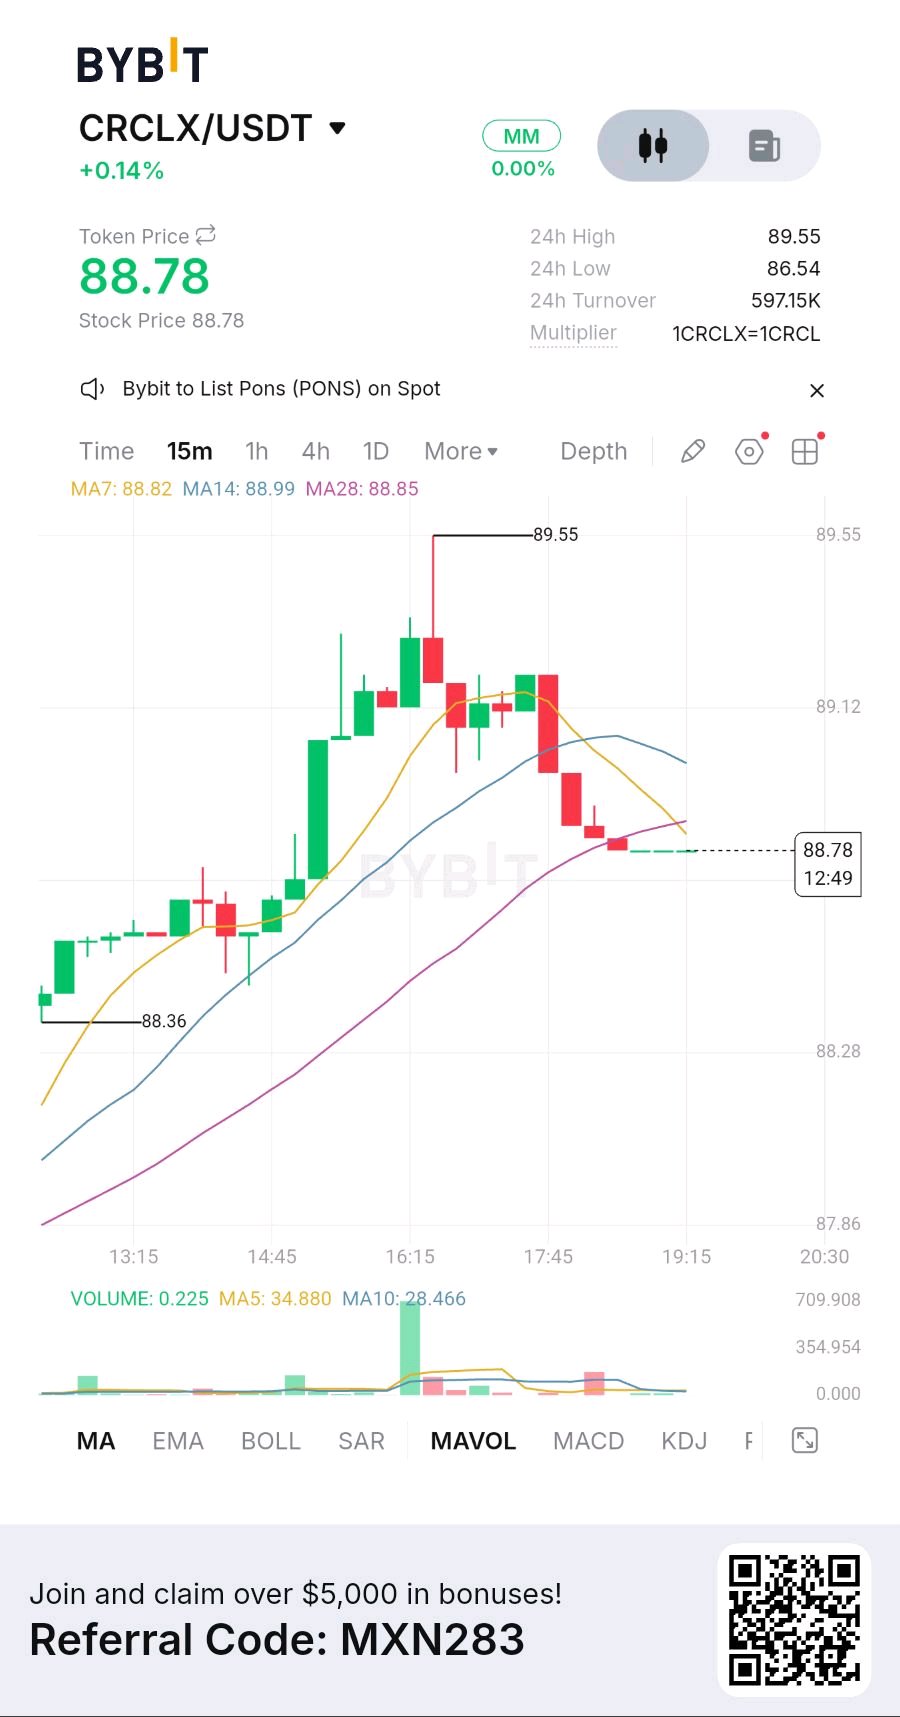
CRCLX at 88.78: CFO Exit Tests Binance glow
$CRCLXUSDT on Bybit. Last traded 88.78, up 0.14% on the session. 24-hour range sits between 86.54 and 89.55, and the token is currently sitting just above the lows of that band. The 15-minute chart shows a clear rejection from the highs. Price spiked to 89.55, then sold off in a series of red candles that dragged the contract back to 88.78, with the current candle testing the lower end of the range. The moving averages tell the story: MA7 at 88.82, MA14 at 88.99, MA28 at 88.85. All three are compressed into a tight band, and price is trading right in the middle of it. That is a classic dead zone — no clear short-term bias, just drift. Volume confirms it: the current bar shows 0.225, while MA5 sits at 34.880 and MA10 at 28.466. Participation has dried up completely, and the impulse leg that drove the move to 89.55 has fully faded. The 89.55 high is the immediate ceiling. A clean 15-minute close above that level, with volume expanding, would open the door to continuation. On the downside, the 86.54 session low is the structural floor. A close below the MA cluster around 88.82 would signal momentum has flipped. Funding is neutral at 0.00%, so this is not a crowded-long unwind, just a directional move that has run out of buyers. CRCLX is a tokenized version of Circle Internet Group's stock, issued through the xStocks platform backed by Backed Finance. Each token is backed 1:1 by Circle equity, with minting and redemption verified through real-time auditing. It is a synthetic equity instrument tracking the company behind USDC, not a native crypto token. The fundamental backdrop is genuinely strong. On September 22, Binance announced a $100 million strategic investment in Circle, buying 1,237,011 Class A shares at $80.84 each, alongside a new five-year agreement to expand USDC access across emerging markets . Binance agreed not to sell or transfer the shares for two years, a lockup that signals long-duration conviction rather than a quick flip . The deal supersedes prior agreements from November 2024 and August 2025, making Circle the primary stablecoin partner for the largest exchange by registered users . Operationally, USDC ended Q2 with $73.3 billion in circulation, up 19% year over year, while quarterly on-chain transaction volume hit $14.8 trillion, up 151% . The Circle Payments Network reached $14.7 billion in annualized volume, up 76% sequentially, with 175 financial institutions enrolled . BNY added USDC minting and redemption to its custody platform, Standard Chartered launched bank-led USDC access, and Nium connected USDC settlement to payouts across more than 190 countries . But there is a genuine overhang the market is pricing in. On September 25, Circle announced that CFO Jeremy Fox-Geen is stepping down after more than five years, with co-founder P. Sean Neville also resigning from the board . The stock fell 2.6% in Friday's extended session on the news . Both departures were characterized as amicable, but the timing — just days after the Binance deal — introduces short-term governance uncertainty. CRCLX trades at 88.78, while the underlying stock closed at $89.00 on September 25, down 4.30% . That near-perfect tracking means the token is not diverging from the equity, just reflecting it. The near-term setup is neutral-to-bearish while price holds below the MA cluster around 88.99. A break below 86.54 would put the 85 area back in play, while a reclaim of 89.55 with volume would put the highs back in play. The honest read is that this is a post-news cooldown in a fundamentally strong asset, clouded by an unexpected executive transition. Where are you watching for the next entry holding above 88 or waiting for a retest of the 86.54 low? Drop your level in the comments. #ByXIMPACT
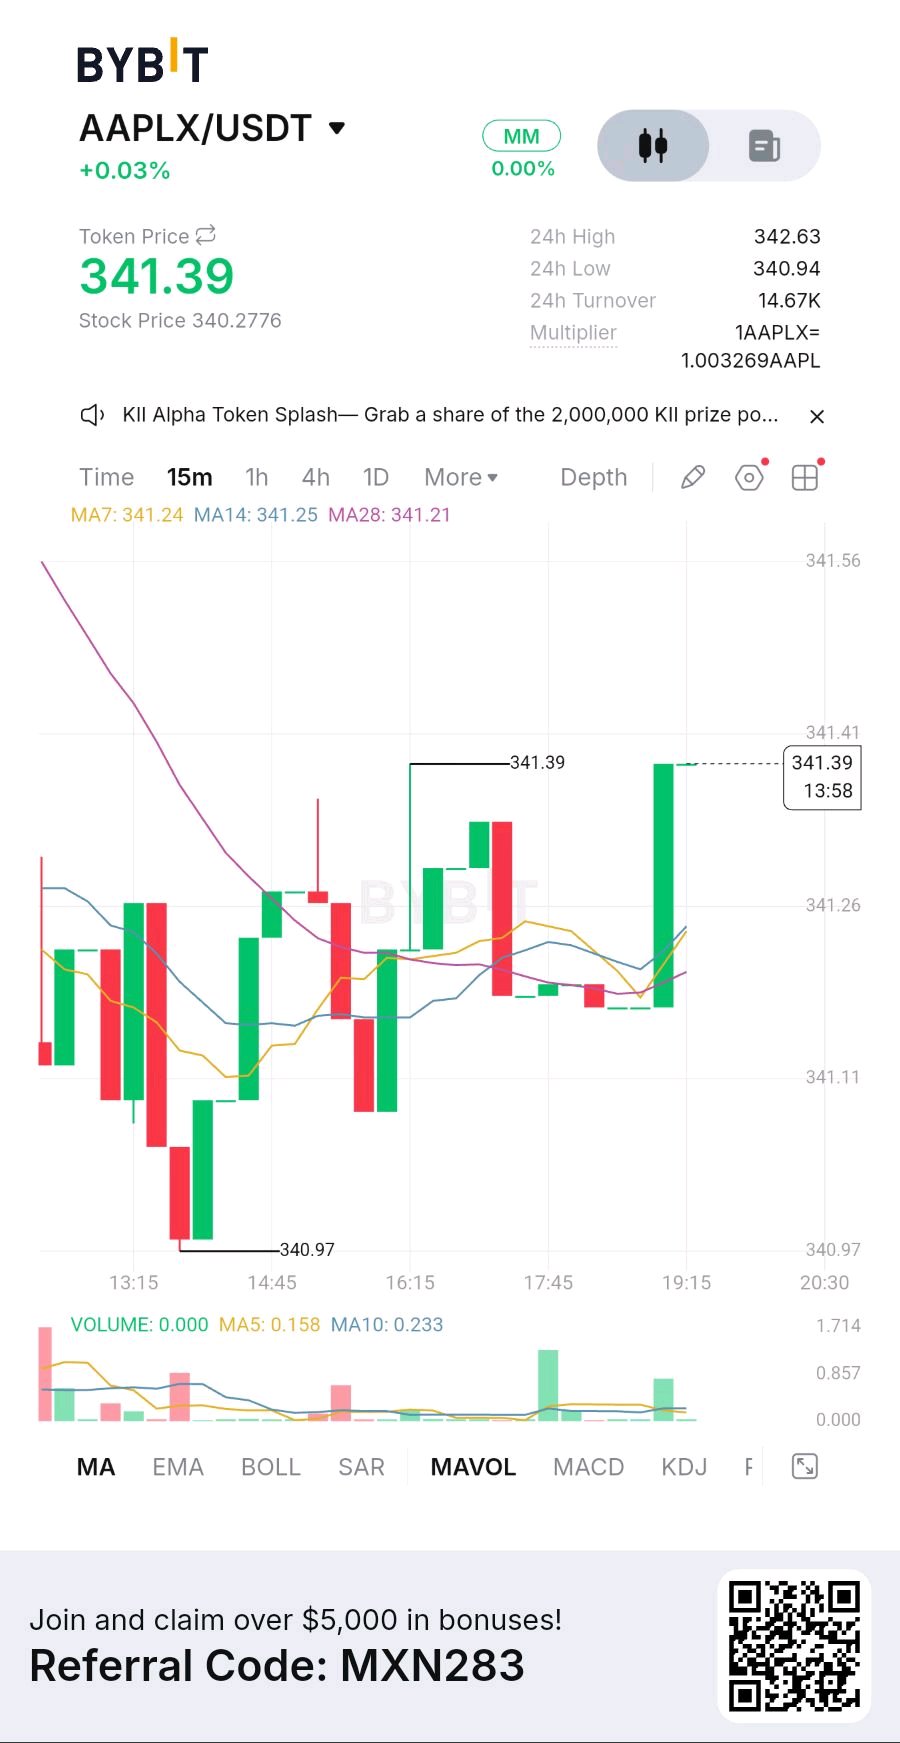
$AAPLXUSDT on Bybit. Token price last traded 341.39, up 0.03% on the session. 24-hour range sits between 340.94 and 342.63 — and the token is currently sitting mid-range, waiting for direction. The 15-minute chart shows a flat consolidation that has settled after a dip to 340.97. Price is trading right in the middle of the moving average cluster: MA7 at 341.24, MA14 at 341.25, and MA28 at 341.21. All three are compressed into a 4-cent band, which means the market has no short-term bias whatsoever. That is a classic dead zone — no buyers, no sellers, just drift. Volume confirms it: the current bar shows 0.000, while MA5 sits at 0.158 and MA10 at 0.233. Participation has dried up completely, and this is not a setup for a breakout. AAPLX is a Bybit USDT perpetual tracking Apple Inc. stock, with the multiplier showing 1 AAPLX equals roughly 1.003269 AAPL. The token trades around the clock, but the underlying equity sets the tone. The stock closed at $340.28 on September 25, and the token trades at a slight premium. The fundamental backdrop is genuinely strong. Apple became the second company in history to breach a $5 trillion market cap, a milestone it first crossed on July 28 when shares hit $342.89 . The rally has been driven by the iPhone 18 Pro cycle and the anticipation around the iPhone Duo. JPMorgan reported that lead times for the iPhone 18 Pro more than tripled in week two, rising from seven to 23 days, while the Pro Max went from 19 to 30 days . Evercore ISI's survey of nearly 4,000 consumers found that 53% of prospective buyers plan to purchase an 18 Pro or Pro Max, with 32% specifically intending to buy the Pro Max, up from 29% last year . That suggests the upgrade cycle is performing better than feared. But the bear case is real and it is the reason the token is stalling. Bernstein analyst Mark Newman flagged rising memory costs as a serious margin pressure point. He cut his fiscal Q1 EPS estimate to $2.87 from $3.00, about 2% below consensus, with iPhone gross margin now projected at 40.4%, 390 basis points below consensus . The culprit is DRAM and NAND memory, which make up roughly 90% of the estimated $168 year-over-year cost increase for the 256GB iPhone 18 Pro Max . The next catalyst is Apple's Q4 earnings on October 29, which is confirmed . The honest read is that this is a fundamentally strong asset in a post-rally cooldown. The demand data is mixed — JPMorgan sees strength, UBS flags China as the biggest vulnerability with demand still below year-ago levels . The token has priced in the $5 trillion milestone but not the margin math. Setup is neutral while price holds the 341.20 cluster. A break above 342.63 puts the highs back in play, while a loss of 340.94 would open a retest of the session low. Where are you watching for the next entry — holding above 341.20 or waiting for the earnings catalyst on October 29? Drop your level in the comments. #ByXIMPACT
AAPLX at 340.43: Can Apple Hold $5T?
$AAPLXUSDT on Bybit. Last traded 340.43, up 0.51% on the session. 24-hour range sits between 335.90 and 340.83, and the token is pressing right up against the top of that band. The 15-minute chart shows a steady recovery that has stalled. Price sold off to a low at 335.90, then climbed in a series of higher lows back toward the highs, clearing the moving averages on the way up. The moving averages tell the story: MA7 at 340.58, MA14 at 339.70, MA28 at 338.44. Price is trading just below the MA7 while holding above the 14 and 28, which are stacked in bullish order. That is a healthy structure, but the current candle is pressing against the 340.83 high without a clean breakout. This is a market testing resistance, not clearing it. The 340.83 high is the immediate ceiling. A 15-minute close above it, with volume expanding, opens the door to continuation. Volume is the key signal here: the current bar shows 0.000, while MA5 sits at 1.416 and MA10 at 4.877. The impulse leg had real participation, but the current consolidation is happening on thin flow. On the downside, the first zone to watch is the 339.70 MA14, then the 338.44 MA28. A close below the 28 average would signal momentum has flipped. Funding is neutral at 0.00%. AAPLX is not a token. It is a Bybit USDT perpetual tracking Apple Inc. stock. The multiplier shows 1 AAPLX equals roughly 1.003269 AAPL, and the contract trades around the clock while the underlying equity sets the tone. That link matters, because Apple just became the latest company to briefly cross a $5 trillion market cap. The headline event is the iPhone 18 cycle. Apple unveiled the iPhone 18 Pro and Pro Max on September 9, opened pre-orders on September 12, and began selling in more than 65 countries on September 18 . The early demand signals are genuinely mixed, and that is why the market is pausing. JPMorgan’s tracking put average iPhone 18 Pro lead times at 23 days in week two, up from seven days in week one, with Pro Max waits climbing from 19 to 30 days — increases that exceeded last year’s comparable jumps . But UBS found that absolute waits across 30-plus markets remain roughly flat to slightly shorter year over year, with China still the weakest region . Morgan Stanley noted that production of the 18 Pro line is up roughly 18% year over year, which means flattish wait times on more supply could actually signal healthier underlying demand . The second catalyst is the iPhone Duo, Apple’s first foldable, arriving in October at a base price near $2,000 . Analysts expect it to account for 5% to 10% of iPhone sales in fiscal 2027, and its launch is one reason the 18 Pro demand picture is foggy — premium buyers may be holding off . The bear case is real. Memory costs are squeezing margins, and Apple’s $100 price increase on the new models has not fully offset the pressure . Analysts expect EPS growth to slow to roughly 9% in fiscal 2027, with the tariff refund benefit from 2026 not repeating . GuruFocus rates Apple about 18.5% overvalued on its GF Value metric, with insiders selling $173.1 million over the past year and no insider purchases . The stock closed at $335.92 on September 24, and the token trades at 340.43 — a premium that reflects the market pricing in the $5 trillion milestone and the Duo launch, but not yet the margin math . The honest read is that this is a fundamentally strong asset riding a real product cycle, but one where the demand evidence is genuinely split and the valuation is stretched. The near-term setup is neutral-to-bullish while price holds above the 339.70 MA14. A reclaim of 340.83 with volume puts 341.50 in play, while a loss of 338.44 would put the entire recovery leg in question. Where are you watching for the next entry — holding above 340 or waiting for a retest of the 338.44 mean? Drop your level in the comments. #ByXIMPACT