Bashirnuhuusman
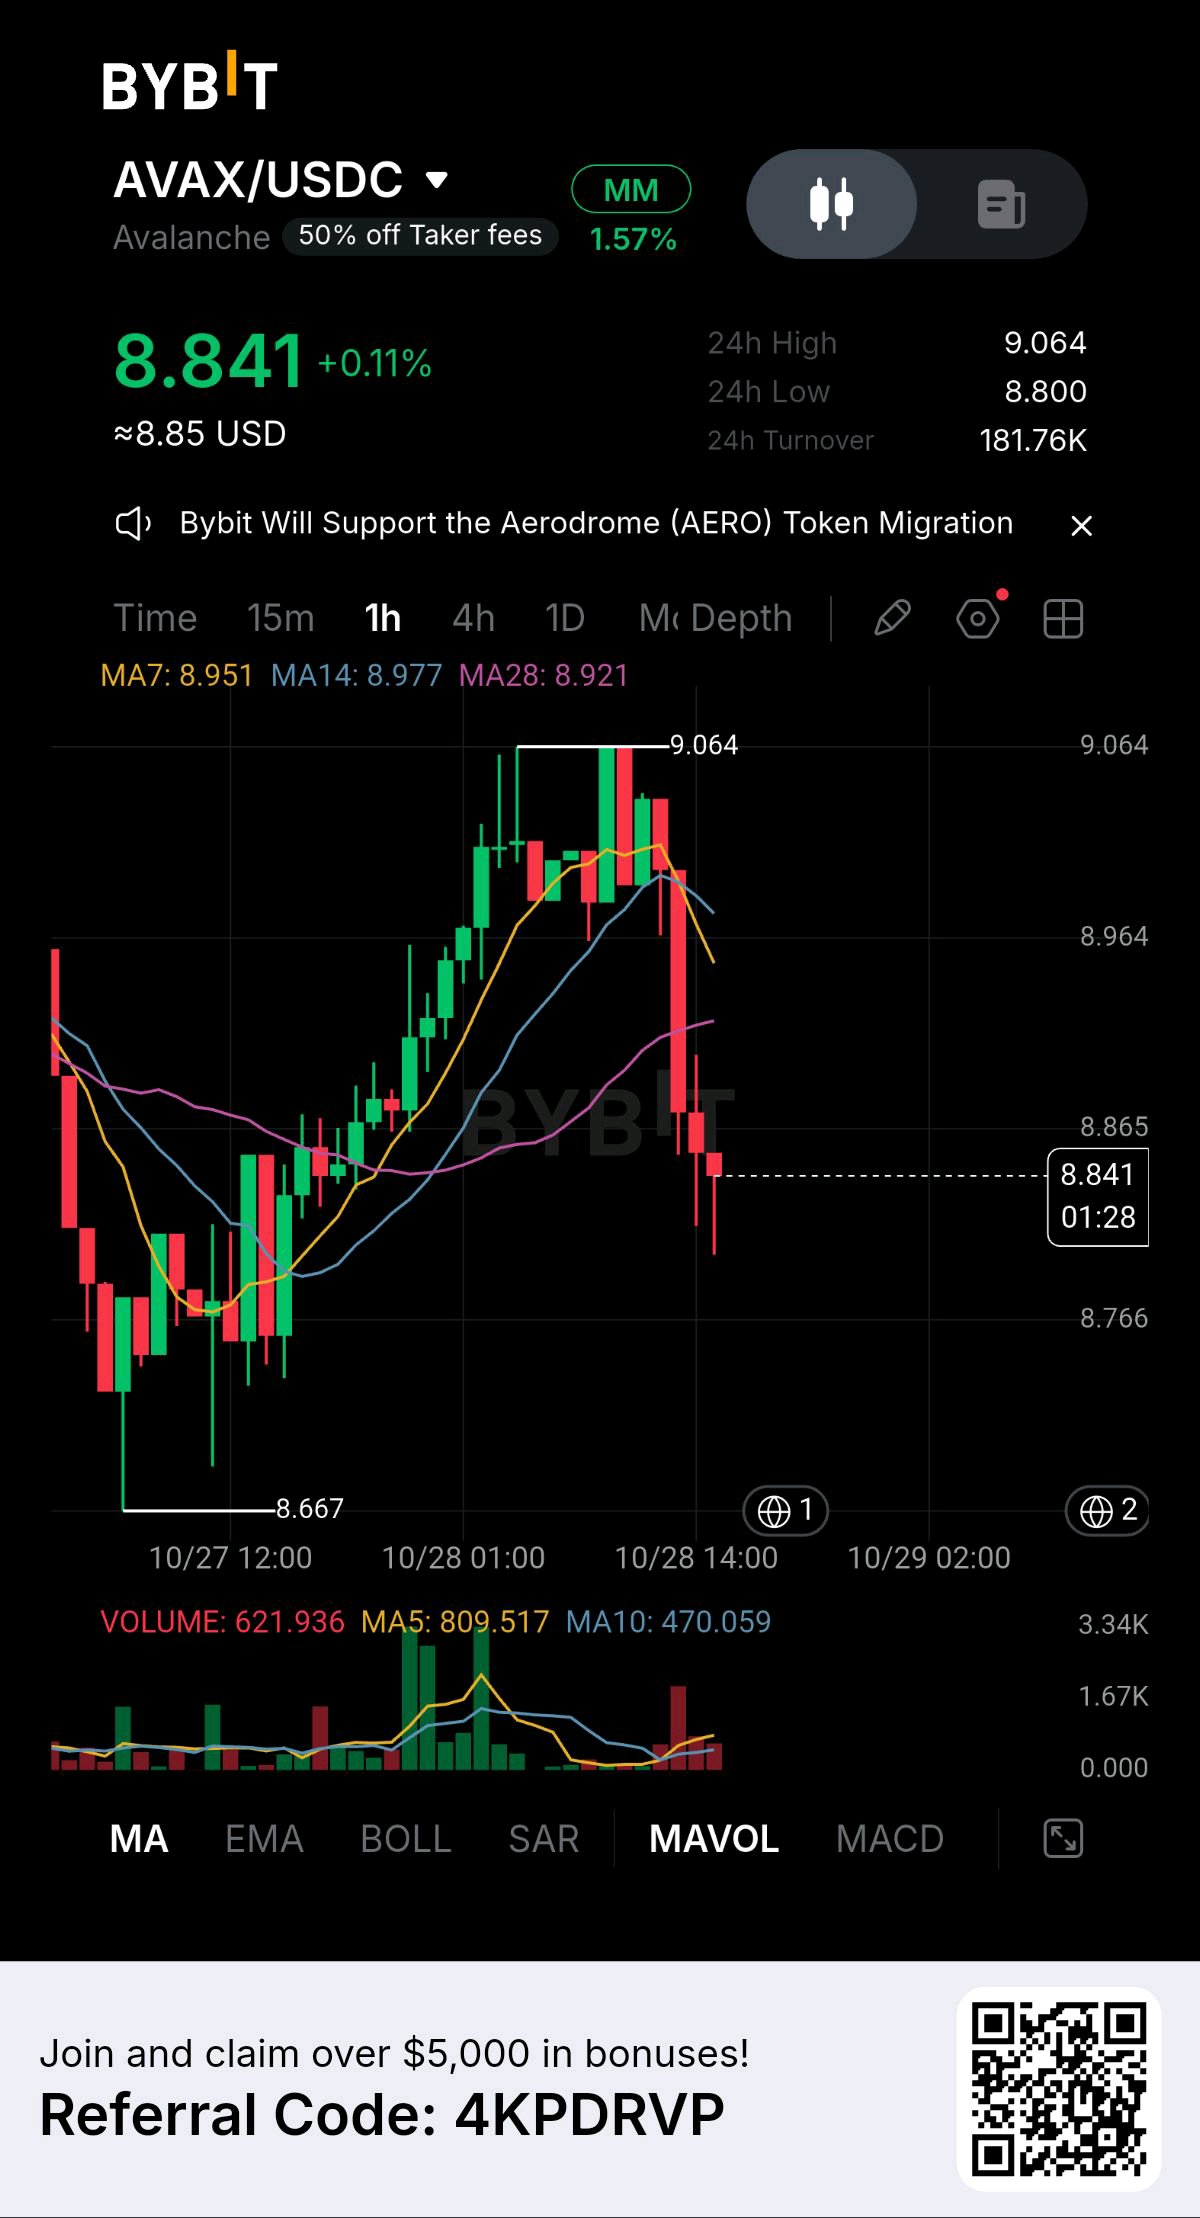
I’m closely watching $AVAXUSDT on the 1-hour chart because the latest price action shows a clear shift in short-term momentum. After recovering strongly from the $8.667 low and pushing toward the $9.064 high, the price has faced heavy selling pressure. Now, AVAX is trading around $8.841, and the important question is whether buyers can defend the current support area or sellers will continue pushing the price lower. CURRENT MARKET STRUCTURE AVAX is currently trading around $8.841, up approximately 0.11%, but the recent candles tell a more cautious story. Price climbed from the $8.667 low toward $9.064 before experiencing a sharp rejection. The latest bearish candles indicate that sellers have entered the market with increased pressure. The moving averages also support this cautious outlook. MA7 is around $8.951, MA14 is approximately $8.977, and MA28 is near $8.921. Price is now trading below all three moving averages, showing that short-term momentum has weakened. For me, this is an important development. The previous recovery showed that buyers could push the price higher, but the latest rejection suggests they have not yet established enough strength to maintain control. I want to see price reclaim these moving averages before considering the recovery strong again. KEY SUPPORT ZONE The first area I’m watching is $8.800–$8.765. Price is approaching this region after the recent sell-off, making it an important area for buyers to defend. If AVAX holds this zone and forms a convincing bullish reaction, a short-term recovery could develop. However, I would not consider a single green candle sufficient confirmation. I want to see stronger buying pressure, a higher low, and a move back above nearby resistance. If sellers break below $8.765 with strong volume, the next important downside reference is the previous swing low around $8.667. A move toward that level would indicate that bearish pressure is continuing. KEY RESISTANCE ZONES The first resistance area is $8.921–$8.977, where the moving averages are currently positioned. This is the first zone bulls need to reclaim to improve the short-term structure. Above that, I’m watching $9.000–$9.064. A strong breakout above $9.064, supported by increasing volume and a successful retest, would provide stronger evidence that buyers are regaining control. Until price reclaims these levels, I remain cautious about assuming that the previous bullish move will immediately continue. VOLUME AND MOMENTUM Volume is another important factor in this setup. The recent decline has been accompanied by noticeable selling activity, suggesting that the rejection should not be ignored. However, volume alone cannot confirm the next direction. I want to observe whether selling volume begins to decrease near support or whether bearish volume continues to expand during a breakdown. A strong bullish candle with increasing volume would provide better evidence of a potential recovery. BULLISH SCENARIO If AVAX holds $8.800–$8.765, establishes a higher low, and reclaims the $8.921–$8.977 moving-average zone, I will start watching for a recovery toward $9.000 and the previous high at $9.064. A confirmed breakout above $9.064 could open the door to further upside, but price confirmation and volume will be important. BEARISH SCENARIO If AVAX fails to defend $8.800–$8.765 and breaks below $8.765 with strong selling pressure, I will watch the $8.667 swing low as the next major downside reference. A breakdown below that low could weaken the structure further. If support holds, however, a recovery remains possible. MY FINAL THOUGHTS My current outlook is cautious to bearish in the short term because AVAX has fallen below all three moving averages following a strong rejection near $9.064. I’m not rushing to predict a reversal, and I’m not assuming that the decline must continue. I want the market to confirm its next direction through price action, volume, and the reaction around key levels. For me, the most important areas are $8.800–$8.765 for support and $8.921–$8.977 for the first resistance zone. These levels could help determine whether buyers can rebuild momentum or sellers maintain control. The key is not to chase the next candle. It is to wait for confirmation and let the market reveal its direction. This is my technical interpretation of the chart, not a guaranteed prediction or financial advice. #ByXIMPACT
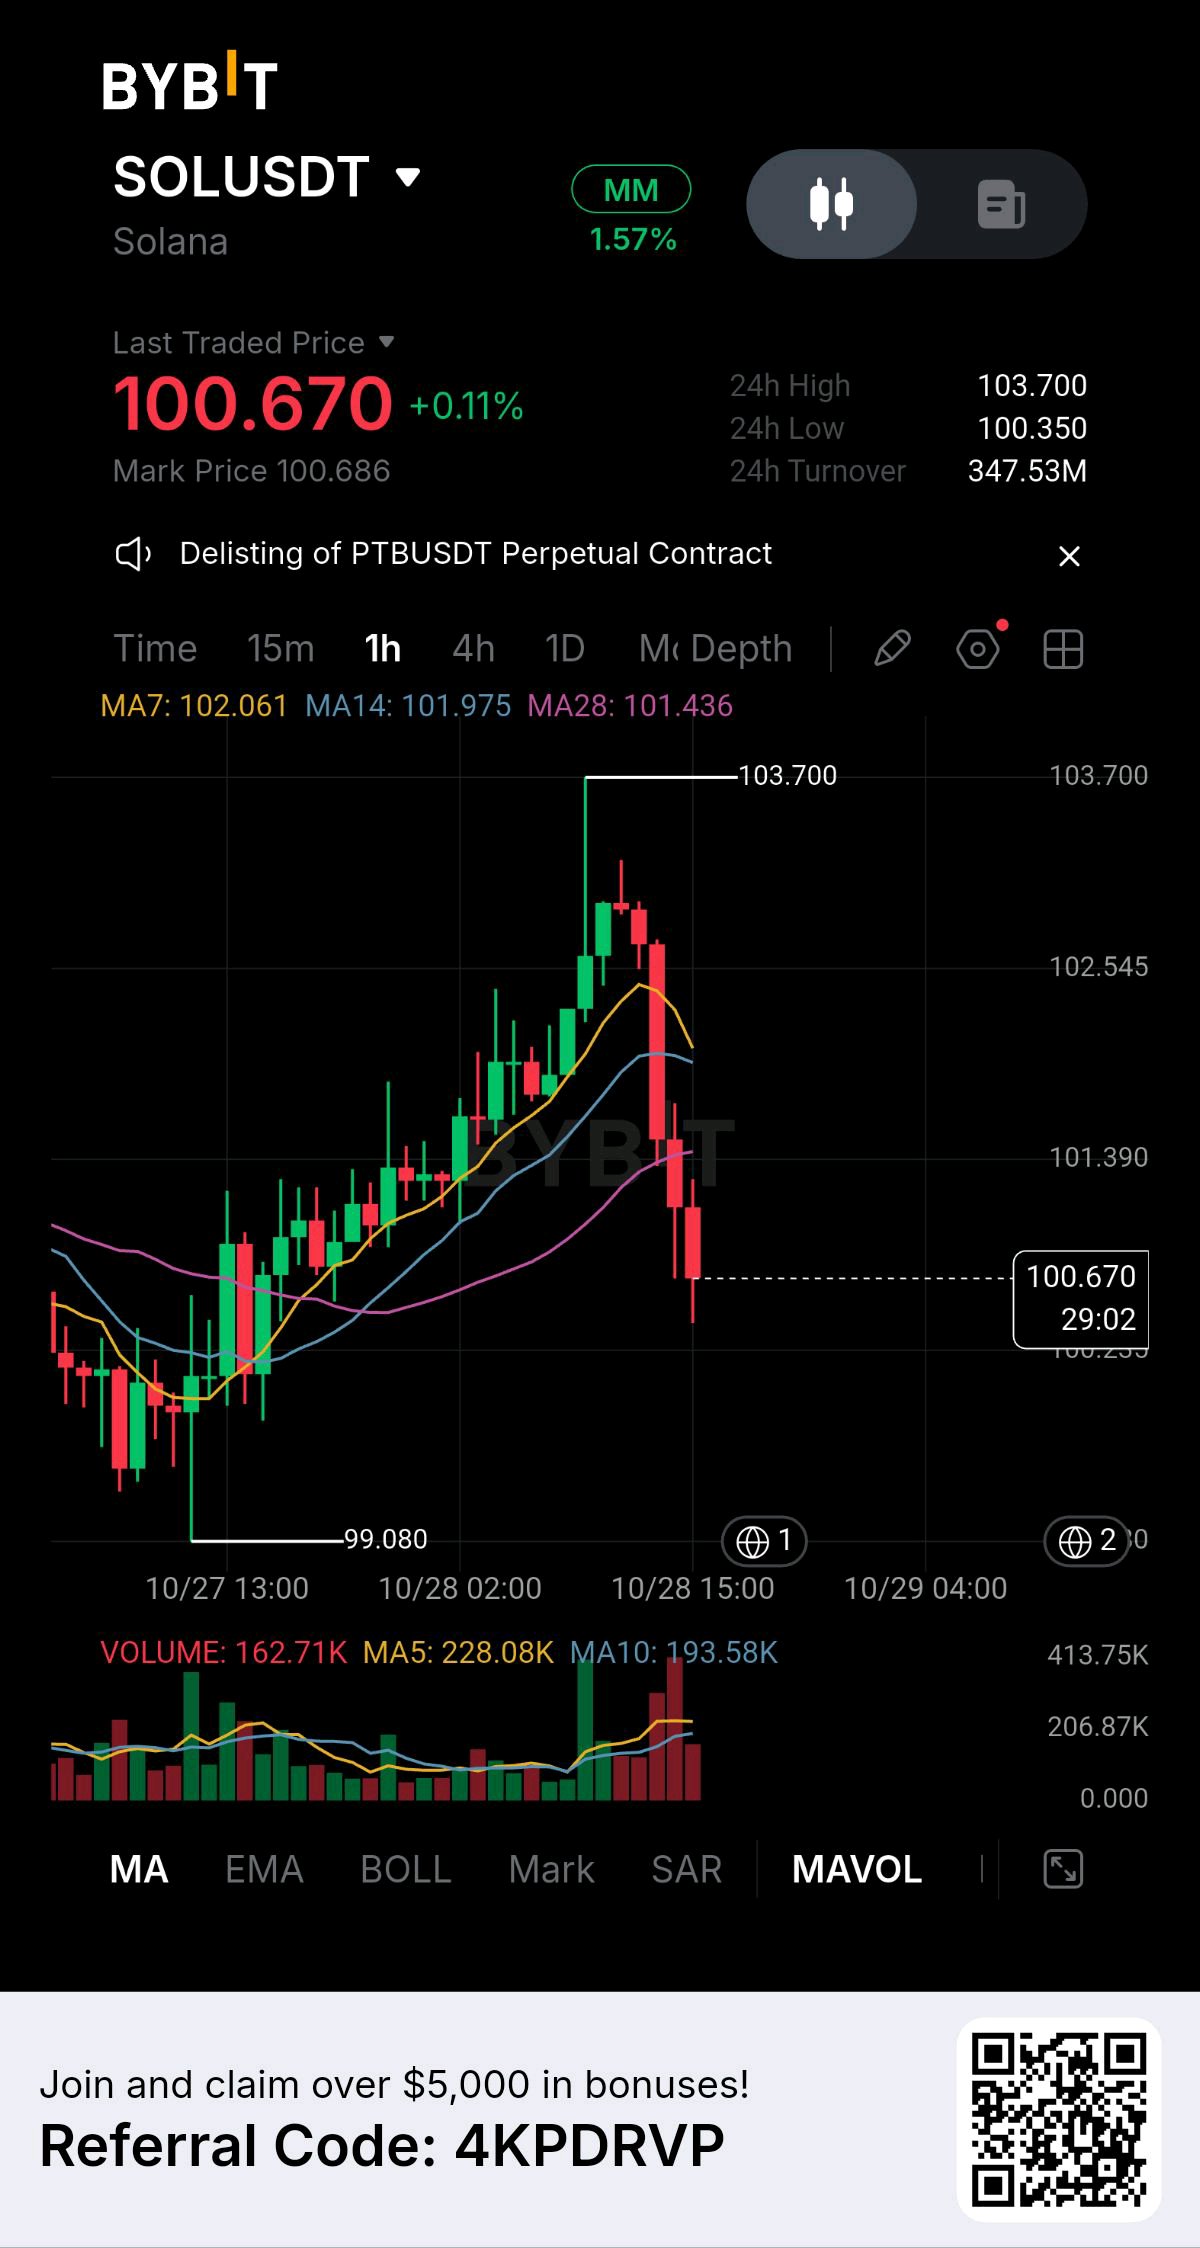
I’m watching $SOLUSDT closely after its strong recovery toward $103.700 was rejected by sellers. Price is now trading around $100.670, and the latest bearish candles show that selling pressure has increased significantly. What looked like a bullish continuation setup has turned into a critical support test, and I want to see how price reacts before deciding on the next potential direction. 1. MARKET STRUCTURE: SELLERS ARE TAKING CONTROL SOL previously recovered from the $99.080 low and climbed toward the $103.700 high, forming a short-term upward move. However, buyers failed to maintain control near the top, and the market has now produced a sharp pullback. The rejection near $103.700 is important because it shows that sellers were willing to defend higher prices. The latest decline has pushed SOL below all three moving averages, weakening the previous bullish structure. My focus now is whether this decline develops into a deeper correction or whether buyers can step in and create a strong recovery. 2. MOVING AVERAGES: BEARISH PRESSURE INCREASES The current moving average levels are: MA7: $102.061 MA14: $101.975 MA28: $101.436 SOL is trading below all three moving averages. The short-term averages are positioned above the current price, creating potential resistance during any recovery. For buyers to regain momentum, I want to see price reclaim the $101.436 area first, followed by a stronger move above $101.975–$102.061. Until that happens, I’m treating any bounce with caution rather than assuming the bullish trend has resumed. 3. KEY SUPPORT ZONE: $100.350–$100.000 The immediate area I’m watching is around the recent 24-hour low of $100.350 and the psychological $100.000 level. If buyers defend this zone and produce a strong bullish candle with increasing volume, SOL could attempt a relief bounce toward $101.436 and then $101.975–$102.061. However, if price breaks below $100.350 and fails to recover quickly, selling pressure could extend toward the previous swing-low area around $99.080. This is a level I would monitor for the next reaction, not a guaranteed downside target. 4. RESISTANCE LEVELS TO WATCH The first important resistance is $101.436, followed by the $101.975–$102.061 moving average zone. A stronger recovery could bring $102.545 into focus, while $103.700 remains the major recent high. I want to see SOL reclaim these levels with convincing candles and stronger buying volume before considering a meaningful bullish continuation. 5. VOLUME CONFIRMATION AND MY NEXT MOVE The recent sell-off has been accompanied by increased trading activity, suggesting that the rejection is more than just a small price fluctuation. Still, I want to observe the next candles to determine whether sellers remain in control or buyers begin absorbing the selling pressure. My plan is simple: I will not chase a falling price, and I will not call a reversal without confirmation. BULLISH SCENARIO: SOL holds the $100.350–$100.000 support area, forms a higher low, and reclaims $101.436 with stronger buying volume. BEARISH SCENARIO: SOL loses $100.350, struggles to recover above $100.000, and continues printing bearish candles. In that case, the $99.080 swing low becomes an important area to monitor. MY FINAL THOUGHTS SOL is at a critical decision point. The previous rally toward $103.700 has lost momentum, and price is now trading below all three moving averages. For now, sellers have the short-term advantage, but the $100 area could determine whether this becomes a deeper correction or the beginning of another recovery. I’m watching support, candle structure, and volume together. The next confirmed move matters more than guessing the direction too early. This is my technical market analysis, not a guaranteed prediction. I will wait for confirmation and manage risk carefully rather than enter a trade based on emotion. #ByXIMPACT
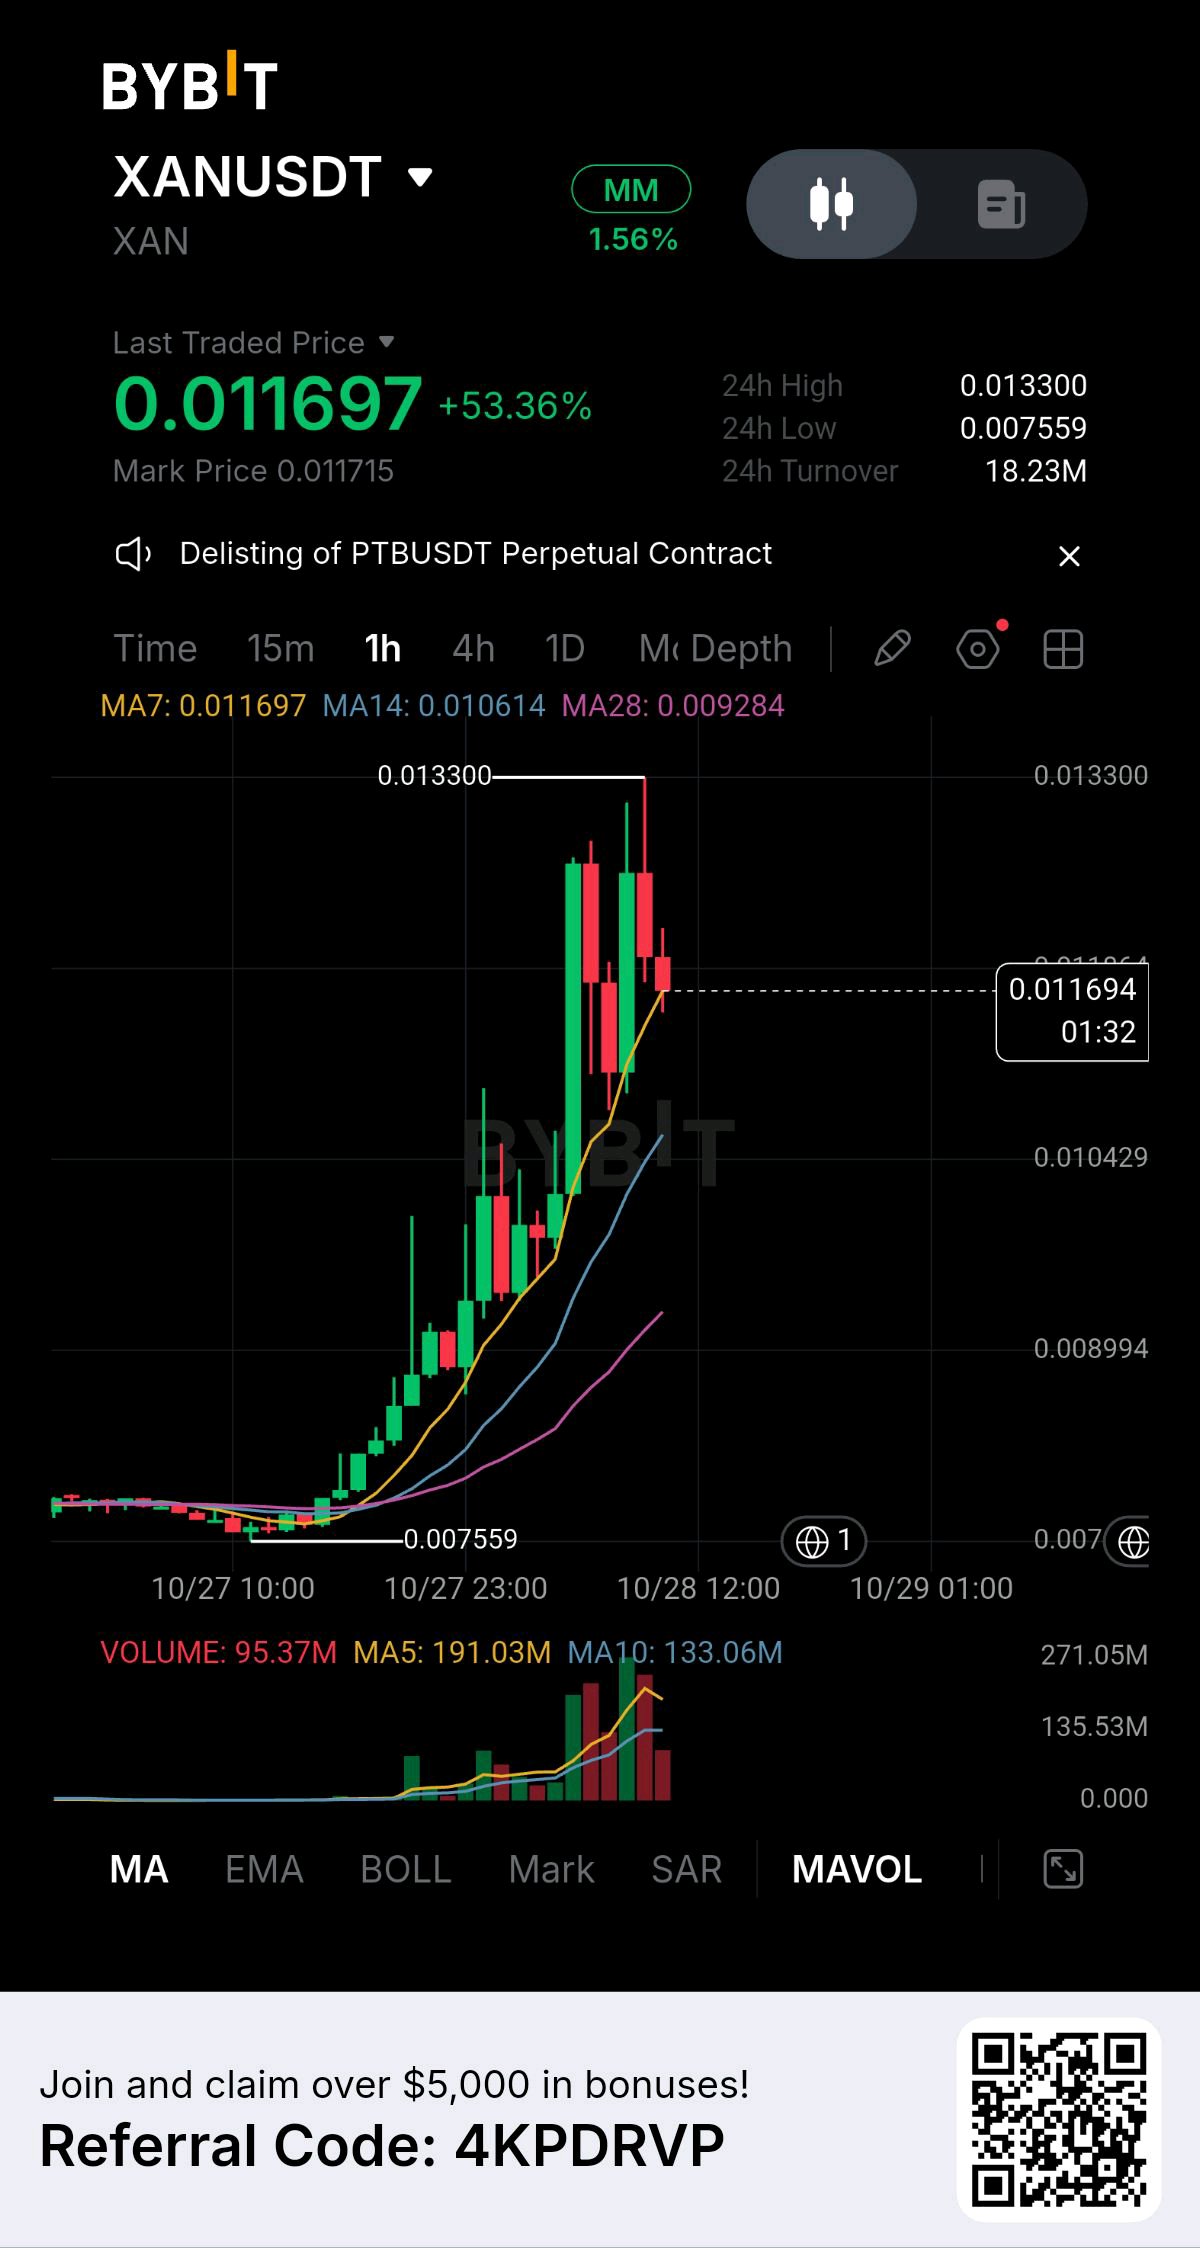
$XANUSDT has already delivered a massive move, but the real question now is whether buyers have enough strength to push the price higher or whether this rally is approaching a major rejection zone. I’m watching the current price action closely because the next reaction could determine whether bullish momentum continues or sellers take control. On the 1H chart, XAN is trading around $0.011697, up approximately 53.36% in the last 24 hours. Price has rallied sharply from the recent low of $0.007559 to a high of $0.013300, showing an aggressive increase in buying pressure. However, after such a strong expansion, I want to see how price behaves around the current levels before making any assumptions about the next move. MARKET STRUCTURE: BUYERS STILL HAVE THE ADVANTAGE The chart shows a strong upward move, with price forming higher highs and higher lows during the recovery. This suggests that buyers have been dominating the short-term structure. However, the latest candles show a pullback from the $0.013300 high, indicating that some selling pressure has entered the market. A pullback after a sharp rally does not automatically mean the bullish trend is over. What matters now is whether buyers can defend the current structure and build enough momentum for another attempt at resistance. MOVING AVERAGES: BULLISH STRUCTURE REMAINS IN PLACE The current moving averages are: MA7: $0.011697 MA14: $0.010614 MA28: $0.009284 Price remains above the MA14 and MA28, while the MA7 is close to the current price. This alignment supports the broader short-term bullish structure, although momentum may be cooling after the rapid advance. I’m watching whether price can hold above the short-term moving average and maintain support near the $0.0110–$0.0115 region. A successful hold could help buyers prepare for another upward attempt. However, a decisive breakdown could open the door to a deeper correction. KEY RESISTANCE: $0.0120–$0.0133 The first important area to watch is around $0.0120, followed by the recent high at $0.013300. A strong 1H candle close above $0.0120, supported by increasing volume, could signal renewed buying interest. If buyers eventually break and hold above $0.013300, that would provide stronger evidence of bullish continuation. Until that happens, I will treat the recent high as a resistance level rather than assume that a breakout is guaranteed. KEY SUPPORT: $0.0110–$0.0106 The $0.0110–$0.0106 region is an important area to monitor during this pullback. The MA14 is currently near $0.010614, making this zone particularly relevant to the short-term structure. If buyers defend this area and price begins forming higher lows, bullish momentum could recover. If price loses this zone decisively, the next area I would monitor is around $0.0100, followed by the MA28 near $0.009284. VOLUME ANALYSIS Trading volume has increased significantly during the rally, confirming that the move attracted strong market participation. However, elevated volume alone does not guarantee further upside. I want to see renewed buying volume during an upward move rather than assume that the previous surge will continue indefinitely. MY FINAL VIEW XAN has demonstrated impressive bullish momentum, but after a 53% daily increase, chasing price without confirmation carries considerable risk. My focus is on three things: whether buyers defend the current support zone, whether volume returns during a recovery, and whether price can challenge the $0.013300 resistance again. A confirmed breakout could strengthen the bullish continuation scenario. A loss of support, however, could trigger further profit-taking and a deeper pullback. For now, I’m watching the reaction at these key levels and waiting for confirmation rather than predicting the next move prematurely. The next move depends on confirmation, not excitement. This is my technical market analysis, not financial advice. Always manage risk and avoid entering a trade based solely on a sudden price surge. #ByXIMPACT
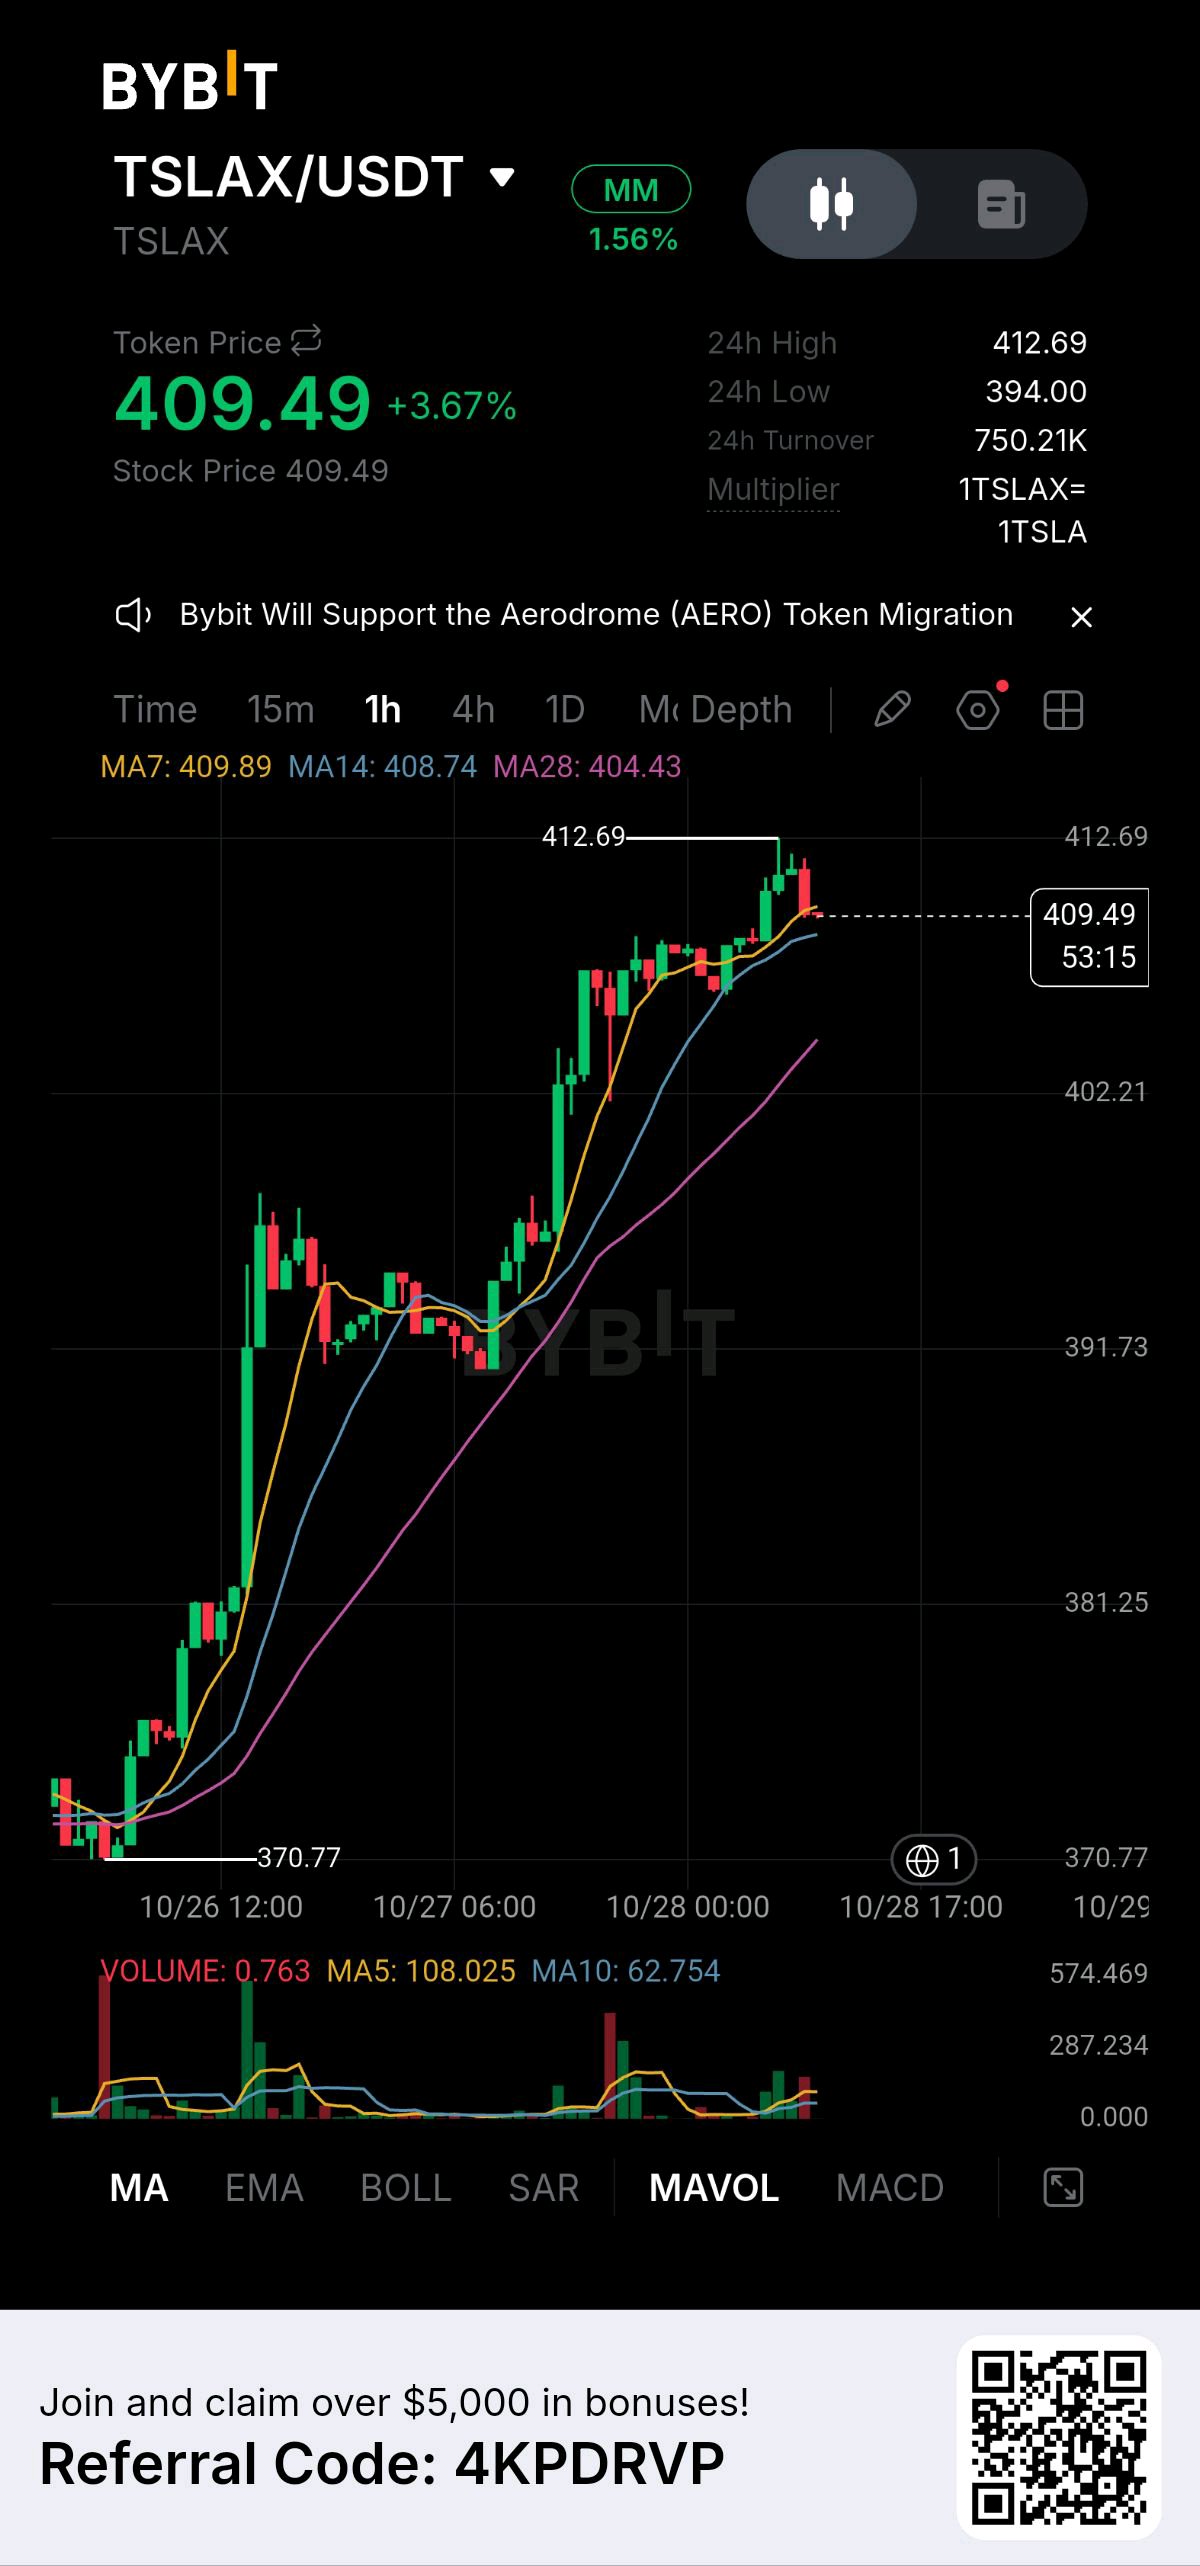
$TSLAXUSDT has made a strong bullish move, but price is now approaching a critical resistance zone where the next move could determine whether buyers can push higher or sellers will trigger a short-term pullback. On the 1H chart, TSLAX is trading around $409.49, up 3.67%, after recovering strongly from the $370.77 low. Price has climbed steadily, broken through several resistance levels, and reached a new local high around $412.69. This move shows strong bullish momentum, but I’m watching the current reaction carefully because the market is now testing an important decision area. MARKET STRUCTURE The overall 1H structure remains bullish. Price has formed higher highs and higher lows, while the moving averages continue to support the recovery. MA7: $409.89 MA14: $408.74 MA28: $404.43 Price is currently trading slightly below MA7 but remains above MA14 and MA28. This suggests that buyers still have an advantage, although short-term momentum may be cooling after the recent rally. KEY RESISTANCE The immediate resistance is between $412.00 and $412.69. This is the level I’m watching closely. If buyers return with strong volume and secure a 1H candle close above $412.69, TSLAX could attempt another bullish continuation. However, a rejection from this area could lead to consolidation or a temporary pullback before the next directional move. KEY SUPPORT The first support zone is around $408.70–$409.00, near the MA14 area. If price holds this zone, buyers may have an opportunity to push toward the recent high again. The next important support sits around $404.40, near MA28. A deeper pullback could bring $402.20 into focus. These levels will help determine whether the current bullish structure remains intact. VOLUME AND MOMENTUM The chart shows strong buying activity during the upward move, but recent volume appears less aggressive than during the earlier breakout candles. I want to see fresh buying volume before treating a move above $412.69 as a confirmed breakout. MY MARKET OUTLOOK My bias remains cautiously bullish while price holds above the key support zones. A strong breakout above $412.69 with increasing volume could support further upside, while a loss of $408.70 may expose price to a deeper correction toward $404.40. I’m not chasing the move blindly. I’m watching how price reacts at these levels because the next confirmed move matters more than the recent pump. The key question is simple: can buyers break $412.69 and continue the rally, or will sellers defend the resistance and force a pullback? This is my technical analysis based on the 1H chart, not a guaranteed prediction. I’ll be watching the breakout, volume, and support reaction before drawing a stronger conclusion. #ByXIMPACT

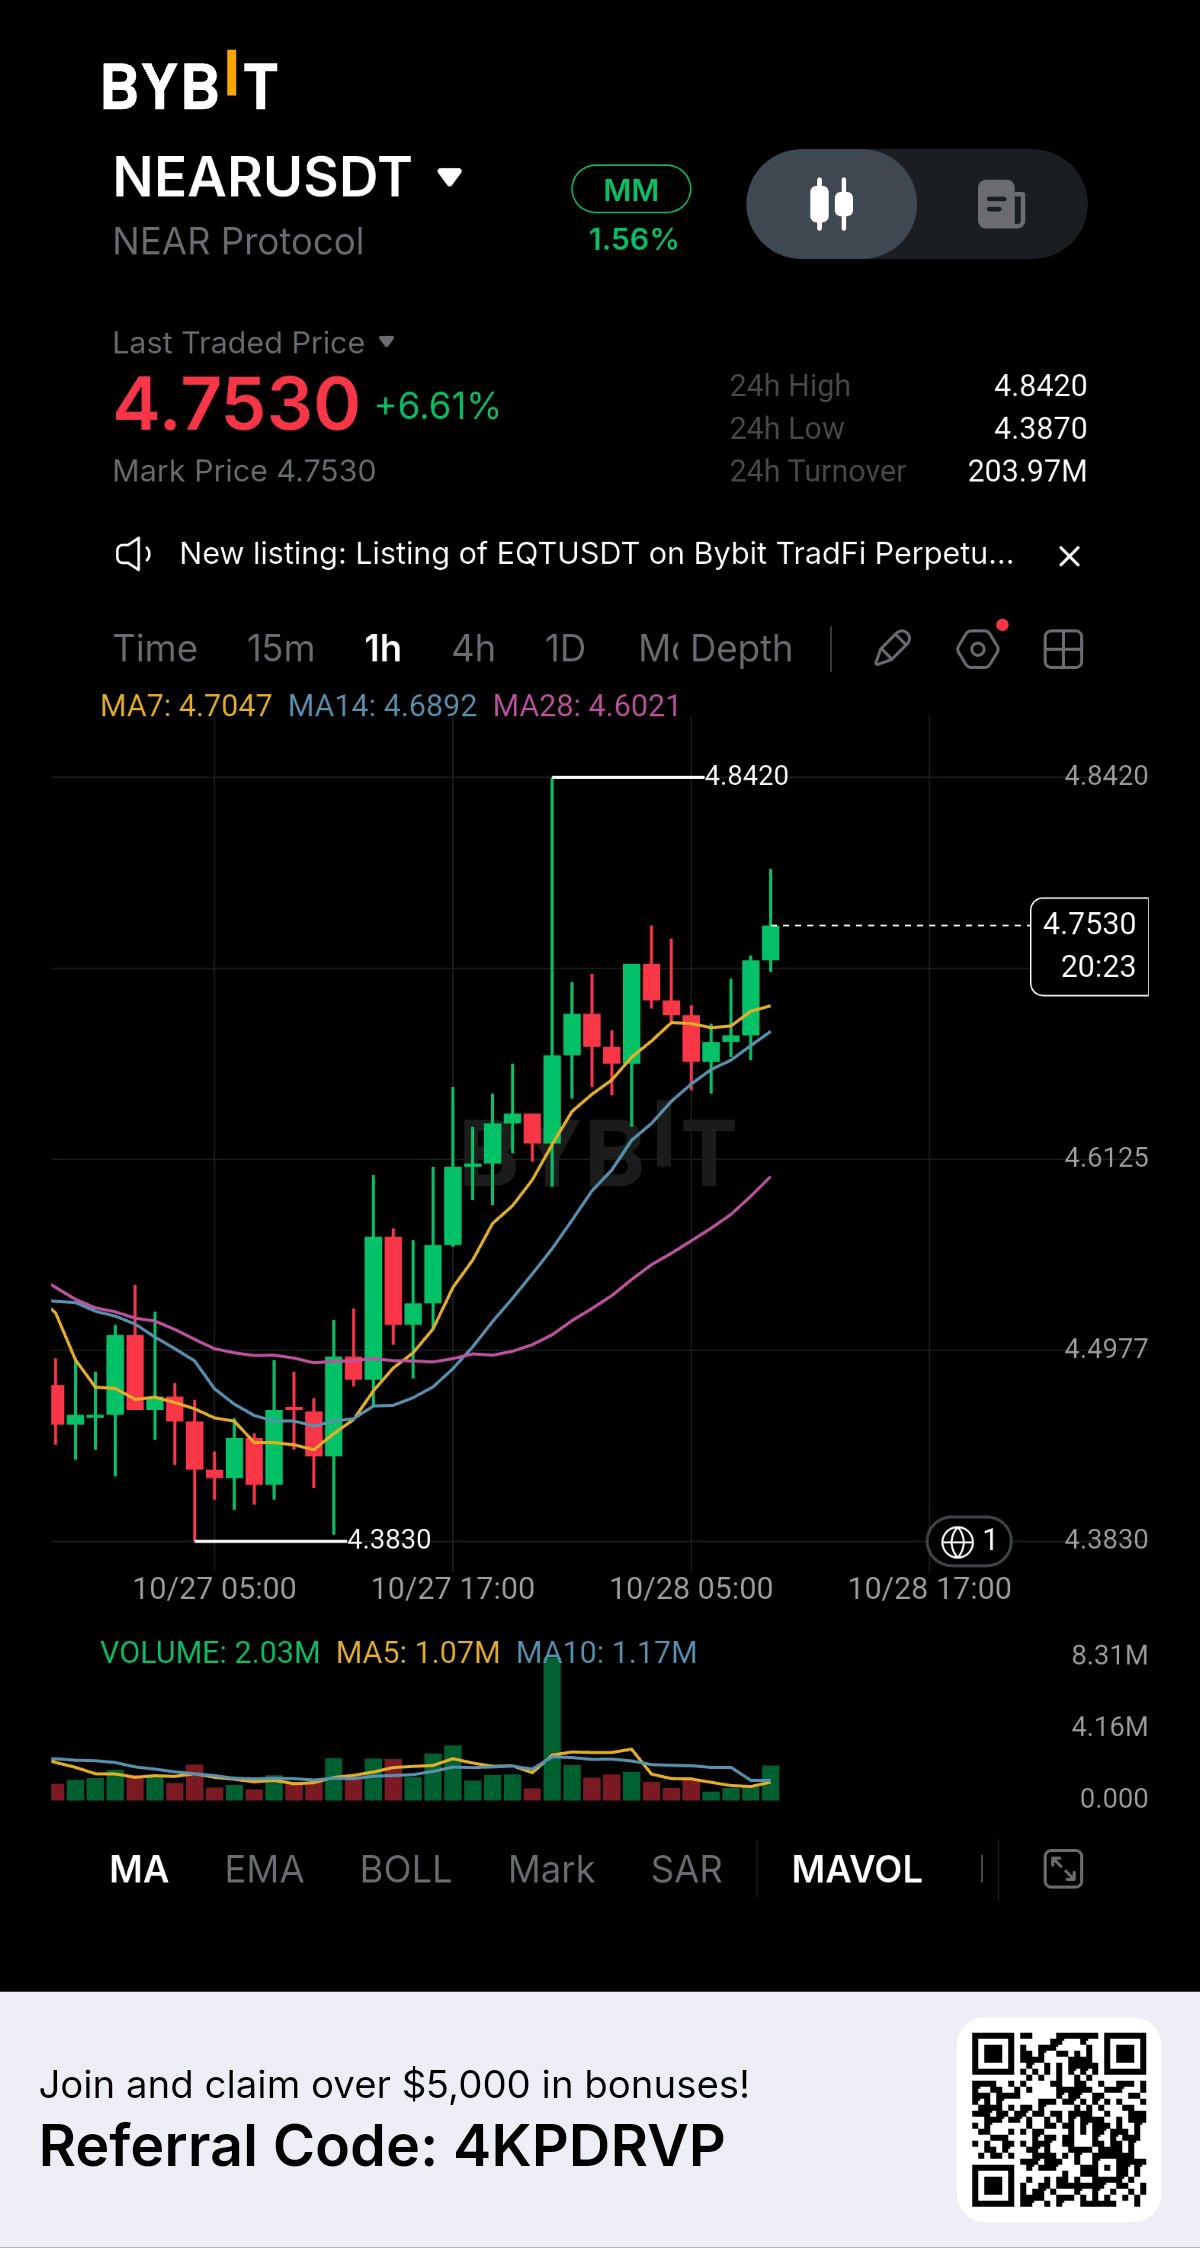
$NEARUSDT is approaching a critical resistance zone after a strong bullish move, and the next reaction could determine whether buyers push for another breakout or sellers force a short-term pullback. From my 1H chart analysis, NEAR is trading around $4.7530, up 6.61%, after recovering strongly from the $4.3830 support area. Buyers have taken control of the short-term structure, pushing price toward the recent high of $4.8420. Market Structure Price is trading above MA7 at $4.7047, MA14 at $4.6892, and MA28 at $4.6021. This alignment supports the current bullish momentum and shows that buyers still have the advantage. However, I want to see whether this strength can continue as price approaches resistance. Key Resistance: $4.8420 This is the main level I’m watching. A strong 1H candle close above $4.8420, supported by increasing volume, could open the door for another upward move. I don’t want to assume a breakout before price confirms it. Key Support Zones - $4.7000–$4.6900: Immediate support around MA7 and MA14. - $4.6125: Important structure support if the price pulls back further. - $4.6021: MA28 support to watch for a deeper retracement. Bullish Scenario If buyers maintain control, defend the moving averages, and break above $4.8420 with strong volume, NEAR could extend its recovery and enter a new bullish phase. Bearish Scenario If price fails to break resistance and loses the $4.6900 area, a pullback toward $4.6125 becomes possible. A deeper move below MA28 would weaken the current bullish structure. My Trading View NEAR is showing strong momentum, but I’m focusing on confirmation rather than chasing green candles. The $4.8420 level is the key decision point. A confirmed breakout could favor continuation, while a rejection may create a healthy pullback before the next move. The level is clear. Now I’m watching the reaction, the volume, and the candle close. This is my technical analysis, not financial advice. Always manage risk and wait for confirmation before entering a trade. #ByXIMPACT
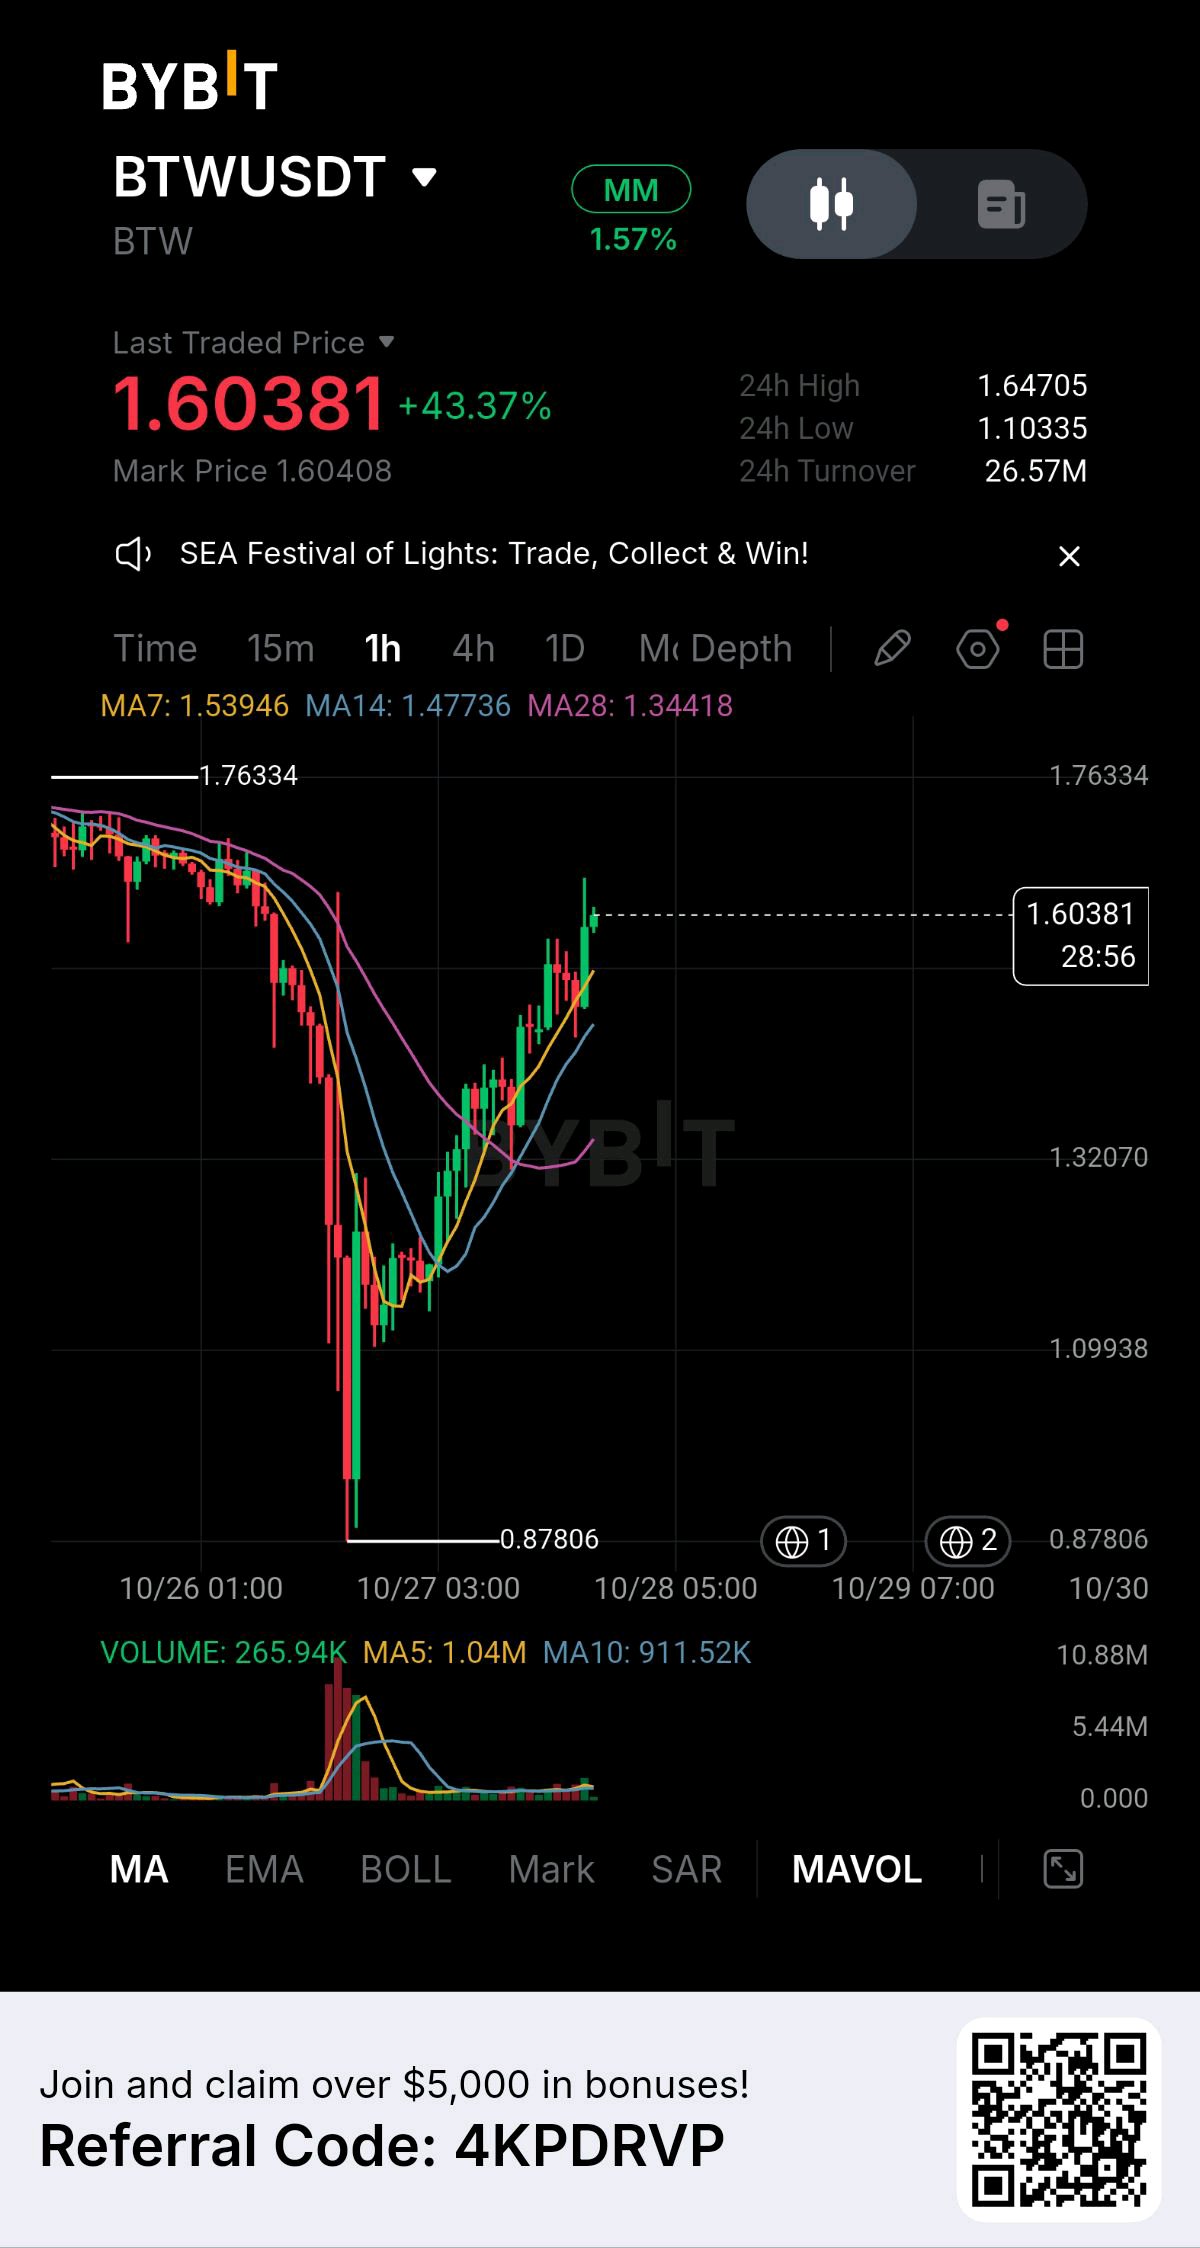
BTW IS UP 43.37%, BUT THE REAL TEST IS JUST AHEAD. WILL BUYERS BREAK THE RESISTANCE OR WILL SELLERS TURN THIS RALLY INTO A TRAP? BTW has caught my attention after an aggressive recovery from $0.87806 to the current price of $1.60381. The market has already made a powerful move, but I’m not focusing only on how much the price has increased. I’m watching the next reaction because this is where the market could reveal whether buyers still have enough strength to push higher. THE MARKET STRUCTURE IS CHANGING On the 1-hour chart, BTW has recovered strongly from its recent low and started forming higher price levels. This suggests that buyers have regained short-term momentum after the previous sell-off. Price is currently trading above all three moving averages: MA7: $1.53946 MA14: $1.47736 MA28: $1.34418 This alignment supports the bullish recovery. However, after a move of more than 43%, I’m also aware that some traders may begin taking profits. That is why I want to see how price behaves around resistance before assuming another major upward move is coming. THE LEVEL THAT COULD CHANGE EVERYTHING The key resistance I’m watching is $1.64705, the displayed 24-hour high. This is the level where I want to see buyers prove their strength. A strong 1-hour candle close above $1.64705, supported by increasing volume, could open the door to another bullish continuation attempt. But I’m not interested in chasing a breakout without confirmation. If price briefly moves above resistance and quickly falls back below it, that could signal a false breakout and leave late buyers exposed to a pullback. SUPPORT LEVELS I’M WATCHING If BTW faces selling pressure, my first area of interest is $1.53946, around MA7. The next important support is $1.47736, near MA14. If the market pulls back into this zone and buyers defend it, the recovery could remain constructive. However, if price loses these levels and continues falling, I would become more cautious. A move toward $1.34418, near MA28, could indicate that the current bullish momentum is weakening. VOLUME IS THE NEXT CONFIRMATION The chart shows a major increase in volume during the sharp sell-off and recovery. That tells me significant trading activity accompanied the move. Now, I want to see whether buying volume returns as BTW approaches resistance. A breakout with strong participation would carry more weight than a price increase supported by weak volume. MY PERSONAL MARKET OUTLOOK My short-term bias remains bullish while price holds above the key moving-average support zones. However, the $1.64705 resistance remains the immediate test. A confirmed breakout could strengthen the continuation setup, while a rejection could trigger profit-taking and a temporary correction. I’m watching the price reaction, candle closes, and volume before deciding which scenario is gaining strength. REMEMBER: THE BIGGEST MOVE IS NOT ALWAYS THE BEST ENTRY. SOMETIMES, THE MOST IMPORTANT SIGNAL IS HOW PRICE BEHAVES AFTER EVERYONE STARTS PAYING ATTENTION. BTW is approaching a critical decision area. Will buyers deliver another breakout, or will sellers defend the high? I’m watching the structure and waiting for confirmation rather than blindly chasing the pump. This is my technical market observation, not a guaranteed prediction. Always manage your risk and wait for confirmation before entering a trade. #ByXIMPACT
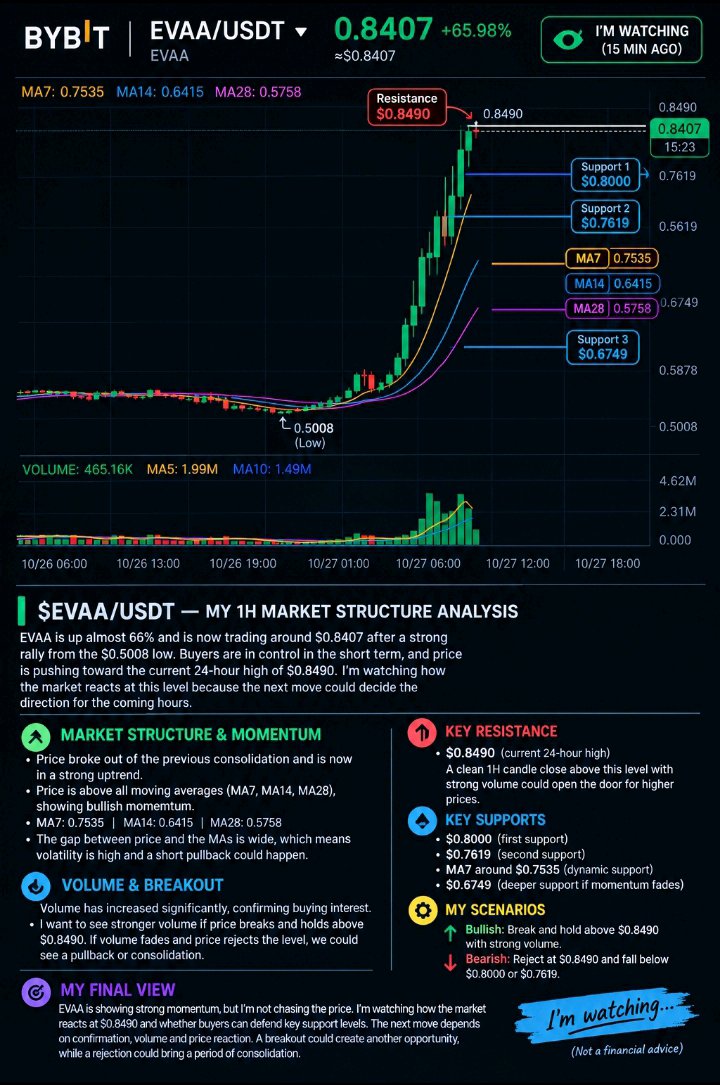
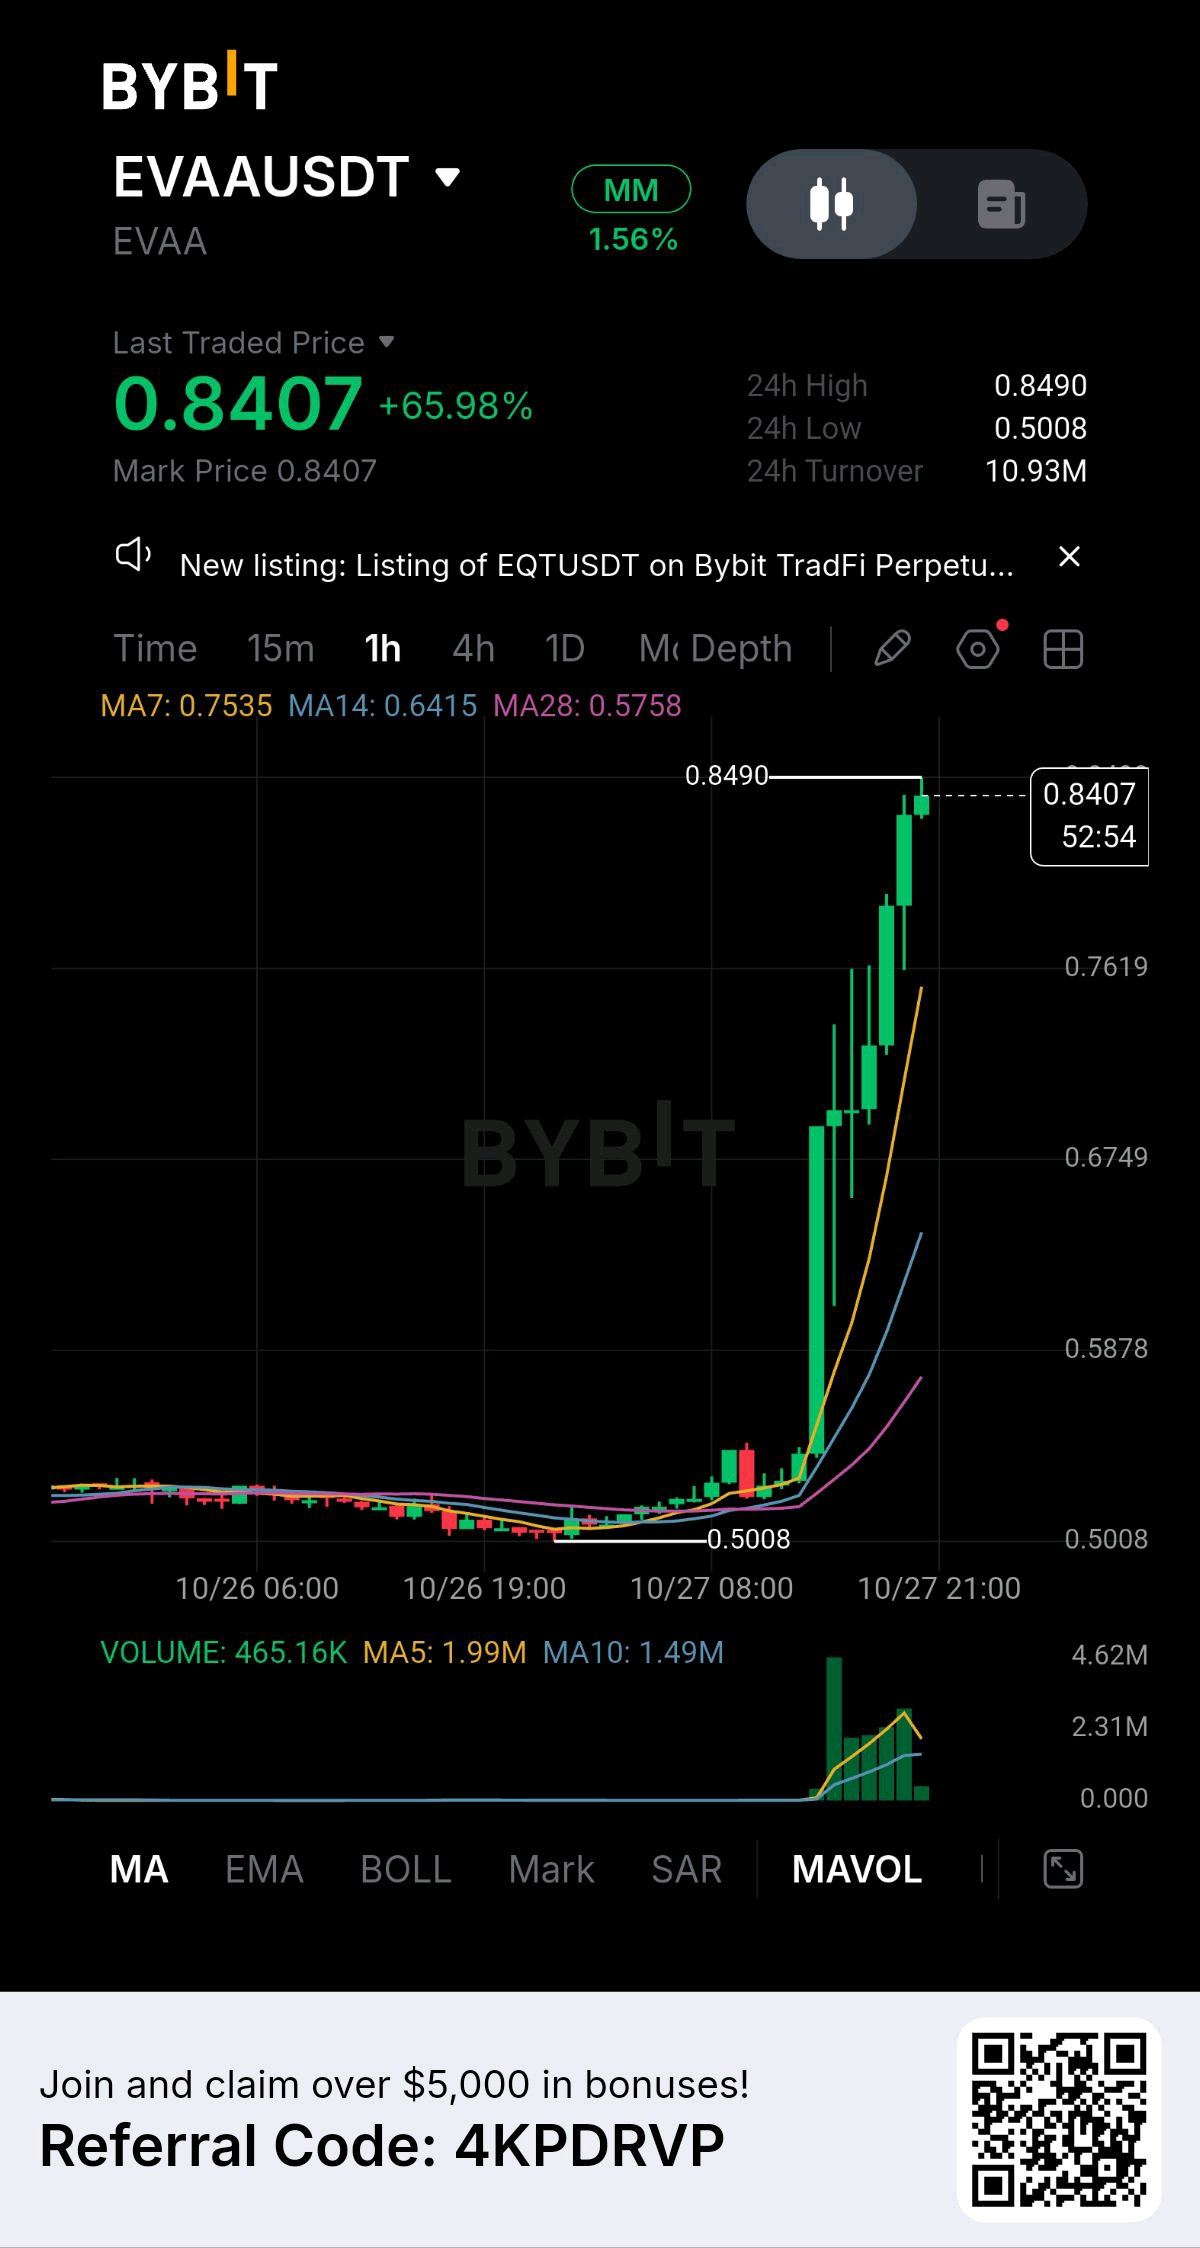
I have been watching EVAA closely on the 1-hour chart, and the price action is becoming increasingly interesting. EVAA is trading around $0.8407, up approximately 65.98%, after climbing aggressively from the $0.5008 low. This is a powerful move that has shifted the short-term market structure in favor of buyers. However, I am not looking at this rally simply because the price is moving higher. I am paying attention to the strength of the breakout, the volume behind the move, and the resistance level that could determine the next direction. MARKET STRUCTURE: BUYERS HAVE TAKEN CONTROL EVAA spent a considerable period consolidating around the $0.50–$0.53 region before buyers stepped in with strong momentum. Price then broke out of that range and accelerated toward the $0.8490 resistance area. The moving averages reinforce the current bullish structure. MA7 is around $0.7535, MA14 is near $0.6415, and MA28 is around $0.5758. Price is trading above all three averages, showing that bullish momentum remains strong on the chart. But there is one important detail: price has moved significantly above its moving averages. After such an aggressive rally, volatility can increase, and a sharp pullback can occur even while the broader short-term structure remains bullish. KEY RESISTANCE: $0.8490 This is the level I am watching most closely. EVAA is approaching its current 24-hour high, and the reaction here could determine whether buyers have enough strength to extend the rally. If price breaks above $0.8490 with a strong 1-hour candle close and convincing volume, it could signal another bullish continuation attempt. I would then watch whether the breakout holds instead of chasing the first green candle. If price fails repeatedly at this resistance, sellers could take advantage of the rally to trigger profit-taking and short-term consolidation. SUPPORT LEVELS THAT MATTER The first level I am watching below the current price is $0.8000. If EVAA pulls back, buyers need to demonstrate that they can defend this area. The next important level is $0.7619, followed by the MA7 around $0.7535. A reaction around these levels could help determine whether the market is preparing for another move higher or losing momentum. If selling pressure increases and price drops toward $0.6749, that would signal a deeper correction and a more significant weakening of the current bullish momentum. VOLUME: CONFIRMATION IS EVERYTHING The recent expansion in trading volume shows that the breakout has attracted significant market participation. However, volume must continue supporting the move if buyers want to push through resistance. I want to see strong buying activity during a breakout, followed by price holding above the reclaimed level. A breakout without follow-through could quickly turn into a failed move. MY TWO SCENARIOS Bullish scenario: EVAA breaks above $0.8490, closes strongly above resistance, and maintains buying pressure. This would strengthen the case for further upside. Bearish scenario: EVAA gets rejected at $0.8490, loses $0.8000, and falls below $0.7619. That would increase the possibility of a deeper pullback. MY FINAL ANALYSIS EVAA has demonstrated impressive bullish momentum, but I believe the next move must be confirmed rather than assumed. The market has already delivered a massive rally, and entering without a clear plan could expose traders to unnecessary risk. I am watching the $0.8490 resistance, the reaction around $0.8000, and the volume behind every major candle. If buyers prove their strength, continuation remains possible. If sellers take control, a correction could develop quickly. THE STRONGEST MOVE IS NOT ALWAYS THE BEST ENTRY. I WANT CONFIRMATION, NOT FOMO. This is my technical market analysis, not a guaranteed prediction. Always manage risk carefully, especially after a rally of this size. #ByXIMPACT
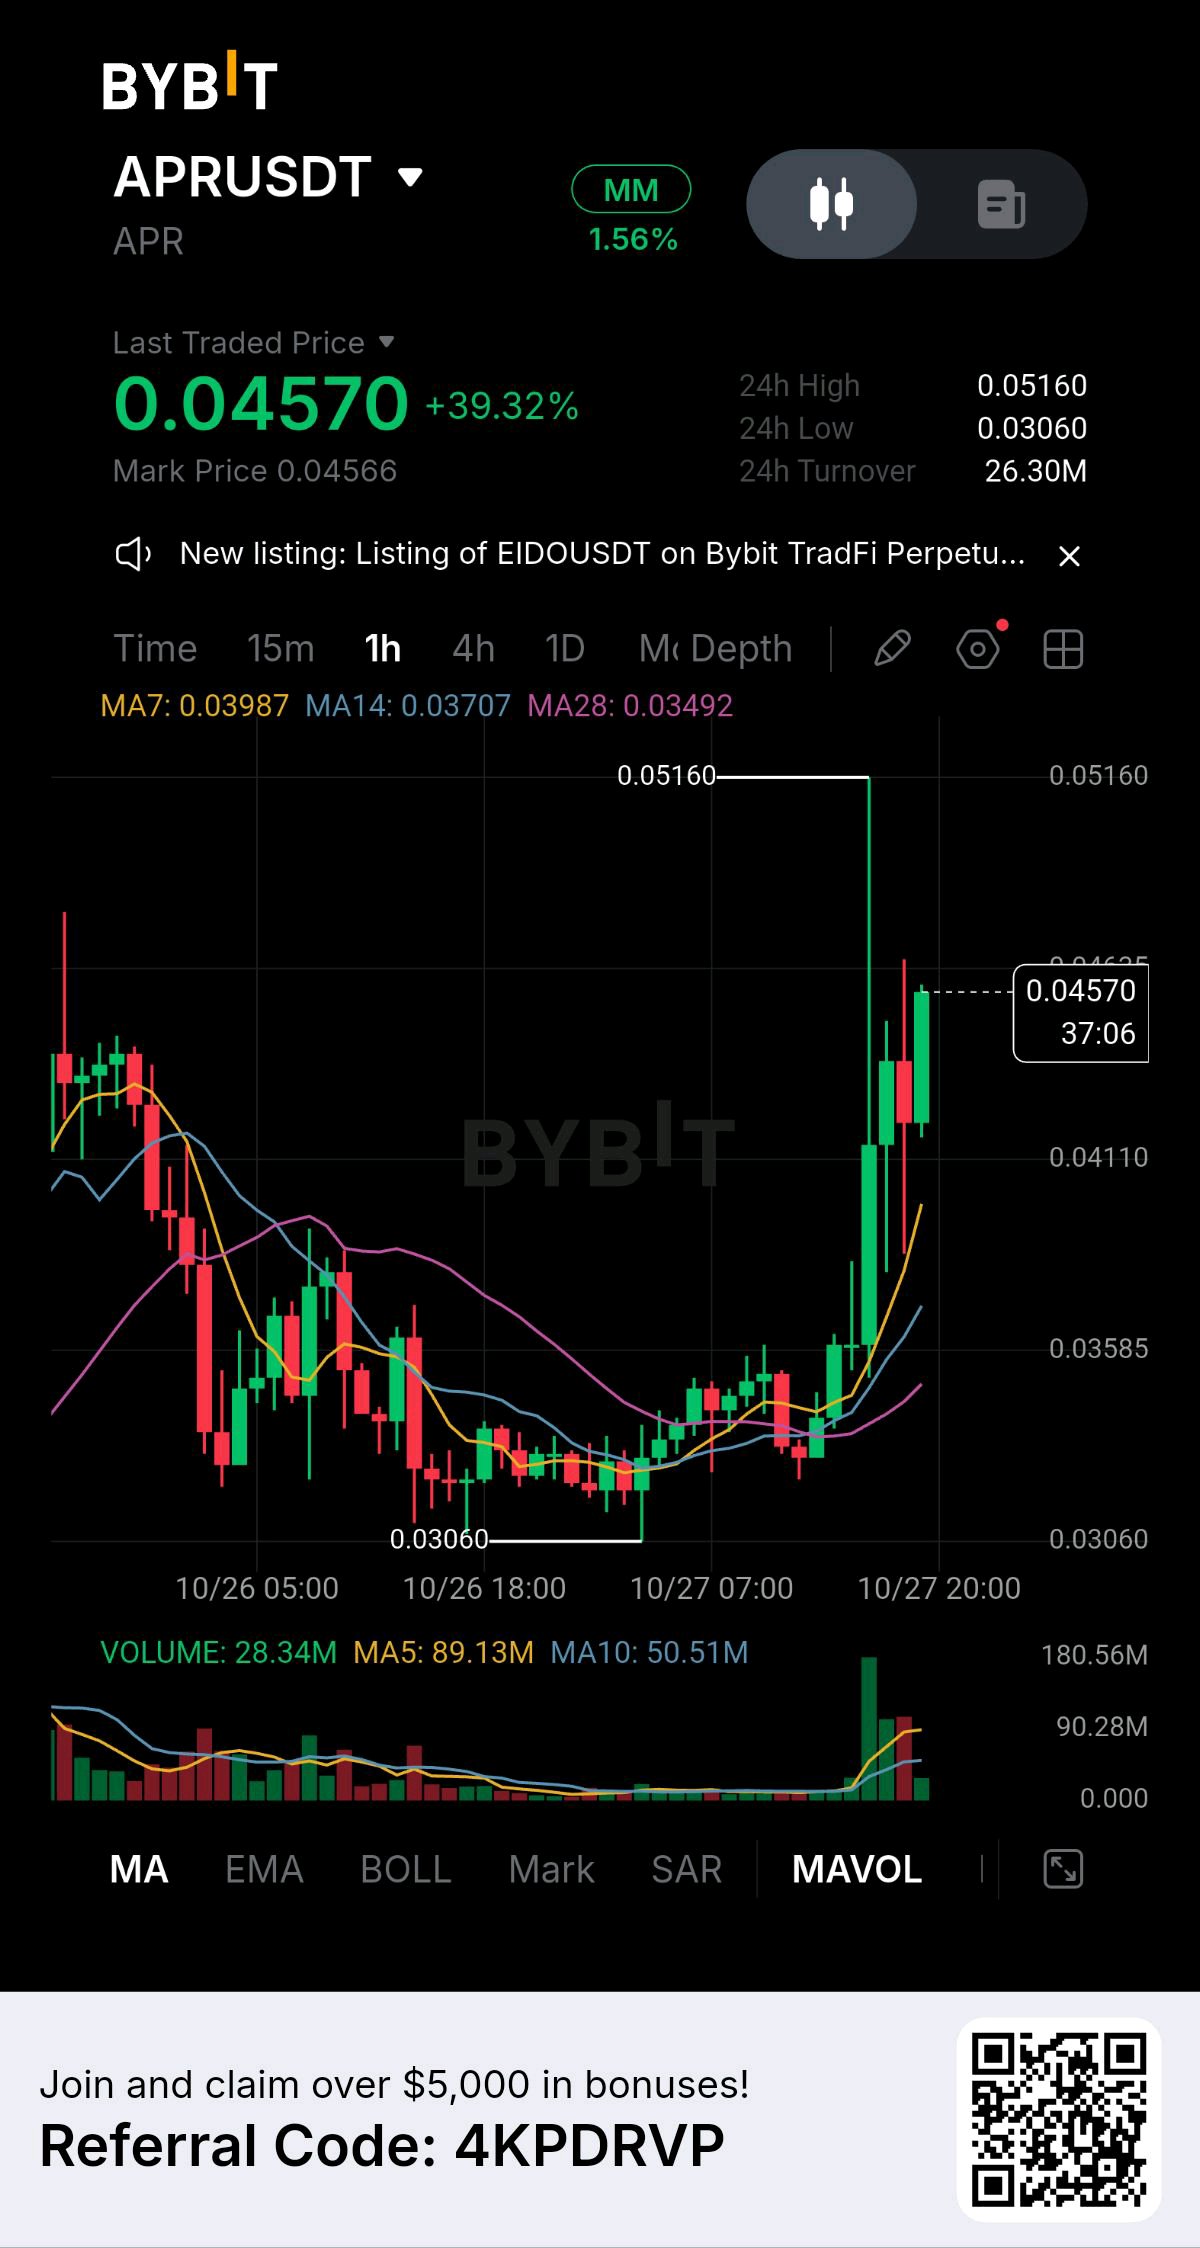
APR JUST SURGED 39.32%, BUT THE MOST IMPORTANT MOVE MAY STILL BE AHEAD. WILL BUYERS BREAK THROUGH RESISTANCE AND EXTEND THIS RALLY, OR IS THE MARKET PREPARING FOR A SHARP CORRECTION? I’m watching APRUSDT closely on the 1-hour chart because the latest price action has completely changed the short-term market structure. After spending considerable time consolidating around the $0.03060–$0.03500 region, buyers entered aggressively and pushed the price to $0.04570, with a recent 24-hour high of $0.05160. However, a strong rally alone does not guarantee continued upside. My focus now is on whether buyers can defend the breakout and build enough momentum to challenge the recent high again. MARKET STRUCTURE AND MOMENTUM APR has moved above all three moving averages, showing a strong improvement in short-term momentum. MA7 is at $0.03987, MA14 at $0.03707, and MA28 at $0.03492. This alignment supports the bullish outlook, provided price continues to hold above important support levels. The sharp move from the consolidation zone suggests that buyers have gained control in the short term. Nevertheless, after such a rapid increase, profit-taking and volatility could create a temporary pullback. KEY RESISTANCE LEVELS The first area I’m monitoring is $0.04650–$0.04700. A strong 1-hour close above this zone, supported by increasing volume, could strengthen the possibility of another move toward $0.05000. Above that, $0.05160 remains the major resistance and recent 24-hour high. A confirmed breakout above this level could signal further bullish continuation, but I want to see price hold above the breakout rather than rely on a brief spike. KEY SUPPORT LEVELS On the downside, $0.04110 is an important level to watch. If APR pulls back and buyers defend this area, the market could establish a higher low and prepare for another attempt at resistance. If selling pressure increases, MA7 at $0.03987 becomes the next reference point, followed by MA14 at $0.03707. A deeper decline toward $0.03585 would require a closer assessment of whether the bullish structure is weakening. VOLUME CONFIRMATION The recent breakout came with a significant increase in trading activity, showing strong participation during the rally. However, I’m watching for fresh volume to confirm any further breakout. Without continued buying pressure, price could struggle to sustain its current momentum. MY TRADING OUTLOOK My bullish scenario remains valid if APR holds above $0.04110, forms a higher low, and breaks through $0.04700 with strong volume. That could open the way toward $0.05000–$0.05160. On the other hand, rejection near resistance followed by a breakdown below $0.04110 would increase the risk of a deeper correction. MY CONCLUSION APR has delivered an impressive recovery, but I’m not chasing the rally blindly. The next move depends on how price reacts around resistance and whether buyers can defend the breakout structure. I’m waiting for confirmation before making a decision. The opportunity matters, but protecting capital matters more. #ByXIMPACT
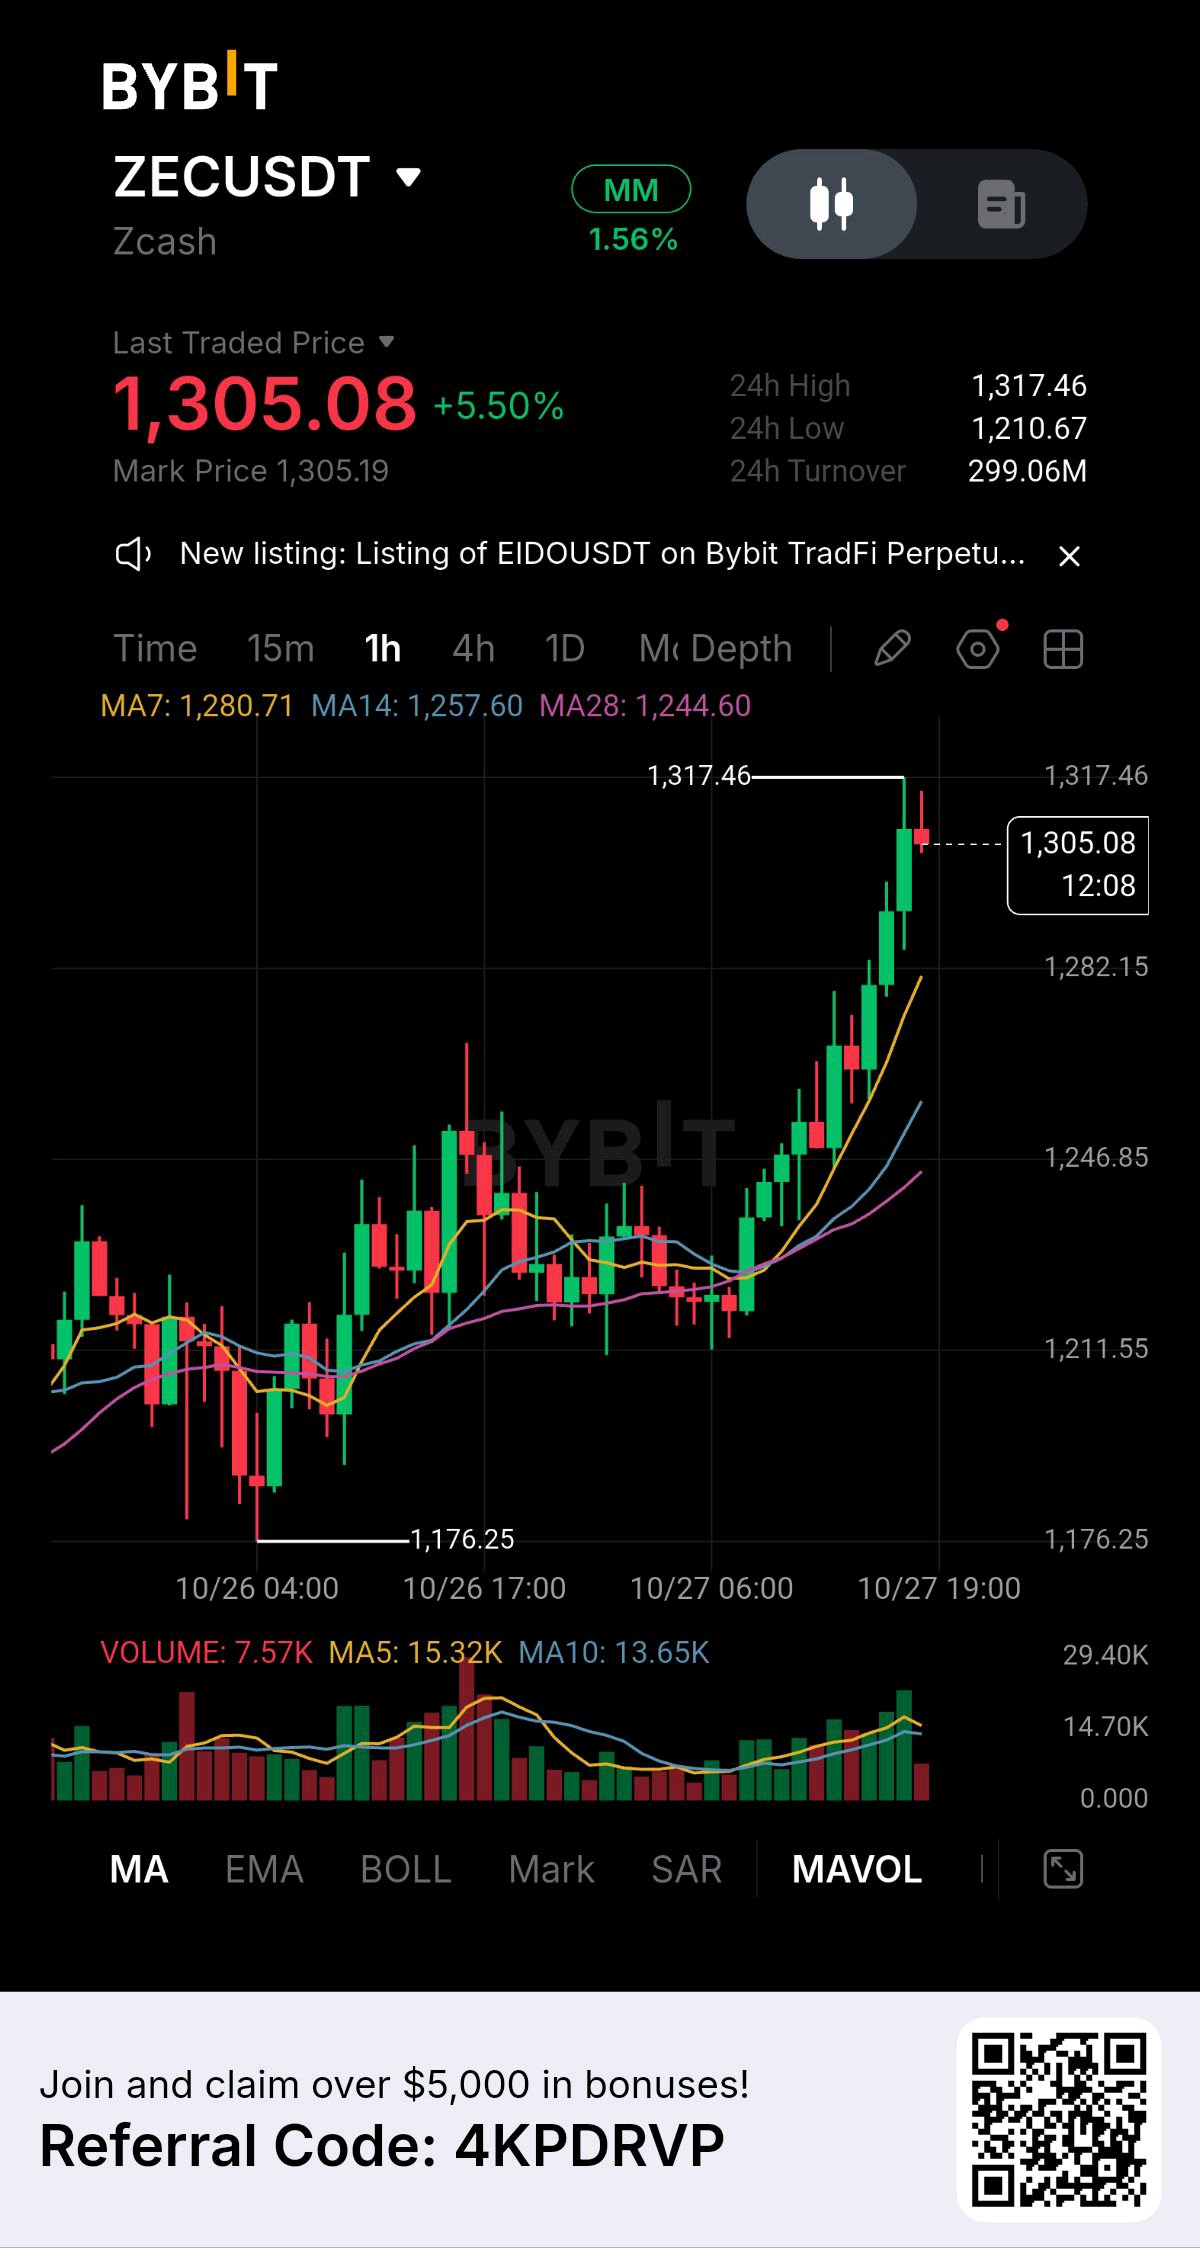
I’ve been watching the ZEC chart closely, and the move happening right now is important. ZEC is trading around $1,305.08, up approximately 5.50%, after making a strong recovery from the $1,210 area. The price structure has shifted clearly in favor of buyers, but the next move depends heavily on how price reacts around the current resistance. The first level that immediately stands out is $1,317.46. That is the current 24H high and the strongest nearby resistance on this chart. Price pushed aggressively toward this level, but the latest candle is showing some rejection around the highs. That tells me buyers have momentum, but they still need to prove they can break and hold above $1,317.46. What makes the setup interesting is the moving-average structure. MA7 is around $1,280.71, MA14 is around $1,257.60, and MA28 is around $1,244.60. The short-term averages are stacked bullishly, with price trading well above all three. This shows that the recent upward move is not just a single candle spike. The broader 1H structure has been improving, with price creating higher lows and pushing progressively higher. The key area I’m watching now is the $1,280–$1,282 zone. If ZEC pulls back after testing $1,317 and buyers defend this area, that could become an important confirmation that the previous resistance has turned into support. A clean 1H candle close above $1,317.46, preferably supported by stronger volume, would be the confirmation I want to see for another continuation attempt. Without that confirmation, I would not treat the current move as a guaranteed breakout. There is also an important warning on volume. The displayed volume is around 7.57K, while the MA5 volume is approximately 15.32K and MA10 volume is around 13.65K. So although price has moved strongly, the latest volume is not yet showing overwhelming participation. This is why I would rather see buyers step in with stronger volume above resistance instead of chasing the current candle. If $1,317.46 breaks and holds, the market could start searching for higher levels as momentum traders enter. The first objective would be the next psychological area above the current high, while continued strength could open the door to a much larger extension. On the downside, losing $1,280–$1,282 would weaken the immediate bullish structure. Below that, I would watch the $1,246–$1,257 region, where the MA14/MA28 structure becomes increasingly important. A deeper breakdown toward $1,211 would completely change the current short-term picture. My view is simple: ZEC is bullish on the 1H structure, but $1,317.46 is the real test. I’m not interested in chasing the green candles. I want to see whether buyers can break resistance, close above it, and then defend the breakout zone. Breakout + volume + successful retest would give this setup much stronger confirmation. Until then, $1,317.46 remains the battlefield.If you want, I can also make this more aggressive and attention-grabbing at around 3,000 characters while keeping it in your own-analysis style. #ByXIMPACT
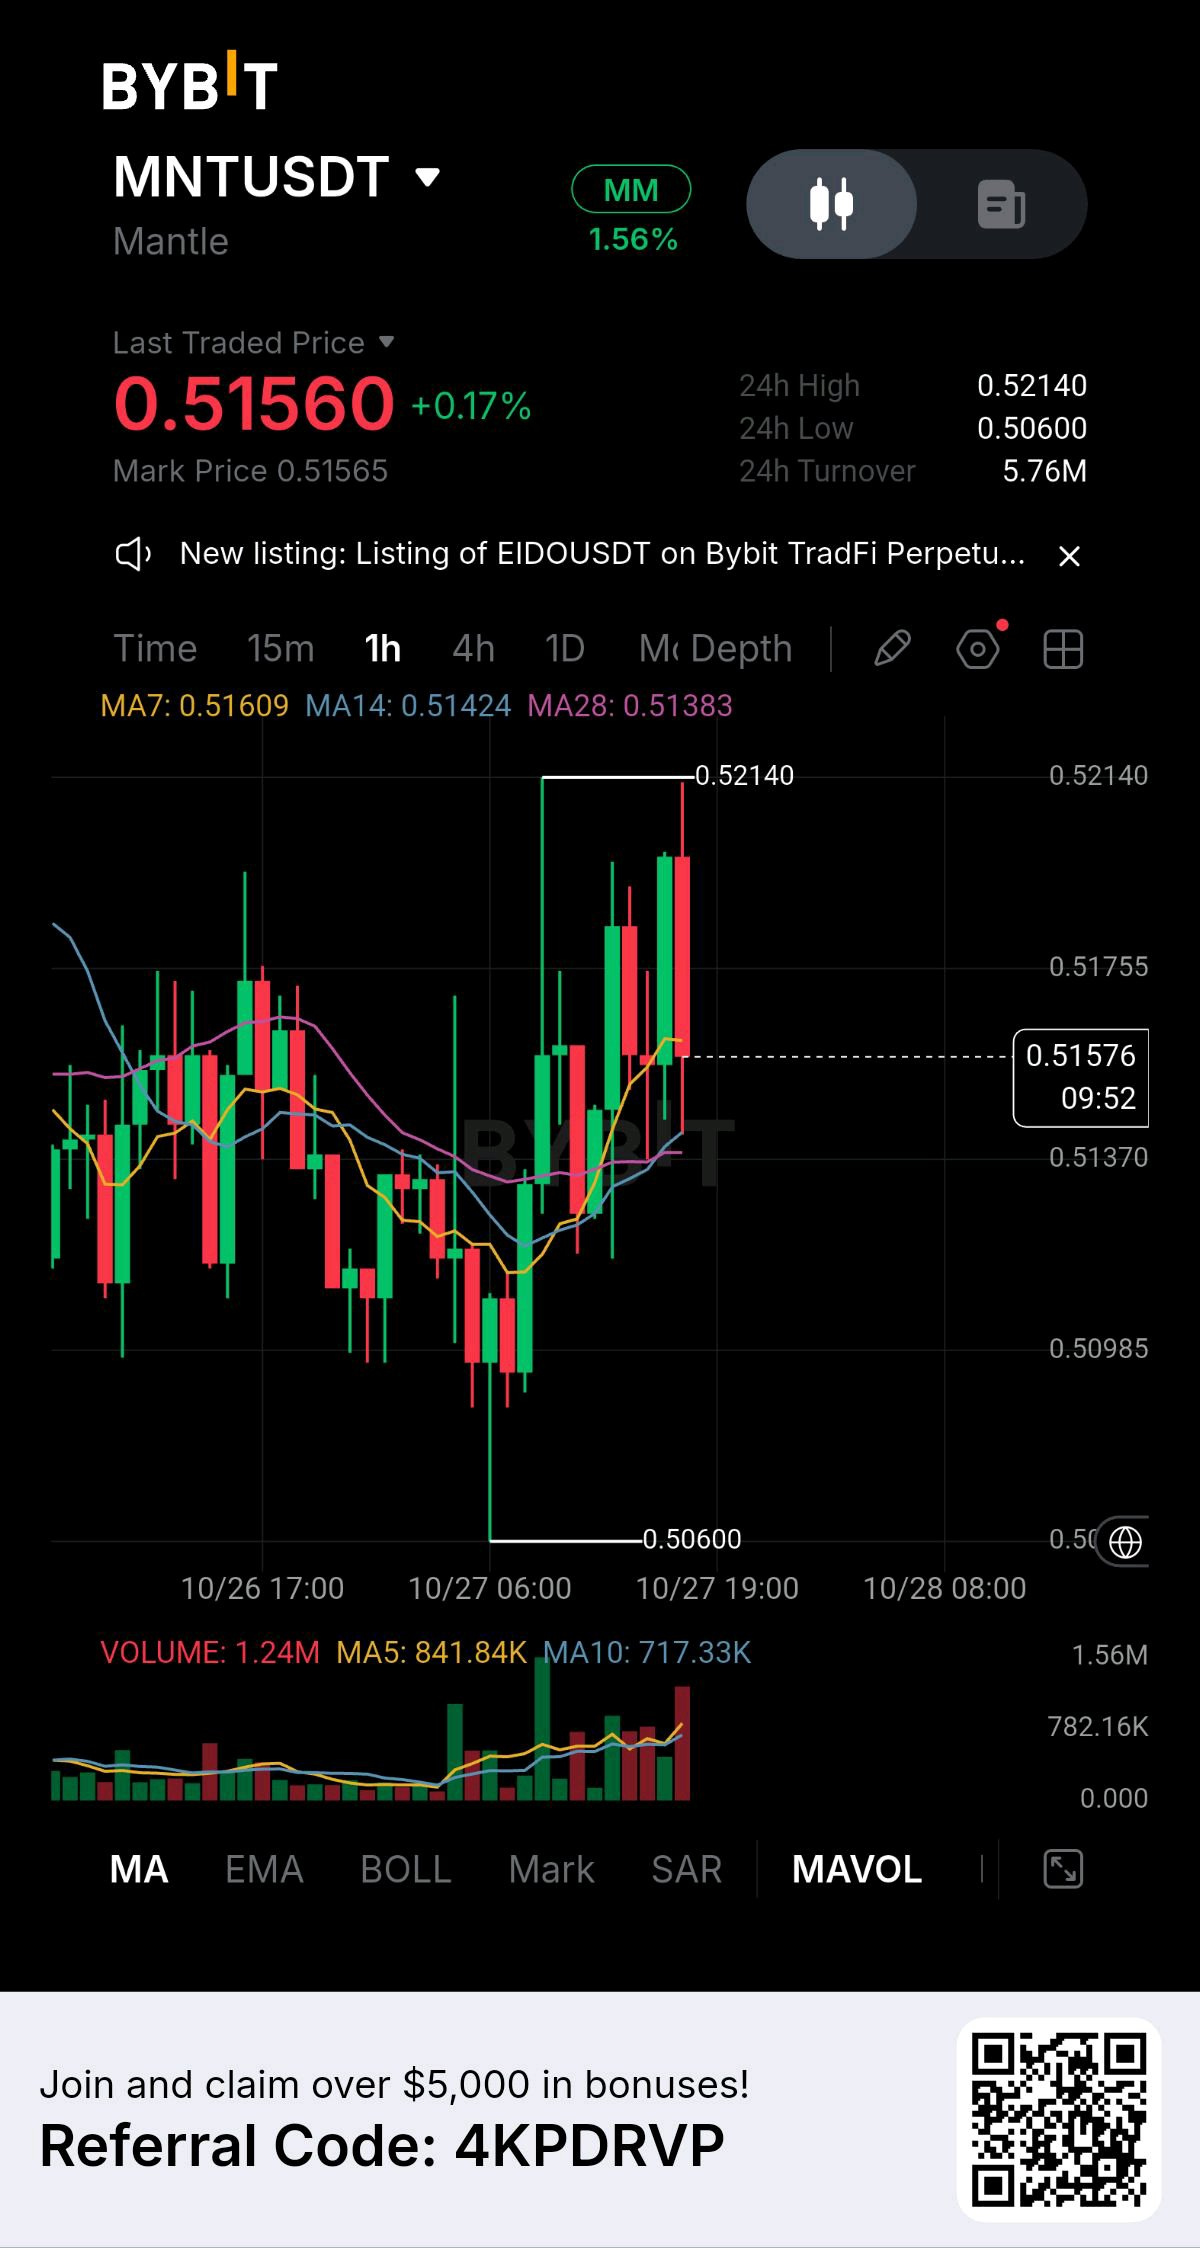
I’ve been watching the $MNTUSDT 1H structure closely, and the chart is showing an interesting battle between buyers defending the recovery and sellers protecting the $0.5214 resistance. MNT is currently trading around $0.5156 after pushing strongly upward from the $0.5060 area. What stands out to me is the way price recovered from the recent low and started printing stronger bullish candles. This tells me buyers have stepped back into the market, but the move is now reaching a level where confirmation becomes extremely important. The first major level I’m watching is $0.5214. This is the current 24H high and the clearest resistance on the chart. Price already tested this area and was rejected, so I would not treat $0.5214 as broken until buyers produce a convincing 1H candle close above it. The moving averages are also giving the recovery some structure. MA7 is around $0.51609, MA14 around $0.51424, and MA28 around $0.51383. The short-term averages are positioned above the longer average, which supports the idea that momentum has shifted toward the buyers. But I’m not ignoring the rejection. MNT is currently sitting slightly below MA7 after failing to hold the $0.5214 high. That makes the $0.5137–$0.5140 region important. If buyers defend this area and push price back above $0.5160, I would want to see another attempt toward $0.5214. A clean breakout above $0.5214, preferably supported by stronger volume, could open the door toward the next psychological resistance around $0.5250 and potentially higher levels if momentum continues. Volume is another important part of this setup. Current volume is around 1.24M, above the displayed MA5 volume of roughly 841.84K and MA10 volume of about 717.33K. That tells me the recent movement is receiving meaningful participation rather than happening on extremely thin activity. However, I would still avoid chasing the candle. If MNT loses $0.5137 and starts closing below that area, the bullish structure becomes weaker. The next levels I would watch are around $0.50985 and then the major recent low near $0.5060. So for me, this is a confirmation setup. Above $0.5214 with strong volume = breakout strength. Holding $0.5137–$0.5140 = buyers still have a chance to attack resistance again. Below $0.5137 = caution, because the recovery could start losing momentum. The chart is bullish in the short term, but the real proof comes from how MNT reacts at $0.5214. I want to see resistance become support before calling the next move a confirmed breakout. Less emotion. More structure. Less hype. Let the price action confirm the move.A useful next step would be to mark $0.5214 breakout, $0.5137 support, and the first take-profit zone directly on the chart so the setup is easier to understand. #ByXIMPACT
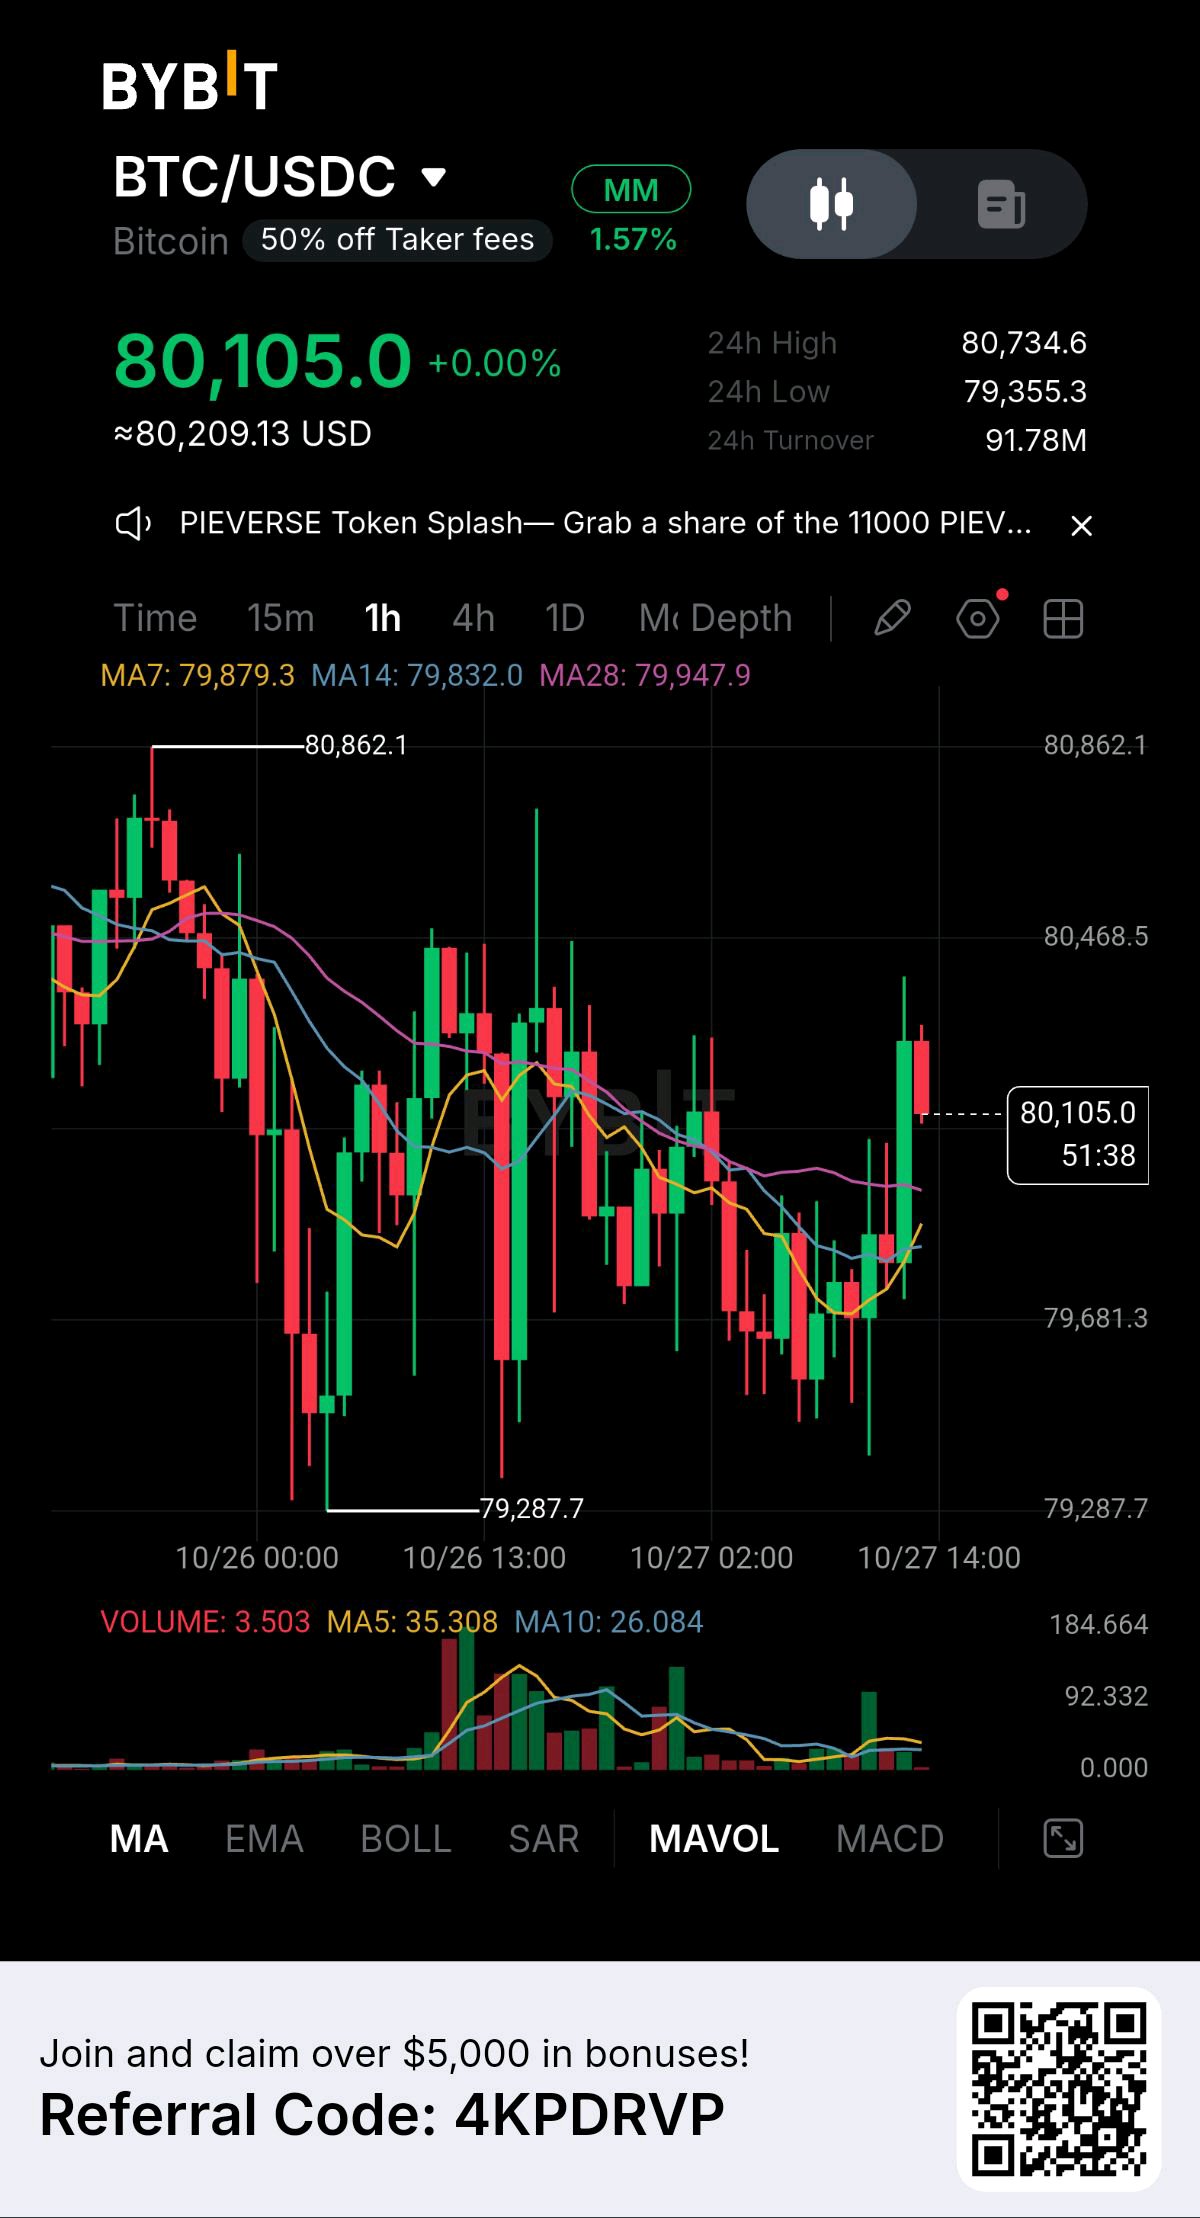
I’ve been watching the $BTCUSDT 1H chart closely, and the current structure is interesting because Bitcoin is sitting at a critical short-term decision area around $80,100. BTC is currently trading near $80,105 after recovering from the recent $79,287.7 low. What stands out to me is that buyers have managed to push price back above the short-term moving averages, but the latest rejection shows that the market still needs stronger confirmation before I would call this a clean bullish breakout. The moving averages are currently positioned around: MA7: $79,879 MA14: $79,832 MA28: $79,948 Price is trading above all three, which gives the short-term structure a slightly bullish advantage. More importantly, the recent recovery from below $79,700 shows that buyers are defending the lower part of the range instead of allowing another immediate breakdown. However, I’m not looking at this chart and assuming that every green candle means a continuation. The first level I’m watching is $80,100–$80,200. BTC is already testing this area, and the reaction here could determine the next move. If buyers can reclaim this zone decisively and hold it as support, the next important resistance comes around $80,468. Above $80,468, the next major area I’m watching is around $80,734, which is also close to the recent 24H high. A clean break above that level with increasing volume would give the bullish setup much more credibility. The bigger resistance on this chart is around $80,862.1. That is the previous visible high, and I would consider a move through this area much more significant than simply breaking $80,200. My bullish scenario is therefore simple: BTC needs to hold above the moving-average cluster, reclaim $80,200, break $80,468, and then challenge $80,734–$80,862. If volume expands during those breaks, it would suggest that buyers are actually taking control rather than price simply moving because of low liquidity. But there is another side to the chart. If BTC fails to hold above $80,000 and starts falling back below the MA7, MA14 and MA28 cluster, I would become more cautious. The first downside area I’m watching is around $79,681. A loss of that level could bring the market back toward the recent $79,287.7 low. That means I’m not chasing the current candle. The chart is giving a potential recovery structure, but confirmation is still important. The recent candles show buyers stepping in from the lower range, while volume has also picked up during some of the stronger moves. Still, I want to see sustained buying pressure rather than one sudden spike followed by another rejection. For me, the key battle is between $80,000 and $80,468. Above $80,468, momentum can strengthen toward $80,734 and potentially $80,862. Below $79,681, the bullish recovery becomes much weaker and the market could revisit $79,287. So right now, I’m watching the reaction, not predicting blindly. If buyers can turn the $80,000 area into support and push through the resistance levels with volume, BTC could be preparing for another attempt at the recent highs. If resistance continues to reject price, patience is more important than chasing the move. Less emotion. More structure. The next confirmed breakout matters more than the current candle.If you want, I can also turn this into a stronger 3,000-character ByX Impact version with an even more attention-grabbing opening while keeping the analysis realistic. #ByXIMPACT
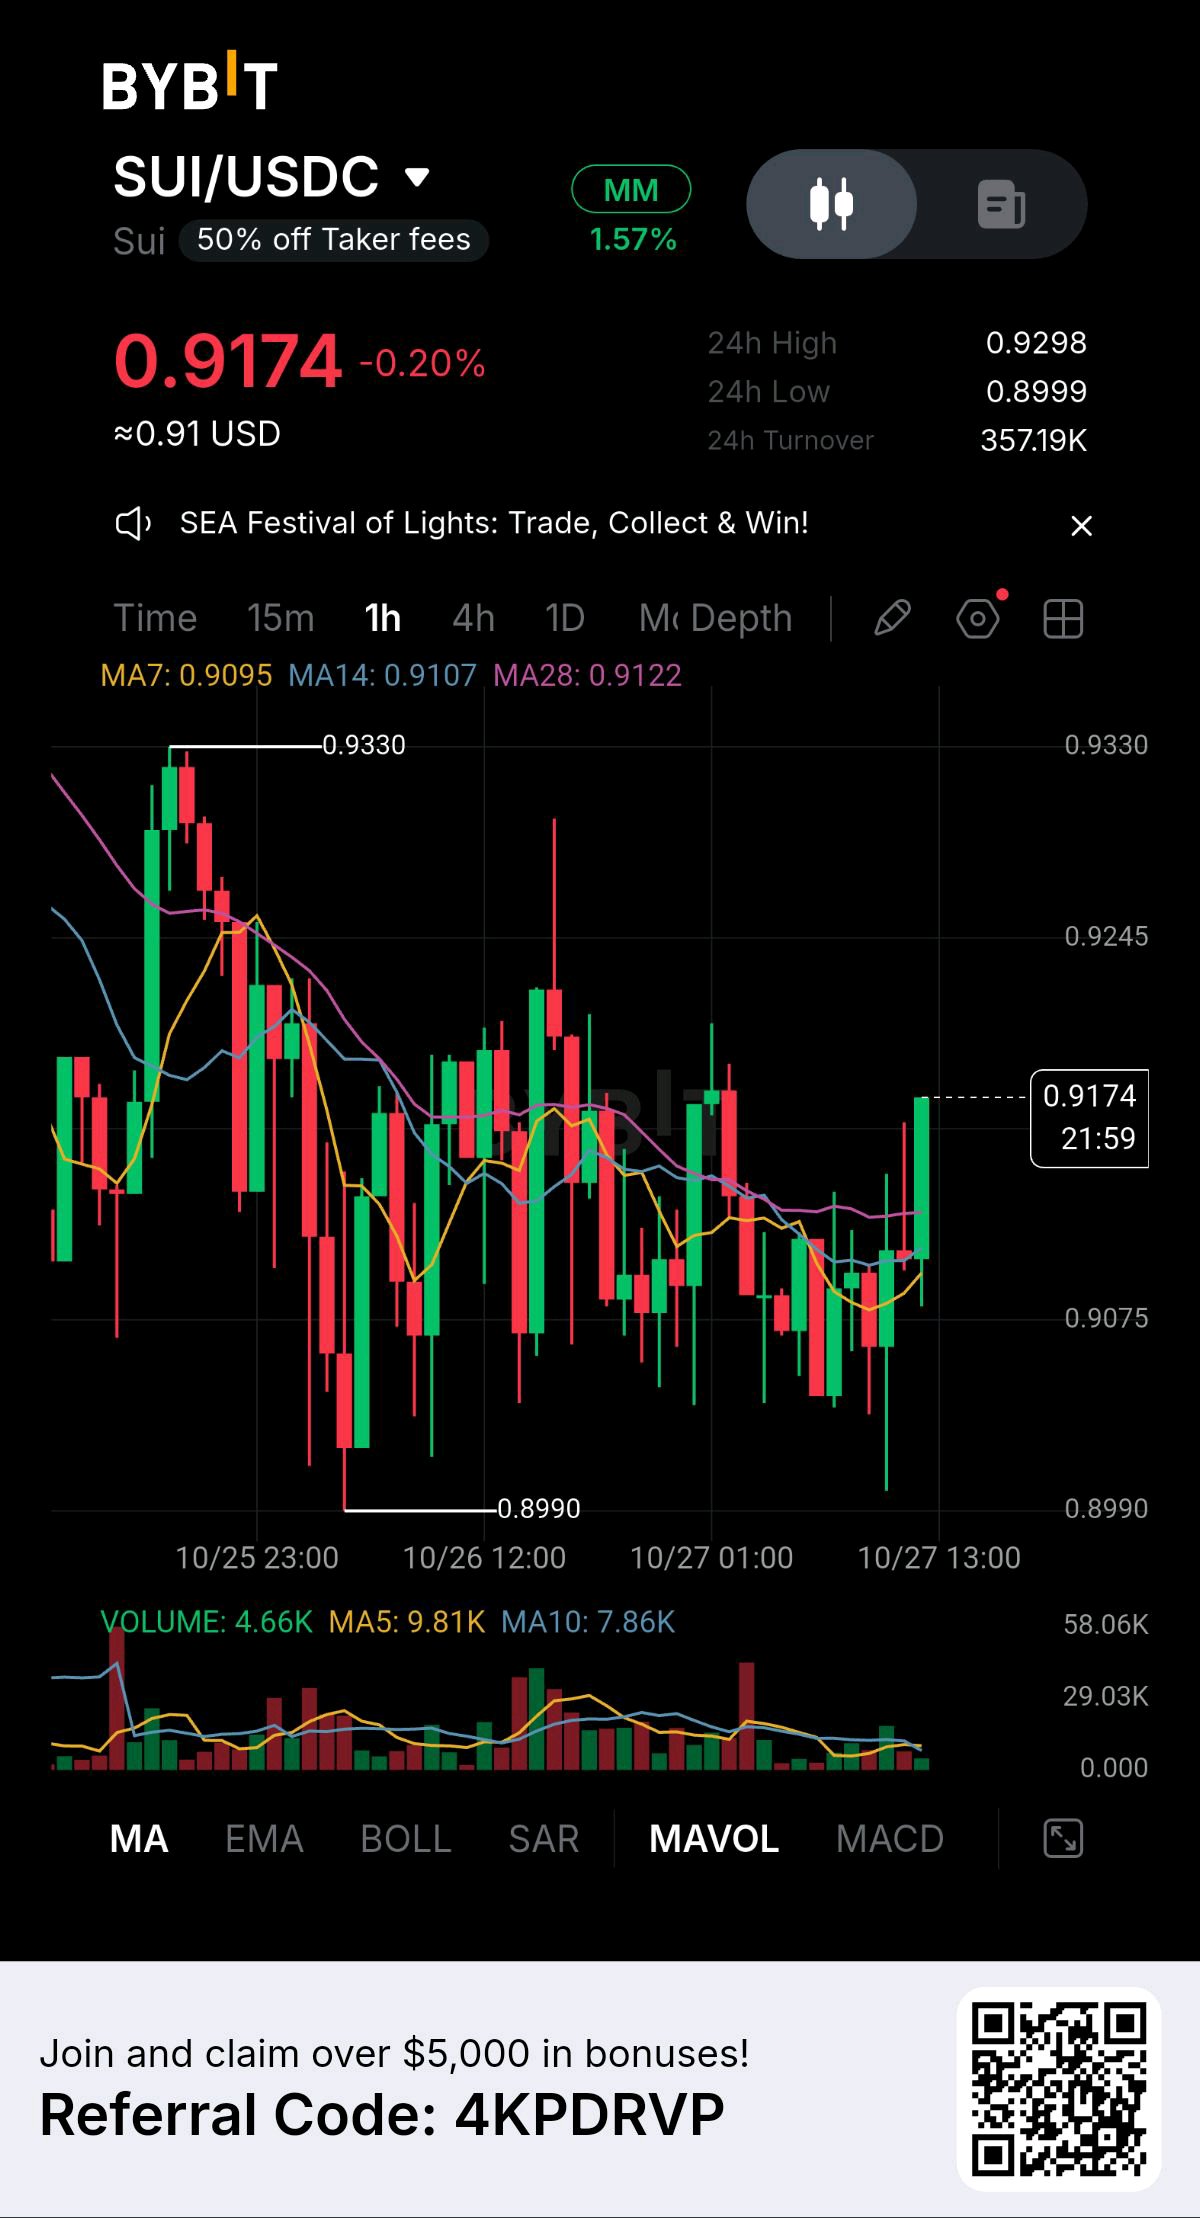
I’ve been watching this $SUIUSDT 1H chart closely, and what stands out to me right now is that price is trying to recover after spending a long period trapped inside a volatile range. SUI is currently around $0.9174, while the chart shows a recent low near $0.8990 and a previous high around $0.9330. That gives me a very clear range to work with. The market has tested the lower area several times, but sellers have not been able to maintain a clean breakdown below $0.8990. The latest candles are important. Price has pushed back above the $0.91 area and is currently trading around $0.9174. This is encouraging, but I would not call it a confirmed breakout yet. The move needs follow-through. The moving averages are also sitting close to the current price: MA7: $0.9095 MA14: $0.9107 MA28: $0.9122 SUI is now trading above all three short-term moving averages, which gives the recovery a better structure. However, the MA28 around $0.9122 is still an important level because price needs to remain above this area to show that buyers are actually gaining control rather than simply producing another temporary bounce. The first level I’m watching is $0.9170–$0.9200. If buyers can hold above this zone and produce a strong 1H close with increasing volume, the next important resistance comes around $0.9245. A clean break above $0.9245 would strengthen the bullish setup and could open a move toward $0.9298, followed by the major resistance around $0.9330. The $0.9330 level is the real test for me. That is where the previous upside move was rejected. If SUI reaches that area and breaks through it with strong buying volume, the market structure could shift much more decisively toward bullish continuation. But I’m also watching the downside carefully. The $0.9075 area is an important short-term support zone. If price falls back below it and starts closing candles underneath, the current recovery could lose momentum. Below that, $0.8990 becomes the critical support. A clean breakdown below $0.8990 would invalidate much of the current recovery idea and could signal that sellers are regaining control. Volume is another part I would not ignore. The current volume is around 4.66K, while the MA5 volume is around 9.81K and MA10 around 7.86K. That tells me the latest recovery still needs stronger participation. Price moving higher without meaningful volume is not enough evidence for me to chase the move. So my approach here is simple: I’m not chasing the green candle. I want to see SUI hold above $0.9120–$0.9170, then break $0.9245 with convincing volume. If that happens, $0.9298 and $0.9330 become the next areas I would watch. If buyers fail and price loses $0.9075, I would become more cautious. Losing $0.8990 would be a much stronger bearish signal. For me, SUI is currently at a decision point. The recovery is visible, but confirmation is still needed. Less emotion. More structure. Less hype. More confirmation.If you want, I can also turn this into a much stronger 3,000-character ByX Impact version designed to attract attention while keeping the analysis natural. #ByXIMPACT
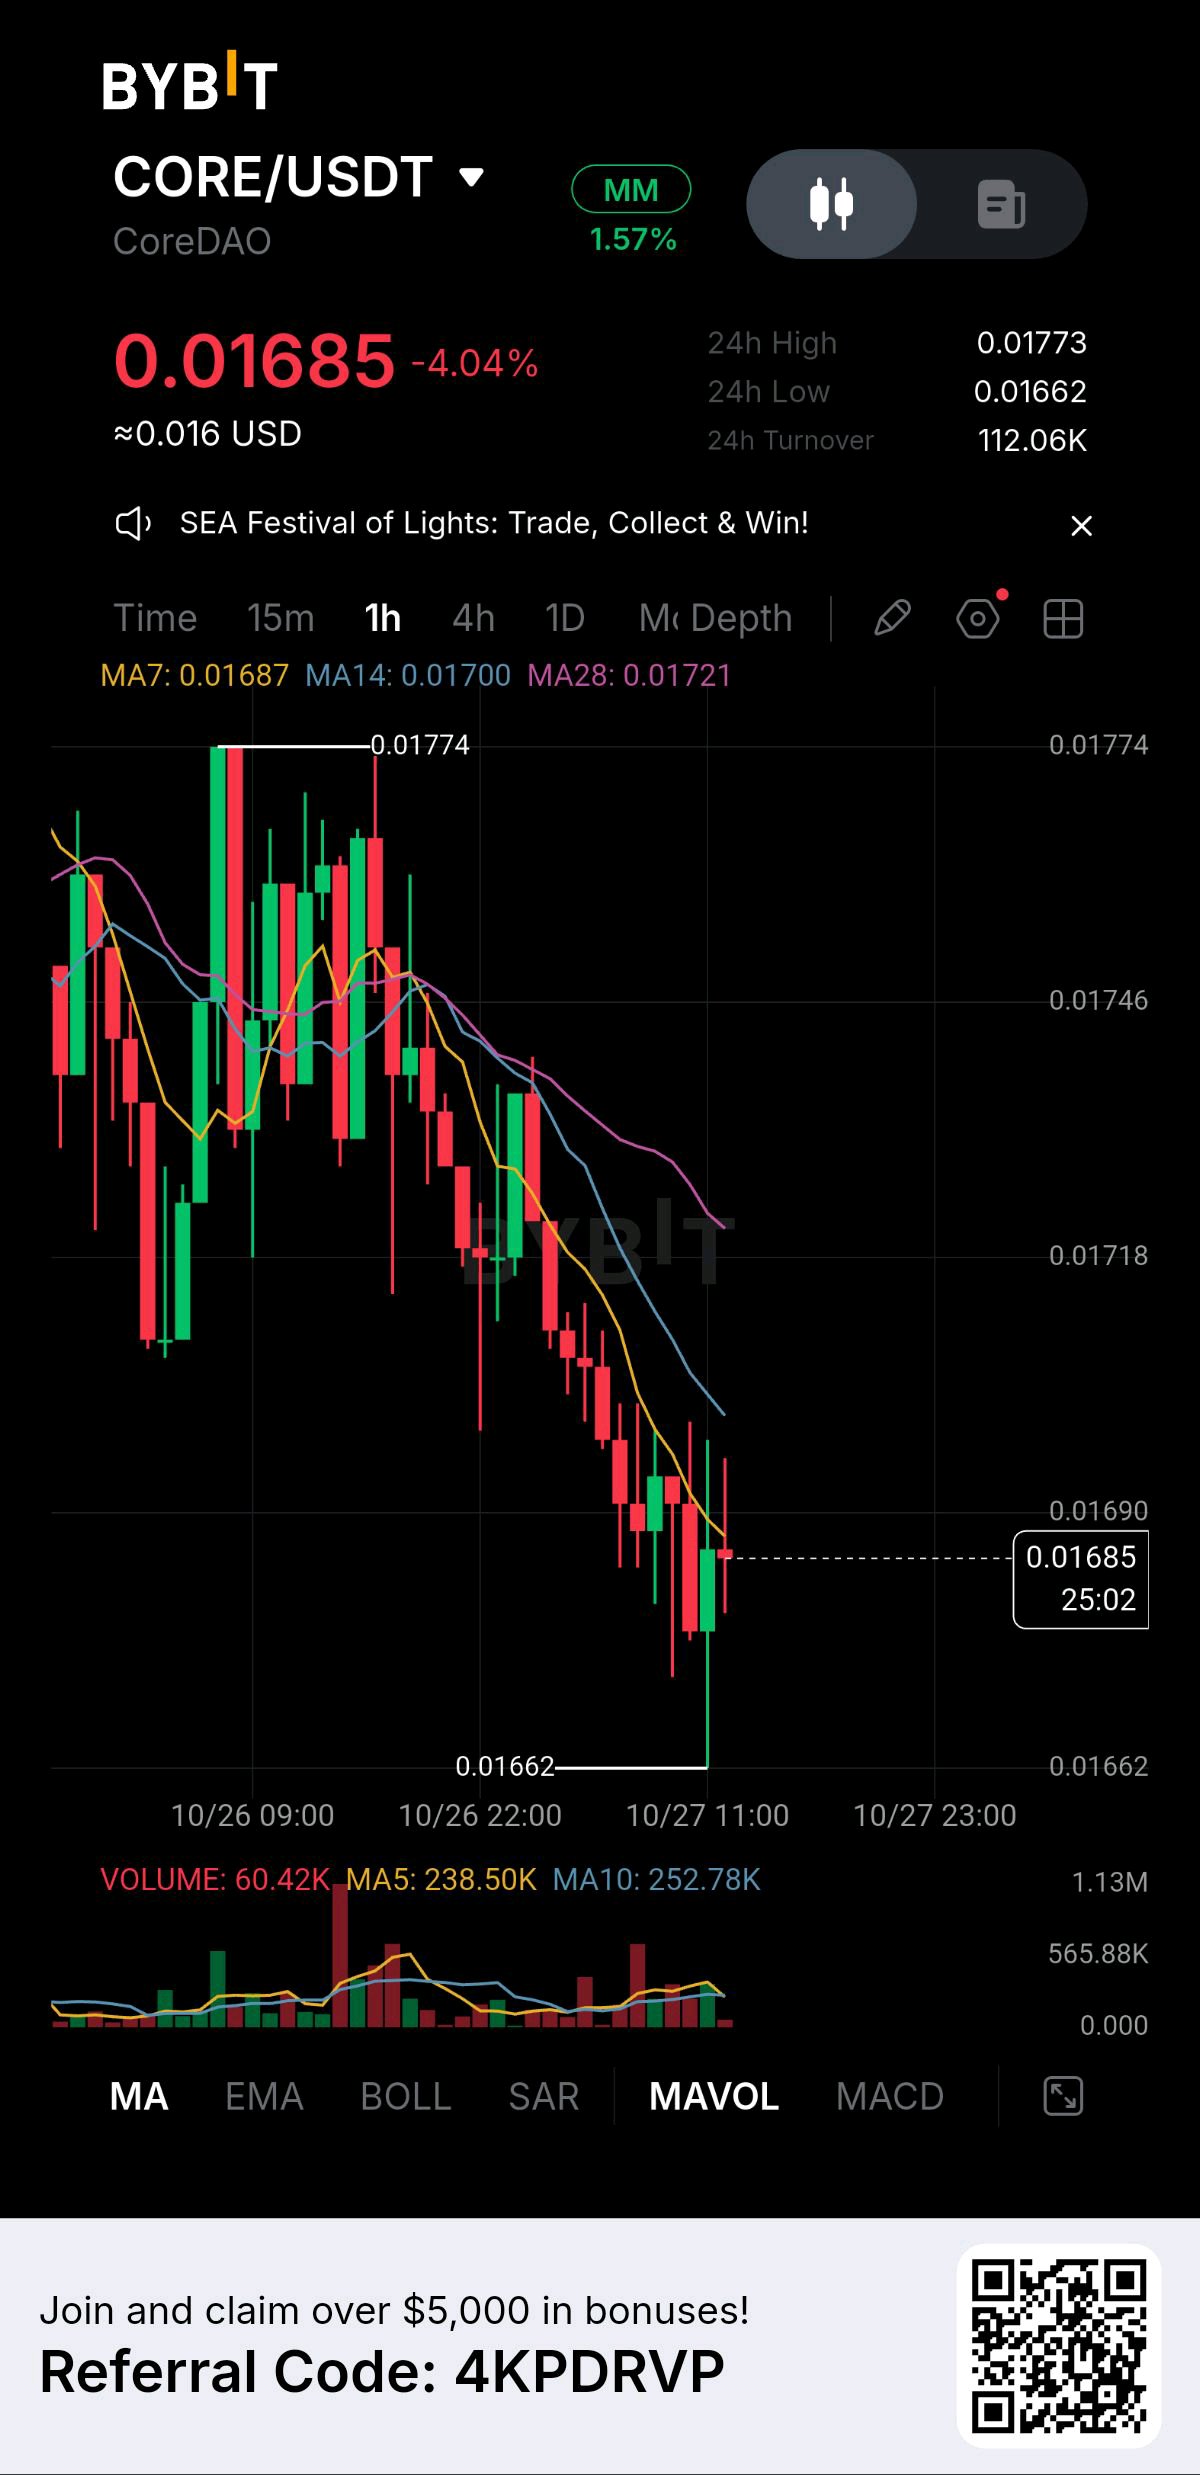
I’ve been watching the $COREUSDT 1H structure closely, and the chart is currently showing weakness rather than a confirmed reversal. Price is sitting around $0.01685 after falling approximately 4.04%, and the most important thing I’m watching now is whether buyers can defend the recent low or whether the selling pressure pushes CORE into another leg lower. The chart shows a clear short-term downward structure. After reaching the $0.01774 area, price started forming lower highs and lower lows. Each recovery attempt has been met with selling, which tells me that buyers are still struggling to regain control. The immediate support I’m watching is $0.01662. This is the current 24H low and also the lowest visible point on the recent structure. Price has already reacted from this area, which makes it an important decision zone. If $0.01662 holds, I would want to see a stronger recovery above $0.01690 first. That would be the first sign that buyers are beginning to absorb the selling pressure. Above $0.01690, the next level I’m watching is $0.01700. A clean move through this level could open the way toward $0.01718–$0.01721, where the MA28 is currently positioned around $0.01721. The moving averages are also giving an important warning. MA7 is around $0.01687, MA14 is around $0.01700, and MA28 is around $0.01721. Price is currently below the MA14 and MA28, while the averages are positioned above price like resistance. Until CORE can reclaim these levels, I would not treat a small bounce as a confirmed trend reversal. The volume picture is another reason I’m staying cautious. Current volume is around 60.42K, while the MA5 volume is approximately 238.50K and MA10 volume is around 252.78K. That means the current bounce does not yet have strong volume confirmation behind it. For me, the real confirmation would come from price reclaiming $0.01700 and then breaking above $0.01721 with noticeably stronger volume. If that happens, the structure could start changing from lower highs into a more meaningful recovery. Above $0.01721, I would watch $0.01746 as the next resistance zone, followed by the major recent high around $0.01774. A break above $0.01774 would be much stronger evidence that buyers have completely shifted the short-term structure. But there is another side to this setup. If CORE fails to hold $0.01662 and breaks below that level with strong selling volume, the current recovery attempt could fail completely and the market may search for lower support. That is why I would not chase a green candle simply because price bounces from the low. My current read is simple: CORE is at a decision point. $0.01662 is the level buyers need to defend. $0.01690 is the first recovery level. $0.01700 is the next confirmation area. $0.01721 is the key moving-average resistance. $0.01746 is the next major barrier. $0.01774 is the major breakout level. Until CORE proves strength above these resistance levels, I’m treating the current move as a possible relief bounce inside a weak 1H structure rather than calling it a confirmed bullish reversal. The chart does not need hype right now. It needs confirmation. If buyers return with real volume and reclaim the resistance levels one by one, the setup can change quickly. If they fail to defend $0.01662, the bearish structure remains in control. For me, the next candle closes and the volume response around $0.01662–$0.01700 are the areas worth watching most closely.A useful next step would be to mark $0.01662 support, $0.01700 confirmation, and $0.01721 breakout resistance directly on the chart so the setup is easier to read at a glance. #ByXIMPACT
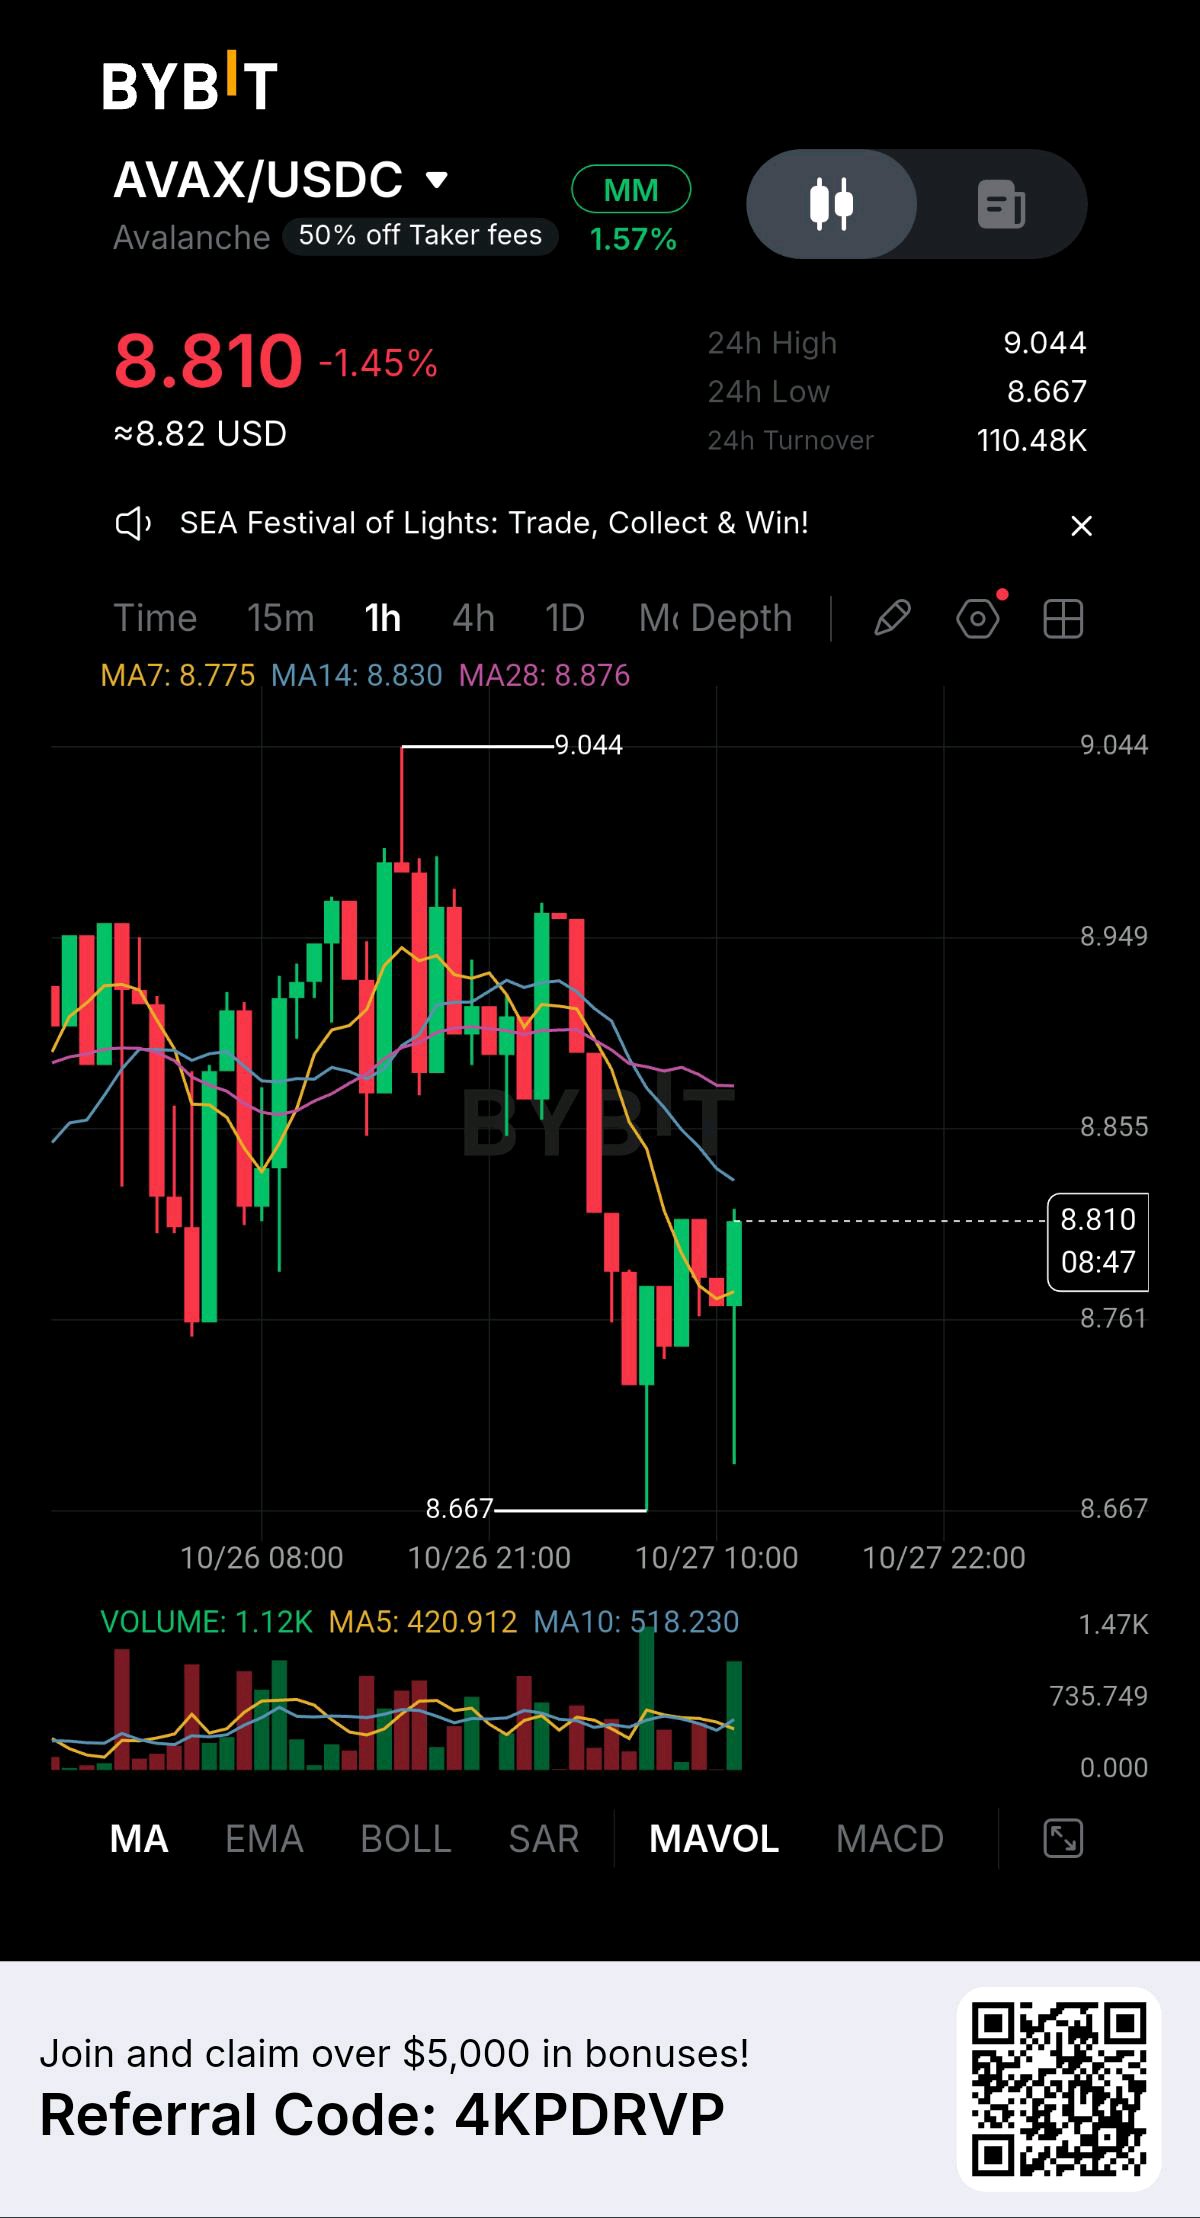
I’ve watched the price action closely, and $AVAXUSDT is currently sitting at a critical short-term decision zone. Price is around $8.81, down about 1.45%, after dropping from the $9.044 high and finding strong buying interest near the $8.667 low. The first thing I’m watching is the reaction from $8.67–$8.76. Buyers stepped in aggressively from this area, creating a sharp lower wick and pushing price back toward $8.81. That tells me there is demand underneath the current price, but the recovery is not confirmed yet. The moving averages are still giving a cautious signal: MA7: $8.775 MA14: $8.830 MA28: $8.876 AVAX has reclaimed the MA7, but price is still below the MA14 and MA28. That means the market is attempting a recovery, but sellers still have control of the broader 1H structure until those levels are reclaimed. The first resistance I’m watching is $8.83. A clean 1H close above this level would be important because it would put price back above the MA14. From there, $8.88–$8.90 becomes the next major test around the MA28 and previous price congestion. If buyers can push through $8.90, the next upside area is around $8.95, followed by the major resistance at $9.044. A breakout above $9.044 would significantly strengthen the bullish recovery structure. But I would not ignore the downside. The key support zone is $8.67–$8.76. If AVAX loses $8.76 and especially breaks below $8.667, the recent bounce could turn into another continuation of the bearish move. Volume is also important here. The latest volume spike shows increased activity around the rebound, but I want to see stronger buying volume accompanying a move above $8.83–$8.88 before calling this a confirmed reversal. For me, this is a confirmation zone, not a chasing zone. Bullish scenario: $8.76 holds → reclaim $8.83 → break $8.88–$8.90 → test $8.95 → possible retest of $9.044. Bearish scenario: Failure below $8.83 → rejection from $8.88 → loss of $8.76 → retest of $8.667. The most important thing on this chart is whether buyers can turn the recent bounce into a real structure recovery. $8.83 is the first battle. $8.90 is the confirmation area. $9.044 is the major breakout level. For now, I’m watching the reaction at these levels rather than assuming the bounce is already a reversal. #ByXIMPACT
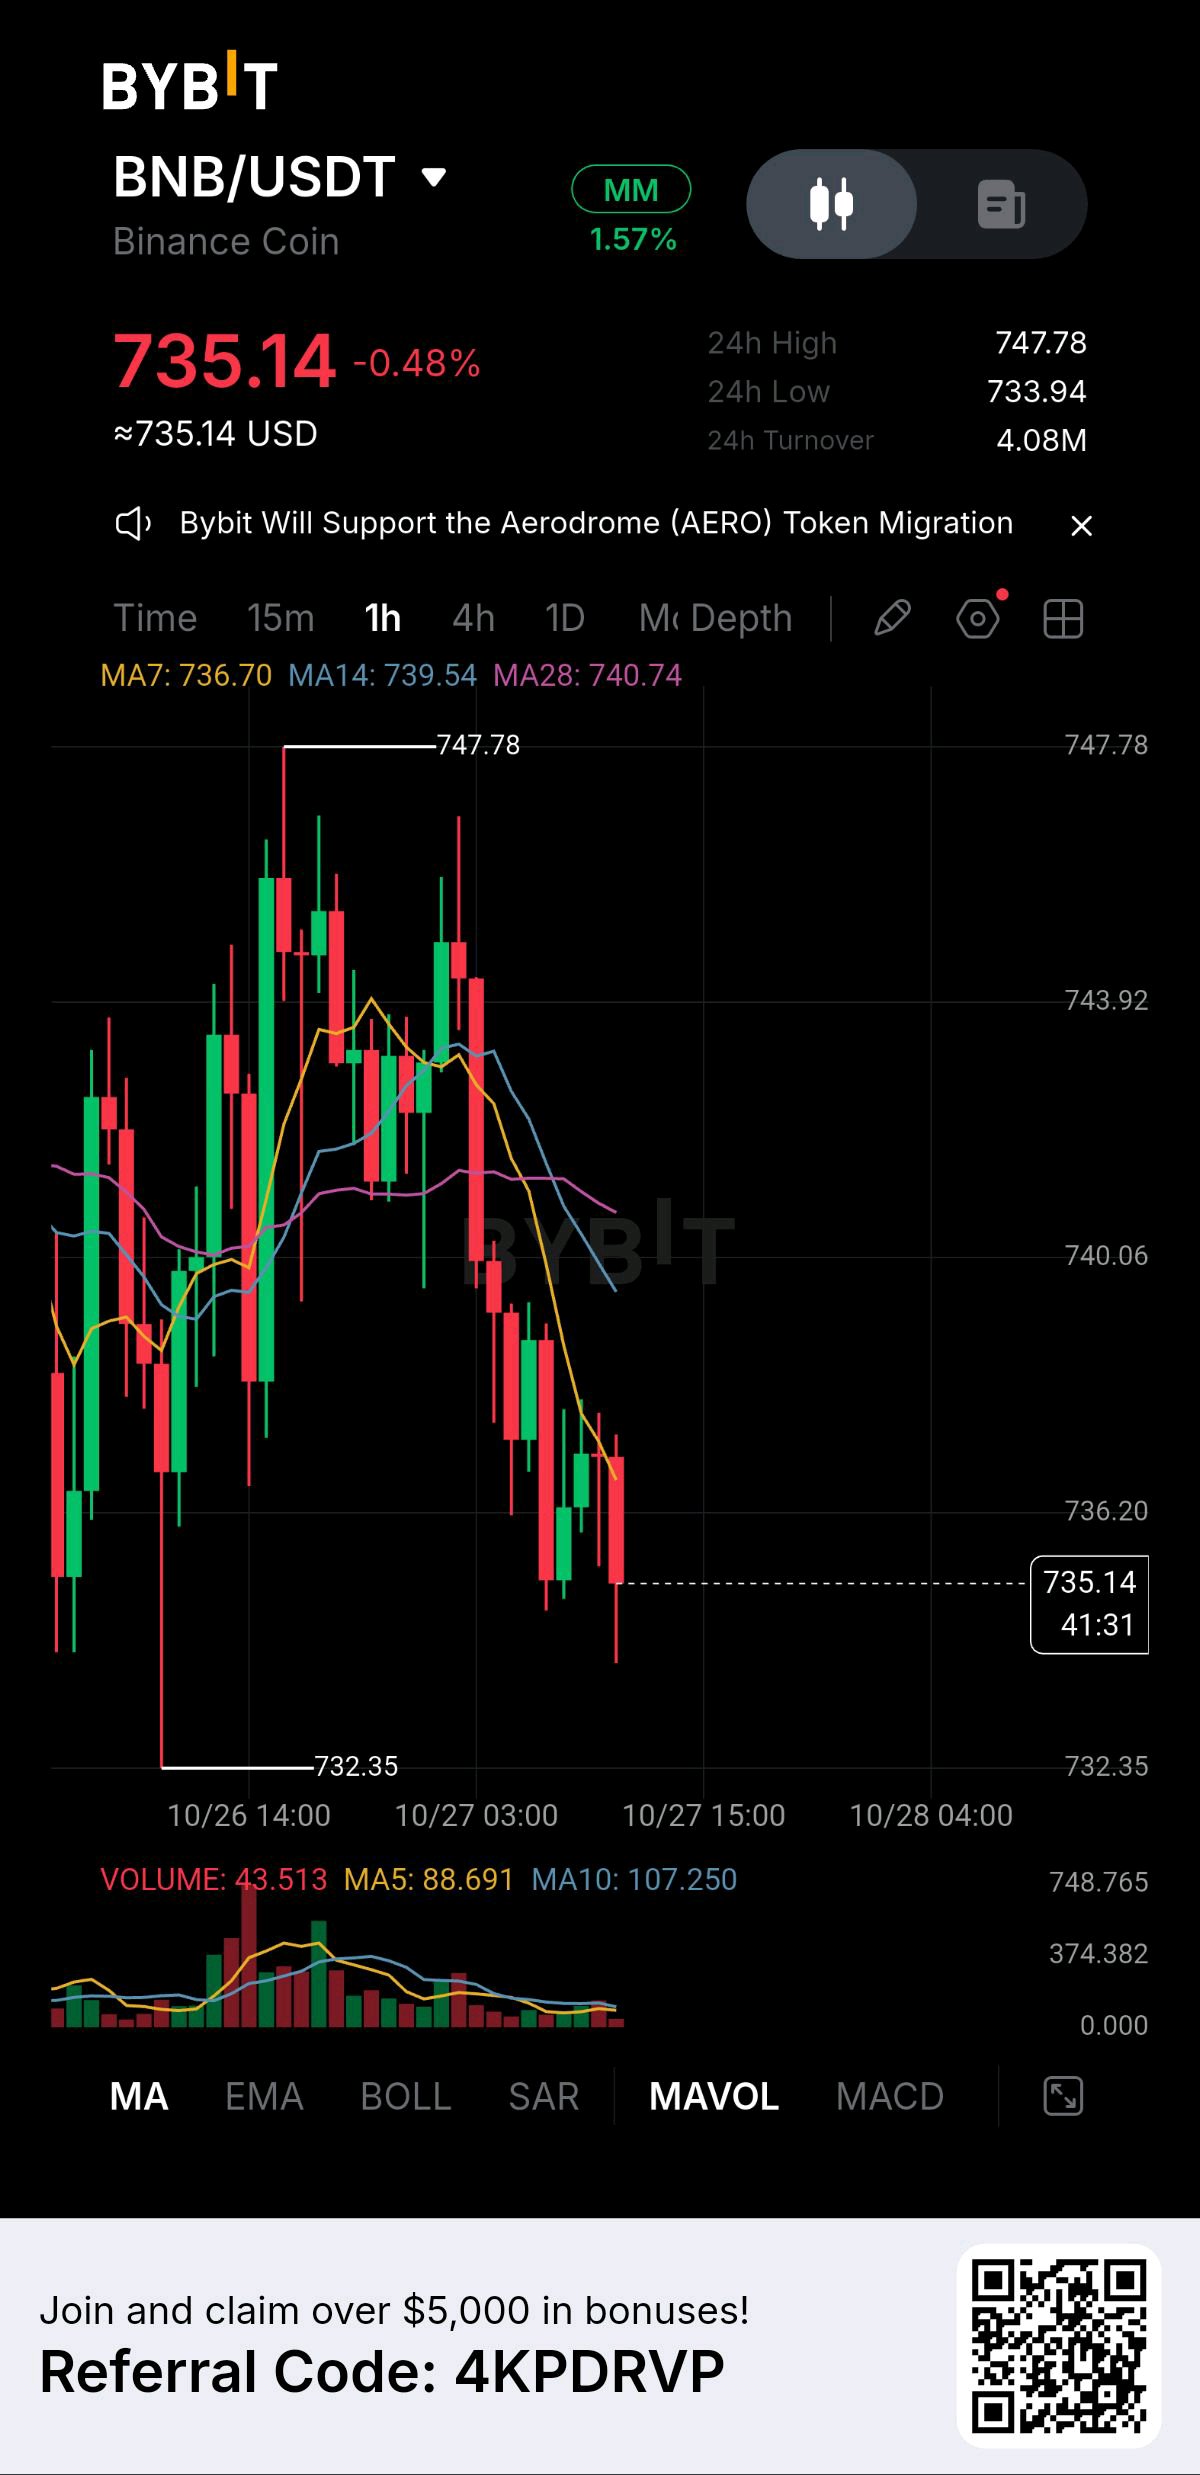
I’ve been watching the BNB chart closely, and the current structure is showing short-term weakness. BNB is trading around $735.14 after failing to maintain the momentum from the $747.78 high. The most important thing I’m watching right now is how price reacts around the $733.94–$732.35 support zone. This area has already attracted buyers, but the recent candles are still showing selling pressure, so I would not treat this support as guaranteed. The moving averages are also giving the chart a cautious signal. MA7 is around $736.70, MA14 around $739.54, and MA28 around $740.74. Price is currently below all three, which means sellers have short-term control and BNB needs to reclaim these levels before the structure starts looking stronger. For me, $736.70 is the first level to watch. A strong 1H close back above it could indicate that buyers are beginning to recover control. Above that, $739.54–$740.74 becomes the next major decision area. If BNB can reclaim and hold this zone with increasing volume, the next upside levels I would watch are around $743.92 and then $747.78. But there is another side to this setup. If BNB fails to reclaim $736–$740 and sellers push price below $733.94, the $732.35 low becomes extremely important. A clean breakdown below $732.35 could open the door to further downside and confirm that the recent recovery was only a temporary bounce. Volume is also something I would not ignore. Current volume is below the short-term volume averages shown on the chart, so the latest move does not yet have strong confirmation. I would rather see volume expand with the breakout than chase a weak candle. My approach here is simple: don’t chase the move. Let price prove its direction. Bullish confirmation: reclaim $736.70, then $739.54–$740.74 with stronger volume. Upside levels: $743.92 → $747.78. Bearish confirmation: lose $733.94, followed by a break below $732.35. Right now, BNB is at a decision point. The next strong 1H candle could reveal whether buyers are ready to defend support or sellers are preparing for another leg lower. I’m watching the confirmation, not guessing the next candle.A useful next step would be to mark $732.35 support, $740.74 resistance, and the potential take-profit levels directly on this chart for a cleaner ByX Impact post. #ByXIMPACT
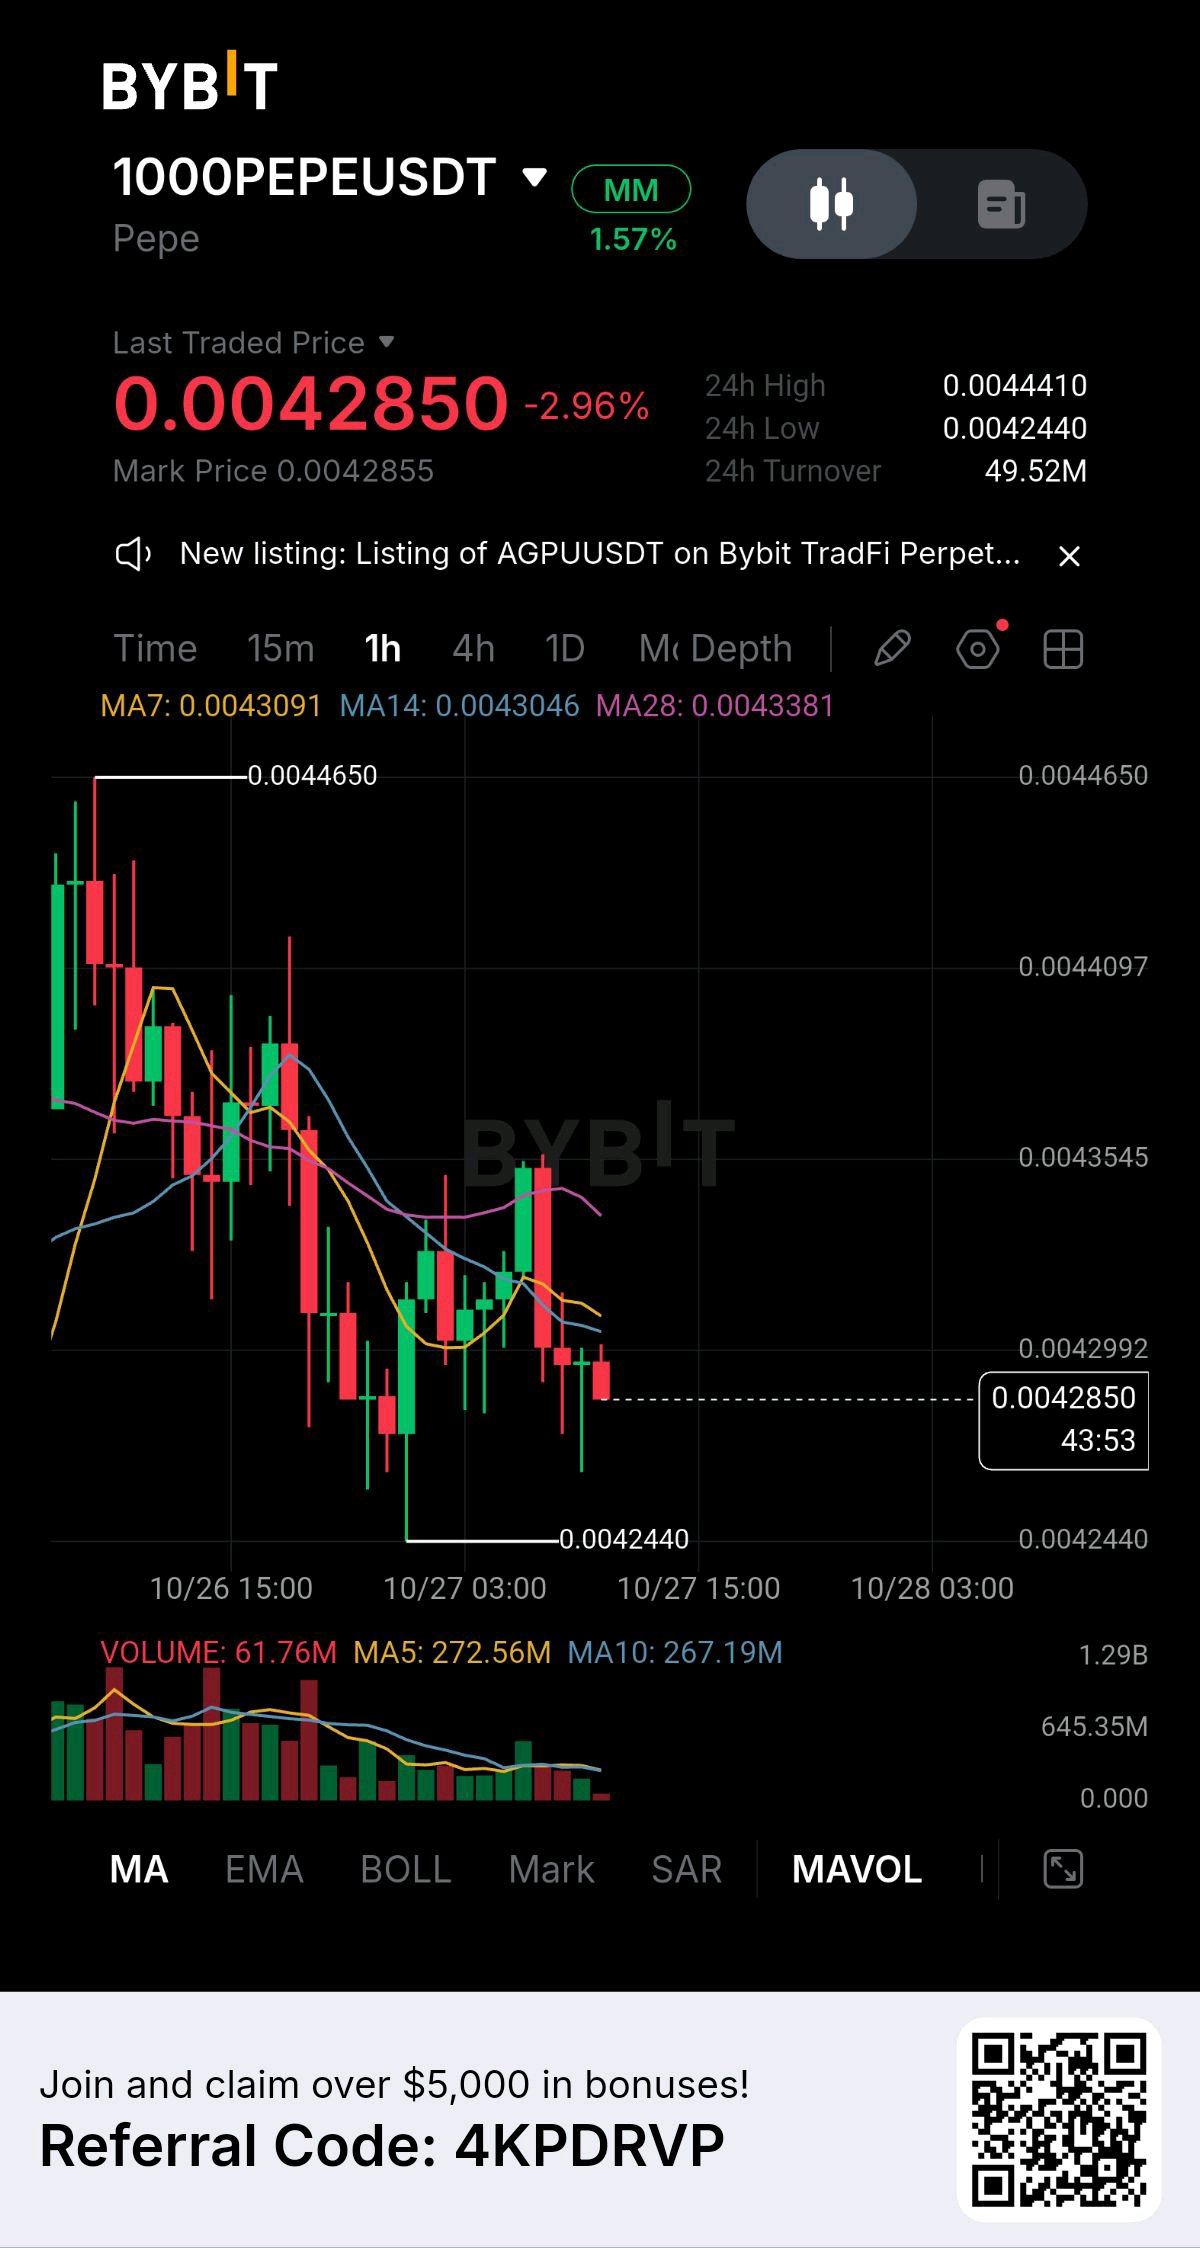
I’ve been watching this $PEPEUSDT setup closely, and the chart is currently showing a clear battle between sellers defending the upper levels and buyers trying to protect the recent low. PEPE is trading around $0.0042850, down roughly 2.96%, and the short-term structure is still under pressure. Price is sitting below the MA7 at $0.0043091, MA14 at $0.0043046, and MA28 at $0.0043381. That alignment tells me buyers have not yet regained enough strength to take control of the 1H trend. The most important level on the downside is $0.0042440. That is the recent 24H low and the clearest support visible on this chart. If buyers defend this area and start producing stronger green candles with increasing volume, I would watch for a recovery back toward $0.0042992 first. But I would not call the move bullish simply because price bounces from support. The first real test is $0.0042992. PEPE needs to reclaim this level and hold above it instead of getting rejected immediately. A strong 1H close above $0.0042992 would improve the short-term structure and could open the door toward $0.0043381, where the MA28 is currently sitting. Above that, the next major resistance zone is around $0.0043545. This level matters because it sits directly inside the previous price structure. If buyers can break through it with convincing volume, the recovery becomes much more interesting. The next upside levels I would monitor are approximately $0.0044097 and then $0.0044410, which is close to the recent high. However, there is still an important warning on the chart. Volume is currently around 61.76M, while the displayed MA5 and MA10 volume averages are much higher at approximately 272.56M and 267.19M. That means the current move does not yet have the kind of volume expansion I would want to see for a convincing breakout. So for me, this is not a “chase the candle” setup. The better signal would be PEPE holding $0.0042440, forming a stronger higher low, then reclaiming $0.0042992 with increasing volume. If that happens, momentum could shift back toward the resistance levels above. On the other hand, if $0.0042440 fails decisively and sellers push price below that support with strong volume, the current recovery attempt would weaken considerably and I would expect further downside pressure before considering another bullish setup. My key levels: Support: $0.0042440 First resistance: $0.0042992 MA resistance: $0.0043046–$0.0043381 Major resistance: $0.0043545 Next upside level: $0.0044097 Recent high: $0.0044410 The message from this chart is simple: PEPE is at a decision point. Buyers need to defend the low and reclaim the moving-average zone. Sellers still have the advantage until that happens. I’m watching the reaction around $0.0042440–$0.0042992 very closely. The breakout only becomes convincing when price proves it can hold above resistance and volume confirms the move.A useful next step would be to mark the support, breakout level, and upside targets directly on the chart so the setup is easier to follow. #ByXIMPACT
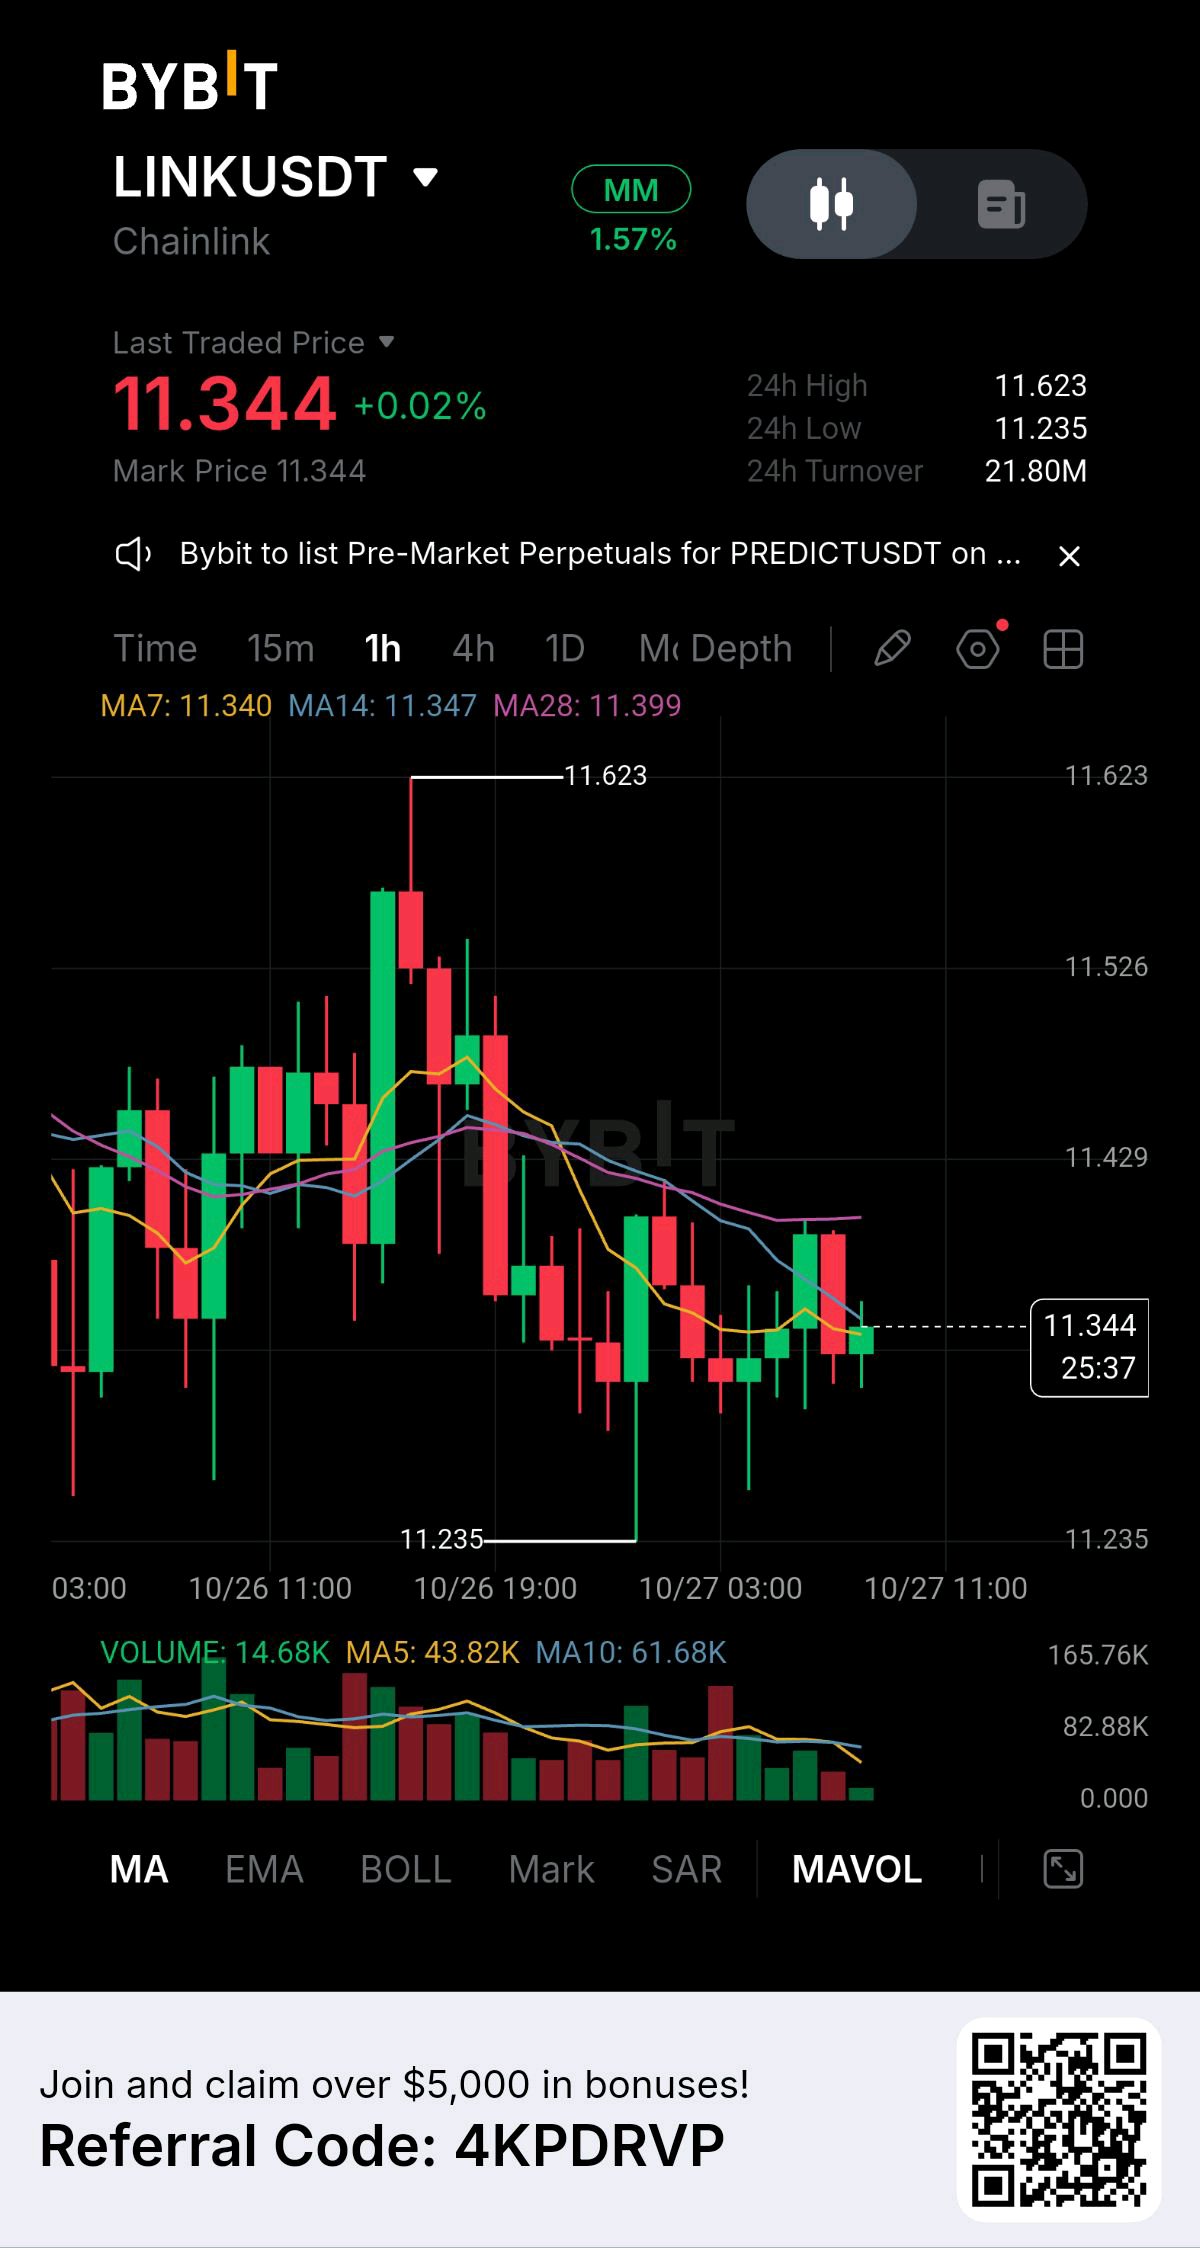
I’ve been watching the $LINKUSDT 1H chart closely, and the current structure is showing a market that is trying to stabilize after a sharp rejection from the $11.623 high. LINK is currently trading around $11.344. The important thing for me here is that price is sitting almost directly around the short-term moving averages, which means the market has not established a clear direction yet. The MA7 is around $11.340, MA14 is $11.347, while the MA28 is higher at $11.399. This tells me short-term momentum is relatively flat, but LINK is still trading below the stronger MA28 resistance. Until price can reclaim that area, I would not call this a confirmed bullish reversal. The first level I’m watching is $11.399–$11.429. This is the area where LINK needs to show real strength. A clean 1H candle close above this zone, preferably supported by increasing volume, would give buyers a much stronger position. If buyers successfully reclaim $11.429, the next resistance I’m watching is around $11.526. Above that, the major recent high at $11.623 becomes the key target and decision point. But there is another side to this setup. The chart is currently showing relatively weak volume. Current volume is around 14.68K, while the MA5 volume is approximately 43.82K and MA10 volume is around 61.68K. That tells me the recent movement is not yet supported by strong participation. So I would not chase a small green candle here. For me, the more important support zone is around $11.300–$11.235. The $11.235 low is especially important because it represents the recent downside extreme. If LINK continues holding above this area and starts producing higher lows, buyers could gradually regain control. The bullish scenario is simple: hold above $11.30, reclaim $11.399–$11.429, confirm the breakout with stronger volume, and then push toward $11.526 and potentially $11.623. The bearish scenario is equally important: repeated rejection below $11.399–$11.429 followed by a breakdown under $11.235 would invalidate the current recovery structure and indicate that sellers are still controlling the market. Right now, I see this as a decision zone rather than a confirmed breakout. I’m watching the reaction around $11.399 very carefully. If buyers can turn that resistance into support with volume behind the move, the structure could shift significantly. Less emotion, more structure. Less hype, more confirmation. #ByXIMPACT
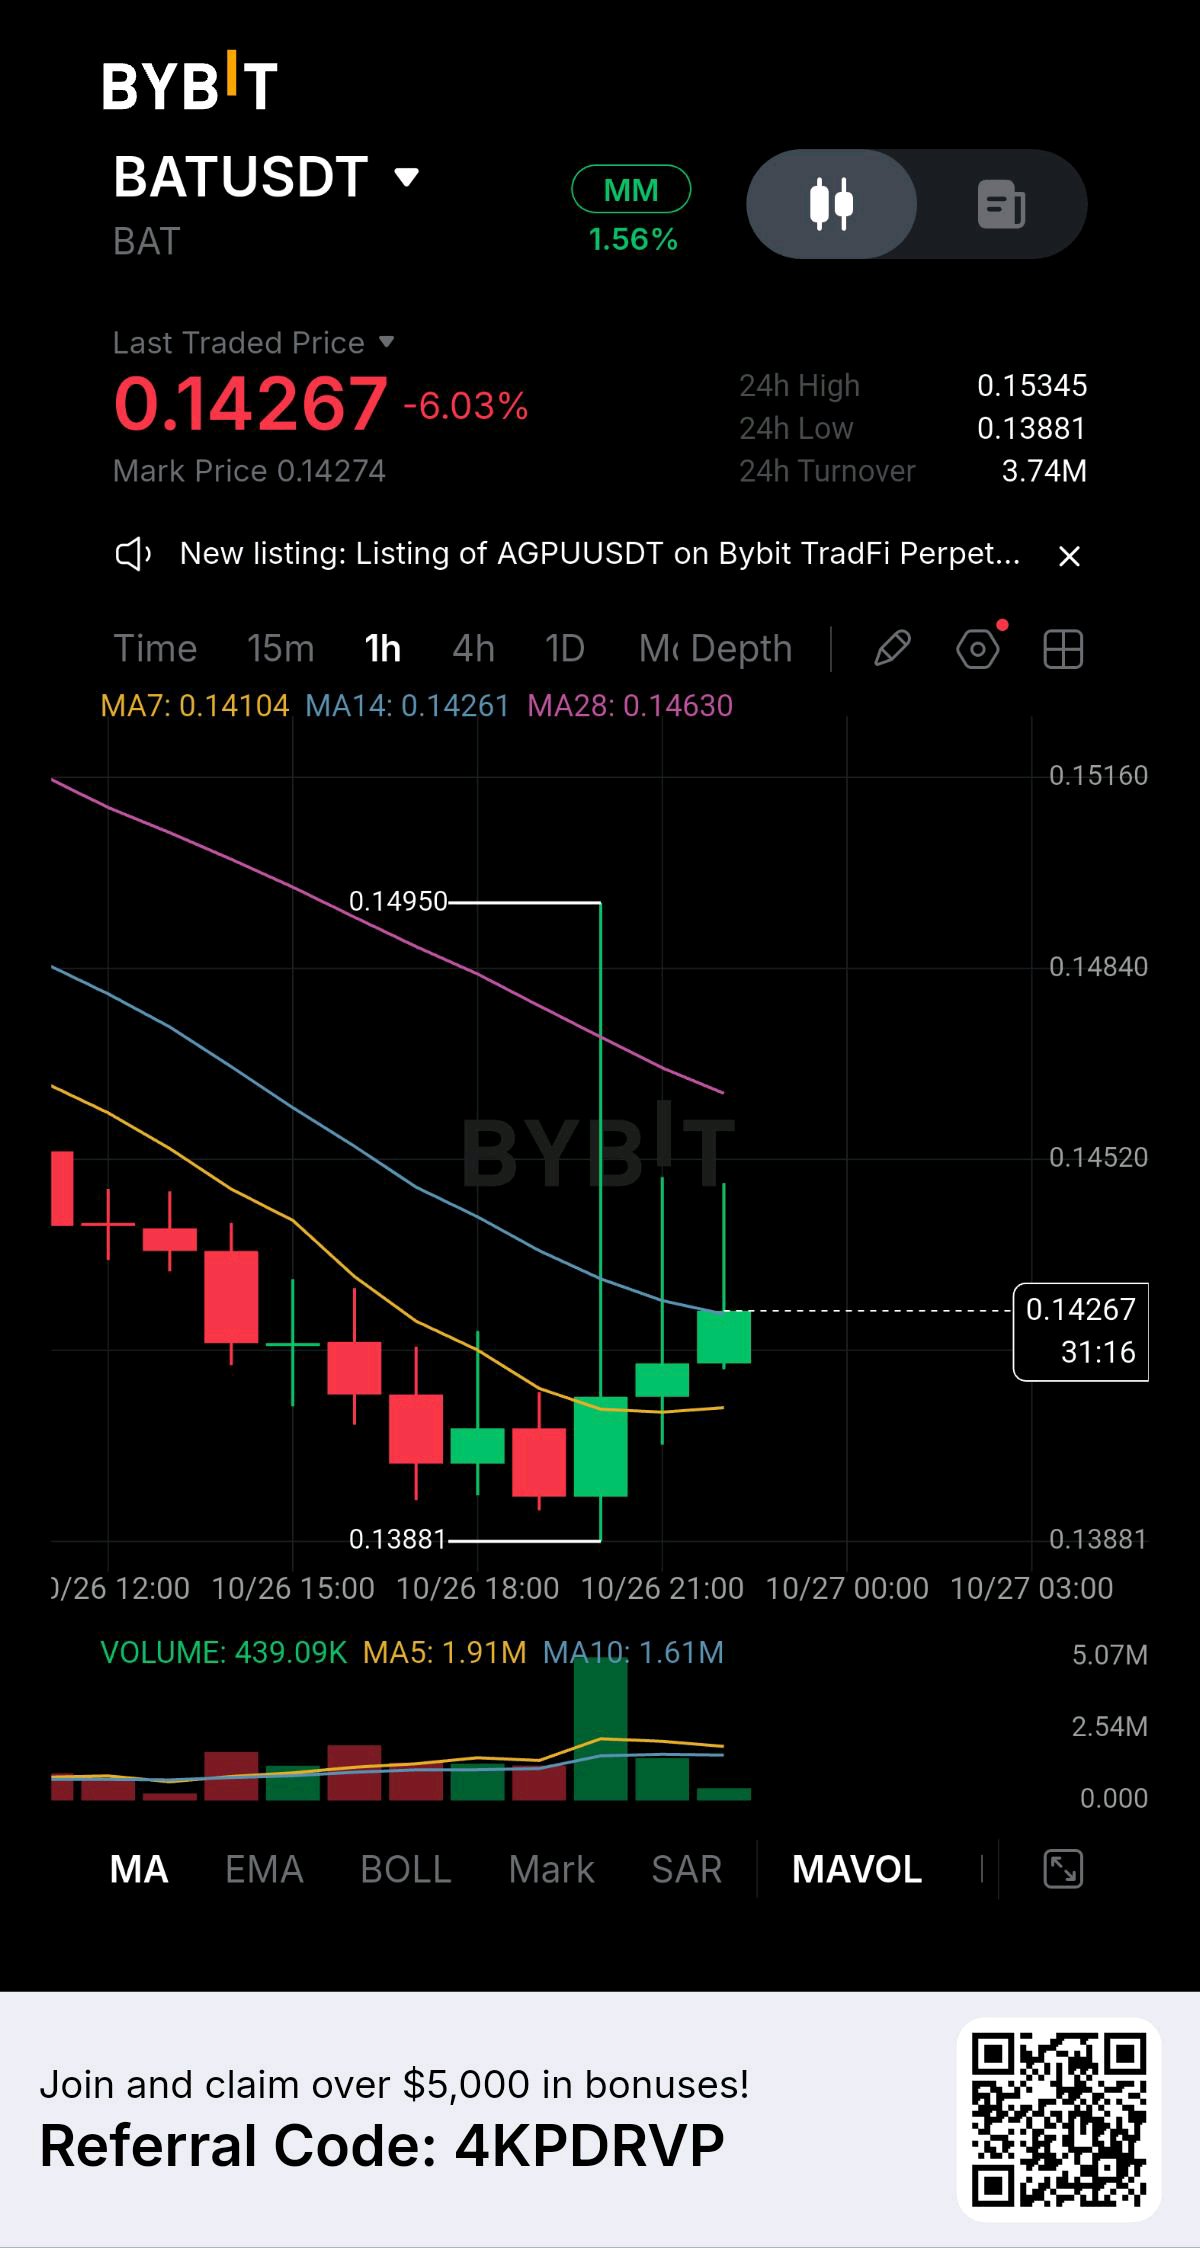
I’ve been watching the $BATUSDT 1H chart closely, and the current price action is showing an interesting recovery attempt after a sharp sell-off. BAT is trading around $0.14267, down approximately 6.03%, but the important part of this chart is what happened after price reached the $0.13881 low. That level produced a visible reaction from buyers. Instead of continuing directly lower, price started building green candles and pushed back toward the $0.14200–$0.14300 area. This tells me buyers are attempting to regain short-term control, but I would not call this a confirmed reversal yet. The first thing I’m watching is the moving-average structure. MA7 is around $0.14104, while MA14 is around $0.14261 and MA28 is around $0.14630. Price has recovered above MA7 and is currently testing the MA14 area. That makes $0.14260–$0.14300 an important short-term decision zone. If BAT can hold above this area and produce a strong 1H close, the next challenge is around $0.14520. Above that, the MA28 near $0.14630 becomes a much more important resistance level. A clean break above $0.14630 with strong volume could change the short-term structure significantly. From there, I would watch $0.14950 as the next major resistance and decision point. A successful move through $0.14950 could open the door toward the $0.15160 area and potentially allow buyers to challenge the recent $0.15345 high. But there is an important warning here: volume is not confirming the recovery yet. The current volume is around 439K, while the recent volume averages shown on the chart are much higher. There was a major volume spike during the rebound from $0.13881, but the latest candles are showing considerably less participation. That means I don’t want to chase the green candles simply because BAT has bounced. For me, the stronger bullish setup would be a sustained move above $0.14260–$0.14300, followed by a breakout of $0.14520 and then confirmation above $0.14630 with increasing volume. That would show that buyers are not just producing a temporary bounce but are actually taking control of the structure. On the downside, $0.14100–$0.14200 is the first area I’m watching for support. If price loses that zone and starts closing below MA7, the recovery could weaken quickly. The major support remains $0.13881. A break below $0.13881 would invalidate the current recovery attempt and could expose BAT to another wave of selling. So right now, I see BAT at a critical decision point. The bounce from $0.13881 is encouraging, but confirmation is still missing. I would rather see BAT prove strength through resistance than assume the reversal is already complete. My key levels are: Support: $0.14100–$0.14200 Major support: $0.13881 Resistance: $0.14520 Major resistance: $0.14630 Breakout zone: $0.14630–$0.14950 Upside levels: $0.14950 → $0.15160 → $0.15345 The message from this chart is simple: the buyers have started fighting back, but they still need volume and a confirmed resistance breakout to prove that this is more than a short-term relief bounce.If you want, I can also turn this into a much stronger 3,000-character ByX Impact version with a harder opening hook and more attention-grabbing language. #ByXIMPACT
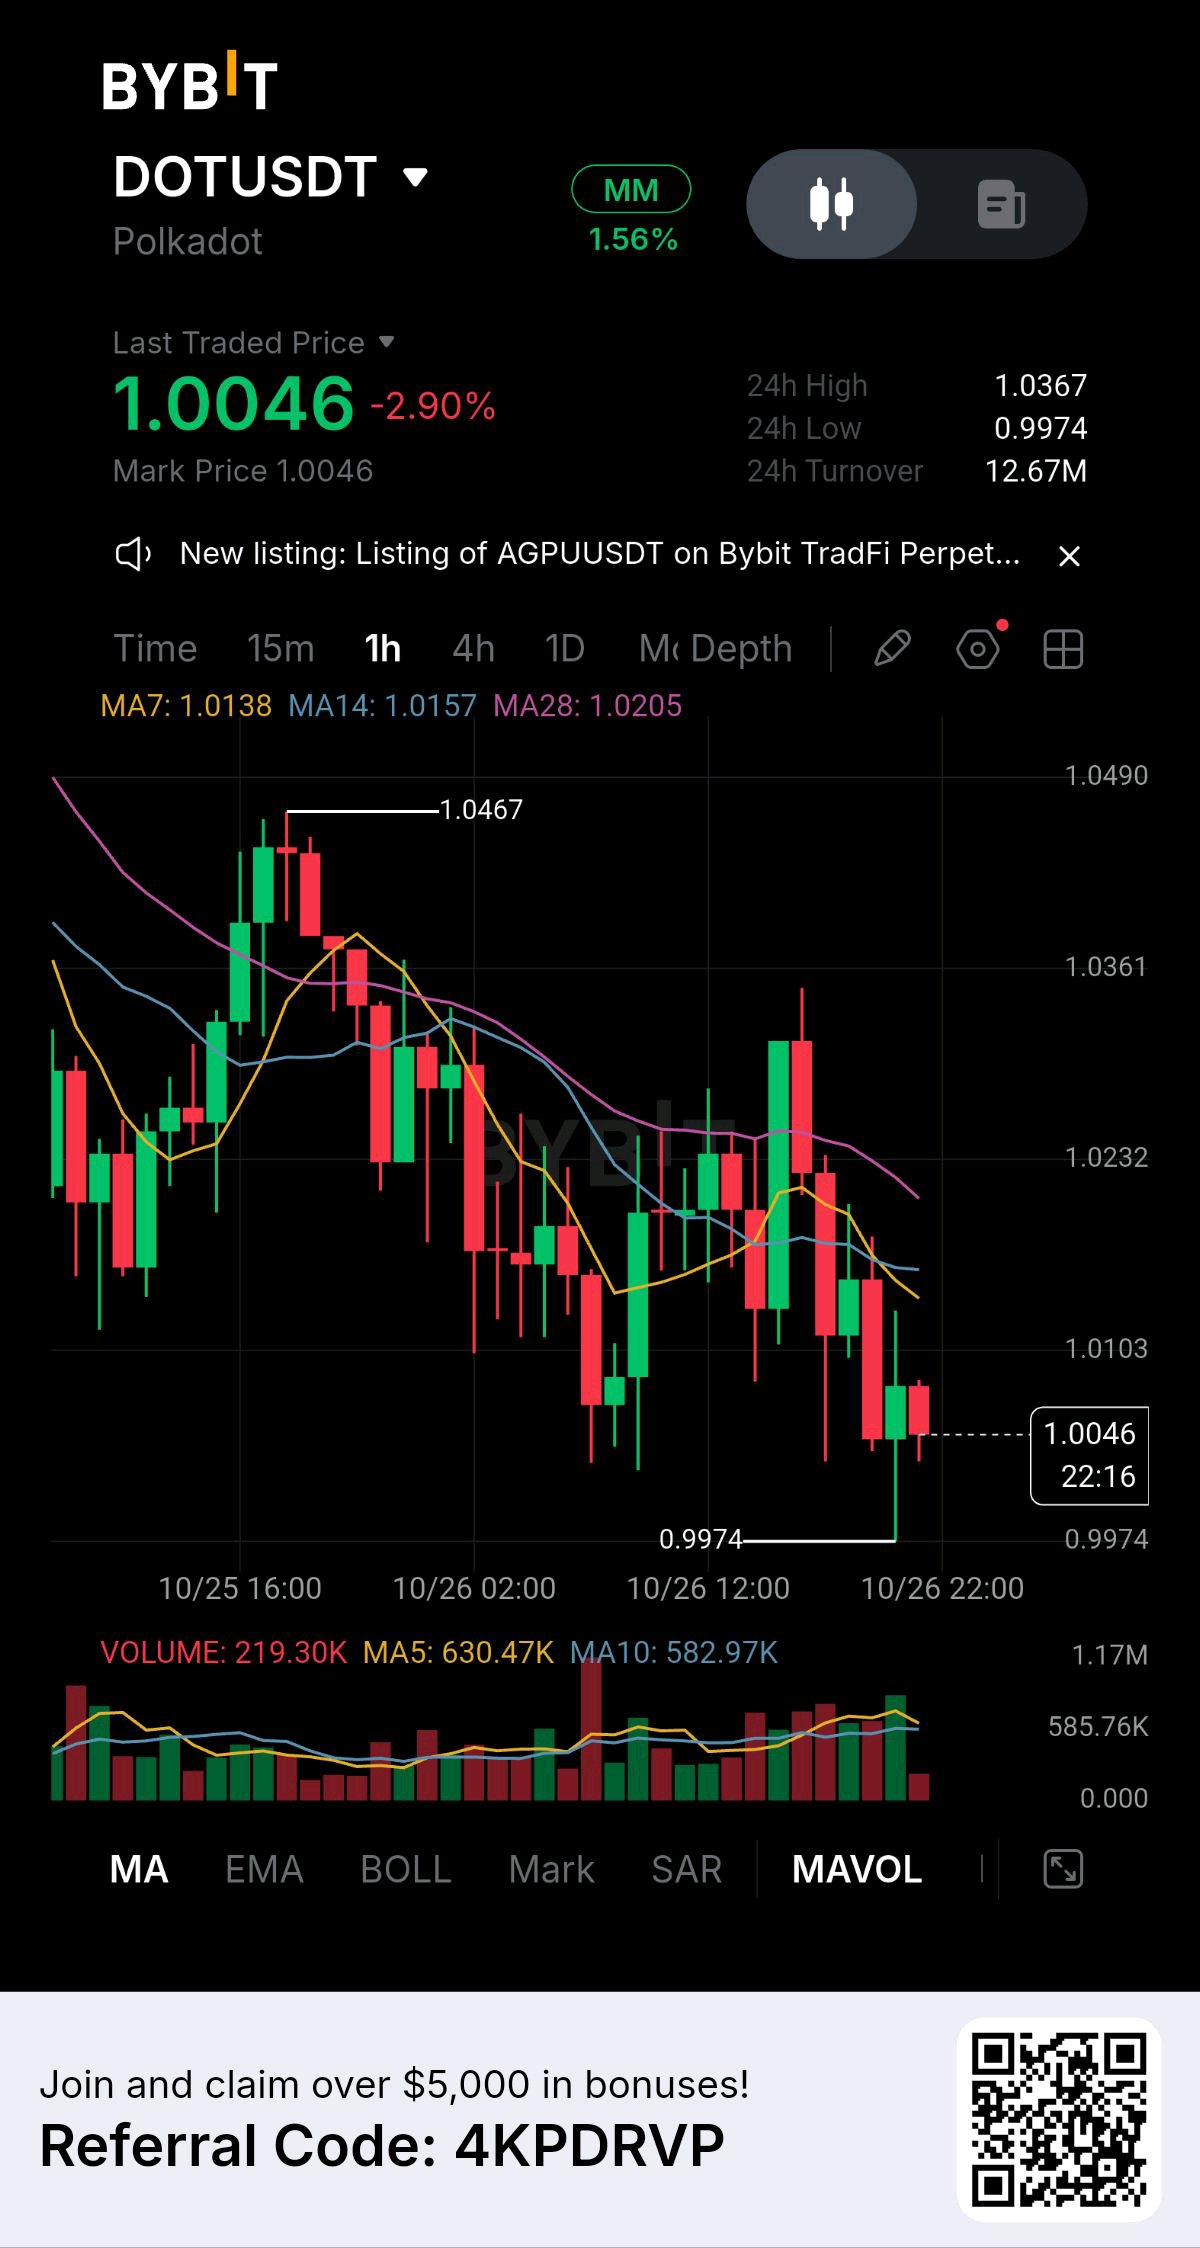
I’ve been watching the $DOTUSDT 1H chart closely, and the current structure is showing a market that is still under short-term pressure. DOT is trading around $1.0046, down roughly 2.90%, and price is now sitting very close to the important $0.9974 support level. What stands out to me is that DOT previously pushed up toward $1.0467 but failed to maintain that strength. After that rejection, the chart started forming lower highs and lower trading levels, which tells me sellers are still controlling the short-term structure. The moving averages are also giving me a reason to stay cautious. MA7 is around $1.0138 MA14 is around $1.0157 MA28 is around $1.0205 Price is currently trading below all three averages. That means DOT needs to recover these levels before I would consider the short-term structure meaningfully stronger. The first level I’m watching is $0.9974. This is the recent chart low and an important decision zone. If buyers defend this area and produce a strong reaction, DOT could attempt a recovery back toward $1.0103, followed by $1.0138–$1.0157. A clean reclaim of those moving averages would be the first sign that buyers are starting to regain control. But I would not call it a confirmed reversal yet. For me, the bigger confirmation comes above the $1.0205 area. That level is close to the MA28 and could become an important resistance point. If DOT can break above $1.0205 with stronger volume and hold that level as support, the recovery could become much more convincing. Above there, I would watch $1.0232 and then the $1.0361 area. A stronger continuation could eventually bring the previous high around $1.0467 back into focus. However, there is another side to this setup. If $0.9974 fails decisively and the 1H candles continue closing below that support, I would not force a bullish interpretation. Losing the recent low would signal that sellers are still pushing the market lower and could open the door for another leg down. Volume is also important here. The latest volume is around 219K, while the displayed MA5 and MA10 volume averages are significantly higher. That tells me the current move does not yet have overwhelming volume confirmation. I would rather see expanding volume behind a breakout than chase a move simply because price produces one strong candle. My current roadmap is simple: Support: $0.9974 First recovery zone: $1.0103 MA7: $1.0138 MA14: $1.0157 Major short-term reclaim: $1.0205 Resistance: $1.0232 Next resistance: $1.0361 Major resistance: $1.0467 The key battle is happening around $0.9974–$1.0205. If buyers defend $0.9974, reclaim $1.0103, and then break $1.0205 with volume, the chart could start shifting from bearish pressure toward recovery. If sellers break $0.9974 instead, I would step back and wait for a new structure rather than assuming every dip is a buying opportunity. For me, the most important thing on this chart is confirmation. I’m not interested in chasing the first green candle. I want to see DOT prove that resistance has turned into support. Right now, DOT is at a decision point. The next move around $0.9974 could tell us whether buyers are preparing a recovery or sellers are preparing another breakdown.If you want, I can also turn this into a much stronger 3,000-character ByX Impact version with a harder opening hook and more attention-grabbing structure. #ByXIMPACT
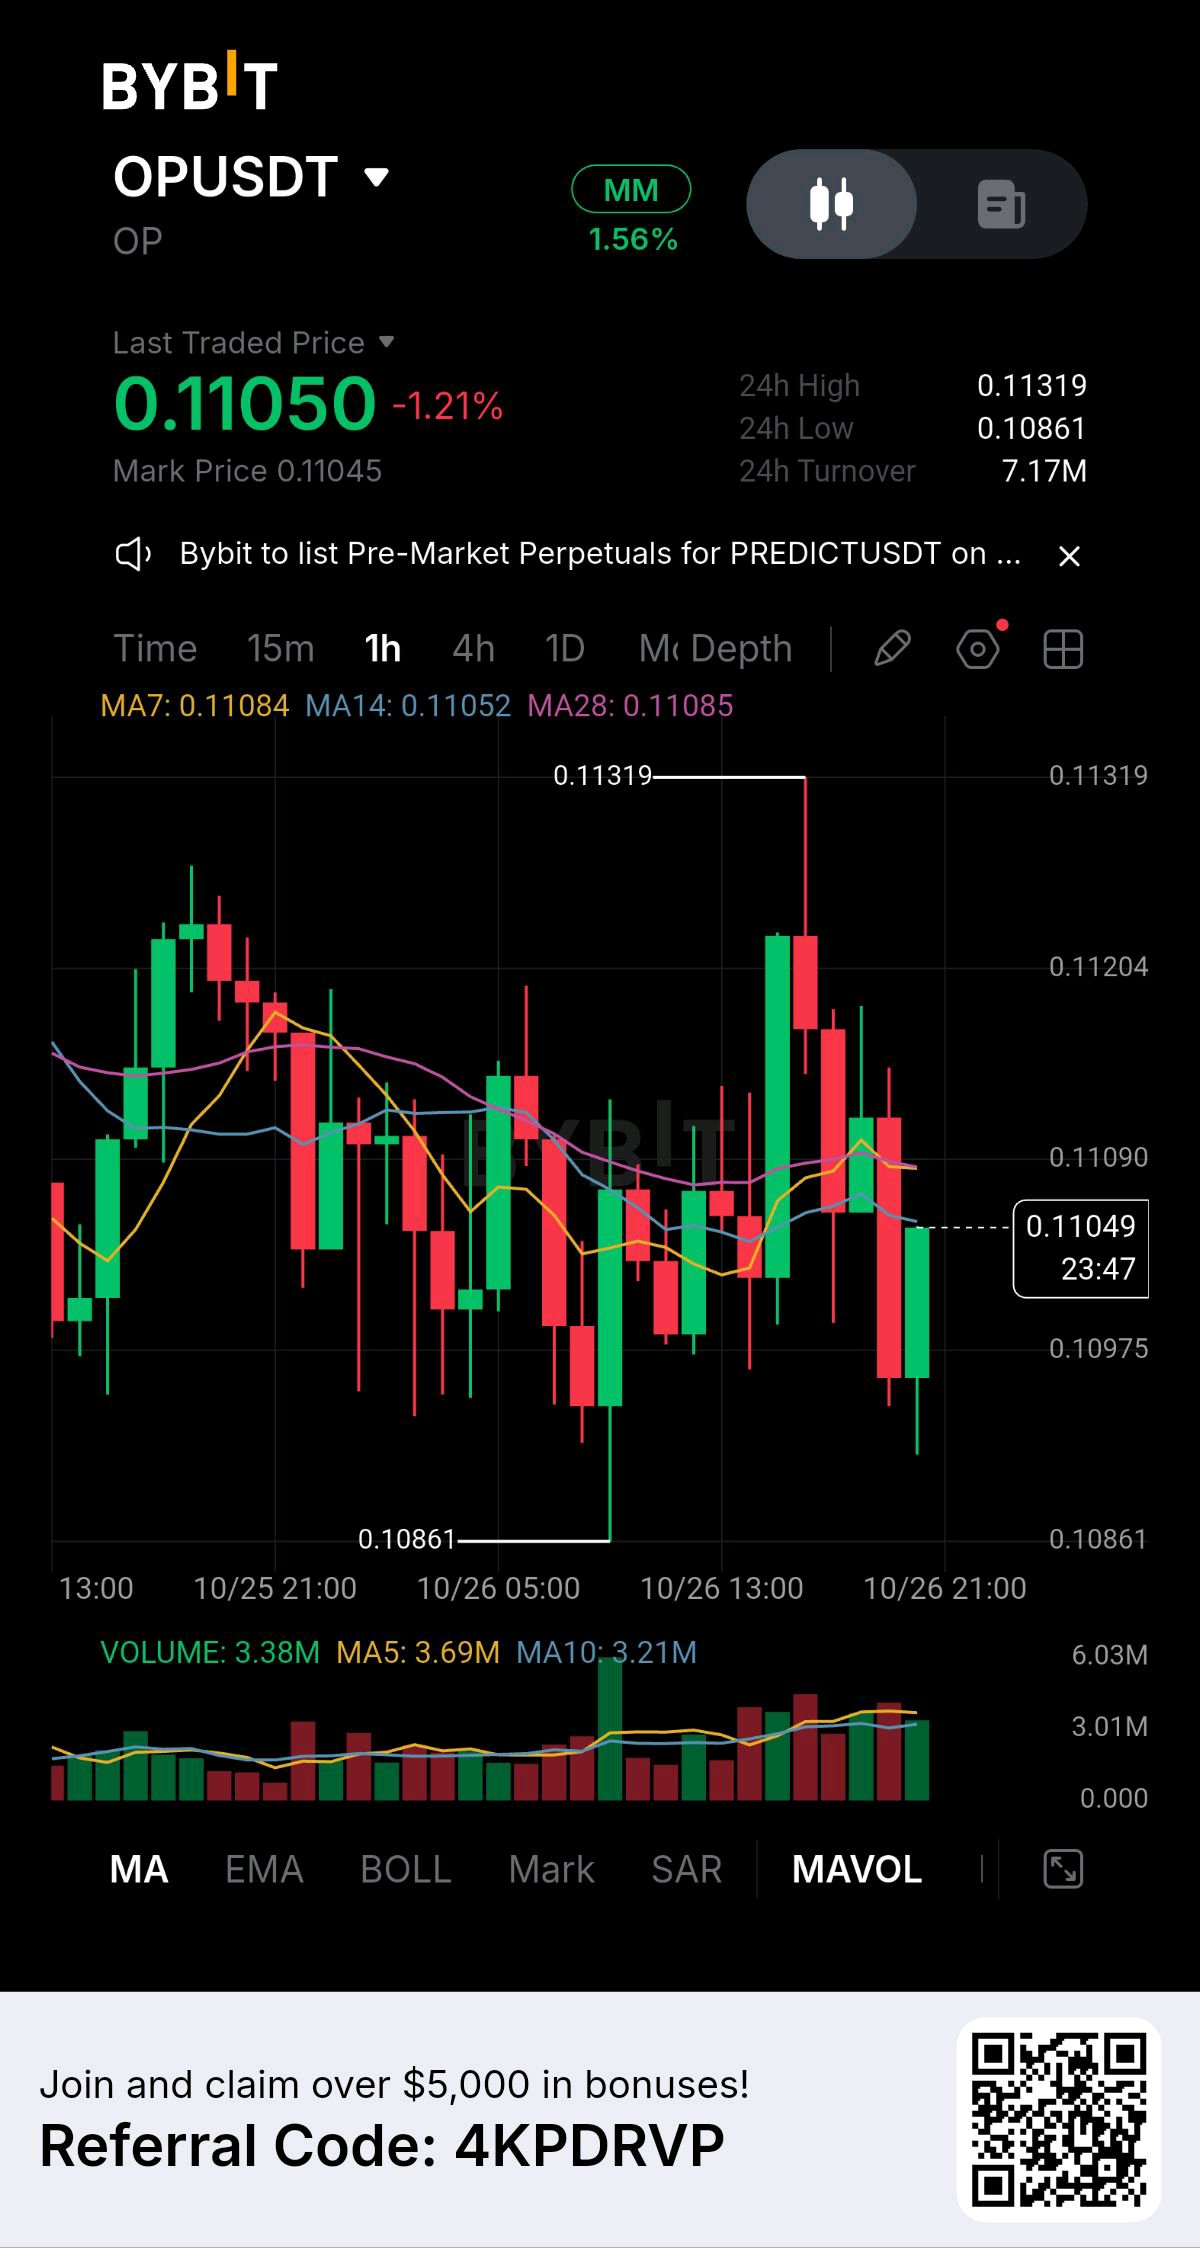
I’ve been watching the $OPUSDT 1H chart closely, and what stands out to me right now is that price is sitting in a very important decision area rather than showing a clean breakout. OP is trading around $0.11050 after being rejected from the $0.11319 area. That rejection matters because $0.11319 is currently the strongest visible resistance on this chart. Buyers pushed price aggressively toward that level, but sellers immediately stepped in and forced the candle back down. The short-term structure is still mixed. Price is moving around the moving averages, with MA7 near $0.11084, MA14 around $0.11052 and MA28 around $0.11085. That tells me momentum has not established a clear direction yet. The level I’m watching first is $0.11090–$0.11100. If OP can reclaim this zone and hold above it with stronger volume, the next test becomes $0.11204, followed by the major resistance at $0.11319. A clean 1H close above $0.11319 with convincing volume would be the breakout signal I would take seriously. That would show that buyers have finally absorbed the selling pressure around the recent high and could open the door for a stronger continuation. But I would not chase the move simply because one green candle appears. On the downside, $0.10975 is the first support area I’m watching. Below that, the more important support sits around $0.10861, which is also the recent 24H low. If that level breaks decisively, the current recovery structure becomes much weaker and sellers could regain control. Volume is another important part of this setup. Recent candles have produced higher activity, but OP still needs stronger buying volume to confirm that a real breakout is developing. Without that confirmation, another rejection from resistance remains possible. My approach here is simple: I’m watching how price reacts around $0.11100 and whether buyers can reclaim $0.11204. Above $0.11319, the structure becomes significantly more interesting for bullish continuation. Below $0.10975, I would become more cautious. For me, this is not about predicting the next candle. It is about waiting for OP to prove which side is actually taking control. Resistance: $0.11100 → $0.11204 → $0.11319 Support: $0.10975 → $0.10861 Bullish confirmation: 1H close above $0.11319 with strong volume. The setup is developing, but confirmation is still more important than hype.A useful next step would be to mark $0.11319 as the breakout level and $0.10975/$0.10861 as the key support zones directly on the chart before posting. #ByXIMPACT