Nathan Cole
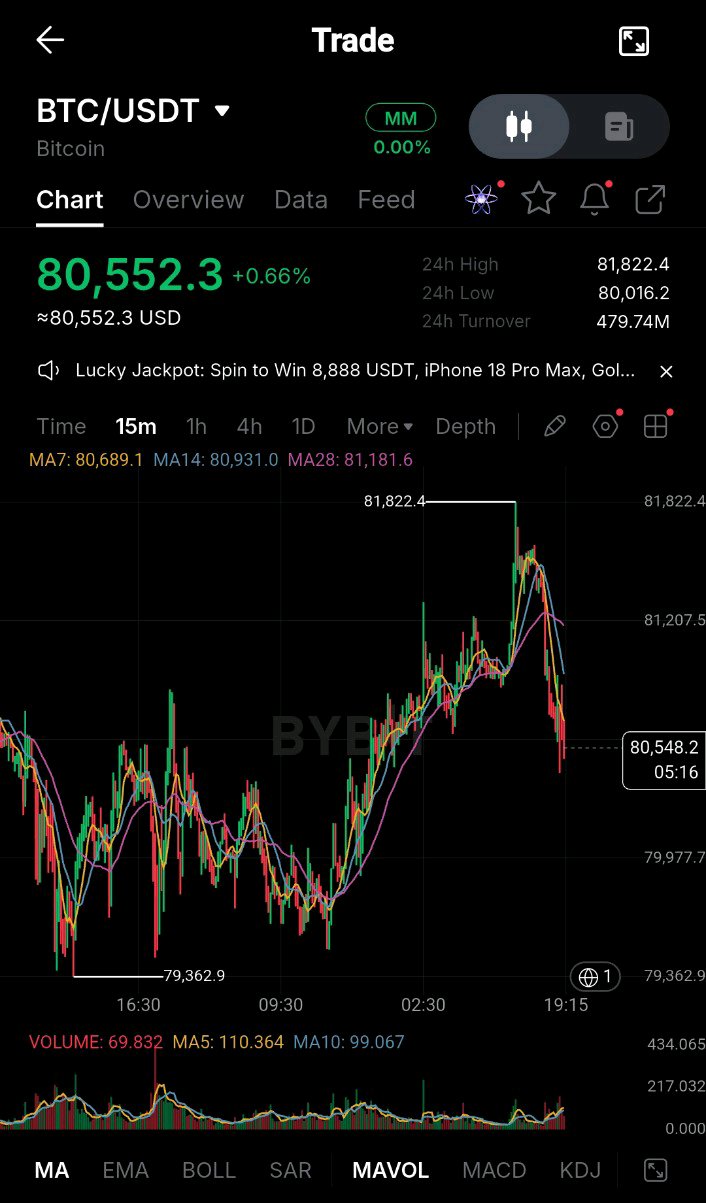
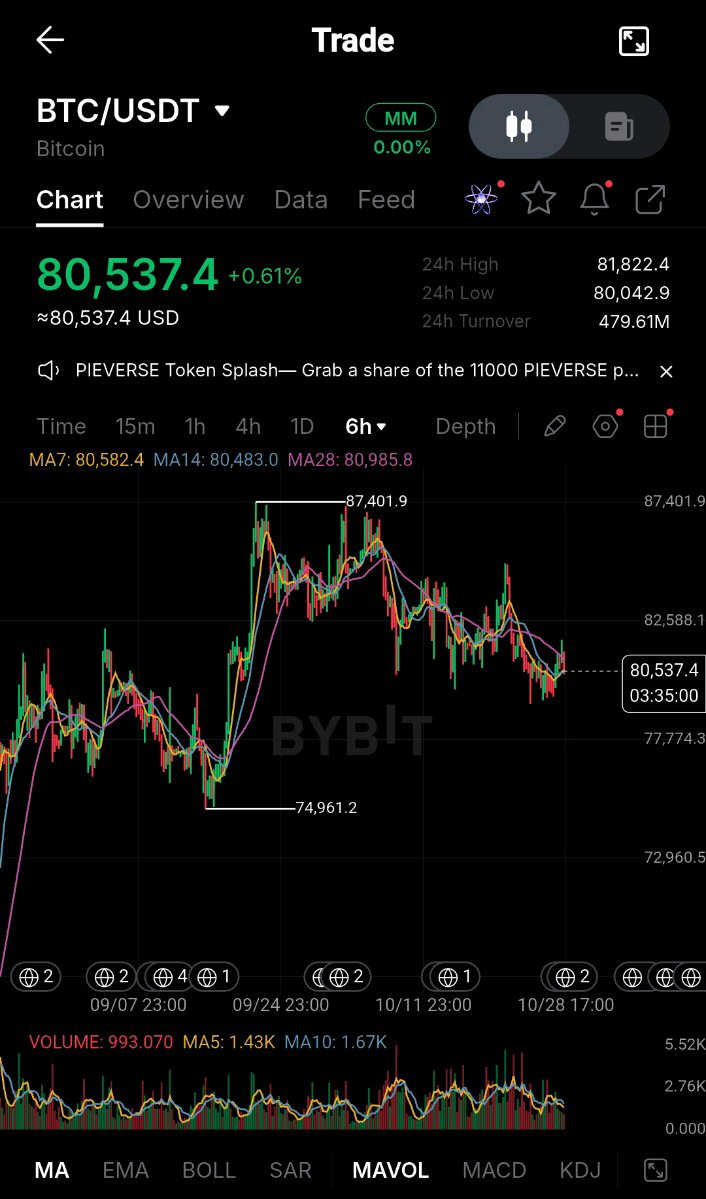
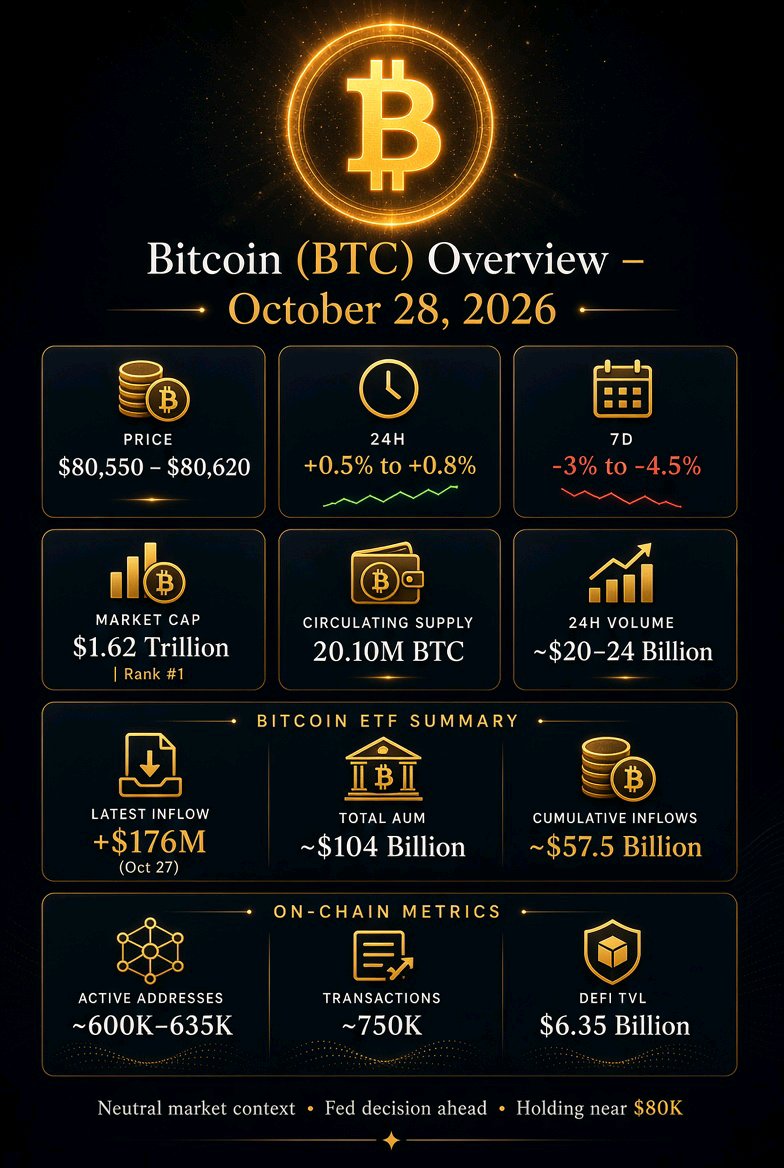
Bitcoin $BTCUSDT Overview – October 28, 2026** Bitcoin trades near $80,550–$80,620, up roughly 0.5–0.8% over 24 hours and down about 3–4.5% over the past 7 days. 24-hour trading volume stands near $20–24 billion. Market capitalization is approximately $1.62 trillion, ranking #1. Circulating supply is 20.10 million BTC out of a maximum 21 million. U.S. spot Bitcoin ETFs recorded a net inflow of $176 million on October 27 (led by BlackRock’s IBIT), following $110 million the prior day. Total net assets stand near $104 billion, with cumulative net inflows since launch around $57.5 billion. ETFs hold roughly 1.29 million BTC. On-chain metrics show roughly 600,000–635,000 daily active addresses and about 750,000 transactions in the latest 24-hour period. DeFi total value locked on Bitcoin is approximately $6.35 billion. Stablecoin activity on the network remains limited relative to other chains. Recent developments include consecutive days of positive ETF flows after earlier outflows, price recovery above $80,000 following a brief dip, and market focus on the Federal Reserve’s policy decision. Broader context involves elevated oil prices, AI-related equity volatility, and cautious risk sentiment ahead of the Fed meeting and U.S. midterms. Bitcoin remains approximately 36% below its all-time high of about $126,000 set in October 2025. #ByXIMPACT
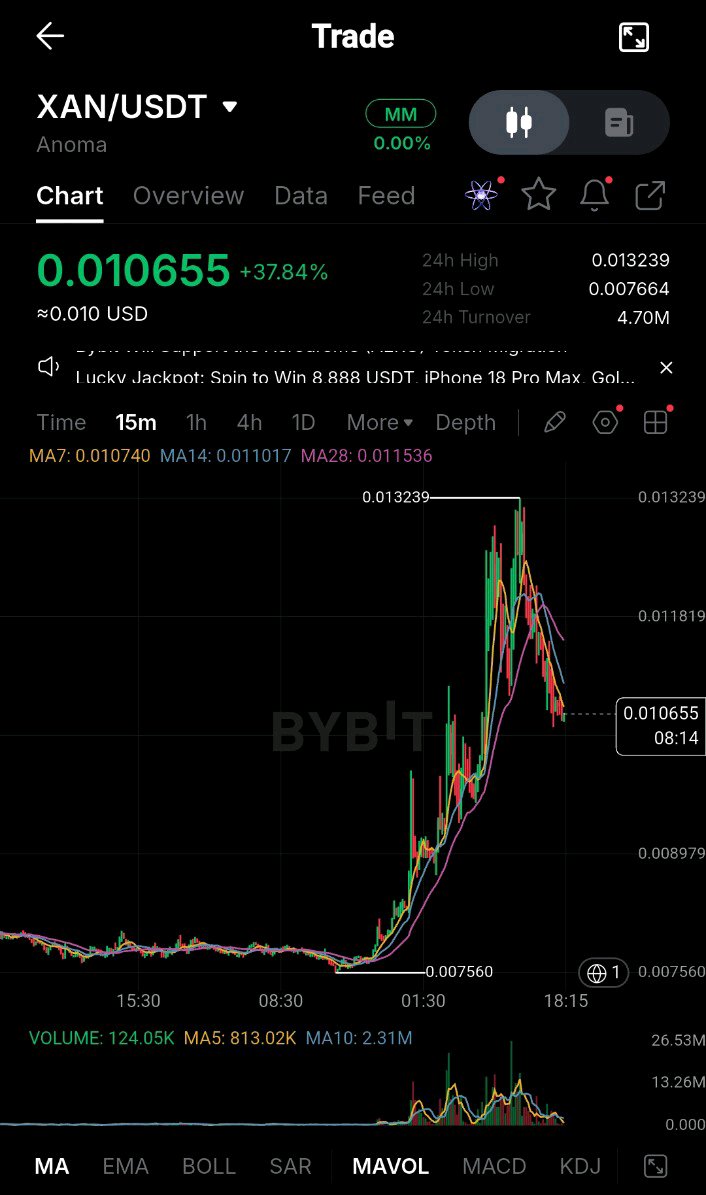
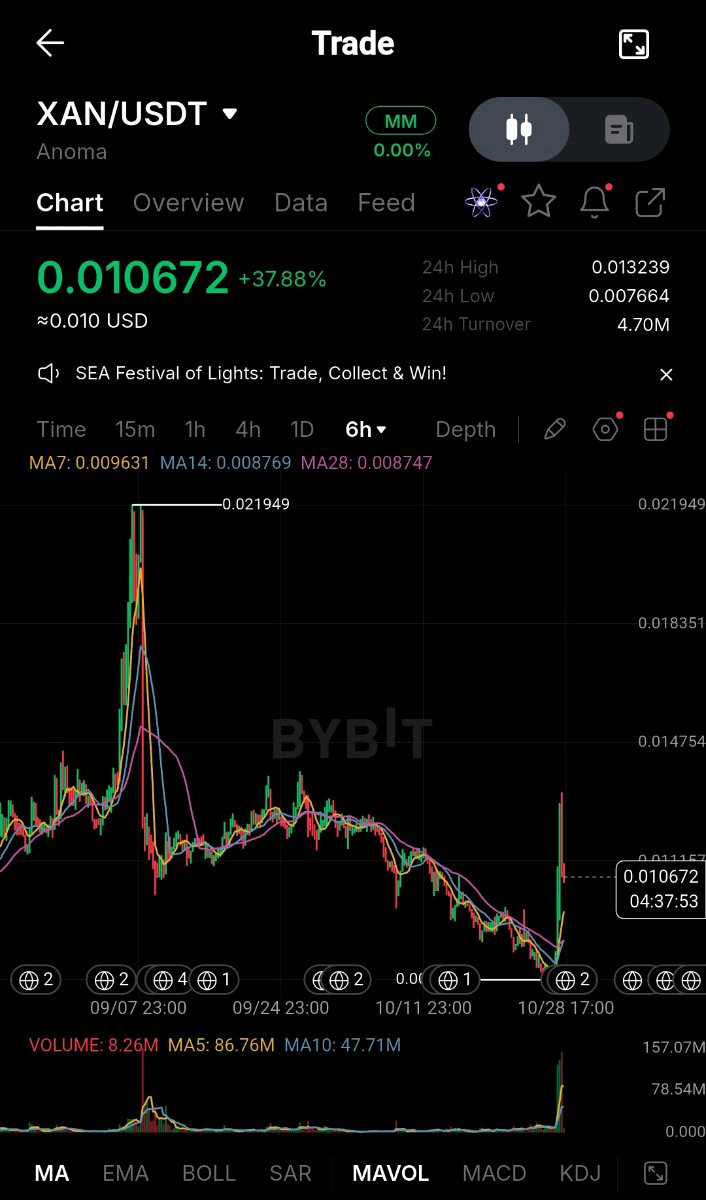
Anoma (XAN) $XANUSDT trades near $0.0107, up approximately 38–45% over the past 24 hours and roughly 14–18% over the past 7 days. 24-hour trading volume stands around $40–42 million. Market capitalization is approximately $27 million, with a fully diluted valuation near $107–113 million. Circulating supply is 2.5 billion XAN out of a maximum and total supply of 10 billion. The token ranks roughly in the #570–#700 range by market capitalization depending on the data source. No ETF products or related flows exist for XAN. On-chain activity remains limited. Holder count is reported near 16,000. DEX-related liquidity and TVL sit in the low hundreds of thousands of dollars. Detailed active-address or transaction-volume metrics specific to the protocol are not widely published at high frequency. Approximately 75% of the total supply remains locked. Recent developments include the launch of Governance V2 in mid-September 2026, enabling Anoma DAO operations with proposal submission, voting, and delegation by XAN holders. The project has expanded AnomaPay features, including private payments, yield-bearing accounts, and shielded asset-management tools across multiple networks. The token remains well below its September 2025 all-time high near $0.25–$0.27. XAN functions as the native token of Anoma, an intent-centric protocol designed as a distributed operating system for cross-chain applications with privacy features. Price action has shown elevated volatility and volume relative to market capitalization amid broader market conditions and ongoing protocol development. #ByXIMPACT

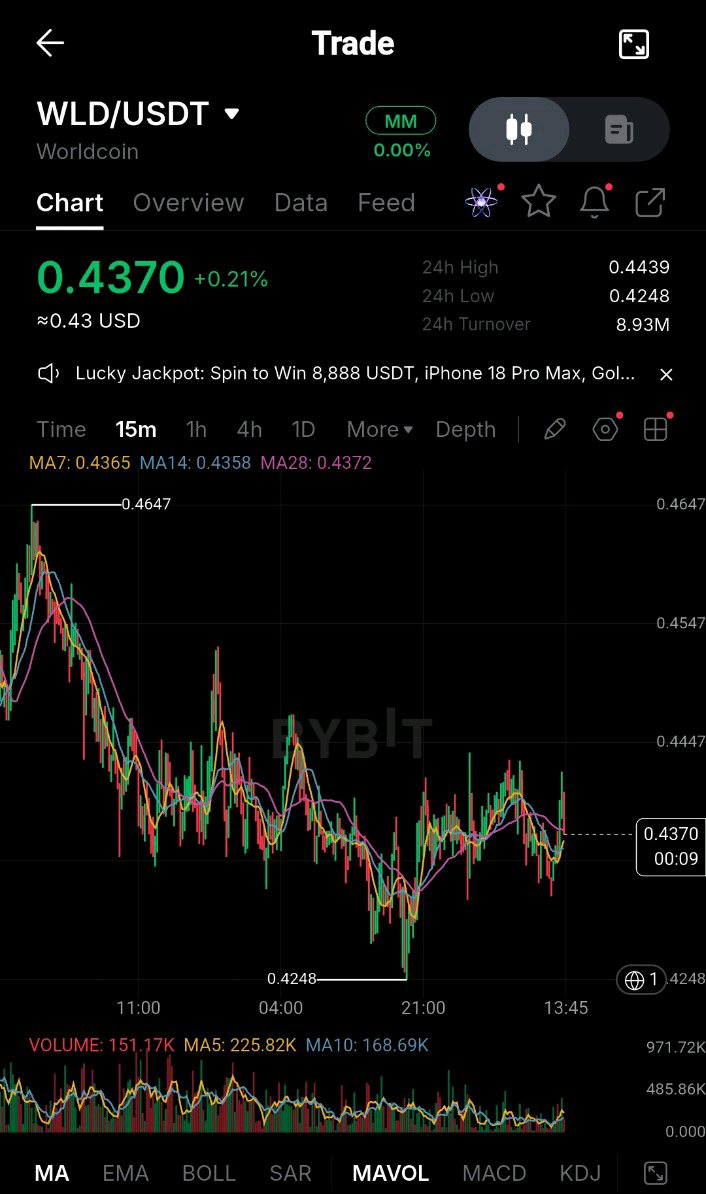
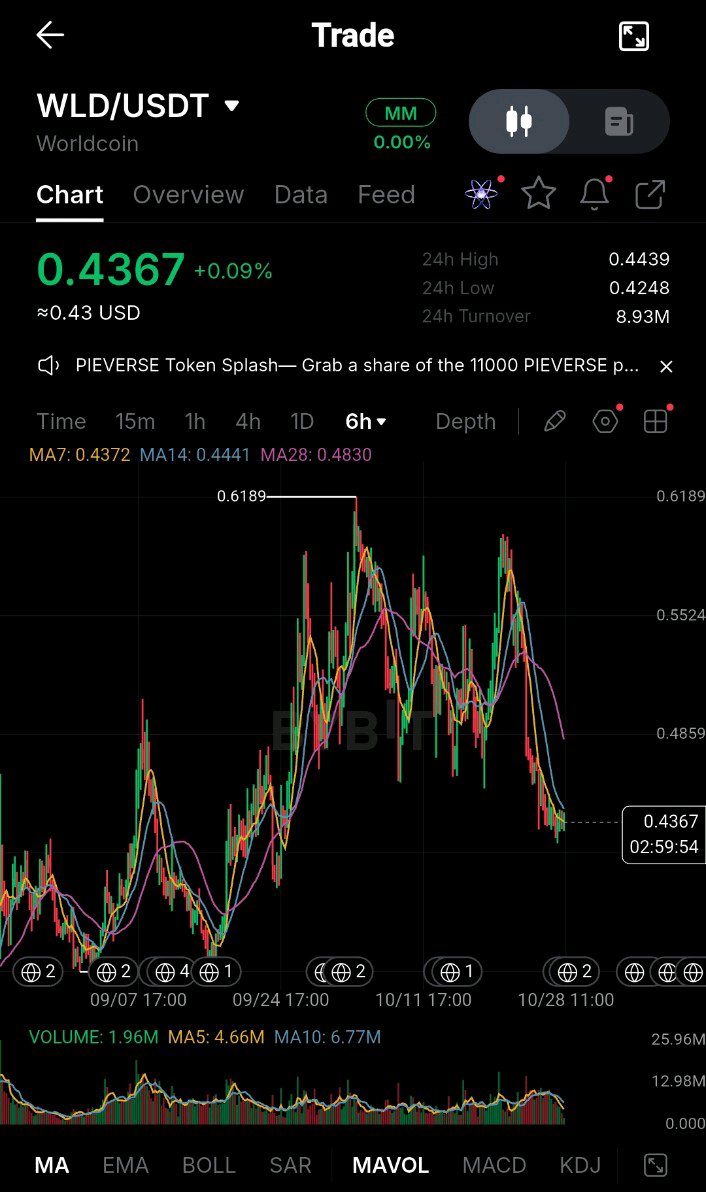
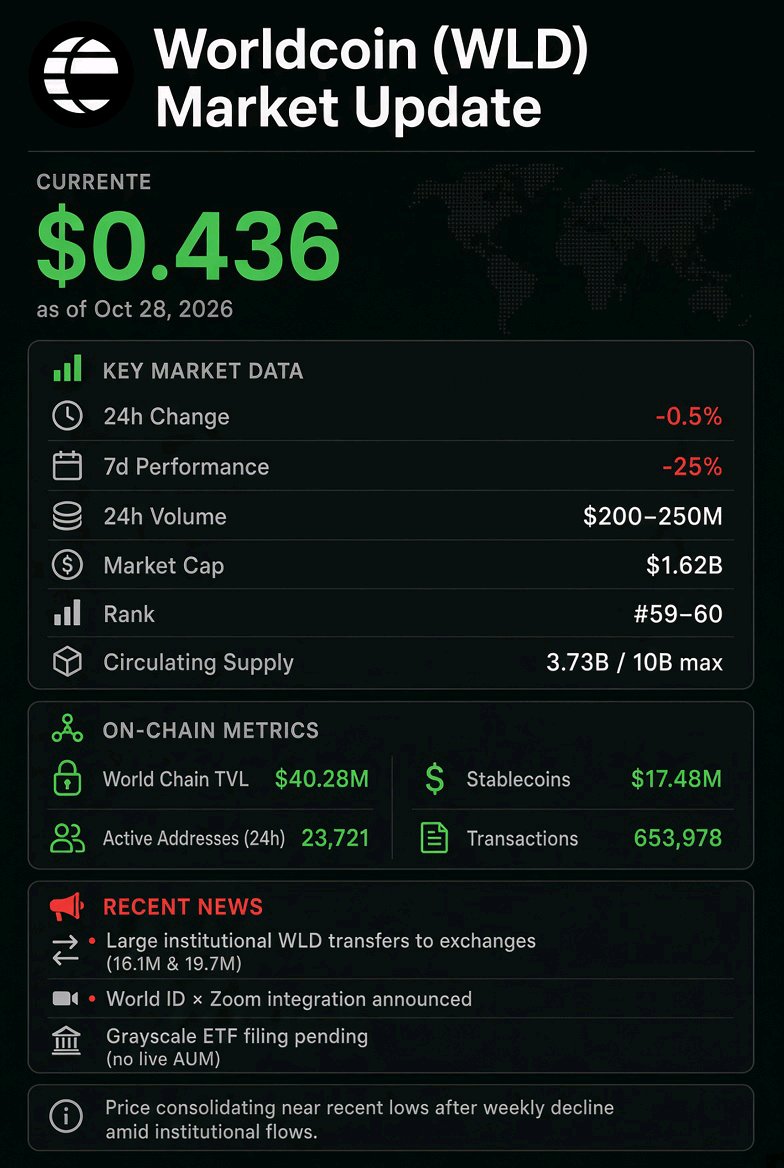
Worldcoin $WLDUSDT trades at approximately $0.435–$0.437 as of October 28, 2026. 24h change is near flat to mildly negative (−0.1% to −0.8%). 7d performance stands at roughly −25% (from levels near $0.58). 24h trading volume is approximately $200–250 million. Market capitalization is about $1.62 billion, ranking it around #59–60. Circulating supply is ~3.73 billion WLD out of a 10 billion maximum supply. No live Worldcoin ETF currently exists. Grayscale filed for a spot Worldcoin ETF (proposed ticker GWLD) in July 2026, with BitGo as custodian, but the application remains pending with no reported assets under management or flows. On World Chain, DeFi TVL is $40.28 million. Stablecoin market cap on the network is $17.48 million (primarily USDC). 24h active addresses total 23,721, with 653,978 transactions recorded. Recent developments include multiple large institutional transfers of WLD to centralized exchanges in late October (including amounts of 16.1 million and approximately 19.7 million tokens), coinciding with price declines. A World ID integration with Zoom for meeting verification was announced around mid-October. Earlier product updates include the World Money self-custodial app and ProveKit privacy tools. WLD has declined from multi-week highs near $0.55–$0.58 amid these flows and broader market conditions, currently consolidating near recent lows around $0.43 after earlier volatility. #ByXIMPACT
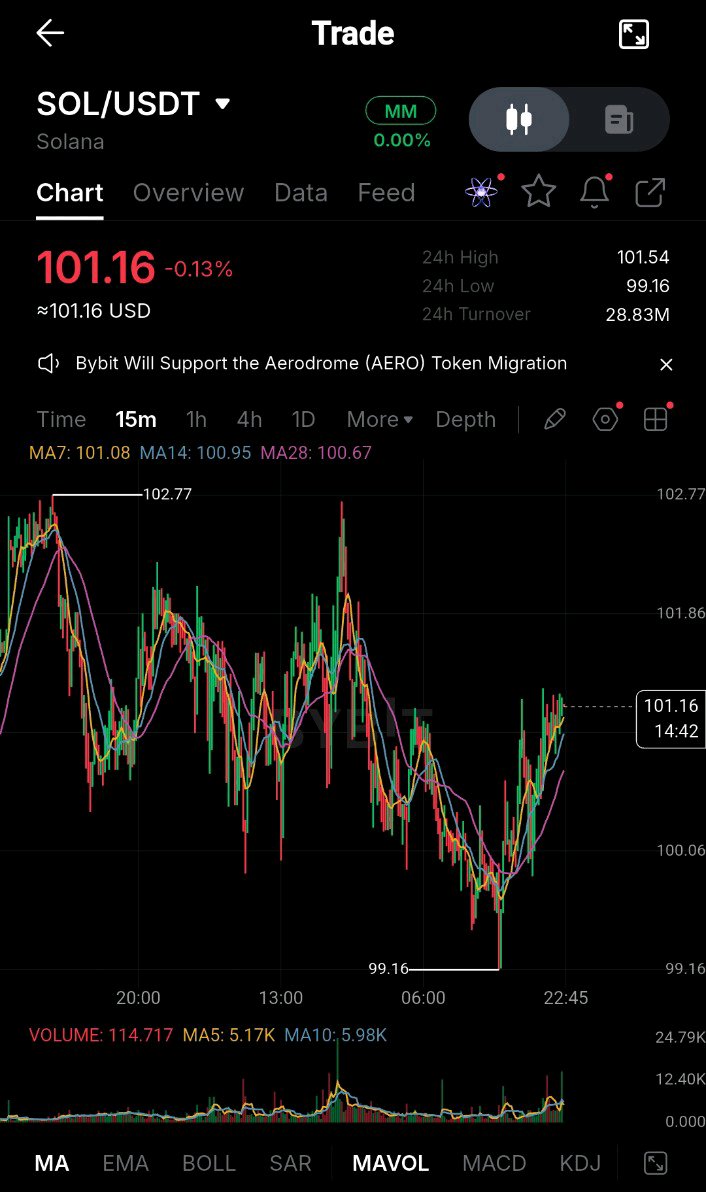
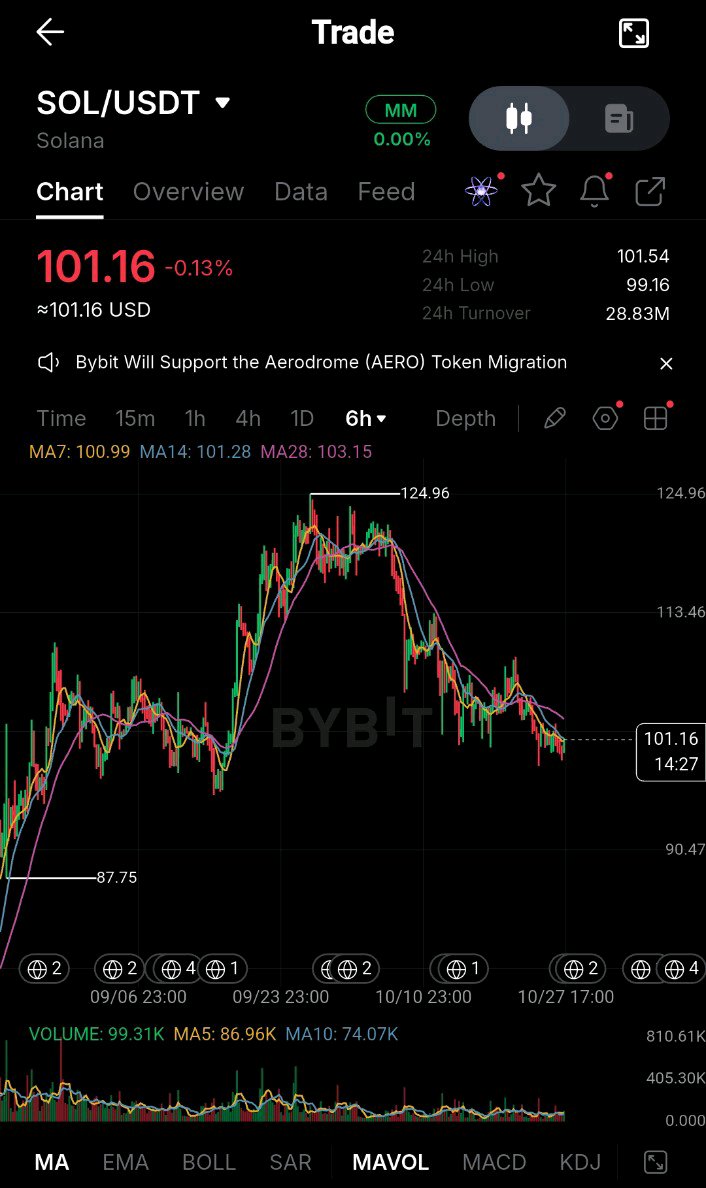
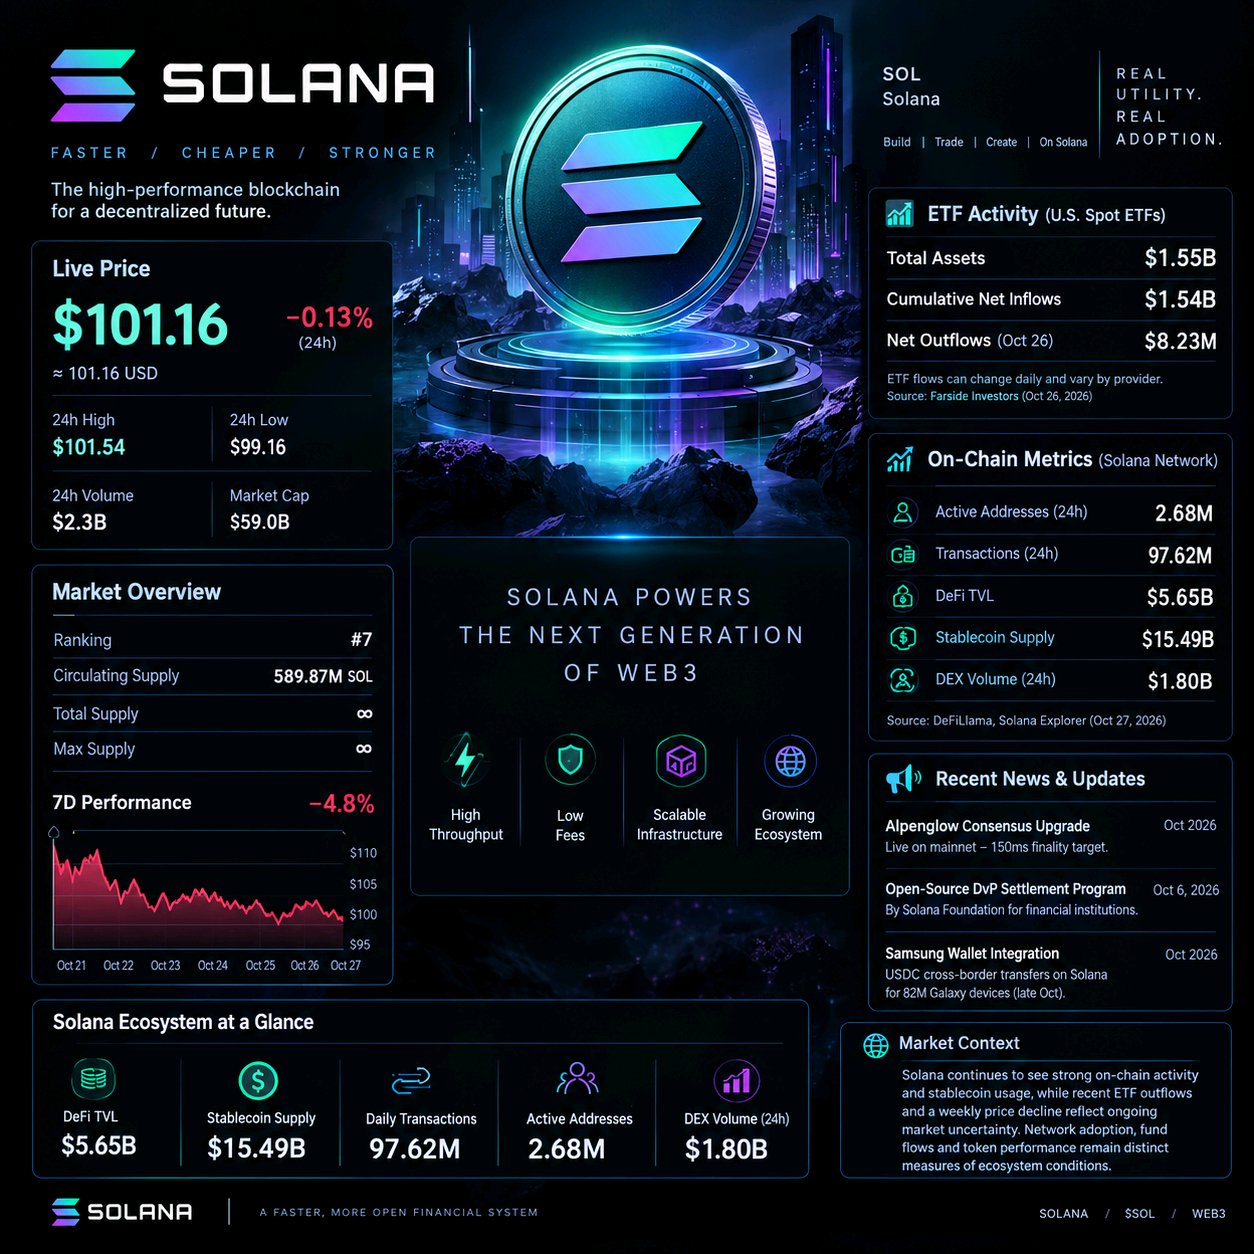
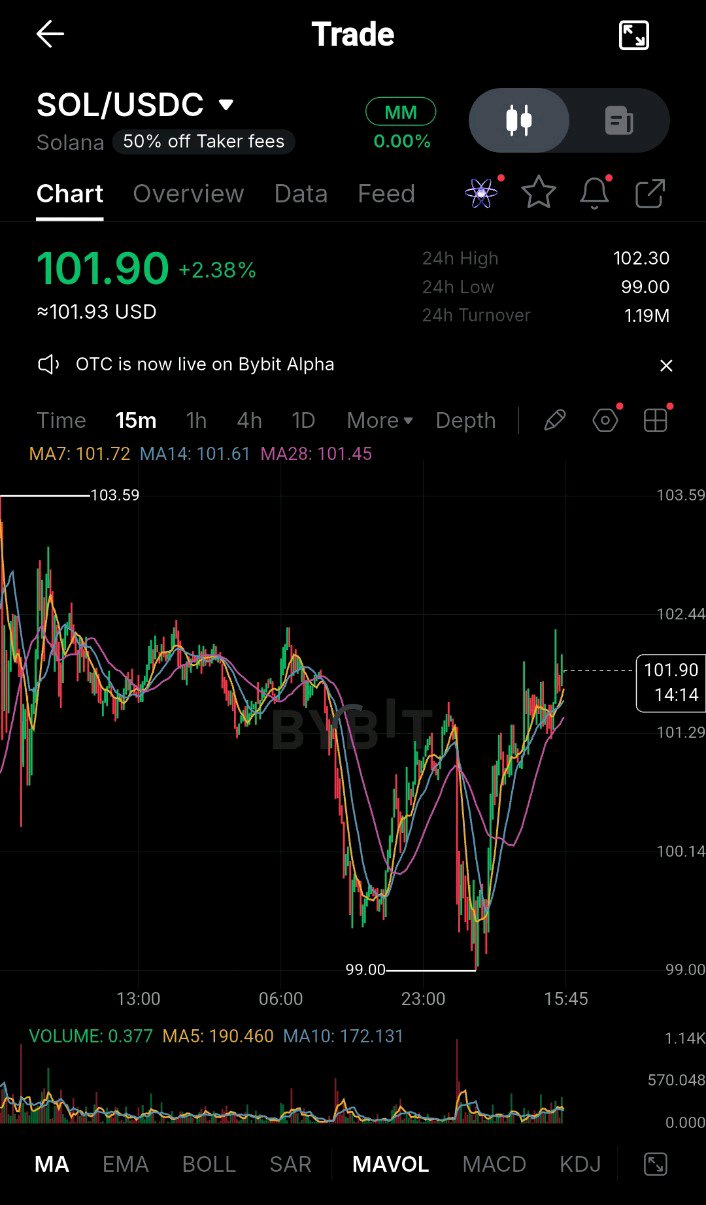
Solana (SOL) — Market & Network Update | October 27, 2026 $SOLUSDT trades around $100–$101.16, with the supplied Bybit snapshot showing −0.13% over 24 hours and a session range of $99.16–$101.54. Market-wide data indicates approximately −4.8% over seven days, a market cap near $59 billion, a #7 market ranking, roughly $2.3 billion in 24-hour trading volume, and 589.87 million SOL in circulating supply. Figures vary by exchange and timestamp. Coinucation +1 ETF activity: U.S. spot Solana ETFs recorded approximately $1.55 billion in assets and $1.54 billion in cumulative net inflows as of October 26. That session registered $8.23 million in net outflows, continuing a period of uneven institutional fund flows. solanafloor.com On-chain metrics: Solana’s DeFi total value locked stands at approximately $5.65 billion, with stablecoin market capitalization near $15.49 billion. The network recorded 2.68 million active addresses and 97.62 million transactions over 24 hours. DEX volume reached approximately $1.80 billion. DefiLlama Recent developments: Solana’s Alpenglow consensus upgrade is now listed as live on mainnet, targeting transaction finality of around 150 milliseconds. The Foundation also announced an open-source delivery-versus-payment settlement program for financial institutions on October 6. Separately, Samsung Wallet announced plans for USDC cross-border transfers on Solana across 82 million U.S. Galaxy devices, beginning in late October. Solana Media +2 Market context: Solana continues to record substantial on-chain activity and stablecoin usage, while recent ETF outflows and negative weekly price performance reflect ongoing market uncertainty. Network adoption, fund flows, and token performance remain distinct measures of ecosystem conditions. #IMPACTbyTrade #Bybit8thAnniversary #ByXIMPACT
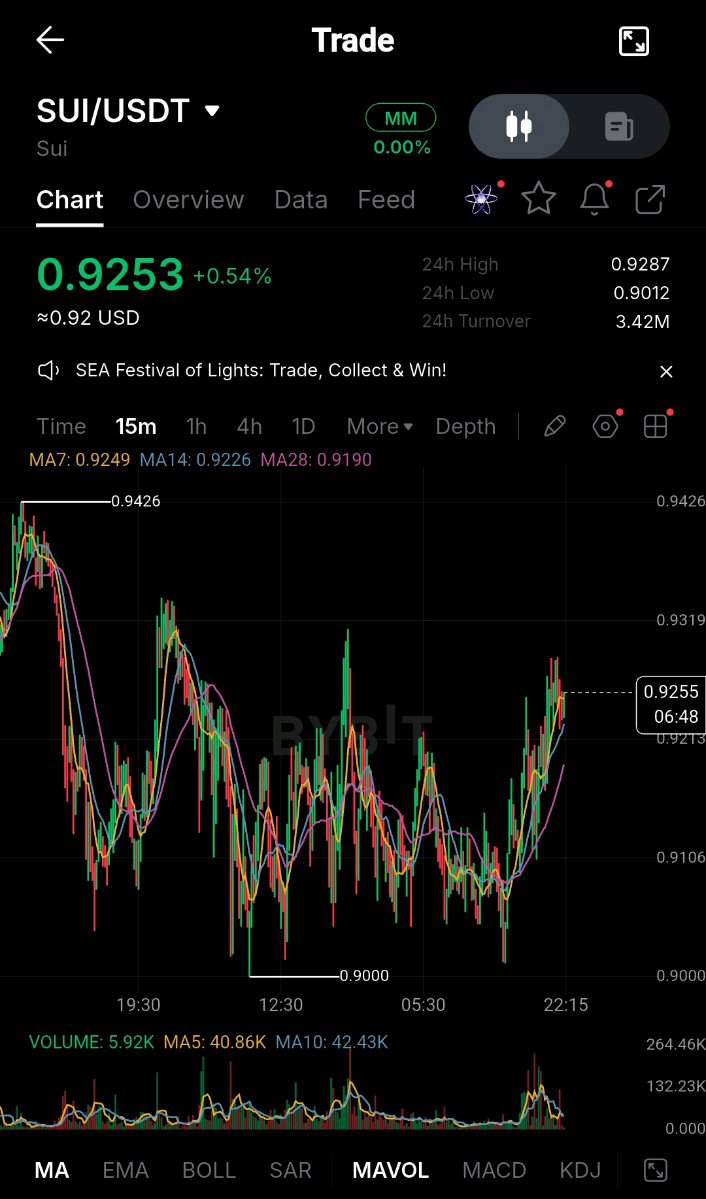
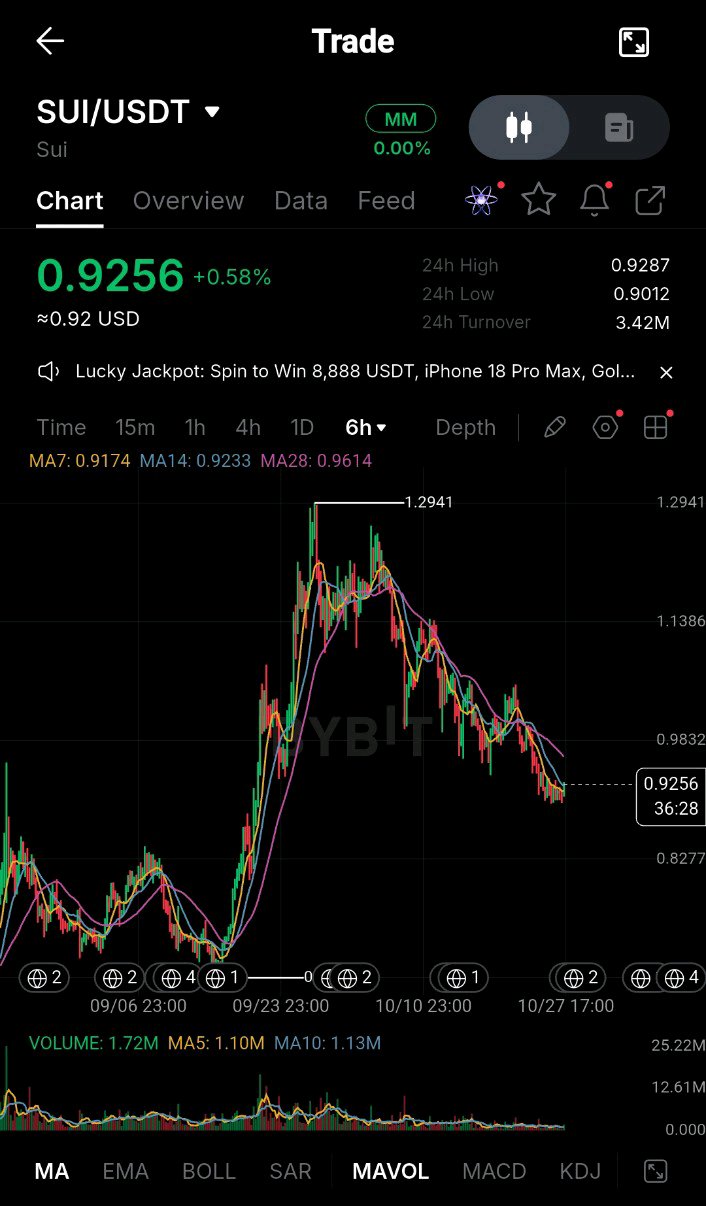
$SUIUSDT (Sui) Update – October 27, 2026** SUI trades near $0.925–0.926, up ~0.5–0.6% in the past 24 hours (24h high ~$0.9287, low ~$0.901). 7-day performance is down approximately 7–11%. Market capitalization stands at ~$3.80–3.81 billion (rank #26–#32), with 24h trading volume of $280–310 million. Circulating supply is 4.12 billion SUI (41.2% of 10 billion max supply). Fully diluted valuation is ~$9.23–9.26 billion. Sui-linked ETFs (GSUI, SUIS, TSUI) hold combined assets in the low tens of millions of dollars. GSUI (Grayscale Sui Staking ETF) reports AUM around $38–41 million as of late October, with modest recent inflows. On-chain metrics (DefiLlama, Oct 27): DeFi TVL ~$472 million. Stablecoin market cap ~$430 million (down ~19% over 7 days; USDC dominant at ~63%). 24h active addresses ~130,000; transactions ~41 million. Recent developments include Cetus Protocol’s AI agent tools for swaps/liquidity, Samsung Wallet USDC integration rollout targeting ~82 million U.S. Galaxy devices (gasless transfers), Sui Foundation’s $30 million investment in DATA Network (migrating to Sui), and Hashi’s Bitcoin finance platform advancing with $500M+ capital commitments. Network tests previously recorded high theoretical TPS figures. SUI remains ~83% below its January 2025 all-time high of $5.35 amid broader market conditions and recent ecosystem liquidity shifts. #IMPACTbyTrade #AnthropicS1Filing #ByXIMPACT
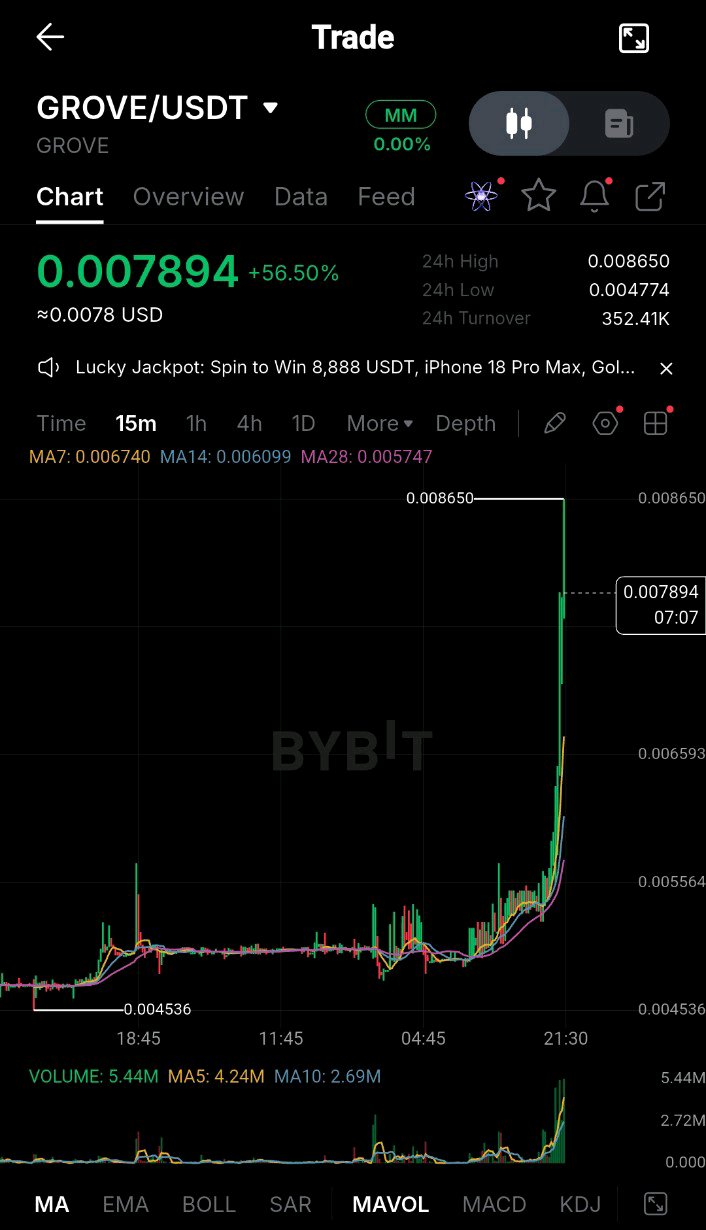
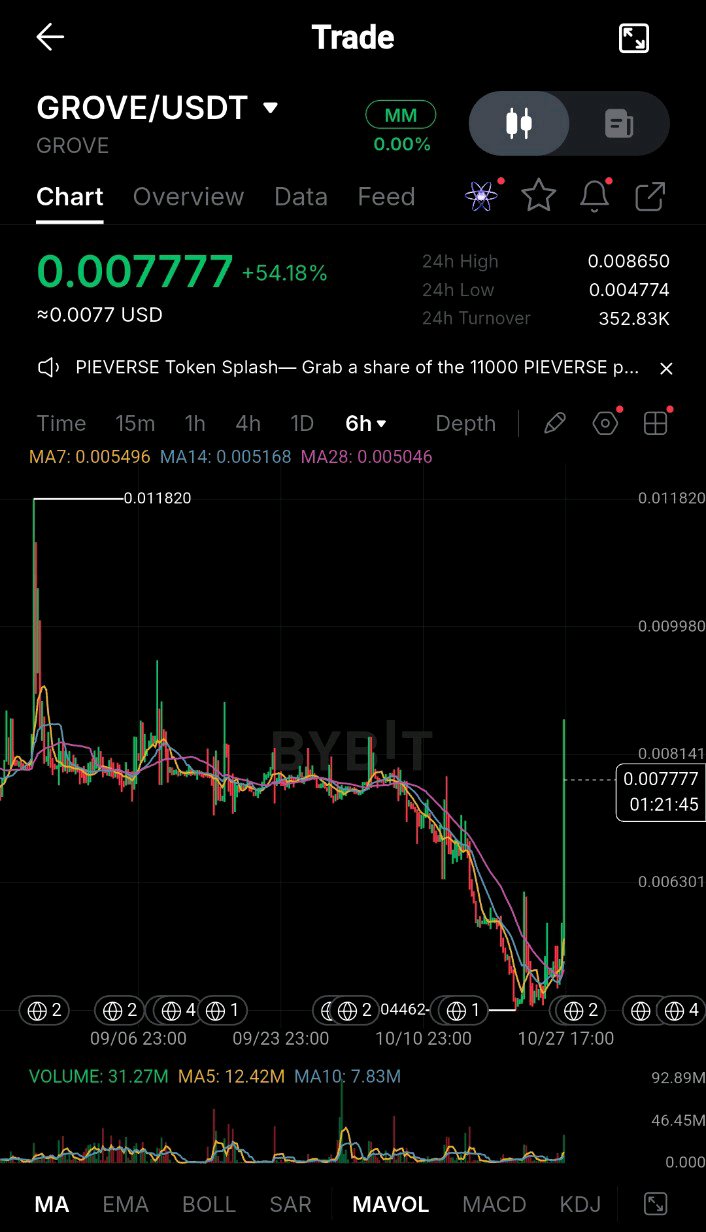
$GROVEUSDT (Grove Finance) GROVE trades near $0.0078 on major exchanges including Bybit, up approximately 54-56% in the past 24 hours. 24h high reached $0.00865 and low $0.00477. Trading volume in the period exceeded $350k on Bybit alone, with broader 24h volumes reported in the $0.6–1.3M range across venues. Market capitalization stands near $7M based on circulating supply of roughly 897 million GROVE tokens. Fully diluted valuation is approximately $78M against a maximum and total supply of 10 billion. Rankings place it around #1,200–1,600 depending on the data source. No ETF products or flows are associated with GROVE. Grove operates as an onchain credit and capital allocation protocol within the Sky (formerly MakerDAO) ecosystem. Protocol TVL is approximately $1.39 billion across Ethereum, Base, Avalanche, Plume, and other chains, with the largest share on Ethereum. The protocol deploys stablecoin liquidity into tokenized real-world assets, lending markets, and related strategies. Token holder count is in the low hundreds (around 650–660). Specific active address or transaction metrics for the token itself remain limited in public aggregators. Recent developments include continued operation of Grove Basin for instant liquidity on tokenized assets, the Seeds governance and staking program for stGROVE, a warehouse lending facility with Galaxy Digital, and partnerships expanding RWA yield access (including Mantle). Institutional names such as BlackRock, Apollo, Janus Henderson, and Galaxy appear in protocol communications regarding capital deployment. The token launched in mid-2026 with allocation weighted toward the Sky ecosystem. GROVE remains a mid-to-low liquidity DeFi governance token tied to institutional credit infrastructure. Price has recovered from recent lows near $0.0045 but trades well below its July 2026 all-time high near $0.045. Data reflects conditions as of late October 2026. #IMPACTbyTrade #MidtermsMarketWatch #ByXIMPACT

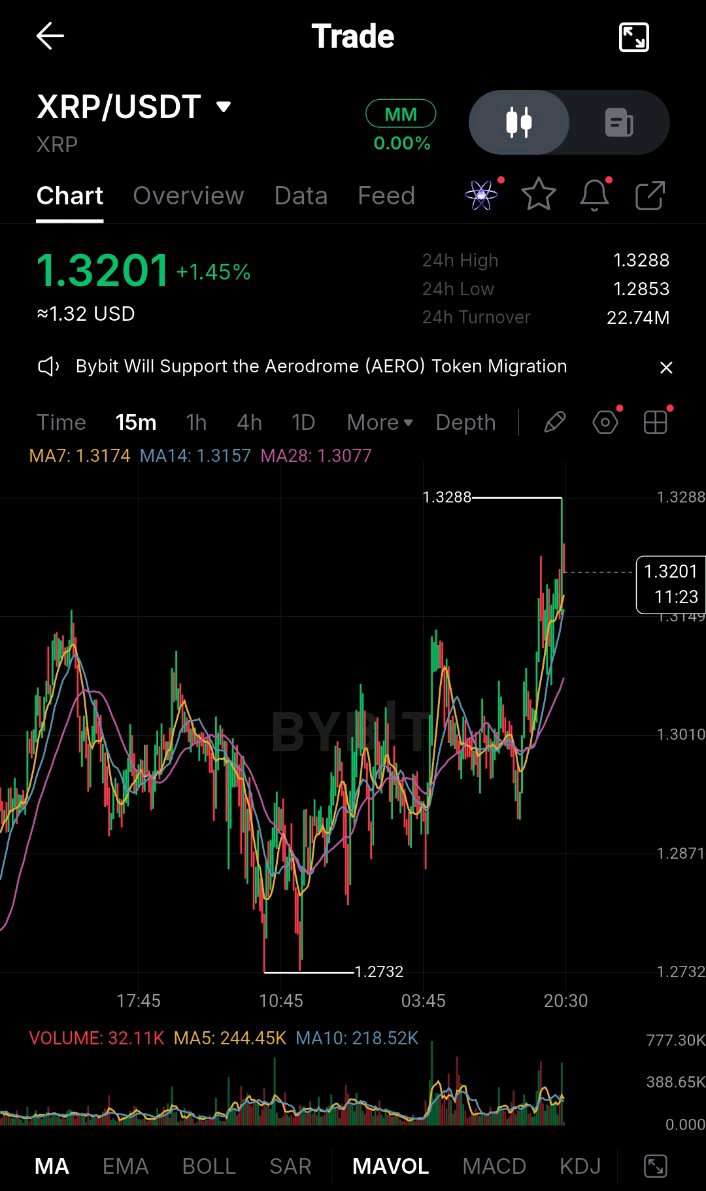
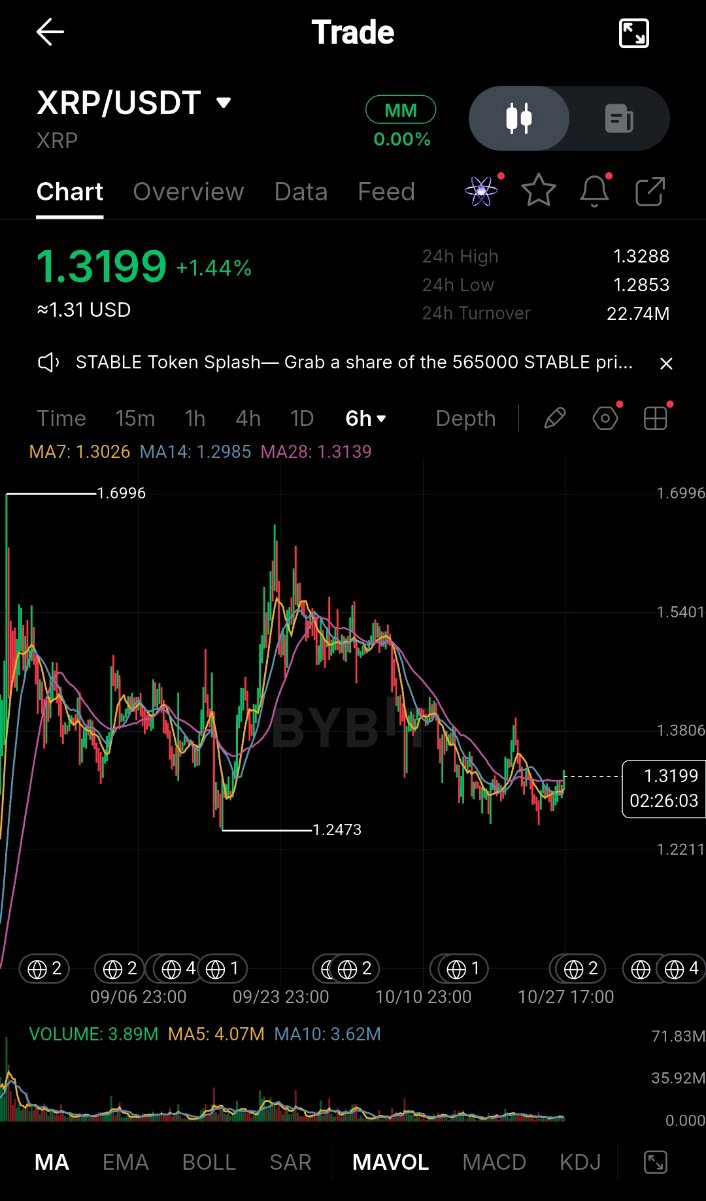
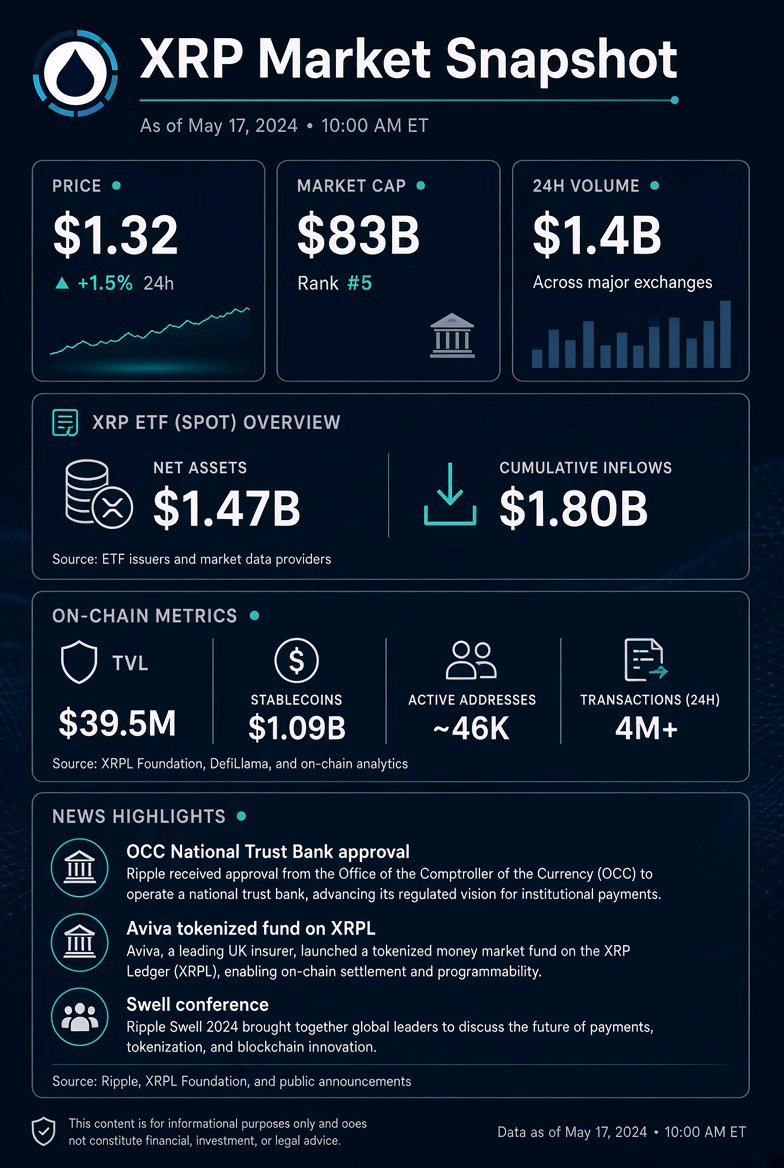
$XRPUSDT trades at approximately $1.32, up 1.4–1.5% in the past 24 hours and roughly 0.9% over seven days. Market capitalization stands near $83 billion (rank #5). 24-hour trading volume is about $1.4–1.5 billion. Circulating supply is 63.35 billion XRP out of a maximum 100 billion. US spot XRP ETFs hold roughly $1.47 billion in net assets with cumulative net inflows of approximately $1.80 billion since launch in late 2025. Recent daily activity included a $3.6 million net outflow on October 26, following mixed weekly flows. On the XRP Ledger, DeFi TVL is about $39.5 million. Stablecoin market capitalization reaches $1.09 billion, dominated by RLUSD. Recent 24-hour figures show around 46,000 active addresses and over 4 million transactions. Recent developments include Ripple receiving final OCC approval for a National Trust Bank charter to support RLUSD and digital asset custody. Aviva Investors launched a tokenized fund share class on the XRP Ledger. Ripple’s Swell conference is underway in New York. Large-holder concentration has risen to multi-year highs. XRP remains well below its July 2025 all-time high of $3.65 and has declined roughly 14% over the past month amid broader market conditions and slower ETF inflows after earlier strong accumulation periods. #IMPACTbyTrade #MidtermsMarketWatch #ByXIMPACT
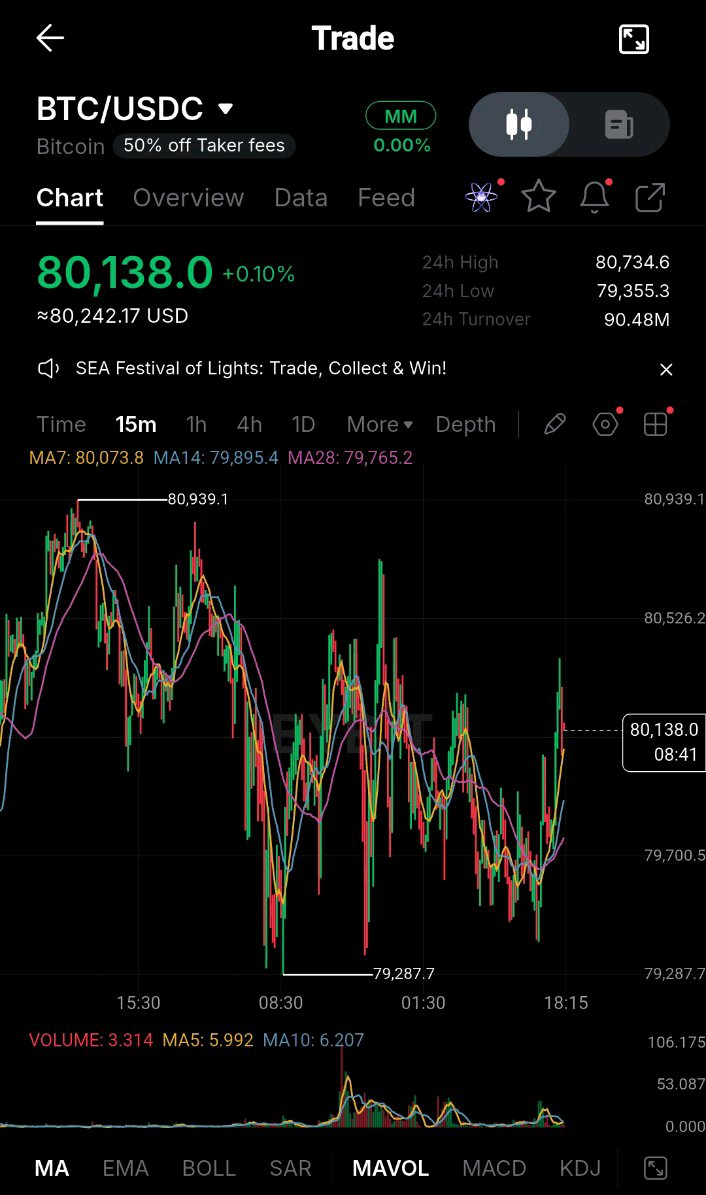
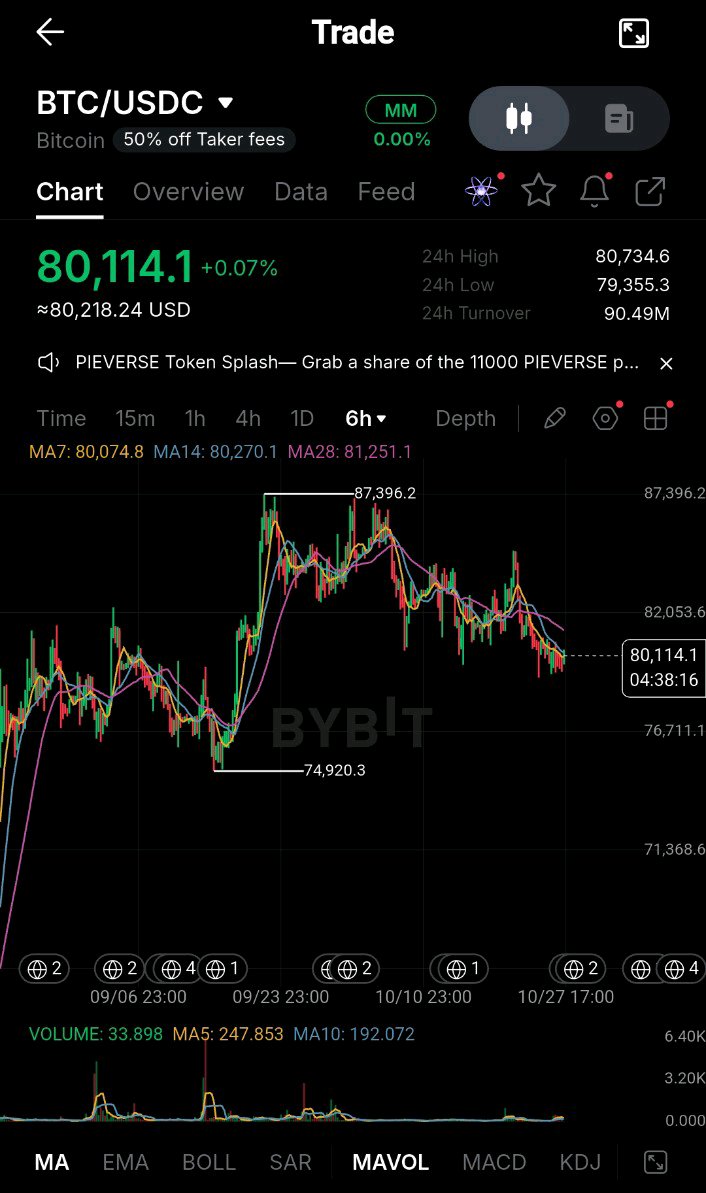
Bitcoin $BTCUSDT Update – October 27, 2026 Bitcoin trades near $80,140–$80,250, up approximately 0.1–0.3% over 24 hours and down roughly 2–3.5% over 7 days. Market capitalization stands at $1.61 trillion (rank #1). 24-hour trading volume ranges $20–27 billion. Circulating supply is 20.10 million BTC (about 95.7% of the 21 million maximum). US spot Bitcoin ETFs recorded a net inflow of $110.3 million on October 26, driven entirely by BlackRock’s IBIT. Total net assets are approximately $102.8–107 billion, with holdings near 1.28–1.29 million BTC. Cumulative net inflows since launch total about $57.3 billion. Recent days showed mixed flows, including prior outflows exceeding $600 million on some sessions. On-chain metrics indicate daily active addresses around 612,000–636,000 and roughly 822,000–829,000 transactions. DeFi TVL on Bitcoin is approximately $4.27 billion. Network transfer value remains elevated while transaction fees stay low. Recent developments include price consolidation near the $80,000 level after a brief dip below it, mixed institutional ETF activity, and ongoing Federal Reserve policy discussions. Mining and network data show continued high settlement volumes with subdued fee generation. Corporate and mining-related purchases have been noted in recent reports. Overall market context reflects range-bound trading amid macro uncertainty and steady institutional product holdings. #IMPACTbyTrade #MidtermsMarketWatch #ByXIMPACT

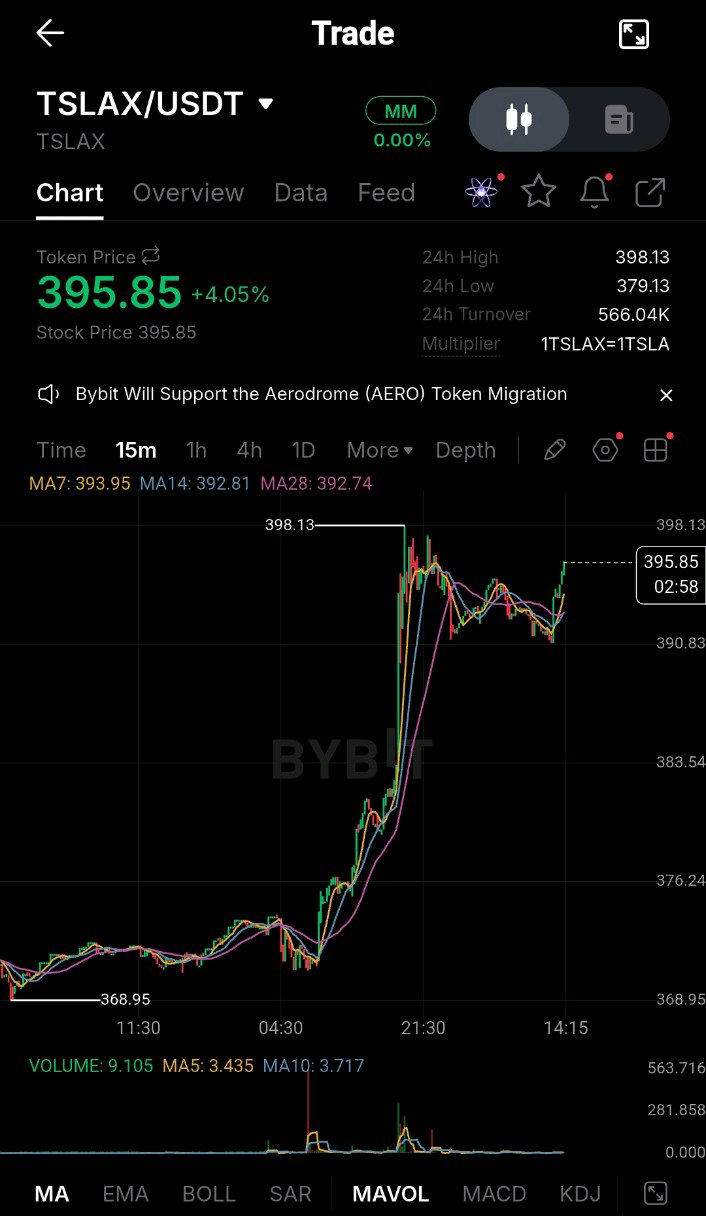
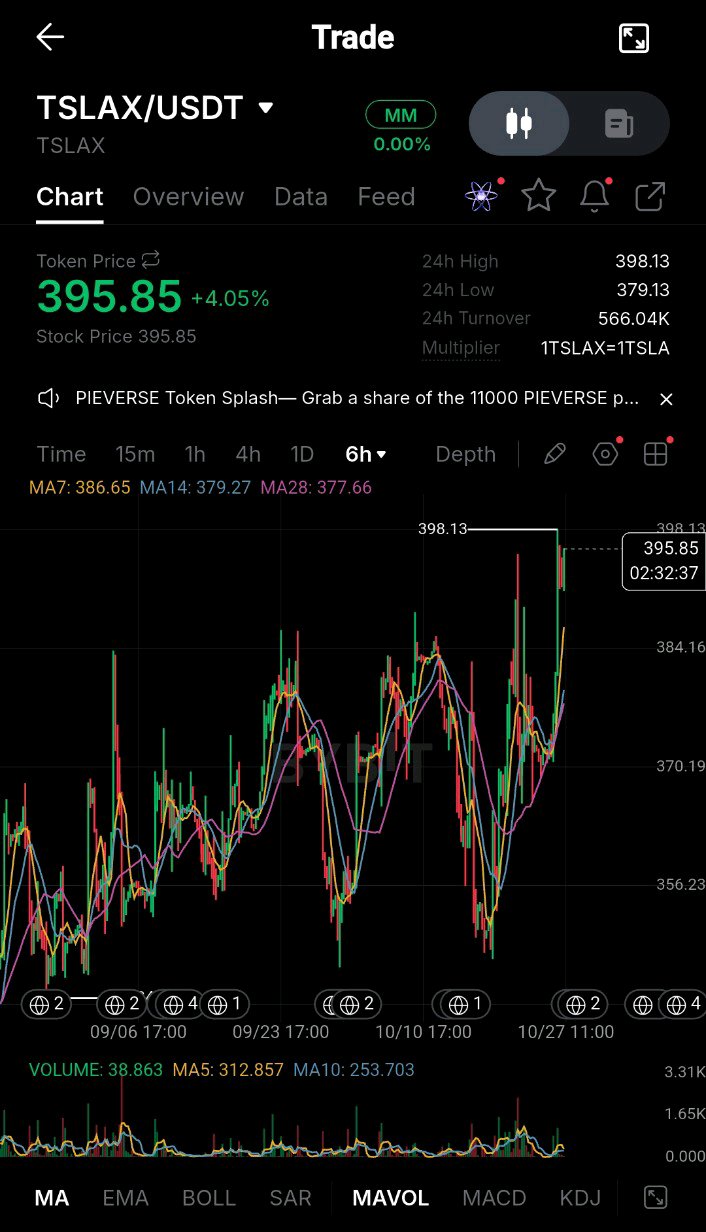
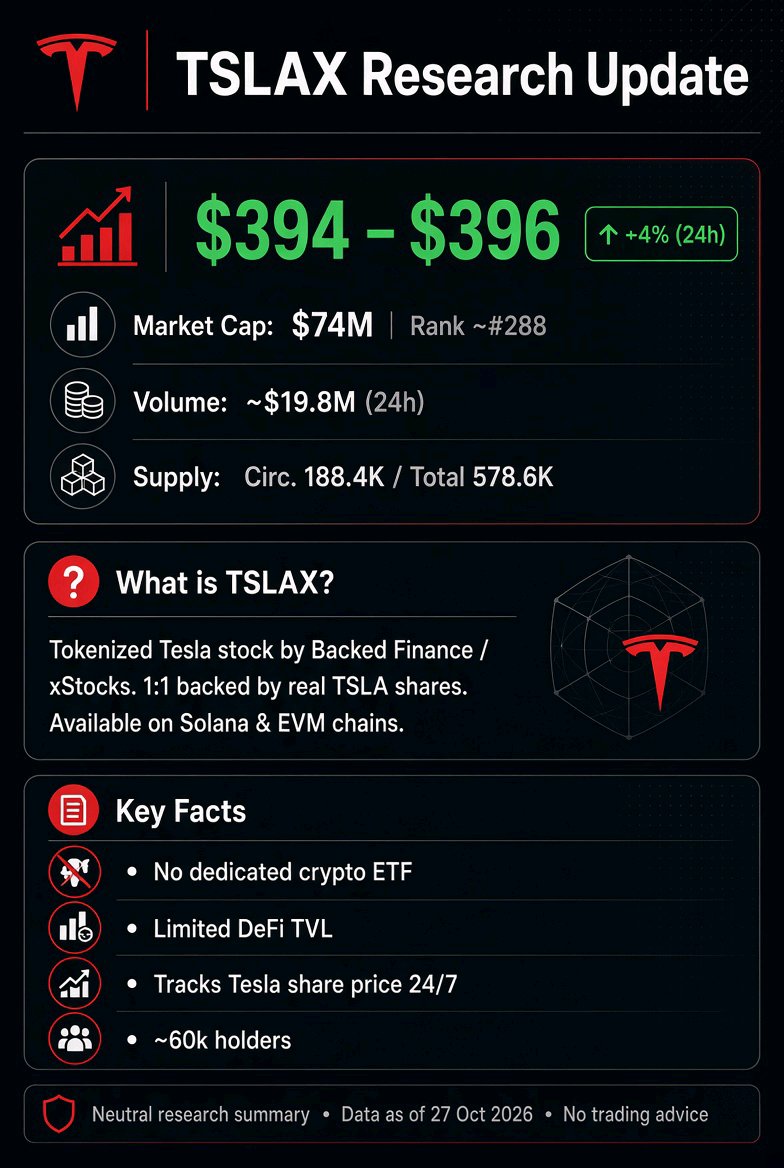
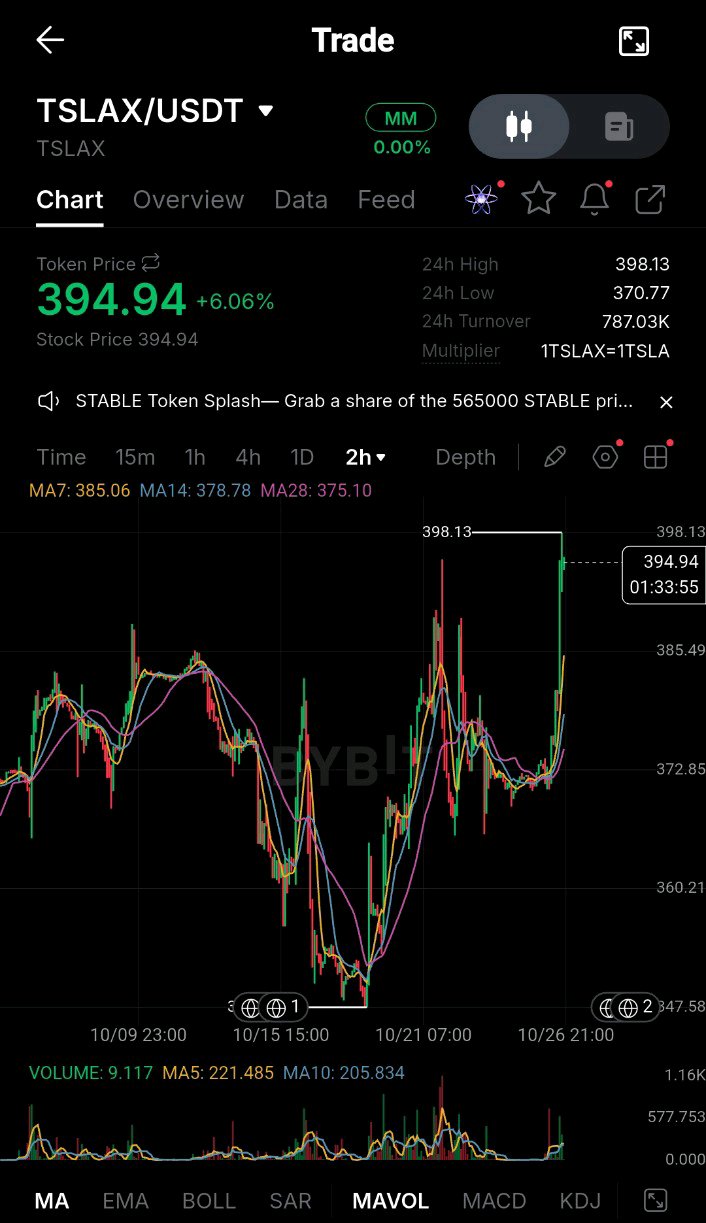
$TSLAXUSDT (Tesla xStock) is a tokenized tracker certificate issued by Backed Finance / xStocks that provides 1:1 price exposure to Tesla, Inc. (TSLA) shares. It is available as an SPL token on Solana and ERC-20 on EVM chains, backed by real TSLA shares held in regulated custody. Holders receive economic exposure but no voting rights or direct equity ownership. As of late October 27, 2026, TSLAX trades near $394–396 (Bybit showing ~395.85). It is up approximately +4% over the past 24 hours, with a 24h range of roughly $378–$398 and trading volume around $19–20 million. Market capitalization stands near $74 million, ranking approximately #287–#290. Circulating supply is about 188,400 TSLAX out of a total supply near 578,600 (no hard max supply). 7-day performance is positive in the +3% to +6% range across sources. All-time high was $497.08 (December 2025); all-time low $290.28 (July 2025). No dedicated crypto ETF flows or AUM data apply, as TSLAX is a tokenized stock product rather than an ETF. On-chain activity centers mainly on Solana with secondary presence on Ethereum, Arbitrum, and others. Holder count is reported around 60,000. DeFi usage remains limited, with relatively low TVL in liquidity pools (tens to low hundreds of thousands of dollars across major DEXes) and modest transaction volumes compared with major cryptocurrencies. No significant stablecoin supply metrics are tied specifically to the TSLAX network itself. Recent updates include continued listings and liquidity support on platforms such as Bybit, expansion of the broader xStocks suite of tokenized equities, and price movements that generally track Tesla’s traditional share performance amid company news (including product reveals and earnings periods). The product enables 24/7 trading and fractional exposure for eligible non-U.S. users within a regulated RWA framework. #IMPACTbyTrade #MidtermsMarketWatch #ByXIMPACT
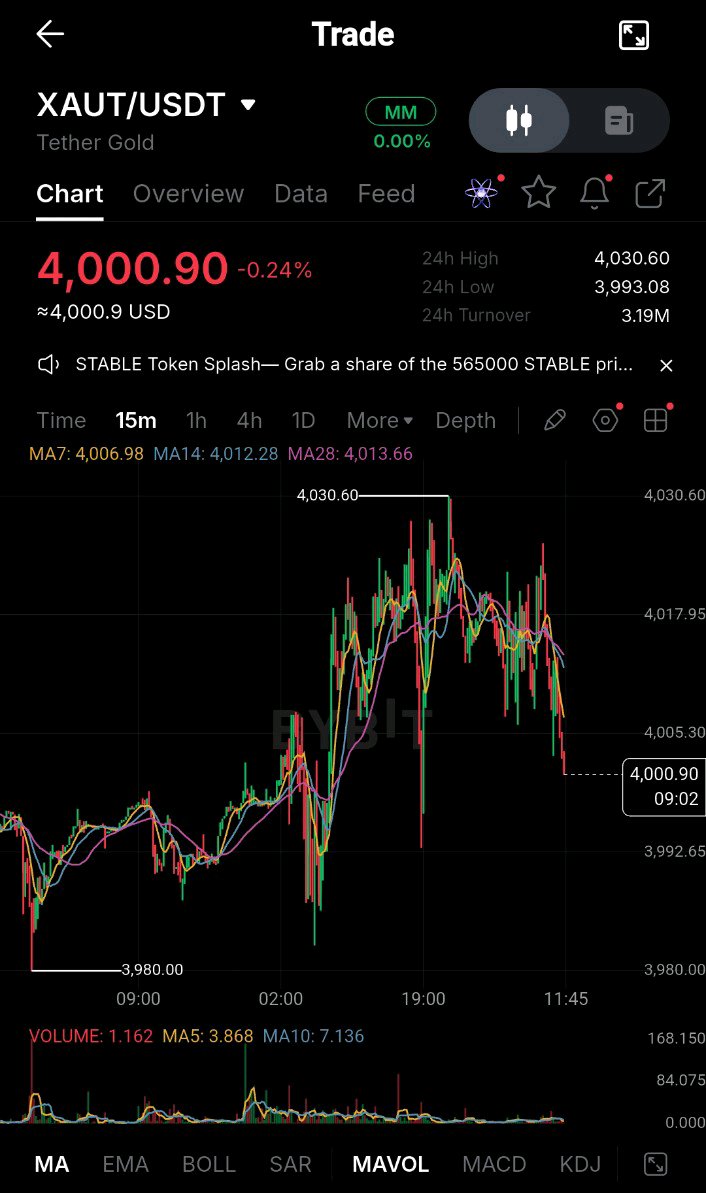
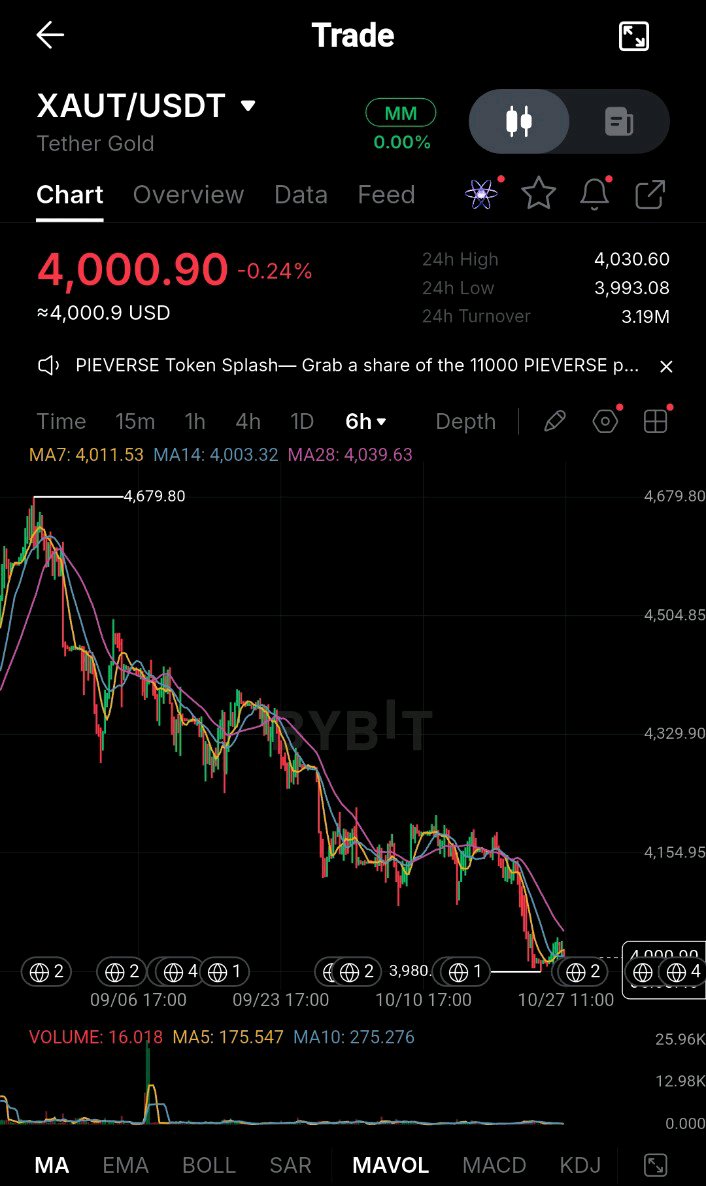
Tether Gold $XAUTUSDT trades near $4,001–$4,010, down approximately 0.1–0.24% over 24 hours and 2.8–3.1% over 7 days. Market capitalization stands at roughly $3.2–3.25 billion (rank #33), with 24-hour trading volume in the $100–150 million range. Circulating supply is approximately 809,000 XAUT (total supply near 827,000); each token represents one troy ounce of LBMA Good Delivery gold held in allocated custody. XAUT is a tokenized gold product rather than a traditional ETF, so conventional ETF flow data does not apply. On-chain AUM is reported near $3.4 billion, predominantly on Ethereum. DeFi deposits involving XAUT have grown, with total active TVL previously exceeding $100 million (Aave holding the majority share across V3/V4 markets, followed by Uniswap and other venues). On-chain activity includes tens of thousands of active addresses over recent 30-day periods and over 140,000 holders. Large transfers and exchange flows remain observable, with net exchange activity varying week to week. Recent developments include continued minting of additional XAUT (including substantial issuance earlier in the year), rising institutional holdings reported by some funds, and increased use of the token as collateral in DeFi. Quarterly attestations confirm physical gold reserves backing circulating tokens. Price action continues to track broader gold market movements amid macroeconomic conditions. XAUT remains one of the larger tokenized gold assets by market value within the expanding real-world asset (RWA) commodity segment. #MyByXTake #IMPACTbyTrade #ByXIMPACT
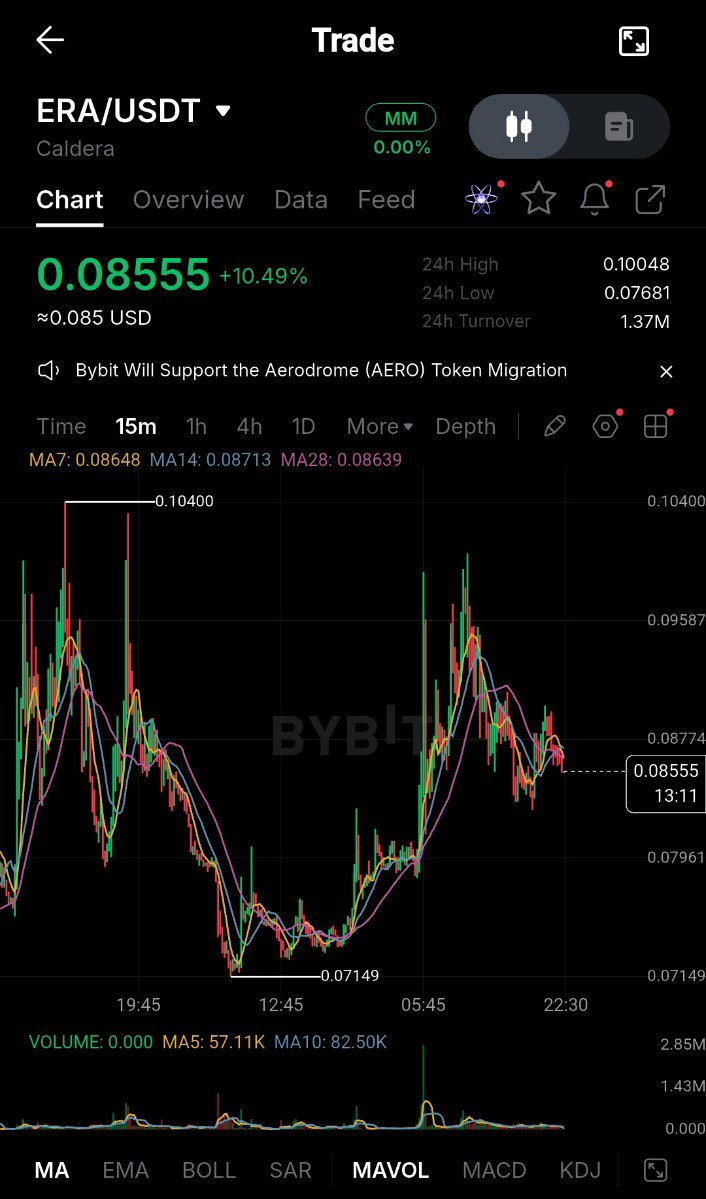
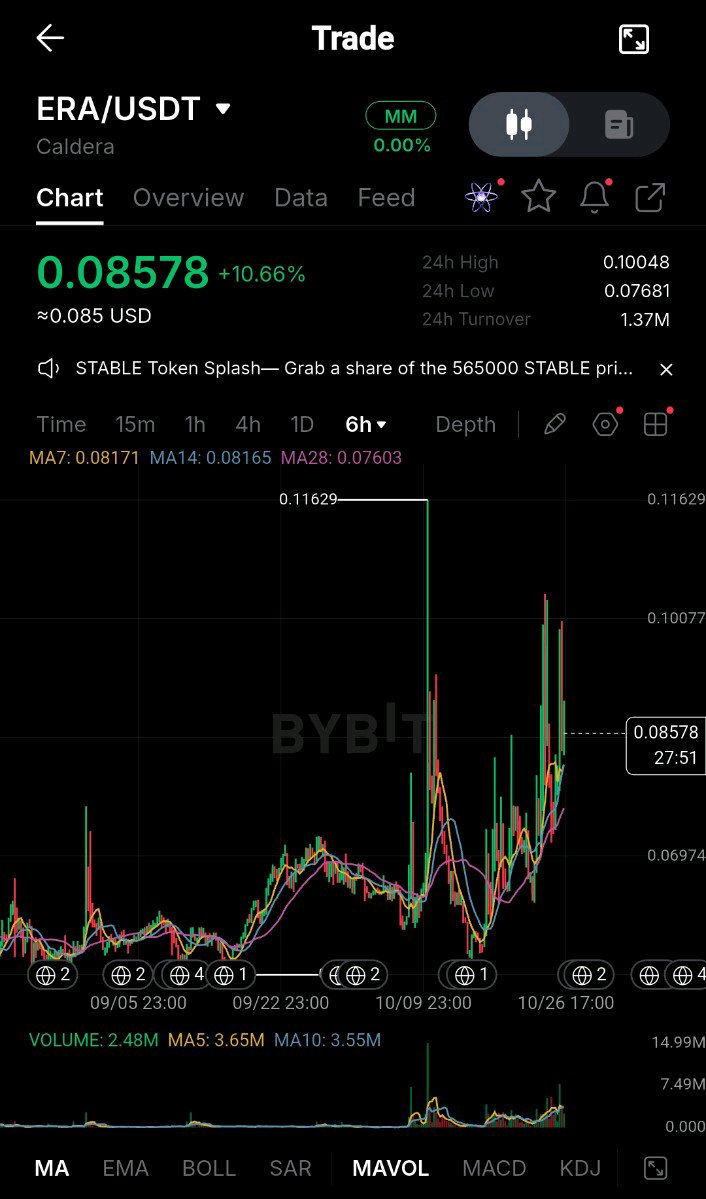
Caldera $ERAUSDT trades near $0.085–0.092, up approximately 10–25% over 24 hours on elevated volume of roughly $40–90M. Market capitalization is about $13–16M (rank roughly #700–1,000). Circulating supply stands near 148.5–175M ERA of a 1B maximum supply. 7-day performance is positive in the +13–30% range. No ETF flows or related assets data are available for ERA. Caldera operates as rollup infrastructure enabling customizable Ethereum L2/L3 chains. Ecosystem metrics include cumulative transactions exceeding 1 billion, unique wallets in the tens of millions, and reported TVL across powered chains historically in the $177–300M+ range (self-reported, varying by source). Direct ERA on-chain activity metrics such as active addresses specific to the token or stablecoin supply on a native network are limited, as ERA functions primarily as a utility and governance token for the Metalayer and related incentives. Recent updates include a domain migration of millions of subnames and ongoing development of the ERA Strategic Reserve (initially funded via open-market purchases). Price action has shown high volatility and turnover following the July 2025 token generation event, with the asset remaining substantially below its all-time high near $1.88–2.2. Current conditions reflect elevated trading activity amid broader interest in modular rollup infrastructure. #IMPACTbyTrade #MidtermsMarketWatch #ByXIMPACT
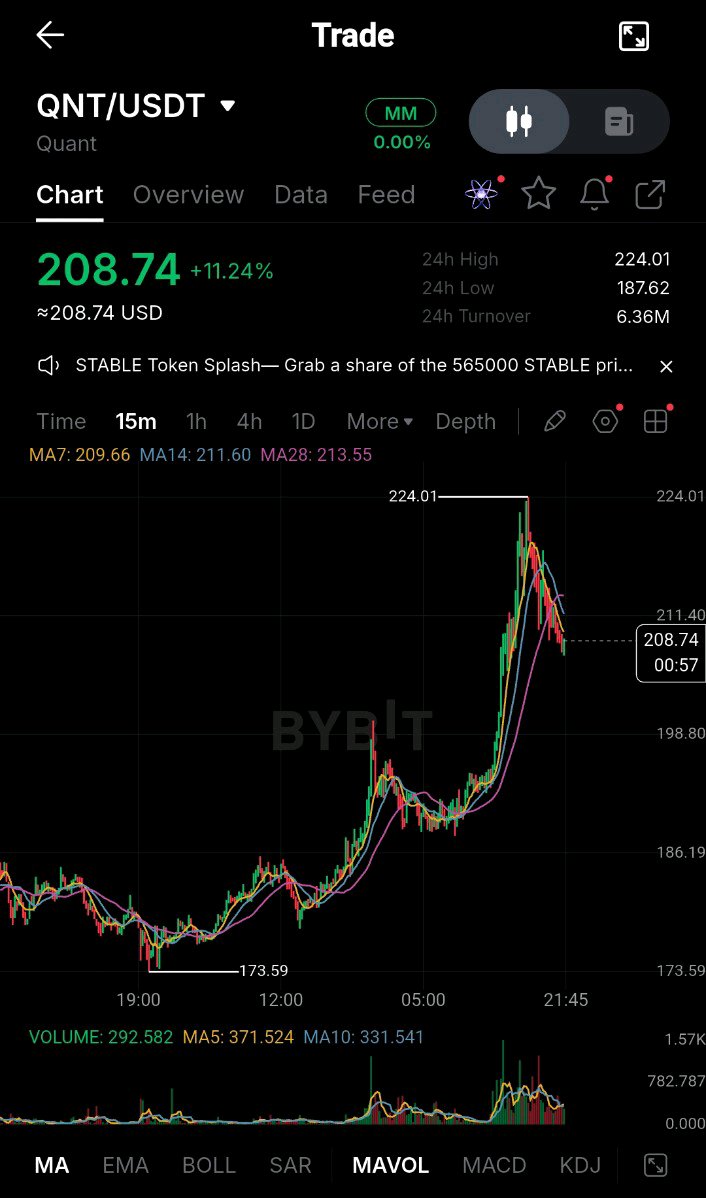
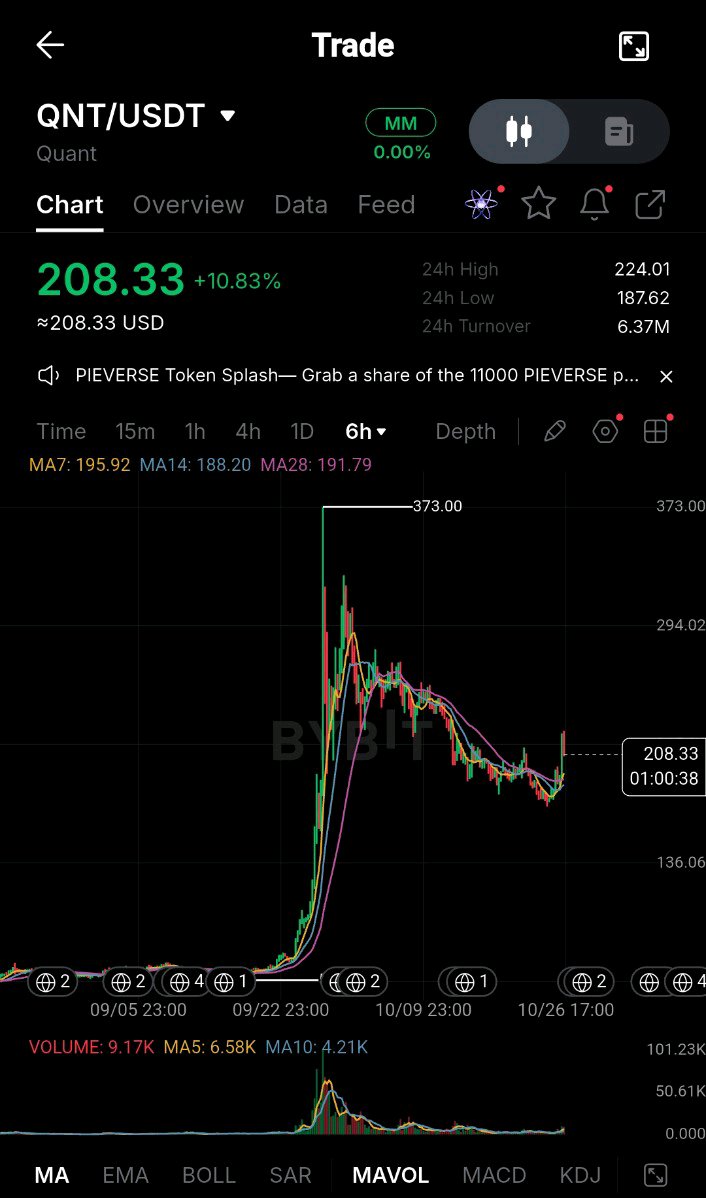
$QNTUSDT trades near $210, up approximately 11-12% over 24 hours with volume around $80-180M. Market capitalization stands near $2.4-2.5B (rank ~#36-37). Circulating supply is reported as approximately 12.07M QNT of a max supply near 14.88M (some trackers list ~14.56M circulating). 7-day performance is roughly flat to mildly negative following a prior sharp advance. No dedicated QNT ETF or related fund flows/assets data is available. QNT is an ERC-20 token on Ethereum. Holder count is approximately 190,000. Detailed public metrics for daily active addresses, transaction counts, network TVL, or stablecoin supply specifically tied to Quant infrastructure are limited, as the project functions primarily as an interoperability operating system (Overledger) rather than a base-layer chain with native DeFi activity. Recent developments center on institutional adoption. In late September 2026, The Clearing House selected Quant to provide the interoperability, orchestration, and transaction-management layer for its On-Chain Money Initiative, a network for clearing and settling tokenized deposits that connects to existing U.S. rails including RTP and CHIPS. Availability to participating institutions is targeted for the first half of 2027. Parallel UK activity includes live tokenized sterling deposit pilots involving major banks. Quant’s Fusion multi-ledger rollup, connecting dozens of chains, is also operational. QNT has experienced elevated volatility after a strong September rally linked to the Clearing House announcement, with subsequent consolidation and a recent rebound amid broader market conditions focused on real-world asset tokenization and bank infrastructure. #IMPACTbyTrade #ByXIMPACT #MidtermsMarketWatch
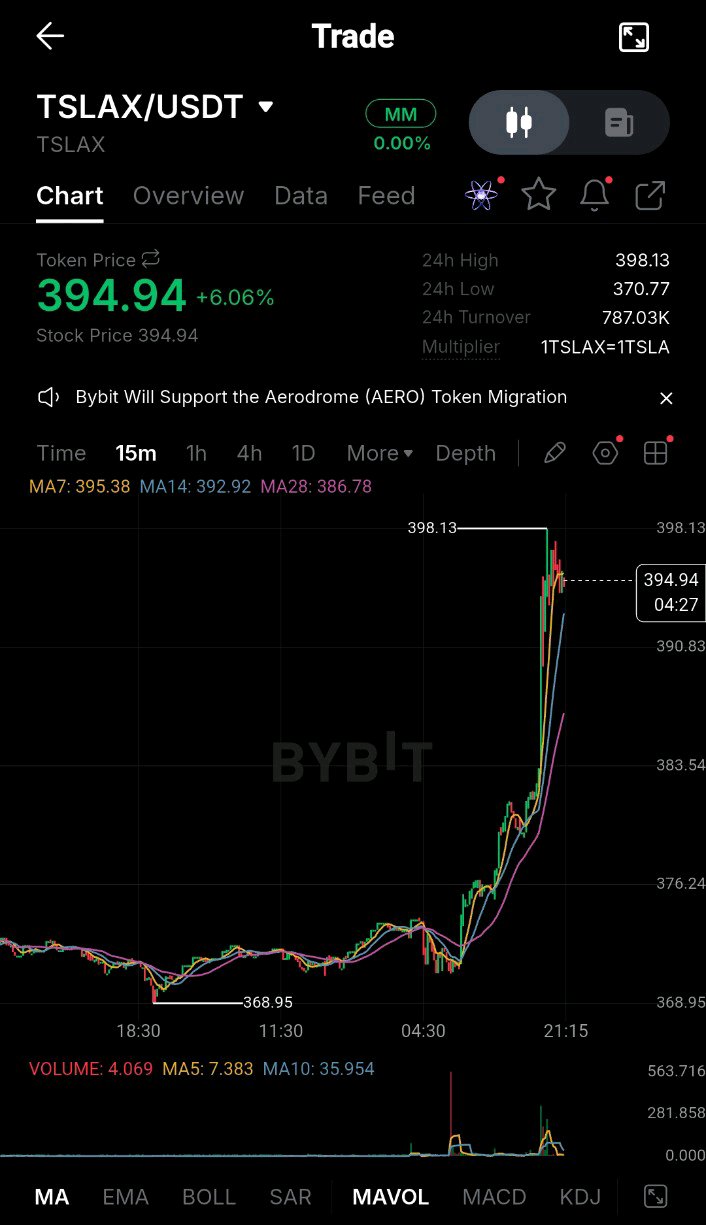
$TSLAXUSDT (Tesla xStock) — Market & On-Chain Overview | October 26, 2026 Tesla xStock (TSLAX) is a tokenized asset designed to track Tesla Inc. shares, bringing stock-linked exposure into blockchain markets through the xStocks ecosystem. Market data: Bybit’s supplied screenshot shows TSLAX at $394.94, up 6.06% over 24 hours, with a high of $398.13 and a low of $370.77. Reported 24-hour turnover is 787.03K USDT. CoinMarketCap’s latest indexed data differs, reporting $375.56, a $71.19 million market cap, $6.3 million in 24-hour volume, and approximately 189,570 circulating tokens. These figures vary by source and venue. Weekly performance: The latest indexed market registry reports a 7-day gain of approximately 7.22%, based on data available October 23. On-chain activity: DeFiLlama reports approximately $66.53 million in on-chain assets under management and $6.51 million in DeFi TVL across tracked protocols. Solana accounts for the largest share of the reported asset value. CoinMarketCap lists approximately 60,380 holders. A verified, current aggregate for active addresses, transaction count, and network-wide stablecoin supply was not available in the reviewed sources. ETF flows: No directly applicable ETF flow series or ETF net-assets figure was identified for TSLAX itself. It is a tokenized stock product, not a conventional ETF. Recent developments: An October 2026 report put tokenized Tesla and SpaceX products at a combined $403 million on-chain, with TSLAx accounting for approximately $69 million in the cited dataset. The report also highlighted fragmentation across competing tokenized-stock products. Market context: TSLAX connects traditional equity exposure with blockchain-based transfers and DeFi integrations. Its market activity reflects both Tesla’s underlying share-price movements and the liquidity, pricing, and operational characteristics of tokenized assets. #IMPACTbyTrade #ByXIMPACT #AnthropicS1Filing
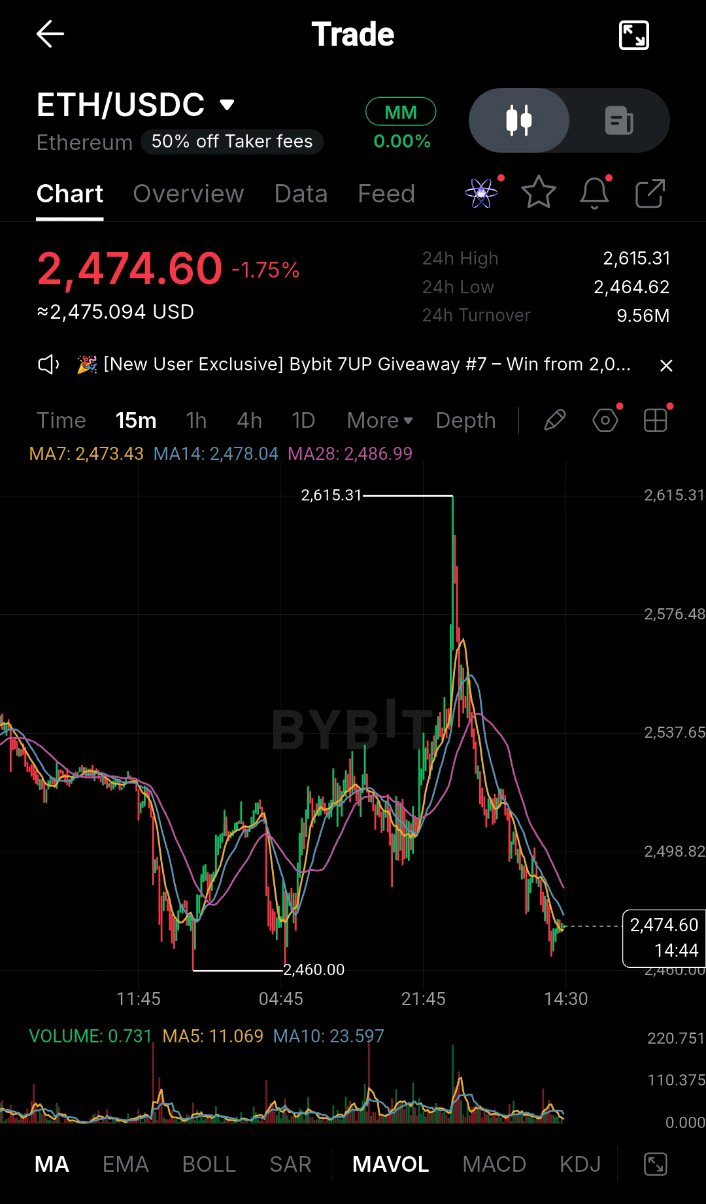
Ever stared at a fifteen-minute chart until the candles stop looking like data and start looking like a heart monitor? Right now, Ethereum is hovering near $2,474 against USDC, sliding about 1.7% on the day while trapped under a stubborn $2,615 ceiling. Standard technical analysis points us straight toward the moving averages—the MA7, MA14, and MA28 all tangled together like tired runners—trying to squeeze some profound prophecy out of them. But zoom past the blinking indicators and fee-discount banners, and a much stranger reality emerges about how liquidity actually moves. For months, the chorus has been loud: execution layers and alternate networks are draining mainnet dry, leaving the core asset as little more than a custody receipt for institutional players. Yet, when you look closely at active turnover on pairs like ETH/USDC, order book depth tells a quieter, more resilient story. Market makers aren't abandoning ship; they are aggressively recalibrating risk parameters in real-time, treating these localized ranges as a high-stakes playground. What gets lost in the noise is the sheer psychological weight of these mid-range bounds. That sharp rejection wick hitting near $2,615 wasn't random volatility. It was an algorithmic wall where leveraged long positions collided head-on with passive spot liquidity takers locking in minor gains. We love dressing up routine market plumbing in grand ideological narratives. When prices stall, commentators invent structural crises; when they bounce, they shout about secular reversals. But the truth in these tight bands is purely mechanical. It’s a grinding tug-of-war between resting limit orders and impatient market participants, playing out against an economic backdrop where neither bulls nor bears possess the raw conviction to break the channel.$ETHUSDC #BybitAIBestReplies #CPI3.4 #MyBybitAIPromptPlaybook
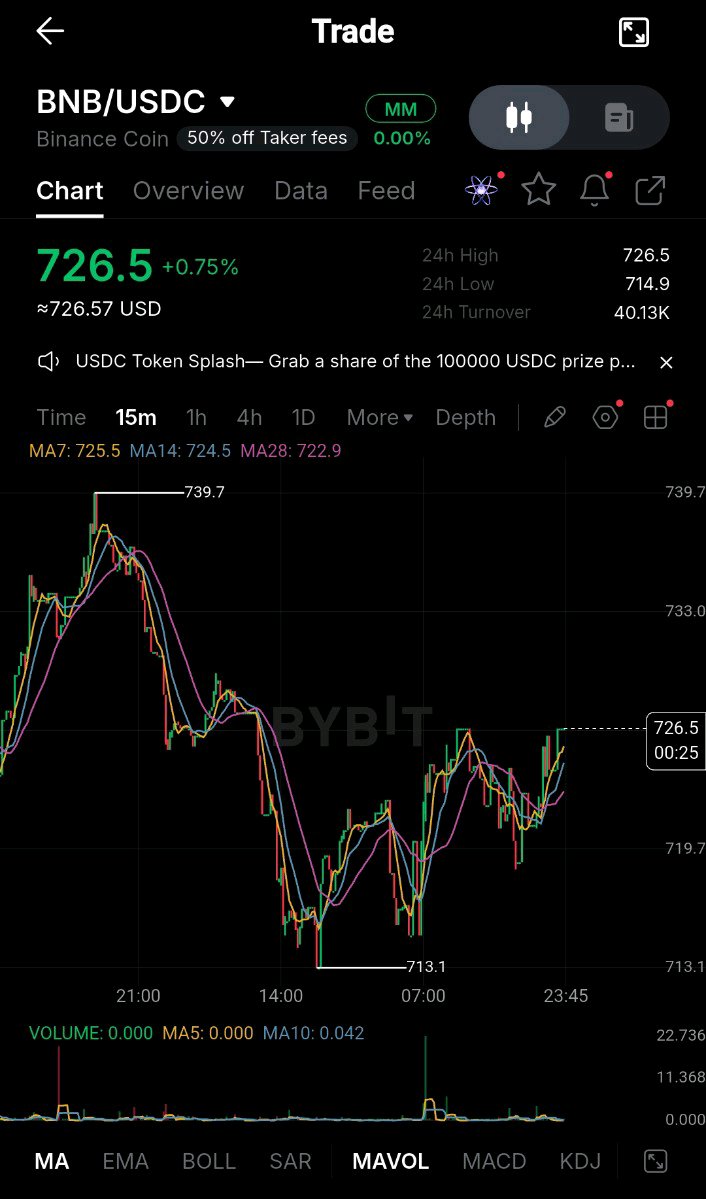
Staring at a 15-minute chart during a choppy session often feels less like financial forecasting and more like watching a pulse monitor during an adrenaline spike. Look at that BNB/USDC chart sitting right around $726.5. On the surface, it is a modest 0.75% green tick on an exchange screen. But if you track how those moving averages compressed after rejecting the 739.7 local peak—the MA7 tumbling down through the MA14 and MA28 before curling sideways—you can practically see the structural exhaustion settling into the order book. Markets love to punish anyone who tries to draw straight lines through chaos. We convince ourselves that every swing is driven by pristine fundamental logic, as if algorithmic execution and emotional fatigue don't dictate ninety percent of the intraday noise. Trace that steep descent from the 739.7 high down to the 713.1 floor, and you are looking at a textbook liquidity clearance. That wasn't just a random drift downward; it was a heavy-handed flush that systematically washed out late breakout buyers and trapped aggressive longs before the market even tried to find its footing. What gets lost in the shorthand summaries is the sheer wear and tear of trading these compressed ranges. When overhead resistance hardens and momentum stutters, every relief bounce feels fragile, tempting traders into premature entries only to pull the rug right after. Yet, notice how the volume bars at the bottom flatline during the deep consolidation phases, only spiking microscopically when the price tests support near 713. That tells you the recovery back toward 726 wasn't backed by an aggressive wave of fresh capital. It was a classic retracement driven by fading sell pressure and trapped shorts scrambling to cover before weekend gaps. We treat indicators like moving averages as holy scripture when they are really just historical footprints of collective panic and relief. When BNB cratered toward 713, social feeds instantly pivoted to bearish panic, calling for a deeper slide below 700. But that exact zone of maximum discomfort is where passive buyers quietly absorbed the excess supply. The push back to $726.5 isn't a grand macro breakout; it's a mechanical grind back toward the midpoint of a messy range. Recognizing that distinction keeps you from chasing green candles that are often just traps waiting to snap shut. #BybitAIBestReplies #ClarityAct #ByXIMPACT
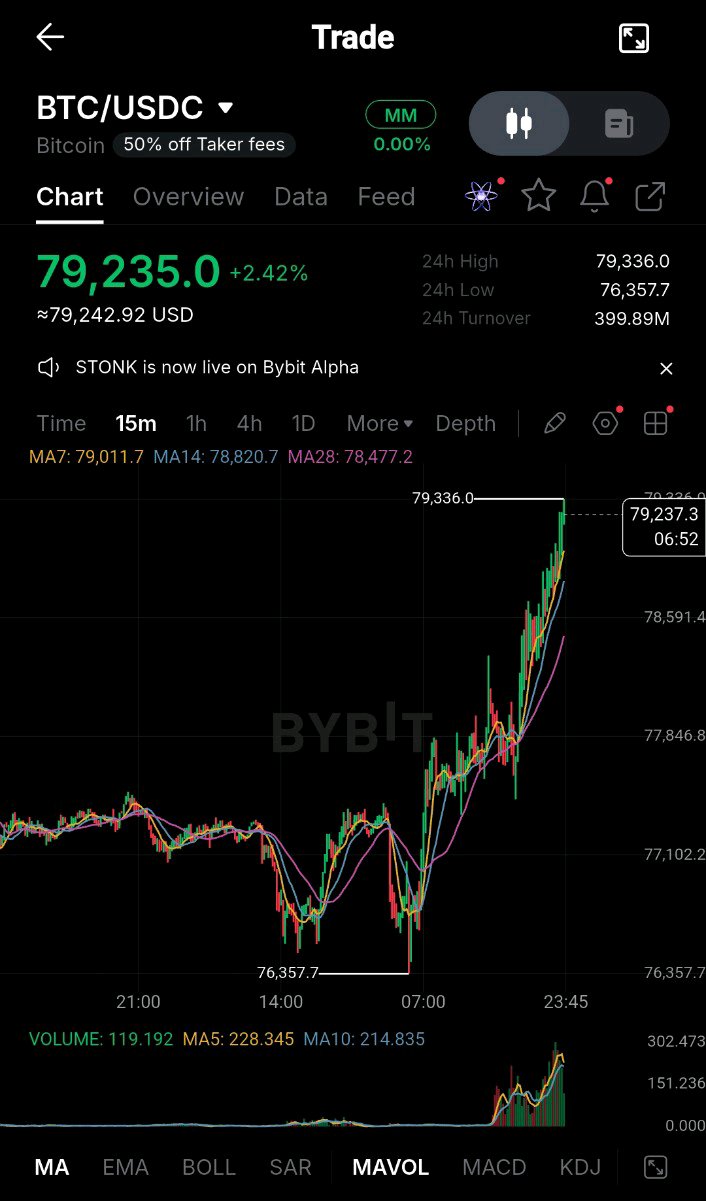
Staring at a 15-minute chart can feel less like trading and more like watching a seismograph during an underground tremor. Take a close look at that BTC/USDC pair hovering near $79,235. On the surface, it looks like just another green candle punching upward on an exchange interface. But if you watch the moving averages bunching together right before the vertical acceleration—the MA7 curling up sharply through the MA14 and MA28—you realize you are looking at the exact physical footprint of a localized liquidity squeeze. Markets rarely move in straight lines, yet participants constantly expect them to. We build elaborate narratives around macroeconomic data prints and rate expectations as if every tick on a terminal screen is driven by pure rational valuation. Zoom in on the price action between 14:00 and the sharp climb toward the 79,336 high, and you see the ugly mechanics of leverage at play. Hours before that vertical extension, the price violently flushed down to test the 76,357 floor. That wasn't a casual dip; it was a deliberate structural purge designed to hunt late longs and shake out over-leveraged margin positions before the real move could happen. What gets lost in the standard commentary is the psychological attrition required to trade these ranges. When sticky inflation readings give markets fewer excuses to ease, every breakout attempt feels like walking through wet cement. Yet, despite persistent crosscurrents that keep traditional investors hesitant, the baseline bids keep holding firmer than the bears care to admit. Notice how the volume profile at the bottom of the chart remains relatively muted during the consolidation phases before exploding into the green surge. That tells you the breakout wasn't fueled by broad, euphoric retail participation. It was a classic short-covering cascade—algorithmic traps snapping shut on anyone trying to front-run a breakdown below 76k. We tend to treat indicators like moving averages or MACD histograms as crystal balls when they are actually just lagging mirrors of human panic and greed. When the market dipped into the mid-$76,000 zone, sentiment turned instantly defensive. Yet, that is precisely where order books quietly absorbed the selling pressure. The push toward $79,200 wasn't a sustainable macro repricing; it was an efficient mechanical sweep of resting liquidity sitting above previous highs. Recognizing that distinction changes how you read every green candle and red wick flashing across your screen. #BybitAIBestReplies #ClarityAct #ByXIMPACT
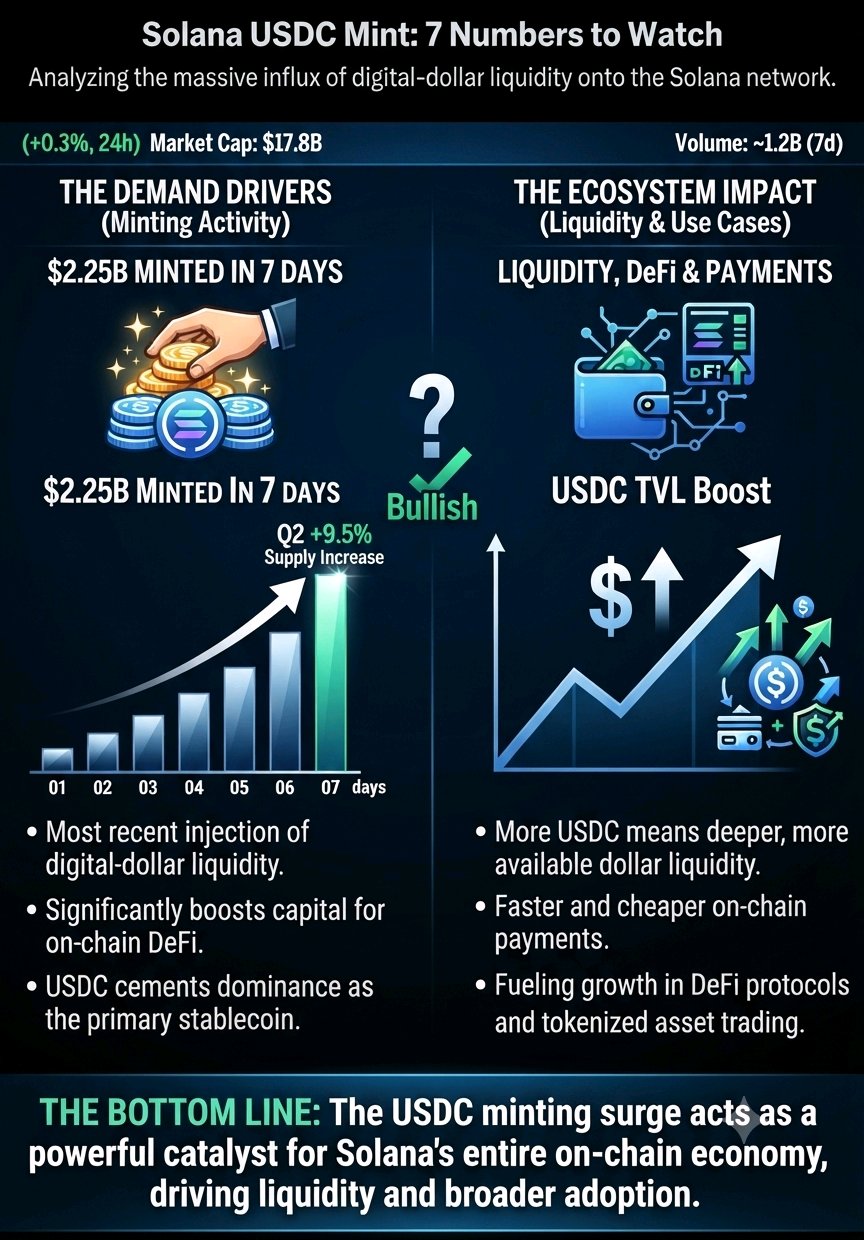
Solana USDC Mint: 7 Numbers to Watch Over the past seven days Circle has issued about $2.25 billion in USDC on the Solana network, demonstrating the increasing amount of digital-dollar liquidity entering the network. It is important since USDC is already a major component of Solana's stablecoin ecosystem and is used for payments, DeFi activities and on-chain trading. Here are the key numbers: * $2.25B USDC minted on Solana in 7 days * 7 days — period covered by the latest minting figure * The supply of the Solana stablecoin was $17.48 billion according to a previous record issued by SolanaFloor. * 72.3 percent — the proportion of the stablecoin supply that is in the form of USDC — The amount of USDC supply in the prior record was $12.64 billion. * 3.7 million — the number of wallets containing USDC within SolanaFloor's previous ecosystem data * 1,018 — Solana program IDs interacting with USDC in that analysis The most recent injection of $2.25 billion through minting is a substantial increase in liquidity, even though the act of minting does not mean that all of the newly issued USDC is at once used in DeFi or trading. In the past USDC has been the dominant stablecoin in Solana's market. According to a previous report by SolanaFloor, USDC made up 72.3 per cent of the stablecoin supply on the network and had interacted with more than 1,000 program IDs within the ecosystem. The bigger picture is: More USDC means deeper dollar liquidity. This makes more capital available for Solana's onchain economy. If the current rate of stablecoin issuance carries on, Solana may experience further growth in its payments, DeFi and tokenized-asset activities. Shouldn't the increasing liquidity of USDC serve as a major catalyst for Solana's ecosystem?$SOLUSDT$CRCLXUSDT #BybitAIBestReplies #ByXIMPACT #MyBybitAIPromptPlaybook
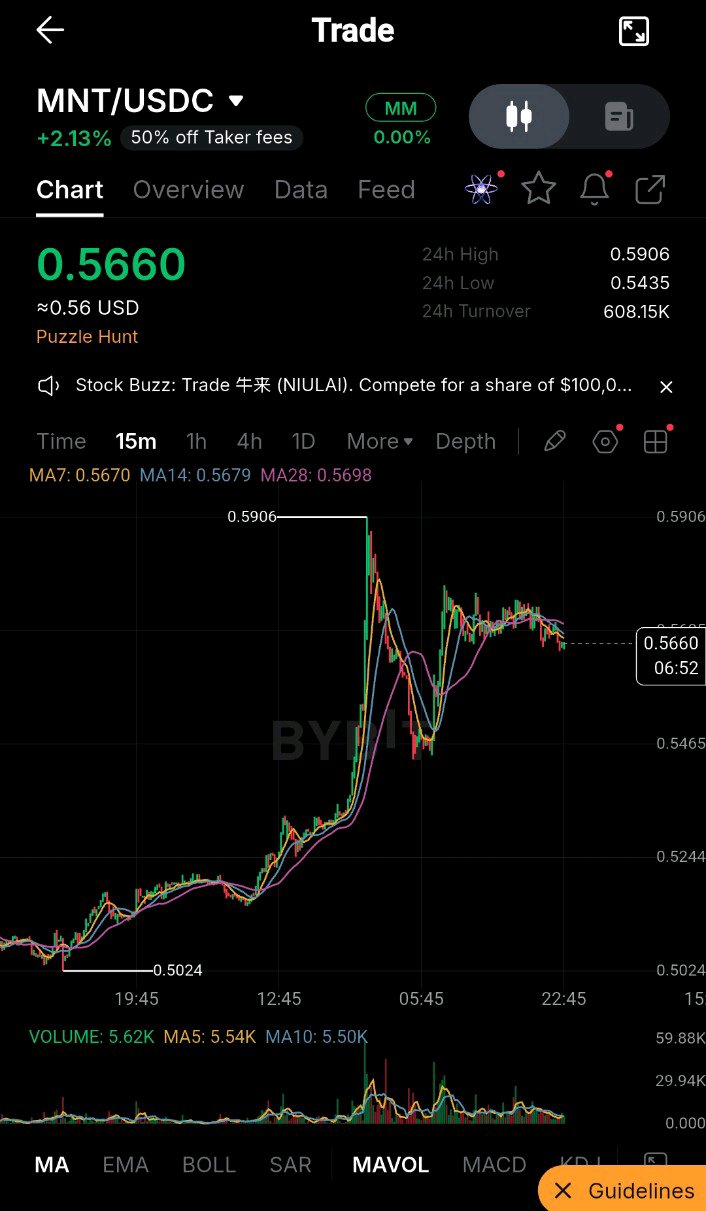
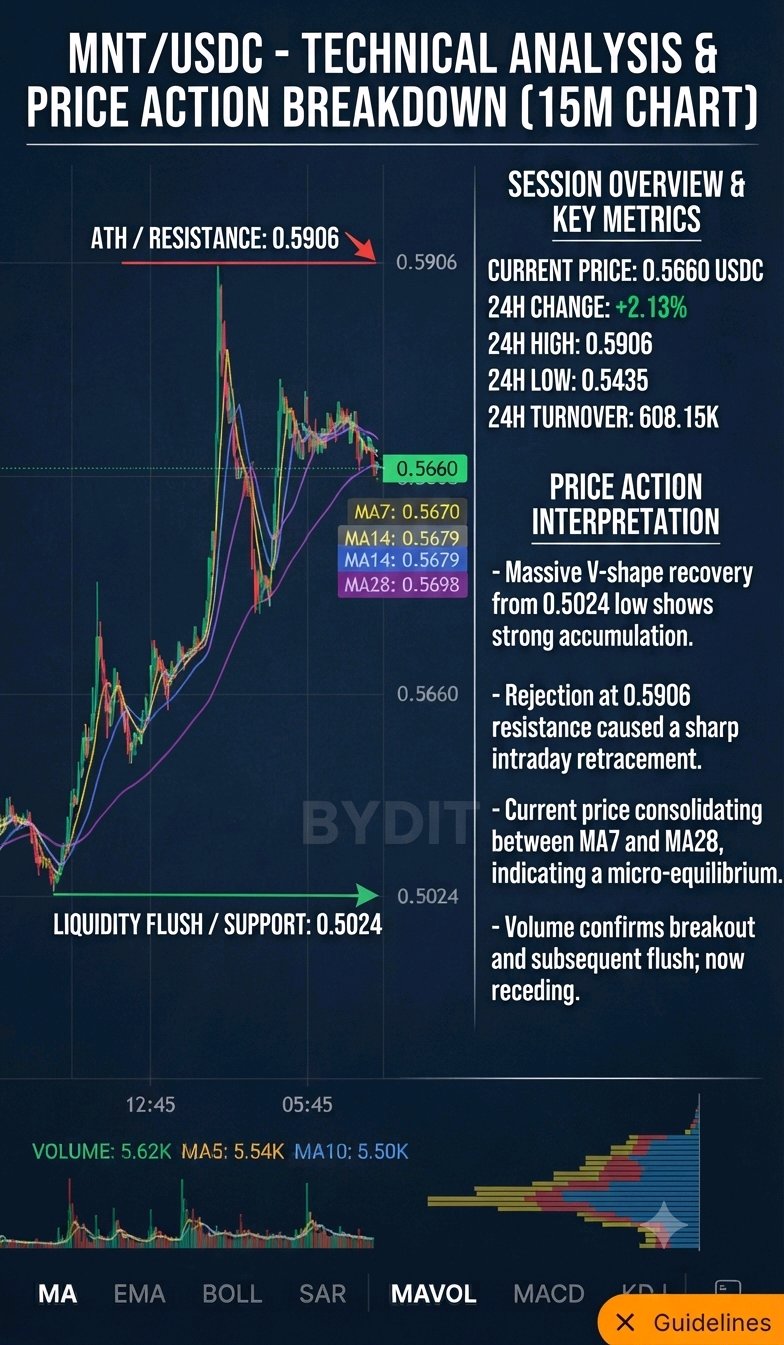
MNT/USDC Structural Market Analysis & Price Action Breakdown Core Metrics & Session Dashboard Trading Pair: MNT/USDC (Mantle Network vs USD Coin) Real-Time Price: 0.5660 USDC (+2.13%) 24-Hour Range: High 0.5906 | Low 0.5435 24-Hour Turnover: 608.15K USDC Moving Averages: MA7: 0.5670, MA14: 0.5679, MA28: 0.5698 Phase 1: Accumulation & Breakout The chart begins with a quiet accumulation phase near the 0.5024 support. This baseline stability was abruptly shattered by a parabolic surge that drove the price vertically to a session peak of 0.5906. This explosive markup liquidated aggressive short positions and triggered widespread market momentum. Phase 2: Rejection & Moving Average Squeeze Hitting the 0.5906 resistance triggered immediate profit-taking, causing a sharp drop down to 0.5435. The price has since recovered to 0.5660, where it is tightly compressed beneath the descending MA lines acting as dynamic overhead resistance. Strategic Outlook Volume indicators confirm heavy trading activity during the breakout followed by a cooling phase. Bulls must reclaim the 0.5700 level to target a retest of 0.5906, while failure to hold support risks a deeper retrace. #ByXIMPACT #EarnOnEveryWave #NiuLai
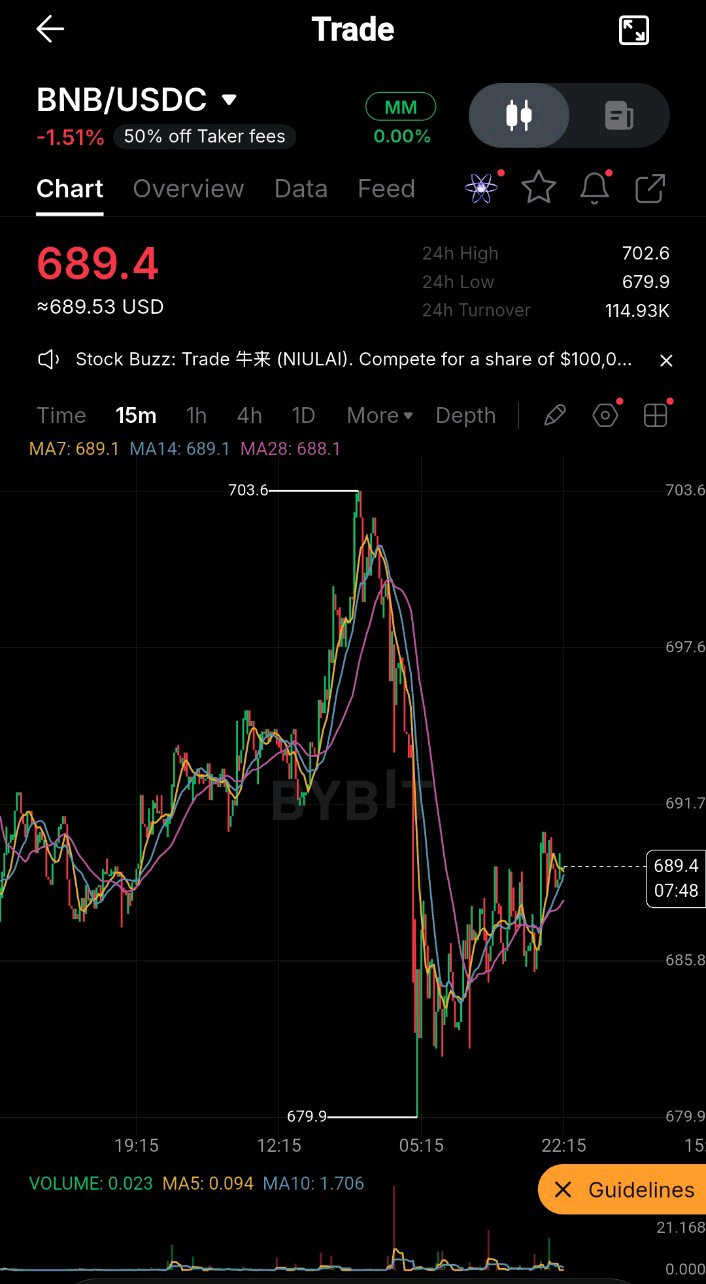
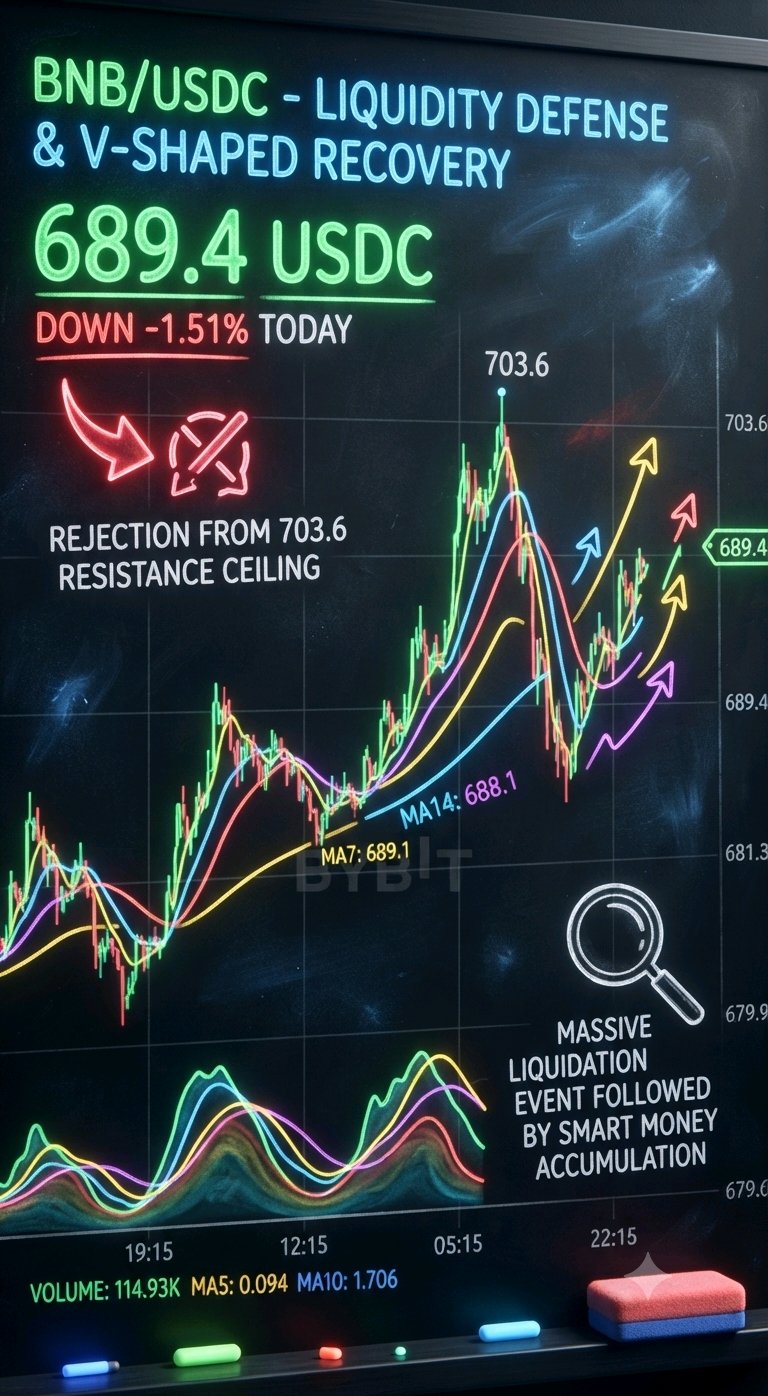
Market Context & Valuation Analysis: I am closely monitoring the BNB/USDC trading pair currently hovering around the 689.4 USDC mark. The asset has recorded a 24-hour retracement of -1.51%, indicating that sellers have maintained structural control over the broader session. The high for the rolling 24-hour window reached 702.6 USDC (specifically touching 703.6 on the intraday peak), while the absolute floor dropped to a liquidation low of 679.9 USDC before aggressive buy-side liquidity entered the market. Total 24-hour turnover is locked at 114.93K USDC, reflecting substantial capital shifting hands during high-volatility events. Anatomy of the Flash Crash & Liquidation Cascade: Looking closely at the 15-minute timeframe, BNB experienced a steady accumulation phase near the upper 690s before hitting a heavy distribution wall near the 703.6 resistance ceiling. This resulted in an aggressive, nearly vertical flash crash that wiped out leveraged longs and swept liquidity down to the 679.9 support level. Volume indicators below the chart show distinct spikes during this collapse, proving that panic selling and cascading stop-losses dominated the price action during the drop. V-Shaped Reversal & Whale Accumulation: Rather than bleeding into a prolonged downward trend, the market printed an immediate V-shaped recovery straight off the 679.9 bottom. Buyers heavily defended this zone, absorbing the remaining sell orders and driving the price rapidly back up into the mid-689 range. This aggressive bounce suggests that smart money and whale accumulation were heavily concentrated at the dip, neutralizing further downside risk and setting up a stabilization channel. Moving Average Convergence & Price Equilibrium: The short-term technical indicators show the moving averages compressing tightly together following the volatility storm. The 7-period moving average (MA7) rests at 689.1, the 14-period moving average (MA14) is identical at 689.1, and the 28-period moving average (MA28) tracks closely at 688.1. This tight overlapping of the MA lines signals a compression zone where the market is coiling, waiting for a definitive catalyst to trigger the next directional breakout. Volume Profile & Sub-Indicators Breakdown: Analyzing the sub-indicators, the short-term volume metrics show MA5 sitting at 0.094 and MA10 at 1.706 against a base volume reading of 0.023. This variation highlights how the massive volume injection during the initial flash crash skewed the moving average calculations, followed by a period of cooling volatility as market participants paused to reassess their positions. Strategic Outlook & Price Action Targets: From my perspective, BNB is currently locked in a critical equilibrium channel between the 685 support zone and the 695 immediate resistance barrier. If the bulls can manage to push and hold the price above the MA confluence zone with expanding volume, we could see a strong retest of the 700 to 703 supply zone. Conversely, a failure to hold the 685 floor would invalidate the recovery and invite a retest of the 679.9 structural low. I am tracking these exact inflection points closely to gauge the next major market move. #ByXIMPACT #EarnOnEveryWave #NiuLai
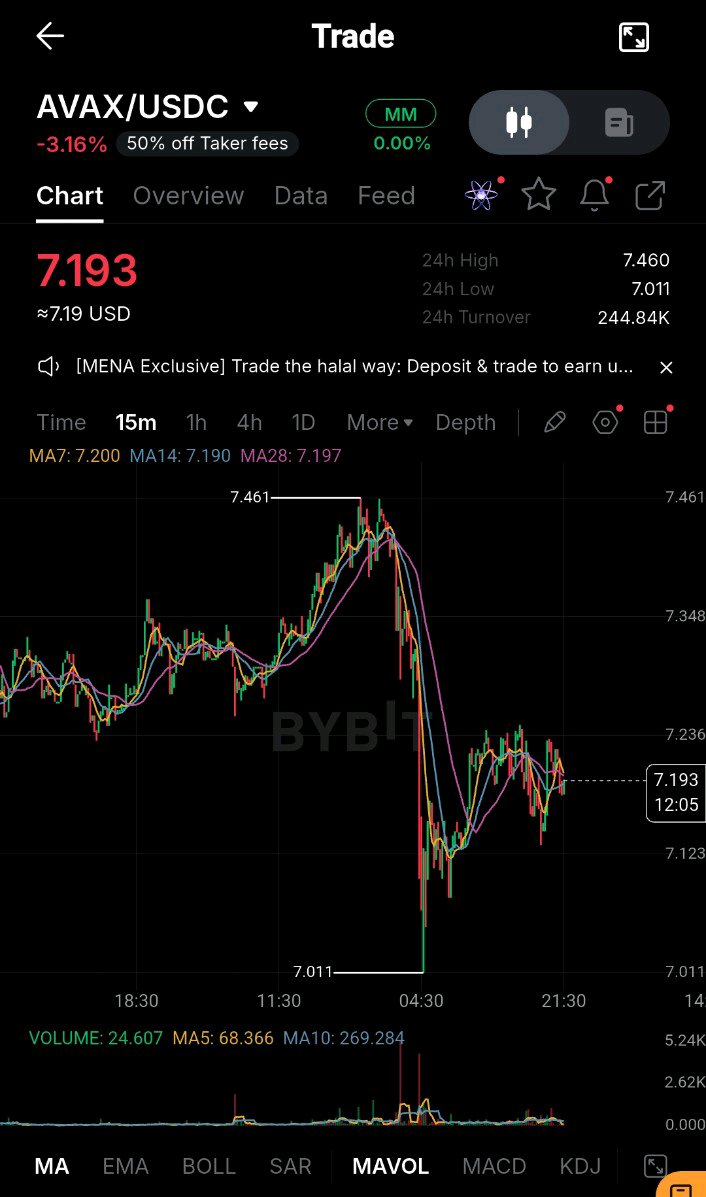
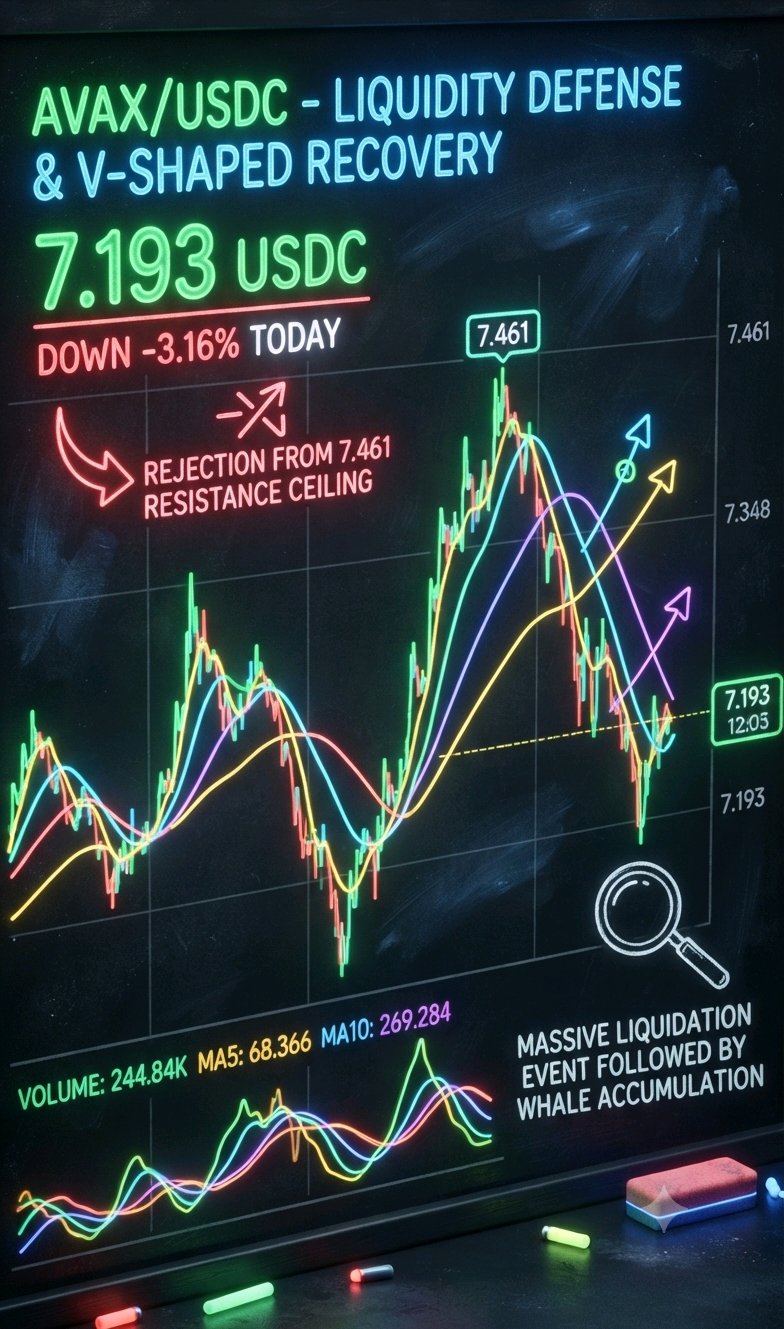
Market Snapshot & Valuation: I am tracking AVAX/USDC currently trading at 7.193 USDC. The pair has registered a 24-hour decline of -3.16%, showing persistent selling pressure throughout the session. The 24-hour high peaked at 7.460 USDC (specifically touching 7.461 on the chart), while the absolute low bottomed out at 7.011 USDC before aggressive buying stepped in to defend the psychological seven-dollar threshold. Total 24-hour turnover stands at 244.84K USDC, indicating localized liquidity concentration during key volatility windows. Anatomy of the Sell-Off & Liquidation Cascade: Examining the 15-minute timeframe, the asset experienced an extended consolidation phase near the mid-7.30 range before aggressive distribution kicked in near the 7.46 resistance ceiling. This led to a near-vertical downward cascade, wiping out leveraged long positions as price violently plunged toward the 7.011 support zone. Volume metrics below the chart confirm massive spikes during this drop, showing heavy panic selling and forced liquidations clustering around the lows. V-Shaped Reversal & Bullish Defense: Instead of continuing into a deeper correction, the market triggered an immediate V-shaped recovery off the 7.011 low. Buyers aggressively absorbed the sell wall, propelling the price back up past the 7.12 and 7.23 inflection points. This rapid bounce indicates that major institutional or whale accumulation occurred at the dip, preventing a breakdown toward lower support zones and stabilizing the immediate price action. Moving Average Convergence & Trend Analysis: The short-term technical indicators show the moving averages compressing tightly following the volatility storm. The 7-period moving average (MA7) is positioned at 7.200, the 14-period moving average (MA14) rests at 7.190, and the 28-period moving average (MA28) is tracking at 7.197. This tight clustering of the MA lines signals a compression phase where market participants are waiting for a definitive breakout direction. Volume Profile & Sub-Indicators: Looking at the volume moving averages, the short-term indicators show MA5 at 68.366 and MA10 at 269.284 with a baseline volume reading of 24.607. This disparity reflects the massive institutional volume injection during the crash candle, which significantly skewed the moving average volume calculations upward, followed by a cooling-off period as volume tapered down during the recovery leg. Strategic Outlook & Price Targets: From my perspective, AVAX is currently locked in a tight equilibrium range between 7.12 support and the 7.25 immediate resistance barrier. If the bulls manage to flip the MA cluster into active support with sustained volume, we could see a retest of the 7.35 and 7.46 supply zones. Conversely, losing the 7.12 floor would invite another retest of the crucial 7.01 daily support level. I am monitoring these precise thresholds closely for the next breakout confirmation. #ByXIMPACT #EarnOnEveryWave #NiuLai