shuja246
Sharing market views, charts & lessons
TRUMPUSDT has settled at $1.69
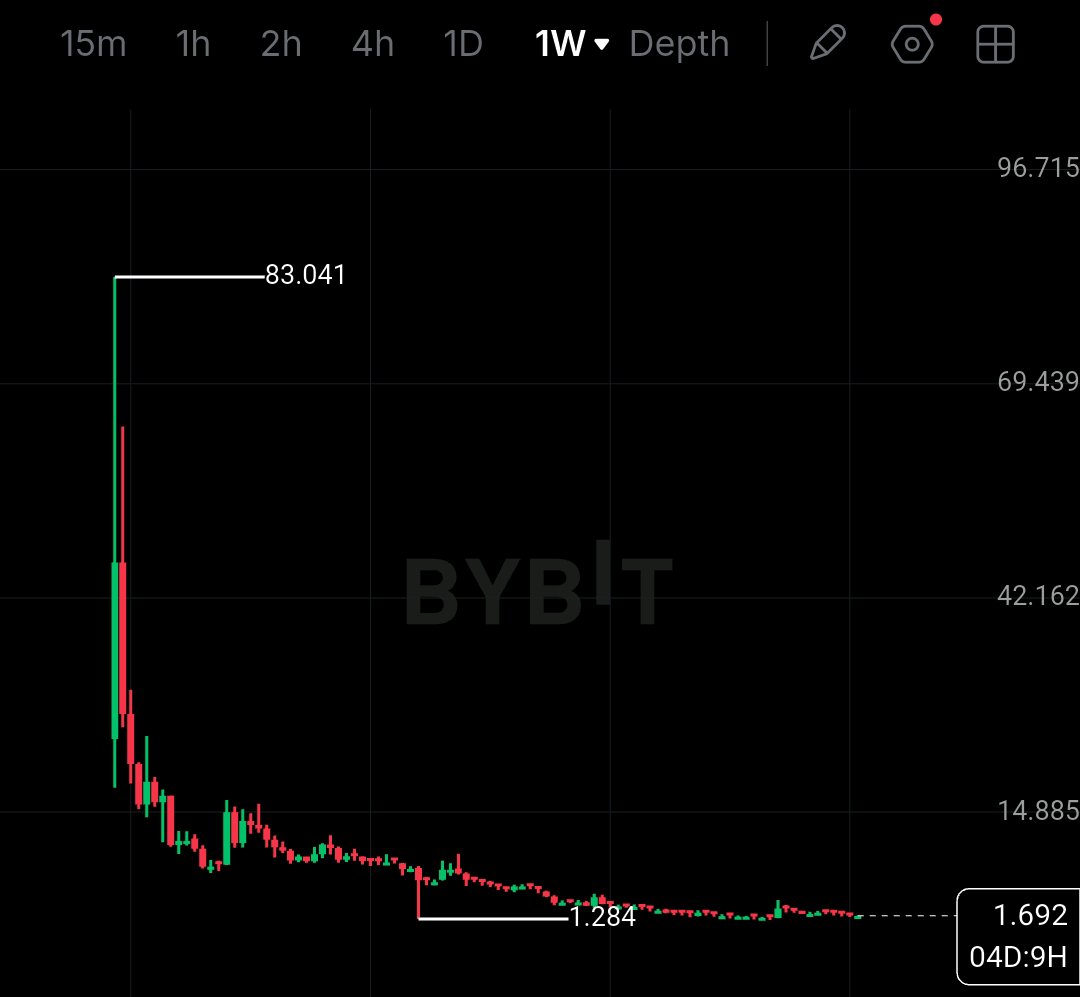
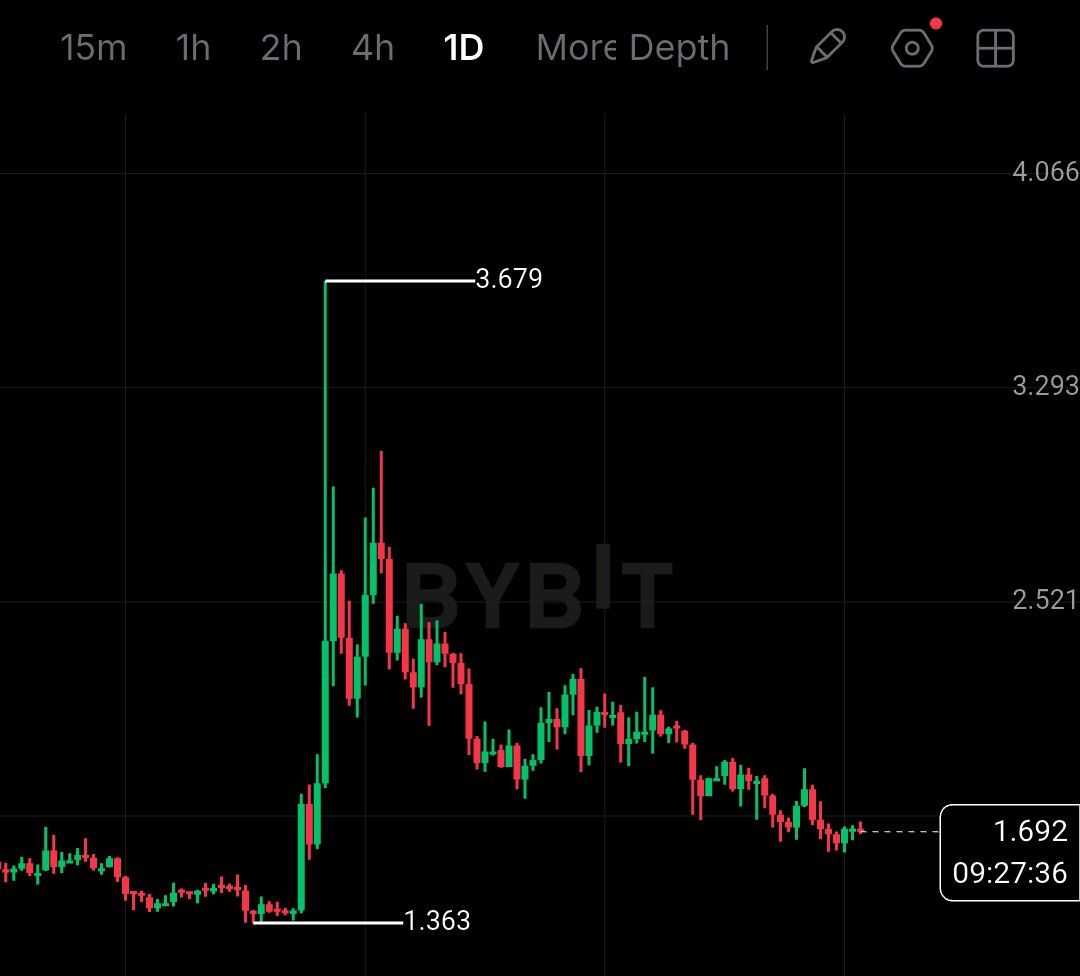
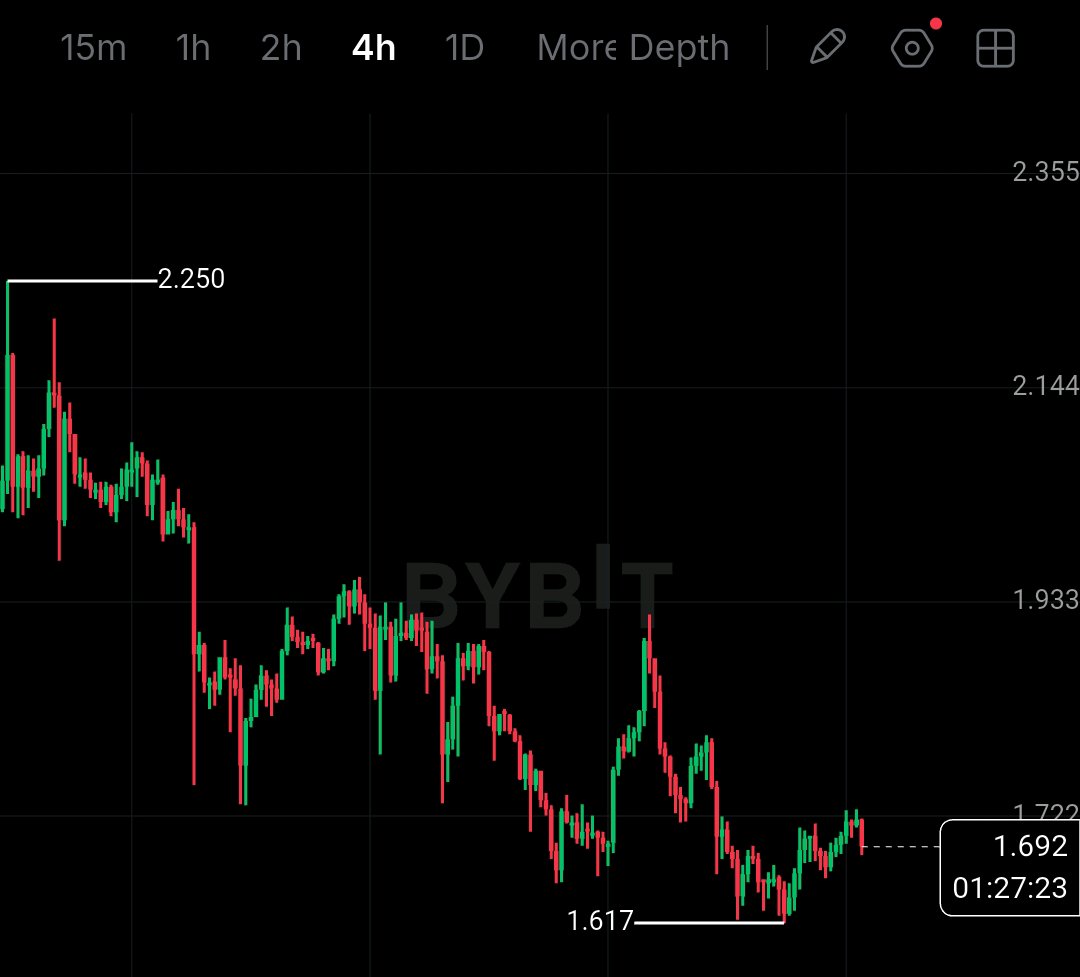
$TRUMPUSDT at $1.69 (+0.41%) 98% lower than $83 ATH, Double Bottom at $1.61 TRUMPUSDT has settled at $1.69 following a sharp washout. Last: $1.693 +0.41% / Mark: $1.693 24H High: $1.729 / Low: $1.680 Volume: $9.18M 1W chart has seen a 98% move down to $83.041 top on Feb 2025 dumped straight to $1.284 on March 2026. It has been consolidating at the bottom at $1.691 for 7 months. 1D chart has had a high of $3.679 on Aug, bottom $1.363 and now sits at $1.692 lower highs pattern but holding above $1.363. 4H chart has seen a high at $1.958 on Oct 14, low $1.617 on Oct 27. The double bottom has formed at $1.617 confirmed. Now $1.692 which is 4% above the low. 1H chart has the same low at $1.921 high on Oct 23 to $1.617 however we are trying to break out at $1.729. Support at $83 ATH, Double Bottom at $0__1.617 (Double Bottom) and at $83 ATH, Double Bottom at $1$83 ATH, Double Bottom at $2__ (Bottom). Resistance at $83 ATH, Double Bottom at $3__1.921 and $83 ATH, Double Bottom at $4__3.679. Breakout at $1.729. Trade Setup: LONG if it goes above $83 ATH, Double Bottom at $5__1.921 then back down to $83 ATH, Double Bottom at $6__1.617. SHORT if it goes below $83 ATH, Double Bottom at $7__1.363. Stop Loss at $1.729. Overall bias is SHORT-TERM LONG as it’s a low leverage, high volatility Meme Coin with $83 ATH, Double Bottom at $8__9.18M. Is it at $83 ATH, Double Bottom at $9__1.284? Tap $TRUMPUSDC to trade this bottom range. #IMPACTbyTrade #ByXIMPACT @BybitX @Bybit Learn @612 Ceros @SignalX @Demon - Trader @GhostWriter @VietnexusCrypto @James @PRADO @IBLOLO
The price has rebounded strongly from the bottom.
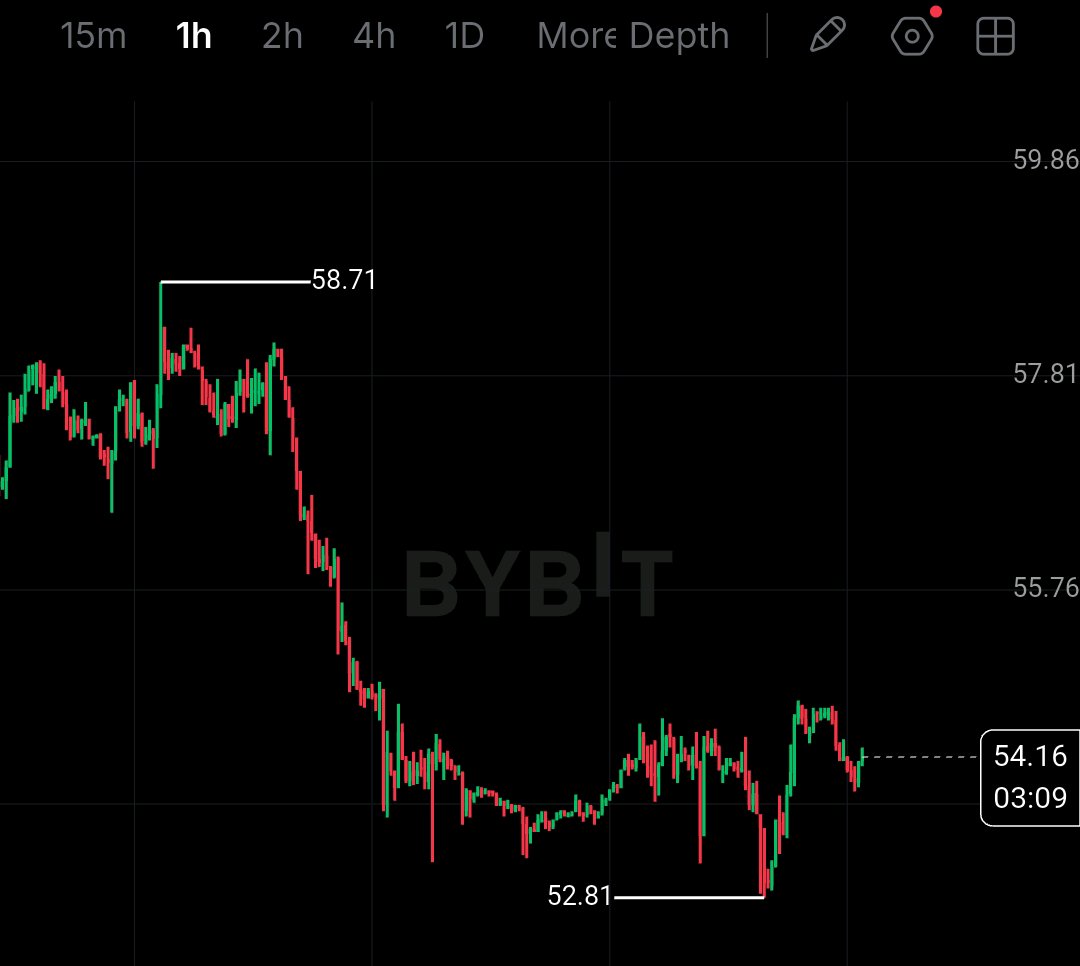
SILVER / XAGUSDT at $54.16 +2.03% Double Bottom at $52.81, $56.30 What's next? The price has rebounded strongly from the bottom. Previous Close: $54.16 +2.03% / Mark: $54.16 24H High: $54.70 / Low: $53.07 Volume: $30.34M On our 4H chart we can see the price made a low of $64.32 top early Oct dumped straight to $52.81 on the 27th Oct. We are currently sitting on a double bottom of $54.16 that's a +2.8% recovery from bottom. 1H also confirmed same $52.81. This is a classic accumulation pattern after a deep correction. Trade Setup: Buy Zone: $54.45-$54.55 We are looking for a breakout here. Long confirmation when price breaks above and stays above. Stop Loss: $52.05 Below Double Bottom. Take Profit 1: $54.80 / TP2: $55.7 Take Profit 3: $56.30 Risk Reward Ratio of 1:3 Clean Trade Setup. Support: $52.81 major / $52.05 This is our Stop Loss. If we lose $52.05 then the setup has failed. Resistance: $54.55 / $54.70/$58.71 / $64.32 Trend Bias is LONG. We are looking to go long once the price hits $52.81 holds. Above $54.55 with volume. We will go long to $54.16 +2.03% / Mark: $0__55.7 before closing back down to $54.16 +2.03% / Mark: $1__52.05 to go short to $51.65. Low leverage. TradFi 24/7 Volatile. Have you been waiting for a bottom at $54.16 +2.03% / Mark: $2__52.81? $BTCUSDT $XAUTUSDT @BybitX @Bybit Learn @612 Ceros @Demon - Trader @VietnexusCrypto @James @IBLOLO @Kiran @Mus Invest #IMPACTbyTrade #ByXIMPACT
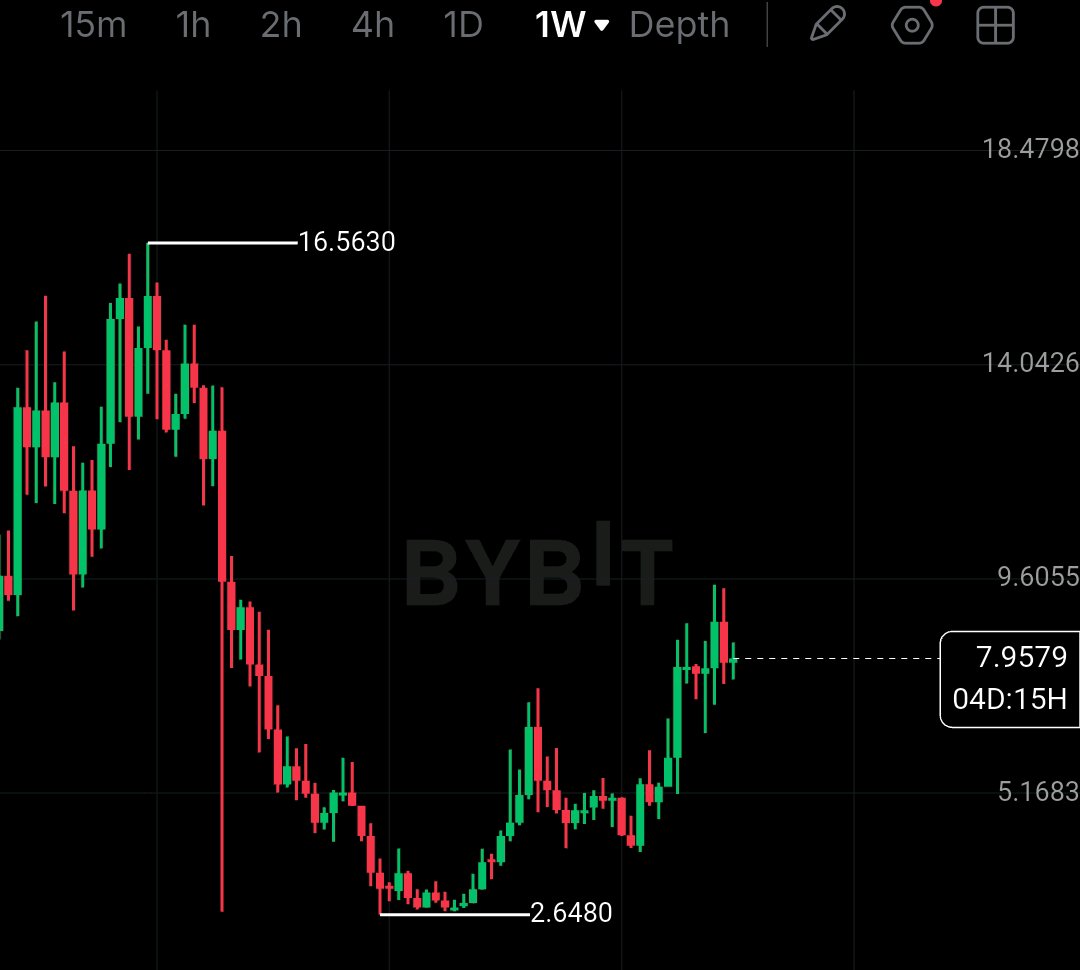
INJ looks complicated
INJUSDT @ $7.9650 +2.47% Weekly Doji at $8.29 High vs Breakout @ $9.60 or Drop to $6.50 $INJ looks complicated and is being overlooked by most traders. Live: Last: $7.9650 +2.47% / Mark: $7.9671 24H Higher: $8.2880 / Low: $7.6870 Volume: $17.34M Weekly Range on chart: High $8.297 / Low $7.527 Weekly doji. History: Low $1.2215 in Jan 2023 to $53.6925 (ATH April 2024) - now 85% lower @ $7.96. Weekly doji is visible (uncertainty). Weekly kumo cloud is large and neutral. Daily trend is still intact but price structure isn't looking safe. Looking at your 1W chart price has been at $INJ tried to reclaim $10.7251 and has failed. Now at $7.9650. Where the trap is. Key Levels Support: $7.500 critical lose this and $7.050 / $6.50 opens (as warned). Resistance: $8.2880 24H high / $8.297 (weekly high). Major resistance: $9.600 break $9.60 to trigger long term bullish structure to $10.72. Trade Bias: CAUTIOUSLY BEARISH below $9.60. LONG Structure: Only above $9.60 or Drop to $0__10.72 and $9.60 or Drop to $1__8.29. SHORT Structure: Below $9.60 or Drop to $2__7.05 and $9.60 or Drop to $3__8.2880. Bullish pressure is dying out and I am not going for long on a breakout above $9.60 or Drop to $4__9.60 or breakdown below $7.50 for a clean trade. Waiting for drop to $9.60 or Drop to $5__6.50? Click to trade $INJUSDT here. #IMPACTbyTrade #ByXIMPACT @BybitX @Bybit Learn @612 Ceros @SignalX @Demon - Trader @GhostWriter @VietnexusCrypto @James @James @PRADO
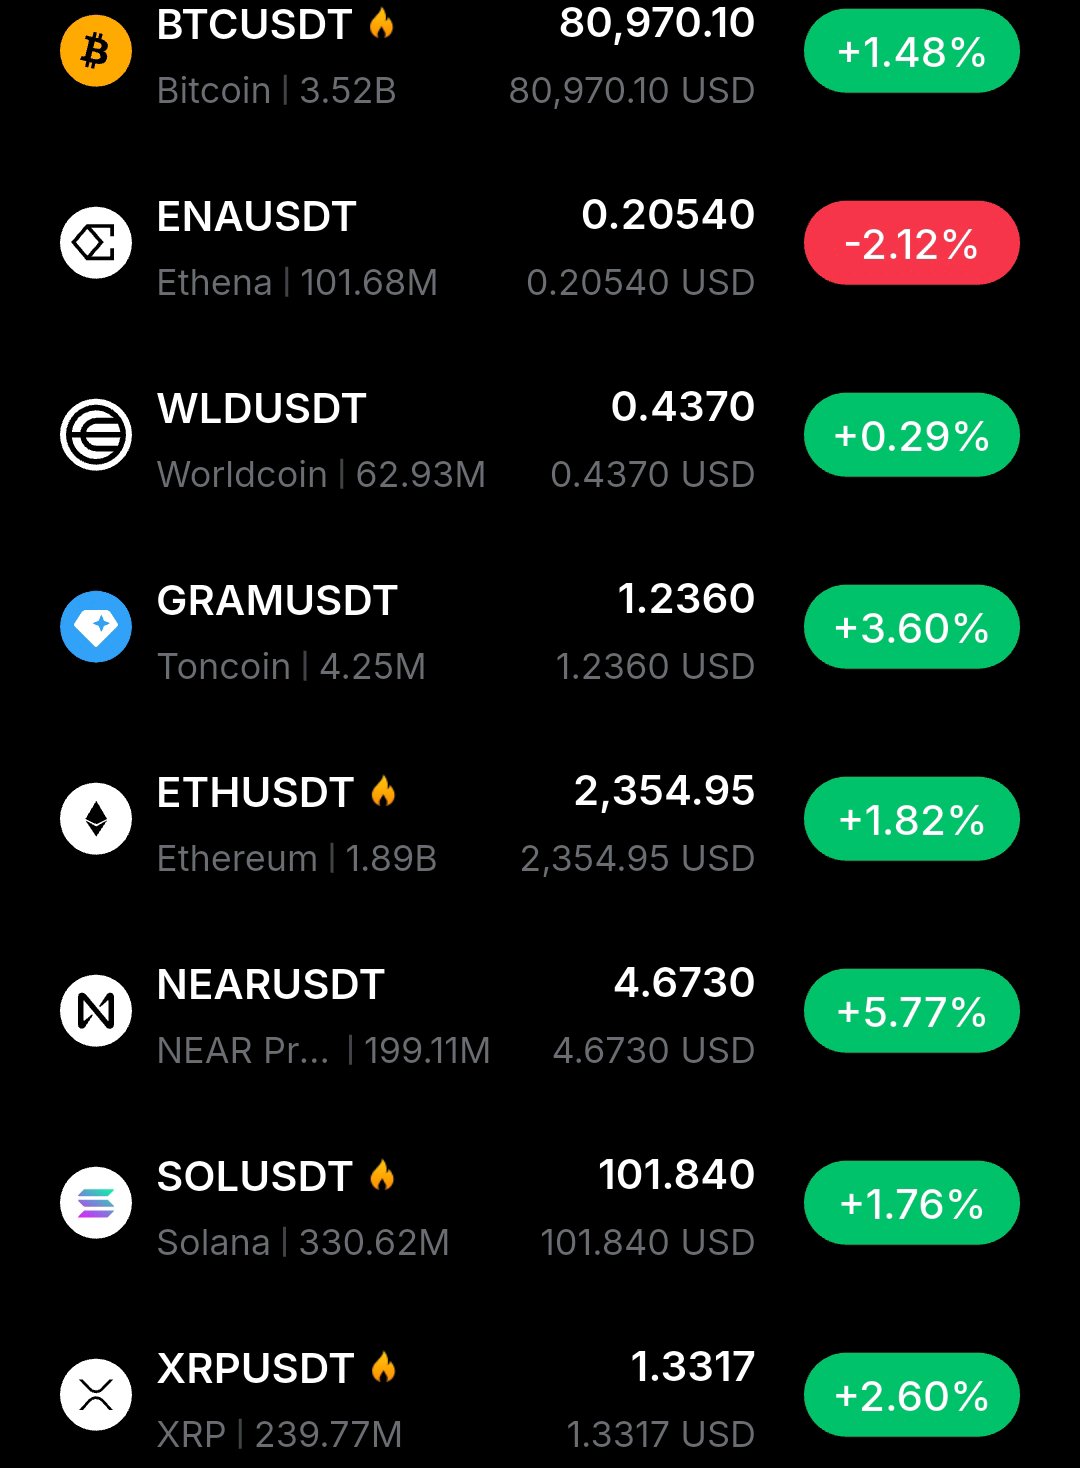
Market is going Green today
Market is going Green today with 7/8 coins showing gains, NEAR up +5.77% Green board $BTCUSDT $: $80,970.10 (+1.48%) Vol 3.52B (Holding $80K) $ENAUSDT $: $0.20540 (-2.12%) Vol 101.68M (Only red) $WLD $: $0.4370 (+0.29%) Vol 62.93M $GRAM $: $1.2360 (+3.60%) Vol 4.25M (Toncoin lower cap mover) ETH $: $2,354.95 (+1.82%) Vol 1.89B (Following BTC) $NEAR $: $4.6730 (+5.77%) Vol 199.11M (Best performer) $SOL $: $101.840 (+1.76%) Vol 330.62M (Back to $100) $XRP $: $1.3317 (+2.60%) Vol 239.77M BTC ($80,970) is providing support to the altcoins. NEAR is looking strong at +5.77%, followed by Gram at +3.60%. Only ENA is selling off at -2.12%. Trade Signal: Support: BTC $80K / NEAR $4.40 / SOL $100 (Holding) Resistance: NEAR $4.80 / BTC $81,300 / SOL $101.84. LONG Signal: NEAR > $0__4.90 and then $ENA $1__4.40. BTC > $ENA $2__81,300. SHORT Signal ENA < $ENA $3__0.21 Short to $ENA $4__4.40 (Short to $4.20). Bias: I would be looking to go LONG NEAR and BTC as long as $80K is being held. ENA is the only one looking weak so stay clear of going long here. The market is very bullish with 87% of coins green. Are you trading NEAR breakout or BTC $80K hold? Click to trade the green board: $ENA $5__NEAR $ENA $6__ETH $XRP #IMPACTbyTrade #MyByXTake #ByXIMPACT @BybitX @Bybit Learn @612 Ceros @IBLOLO
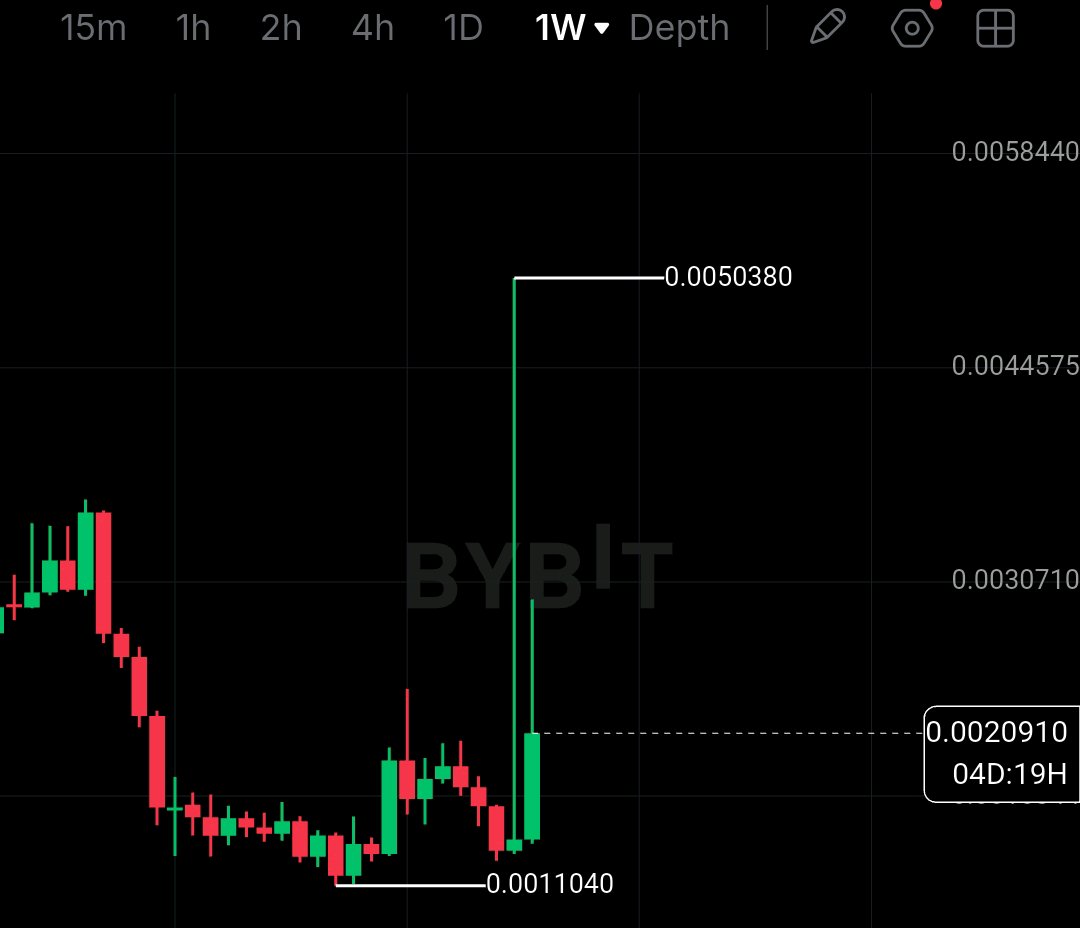
DOODUSDT is moving again after months of silence.
DOODUSDT at $0.002101 -9.25% — After $0.01755 Top to $0.00110 Bottom, Is Volume Coming Back? $DOOD Perp is moving again after months of silence. Live Data | 8:55 AM: Last: $0.002101 / Mark: $0.002101 / -9.25% 24H High: $0.002462 / Low: $0.001960 / Vol(DOOD): 62.57B / Vol(USDT): $134.50M Chart Vol: 292B DOOD / 632M USDT / MA(5): 170B / MA(10): 103B — MA5 above MA10, volume is expanding. What the 1W chart shows: Pumped to $0.0175551 ATH, then dumped -93% to $0.0011040 low on March 30, 2026. Since then flat at $0.00110 for months. Now price just wicked to $0.0039007 and is back at $0.002101. That green volume bar with 538B is the biggest since listing. Performance: Today +1.69% / 7 Days -13.22% / 30 Days +12.30% / 90 Days +60.18% / 180 Days -34.02% / 1 Year -71.51% — 90 days is actually up 60%, accumulation is happening. Trade Signal: Support: $0.001960 24H low / Major $0.0011040 — this must hold. Lose it and no bottom. Resistance: $0.002462 24H high / $0.0039007 recent wick / $0.0175551 ATH. LONG Setup: Hold above $0.001960 and close above $0.002462 with volume = long to $0.00390 then $0.00751. SL below $0.001960. SHORT Setup: Lose $0.001960 and close below = short to $0.0011040. SL above $0.002462. My bias is short-term LONG while $0.00196 holds — volume MA5 170B > 103B shows buyers stepping in. But I'm not chasing inside $0.00196-$0.00246 box. Need breakout confirmation. Are you watching $0.002462 breakout or waiting for $0.0011040 retest? Tap $DOODUSDT to trade this volume spike. #IMPACTbyTrade #ByXIMPACT @BybitX @Bybit Learn @IBLOLO @Kiran @Mus Invest @Jiji715
TSLA is back in momentum
TSLAXUSDT $408.08 +3.78% — Breakout to $409.16 after bottom @ $293.99 TSLA is back in momentum. Live Data (8:43 AM): Last: $408.08 +3.78% / Mark: $408.09 24H High: $409.16 / Low: $390.80, Vol: $24.52M - Volume is coming back. Your 4 Charts: 1D Chart: Fell from $437.73 high to $293.99 (bottom) in July, since then has been steadily recovering. Current price is $408.08 (recovered 93% of the fall). 4H Chart: Fell to $347.51 on Oct 16, pumped straight to $409.16 on 28th Oct, up 17% in 10 days. The best leg on the chart. 1H Chart: Fell to $366.07 on Oct 23, now $409.16 high, very little retest, straight up. 1W Chart: Highest at $453.60 in June, bottom $293.99, breaking out at $408.12 still 10% away from weekly top. Room to run if $409. Not a random pump. Tesla TradFi 24/7 Perp has been breaking out higher highs and higher lows since the 16th October. Trade Signal: Support: $390.80 24H low / Major $347.51 (4H low), $293.99 (absolute bottom) Resistance: $409.16 24H high / $437.73 (1D high), $453.60 (weekly high). LONG Signal: Price closes above $408.08 +3.78% / Mark: $0__437.73 on 1H then falls to $408.08 +3.78% / Mark: $1__390.80. SHORT Signal: Falls below $408.08 +3.78% / Mark: $2__366.07. I’m bullish here as we’ve got confirmation of a breakout at $408.08 +3.78% / Mark: $3__409.16. This is where the real FOMO will come in. Breakout or retest $390? Click to trade this TradFi move $TSLAXUSDT $BTCUSDT #IMPACTbyTrade #ByXIMPACT @BybitX @Bybit Learn @612 Ceros @SignalX @Demon - Trader @GhostWriter @VietnexusCrypto @James @IBLOLO @Kiran
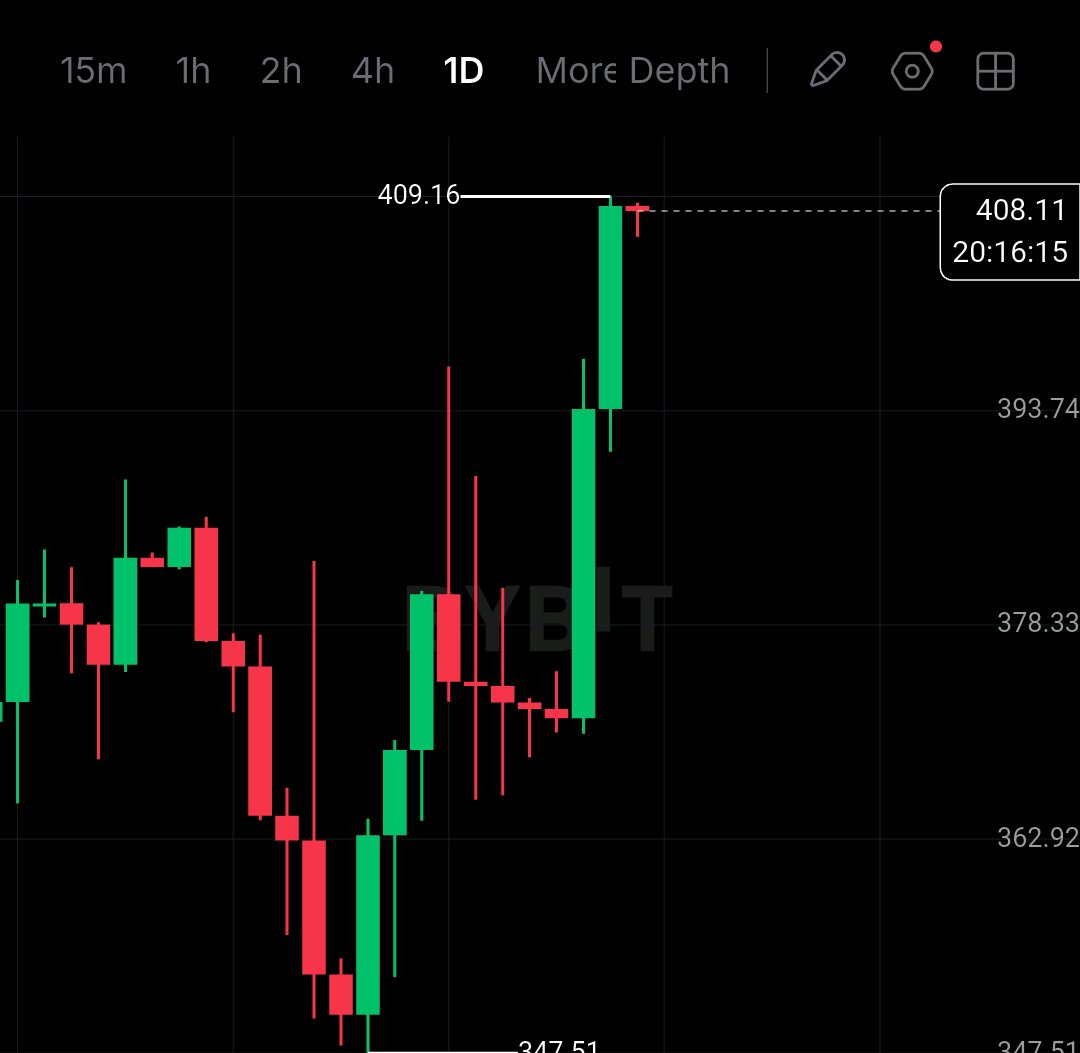
TSLAUSDT has just made a huge bullish
$TSLAUSDT has just made a huge bullish vertical move to a high of 397.47 (+4.90%). However, what stands out is The price gapped down to 347.51 low on Oct 19, after which it was range bound between 370.51 and 371.96 for three days. After this, it went vertical, breaking over 384.71 and 384.98 as it made a huge move up to the high of 397.47. We are now trading at 391.85 (very top of the expansion). The orderbook shows bullish pressure. Live data from your TradFi chart Bybit | 1:17 AM: Last Traded: 391.85 (+4.90%) Mark: 391.82 High: 397.47 Low: 370.51 Turnover: 29.18M (24H) Most importantly, The price is now trading well above the BOLL(20,2) and all MAs. From your charts: RSI6: 1H: 58.08 2H: 70.48 4H: 82.40 1D: 76.78 We can see momentum is strong. However, looking at the 4H chart, RSI6 is at 82.40, meaning we are in a blow off phase. Looking at the 1D chart, we have a long way to go before we hit the top of 453.60 from June. This is a bounce rally, not a new ATH. This looks like a bullish post-expansion trade. However, buying at 391.85 would be a poor risk/reward. You would need to place your stop below 384.98 just to protect against normal volatility. Proper swing stop would be below 370.51. If we retrace and the price hits 384.98 and forms a bullish rejection wick, then it would present a good opportunity to buy long to continue the trend. Buy here is FOMO. I am keeping an eye on 384.98 and 370.51 (24h low). If we hold above 384.98 then we will continue higher towards breaking the high of 397.47 and hitting 410+. If we hit below 370.51 then we will gap back down to between 346.46 and 353.00. I am not buying $TSLA at the top. I want to see if bulls can hold 384.98. Do you want to wait for a retrace or take profits? Click to trade $TSLAXUSDT $BTCUSDT #IMPACTbyTrade #ByXIMPACT @BybitX @Bybit Learn @Jiji715 @612 Ceros @SignalX @Demon - Trader @James @IBLOLO
BTC is finally recovering from that sharp decline.
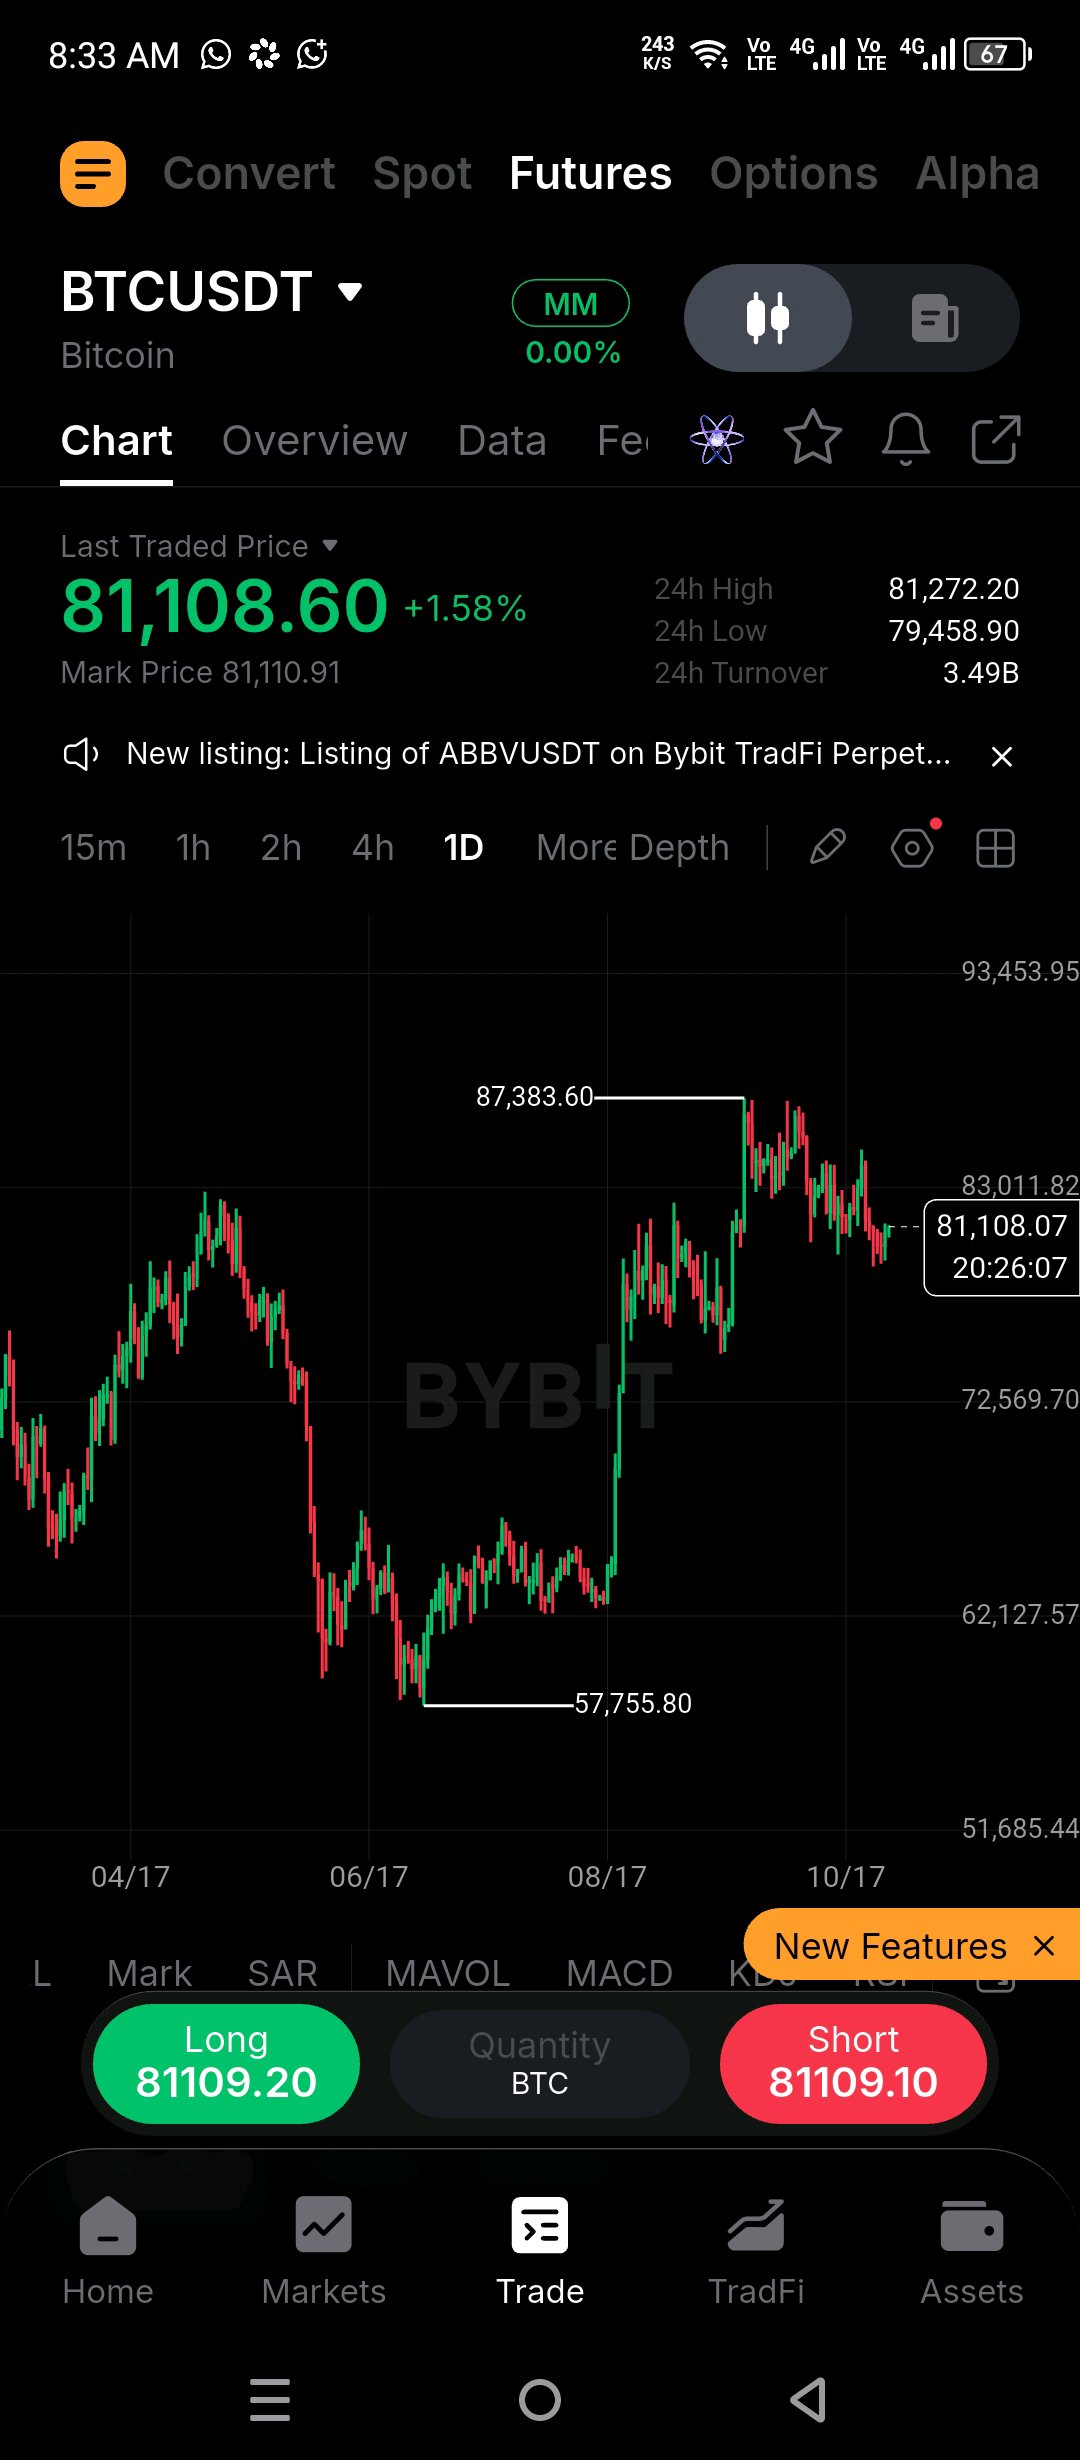
$BTCUSDT at $81,108 +1.58% – Recovered $81K Area After Breaking Down to $79,175 Low is finally recovering from that sharp decline. Current Live Price | 8:33 AM: Last Price: $81,108.60 +1.58% / Mark: $81,110.91 / 24H High: $81,272.20 / Low: $79,458.90 / Volume: $3.49B Latest Level on Order Book: $81,139.50 +1.62% — Buyers have 71% vs Sellers at 29%. What your charts show: 1D: $57,755.80 bottom in June -> $87,383.60 top in September -> current $81,108. This is a higher lows structure. 4H + 1H: Both tested $79,175.40 low on October 27 and rejected hard. This is a liquidity break. $84,880.00 resistance from October 21 high. 1W: ATH $126,150.00 in July 2025, current price is -35% down from that at $81,115. Long-term trend is still correction from ATH, not a new bull trend. Order book is showing $421K buy wall at $81,132.70 and sellers are light — short term momentum is bullish. Trade Signal: Support: $79,458 / $79,175.40 – must hold it. Break this level and $57,755 is back. Resistance: $81,272.20 / $84,880 / $87,383.60 LONG Setup: Hold above $79,175 and close above $81,272 on 1H = long to $84,880 then $87,383. SL below $79,175. SHORT Setup: Lose $79,175 #WSOT2026 #AnthropicS1Filing #IMPACTbyTrade #MyByXTake #MidtermsMarketWatch @BybitX @Bybit Learn @612 Ceros @SignalX @Demon - Trader @GhostWriter @VietnexusCrypto @James @JonyDong 509 @PRADO

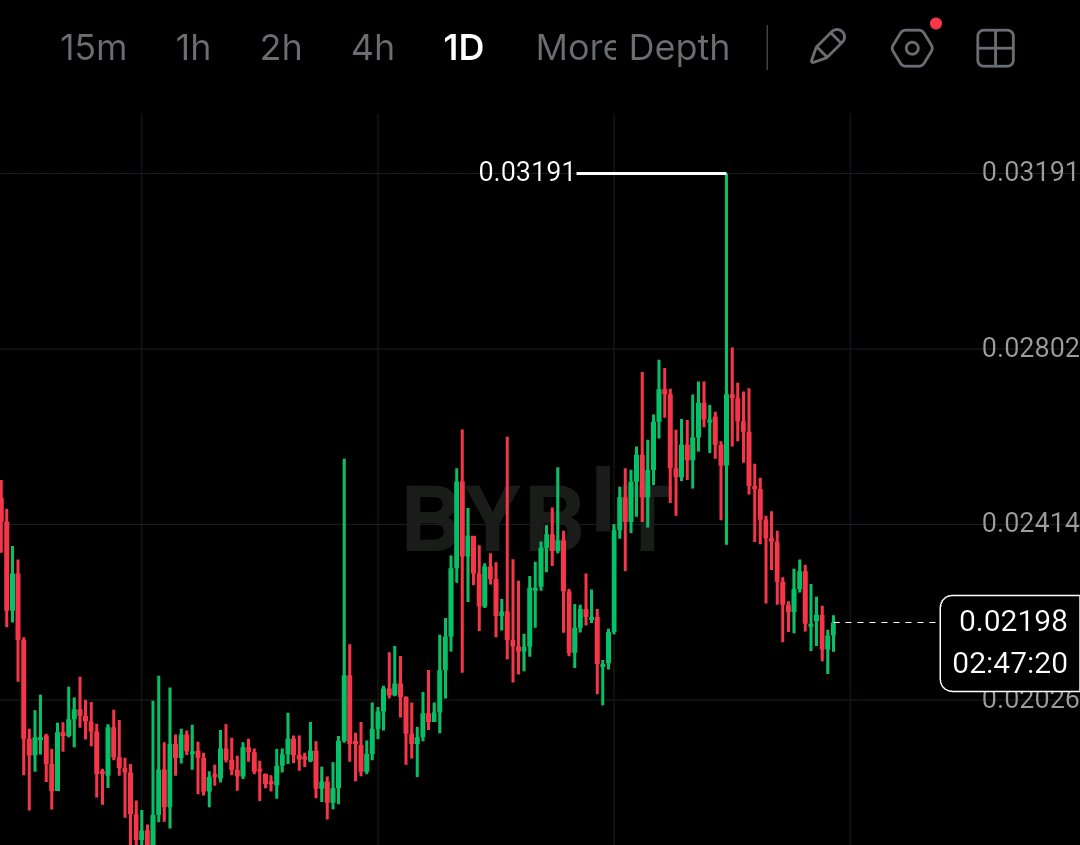
AEVOUSDT SHORT-TERM LONG (Breakout Only)
$AEVOUSDT at $0.02196 (+2.37%) – Waking up after 3 month sideways? The price of $AEVO has been very sideways, now it’s starting to move. Live Data (2:04 AM): Last: $0.02196 +2.37% / Mark: $0.02196 High @ 24h: $0.02214 / Low: $0.02132 Volume: $103.50K Low volume, high volatility risk. Long: $0.02197 / Short: $0.02195 Chart Breakdown: 1W: Price has been moving from the big bottom at $3.74430 in July 2024 to $0.01638 (Nov 2025) which shows a -99% decline. It’s currently at $0.02196 which is still -99%. 1D: Price has been moving higher since High at $0.03417 on May, low around $0.015 (June 01). Daily trend is weak (RSI6=38.79). 4H: Price has been moving higher since High at $0.03191 on Oct 10, low $0.02084 (Oct 27). Momentum is forming (RSI6=65.10). 2H: Price has been moving within the same range as High at $0.03191 -> $0.02084. RSI6=65.86. 1H: Price has been moving higher since High at $0.02337 on Oct 22, low $0.02084. Bullish divergence (RSI6=66.85). Base is strong at $0.02084 after 3 tests – accumulation. Trading Signal & Strategy: Bias: SHORT-TERM LONG (Breakout Only). Long: Entry above $0.02214 with volume. SL: $0.02084. Target: $0.02337 -> $0.03191 → $0.03417. Short: Entry below $0.02214 / Low: $0__0.02214. Target: $0.01638. If price remains above $0.02084 then Longs would be favourable. However if it breaks below then avoid going Long as sellers will takeover. Only $103K in Volume so keep leverage low. Don’t go chasing within the $0.02214 / Low: $1__0.02214 box. Click AEVO to trade this breakout. @BybitX @Bybit Learn @IBLOLO #WSOT2026 #AnthropicS1Filing #IMPACTbyTrade #MyByXTake #MidtermsMarketWatch $DOGEUSDT
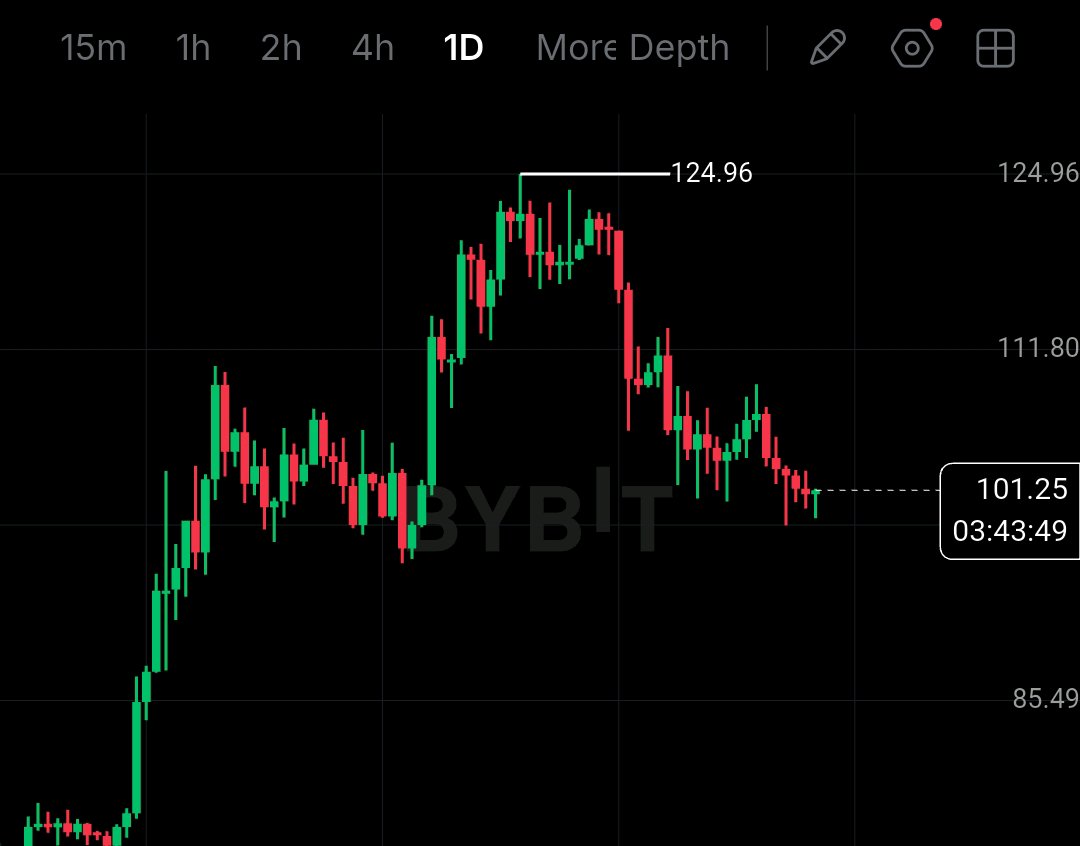
SOL/USDT is looking to rebound
$SOLUSDT is looking to rebound from a sharp correction at $101.22 +0.74% — Daily RSI 26.84 Oversold After $124.96 Top. Live Data (1:15 AM) Price: $101.22 +0.74% / Approx: $101.22 24H High: $101.38 / Low: $99.16 / 24H Turnover: $28.44M Buy (Margin): 101.22 / Sell (Margin): 101.21 Chart Analysis 1D: Reaching a high of $124.96, Bottom $60.10 (May 30), currently trading at $101.22. RSI indicators are all showing a bearish daily chart with 26.84 (RSI6), 33.81 (RSI12) and 43.91 (RSI24). 4H: Chart has reached the same highs of $124.96, bottom around $99.16 (Oct 27). RSI6 shows 56.32, indicating a rebound. 2H: Chart has reached a high of $115.84, Bottom $98.62 (Oct 24). RSI6 shows 66.16, indicating improving momentum. 1H: Chart has reached a high of $109.20 on Oct 22, Bottom $98.62. RSI6 shows 66.73 indicating short term bullish movement. 1W: Chart has reached a historic high of $295.73, Historical Bottom $7.91 (Aug 2022). Long-term this has shown massive growth. RSI6 shows 47.03 indicating neutral. Short-term showing signs of rebounding. Daily chart is bearish. Key Levels Support: $99.16 (24H low) / $98.62 (1H/2H Low) and Major $60.10. Resistance: $101.38 (24H high) / $109.20 and $101.22 +0.74% / Approx: $0__295.73. Trade Strategy Bullish confirmation: If price remains above $101.22 +0.74% / Approx: $1__101.38 with volume then price will continue to go higher towards $101.22 +0.74% / Approx: $2__124.96. RSI6 in 1H shows 66.73 confirming the rebound. Bearish confirmation: Losing $101.22 +0.74% / Approx: $3__92.53 and $76.32. I am not looking to chase price to reach $101.22 +0.74% / Approx: $4__101.38 or test $99.16 for better risk/reward ratios. Daily RSI shows 26.84 which indicates a rebound zone. Are you watching out for $101.22 +0.74% / Approx: $5__99.16 Support? Tap into SOL and trade within this range. $BTCUSDT #AnthropicS1Filing #WSOT2026 #IMPACTbyTrade #MyByXTake #MidtermsMarketWatch @IBLOLO @Kiran @Mus Invest @Jiji715 @Annnn @PRADO @BybitX @Bybit Learn @612 Ceros @SignalX
QNTUSDT Pullback or Accumulation?
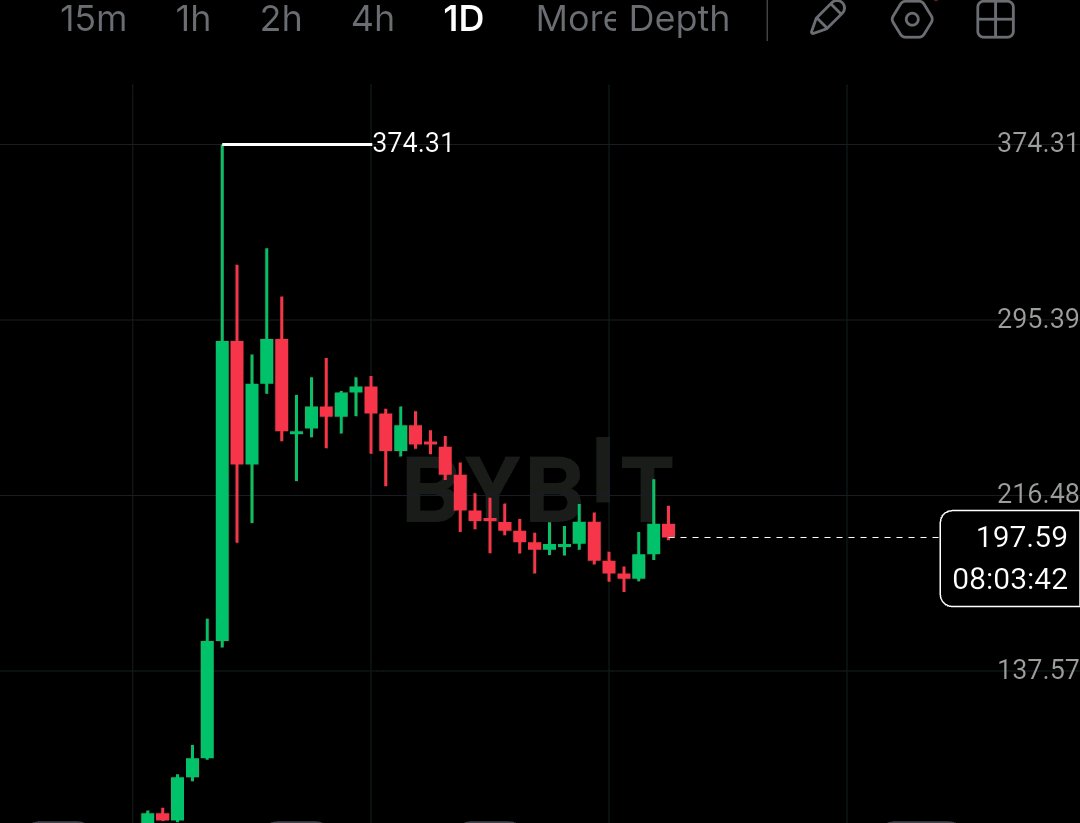
$QNTUSDT at $197.76 -5.70% Retracement or Accumulation? After $223.79 High. QNT is correcting after a strong pump. Live Data | 8:55 PM: Last Price: $197.76 -5.70% (197.77-197.83) 24H High: 212.14 Low: 196.35 Volume 24H: 37.56M Long: 197.76 Short: 197.75 Chart Analysis: 1H: Correction from low of $173.18 on Oct 24, pumped to $223.79 (Oct 26). Current price $197.77 RSI6: 33.03 (Short term oversold). 2H: Correction from High of $245.80 on Oct 13, bottom $173.18. Price reached $223.79 High. RSI6: 38.25 (Weak). 4H: Correction from historical high of $374.31 on Sep 30, corrected to $162.63. Price corrected to $233.19. RSI6: 45.61 (Neutral). 1D: Correction from base of $50.05 for months (June to Sep), then massive green candle to $374.31 (Sep 23). Price forming base at $197.60. RSI6: 51.09 (Healthy). 1W: Correction from long term base of $50.05 since May 2024, now $197.53. RSI6: 61.94 (Trend remains bullish on weekly). Correction within an overall bullish trend. Key Levels: Support: $196.35 (24H low) / $173.18 (Oct 24 low) $50.05 major long term base. Resistance: $212.14 (24H high) / $223.79 $245.80 / Final $374.31 ATH wick. Trade Setup: Bullish Confirmation: Holding $196.35 and reclaim $212.14 with volume. Price will continue to $173.18 on Oct 24, pumped to $0__245.80. 1H RSI is oversold at 33. Good setup for a bounce. Bearish Confirmation: Break below $173.18 on Oct 24, pumped to $1__173.18. Price will continue to correct further to $162.63. Not going short at $173.18 on Oct 24, pumped to $2__197 as RSI6 is at 33. Waiting for price to retest $173.18 on Oct 24, pumped to $3__173.18 for a better entry. Low leverage and high volatility. Tap QNT to trade this correction. #IMPACTbyTrade #MyByXTake #MidtermsMarketWatch #FOMCRateDecision #WSOT2026 @BybitX @Bybit Learn @612 Ceros @SignalX @Demon - Trader @GhostWriter @VietnexusCrypto @James @JonyDong 509 @PRADO
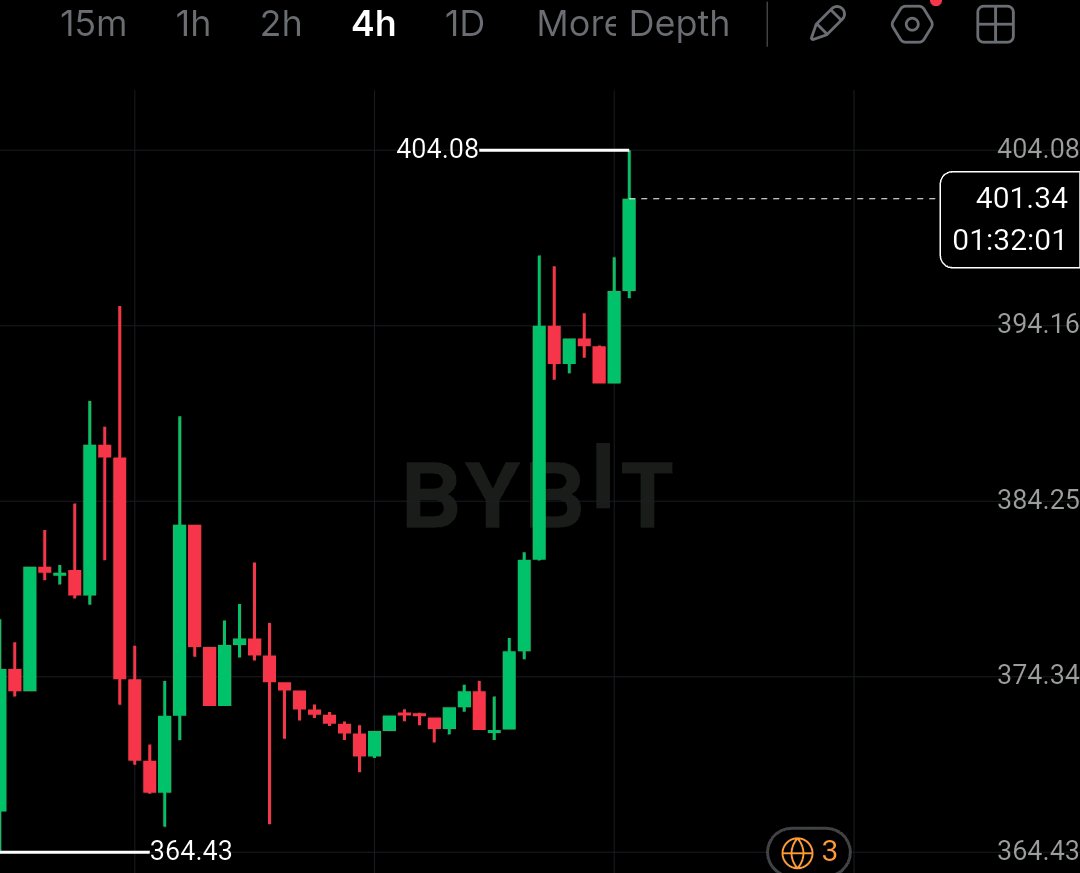
TSLAXUSDT trading at $402.08 +1.50% — New High
$TSLAXUSDT trading at $402.08 +1.50% — New High $404.08 after Double Bottom at $346.61 Tokenized Tesla rising +1.50% to $TSLAX Spot is now $402.08 (from last chart of $393.05). Live Price (7:24PM): Token Price: $402.08 / Stock Price: $402.08 (1 TSLAX = 1 TSLA) 24H High: $404.08 / Low: $390.90 (Turnover: 378.59K) Chart Structure: 4H Chart: Bounced back from low at $346.61 on Sep 29, now tagged $404.08 (+16.5%). 1H Chart: Low at $347.58 (Oct 19). Clear uptrend since Oct 27. 1D Chart: All time high at $453.12, bottom $294.13 (Aug). Still 11% away from all time high. RSI: 4H Chart: RSI6: 84.98 / RSI12: 78.10 / RSI24: 68.39 Overbought conditions. 1H Chart: RSI6: 81.12 / RSI12: 75.20 Overbought conditions. 1D Chart: RSI6: 82.37 Overbought conditions. Strong momentum but getting stretched. Don’t look to buy. Support: $390.90 (24H low) / Major $346.61 - $347.58 must be held. Resistance: $404.08 (24H high) / Next $453.12 Daily high. Set up: Bullish: Price holds above $390.90 and 1H close above $404.08 = continuation (volume) to $430. Bearish: Price breaks below $390.90 and fail to reclaim = pullback to $375 - $347.58. Not looking to chase price at $TSLAX Spot is now $0__390.90 retest or confirmation of breakout at $404.08. Better risk reward. #WSOT2026 #AnthropicS1Filing #IMPACTbyTrade #MyByXTake #MidtermsMarketWatch @BybitX @Bybit Learn @612 Ceros @SignalX @Demon - Trader @GhostWriter @VietnexusCrypto @IBLOLO @Kiran @Mus Invest
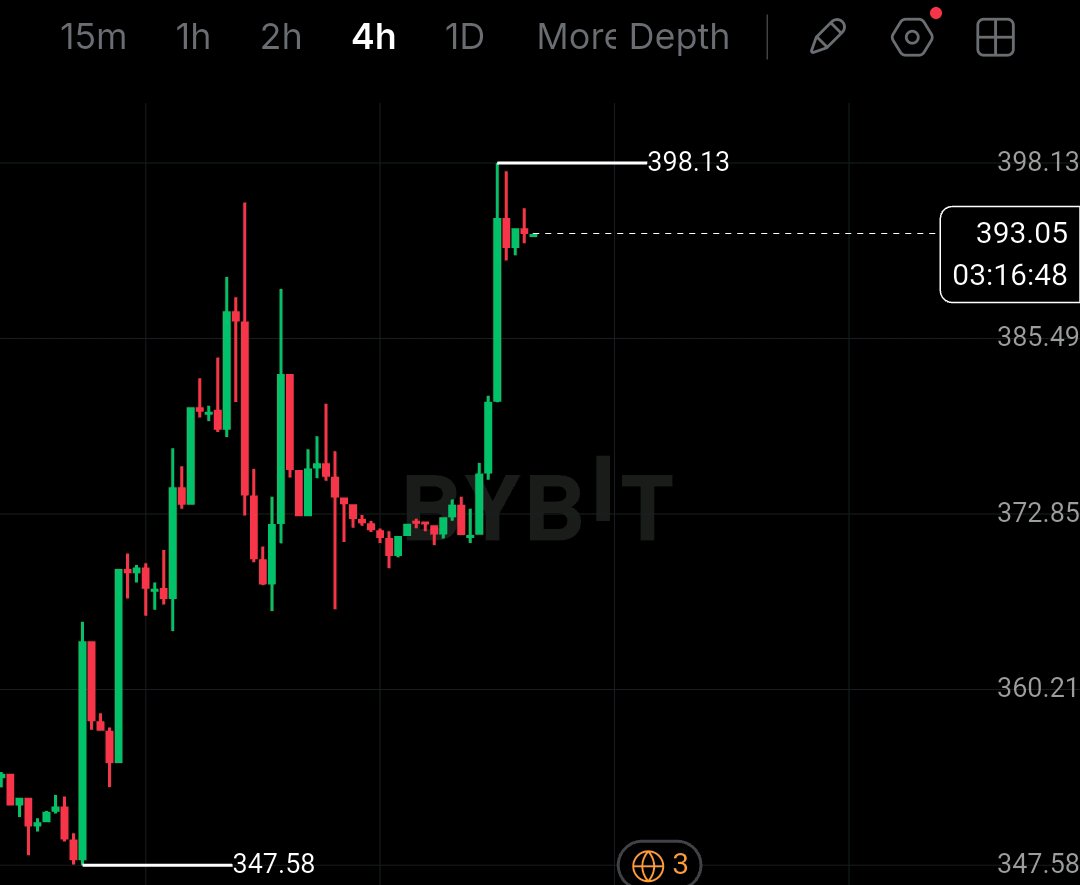
TSLAXUSDT at $393.05 (+4.81%) Breakout
$TSLAXUSDT at $393.05 (+4.81%) Breakout to $398.13 After $347.58 Low Spot is trading at $393.05 (+4.81%) Tokenized Tesla. Live Chart 9:40 AM: Price = $393.05 / Stock Price: $393.05 (1 TSLAX = 1 TSLA) 24H High price = $398.13 / Low: $375.01 Volume = 604.41K 4H Low = $347.58 on Oct 20 — pumped +14% to $398.13 high 1H Low = $353.21 RSI: 4H: RSI6 = 81.96 RSI12 = 74.14 RSI24 = 64.58 Overbought levels. Blow off. 1H: RSI6 = 54.50 RSI12 = 63.41 RSI24 = 65.33 Rebalancing at 1H. Strong rebound pattern. Bounced up from $347.58, consolidated for 4 days around $370 to a straight line to $398.13. Now holding $393.05. Levels: Support = $375.01 (24H low) / Major $347.58 Resistance = $398.13 (24H high) — break above opens $410 Setup: Bullish signal = Stay above $398.13 After $0__398.13 with volume. Continue to $410. Bearish signal = Break below $398.13 After $1__347.58 - $353.21. No chase for $398.13 After $2__398.13 breakout or $375.01 re-test for better risk/reward. Trade $TSLAX. #WSOT2026 #AnthropicS1Filing #IMPACTbyTrade #MyByXTake #MidtermsMarketWatch $BTCUSDT @BybitX @Bybit Learn @IBLOLO @Kiran @Mus Invest @Jiji715 @Annnn @PRADO @JonyDong 509 @James
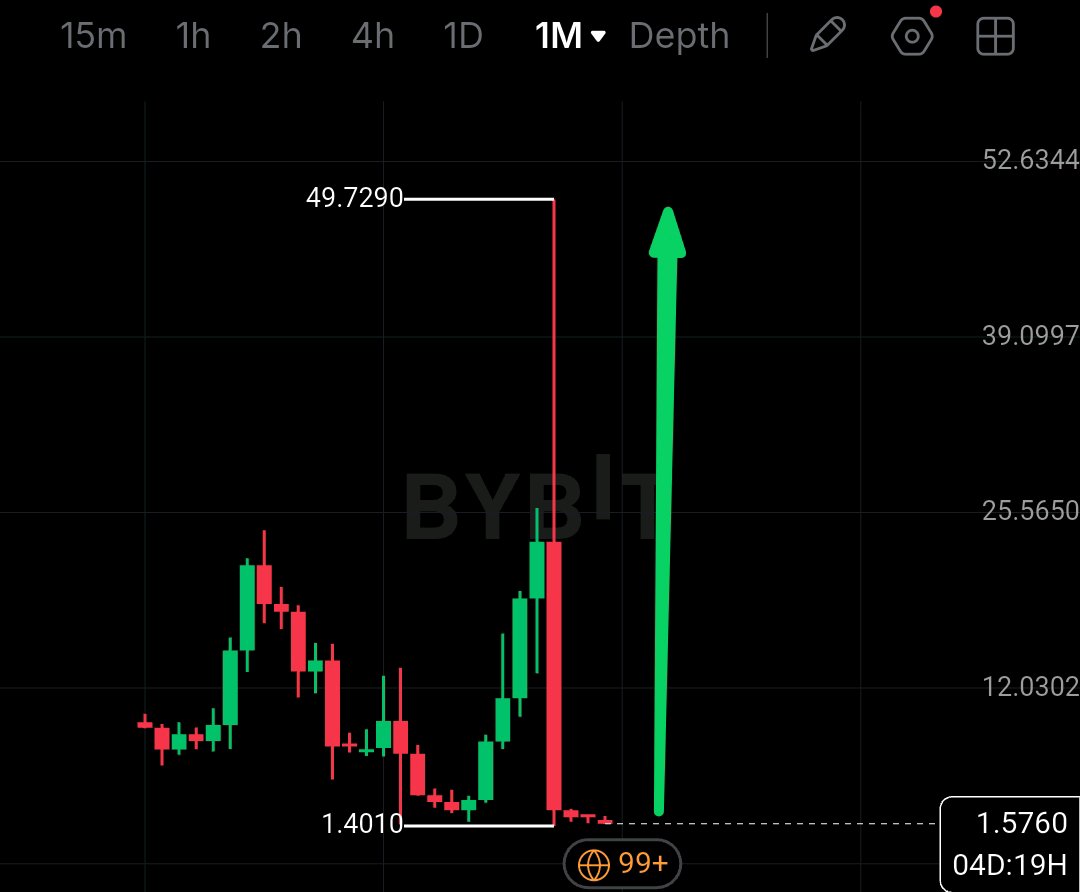
DEXE at $1.5760 after $49.7290
$DEXE at $1.5760 after $49.7290 -> $1.4010 crash on 1M. 24H High $1.6280 / Low $1.5560 / Turnover 511K RSI6 36.58 — weak. $49.99 needs 31x from here. Chances: short-term 3-5%, 12 months 20-30%, whole journey 40-50% if bull returns. Support $1.4010 / Resistance $1.6280 -> $12.03 -> $25.56 -> $49.72 Break $1.6280 = long to $12.03. Lose $1.4010 = avoid. Tap to trade. $DEXEUSDT #WSOT2026 #AnthropicS1Filing #IMPACTbyTrade #MyByXTake #MidtermsMarketWatch @BybitX @Bybit Learn @612 Ceros @SignalX @Demon - Trader @GhostWriter @VietnexusCrypto @James @IBLOLO @Kiran
BTCUSDT, Are We Seeing Capitulation?
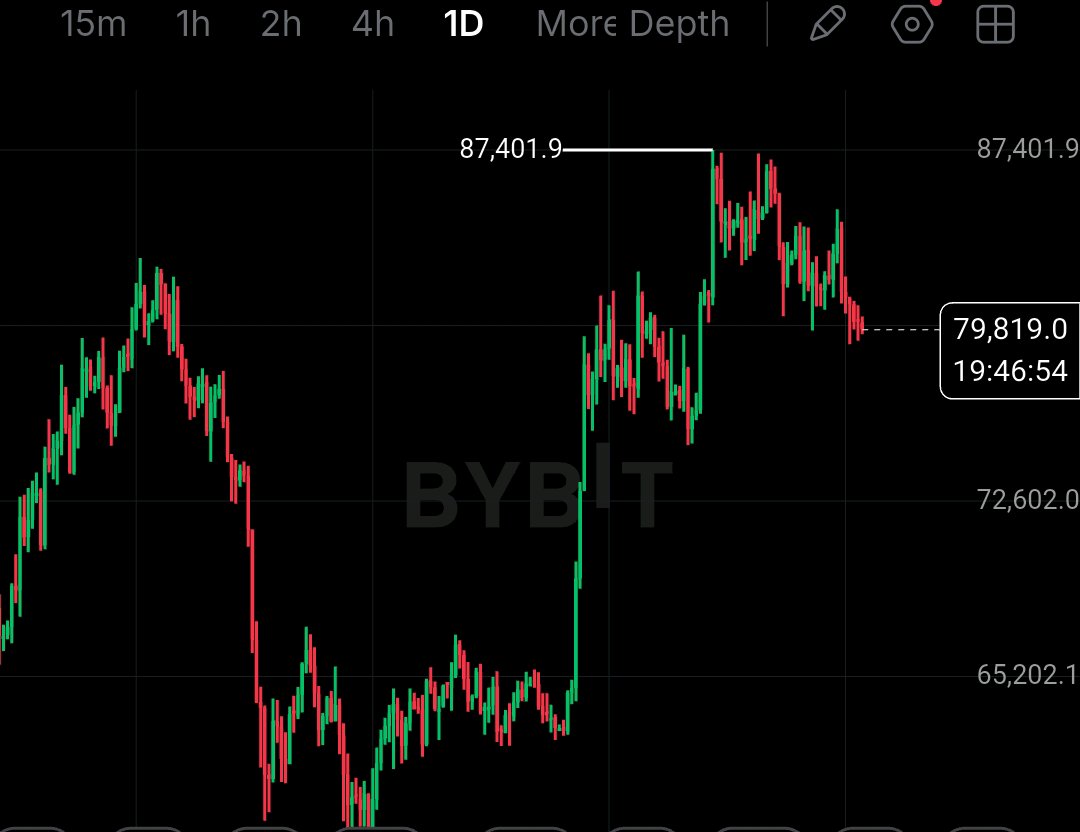
$BTCUSDT BTCUSDT at $79,791 Daily RSI 28.26 After $87,401 Top - Are We Seeing Capitulation? What I have noticed here is the structure of the candle. It has formed a -0.07% red candle. Price peaked at 87,401.9 (Sep 20) before falling all the way to the low of 79,217.9 (Oct 24-25). We are currently sitting at 79,791.4 which is the lowest point from the 8-day fall. Thin order book. Live data from Bybit Spot charts | 9:12AM: Last: 79,791.4 (-0.07%), 79,802.1, 79,805.9, 79,818.9 - Consolidation 24H: High 80,852.0, Low 79,461.1, Turnover: 645.27M-645.53M 1D: High 87,401.9, 4H: High 86,728.2, 2H/1H: High 84,906.1, Low: 79,217.9 ATH: 126,195.5 (Aug 25 2025), Low: 15,484.3 (Jun 2023). Still -36.7% away from ATH. RSI: 1D: RSI6: 28.26, RSI12: 38.28, RSI24: 47.12 - RSI6 oversold on the 1D. Last time RSI was 28 on the 1D was July 10 at the low. 4H: RSI6: 34.75, RSI12: 37.39, RSI24: 40.72 2H: RSI6: 37.41, RSI12: 41.90, RSI24: 42.80 1H: RSI6: 35.34, RSI12: 41.85, RSI24: 44.08 1W: RSI6: 52.36, RSI12: 54.98, RSI24: 51.00 - Still neutral on the weekly. Overall this is a daily oversold bounce within a downtrend. This will be bearish until $80,852 is reclaimed. We have seen a Stop Hunting sweep. We fell below $79,461.1 to $79,217.9 before bouncing back which was liquidity sucking. Key Levels: Resistance: 80,852.0 - 24H high. If price consolidates above this level we will see a continuation and test 82,062.0 & 84,906.1. Support: 79,461.1 & 79,217.9 - This is the support for our current range. If price falls below 79,217.9 we will break the local support from buyers and could see a deeper correction to 72,602.0 & 65,202.1. Trading Strategy: Breakout strategy - Do not trade within the 79,461-80,852 range. Wait for a confident breakout and 4H candle. Growth - If 80,852 breaks and reclaims with volume we could look to go long to 82,973.0 & 84,906.1. Confirmation will be a close above 80,852 on the 4H. Fall - If 79,217.9 breaks we will know sellers are in control. Confirmation will be a close below 79,217.9 and not reclaiming. 72,602.0 will be our target. I will not go long at $79,791 due to the RSI being 28.26 on the daily. I want to see if buyers come in to protect 79,461.1. Going short would be FOMO as the weekly RSI is 52.36 meaning this is still a correction not a bear market. Looking at 80,852 & 79,217.9. Waiting for the $80,852 reclaim or the $79,217 sweep? Trade this oversold zone by tapping $SOLUSDT #WSOT2026 #AnthropicS1Filing #IMPACTbyTrade #MyByXTake #MidtermsMarketWatch @BybitX @Bybit Learn @612 Ceros
PEPEUSDT Let’s talk about realistic price targets
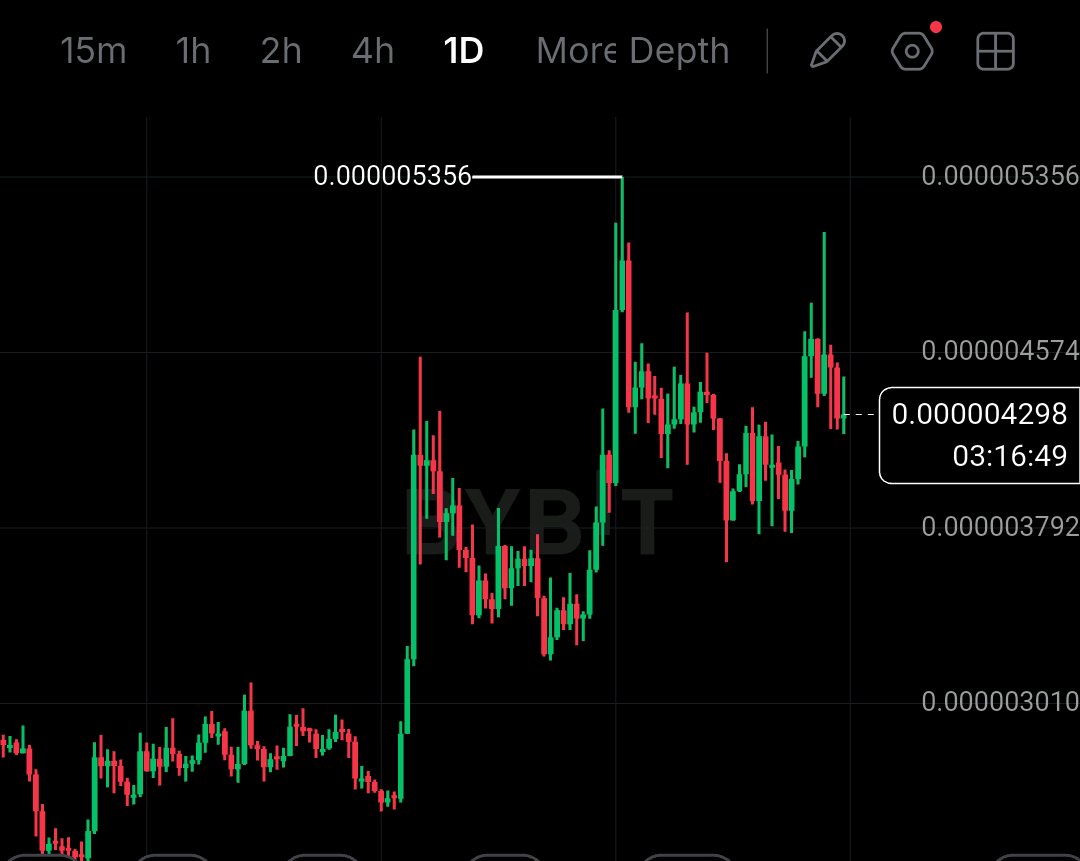
Let’s talk about realistic price targets here. Everyone’s talking about Will PEPE go to 0.$PEPE reach or 0.001 by next month? Let’s look at the chart details. Live Chart Data | PEPE/USDT Spot Chart Last: 0.000004297 [-1.44%] 24H: High 0.000004467 Low 0.000004211 5.54M Price on Bybit: ~0.0000042 USD Chart Details: On the 4H we have seen it fall all the way to 0.000003640 and then quickly spike to 0.000005111. It has since fallen back again to 0.000004297. So we’ve seen a +40% spike and then -15% drop in 3 days. 1H RSI6 25.83 Oversold. Last time RSI was at 25 on 1H, it shot up by 18%. 2H RSI6 33.50 | 4H RSI6 37.14 Short term bearish but not daily oversold. 1D RSI6 48.02 | High 0.000005356 Showing daily bullish trend as price remains above 0.000003010. Math you haven’t included in first screenshot: Market Cap at $0.00000436 would be ~$1.8B Market cap of $0.0001 would need ∼$42B 23x increase. Market cap of $0.001 would need ∼$420B 229x increase. That’s more than $ETH. Both of these targets are ambitious but it doesn’t mean they’ll happen next month. Level watching: Support: $0.000004211 (24H low) / Major $0.000003765-$0.000003640. If this breaks, $0.000003010 comes into play. Resistance: $0.000004467 (24H high) / $0.000005111 (Highest price recently). We need to see consolidation above this level to give us a test to $0.000005356. Trading Strategy: Breakout strategy: Waiting for a strong breakout and to see the candle close. There is an increased risk of trading within this range (0.000004211-0.000004467). Bull Run: If price goes above $0.000004467 is broken and reclaimed with volume + RSI6 crossing 40 on 1H/2H, we consider impulsive continuation toward $0.000005111. Confirmation that it’s going up would be a close above $0.000004467. • Decline scenario: A breakdown of $0.000004211 on the 1H. This will show that sellers are dominating. If it closes below $0.000004211 and failure to reclaim. Then $0.000003765 this is bearish confirmation. I’m not going for $0.0001 or $0.001. I’m looking at $0.0001 would need ∼$0__PEPE proving that it can stay above what $0.0001 would need ∼$1__BTC holds. If I had to choose just one realistic target, I’d say $0.0001 would need ∼$2__0.0001. What level are you looking at? $0.0001 would need ∼$3__0.000004467 Breakout? Trade this range by tapping on $PEPEUSDT #WSOT2026 #AnthropicS1Filing #IMPACTbyTrade #MyByXTake #MidtermsMarketWatch @BybitX @Bybit Learn @612 Ceros @SignalX @Demon - Trader @GhostWriter @VietnexusCrypto @James @JonyDong 509 @PRADO
Gold XAUT Consolidation
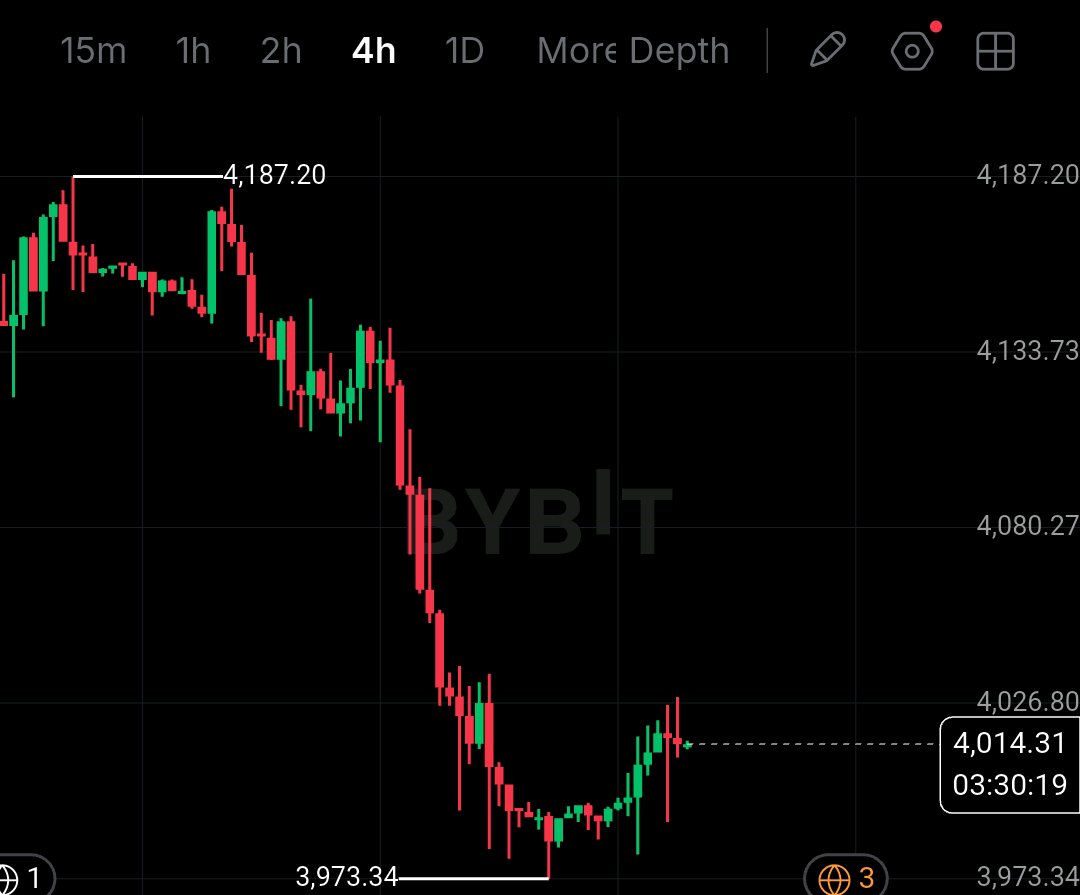
What can we expect from a breakthrough? Let’s take a look The current session for gold is consolidating within a tight range. We’re trading within Friday’s impulse range of 3975 – 4034. This is a typical accumulation zone. Until price tests either of these levels, it is simply consolidation. Accumulation is taking place at these levels, which will usually lead to an impulsive move, therefore any trades made within this range would be high risk. Live Data Price: 4,013.33 +0.42% | Mark Price: 4,013.52 High (24H): 4,028.64 | Low (24H): 3,980.68 | Volume: 26.86M Structure (4H): High 4,194.40 -> flush low 3,973.34 -> Rebounding to 4,013.33 RSI6: 64.00 | RSI12: 46.67 | RSI24: 38.31 | Ranging after a large correction down from 4,194.40 Resistance (4034 / 4028.64) – Upper end of Friday’s impulse range. If price consolidates above here then we can expect to see a continuation of the bullish trend with new local highs being tested at 4,139.13 & 4,194.40. Support (3975 / 3980.68) – Lower end of the current range. Price breaking below this would break the local buying pattern and could cause a larger correction to 3,973.34. Trading the breakout We’re waiting for a strong breakout of either of these levels and a closing candle. Do not trade within the 3975 – 4034 range. Bullish case – Price breaks above 4034 and reclaims 4,028.64 with volume. Expect an impulsive continuation. Confirmation = Close above 4034 on 4H. Bearish case – Price breaks 3975 showing seller dominance. Confirmation = Closing below 3,980.68 with no reclamation. Until we get a clear signal we want to be disciplined and not chasing at 4,013.33. I’m looking to watch 4034 & 3975. Are you waiting for the breakout? Click $XAUTUSDT to trade the accumulation zone. #WSOT2026 #AnthropicS1Filing #IMPACTbyTrade #MyByXTake #MidtermsMarketWatch @BybitX @Bybit Learn @612 Ceros @SignalX @Demon - Trader @GhostWriter @VietnexusCrypto @James @JonyDong 509 @PRADO
TSLAUSDT has just made a huge bullish
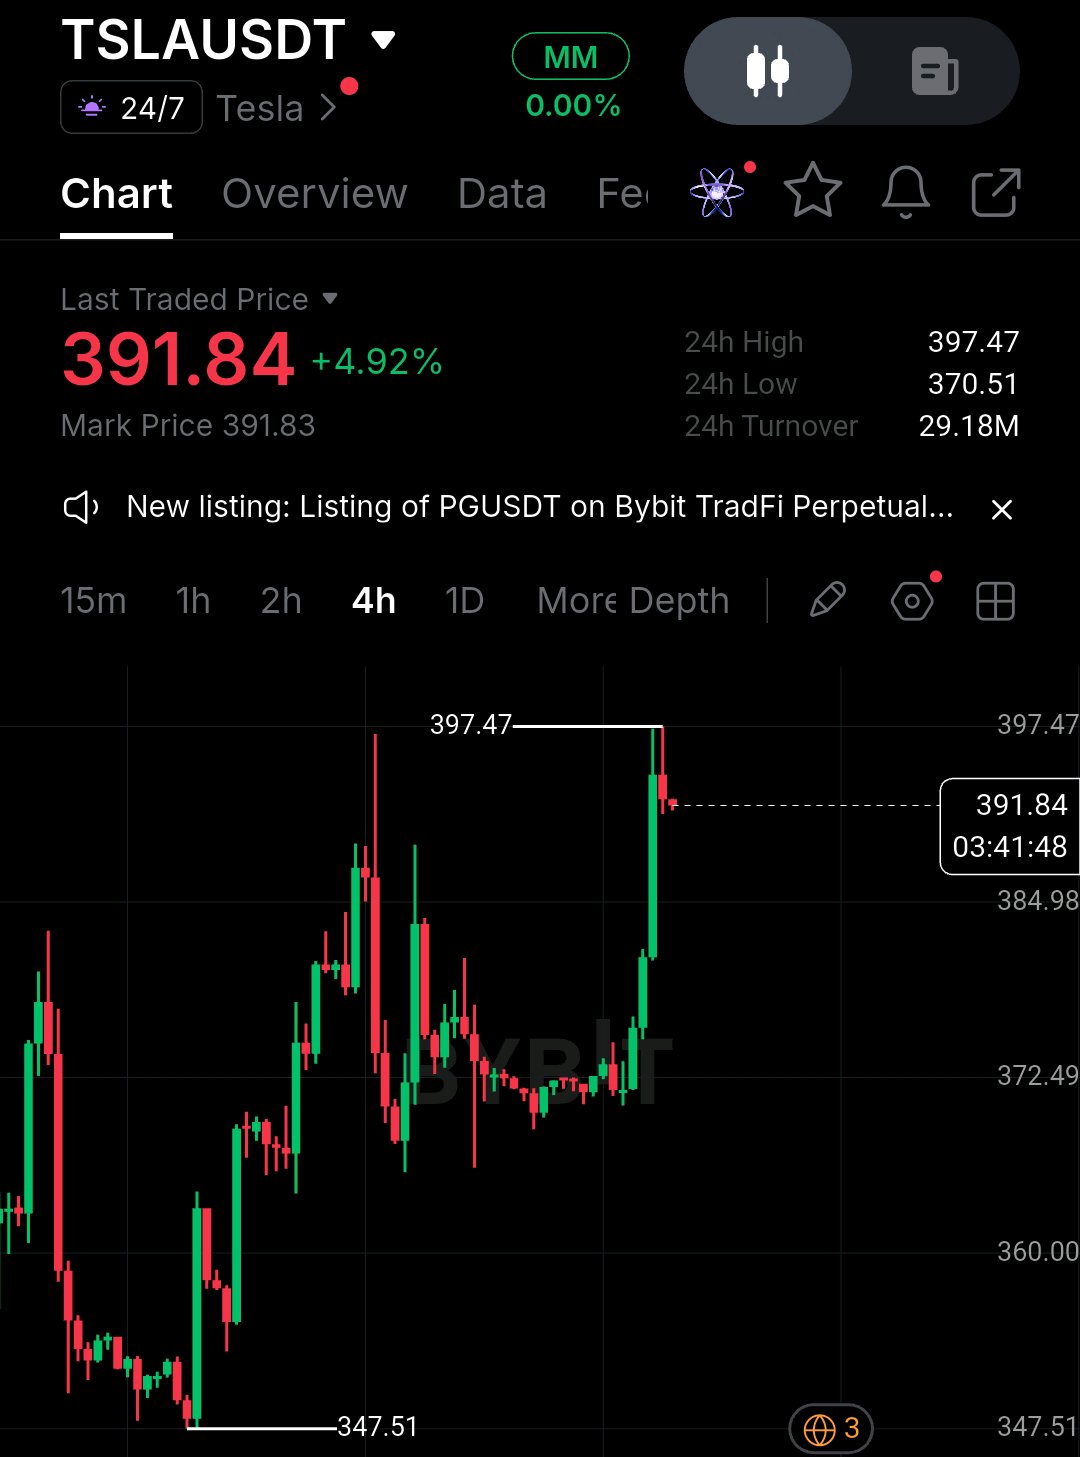
$TSLAUSDT has just made a huge bullish vertical move to a high of 397.47 (+4.90%). However, what stands out is The price gapped down to 347.51 low on Oct 19, after which it was range bound between 370.51 and 371.96 for three days. After this, it went vertical, breaking over 384.71 and 384.98 as it made a huge move up to the high of 397.47. We are now trading at 391.85 (very top of the expansion). The orderbook shows bullish pressure. Live data from your TradFi chart Bybit | 1:17 AM: Last Traded: 391.85 (+4.90%) Mark: 391.82 High: 397.47 Low: 370.51 Turnover: 29.18M (24H) Most importantly, The price is now trading well above the BOLL(20,2) and all MAs. From your charts: RSI6: 1H: 58.08 2H: 70.48 4H: 82.40 1D: 76.78 We can see momentum is strong. However, looking at the 4H chart, RSI6 is at 82.40, meaning we are in a blow off phase. Looking at the 1D chart, we have a long way to go before we hit the top of 453.60 from June. This is a bounce rally, not a new ATH. This looks like a bullish post-expansion trade. However, buying at 391.85 would be a poor risk/reward. You would need to place your stop below 384.98 just to protect against normal volatility. Proper swing stop would be below 370.51. If we retrace and the price hits 384.98 and forms a bullish rejection wick, then it would present a good opportunity to buy long to continue the trend. Buy here is FOMO. I am keeping an eye on 384.98 and 370.51 (24h low). If we hold above 384.98 then we will continue higher towards breaking the high of 397.47 and hitting 410+. If we hit below 370.51 then we will gap back down to between 346.46 and 353.00. I am not buying $TSLA at the top. I want to see if bulls can hold 384.98. Do you want to wait for a retrace or take profits? Click to trade $TSLAXUSDT $BTCUSDT #IMPACTbyTrade #ByXIMPACT @BybitX @Bybit Learn @Jiji715 @612 Ceros @SignalX @Demon - Trader @James @IBLOLO
SIRENUSDT: Oversold RSI 19.73
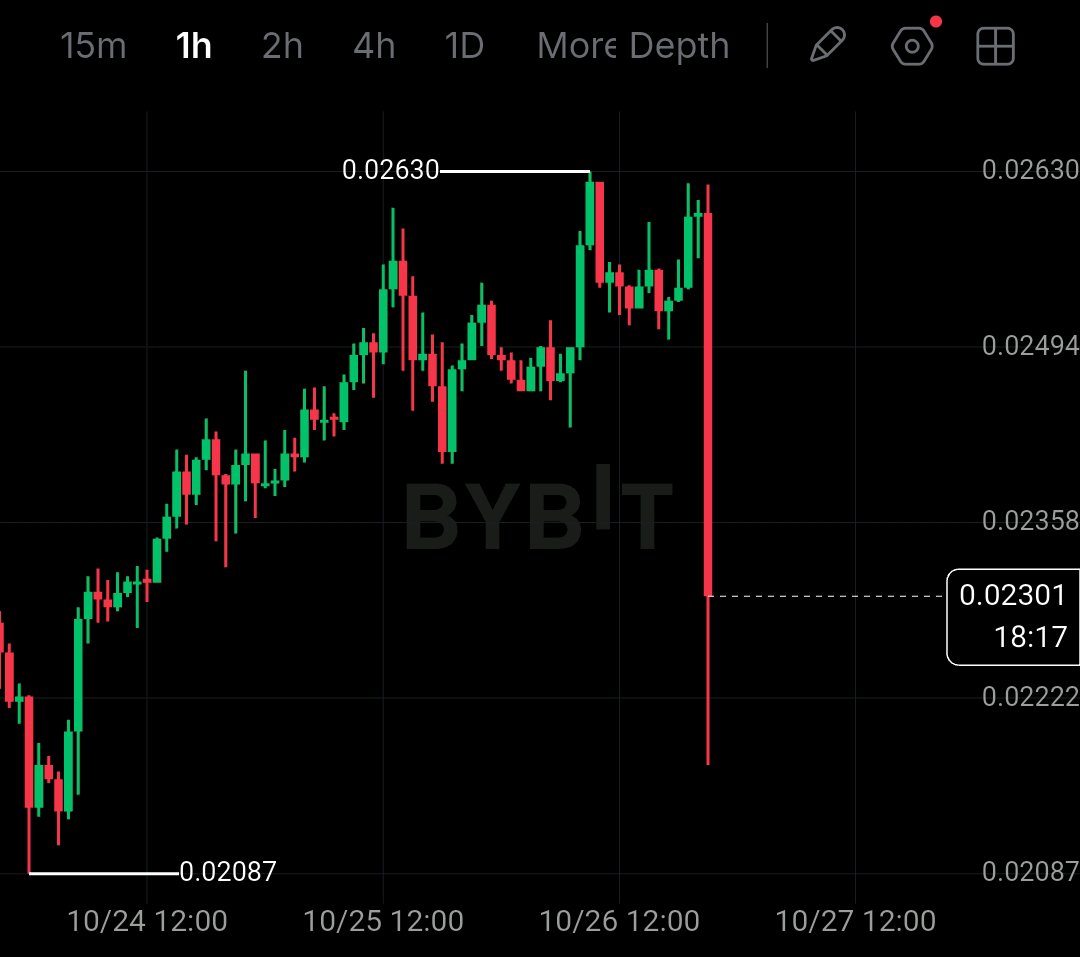
SIRENUSDT: Oversold RSI 19.73 & Capitulation $0.02312 $SIREN is losing value once more on Bybit Futures. Live Chart Data (9:37PM): Last Traded: $0.02312 (-7.96%) Mark Price: $0.02316 24H High: $0.02630 / 24H Low: $0.02171 | 24H Volume: 1.98M Funding: -0.0555% (3h22m) Short squeeze -70% Short / 30% Long Orderbook: Sell wall at $0.02326 (144 USDT) Chart Analysis: 4H Chart: $SIREN topped at $0.04137 (Oct 17) -> crashed to $0.02038, bounced to $0.02630 (Yesterday). Then fell sharply to $0.02171. 1H Chart: Double Bottom at $0.02087 — price just wicked down to $0.02112. RSI6 = 19.73, RSI12= 30.08, RSI24= 39.29. RSI6 is very oversold. When it last dropped to 30.83 (Oct 27), it rebounded +25% to $0.02630. Support & Resistance: Support: $0.02171 (24H low) / Major $0.02087 / $0.02038. Breaks support = No bottom Resistance: $0.02321 (current mark) / $0.02630 (24H High) / $0.04137 (Recent high). $SIREN is in Innovation Zone so expect increased volatility and risk. Bullish Confirmation: Bullish pattern confirmed by holding $0.02171 and reclaim $0.02321. Oversold RSI 19.73 pattern confirmed. Look for breakout above $0.02630 would bring $0.03087. Short squeeze is present due to 70% Short and Funding -0.0555%. Bearish Confirmation: Break below $0.02087 and fail to reclaim. Then $0.02038 to act as a bearish level. Do not go long without confirmation in the red -7%. Not buying this knife. $0.02312. Need to see $0.02171 is being held. Holding low cap AI coins such as $SIREN topped at $0__BTC. Waiting for $SIREN topped at $1__0.02630? Trade this oversold level by tapping $BTCUSDT
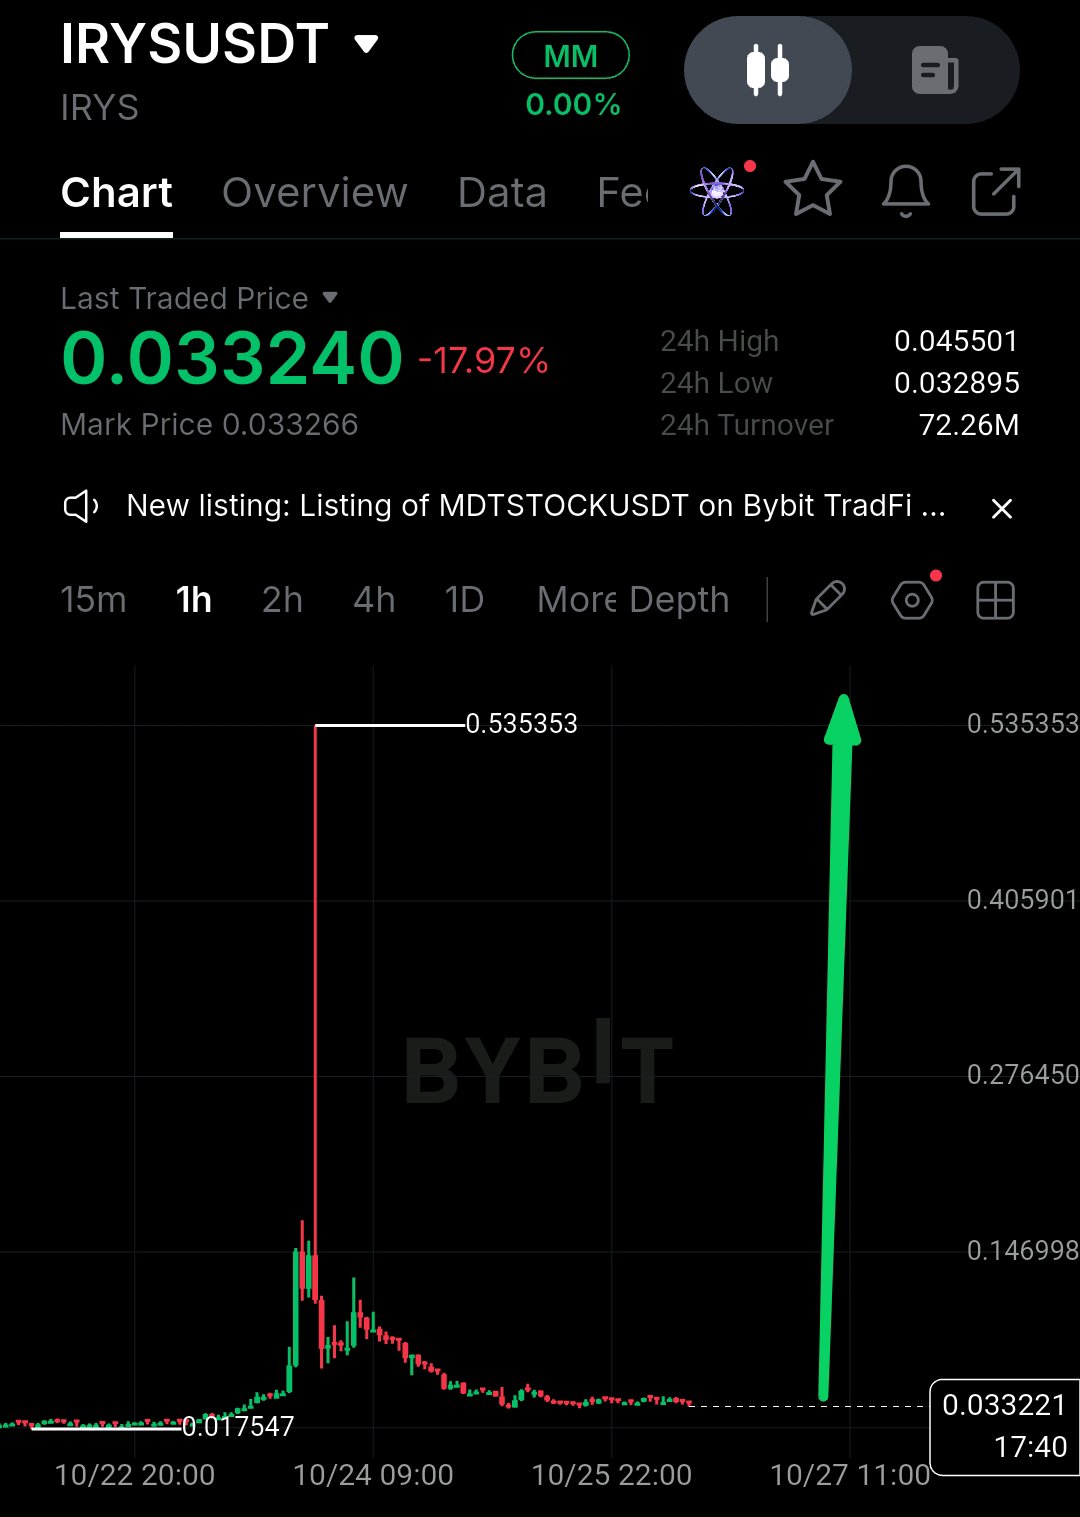
IRYSUSDT falls -18% today
IRYSUSDT falls -18% today after hitting a high of $0.50406. We can see on the 1D chart that price went from $IRYS Perp is at $0.03316 to $IRYS listed on Oct 15 around $0.01168 then straight up to $0.50406, then dumped -93% to $0.033. This is a textbook new listing pump. Today (10:35 AM): Last price: $0.03310 / Mark: $0.03326 24h High: $0.04489 / Low: $0.03285 Volume: 6.45B IRYS ($238.94M) Funding (1h): -0.04813% (Countdown: 00:24:44) Very bearish, bears are aggressive. Orderbook: There’s a wall at $0.03330 (221K IRYS), Bids at $0.03322 (165K) Long/Short Ratio: 32.85% Longs | 67.15% Shorts. Everyone is bearish here. Performance: Today: -8.64% | 7 Days: +171.98% | 30 Days: +92.89% | 90 Days: +118.19% | 180 Days: -0.66% Volume is still huge. 4H Volume is 321M IRYS. Moving average 5: 890M & Moving average 10: 1.28B. MA5 is below MA10 and so we’re seeing momentum drop. Support & Resistance: Support: $0.03285 (24H low) — if this breaks, $0.01168 listing support. Resistance: $0.04489 (24H high) / $0.09578 next big level. Bullish: Bears are stepping in to buy at $0.03285 and reclaim $0.04489. We’re seeing volume and funding turn positive. With 67% of people being bears we could easily see a short squeeze occur. This will put $0.09578 in play. Bearish: Price breaking below $0.03285 and fails to reclaim it. With negative funding -0.048%, sellers are still in control. $0.01168. I’m not buying this falling knife. After a big move of $IRYS listed on Oct 15 around $0__0.03 price needs to show it can stay above $IRYS listed on Oct 15 around $1__IRYS and be volatile for a few days. Are you sitting around waiting for a retest? Click $IRYS to trade this volatility. Remember to use low leverage as funding is hurting both bears and bulls currently. #MyByXTake #MidtermsMarketWatch #FOMCRateDecision #Bybit8thAnniversary #2026FinancialPassport @BybitX @Bybit Learn @shuja246
SIRENUSDT: -99% Crash
SIRENUSDT: -99% Crash. Will it rebound to $SIREN Finally Bottoming at $0.02596? $SIREN Perp is trading at $0.02596 (+4.22%). From the chart you can see it has fallen from $1.38670 high to $0.01745 (July 15th) meaning it has fallen -98.7% since. It has bounced from $SIREN has been flat for 3 months, consolidating between $0.017 and $0.026. Today’s Data (26th Oct 2026): Last: $0.02596 / Mark: $0.02595 24hr High: $0.02623 / Low: $0.02376 Volume: 481.16M SIREN ($12.07M USDT) Intraday Volume: 108M. MA(5): 372M. MA(10): 1.16B. Volume has started to increase after being quiet for months. Performance: +4.42% today. -22.53% (7 Days). +9.67% (30 Days). -4.17% (90 Days). -96.25% (180 Days). -69.63% (1 Year). Support/Resistance: Support at $0.02376 (24H low) — recent buy zone. Major historical support is $0.01745. If this level breaks there will be no support. Resistance at $0.02623 (24H high). Break above $0.02623 with a large amount of volume means we have a breakout buy set up on this level. Next target is $0.03. The trend is still ranging. We can see that the MA(5) at 372M is still below the MA(10) at 1.16B meaning the short term momentum is not strong. The +4.42% gain today is simply a bounce in a larger downtrend of -22.53% weekly. Bullish Confirmation: If it can hold above $0.02376 and reclaim $0.02623 with volume then $0.03 will come into view. Bearish Confirmation: If it loses support at $0.02376 and fail to reclaim it — $0.01745 then this will act as a bearish reference. I am not looking to buy the green candles here. I want to see it break above $SIREN Perp is trading at $0__0.02623 before I look to buy the rebound. Low cap AI coins like this can rally quickly once volume starts to increase. Last time we had a spike of 6.2B. Are you watching $SIREN for a bottom? #ByXIMPACT