LOWSCREAMER™
Crypto enthusiast | Market analysis | Web3 Learning, researching, and sharing insights on the crypto market.
$XMR | Monero Faces a Critical Test
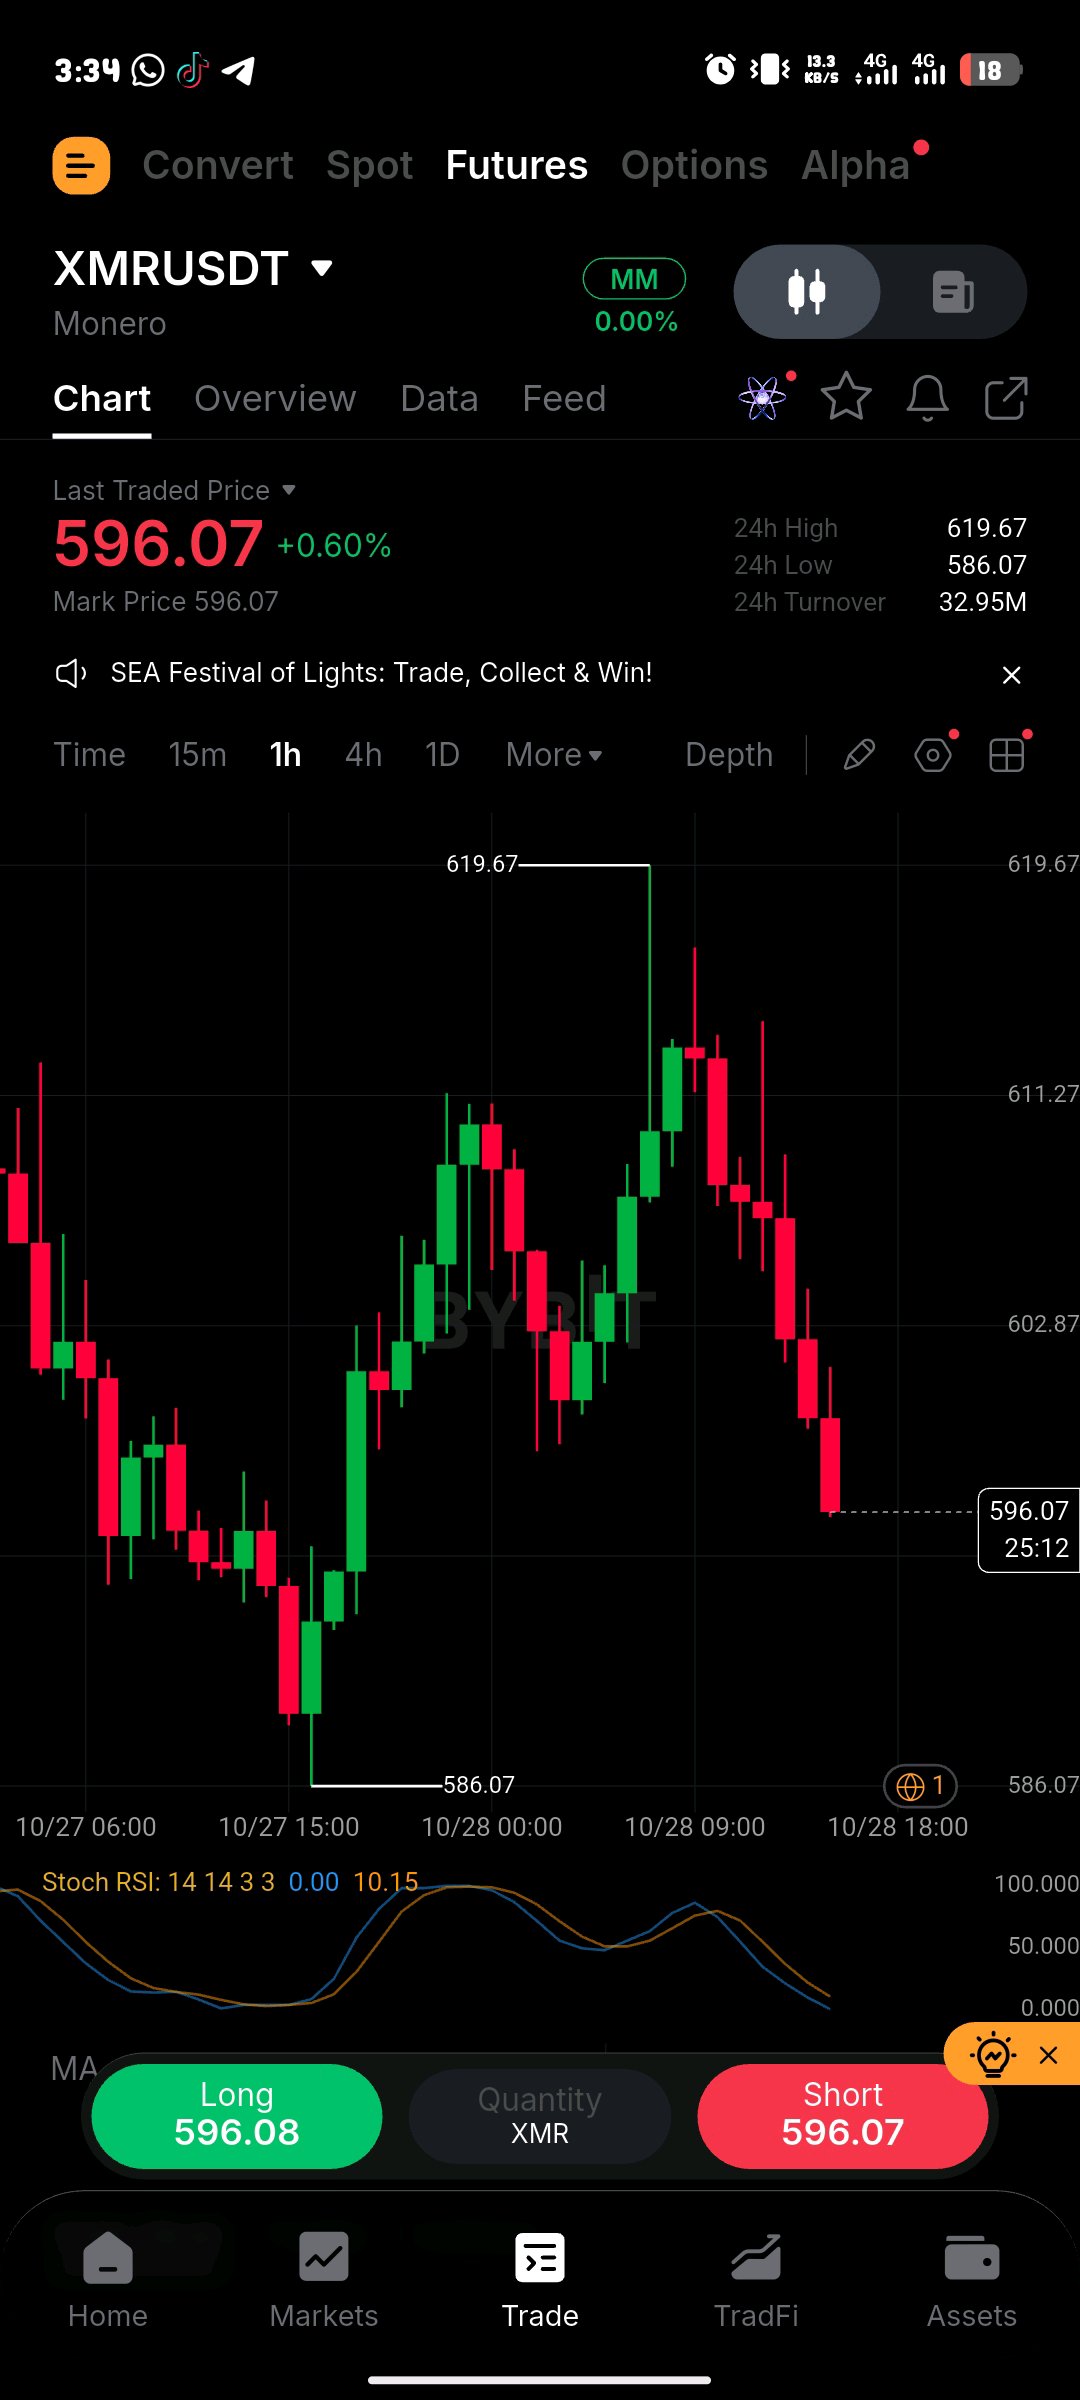
I’ve been watching $XMR, and what caught my attention is that Monero is struggling to follow Bitcoin’s recent strength. While the broader crypto market has shown signs of recovery, XMR has faced selling pressure around the $600 area. For me, the key question is whether buyers can defend support and bring momentum back. Fundamental Analysis Monero remains one of the leading privacy-focused cryptocurrencies. Its development community continues working on privacy improvements, including the proposed FCMP++ upgrade, which aims to strengthen transaction privacy. Recent network activity has also remained active, while the network’s hashrate has approached previous highs. However, mining-pool concentration remains a concern, and technical development alone does not guarantee higher prices. I want to see continued network activity alongside stronger demand for the token. Technical Analysis According to market data published on October 28, XMR was trading around $598–$606, with $590 emerging as an important short-term support level. The price has also faced resistance near $620. Key Levels I’m Watching - Resistance: $610–$620 - Breakout target: $635–$650 - Key support: $590 - Lower support: $575 - Major downside reference: $560 Bullish Scenario: If XMR holds above $590 and breaks through $620 with stronger volume, I’ll watch for a possible move toward $635–$650. Bearish Scenario: If sellers push XMR below $590 and the breakdown holds, the next area I’ll watch is around $575, followed by $560. My Market View I’m cautious on $XMR until buyers demonstrate stronger momentum. The project has a clear identity in the privacy sector, but the chart still needs confirmation. I’ll be watching the $590 support and $620 resistance zones to understand which side is gaining control. I don’t want to mistake a temporary bounce for a confirmed reversal. Price action, volume, and Bitcoin’s direction will all matter. What’s your view on $XMR? Can Monero reclaim $620 and move toward $650, or will sellers push it below $590? Share your thoughts in the comments. $PEPEUSDT $BCHUSDT #AnthropicS1Filing #IMPACTbyTrade
🟢 $HYPE | Bulls Are Back, But Can They Break $85?
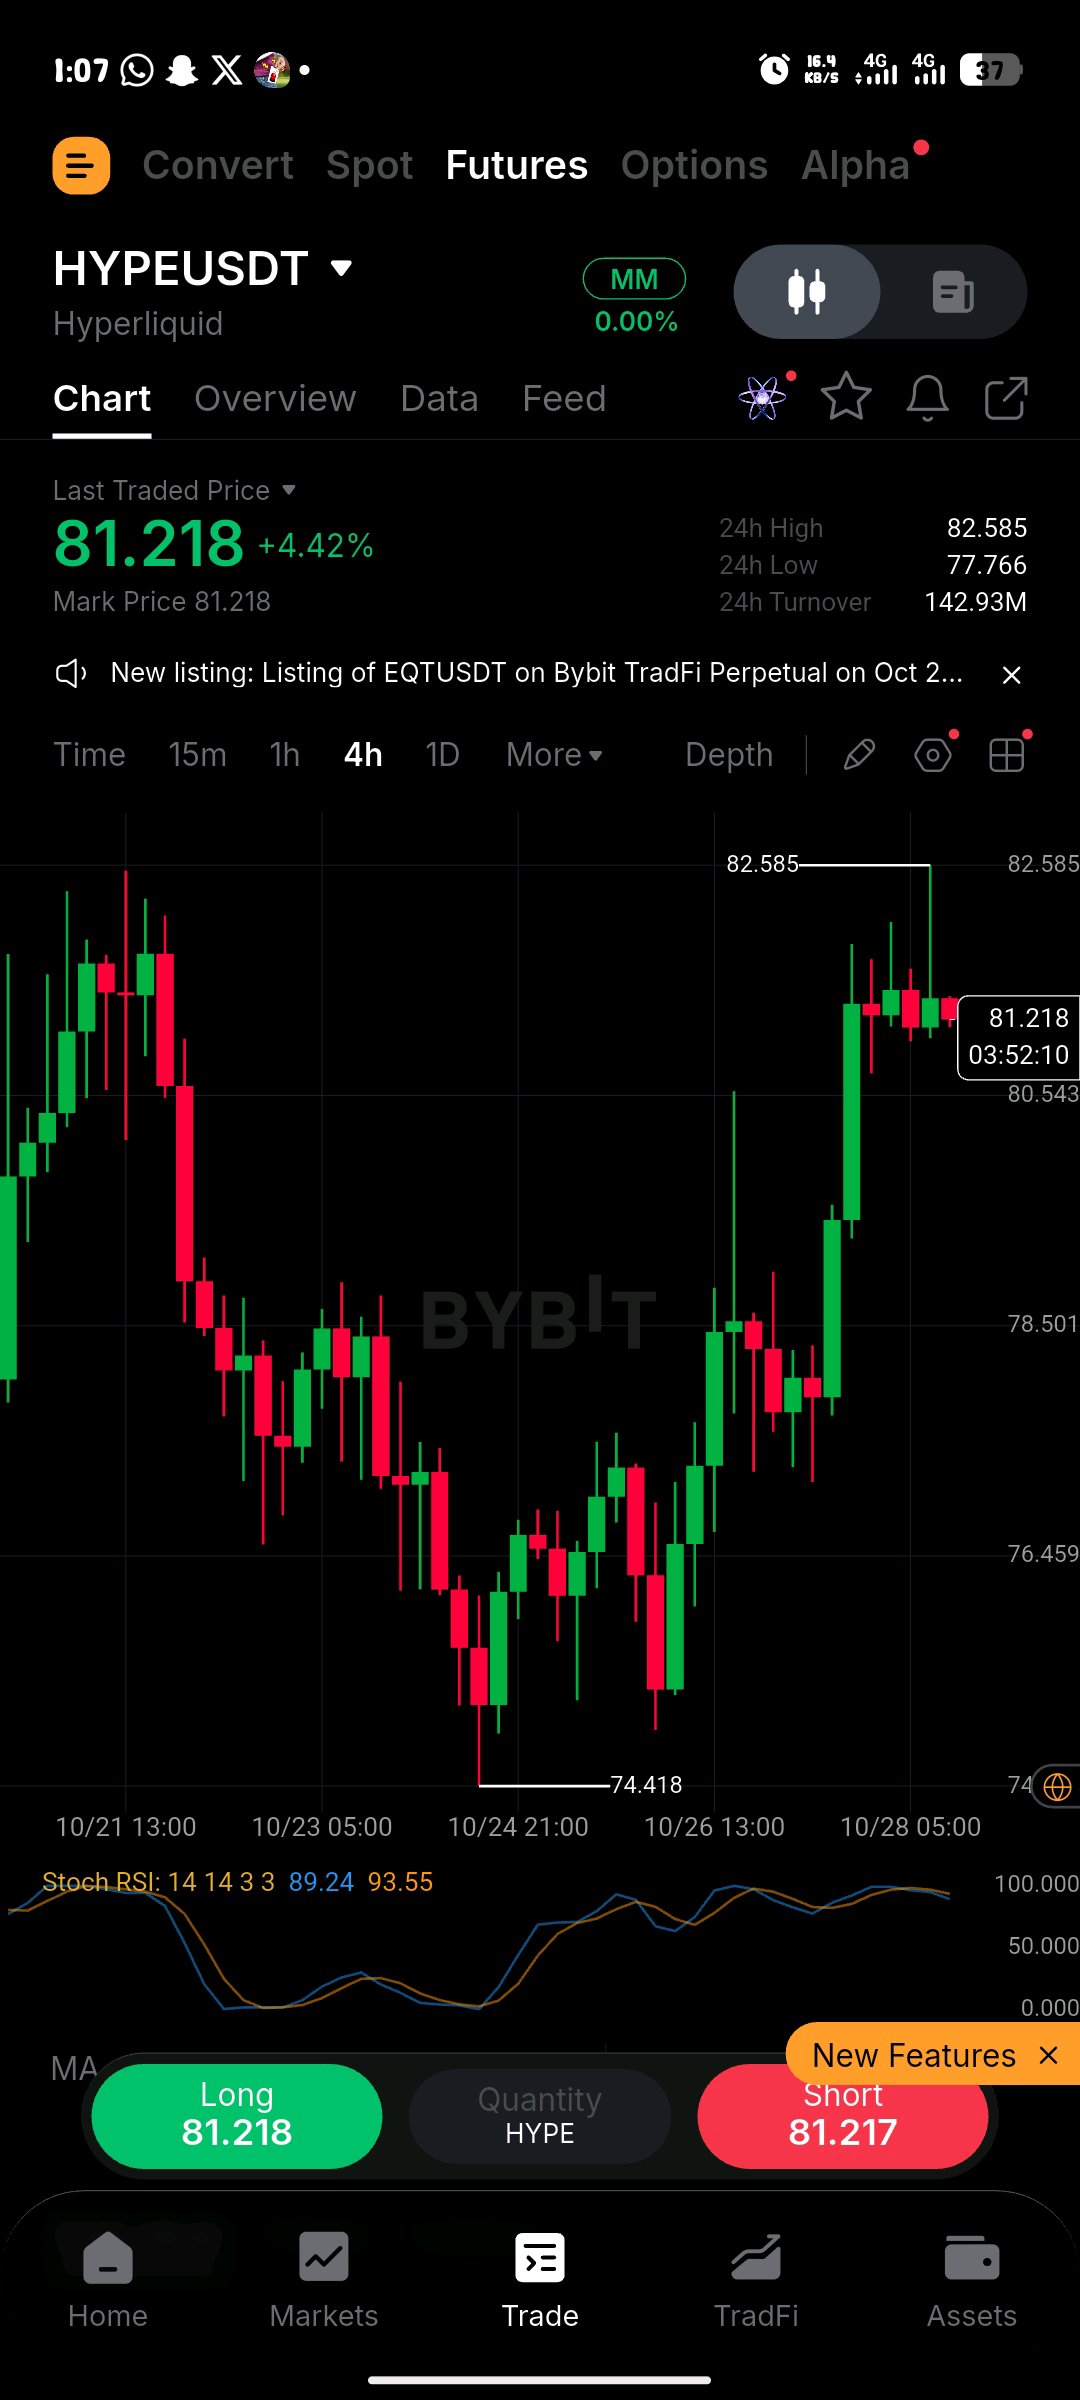
I’ve been watching $HYPEUSDT and the latest move is getting interesting. Hyperliquid is showing renewed buying pressure, with the token trading around $81.50 after gaining roughly 5% over 24 hours. What caught my attention is the growing interest in regulated access to Hyperliquid’s perpetual markets in the United States, although the proposal still requires regulatory approval. Fundamental Analysis For me, one of the most important things about Hyperliquid is its on-chain trading ecosystem. More markets, increased trading activity, and broader accessibility could support the platform's growth. However, I also want to see whether this translates into sustained usage and fee generation. Regulatory uncertainty and competition remain important risks. Technical Analysis HYPE is showing improving short-term momentum, but I’m watching the resistance zone closely. A bullish momentum signal does not automatically confirm a complete trend reversal. Key Levels I’m Watching - Current reference: $81.50 - Resistance: $82.50 - Next target zone: $84.60–$87.00 - Support: $80.00 - Lower support: $78.00 - Bearish target zone: $75.50–$73.00 Bullish Scenario: If HYPE breaks above $82.50 and holds with stronger volume, I’ll watch for a move toward $84.60, followed by $87.00. Bearish Scenario: If the price fails at resistance and loses $80, I’ll watch the $78 support zone. A confirmed breakdown below $78 could expose the $75.50–$73.00 area. My Market View Personally, I’m cautiously bullish on the short-term momentum, but I don’t want to chase the move blindly. I want to see buyers defend $80 and reclaim $82.50 before considering the recovery stronger. If resistance holds, another pullback remains possible. What’s your view on $HYPE? Can bulls break $82.50 and push toward $87, or will sellers take control again? Let me know your thoughts in the comments. #IMPACTbyTrade #BybitStocks
🟠 $BTCUSDT | Fed Decision: My Market View
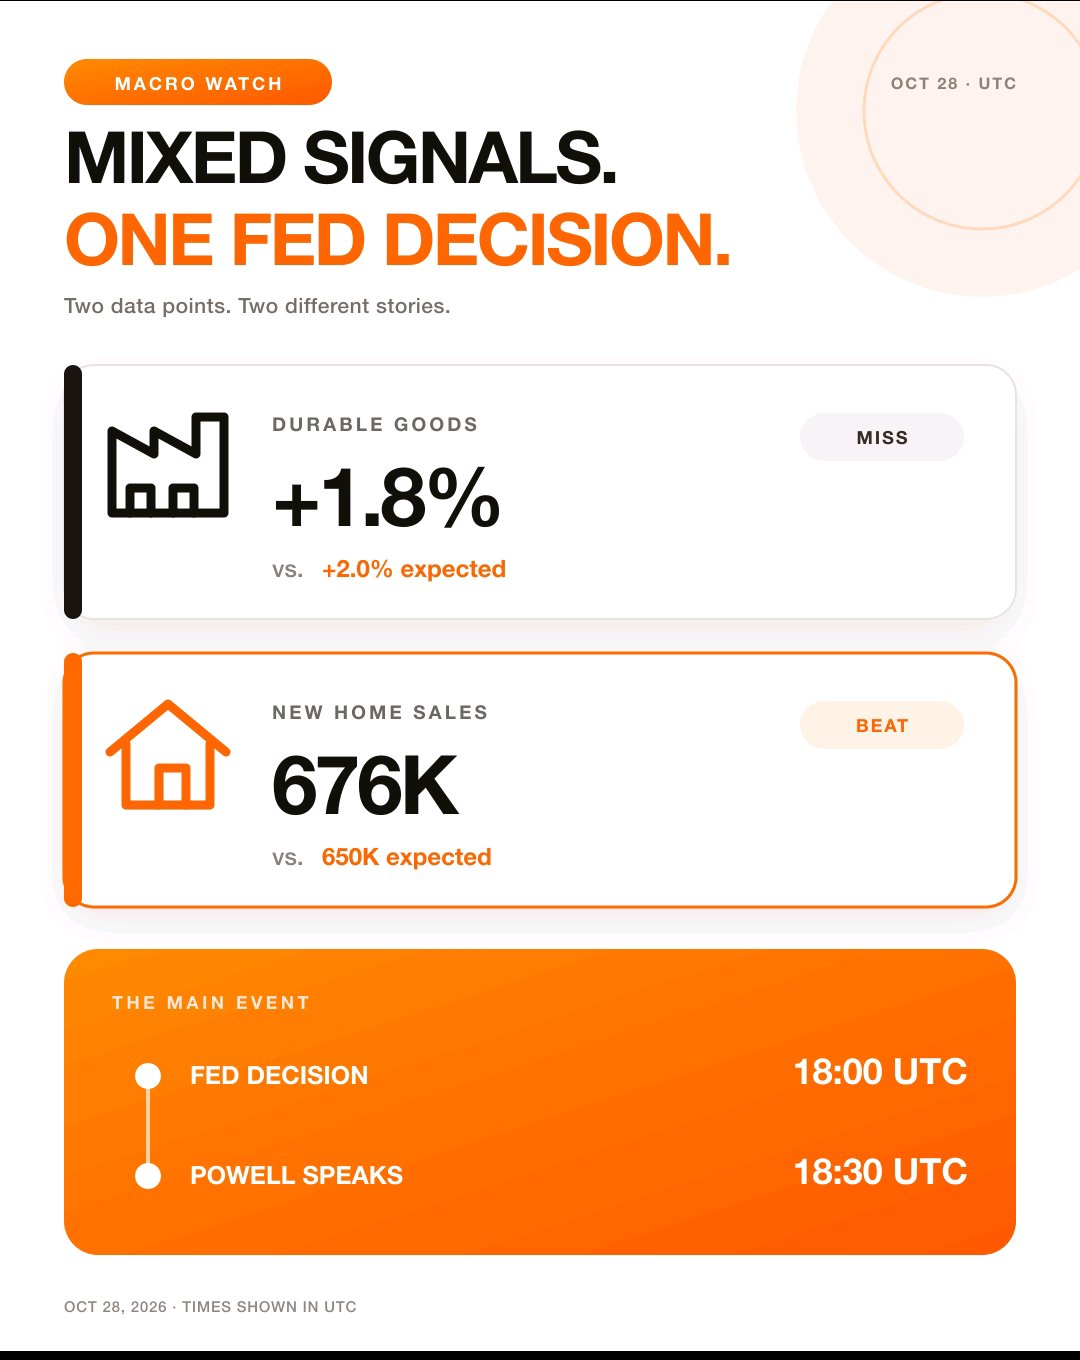
I’m expecting volatility in Bitcoin today, and my current bias is WHIPSAW. The U.S. economic data is sending mixed signals, and the Federal Reserve’s decision could determine the next major move across crypto and traditional markets. Durable goods orders rose 1.8% against 2.0% expected, showing slightly weaker growth than forecast. Meanwhile, new home sales reached 676K against 650K expected, coming in stronger than anticipated. One report suggests some weakness, while the other shows resilience. This makes the Fed’s statement especially important. My BTC levels: - Current reference: Around $81,000 - Resistance: $82,000–$82,500 - Bullish target: $84,000–$85,000 - Support: $79,000–$80,000 - Bearish target: $77,000–$78,000 - Invalidation: A sustained move outside the expected range would invalidate my short-term whipsaw scenario and require a fresh analysis. 🟢 Bullish scenario: If BTC breaks above $82,500 and holds that level, I’ll watch for a potential continuation toward $84,000–$85,000. 🔴 Bearish scenario: If BTC loses $79,000 decisively, I’ll watch for a possible move toward $78,000 and $77,000. 🟠 Why I expect a whipsaw: The market may react not only to the rate decision but also to the Fed’s comments about future policy. Even if rates remain unchanged, its outlook could surprise investors and trigger a quick move in either direction. My conclusion: I’m not choosing a direction blindly before the announcement. I want to see how BTC reacts around $82,500 and $79,000, then judge whether the breakout or breakdown has confirmation. Traders, what’s your call? BTCUSDT, ETHUSDT, Gold, Nasdaq, or USD—which market do you think will move hardest after the Fed decision? And are you expecting risk-on, risk-off, or a whipsaw? $BTCUSDT $ETHUSDT #WSOT2026 #MidtermsMarketWatch #FOMCRateDecision #Bybit8thAnniversary #IMPACTbyTrade
$BTC: Bitcoin Bulls Face a Critical Test
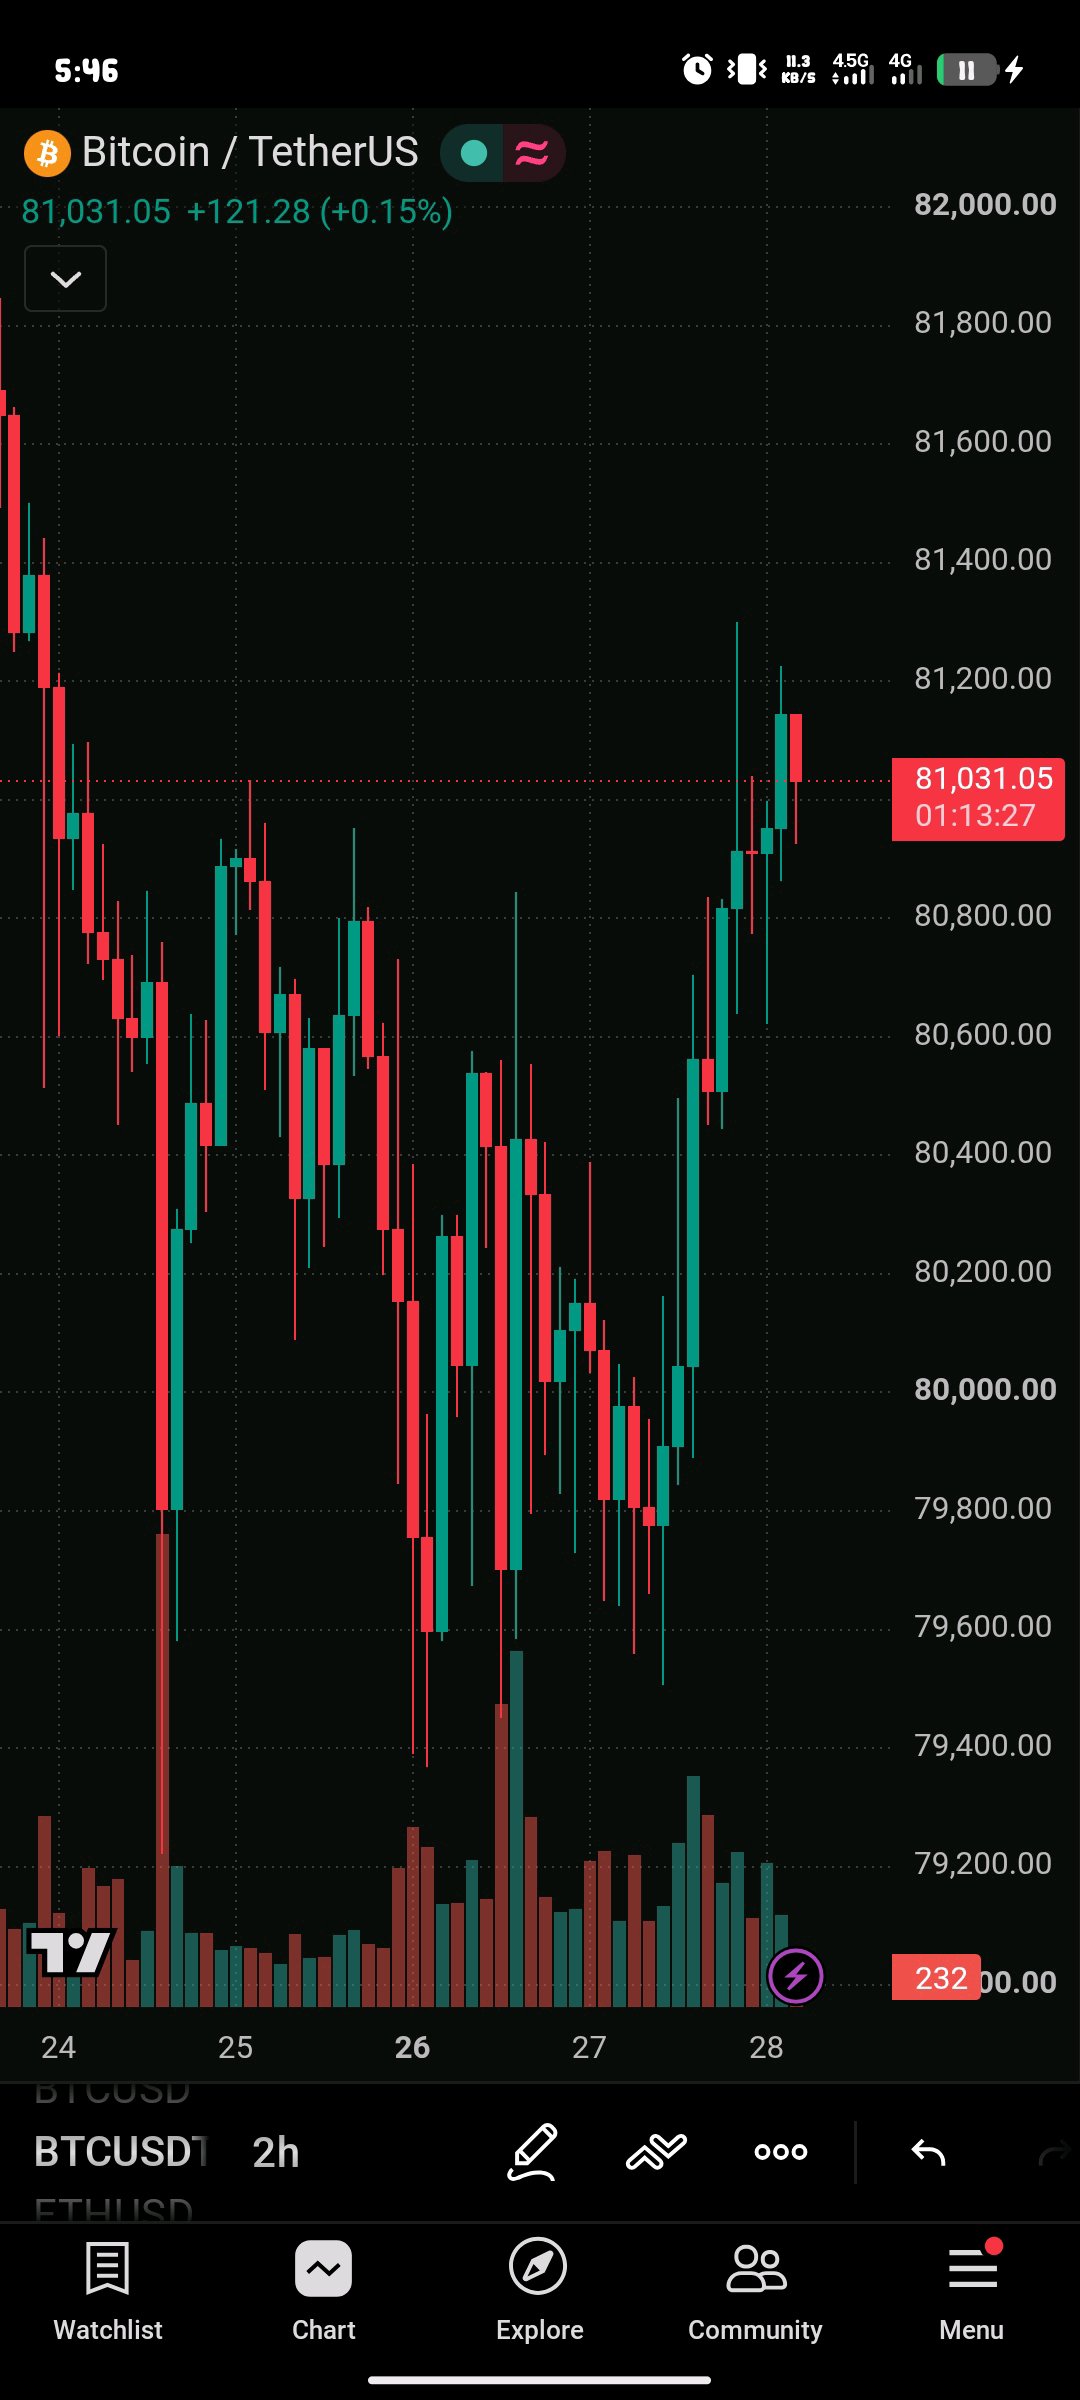
I’ve been watching Bitcoin closely, and right now, the $80,000 level is the main area I want to keep on my radar. BTC recently dropped below this psychological level before recovering, showing that buyers are still trying to defend the market. However, I’m not convinced that the recovery is strong enough to confirm a bullish reversal just yet. The next move could depend heavily on whether buyers can reclaim resistance and how the market reacts to the Federal Reserve’s decision. Market Analysis Bitcoin’s recent weakness has been influenced by broader market uncertainty, pressure on risk assets, and concerns about institutional investment flows. The upcoming Federal Reserve decision is particularly important because interest-rate expectations can affect demand for assets such as Bitcoin. If the Fed’s message supports risk appetite, BTC could benefit. If investors remain cautious, selling pressure could continue. Key Technical Levels I’m Watching - Major support: $79,000–$80,000 - Resistance: $81,500–$82,000 - Next resistance: $84,000–$85,000 - Lower support: $76,500–$78,000 Bullish Scenario: If BTC holds above $80,000 and breaks through $82,000 with convincing volume, I’ll watch for a possible move toward $84,000–$85,000. A sustained breakout would give buyers a stronger argument for recovery. Bearish Scenario: If BTC loses $79,000 decisively, downside pressure could increase toward $78,000 and potentially the $76,500 area. A brief move below support followed by a quick recovery could instead indicate a false breakdown, so confirmation matters. My Market View Personally, I’m staying cautious. Bitcoin remains the market’s key trend indicator, and weakness in BTC can put additional pressure on altcoins. I want to see how price behaves around $80,000 and whether buyers can reclaim $82,000 before describing the market as bullish again. For now, I’m focusing on price structure, trading volume, institutional fund flows, and the Fed’s messaging rather than making assumptions based on a single bounce. In this market, patience and risk awareness matter more than chasing every move. What’s your view on $BTC? Can Bitcoin reclaim $82,000 and push toward $85,000, or will sellers take it below $79,000? Share your analysis in the comments. $BTCUSDT #IMPACTbyTrade
lI’ve been looking at $CORE, and what stands out to me is how the token is trying to stabilize after a prolonged decline. CORE is the native token of Core DAO, a Layer 1 blockchain designed to combine Bitcoin-related security mechanisms with Ethereum-compatible smart contracts. The project has an interesting concept, but I want to see stronger market demand before calling this a confirmed recovery. Fundamental Analysis One thing that makes Core interesting is its Satoshi Plus consensus mechanism, which combines Bitcoin mining participation with delegated proof-of-stake. The network supports smart contracts and decentralized applications, giving developers opportunities to build within its ecosystem. However, a strong project concept does not automatically translate into a rising token price. Adoption, network activity, competition, token supply, and overall crypto market sentiment will all matter. CORE has also experienced a substantial long-term decline, so I believe investors should pay attention to whether the ecosystem can generate sustainable demand. Technical Analysis According to the latest market data I found, CORE was trading around $0.0172–$0.0174 on October 28, 2026. Its seven-day performance remained negative, suggesting that buyers still need to prove their strength. Key Levels I’m Watching - Immediate resistance: $0.0175 - Near-term support: $0.0166 - Major reference level: $0.0164 Bullish Scenario: If CORE breaks above $0.0175 and holds the level with increasing volume, I’ll watch for further recovery. I would look for fresh resistance levels to be established before setting higher targets. Bearish Scenario: If CORE loses the $0.0166 support area, sellers could regain control and the token may retest its recent low near $0.0164. These are short-term reference levels, not guaranteed targets. Confirmation through price action and trading volume remains important. My Market View I’m cautious but interested in how $CORE develops from here. The recent price stabilization is worth watching, but I don’t want to confuse a small bounce with a confirmed trend reversal. I’ll be looking for stronger buying pressure, improving market sentiment, and evidence of continued ecosystem activity. For me, the key question is whether CORE can build a sustainable base or whether sellers will push it toward another low. What’s your view on $CORE? Do you think buyers can reclaim resistance, or should we remain cautious? Share your analysis in the comments. $COREUSDT #IMPACTbyTrade




$IOST: Can Bulls Take Back Control?
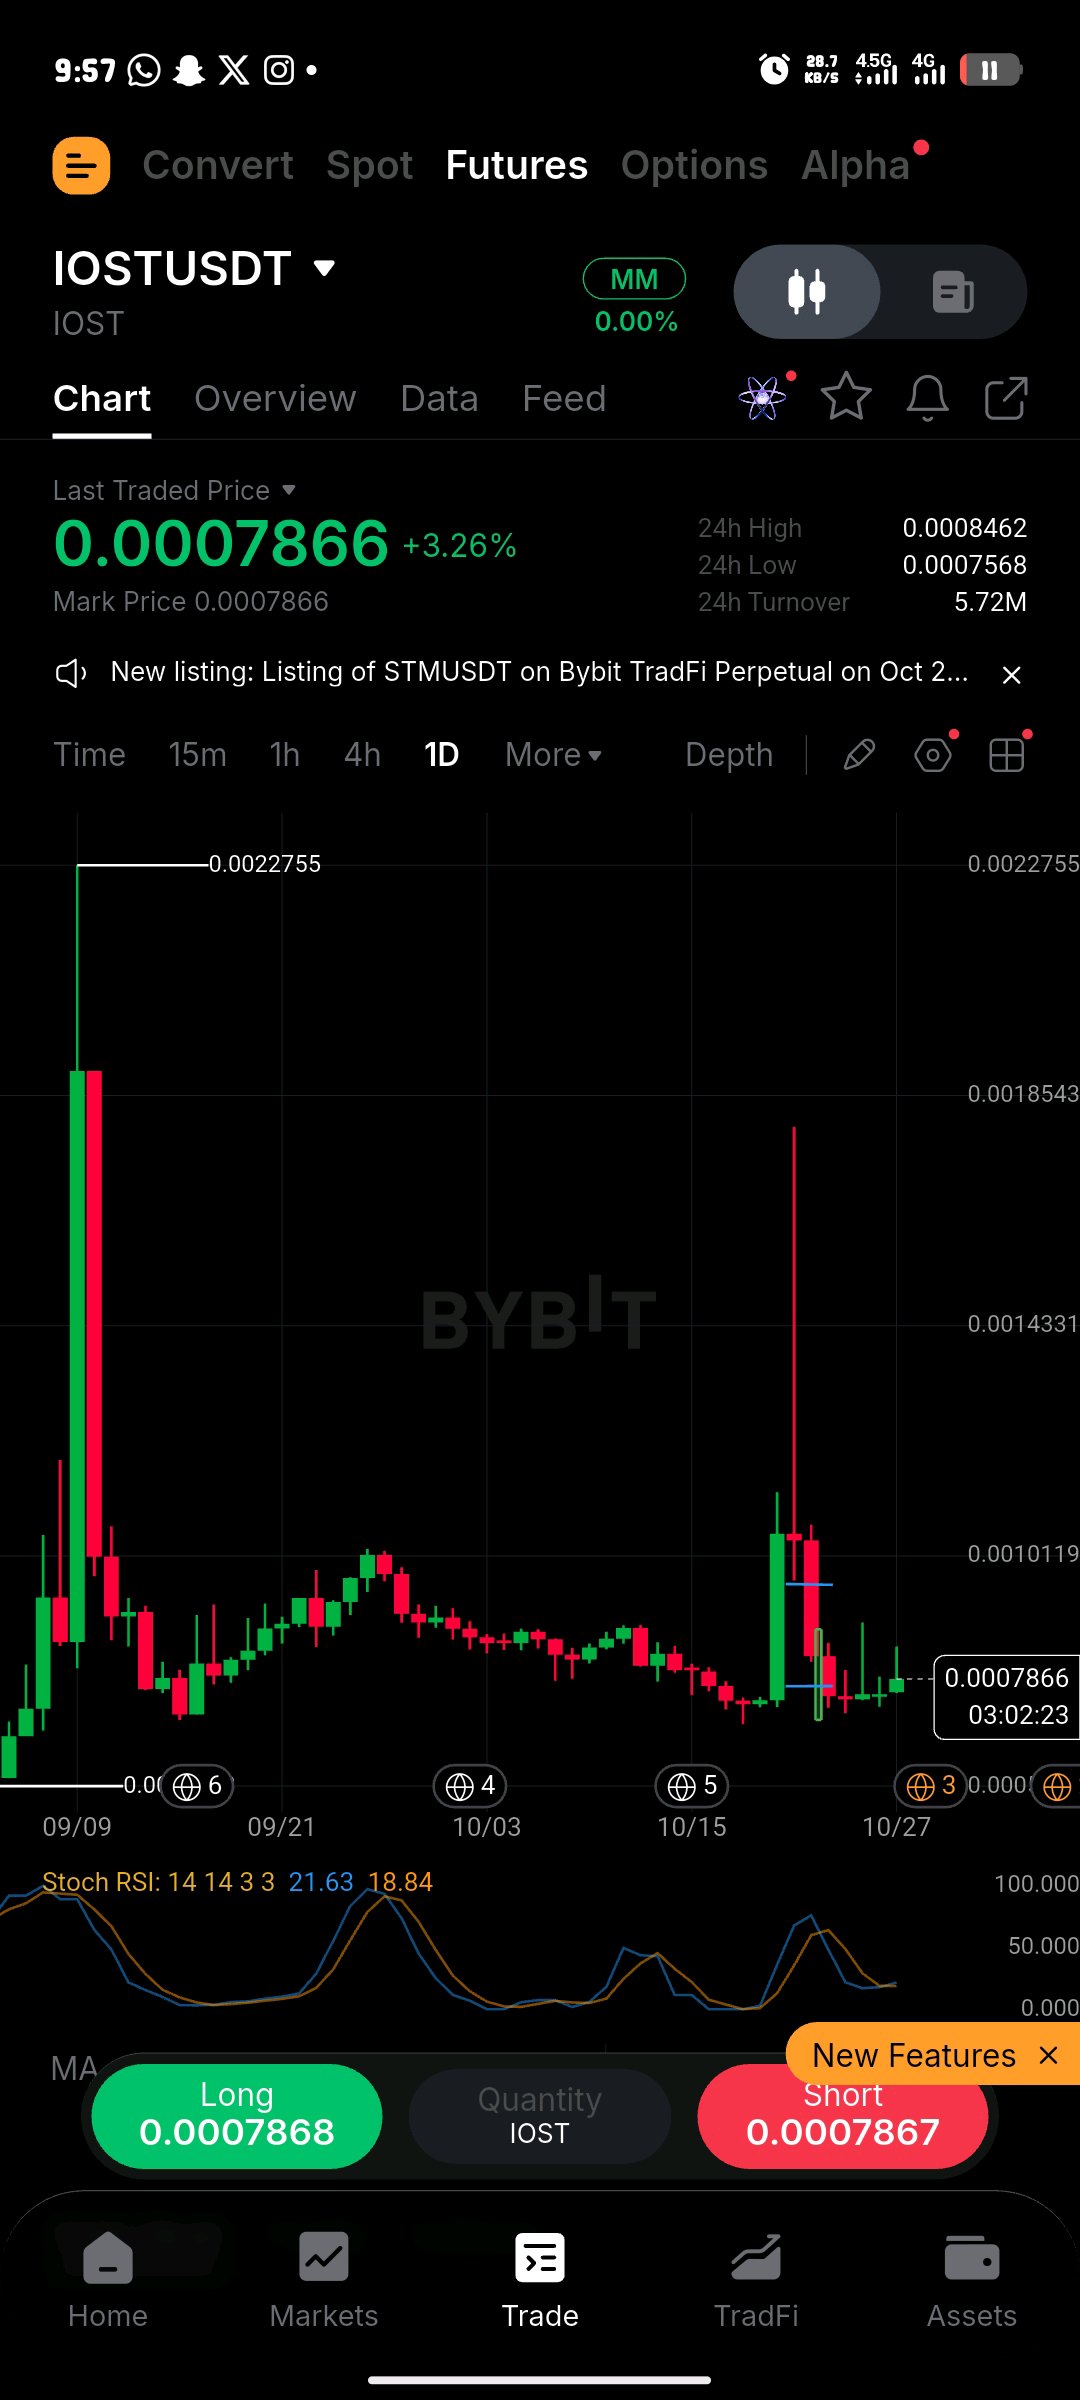
I’ve been looking at $IOST, and one thing that stands out to me is the difference between its recent price movement and the strength of its overall market structure. IOST is a Layer 1 blockchain project focused on blockchain infrastructure and real-world asset tokenization. Its recent software update, go-iost v4.0.0, has also brought fresh attention to the project. However, I want to see sustained market demand before treating this as the beginning of a strong recovery. Fundamental Analysis The tokenization of real-world assets could create opportunities for blockchain projects, but the long-term outlook depends on actual adoption, network activity, developer participation, and competition. A software upgrade is worth watching, but it does not automatically mean the token price will continue rising. I’ll be paying attention to whether the project can turn development progress into lasting demand. Technical Analysis IOST was trading around $0.00078–$0.00080 in the latest market data I found for October 27. The short-term technical picture remains cautious, with the broader trend still showing bearish pressure despite some recent buying. Key Levels I’m Watching - Resistance: $0.000802 - Next resistance: $0.000847 - Key support: $0.000716 - Lower support: $0.000599 Bullish Scenario: If IOST breaks above $0.000802 and holds that level with stronger trading volume, I’ll watch for a possible move toward $0.000847 and then $0.000934. Bearish Scenario: If the price fails to reclaim resistance and drops below $0.000716, selling pressure could increase, bringing $0.000599 into focus. My Market View I’m staying cautious on $IOST for now. I want to see buyers defend support and push the price above resistance before considering the recovery more convincing. A short-term price increase alone is not enough to confirm a trend reversal, especially when volatility is high. I’ll be watching trading volume, Bitcoin’s direction, and whether IOST can establish a higher low. These signals may help show whether buyers are gaining strength or the latest move is only temporary. What’s your view on $IOST? Do you think it can reclaim resistance, or will sellers push it toward lower support? Share your analysis in the comments. #IMPACTbyTrade $BTCUSDT $TRXUSDT
$GRAM: Can Buyers Stop the Downtrend?
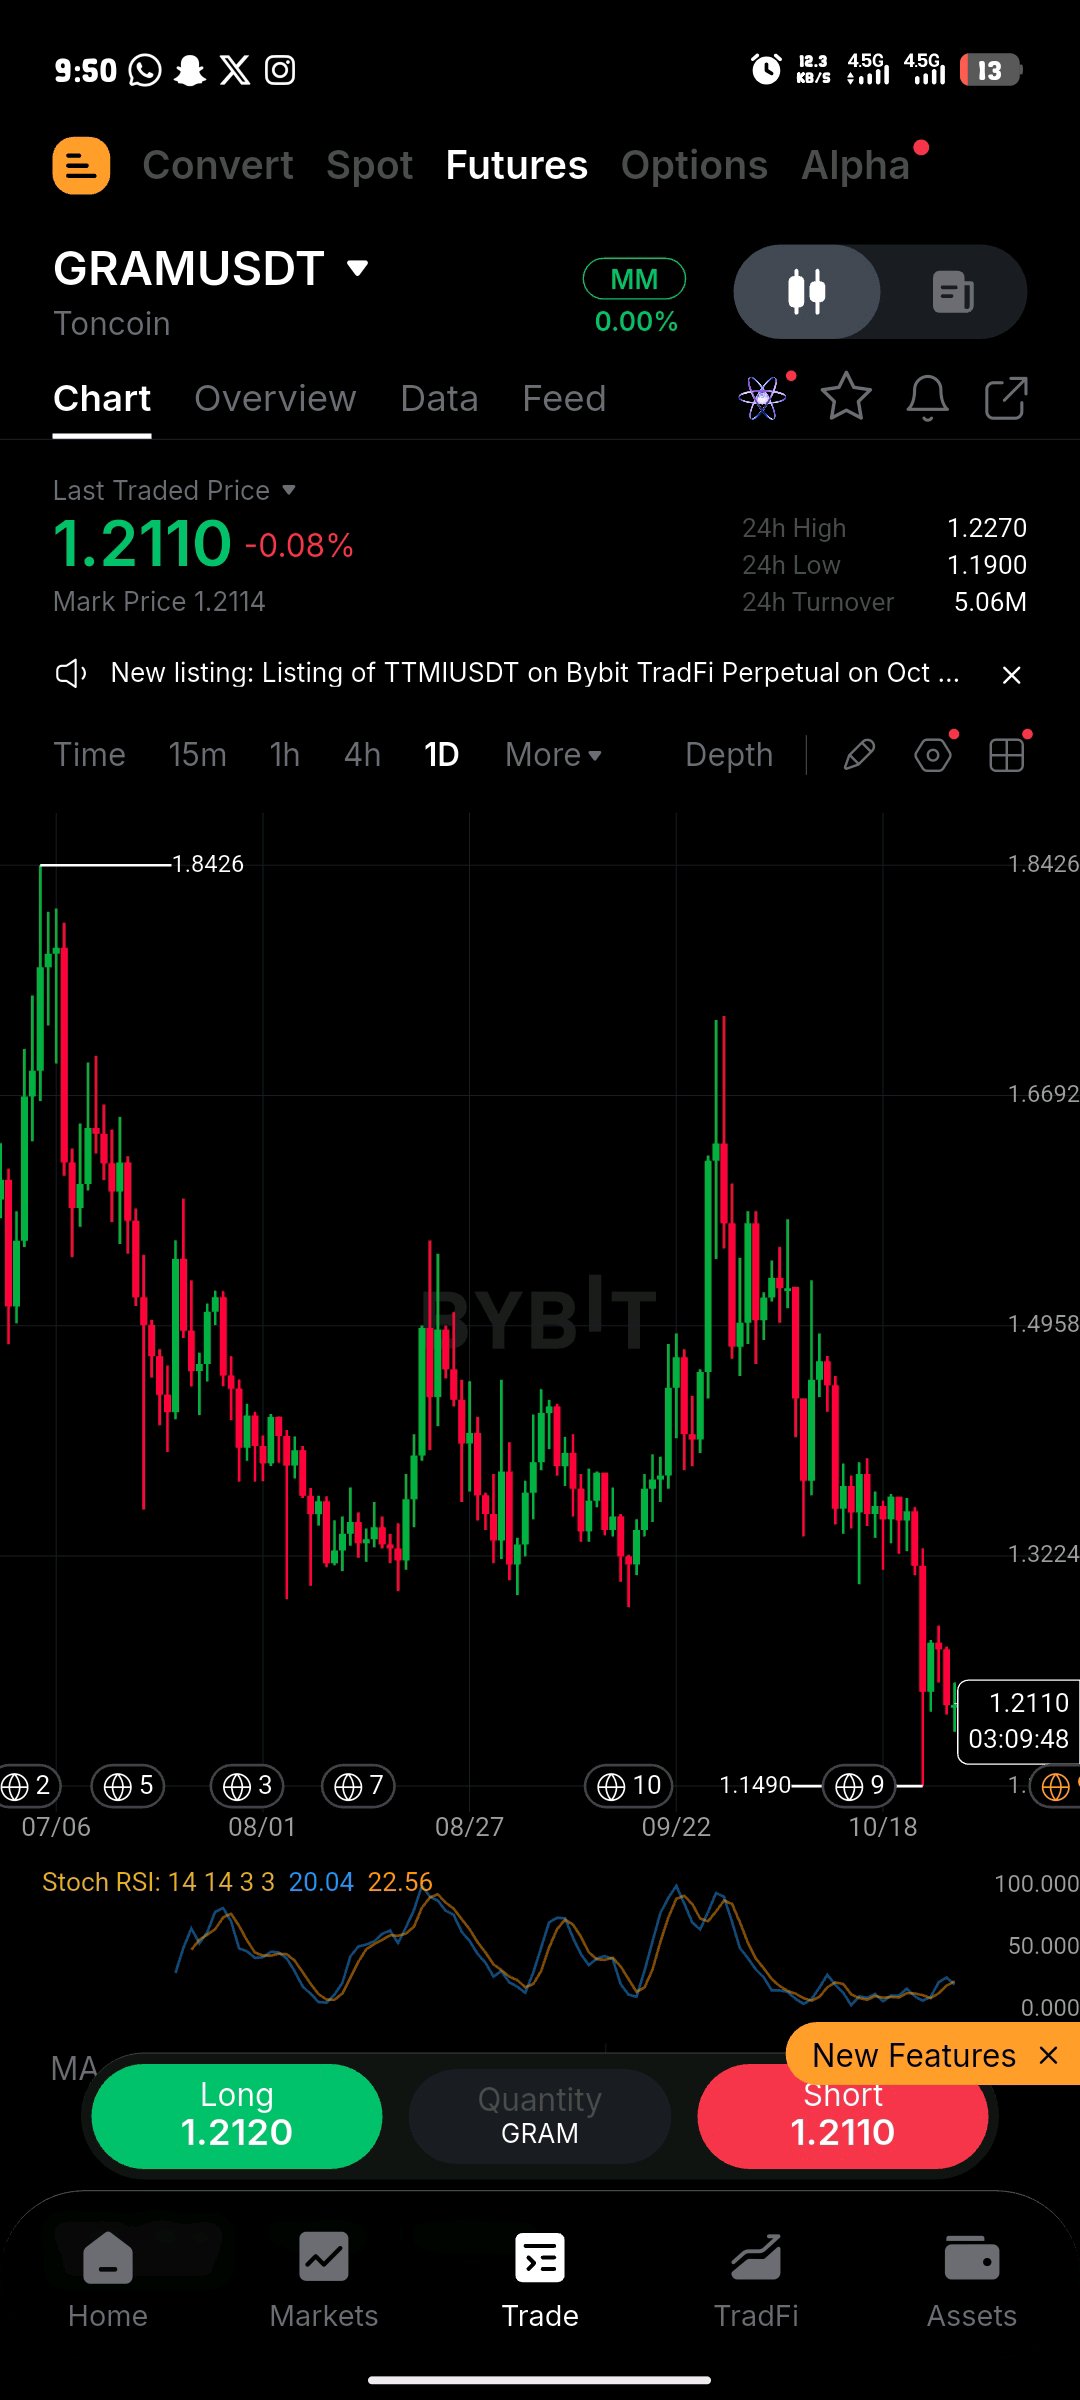
I’ve been looking at $GRAM, and honestly, the current price action tells me that patience is important. The token is trading around $1.21–$1.22, and sellers are still putting pressure on the market. What interests me is whether this decline will attract buyers or whether the price will continue searching for stronger support. Fundamental Analysis GRAM, formerly known as Toncoin (TON), is the native token of The Open Network, a Layer-1 blockchain closely connected to Telegram's ecosystem. One of the biggest opportunities I see is Telegram's ability to bring blockchain services to a large existing user base. Integrated wallets, digital payments, decentralized applications, and staking infrastructure could support long-term ecosystem growth. Recent developments also show why adoption matters. Telegram expanded access to its integrated Money wallet earlier in October, while institutional staking access through Coinbase Prime has created another avenue for eligible institutions to participate in the ecosystem. However, there is an important distinction: ecosystem growth does not automatically translate into token price appreciation. I want to see sustained network activity, stronger demand, and improving market sentiment before becoming confident in a recovery. Another concern is the recent selling pressure. GRAM has declined more than 10% over seven days, according to CoinMarketCap's October 27 market analysis. This suggests that buyers have not yet demonstrated enough strength to reverse the broader trend. Technical Analysis GRAM is trading near $1.21–$1.22, and the short-term structure remains bearish. The important question now is whether buyers can defend the $1.20 support area. Key levels I'm watching: Support 1: $1.20 Support 2: $1.15 Resistance 1: $1.25 Resistance 2: $1.28 Bullish scenario: If GRAM holds above $1.20 and buyers reclaim $1.25, I’ll watch for a possible move toward $1.28. A breakout supported by stronger trading volume would provide better evidence that momentum is improving. Bearish scenario: If the $1.20 support breaks decisively, the next area I’m watching is $1.15. A failure to recover $1.20 after the breakdown would strengthen the bearish outlook. These are reference levels from recent market analysis, not guaranteed targets. My Personal Market View Personally, I think GRAM has an interesting long-term story because of its connection to Telegram and the potential expansion of blockchain-based services. But I’m not going to ignore what the chart is telling me. Fundamentals can create opportunities over time, while technical analysis helps me understand whether buyers are actually returning. For now, I want to see GRAM defend $1.20 and reclaim $1.25 before considering a stronger recovery scenario. If support fails, I’ll remain cautious rather than assume the bottom is in. The upcoming Federal Reserve decision is another factor worth watching because changes in interest-rate expectations can influence sentiment across the crypto market. Let's discuss: Do you think $GRAM can recover toward $1.28, or will sellers push it toward $1.15 first? Share your reasoning in the comments. I want to hear what the community is seeing on the chart. $GRAMUSDT #IMPACTbyTrade

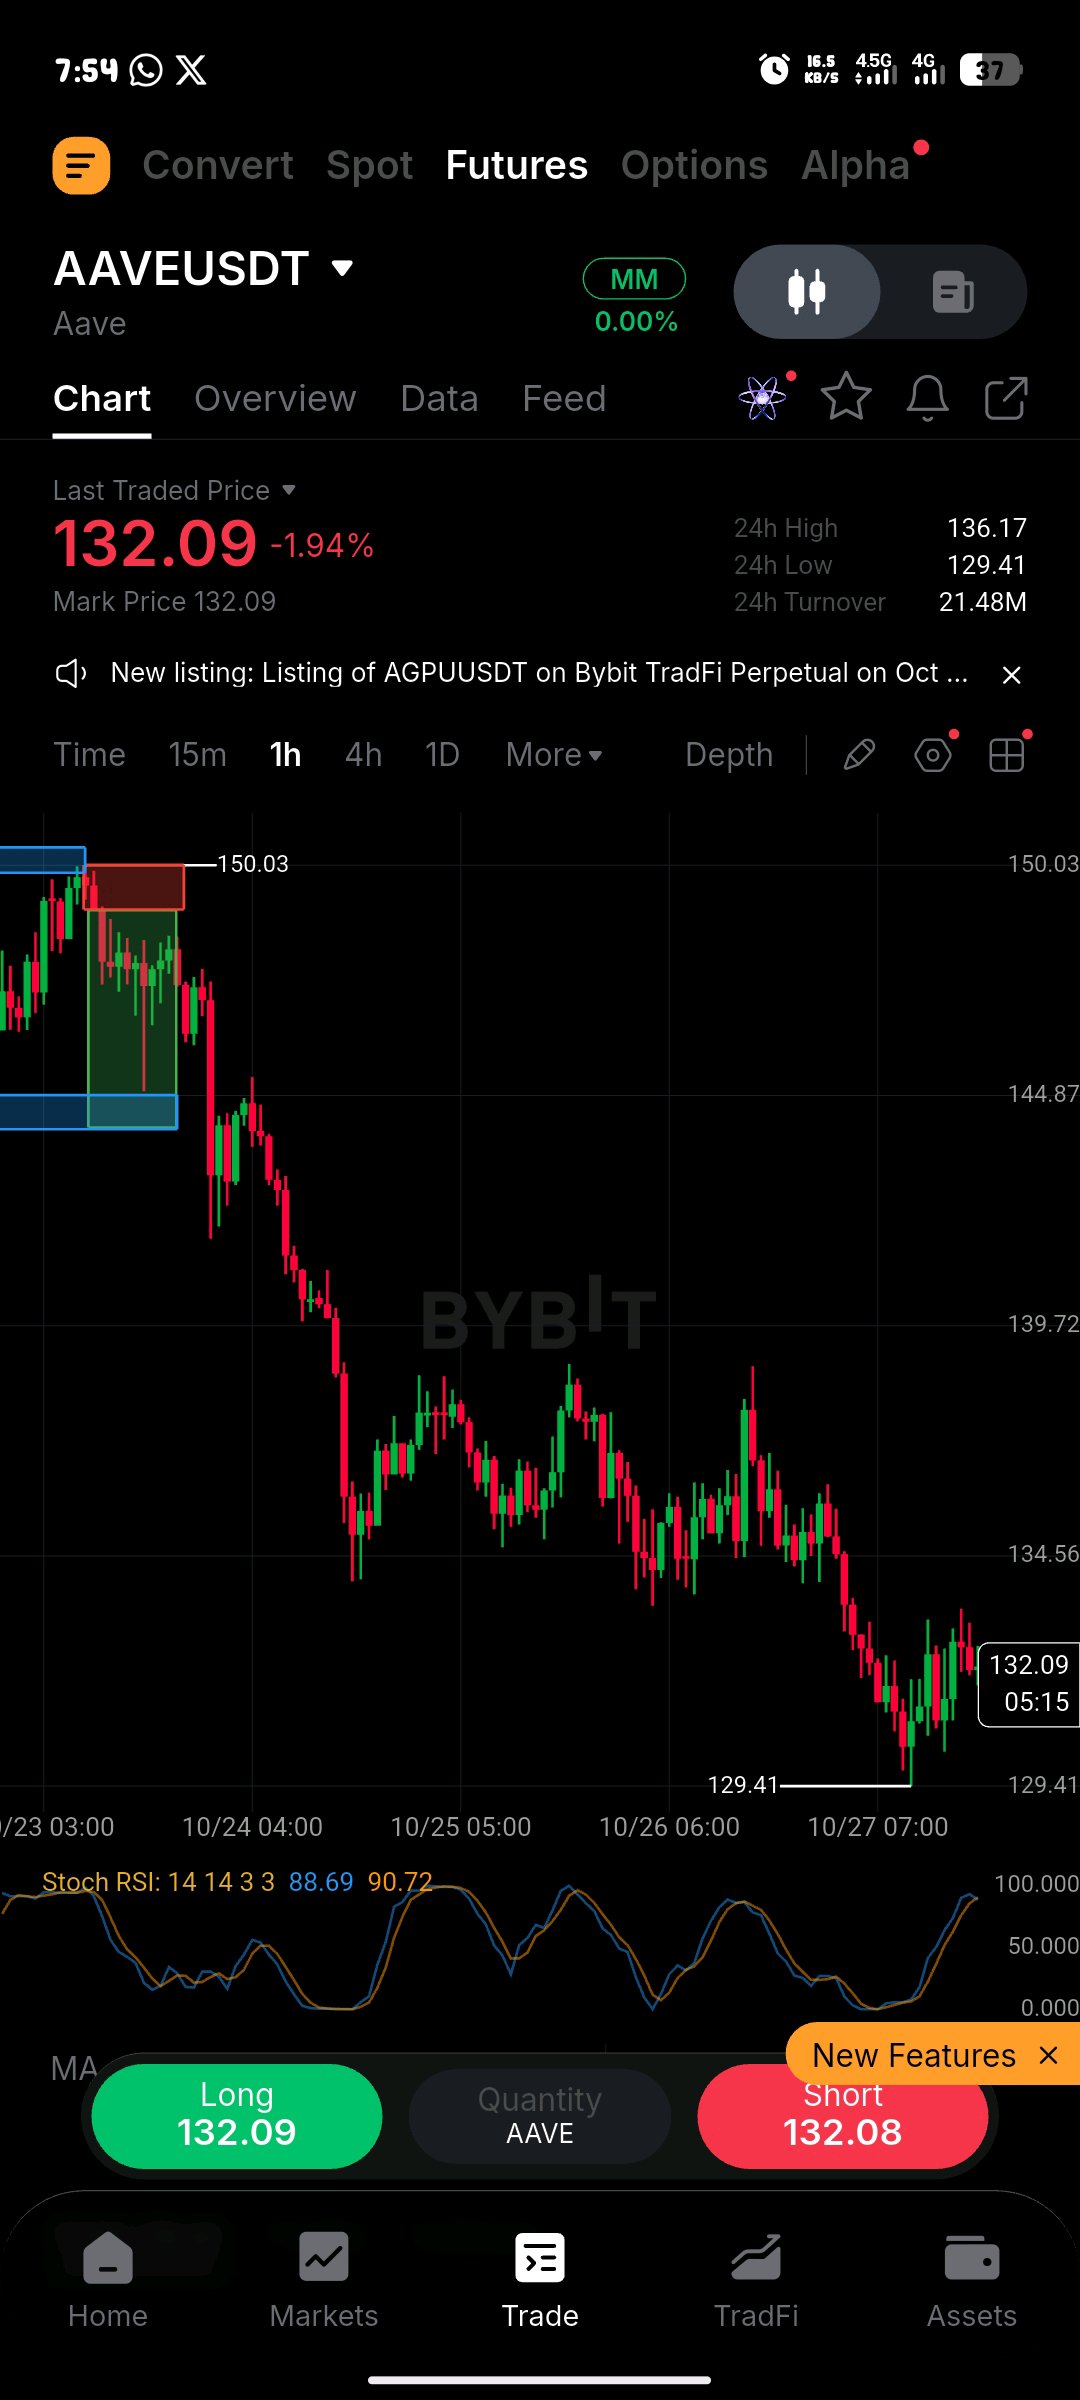
$AAVE: DeFi Strength Meets Market Pressure
I’ve been looking closely at $AAVEUSDT , and one thing stands out to me: there is a difference between a protocol performing well and its token gaining value. That’s exactly what I want to examine here. Aave remains one of the major players in decentralized finance, but recent developments show why we need to look beyond the headlines and understand what is happening beneath the surface. FUNDAMENTAL ANALYSIS Aave is a decentralized lending protocol that allows users to supply digital assets to earn interest and borrow against their collateral. Its business model is built around lending demand, liquidity, risk management, and the growth of on-chain finance. According to Aave's official dashboard, the protocol reported approximately $31.2 billion in deposits, $12.3 billion in outstanding loans, and $83.8 million in revenue year to date in 2026. These figures demonstrate the scale of its lending activity, although they can change as market conditions evolve. Another development I'm watching is Aave V4. Its new architecture is designed to support more flexible lending markets, including potential institutional and tokenized-asset use cases. Aave's expansion into tokenized securities and real-world assets could create new opportunities for on-chain lending if adoption continues. However, there is a risk worth discussing. Recent reports indicate that Aave's total value locked declined from approximately $19.1 billion at the end of September to $17.6 billion on October 26. That contraction deserves attention because liquidity and borrowing demand are important indicators of protocol activity. My interpretation is that Aave has a meaningful fundamental foundation, but I want to see sustained growth in deposits, borrowing activity, and revenue before assuming that its token must recover. TECHNICAL ANALYSIS For my technical analysis, I would focus on three things: market structure, trading volume, and whether $AAVE is outperforming or underperforming the broader crypto market. Bullish scenario: If AAVE establishes higher lows, breaks above its latest significant resistance, and holds the breakout on stronger volume, that would suggest buyers are regaining control. I would then watch for a retest of the breakout level before considering the recovery confirmed. Bearish scenario: If AAVE continues making lower highs and breaks its latest significant support, selling pressure could persist. A failed breakout followed by another lower low would strengthen the bearish interpretation. The confirmation I want: I don't want to label every bounce a reversal. I want to see buyers defend support, trading volume improve, and the price reclaim an important resistance level. I'm deliberately not inventing exact entry prices or targets without a verified live chart. The most recent swing high, swing low, and current price should determine those levels. MY PERSONAL MARKET VIEW What interests me about AAVE is the combination of an established lending protocol, continued product development, and the potential growth of institutional DeFi. At the same time, declining liquidity and competition across lending platforms are risks I cannot ignore. My main question is whether improving protocol fundamentals will translate into stronger demand for the AAVE token. For me, the next step is to watch whether market structure confirms the fundamental story. If both begin moving in the same direction, the recovery case becomes more convincing. If they diverge, patience is necessary. LET'S DISCUSS Do you think $AAVE is being undervalued despite its position in DeFi, or does the recent decline in liquidity suggest that caution is still justified? Share your reasoning in the comments. I want to hear different perspectives from the community. #IMPACTbyTrade

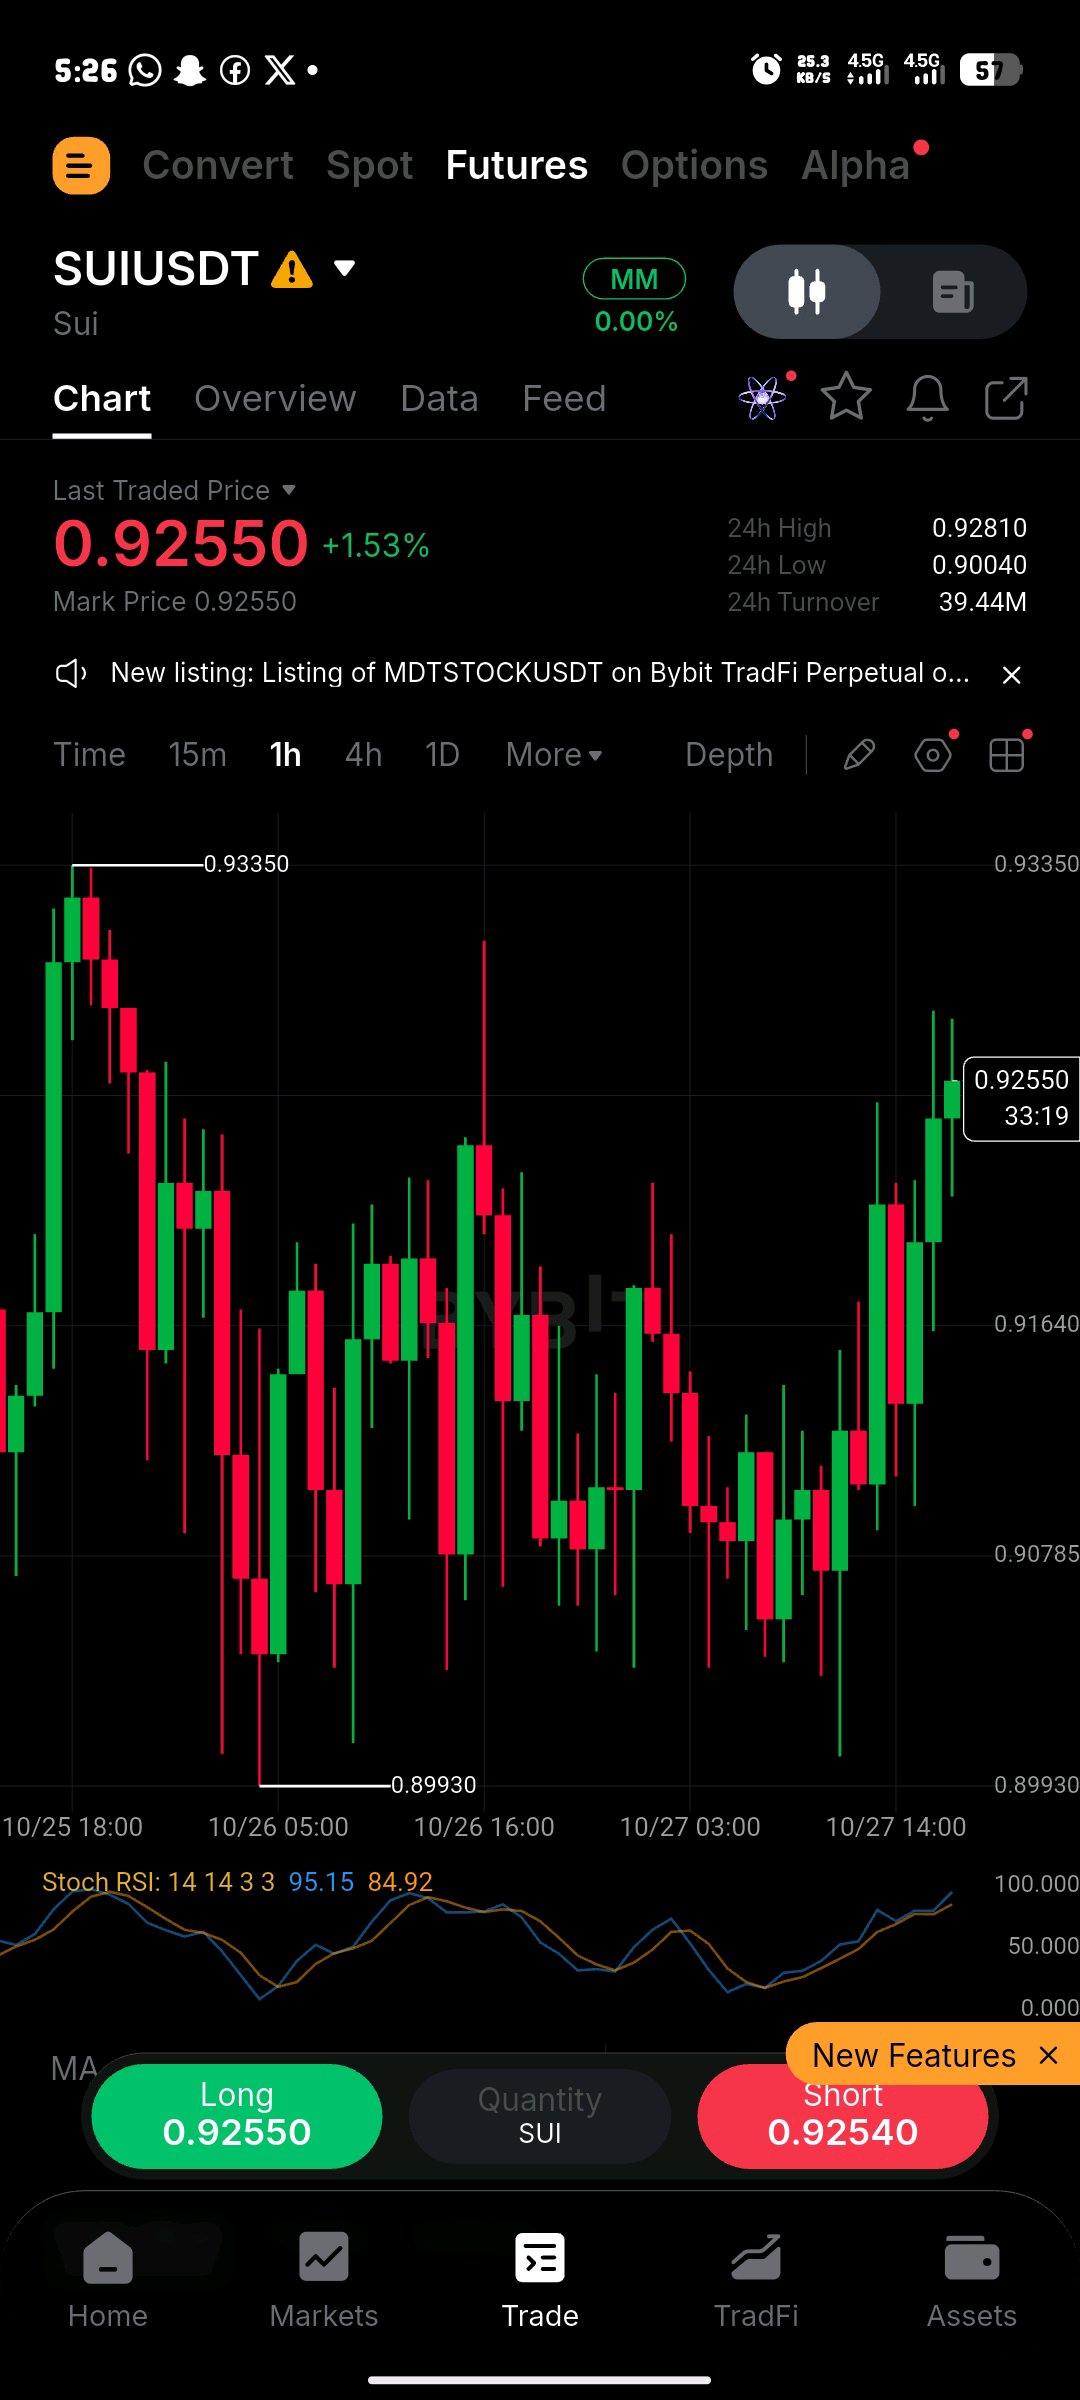
I’ve been looking closely at $SUIUSDT , and what I’m seeing right now tells me that this market needs patience. SUI is trading around $0.91, and sellers are still putting pressure on the price. I’m watching the support zone closely because the next move could determine whether we see a recovery or another leg down. Fundamental Analysis Sui is a Layer-1 blockchain designed for fast transactions, scalability, and low transaction costs. Its ecosystem supports decentralized finance, digital assets, and smart-contract applications. There are also important developments to watch. The Sui ecosystem has reported progress in stablecoin payments, institutional finance, and infrastructure. Samsung Wallet's planned integration of USDC on Sui and new partnerships involving blockchain-based financial services could support adoption over time. However, ecosystem growth does not guarantee an immediate increase in the token's price. The wider crypto market is another important factor. Investors are watching the Federal Reserve's October 27–28 policy meeting, and uncertainty around interest rates could keep pressure on risk-sensitive assets such as SUI. Recent market analysis identifies broader market weakness as a factor behind SUI's decline. Technical Analysis SUI is trading near $0.91, with the short-term trend showing weakness. Its daily RSI is around 37, suggesting weak momentum, while the four-hour technical outlook remains bearish. The market is approaching an important support zone. Key Levels I'm Watching Support 1: $0.90 Support 2: $0.88 Major support: $0.84 Resistance 1: $0.936 Resistance 2: $0.978 Major resistance: $1.02 Bullish Scenario If SUI holds above $0.90 and buyers push the price through $0.936, I’ll be watching for a possible move toward $0.978 and $1.02. A convincing breakout with stronger volume would improve the recovery outlook. Bearish Scenario If the $0.90 support zone breaks decisively, SUI could move toward $0.88, with $0.84 as another important downside area. I want to see buyers defend support before assuming the downtrend is over. My Final Market View Right now, I’m cautious about $SUI because the short-term momentum remains weak. Fundamentally, the ecosystem has promising developments, but technically, the price still needs confirmation from buyers. For me, the key levels are $0.90 on the downside and $0.936 on the upside. The reaction around these levels could help reveal the market's next direction. What do you think about $SUI? Are we preparing for a recovery toward $1.00, or could sellers push the price lower? Drop your thoughts in the comments. I want to hear your analysis. #IMPACTbyTrade

$ETH vs $BTC: Which One Looks 💪
I’ve been comparing Ethereum and Bitcoin, and right now, I’m paying close attention to their price structure, institutional demand, and the macroeconomic factors influencing the entire crypto market. Both assets are facing pressure, but I believe Bitcoin is showing stronger relative resilience than Ethereum at the moment. Fundamental Analysis Bitcoin is currently trading below the $80,000 psychological level, while Ethereum is testing the $2,300 area. The market is watching the upcoming Federal Reserve decision, inflation expectations, institutional fund flows, and broader geopolitical risks. These factors could influence liquidity and investor appetite for risk assets. Bitcoin has demonstrated relative strength during recent market weakness. Recent institutional research also highlighted Bitcoin's resilience, while Ethereum investment products experienced significant outflows earlier in October. Although Ethereum funds subsequently recorded some inflows, sustained demand will be important for a stronger recovery. Ethereum still has its own fundamental strengths, including smart contracts, decentralized finance, and its role in tokenization. However, network adoption does not automatically translate into immediate price appreciation. I want to see improving demand alongside stronger price action before becoming more optimistic about ETH. Technical Analysis: $BTC Bitcoin is trading near $79,800, with short-term momentum showing weakness. The RSI is around 40, while the MACD remains negative, indicating that sellers still have an advantage in the near term. Key levels I’m watching: Support: $79,000–$79,600 Major support: $77,700–$76,400 Resistance: $80,700–$81,000 Upside targets after a confirmed breakout: $82,000–$84,000 If BTC reclaims $80,700–$81,000 and holds above it, I’ll be watching for a recovery toward the next resistance zones. However, a breakdown below the nearby support area could expose the lower support levels. Technical Analysis: $ETH Ethereum is trading around $2,312 and remains under short-term pressure. The price is testing the 200-day EMA near $2,316, while resistance around $2,360–$2,365 could determine whether buyers can regain control. Weak momentum means I’m not treating this support test as a confirmed reversal. Key levels I’m watching: Support: $2,300–$2,290 Major downside area: $2,250–$2,200 Resistance: $2,316–$2,365 Upside targets after a confirmed breakout: $2,400–$2,450 If ETH loses $2,290 decisively, further downside becomes possible. On the other hand, a sustained recovery above $2,365 would improve the short-term outlook and could open the way toward $2,400–$2,450. My Final Market View At the moment, I favor BTC in terms of relative strength, while ETH needs to prove that buyers are ready to defend its support and reclaim resistance. My bullish scenario requires confirmation from price action, not just hope. I’ll also be watching the Federal Reserve decision because unexpected policy signals could change the outlook for both assets. I want to know what my traders think: Are you more confident in $BTC, or do you believe $ETH will outperform Bitcoin in the next recovery? Drop your analysis in the comments. Let’s compare our market views. $BTCUSDT $ETHUSDT #IMPACTbyTrade

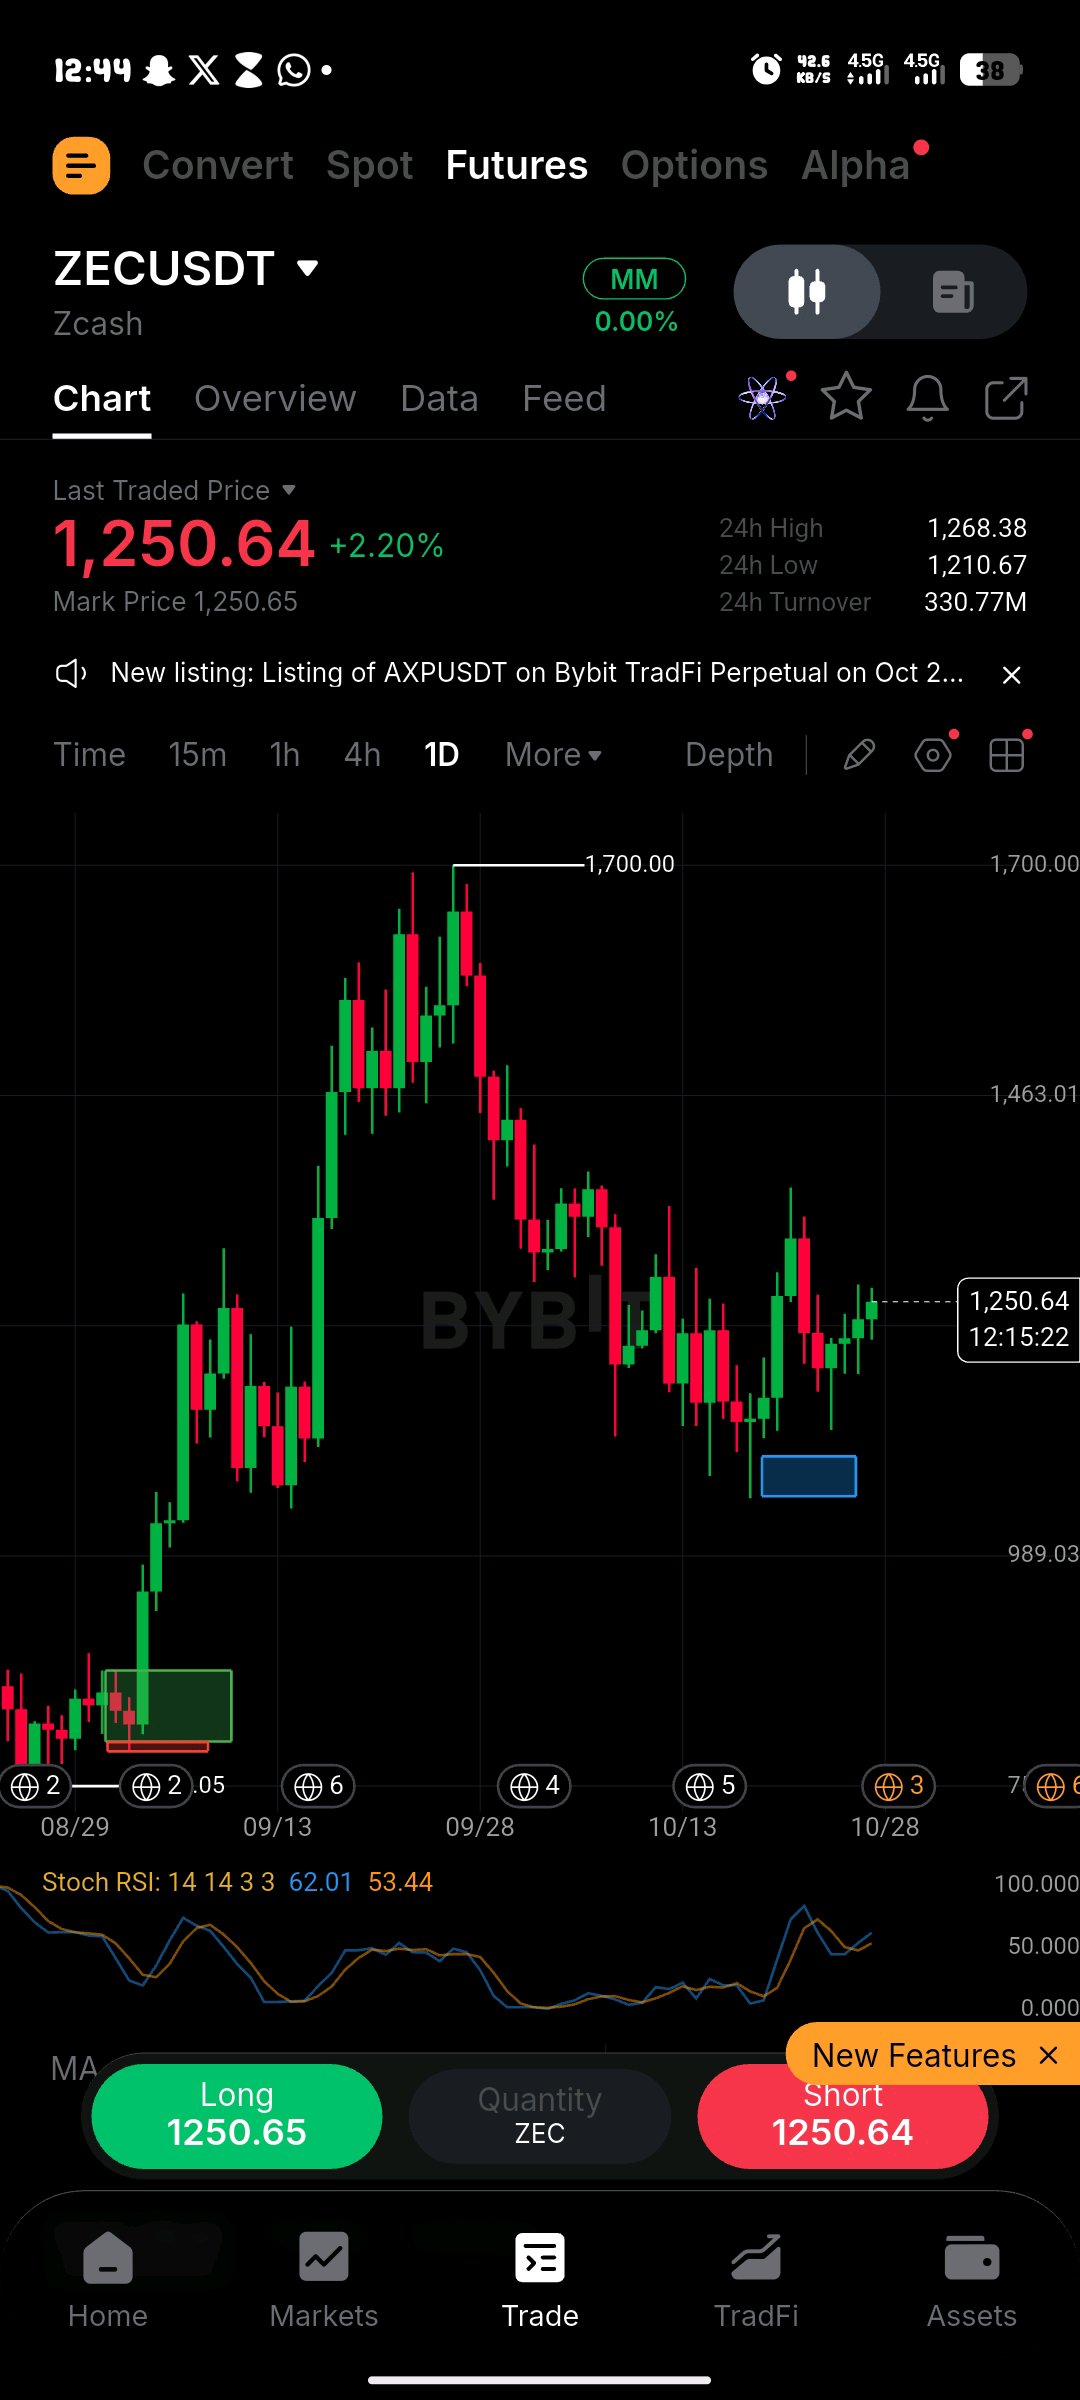
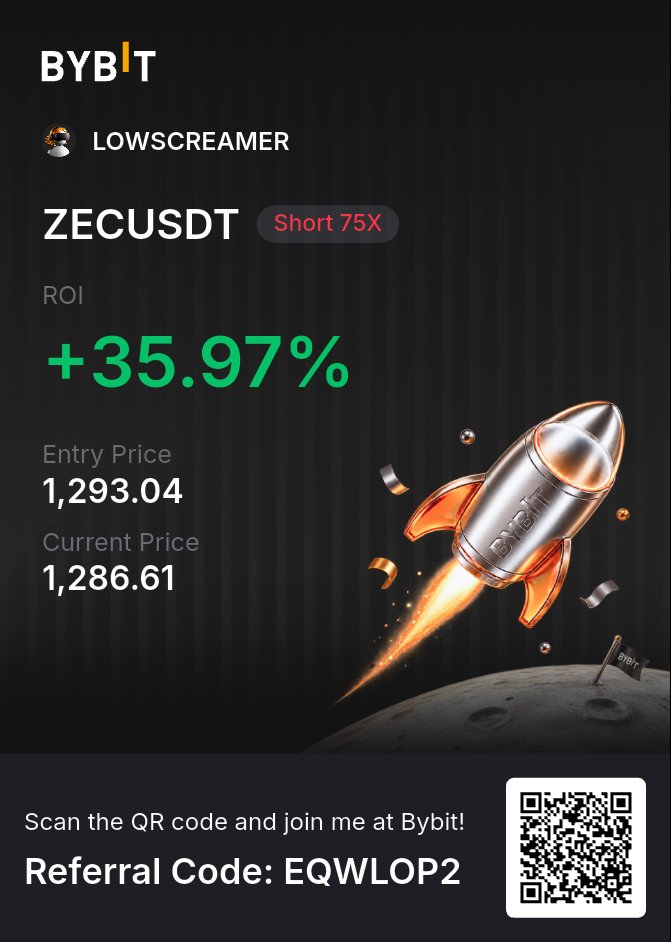
I’ve Analyzed Zcash, Here’s What I’m Watching
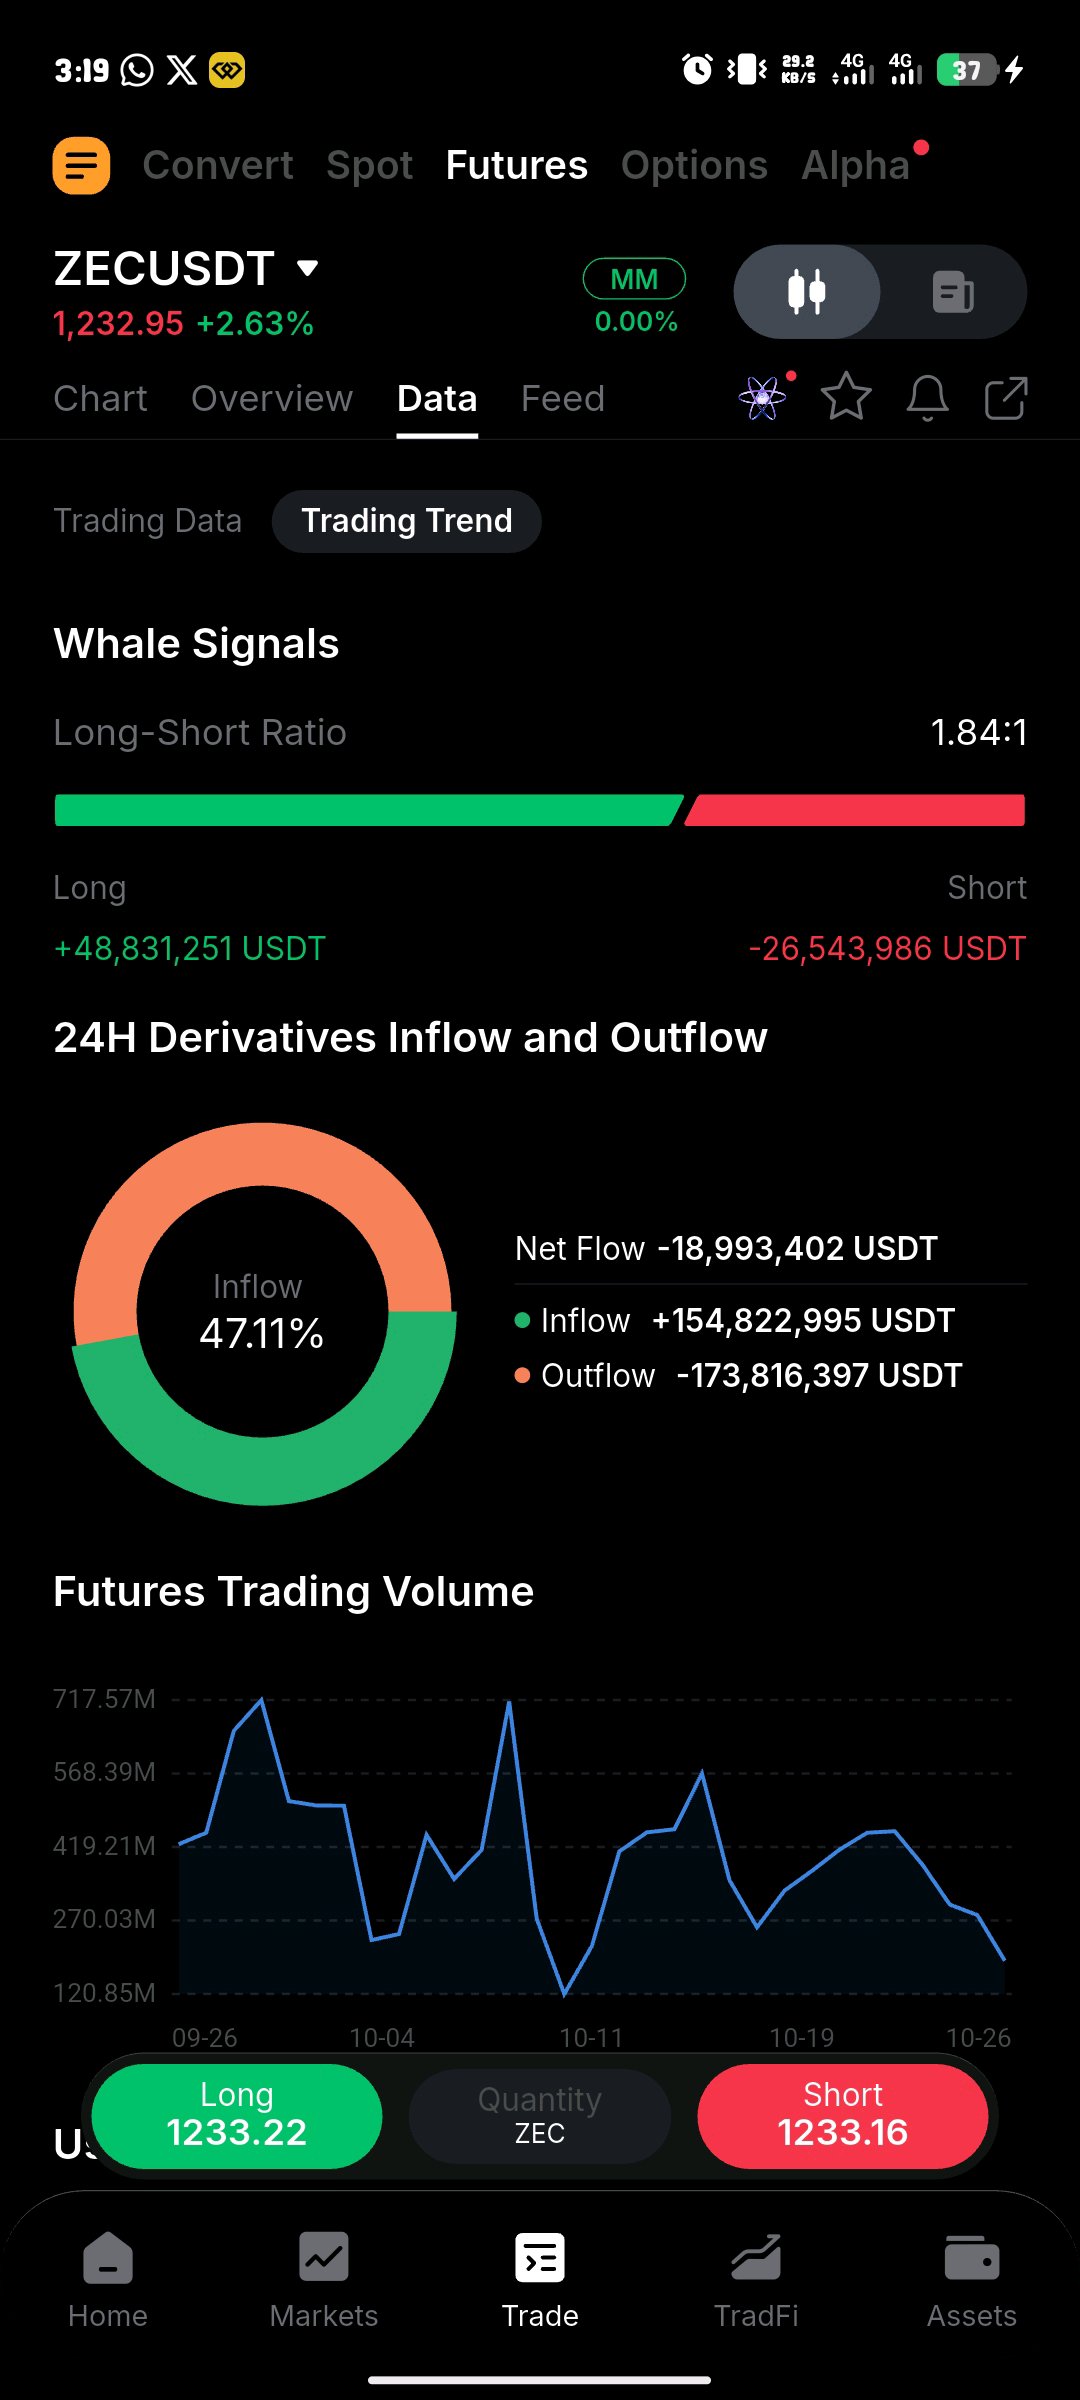
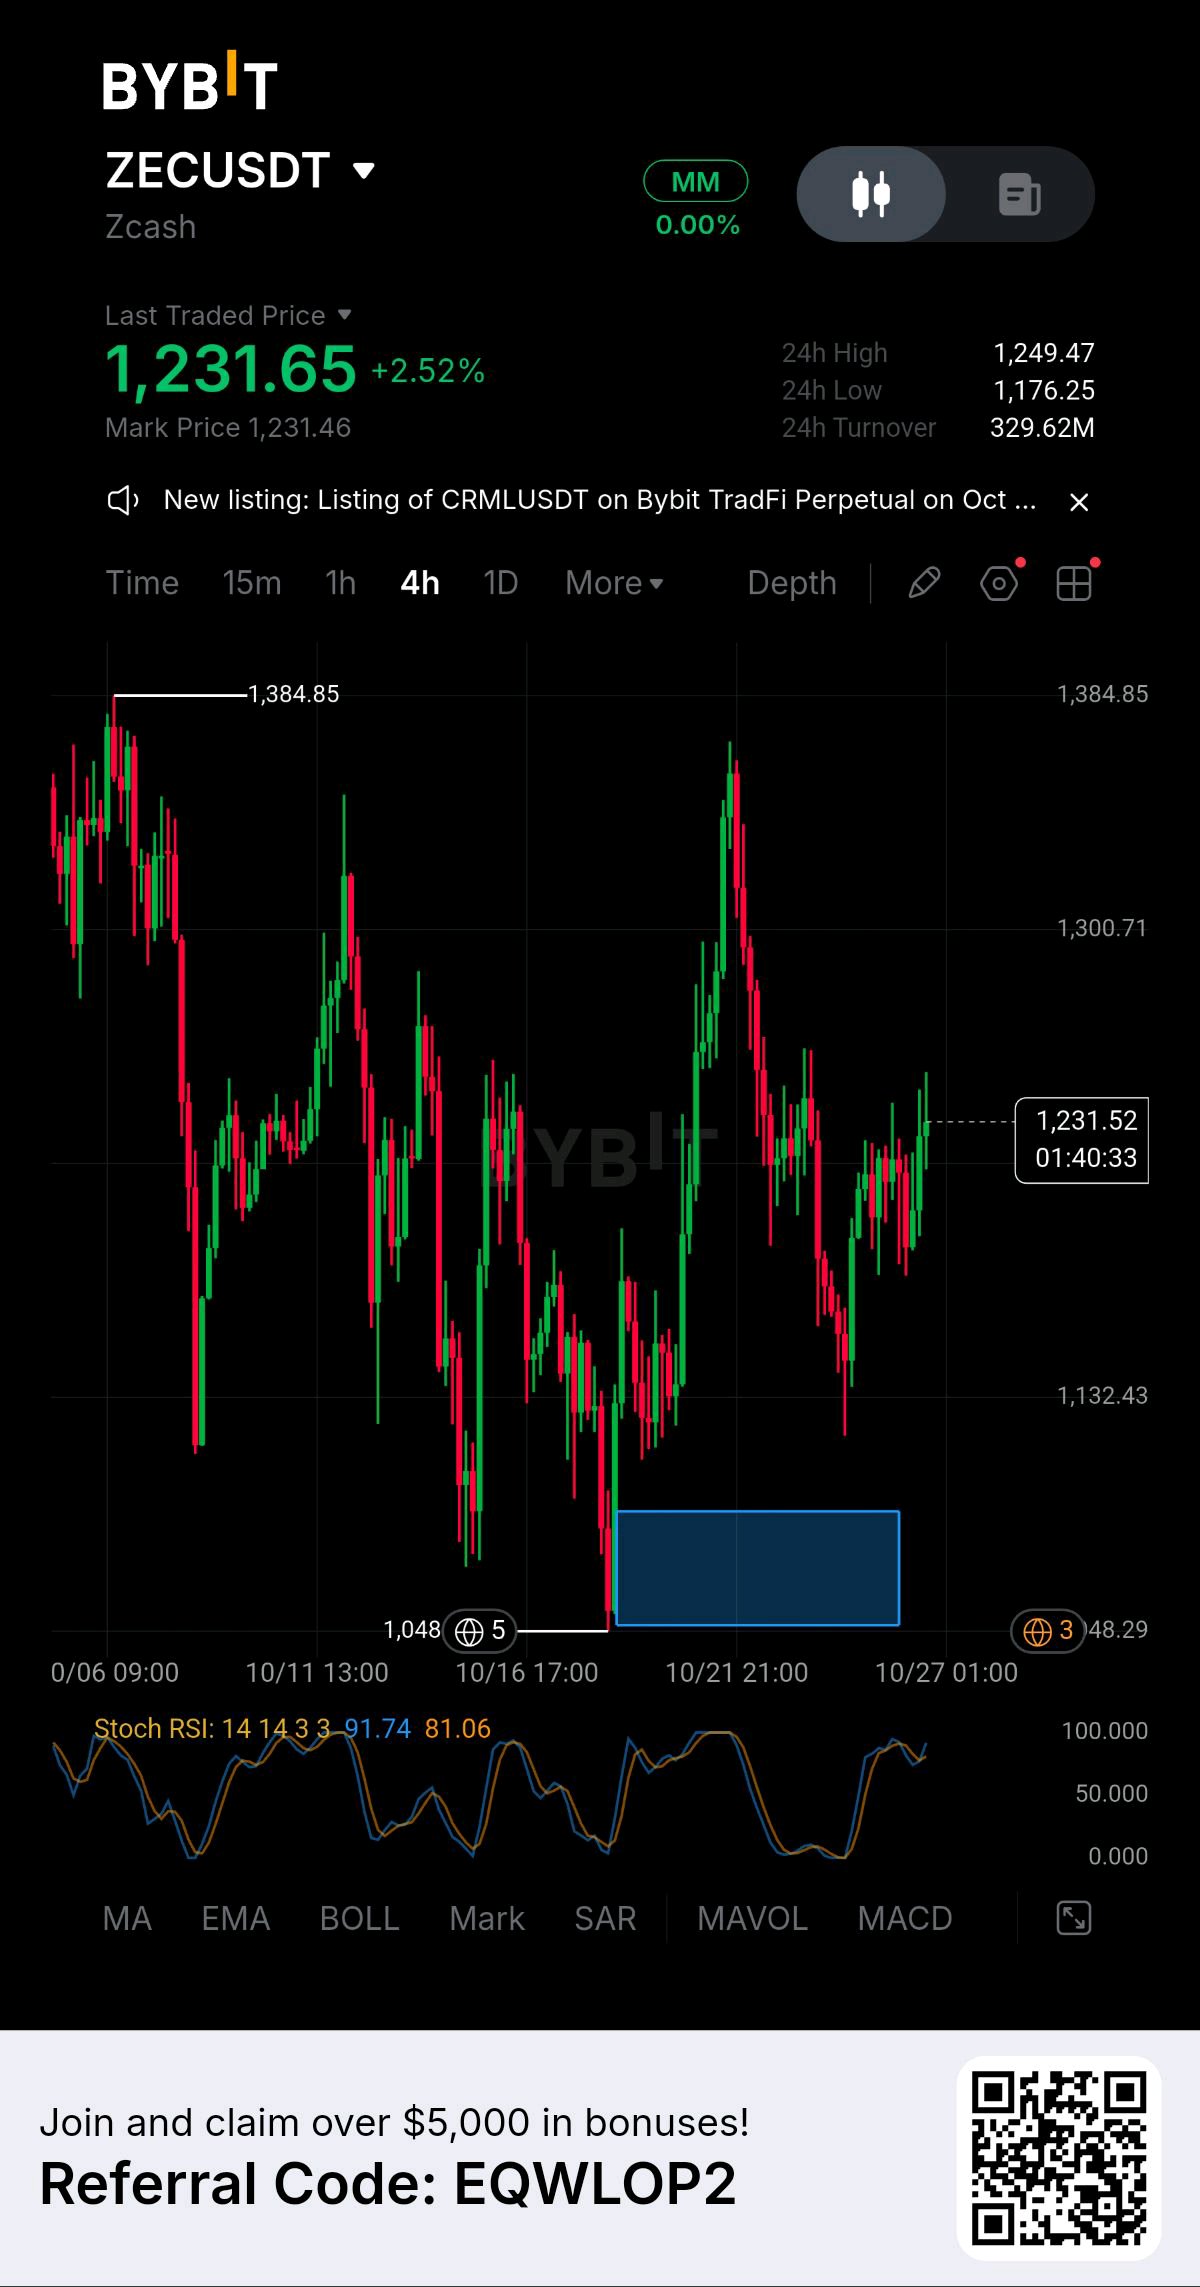
$ZEC | Traders, I’ve been analyzing ZEC, and the market is at an important decision point. After the recent pullback, I’m watching closely to see whether buyers can regain control or sellers will push the price lower. From my analysis, ZEC is trading around $1,220–$1,230. The bigger trend still shows strength, but the short-term momentum is mixed. I don't want to jump into a position without seeing how price reacts around the key levels. KEY LEVELS I’M WATCHING Immediate Resistance: $1,231 Resistance 2: $1,259 Resistance 3: $1,296 Major Resistance: $1,340–$1,385 Immediate Support: $1,207 Support 2: $1,187 Support 3: $1,117 Major Support: $1,000 BULLISH SCENARIO If ZEC reclaims the $1,231 resistance and holds above it, I’ll be watching for a possible move toward $1,259. Potential Targets: TP1: $1,259 TP2: $1,296 TP3: $1,340 If buyers break through the $1,340–$1,385 resistance zone, that would strengthen the bullish outlook. However, I want to see a confirmed breakout before considering this scenario. BEARISH SCENARIO On the other hand, if ZEC fails to reclaim $1,231 and loses the $1,207 support, I’ll be watching for a possible move toward $1,187. Potential Downside Targets: TP1: $1,187 TP2: $1,117 TP3: $1,000 A confirmed breakdown below support would weaken the recovery outlook, so I’ll be watching the reaction at each level. MY PERSONAL OUTLOOK Traders, I’m watching both scenarios because ZEC has shown significant volatility. The $1,231 resistance is the first level I want buyers to reclaim, while $1,207 is the support I want to see defended. I’m not going to assume the next move. I want price confirmation before drawing a stronger conclusion. What do you think, traders? Are we preparing for another bullish move on ZEC, or could sellers take control again? Drop your thoughts in the comments. Let’s discuss! #IMPACTbyTrade #MyByXTake $BTCUSDT $SOLUSDT
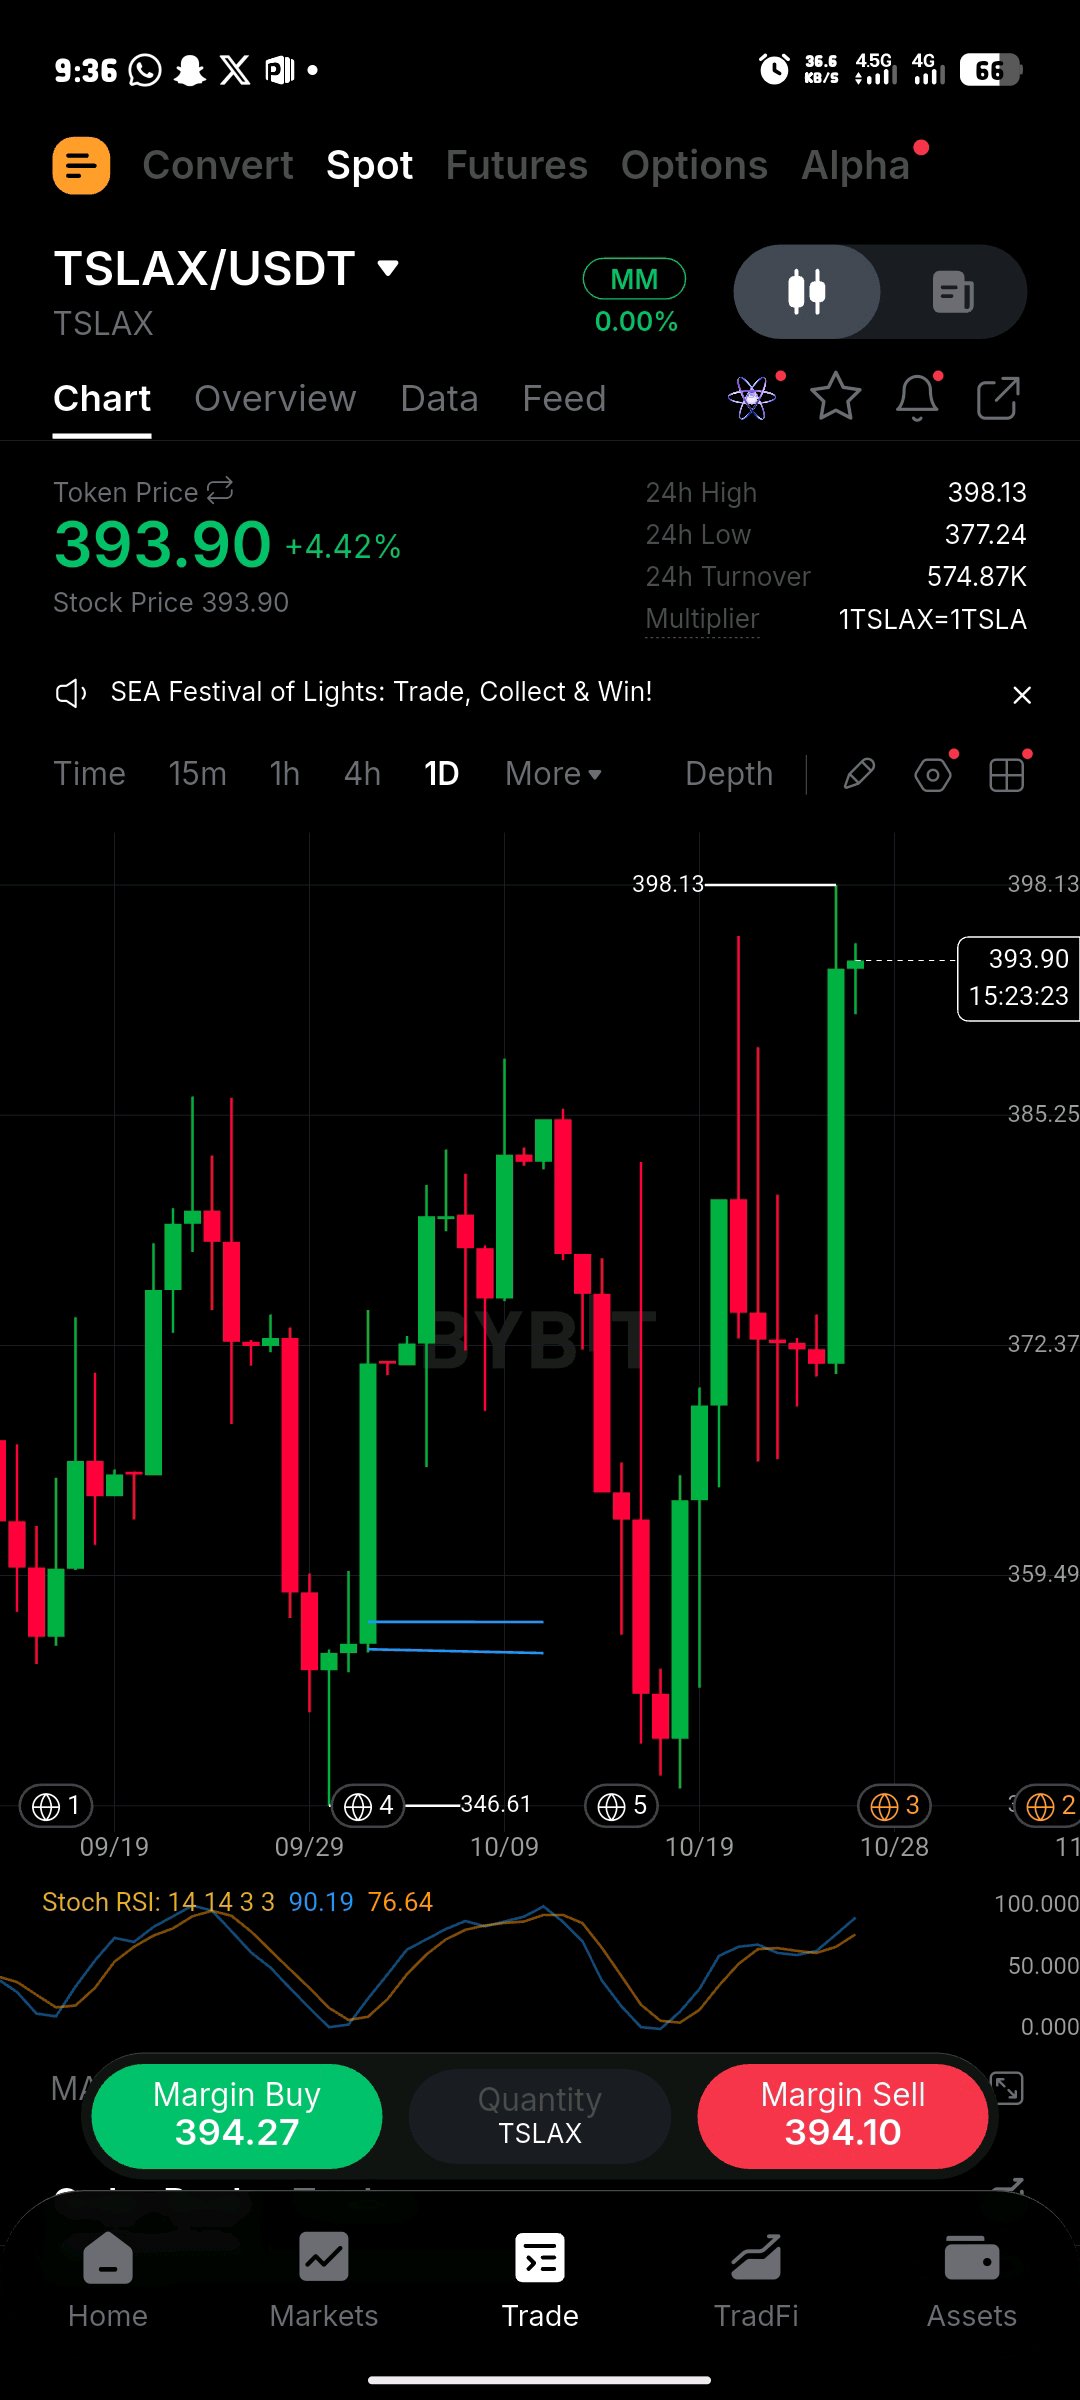
TSLA | Tesla Is Moving! Here’s What I’m Watching
$Traders, I’ve been analyzing Tesla, and the latest price action has caught my attention. TSLA closed at $391.62 on October 26, gaining 5.21% in one session. Buyers are showing strength, but price is now approaching an important resistance zone, so I’m watching carefully before drawing my next conclusion. KEY LEVELS I’M WATCHING Current Reference Price: $391.62 Resistance 1: $397.27 Resistance 2: $400.00 Resistance 3: $410.00 Support 1: $383.73 Support 2: $375.00 Support 3: $365.00 Major Support: $355.00 BULLISH SCENARIO From my analysis, if TSLA breaks above $397.27 and holds that level, I’ll be watching for a possible move toward $400 and then $410. Potential Targets: TP1: $397.27 TP2: $400.00 TP3: $410.00 I want to see a confirmed breakout with strong buying volume before considering this scenario. A rejection at resistance could lead to a temporary pullback. BEARISH SCENARIO On the other hand, if Tesla fails to break above $397.27 and selling pressure increases, I’ll be watching the $383.73 support zone. If that support breaks, the next levels I’m watching are $375 and $365, with $355 as a deeper support area. MY PERSONAL OUTLOOK Traders, I’m leaning cautiously bullish because buyers have recently pushed the price higher. However, I don’t want to chase the move after a strong green session. For me, the key question is whether buyers can push TSLA above $397.27 or whether sellers will defend that resistance and trigger a pullback. I’ll be watching price action, volume, and the reaction around these key levels before making any conclusions. What do you think, traders? Are we going to see TSLA break above $400, or will sellers push the price back toward support? Drop your thoughts in the comments. Let’s discuss! #IMPACTbyTrade $TSLAXUSDT
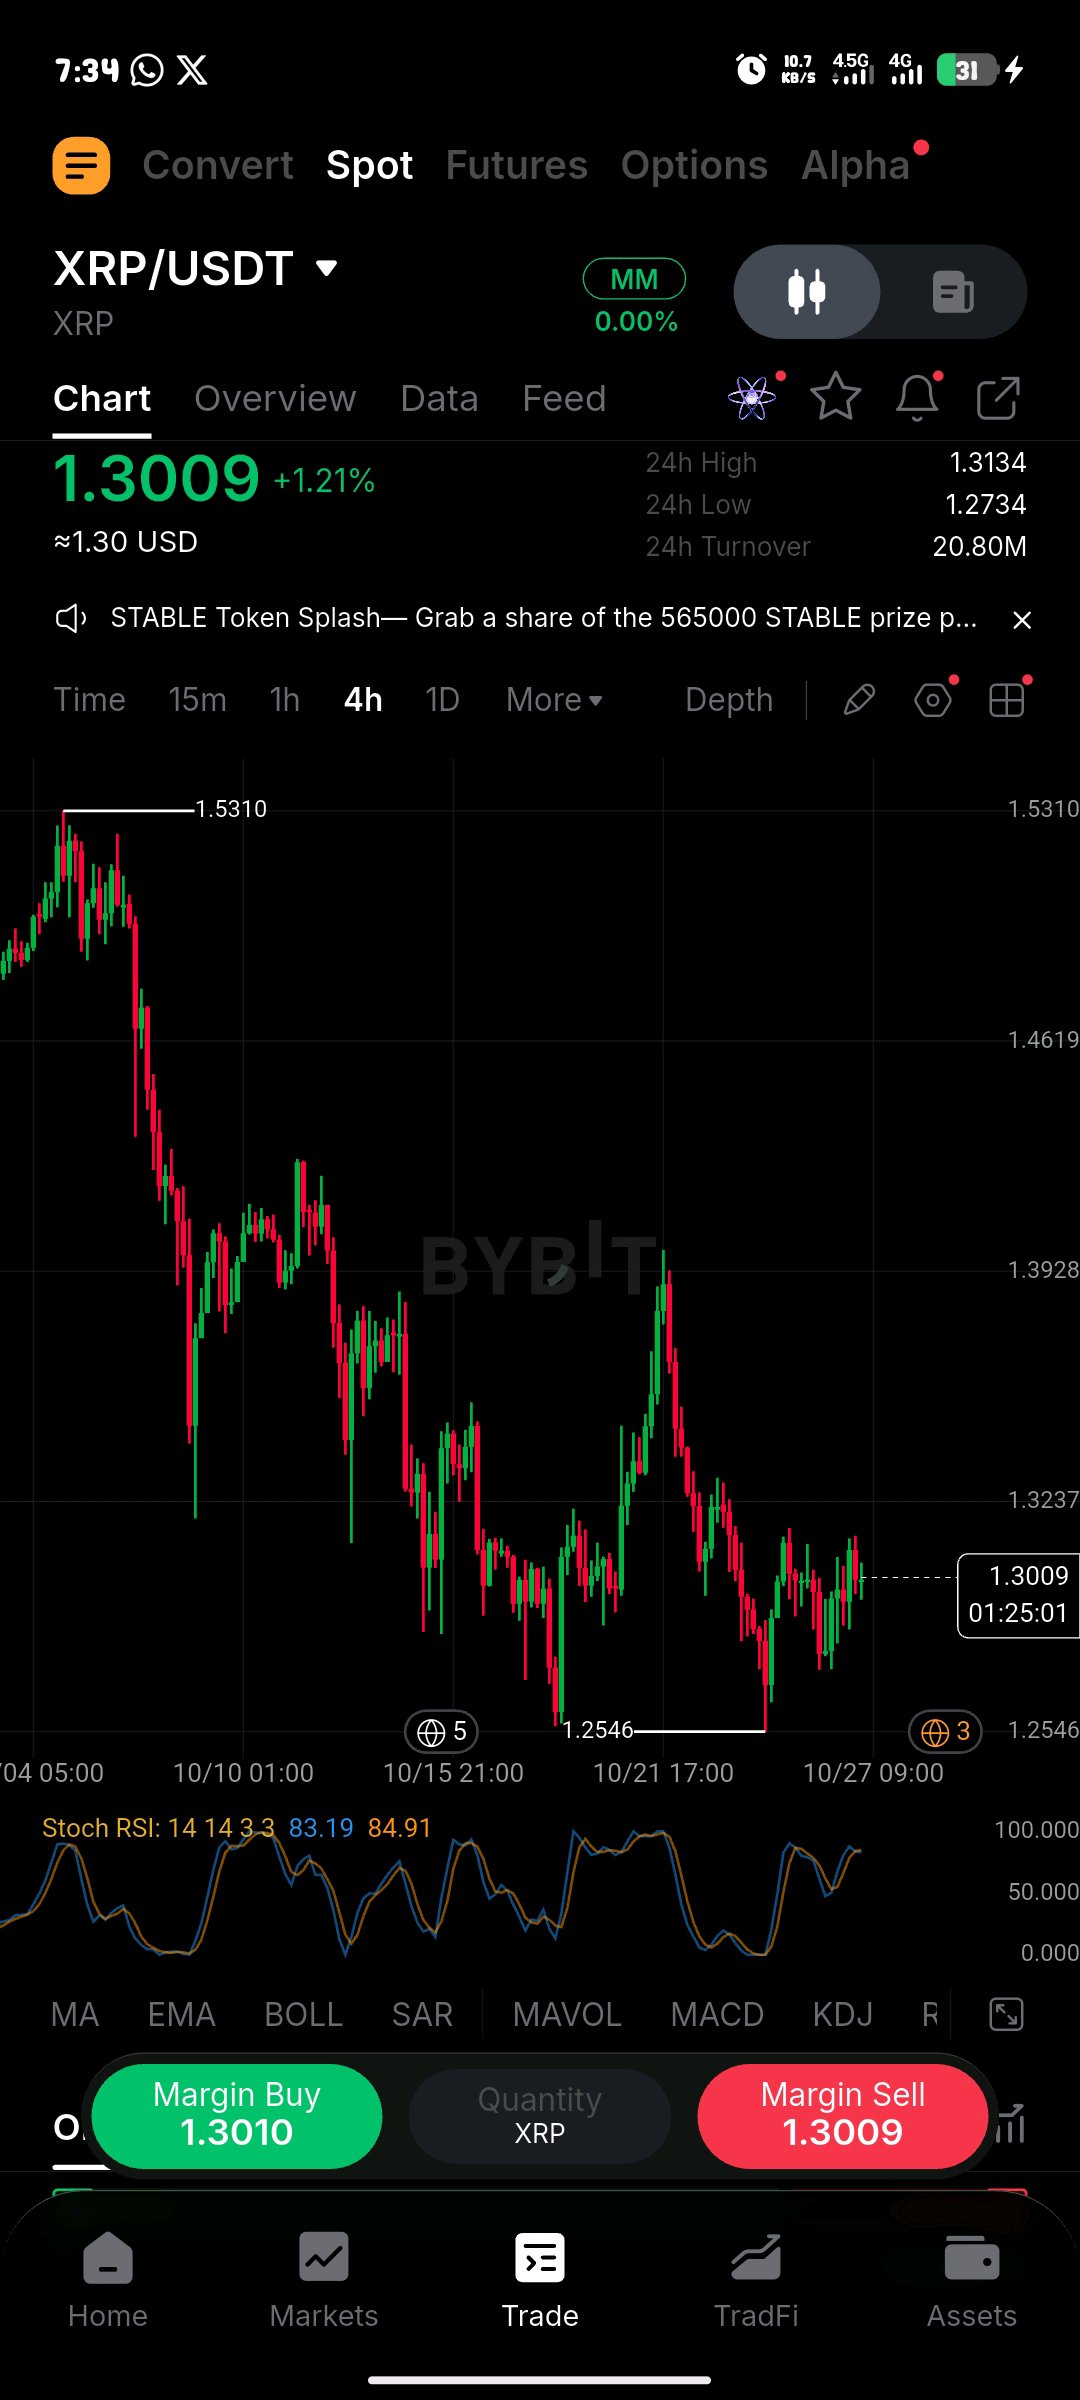
I’ve Analyzed Ripple, Here’s What I’m Watching
$XRPUSDT | Traders, I’ve been analyzing XRP, and honestly, the chart is showing some weakness right now. I’m watching the $1.30 area closely because the way price reacts around this zone could determine the next move. From my analysis, XRP is trading around $1.31, and the short-term structure remains bearish. Momentum is weak, and buyers still need to prove that they can regain control. However, I’m not ruling out a recovery if the market gives us a strong confirmation. Here are the key levels I’m watching. KEY SUPPORT LEVELS Support 1: $1.30 Support 2: $1.28 Major Support: $1.25–$1.26 Lower Support: $1.20 Extended Downside Target: $1.15 KEY RESISTANCE LEVELS Resistance 1: $1.32 Resistance 2: $1.34–$1.35 Major Resistance: $1.37–$1.40 Higher Resistance: $1.46 BEARISH SCENARIO If XRP loses the $1.28 support and confirms a breakdown, I’ll be watching the $1.26 zone next. A clean break below $1.25 could open the door toward $1.20, with $1.15 as a further downside level to monitor. BULLISH SCENARIO On the other hand, if buyers defend the support zone and push XRP above $1.32, I’ll start watching for a possible recovery toward $1.34 and $1.35. If the price breaks above that zone and holds, the next area I’ll be watching is $1.37–$1.40. MY PERSONAL OUTLOOK Traders, I’m staying cautious because the short-term momentum is still weak. I want to see how XRP reacts around $1.28–$1.30 before drawing a stronger conclusion. I’m not going to assume that every bounce is a reversal or that every drop will continue. For me, confirmation is what matters. The main question is whether buyers can defend support or sellers will push XRP lower. What do you think, traders? Are you expecting another move down on XRP, or do you believe buyers are preparing for a recovery? Drop your analysis in the comments. Let’s discuss it together. #IMPACTbyTrade
$XAUTUSDT | I’ve Analyzed Gold, Here’s My Next Move Traders, I’ve been analyzing XAUT, and I’m watching some important levels that could determine the next move. Gold-backed assets have been attracting attention, but I don’t want to jump to conclusions before price confirms its direction. From my analysis, XAUT is trading around $4,020, and the market is approaching a key decision zone. I’m watching whether buyers can push the price higher or whether sellers will take control and send it toward lower support levels. KEY LEVELS I’M WATCHING Resistance 1: $4,041 Resistance 2: $4,069 Resistance 3: $4,108 Support 1: $3,980 Support 2: $3,923 Support 3: $3,890 BULLISH SCENARIO If buyers manage to defend the $3,980 support zone and push XAUT above $4,041, I’ll be watching for a possible move toward the next resistance levels. TP1: $4,041 TP2: $4,069 TP3: $4,108 A strong breakout above $4,108 could open the door to further recovery, but I want to see confirmation before considering this scenario. BEARISH SCENARIO On the other hand, if XAUT loses the $3,980 support zone and confirms a breakdown, I’ll be watching the next support levels. TP1: $3,950 TP2: $3,923 TP3: $3,890 If sellers maintain control, the downside could extend further. However, I’ll be watching price action closely instead of assuming that support will break. MY PERSONAL OUTLOOK Traders, I’m keeping both scenarios in mind. The $3,980 level is particularly important to watch, while $4,041 is the first resistance buyers need to overcome. I’m not interested in guessing the market direction. I want to see a clear reaction at these levels before drawing a conclusion. Remember, protecting your capital and managing risk matter more than chasing every move. Now tell me your opinion: Are you bullish on XAUT, or do you think gold could drop further? Drop your thoughts in the comments. Let’s discuss what the market might do next. #IMPACTbyTrade

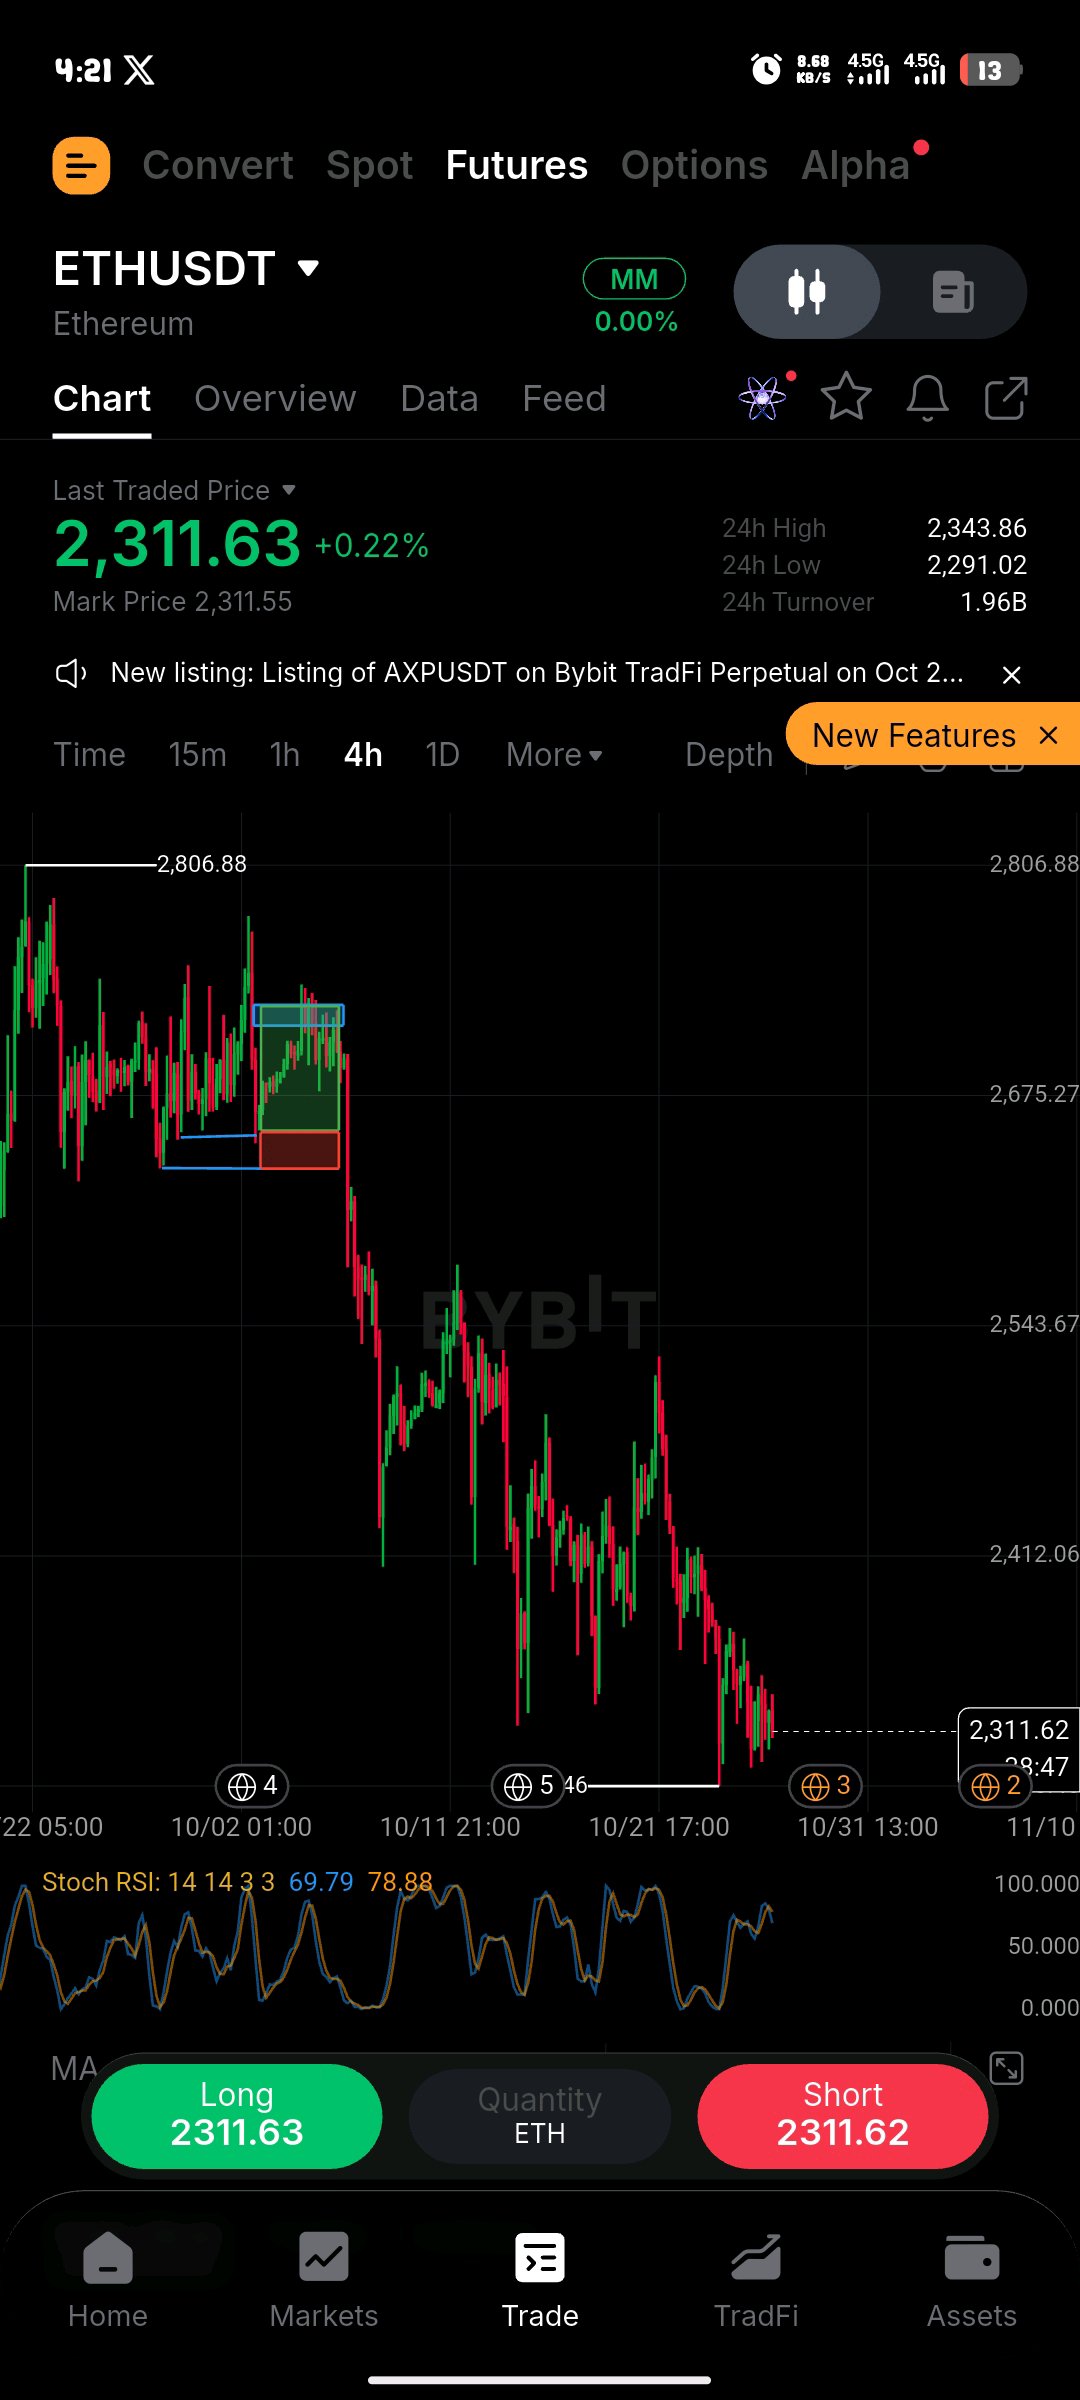
Traders, I’ve been analyzing Ethereum, and I’m watching a very important zone right now. From what I see on the chart, ETH is still facing bearish pressure, and I believe we need to pay close attention to how price reacts around the current support before making our next move. Let me show you the key levels I’m watching and the possible scenarios I’m preparing for. KEY LEVELS Current Reference Price: $2,308 Immediate Support: $2,307 Support 2: $2,262 Major Support: $2,206 Resistance 1: $2,371 Resistance 2: $2,438 Major Resistance: $2,496 BEARISH SETUP — SHORT OPPORTUNITY Personally, I’ll be watching for a possible short if ETH breaks below $2,307 and confirms the breakdown with strong selling pressure. Potential Entry Zone: $2,300–$2,307 after confirmation TP1: $2,262 TP2: $2,235 TP3: $2,206 Invalidation: A strong reclaim of the breakdown level would make me reassess the setup. I don’t want to enter blindly. I want to see sellers confirm their strength before considering this scenario. BULLISH SETUP — LONG OPPORTUNITY On the other hand, if buyers defend the $2,307 support and ETH reclaims $2,371 with strong momentum, I’ll start watching for a possible recovery. Potential Entry: After a confirmed reclaim of $2,371 TP1: $2,400 TP2: $2,438 TP3: $2,496 Invalidation: A failed reclaim followed by a breakdown of support would weaken the bullish scenario. WHAT I’M WATCHING The main thing I’m watching is whether ETH can hold its support or whether sellers will push the price lower. The moving averages and momentum indicators have been showing weakness, so I’m staying cautious until buyers provide a stronger confirmation. MY PERSONAL OUTLOOK Traders, I’m not rushing into anything yet. I want to see the market confirm its direction before taking a position. If support breaks, I’ll watch the downside targets. If buyers reclaim resistance, I’ll consider the recovery scenario instead. Remember, these are potential setups, not guaranteed outcomes. Always manage your risk and avoid entering a trade without confirmation. Now tell me your opinion: Are you looking for an ETH short or do you believe a recovery is coming? Drop your analysis in the comments. Let’s discuss it together. $ETHUSDT #IMPACTbyTrade
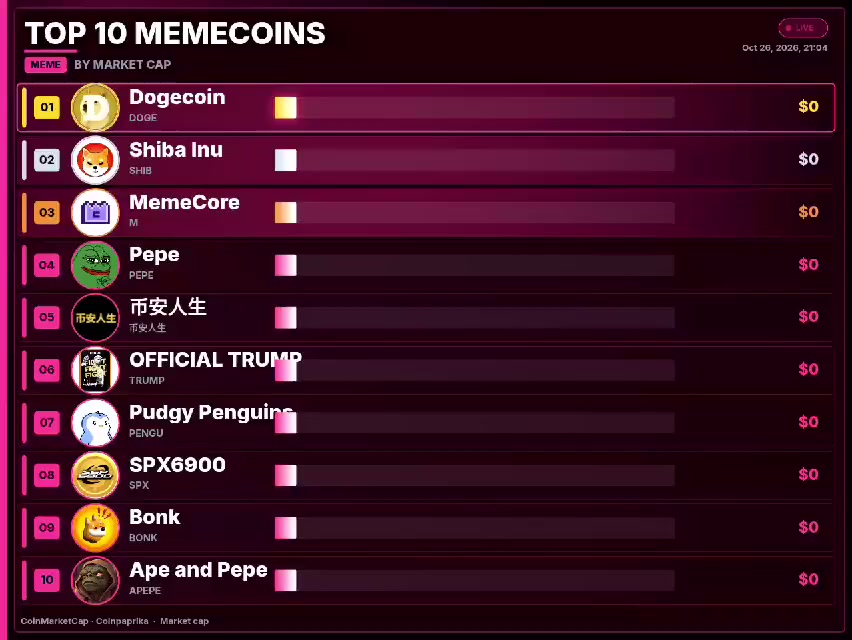
🚨 THE MEMECOIN WAR: IS THE THRONE UNDER THREAT?
The rankings of the top 10 memecoins : Dogecoin ( $DOGEUSDT ) continues to reign at the top with a stratospheric market cap of $12.7 billion. Pepe ( $PEPEUSDT ) securely holds its ground in 4th place at $1.8 billion. Pudgy Penguins ( $PENGU ) makes a notable surge into 7th position at $471.1 million. 📊 Between the historical supremacy of Dogecoin, the craze surrounding Pepe, and the rise of the Penguins, which of these three tokens do you think will outperform the others in the next bull run? Drop your analysis in the comments! 👇 #IMPACTbyTrade #ByXIMPACT #MyByXTake
🔴 $MINA: Can Buyers Stop the Downtrend?
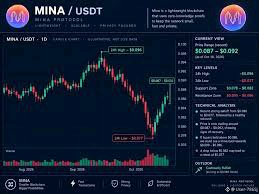
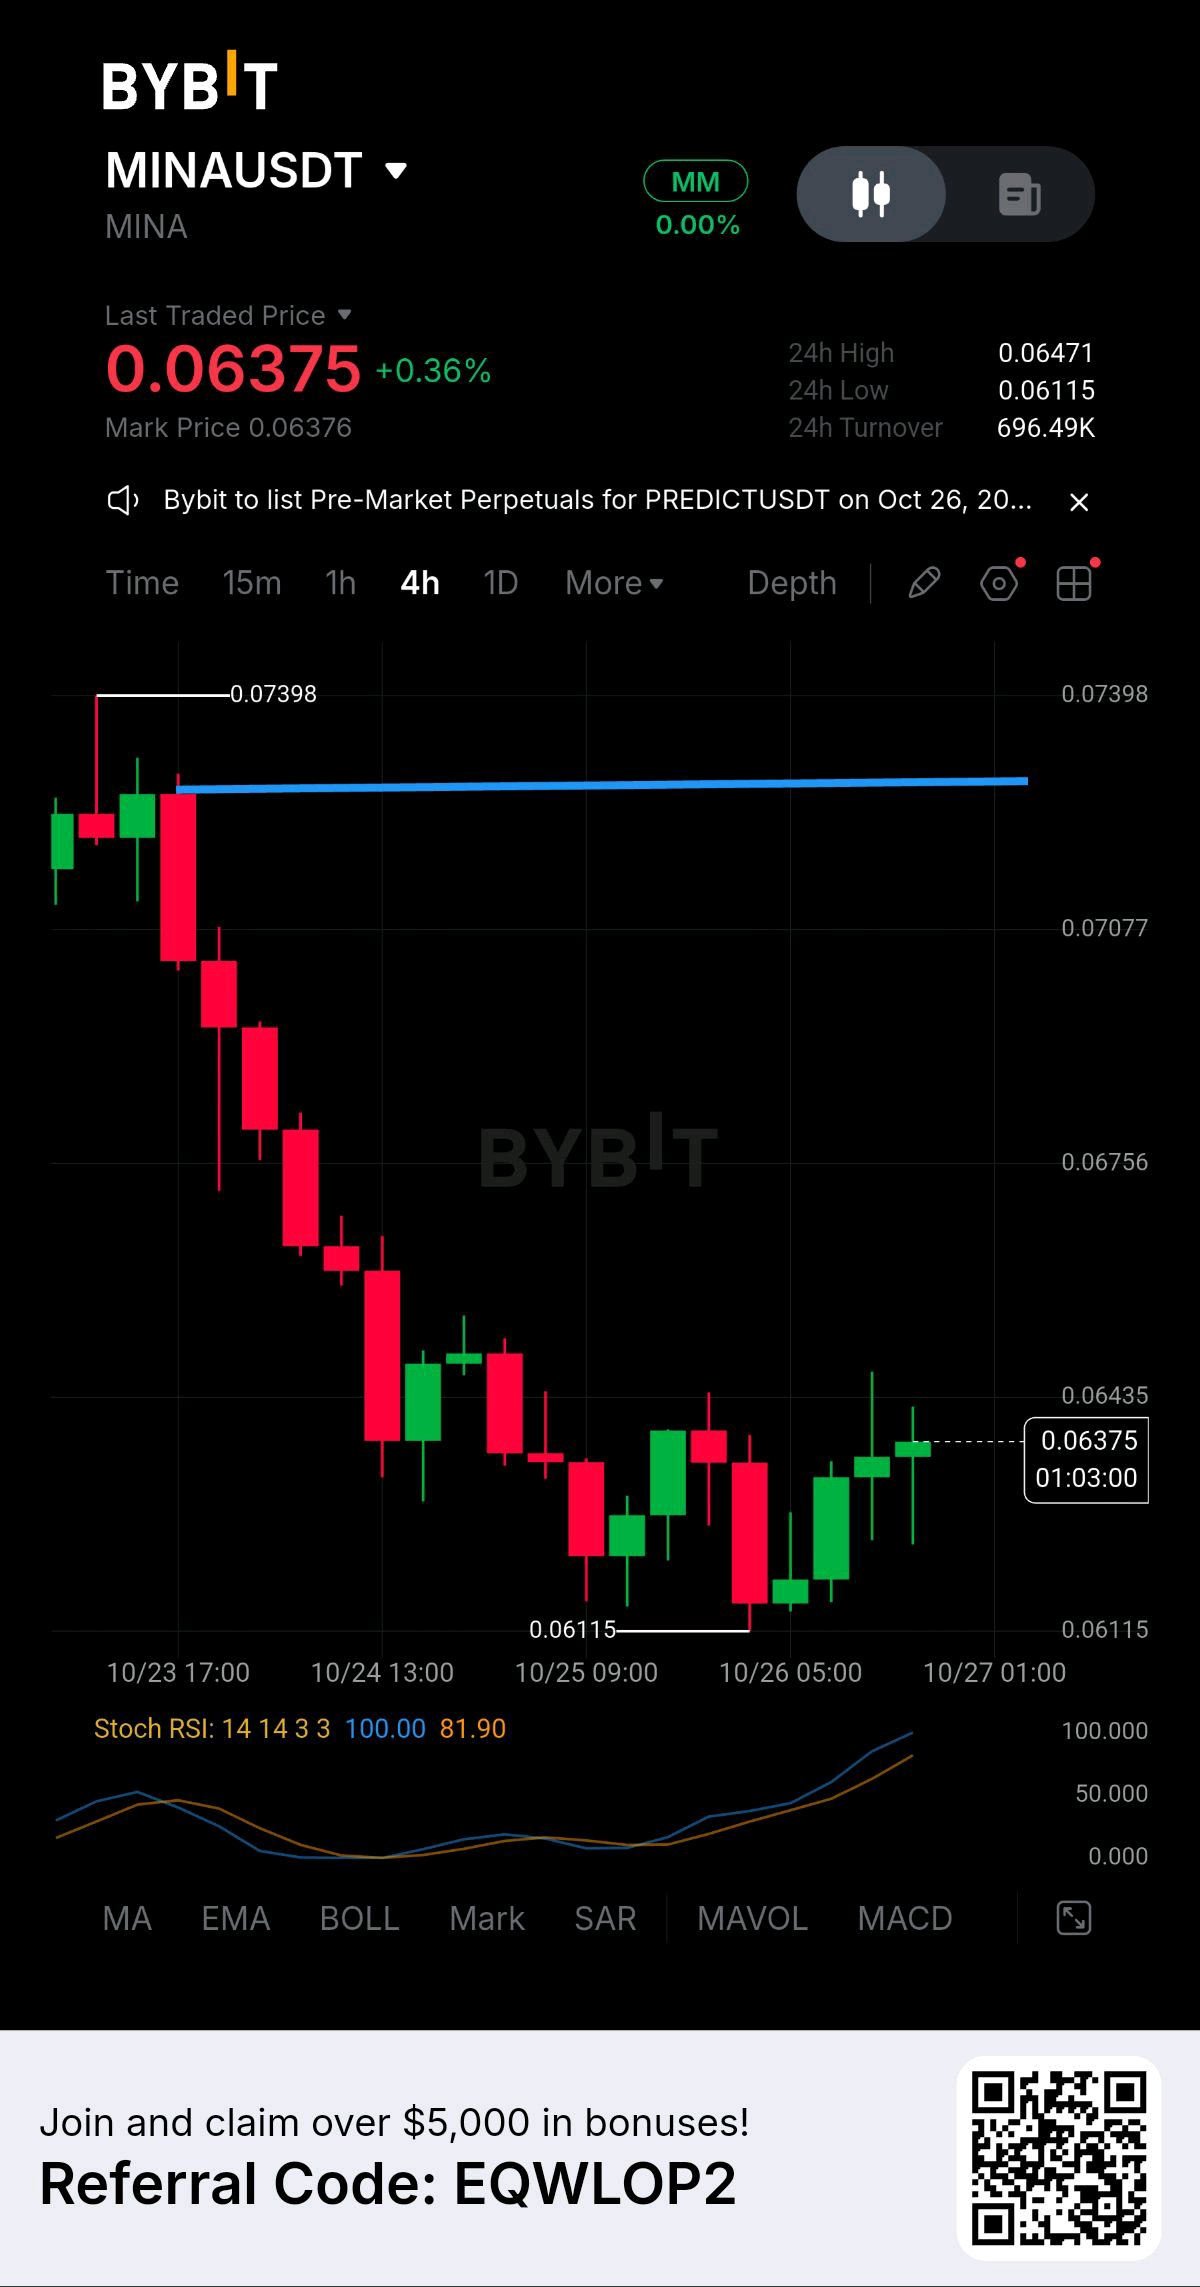
Mina Protocol ($MINA) is showing a small recovery, but the bigger picture remains bearish. As of October 26, MINA is trading around $0.064, up approximately 1.6% over 24 hours. However, the token has dropped around 11.4% over the past seven days and 54.6% over the past 30 days. Buyers still have a lot to prove before I would consider this a confirmed trend reversal. Market Overview MINA is designed around a lightweight blockchain architecture using zero-knowledge cryptography, aiming to make blockchain verification more accessible. But strong technology alone does not guarantee price appreciation. Market sentiment, liquidity, demand, and broader crypto-market conditions still matter. Technical Analysis MINA's daily technical outlook currently shows a strong bearish bias. Its RSI is around 31, indicating weak momentum and proximity to oversold territory. That could allow a relief bounce, but it does not confirm that the downtrend has ended. Key levels I'm watching: - Resistance 1: $0.0653 - Resistance 2: $0.0724 - Resistance 3: $0.0785 - Support 1: $0.0597 - Support 2: $0.0536 - Major lower support: $0.0391 Bullish Scenario If MINA breaks above $0.0653 and holds that level, buyers could attempt a move toward $0.0724. A stronger recovery above that zone could bring $0.0785 into focus. I would want to see stronger buying volume and sustained price action before treating this as a meaningful bullish reversal. Bearish Scenario If MINA fails to reclaim $0.0653, selling pressure could return. A break below $0.0597 would weaken the structure further and potentially expose $0.0536 as the next support. My Final Verdict My current view onis cautious to bearish. The recent bounce is worth watching, but the overall trend remains weak. I would rather wait for confirmation than assume the bottom is already in. The key question is whether buyers can reclaim resistance or sellers will push the price toward lower support. What do you think? Is preparing for a recovery, or is another leg down coming? Share your analysis in the comments. $MINAUSDT #IMPACTbyTrade
🚀 $TSLA: Tesla Bulls Are Back!
Tesla is back in the spotlight! Shares jumped approximately 6% on October 26, trading around $394–$395 after Barclays upgraded its rating from Hold to Buy and raised its price target from $370 to $450. What’s Driving Tesla Today? The latest rally is being fueled by renewed optimism about Tesla’s core automotive business, its Full Self-Driving technology, and speculation surrounding a possible merger with SpaceX. Elon Musk has confirmed that the companies’ boards are considering a potential combination, but no completed merger has been announced. Tesla is also seeing growing interest in its FSD software. The company reported 1.74 million FSD users at the end of Q3 2026, compared with 1.04 million a year earlier. That growth could become an important part of its long-term business model. However, there is still a risk investors should not ignore: Tesla’s third-quarter net income fell 44% year over year, even though adjusted earnings beat analysts’ expectations. The market must decide whether future growth in AI, autonomous driving, and energy can justify the company’s valuation. 📊 Key Price Levels to Watch Current price: Around $394–$395 🔹 Resistance: $397–$400 🔹 Next upside area: $410–$415 🔹 Major bullish target: $440–$450 🔹 Near-term support: $383–$385 🔹 Lower support to monitor: $370–$375 These are watch levels based on recent price action, not guaranteed turning points. My Market View Tesla’s momentum has improved, but I want to see whether buyers can push the stock above the $397–$400 resistance zone and sustain the move. A convincing breakout could open the door toward $410–$415, with $440–$450 becoming a broader upside area if positive momentum continues. On the other hand, rejection near $400 could trigger profit-taking. A move below $383 would weaken the immediate bullish setup and could bring $370–$375 back into focus. My view: Cautiously bullish while price holds above $383–$385, but I would avoid chasing the rally without confirmation. The potential SpaceX combination is an interesting catalyst, yet the underlying business performance and valuation remain crucial. 💬 Your Turn: Do you think $TSLA can break above $400 and move toward $450, or will sellers push the price back down? Share your analysis in the comments! #IMPACTbyTrade $TSLAXUSDT

$WLD: $10M WHALE TRANSFER PUTS BULLS
Worldcoin ($WLDUSDT ) is facing renewed selling pressure after a sharp reversal erased much of its recent recovery. On October 26, WLD traded around $0.44, extending its decline after reaching approximately $0.59 earlier in the week. The latest price action raises an important question: is this simply a healthy correction, or is the market preparing for another leg lower? THE BIGGEST NEWS: A $10M WHALE TRANSFER One of the most important developments is the movement of approximately 19.74 million WLD tokens, worth roughly $10 million, from a previously inactive institutional holder. Reports indicate that approximately 19 million tokens were deposited onto exchanges. Large exchange deposits can increase potential selling pressure, although they do not automatically mean that the holder has sold. The market will be watching closely to see whether buyers can absorb this additional potential supply. WORLD ID EXPANSION: A LONG-TERM CATALYST? World recently introduced an identity package designed for banks and financial service providers. The initiative aims to help distinguish real people from AI-generated identities and impersonation attempts. This development could expand the project's potential use cases, but adoption by financial institutions and its eventual effect on WLD demand remain important questions. World ID utility and the WLD token are not interchangeable, so product growth does not automatically translate into token-price appreciation. TECHNICAL ANALYSIS: KEY LEVELS TO WATCH WLD is trading near $0.44, with immediate support around $0.435–$0.43. A sustained breakdown below this area could expose the $0.40 level, followed by $0.37 if broader selling intensifies. On the upside, $0.463 is the first resistance to monitor. A convincing recovery above this level could open the way toward $0.489 and potentially $0.52. These are conditional technical scenarios, not guaranteed targets. MY MARKET OUTLOOK My current assessment is cautious because WLD is experiencing short-term selling pressure while a significant holder's exchange deposits raise supply concerns. Holding $0.43 could help the token stabilize, but buyers need to reclaim $0.463 before the recovery becomes more convincing. A breakdown below support would increase the risk of further weakness. The bigger picture remains a battle between World ID's potential adoption and the market's concerns about token supply. Fundamental progress may support long-term interest, but short-term price action still depends on demand, liquidity, and broader crypto sentiment. THE QUESTION IS SIMPLE: CAN WLD RECLAIM $0.46, OR WILL SELLERS PUSH IT TOWARD $0.40? #IMPACTbyTrade #WSOT2026 #MyByXTake
Zcash ($ZEC) is approaching a critical turning point as institutional demand returns while selling pressure continues to challenge its recovery. On October 26, ZEC was trading around $1,200, with renewed interest following approximately $41.09 million in weekly inflows into Grayscale's Zcash-focused investment product. However, the price remains significantly below its September peak, raising an important question: can institutional demand fuel another recovery, or will sellers continue pushing the market lower? THE BIGGEST NEWS: INSTITUTIONAL DEMAND RETURNS Grayscale's Zcash investment product recorded four consecutive days of inflows during the previous week, ending a three-week period of withdrawals. This development suggests that some institutional investors are regaining interest in Zcash. Nevertheless, positive fund flows do not guarantee an immediate price increase. The market still needs sustained demand and a convincing technical breakout before a stronger recovery can be confirmed. NETWORK UPGRADE COULD BECOME A CATALYST Zcash's upcoming Network Upgrade 7, targeted for November 5, is another development worth watching. The upgrade is expected to reduce block times from 75 seconds to 25 seconds and disable the Sprout pool and its transactions. Successful implementation could represent an important technical milestone for the network, although the upgrade's impact on price will depend on market expectations, execution, and broader sentiment. TECHNICAL ANALYSIS: KEY LEVELS TO WATCH ZEC is facing immediate resistance around $1,220–$1,231. A sustained move above this region could improve short-term momentum and open the way toward $1,268 and $1,300. Beyond that, the $1,350–$1,385 region represents a more significant resistance zone. On the downside, $1,175–$1,180 is an important support area. If this zone fails, $1,100 becomes the next level to monitor, with $1,000 representing a further psychological support level. These are potential scenarios, not guaranteed outcomes. MY MARKET OUTLOOK My assessment is cautiously neutral. ZEC has encouraging fundamental developments, including renewed investment-product inflows and the approaching network upgrade, but its short-term price structure remains vulnerable. A sustained break above $1,231 would strengthen the recovery scenario, while a breakdown below $1,175 would increase downside risk. The key insight is that positive news and bullish price action are not always the same thing. Investors may be interested in Zcash, but buyers still need to demonstrate enough demand to overcome resistance. Can ZEC reclaim $1,300 before its November network upgrade, or will selling pressure push it toward $1,100? Share your analysis in the comments. #WSOT2026 #IMPACTbyTrade $BTCUSDT $PEPEUSDT #MyByXTake