Ramisha Afrose
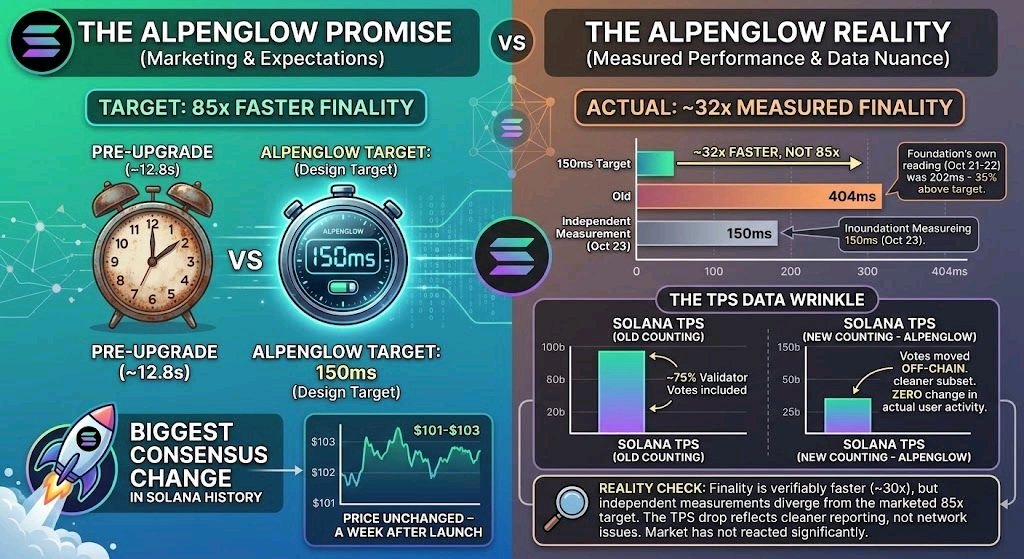
Solana's Alpenglow upgrade went live October 21, and the number everywhere is 85x: finality cut from roughly 12.8 seconds to a 150-millisecond target, an 98.8% reduction, Anza's own words. A week later, SOL is trading near $101-103, up about 3% today on a broader market rebound, not on any Alpenglow-specific move. The upgrade that was supposed to be "the biggest consensus change in Solana's history" hasn't shown up in price at all. Here's why the 85x figure needs a second look. It's a target, not a measurement, and every outlet covering the launch said so explicitly. The Solana Foundation's own dashboard showed a single reading of 202ms on October 21-22, already 35% above target. An independent measurement taken October 23, two days after launch, found median observed finality at 404 milliseconds, not 150ms, not even the 202ms early reading. That's 2.7x the marketed target. Against the old 12.8-second baseline, 404ms is still a real improvement, roughly 32x faster, not 85x. Against what Solana's TPS was already doing under the pre-Alpenglow system in practice rather than its theoretical ceiling, the gain is smaller than the headline number suggests, though I don't have a confirmed operational baseline figure to put an exact number on that comparison. There's a second wrinkle worth knowing before reading any post-Alpenglow TPS chart. Alpenglow moves validator vote messages off-chain, and those votes made up roughly 75% of what Solana's headline transaction count used to include. Reported TPS will drop 60-75% after this upgrade with zero change in actual user activity, because the network is now counting a smaller, cleaner subset of transactions. A chart showing "Solana TPS crashed after Alpenglow" and a chart showing "Alpenglow worked as intended" can be the exact same data. So the belief in circulation, finality got 85x faster, isn't false, it's the design target being quoted as the measured result. The honest version: finality got meaningfully faster, verifiably, by a factor closer to 30x than 85x, four days after launch, and the market hasn't moved on it either way. If the independently measured number is already 2.7x the marketed target four days after launch, is 150ms a figure anyone should keep repeating, or does the real number become whatever the next independent read says? #IMPACTbyTrade #ByXIMPACT $SOLUSDT
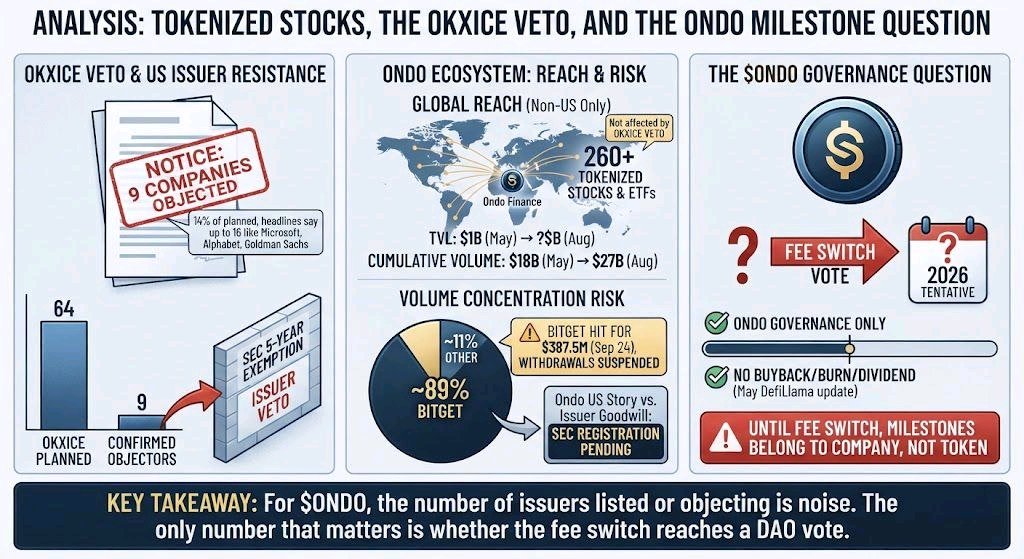
Nine US-listed companies objected to having their stock tokenized on OKXICE in its October 15 notice, about 14% of the stocks it first planned to offer. The venue isn’t live yet. Headlines since then put the count as high as 16, with Microsoft, Alphabet and Goldman Sachs named. I could only confirm the nine in the notice itself. The veto comes from the SEC’s September 17 exemption: five years, 30 days’ notice to issuers, and each company can object. That makes it a veto over one regulated US venue, not over tokenized stocks as a category. Here is where $ONDO comes in. Ondo’s 260+ tokenized stocks and ETFs are sold to non-US persons only, so I don’t think this veto reaches them. That is my read, not a confirmed fact. What it may test is Ondo’s US story: Ondo Global Markets has confidentially filed a registration statement with the SEC, and issuer goodwill is the next thing that filing runs into. The activity is real. Ondo said the stocks platform passed $1B in TVL with $18B in cumulative volume in May, and by August it cited $27B, roughly 26x TVL. But one spring report put about 89% of Ondo-related trading volume on Bitget. I couldn’t find a current split. Bitget was hit for about $387.5M on September 24 and suspended withdrawals. If the share is still anywhere near that, a lot of Ondo’s volume sits on one venue that just went through a freeze. And the token? ONDO is governance-only, with no buyback, burn or dividend active as of DefiLlama’s May update, and no executed DAO proposal since 2024. A fee switch vote is planned for 2026, and I couldn’t find a date for it. So the number worth tracking for $ONDO isn’t how many issuers object or how many tokens Ondo lists. It’s whether the fee switch ever reaches a vote. Until then, every milestone belongs to the company, not the token. #ByXIMPACT #IMPACTbyTrade $ONDOUSDT
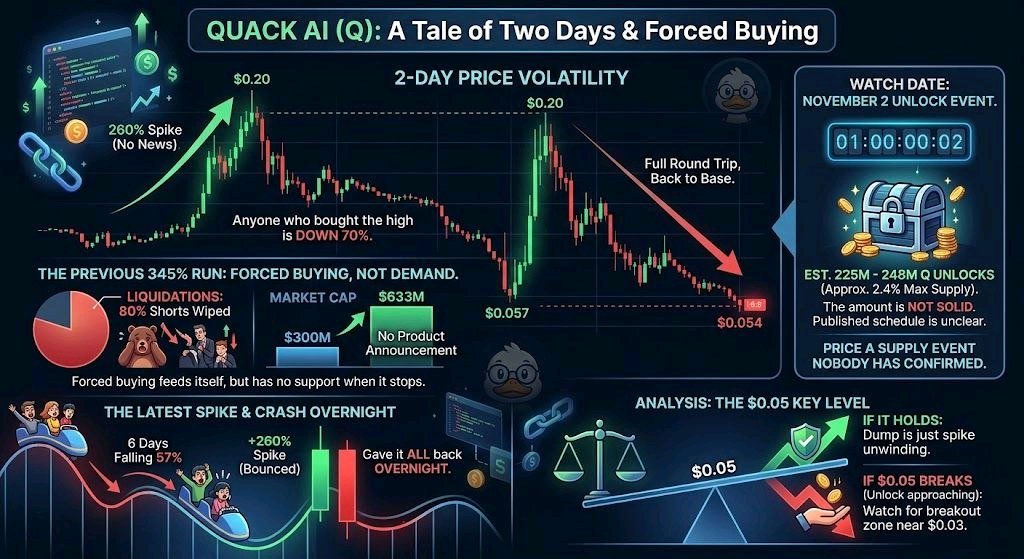
Quack AI (Q) went from about $0.057 to roughly $0.20 and back to $0.054 in two days. Full round trip. Anyone who bought the 260% candle on the 27th is already down 70%. What gets me is that there was no news behind either leg. When it ran 345% earlier this month, the best explanation was a short squeeze: nearly 80% of the liquidations that day were shorts getting wiped. Market cap doubled from $300M to $633M without a single product announcement. That’s not demand finding a token, that’s forced buying feeding itself. And forced buying has no one standing behind it once it stops. Then it did what these always do. It fell 57% in six days, bounced on another 260% spike, and gave all of that back overnight too. I’m not calling it a scam, they have live products and a real team. I’m saying a chart like this tells you nothing about whether the product matters, because nobody was trading the product. The part I’d actually watch is November 2. About 241M Q unlocks, around 2.4% of the 10B max supply, but even that number isn’t solid. Estimates run from 225M to 248M, and the published schedule doesn’t give an amount for that date. So you’re being asked to price a supply event nobody has confirmed the size of. My read: I’d rather watch how it behaves at $0.05 than guess a direction. If it holds, the dump was just the spike unwinding. If it loses $0.05 with the unlock days away, there isn’t much support underneath until the old breakout zone near $0.03. Not chasing either side of this one. #IMPACTbyTrade #ByXIMPACT $GROVEUSDT $BTCUSDT
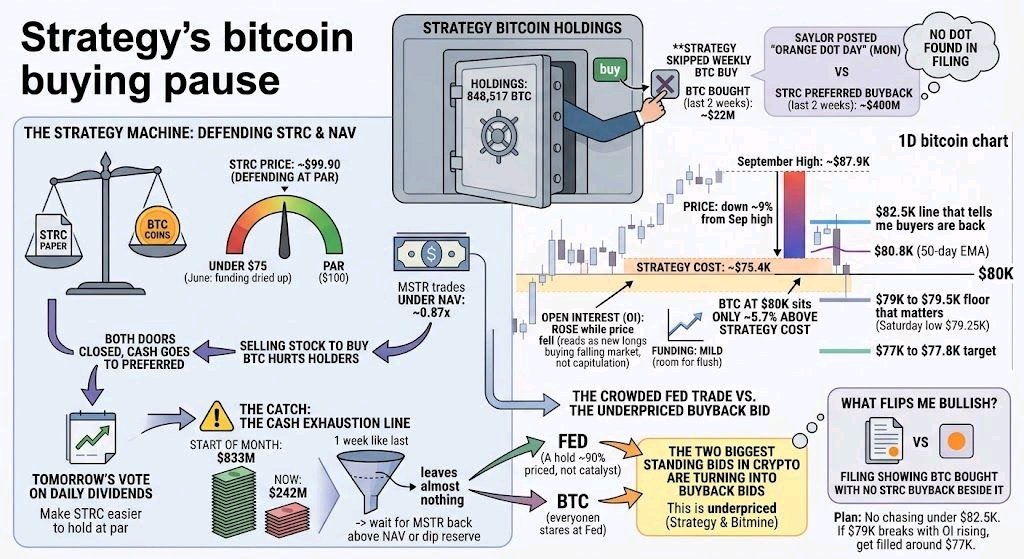
Strategy skipped its weekly bitcoin buy, and I think that’s the most important thing on the BTC chart this week. Not because it sold. It didn’t. Holdings are still 848,517 BTC. It spent $205M of cash buying back its own STRC preferred instead. Over two weeks that’s about $400M into its own paper and $22M into bitcoin. Saylor posted “Orange Dot Day” on Monday, and the filing showed no dot. The reason is simple. The whole machine runs on STRC trading near $100. When it fell under $75 in June, the funding dried up. Now it’s back at $99.90 and they’re defending it. At the same time MSTR trades under NAV (about 0.87x), so selling stock to buy BTC hurts holders. Both doors are closed, so the cash goes to the preferred. Tomorrow’s vote on daily dividends is the same play: make STRC easier to hold at par. The catch is the cash. It was $833M at the start of the month and is $242M now. One more week like the last leaves almost nothing, and then they either dip into the reserve or wait for MSTR to get back above NAV. Bitmine did the exact same thing with ETH last week: below NAV, stopped buying coins, started buying its own stock. The two biggest standing bids in crypto are turning into buyback bids, and I think that’s underpriced while everyone stares at the Fed. A hold is about 90% priced, so a hold isn’t the catalyst. A hike is the tail. On the chart, BTC at $80K sits only 5.7% above Strategy’s $75.4K cost. Price is down about 9% from the September high, and OI rose while it fell. That reads as new longs buying a falling market, not capitulation. Funding is mild, so nobody is crowded yet, but there’s room for a flush. Levels: $79K to $79.5K is the floor that matters (Saturday’s low was $79.25K), then $77K to $77.8K. Above, $80.8K is the 50-day and $82.5K is the line that tells me buyers are back. Plan: no chasing under $82.5K. If $79K breaks with OI still rising, I want to get filled around $77K, not short into it. What flips me bullish isn’t a candle. It’s the next filing showing bitcoin bought with no STRC buyback beside it. #ByXIMPACT $BTCUSDT
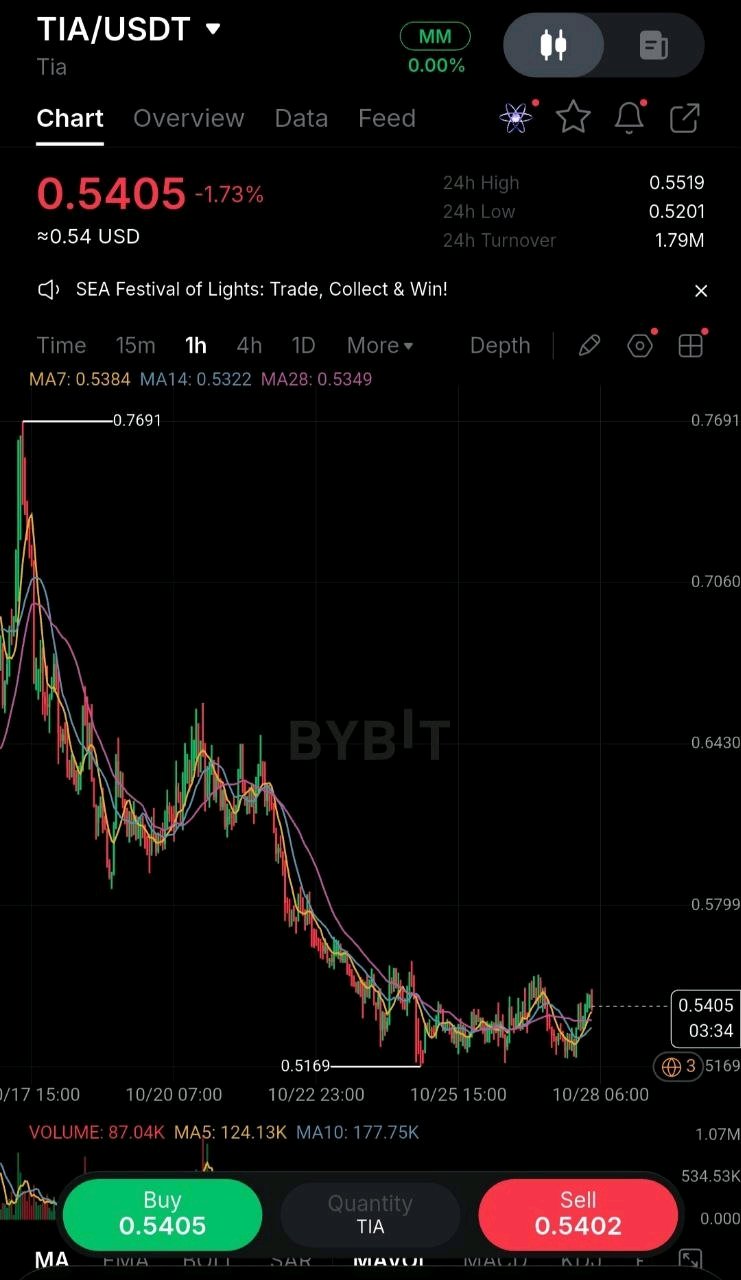
Celestia shipped the biggest upgrade in its history on Oct 20, and TIA is still about 33% below the high it printed days before it. That’s what I can’t get past on $TIAUSDT. Fibre is live on mainnet, and Celestia said it sustained 3.07 Tb/s in a 120-validator test. That’s real engineering. But a Coinbase market note put daily transaction fees at about $158. A faster network is only worth more if people pay to use it, and right now the usage doesn’t match the headline. The market seems to agree. TIA ran to 0.7691, then gave back about a third in roughly ten days. Price at 0.5405 is only about 4.6% above the 0.5169 low. That doesn’t make it a sell by itself, but it looks a lot like selling the news until something proves otherwise. The chart says the slide has paused, not ended. Price is just over MA7 (0.5384), MA14 (0.5322) and MA28 (0.5349), and they’ve flattened. But volume is fading, with the 5-candle average at about 70% of the 10-candle one. Key figures 0.5405: price 0.5201–0.5519: 24H range 1.79M: 24H turnover 0.5169: swing low 0.7691: high of this chart about 0.65: where the last bounce topped Bullish confirmation: 0.5201 holds and price closes an hour above 0.5519 with volume picking up. That would say buyers are absorbing the sell-the-news move, with 0.65 as the first stop. Bearish confirmation: 0.5169 breaks and price fails to reclaim it. There’s no support on this chart below it. I’m ignoring the $1.30 and $9 targets floating around. They depend on usage I can’t see yet. For me, the real test is whether Fibre turns into fees, not just benchmarks. Until 0.5519 breaks, I’m watching. Which matters more for TIA from here: Fibre going live, or the fact that the market sold it within days? #ByXIMPACT $TIAUSDT
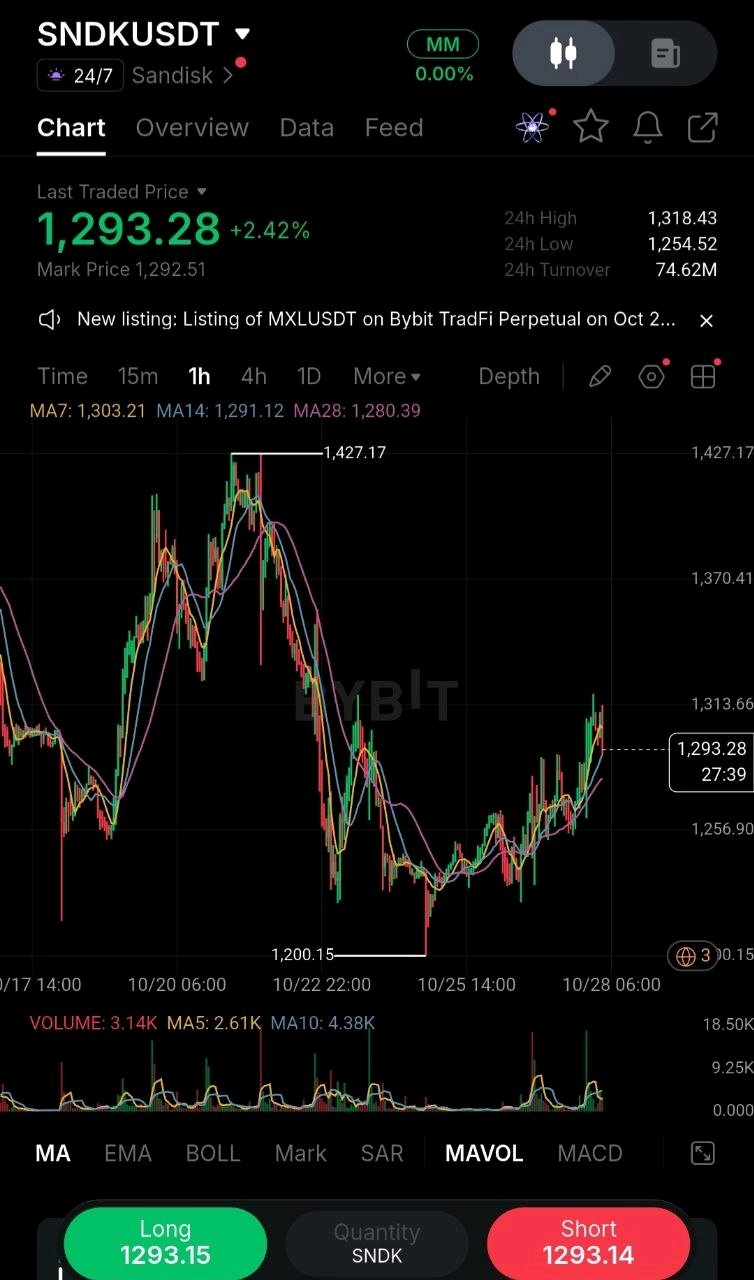
SNDK beat last time and still sold. Thursday?
SNDK is coiling between the MA28 and MA7 two sessions before earnings, and the range is tighter than the story deserves. On the 1H, price is 1,293.28 after bouncing off 1,200.15. The MA28 at 1,280, MA14 at 1,291 and MA7 at 1,303 are packed into a 23-point band, and the five-candle volume average is 2.61K against 4.38K for the ten. That’s compression into a binary event, and that usually resolves with a gap, not a trend. The 24h range is 1,254.52 to 1,318.43, so I have two clean edges. The story is why I’m not leaning. SNDK is up about 428% this year and reports Thursday after the close, with roughly $46 EPS on $10.6B of revenue expected. Western Digital just beat and guided up, which helps. But last quarter SNDK beat on EPS by 13% and still closed lower the next day, and Cantor cut its target from 2,900 to 2,200 on Monday while keeping its overweight. Good numbers are already priced in. The guide is what gets paid. So until the print, I trade the edges, not the middle. Long: 1,255 to 1,280, floor to MA28 SL: 1,240, under the 1,254.52 low TP1: 1,318 | TP2: 1,370 R:R from 1,268: risk 28, about 1.8 to 1 to TP1 and 3.7 to 1 to TP2 Short: a wick into 1,318 to 1,330 that closes back under SL: 1,345 TP1: 1,281 | TP2: 1,255 R:R from 1,324: risk 21, about 2 to 1 to TP1 and 3.3 to 1 to TP2 I close both before Thursday’s 4:05 PM ET release. A gap doesn’t respect a stop, so I won’t hold either side through the print. What changes my mind: a 1H close above 1,330 with turnover rising, which means the range is broken, and I stop fading it. A 1H close under 1,254 means the floor is gone and 1,200.15 is next. What’s your rule for trading the sessions before a print that can gap through any stop? #ByXIMPACT
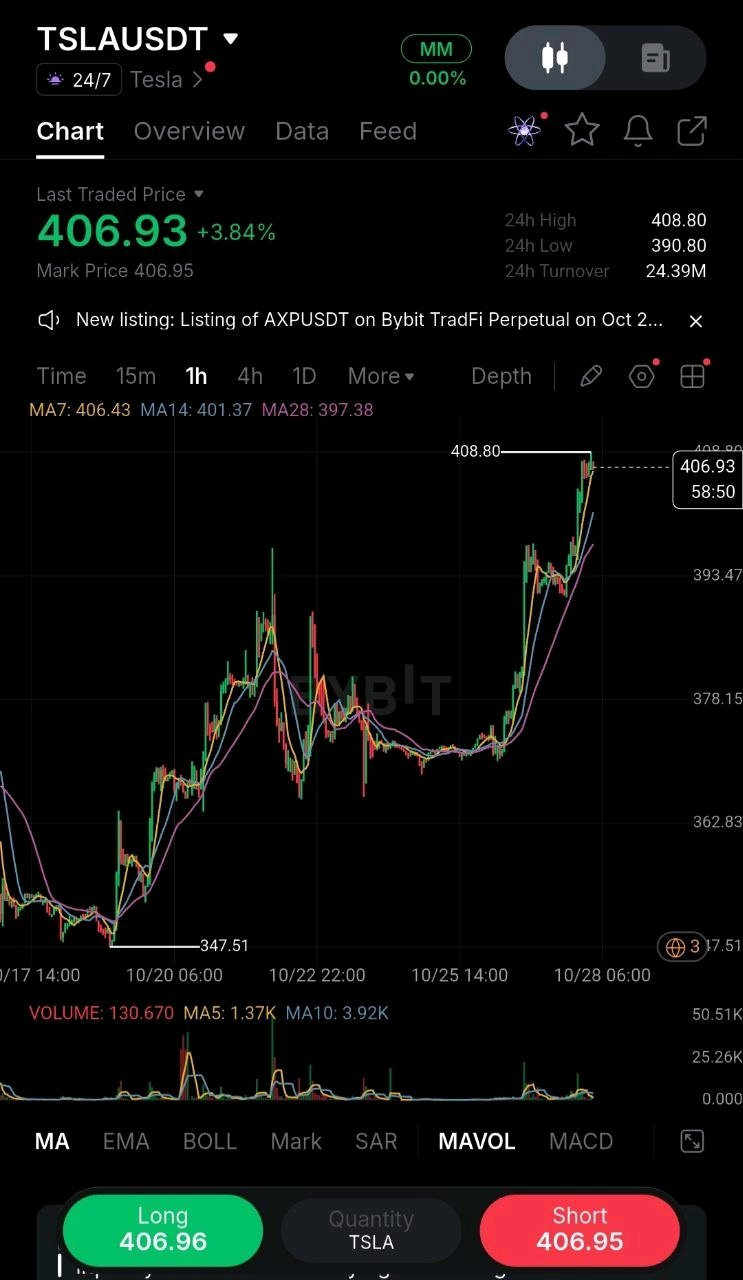
TSLA is at 406.93 and I’m not touching it here. The tape is ripping, and that is exactly when I slow down. Four days ago this stock was grinding sideways in the low 360s. Now it has run to 408.80, about 17% above the 347.51 low, and it’s printing on the 24h high. I can’t point to a clean headline for the move. The context I do have: in late September Tesla was the weakest of the Magnificent Seven this year, down about 21%, with the Terafab chip plant (a $16.8B plan) still more promise than product. A laggard that squeezes without news is usually positioning, and positioning can unwind fast. The chart is stretched. Price is 406.93 against MA7 at 406.43, MA14 at 401.37 and MA28 at 397.38, so the fast average is right under price and the slow one is about 9.5 points back. That gap is what usually gets closed. The shorter volume average (1.37K) is also sitting well under the 10-bar (3.92K). The newest candle has only just opened, which explains part of that, but the push isn’t getting louder. This is a 24/7 perp, so it keeps trading when the stock market is closed. Off-hours liquidity is thinner and gaps on Monday opens are real, so I keep size smaller than I would on a regular session. The numbers 406.93 — Price 408.80 / 390.80 — 24H high / low 347.51 — Swing low 406.43 / 401.37 / 397.38 — MA7 / MA14 / MA28 24.39M — 24H turnover The plan I’d rather buy the dip than the candle. The area I like is 397.50-401.00, where MA14, MA28 and the 23.6% pullback of the whole leg (394.34) all bunch up. I want to see a 1H candle hold there before I touch it. Entry: 397.50-401.00 on a hold Stop: 391.00, just under the 24h low TP1: 408.80, the high TP2: 418.00 TP3: 423.27, the 1.236 extension of the 347.51 to 408.80 leg From 399 that’s about 1.2R to TP1, 2.4R to TP2 and 3.0R to TP3. TP1 is thin on its own, so I’d take only a partial there and let the rest run to the other two. Where I’d change my mind If price pushes through 408.80 and holds above it on a retest, I’d stop waiting for the dip and respect the breakout. If it instead rejects at 408.80 and closes under MA7, the move is probably fading, and 401.37 and then 397.38 are the first places it gets pulled back to. If 391 goes, the whole structure is broken and I’m out. Plenty of people will call the rally a new trend. I’d call it a trend only after it holds a pullback. Until then it’s a stretched move on a stock that was the group’s worst performer a month ago. #ByXIMPACT $TSLAXUSDT

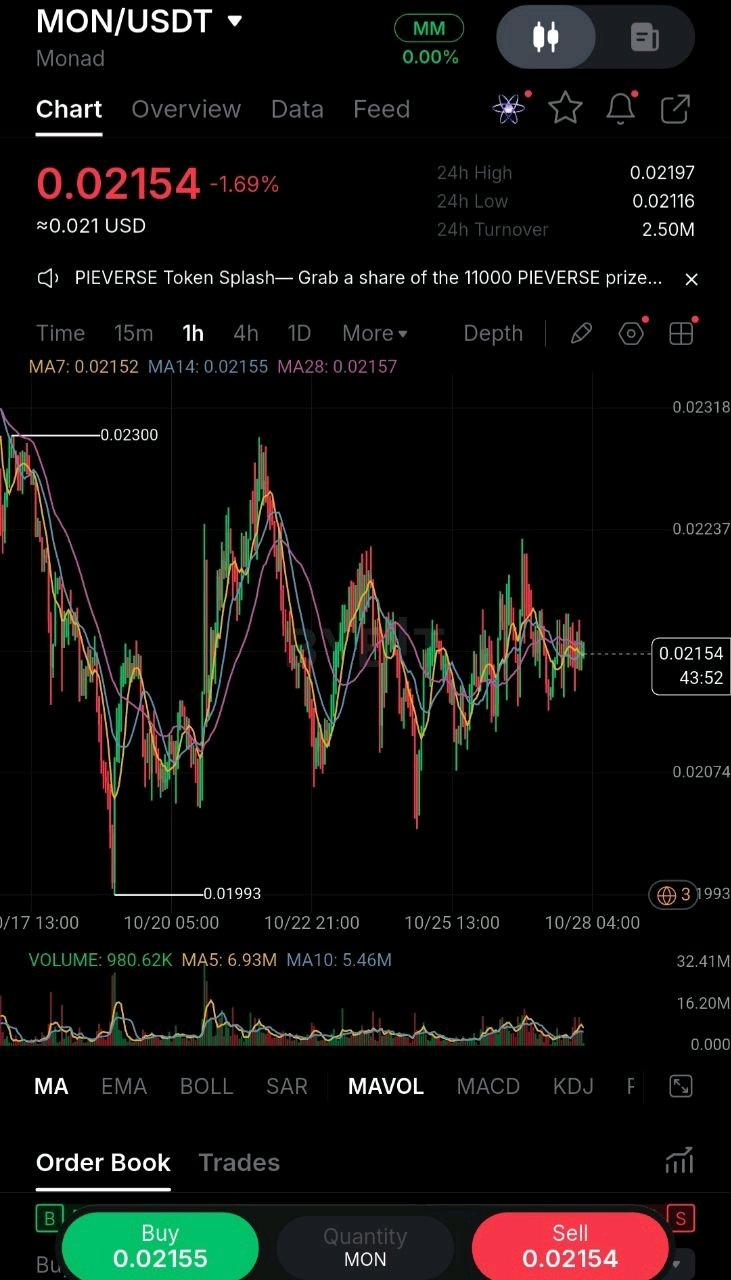
MONUSDT is coiling in the middle of its own range on the 1H, and this tight squeeze around 0.02154 is where I want to see which side blinks first. What caught my attention isn’t the -1.69% on the day, it’s how quiet the averages have gone. MA7 sits at 0.02152, MA14 at 0.02155 and MA28 at 0.02157. All three are inside 0.00005 of each other, about 0.2%, and price is sitting on top of them. When fast, medium and slow averages collapse into one line, the market has no trend. It is waiting. The volume detail matters most to me. The latest candle shows 980.62K against a MA5 of 6.93M and a MA10 of 5.46M. The candle is still open, but participation has been fading, not building. Compression on shrinking volume usually resolves with a sharp move, and the direction is not readable from here. My read is that this is a range with no edge in the middle. The 24h range runs 0.02116 to 0.02197, so the floor is 0.02116 and the ceiling is 0.02197, about 3.8% wide on 2.50M turnover. Zooming out, the full swing from 0.01993 to 0.02300 has its midpoint at 0.021465, and price is only 0.00008 above it. Buying or selling here means paying for no information. The edge sits at the boundaries. Long at the floor Entry: 0.02116-0.02130, only on a rejection wick that closes back inside the range SL: 0.02085 TP1: 0.02197 | TP2: 0.02300 R:R from 0.02123: risk 0.00038, so about 1.9R to TP1 and 4.7R to TP2. TP2 is the target that justifies the trade. Short at the ceiling Entry: 0.02190-0.02197, only on a rejection wick that closes back under SL: 0.02225 TP1: 0.02130 | TP2: 0.02116 R:R from 0.02193: risk 0.00032, so about 2.0R to TP1 and 2.4R to TP2. What would change my mind? A 1H close above 0.02225 with volume well above its MA5 breaks the range upward, and I’d drop the short idea and look toward 0.02300. A 1H close below 0.02085 invalidates the floor and puts the 0.01993 low back in play, so no longs. Three averages squeezed into 0.2% and a 980K candle after a 6.93M average: whichever side stops waiting first sets the next leg. #ByXIMPACT $MONUSDT
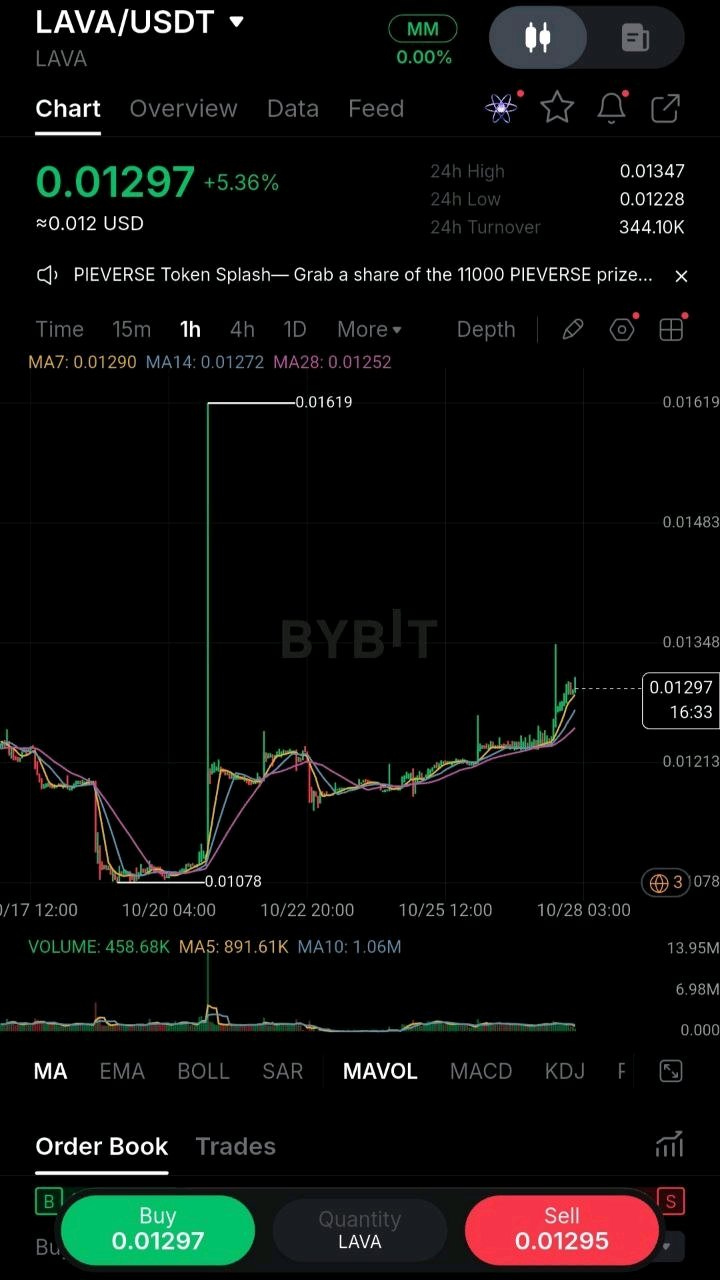
LAVA HAS STOPPED SPIKING AND STARTED STAIRCASING: LET PRICE COME BACK TO THE AVERAGES LAVA is a network that routes data and RPC traffic for dapps and AI agents across chains. After one spike to 0.01619 that was completely retraced, it has been grinding up in small steps. The question is whether it holds the MA shelf on the next dip. LAVAUSDT, 1H. Price 0.01297 (+5.36%), 24h range 0.01228 to 0.01347, turnover 344.10K. Evidence: the swing low is 0.01078. After the spike, price made higher lows into the 0.0123–0.0125 area and is now trading above all three averages: MA7 0.01290, MA14 0.01272, MA28 0.01252. They are stacked in bullish order and rising. A wick to 0.01347 was rejected, so the 24h high is the first ceiling. Volume: the current candle shows 458.68K against a MA5 of 891.61K and a MA10 of 1.06M. The biggest volume belongs to the old spike, and the recent climb has been quiet. I want volume to come back on the next bounce before I trust it. Levels Support: 0.01290 (MA7), 0.01272 (MA14), 0.01252 (MA28), 0.01228 (24h low), 0.01078 (swing low) Resistance: 0.01347 (24h high), 0.01480 (halfway to the spike high), 0.01619 (spike high) Bias: bullish above 0.01252. A 1H close under it turns this into a failed staircase. Plan: buy the pullback onto the shelf Entry: 0.01270–0.01290 SL: 0.01225 (below MA28 and the 24h low) TP1: 0.01347 | TP2: 0.01480 | TP3: 0.01619 R:R from 0.01280: about 1.2:1 to TP1, 3.6:1 to TP2, 6.2:1 to TP3. TP1 is thin, so I’d take a partial there and move the stop to entry. Confirmation: a 1H candle off the shelf that closes back above MA7, with volume moving back toward its MA5. Invalidation: a 1H close below 0.01225. Risk note: turnover is only 344K, so this coin is thin. Use a limit entry, keep size small, and size from the stop so the loss is a small fixed % of your account. If you missed the shelf, wait for the next pullback instead of buying the wick. Does LAVA hold the MA shelf, or is 0.01347 where the staircase ends? #ByXIMPACT $LAVAUSDT

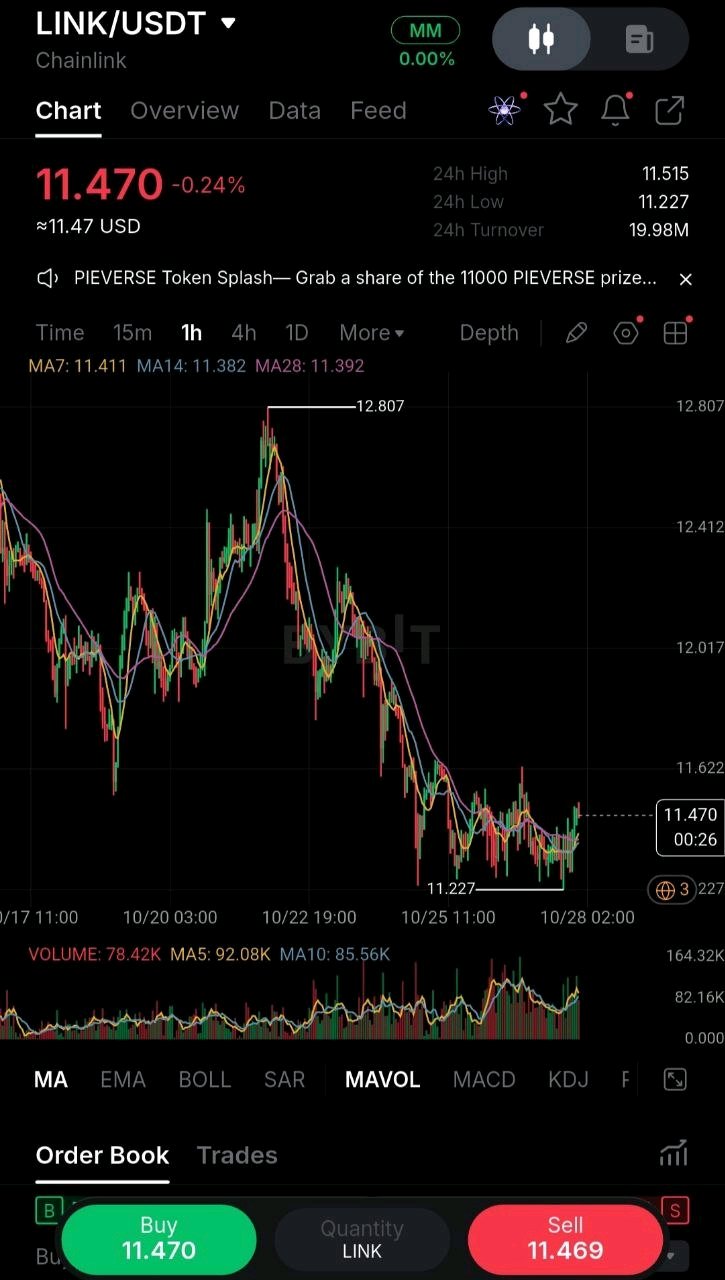
LINK is coiling at the lows of its range after a 27% retrace. The edges tell me where to act. LINKUSDT, 1H. Price 11.470 (-0.24%), 24h range 11.227 to 11.515, turnover 19.98M. LINK ran to about 15.77 after CCIP 2.0 launched at the end of September. Since then it has given back roughly 27%, and on this chart it slid from the 12.807 swing high to the 11.227 low. The slide stopped, and what formed afterwards is a tight, boring range. The detail I’m watching is the MAs. MA7 (11.411), MA14 (11.382) and MA28 (11.392) have collapsed into a band about 0.3% wide, and price is sitting on top of it. Compressed averages after a trend leg usually mean energy is being stored. They don’t say which direction it comes out. Volume tells the same story: it picked up during the flush and has cooled to about average (78K against a MA5 of 92K). Sellers have slowed down, but buyers haven’t shown up yet either. My read: this is a base forming at the lows, and the edge sits at the boundaries, not in the middle. The floor is 11.227. The ceiling is 11.515, with the 11.62 wick above it. Plan (long from the floor) Entry: 11.28–11.34, only after a rejection wick that holds above 11.227 SL: 11.17 TP1: 11.515 | TP2: 11.62 | TP3: 12.00 (where the October bounce faded) R:R from 11.32: about 1:1.3 to TP1 and 1:2.0 to TP2. Both are thin on their own. The number that justifies the trade is TP3, at roughly 1:4.5, so I’d take partials at TP1 and TP2 and leave a runner. What would change my mind: A 1H close above 11.62 that holds would flip this from a base into a break. I’d wait for the retest and then target 12.00. A 1H close under 11.17 means the floor failed and the next leg is lower. I wouldn’t catch that. Are you buying the floor of this range, or waiting for 11.62 to break before committing? #ByXIMPACT $LINKUSDT

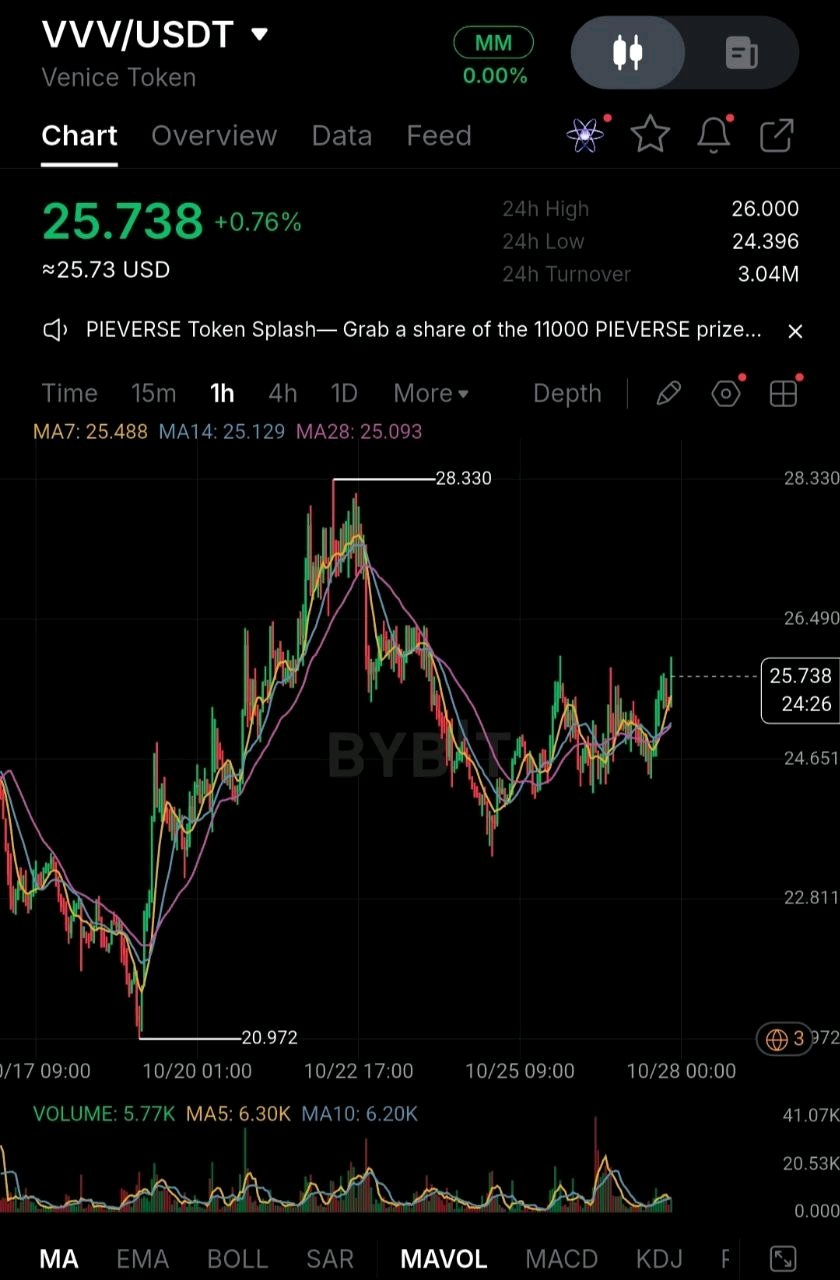
A clean bounce is exactly where I get careless, so I’m slowing down on VVV. Price bottomed at 20.97 and has been climbing ever since. It pulled back from the 28.33 high, found support around 24.40, and is now at 25.74, above MA7 (25.49), MA14 (25.13) and MA28 (25.09). The MAs are stacked bullishly and starting to separate, which is a healthy sign. The 24h range is 24.40 to 26.00 on 3.04M turnover, so participation is decent, not explosive. My first instinct is to buy the break of 26.00. But that level is the top of the recent range, and the last candle already ran into it. If I buy there, my stop has to sit far below and the risk/reward gets ugly. If it rejects at 26, I’m the exit liquidity for someone who bought lower. So I’m waiting for the pullback to MA7 around 25.50. If buyers defend it with a reaction candle, that’s my entry. If price loses MA14 and MA28 (25.10) and closes under them, the bounce is just chop inside the range, and I’m out of the idea. Entry: 25.50 (pullback to MA7, only with a reaction candle) SL: 24.95 TP1: 26.40 TP2: 27.20 Invalidation: 1H close below 25.00 That’s roughly 1.6R to TP1 and 3.1R to TP2. If price breaks 26.00 and holds on a retest, I’d consider adding. If it spikes through and drops back inside the range, I leave it alone. Waiting costs me a missed candle. Chasing costs me a stop. I’ll take the missed candle. Are you buying the 26 break or waiting for the dip? #ByXIMPACT $VVVUSDT
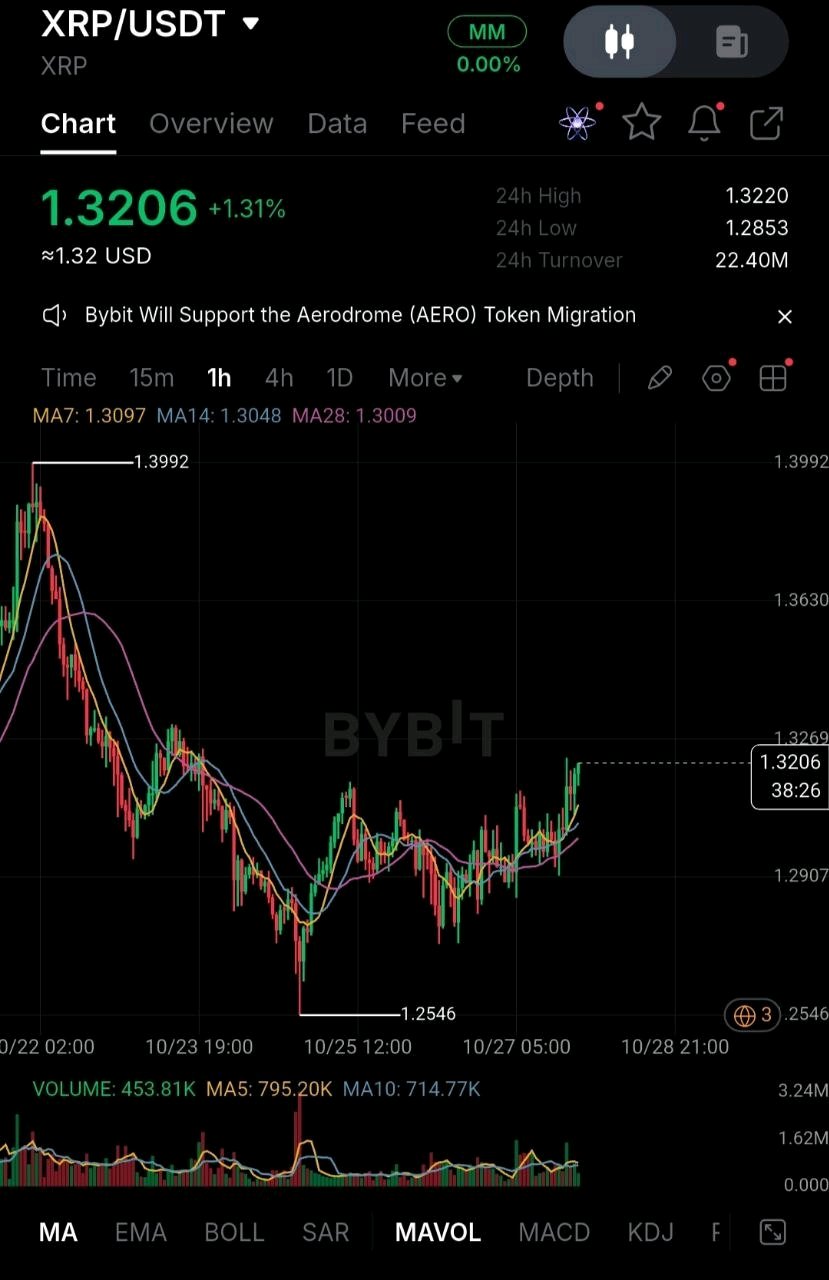
XRP is pushing into the 24h high right now, and honestly my first instinct is to hit buy. Price just got above all three MAs after two days of chop, and the volume on this candle is better than anything in the last few hours. But I’m not touching it yet. I’ve learned that the first push into a level is usually where impatient money gets caught, and the entry after the retest costs a little more but loses a lot less often. We bounced about 46% off the 1.2546 low, and the structure from 1.3992 is still lower highs. A bounce this size after a drop like that is normal, so I don’t see it as a reversal. The level I care about is 1.3269, the midpoint of the whole drop. That’s where this either turns into a real recovery or runs out of steam, and I don’t want to be buying right under it. So here’s my plan. I’m not entering on this candle. I need a 1H close above 1.3269 first, then a retest around 1.3220–1.3230 that holds. Entry: 1.3220–1.3230 after the retest holds SL: 1.3040, under MA14. If we lose that, I’m wrong and I’m out. TP1: 1.3630 TP2: 1.3992 That’s roughly 2.2:1 to the first target. If it tags 1.3269, rejects, and slips back under MA7 at 1.3097, I drop the long idea completely. I’ll only look at shorts if we lose 1.2853. If it runs without me, I let it go. There’s always another setup. Are you buying this push, or waiting for 1.3269 to prove itself? $XRPUSDT #ByXIMPACT
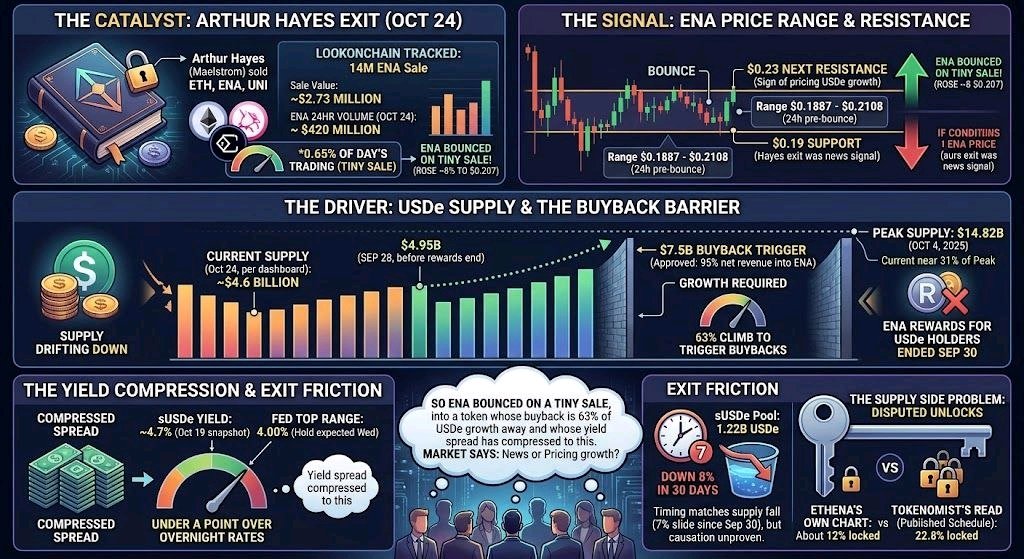
Arthur Hayes announced on October 24 that he had closed his Maelstrom directional book, selling ETH, ENA and UNI. Lookonchain tracked a 14 million ENA sale worth $2.73 million against about $420 million of 24-hour ENA volume. That’s 0.65% of the day’s trading (my math). ENA still rose about 8% to $0.207. The sale was never the number that matters for ENA. USDe supply is. Ethena’s approved buyback sends 95% of net revenue from its branded businesses into ENA, but only once USDe’s 14-day average supply passes $7.5 billion. Supply is about $4.6 billion, so it has to grow roughly 63% before the first dollar of buybacks. It was $4.95 billion on September 28, and the peak was $14.82 billion on October 4, 2025. That puts it near 31% of the peak. The yield shows why it’s drifting down. sUSDe paid about 4.7% in Aavescan’s October 19 snapshot, and the top of the Fed’s range is 4.00% with a hold expected Wednesday. That’s under a point over overnight rates for a synthetic dollar with a seven-day exit. The sUSDe pool held 1.22 billion USDe, down 8% in 30 days. ENA rewards for USDe holders ended September 30, two days after the $4.95 billion reading, and supply has fallen about 7% since. The timing matches, but I can’t show the rewards caused it. The supply side has its own problem. Ethena released all remaining investor tokens on October 5, and how much is still locked depends on who’s counting. Ethena’s own chart says about 12%. Tokenomist’s read of the published schedule says 22.8%. So ENA bounced on a tiny sale, into a token whose buyback is 63% of USDe growth away and whose yield spread has compressed to this. It ranged $0.1887 to $0.2108 in the 24 hours before the bounce, and $0.23 is the next resistance. A close above $0.23 would be the first sign anyone is pricing USDe growth. Back under $0.19 and the market is saying the Hayes exit was the news after all. #ByXIMPACT $ENAUSDT
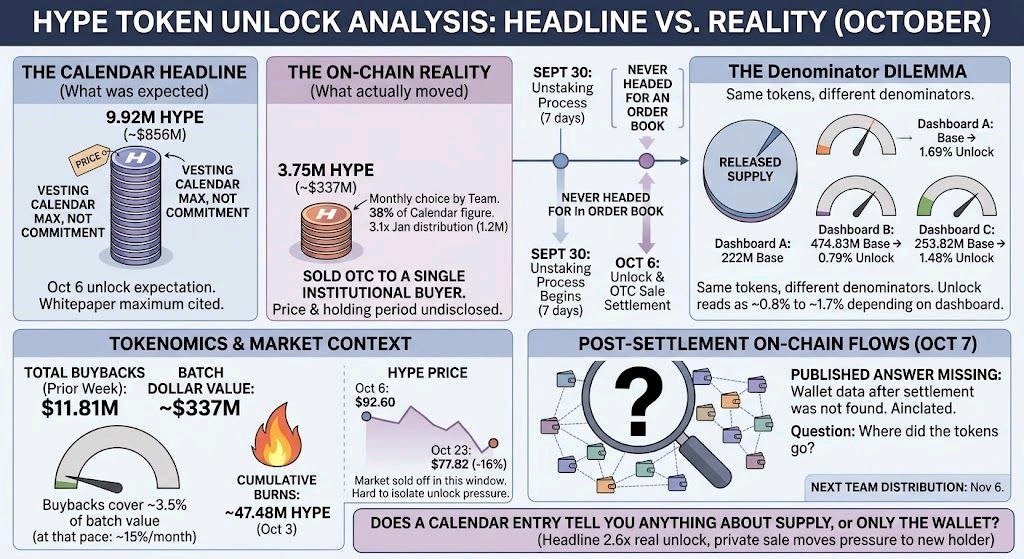
The HYPE unlock that vesting calendars listed for October 6 was 9.92M tokens, about $856M. What actually moved was 3.75M HYPE, about $337M, which is 38% of the calendar figure. Hyperliquid Labs began unstaking the batch around September 30, which goes through the seven-day unstaking process, and sold all of it over the counter to a single institutional buyer, per a co-founder on the project’s Discord. So the event calendars were counting down to on October 6 was already in motion a week earlier, and it was never headed for an order book. The buyer, the price and any holding period haven’t been disclosed. The size is a monthly choice. Team distributions started on January 6 at 1.2M HYPE, and October’s is about 3.1 times that. The 9.92M is the whitepaper maximum, not a commitment, so the same calendar entry can sit far from what’s released. The denominator is just as loose. The unlock is quoted as 1.69% of unlocked supply, which implies a base of roughly 222M HYPE. One tracker lists released supply at 474.83M, which would make it 0.79%. Another lists circulating supply at 253.82M, which makes it 1.48%. Same tokens, three denominators, and the unlock reads as anywhere from 0.8% to 1.7% depending on the dashboard. Against that, buybacks totaled $11.81M in the prior week, about 3.5% of the batch’s dollar value, so at that pace a month of buybacks covers roughly 15% of it. Cumulative burns stood near 47.48M HYPE as of October 3. HYPE traded at $92.60 on October 6 and $77.82 on October 23, 16% lower, but the whole market sold off in that window, so I wouldn’t pin the move on the unlock. The open piece is where the tokens went. Tokenomist said on-chain flows after settlement on October 7 would be the clearest signal, and I couldn’t find a published answer. The next team distribution is scheduled for November 6. If the headline unlock was 2.6 times the real one, and the real one was a private sale, the sell-pressure question moves to whoever holds the batch now. Does a calendar entry still tell you anything about supply, or only the wallet? #ByXIMPACT #IMPACTbyTrade #MyByXTake $HYPEUSDT
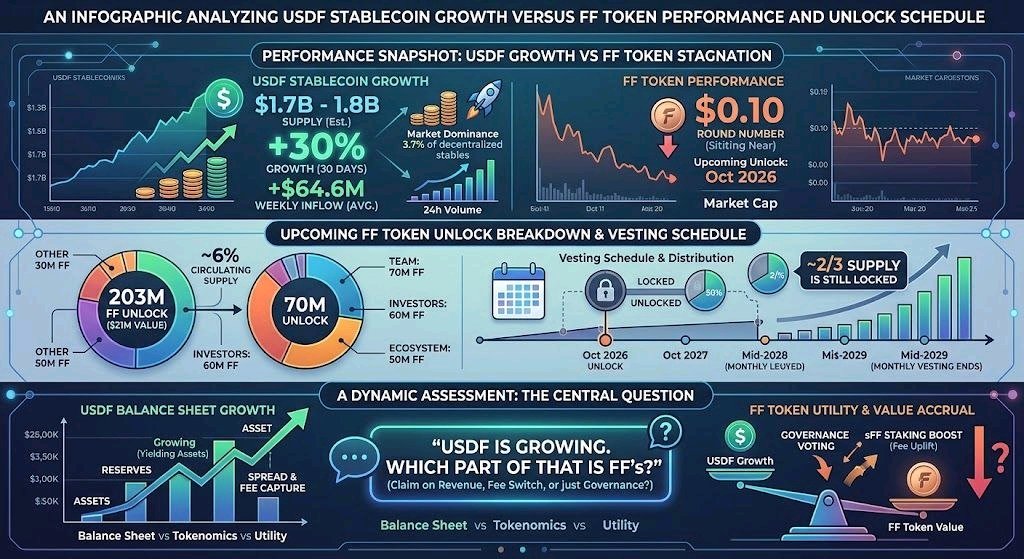
USDf is having a good month. Circulating supply is around $1.7–1.8B, up more than 30% in 30 days, and last week it added $64.6M, more than any other stablecoin issuer. FF is not having a good month. It sits near $0.10, and its next unlock lands Thursday, the day after the Fed decision. Worth asking how much of one is the other’s problem. Here’s what the unlock actually is. The 75M figure on some calendars covers only the ecosystem tranche. Four tranches land that day, about 203M FF in total, roughly $21M and a little over 6% of circulating supply. The team (20% of supply) and investors (4.5%) cleared their one-year cliff a month ago, and their vesting now runs monthly. Trackers show instalments into mid-2029. This isn’t a cliff you wait out. It’s a monthly event, and about two-thirds of the 10B supply is still locked. Now the other side of the ledger. USDf growing is not the same as FF being needed. Minting USDf doesn’t require holding FF. The token’s job is governance and staking: sFF holders get preferential minting terms and yield paid in USDf or FF. That’s an option for users who want a boost, not a toll on the product. And $64.6M of new USDf in a week is balance-sheet growth, not revenue. The protocol earns the spread on it. One third-party summary calls FF a buy-and-burn token. I couldn’t find that in Falcon’s own tokenomics text, which lists governance, staking terms and community rewards. I’ll be honest about what I can’t see. The trackers don’t split how much of USDf’s 30%+ growth is organic and how much is driven by Falcon’s points program. If it’s organic, that’s real demand for the protocol. It just isn’t shown to be demand for the token yet. So the setup is simple. A steady $20M-a-month supply schedule meets a token with no visible revenue line, right on the $0.10 round number. The thing to watch is whether anything ever routes USDf’s earnings to FF holders. USDf is growing. Which part of that is FF’s? #IMPACTbyTrade #MyByXTake #ByXIMPACT $FFUSDT
ZRO ran 140%. Then the unlock hit.
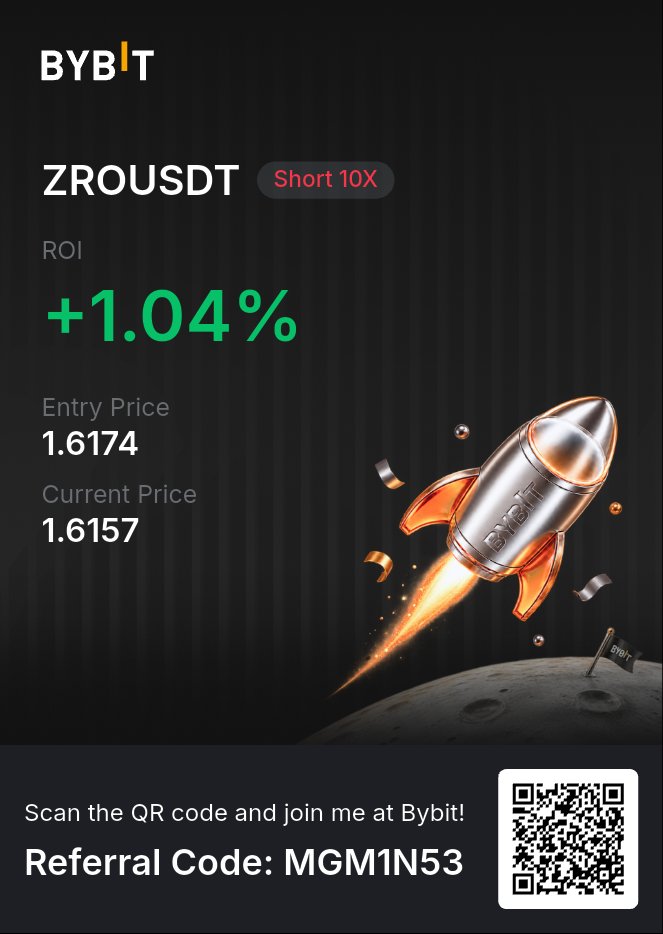
ZRO ran more than 140% in a month, topped near $2.36 on October 12 with RSI at 76, and is now sitting at 1.6157. I’m short from 1.6174 at 10x (attached). This is the full case, including what I’d do differently and what could go wrong. The rally had a real engine. LayerZero’s buybacks reached about 2.5M ZRO ($5.4M), the ATLAS fee-burn story took over the timeline, Binance finished the STG migration, and open interest swelled from about $140M to $187M on the way up. That last number is the one I care about. A coin doesn’t gain 140% on buybacks alone. It gets there because leveraged longs pile in, and those same longs become the supply when the bid stops. I can’t tell you how much of that OI has already been flushed, so I’m treating it as fuel, not proof. Did the October 20 unlock matter? Roughly 23.6M ZRO, about 5.9% of circulating supply and near $47M at the time, went to core contributors and strategic partners. Price has slid from about $2 to 1.62 since. An unlock isn’t automatic selling, and a vesting calendar isn’t a signal on its own. What matters is the schedule. Eight monthly unlocks remain through May 2027, so a fresh batch lands around the 20th of every month, and the next one is roughly three and a half weeks away. The buyback has spent $5.4M in total, against about $47M of supply in a single day. The structure is what gives me the short. Sellers capped the move at $2.36, under the $2.50 level everyone was watching. The $1.80 area held on October 15, and price now trades below it, so the level bulls needed has turned into resistance. Under me, $1.54 was the breakout level in late September, then $1.34 near the top of the old channel, then $1.19. If the rally was mostly leverage, those are the shelves where it gets tested. My trade is a short at 10x from 1.6174. First target is $1.54, about 4.6% below entry, or roughly +46% on margin. Second target is $1.34, about 17% below entry, or roughly +170%, only if $1.54 breaks and holds. Here is what’s wrong with my own trade. I don’t have a hard stop on it, and at 10x that’s the weakest part. My liquidation sits near $1.78, about 10% above entry. So right now I’m risking my whole margin to make roughly 46% at the first target. That isn’t good risk math, and I’m not going to dress it up. A stop fixes that, and it’s the first thing that would make this trade better. What went wrong with the entry? I’m shorting after the coin already fell about 31% from its high, and much of the slide from $2 to 1.62 came around the unlock. That is exactly where late shorts get squeezed. The better short was the retest of $1.80, roughly 11% above where I sold, which would have given a tighter stop and far better reward-to-risk. I didn’t wait for it. I took the earlier price, and the cost is a worse position. What would make this trade better: A hard stop that sits well inside liquidation. Lower leverage. At 5x, liquidation moves roughly twice as far away, and one wick doesn’t end the trade. Scaling in on a failed bounce toward $1.70 or $1.80 instead of selling the middle of the range. Taking partial profit at $1.54 and leaving the rest for $1.34. Checking whether open interest keeps falling while price stalls. If OI is rebuilding, the squeeze risk is higher. What would prove the thesis wrong? A reclaim of the $1.80 area that holds, which would turn resistance back into support. Fresh buyback size that actually absorbs the monthly unlocks would also weaken it. So would a surprise catalyst. LayerZero’s Zero L1 mainnet is slated for this fall, and a December fee-switch vote could add buyback and burn demand. A coin with live catalysts can squeeze a 10x short in hours. I’m barely green at +1% on margin, which means nothing yet. I won’t size up, and I won’t talk myself out of an exit because a small early gain felt good. I’m not calling a collapse. I’m betting the supply schedule and the leverage hangover keep capping every bounce, and I’m showing the flaws in my own trade up front. Do you read the October 20 unlock as already priced in, or does the monthly supply keep ZRO heavy until the fee switch arrives? #IMPACTbyTrade #MyByXTake #ByXIMPACT $ZROUSDT
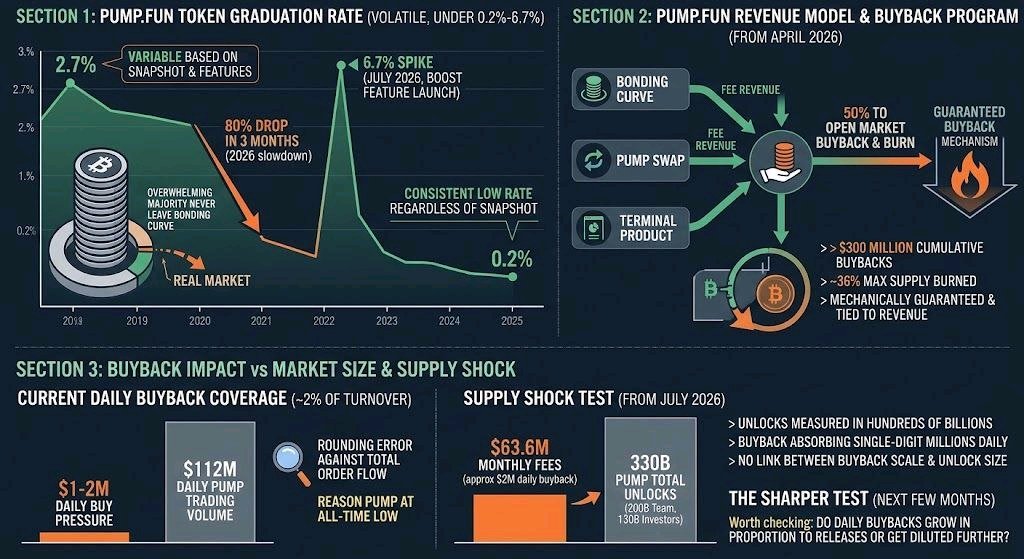
Pump.fun’s graduation rate — the share of tokens launched on its bonding curve that ever reach a real market — gets reported anywhere from under 0.2% to as high as 2.7%, depending on the measurement window and which feature was live at the time. That’s not conflicting data so much as a real, volatile number: it dropped roughly 80% in three months during 2026’s memecoin slowdown, then briefly spiked to 6.7% in July when a feature called BOOST launched. The overwhelming majority of tokens never leave the curve regardless of which snapshot you catch it at — a consistent finding across every version of this stat. The more precise, better-documented story is what Pump.fun actually does with the revenue that model generates. Since April 2026, the platform has directed 50% of its fee revenue — from the bonding curve, PumpSwap, and its Terminal product — into buying back and burning PUMP on the open market. That’s produced more than $300 million in cumulative buybacks and burned roughly 36% of the token’s maximum supply. As token buyback programs go, that’s real: mechanically guaranteed, tied directly to revenue rather than discretionary treasury decisions, and substantial in absolute dollar terms. It’s also been structurally too small to matter against how much PUMP actually trades. Pump.fun collects roughly $63.6 million in fees a month; half of that going to buybacks works out to somewhere around $1-2 million a day in buying pressure. Daily PUMP trading volume runs around $112 million. The buyback covers roughly 2% of daily turnover — real demand, genuinely happening every day, and still a rounding error against the actual order flow deciding the token’s price. That’s the reason PUMP has sat at its all-time low even while the buyback program has been running exactly as advertised the whole time: the mechanism works, it’s just outsized by the market it’s trying to influence. What makes the next few months a sharper test than the ones before it: starting July 2026, 200 billion PUMP from the team allocation and 130 billion from existing investors begin unlocking — supply measured in the hundreds of billions of tokens hitting a buyback mechanism currently absorbing single-digit millions of dollars a day. The buyback scales with revenue, not with unlock size, so there’s no built-in mechanism tying how much gets bought back to how much new supply is becoming available. Worth checking as those unlocks progress: whether daily buyback volume actually grows in proportion to what’s being released, or whether a program that’s already covering only 2% of turnover gets diluted further against supply growing at a completely different scale. #IMPACTbyTrade #MyByXTake #ByXIMPACT $PUMPUSDT
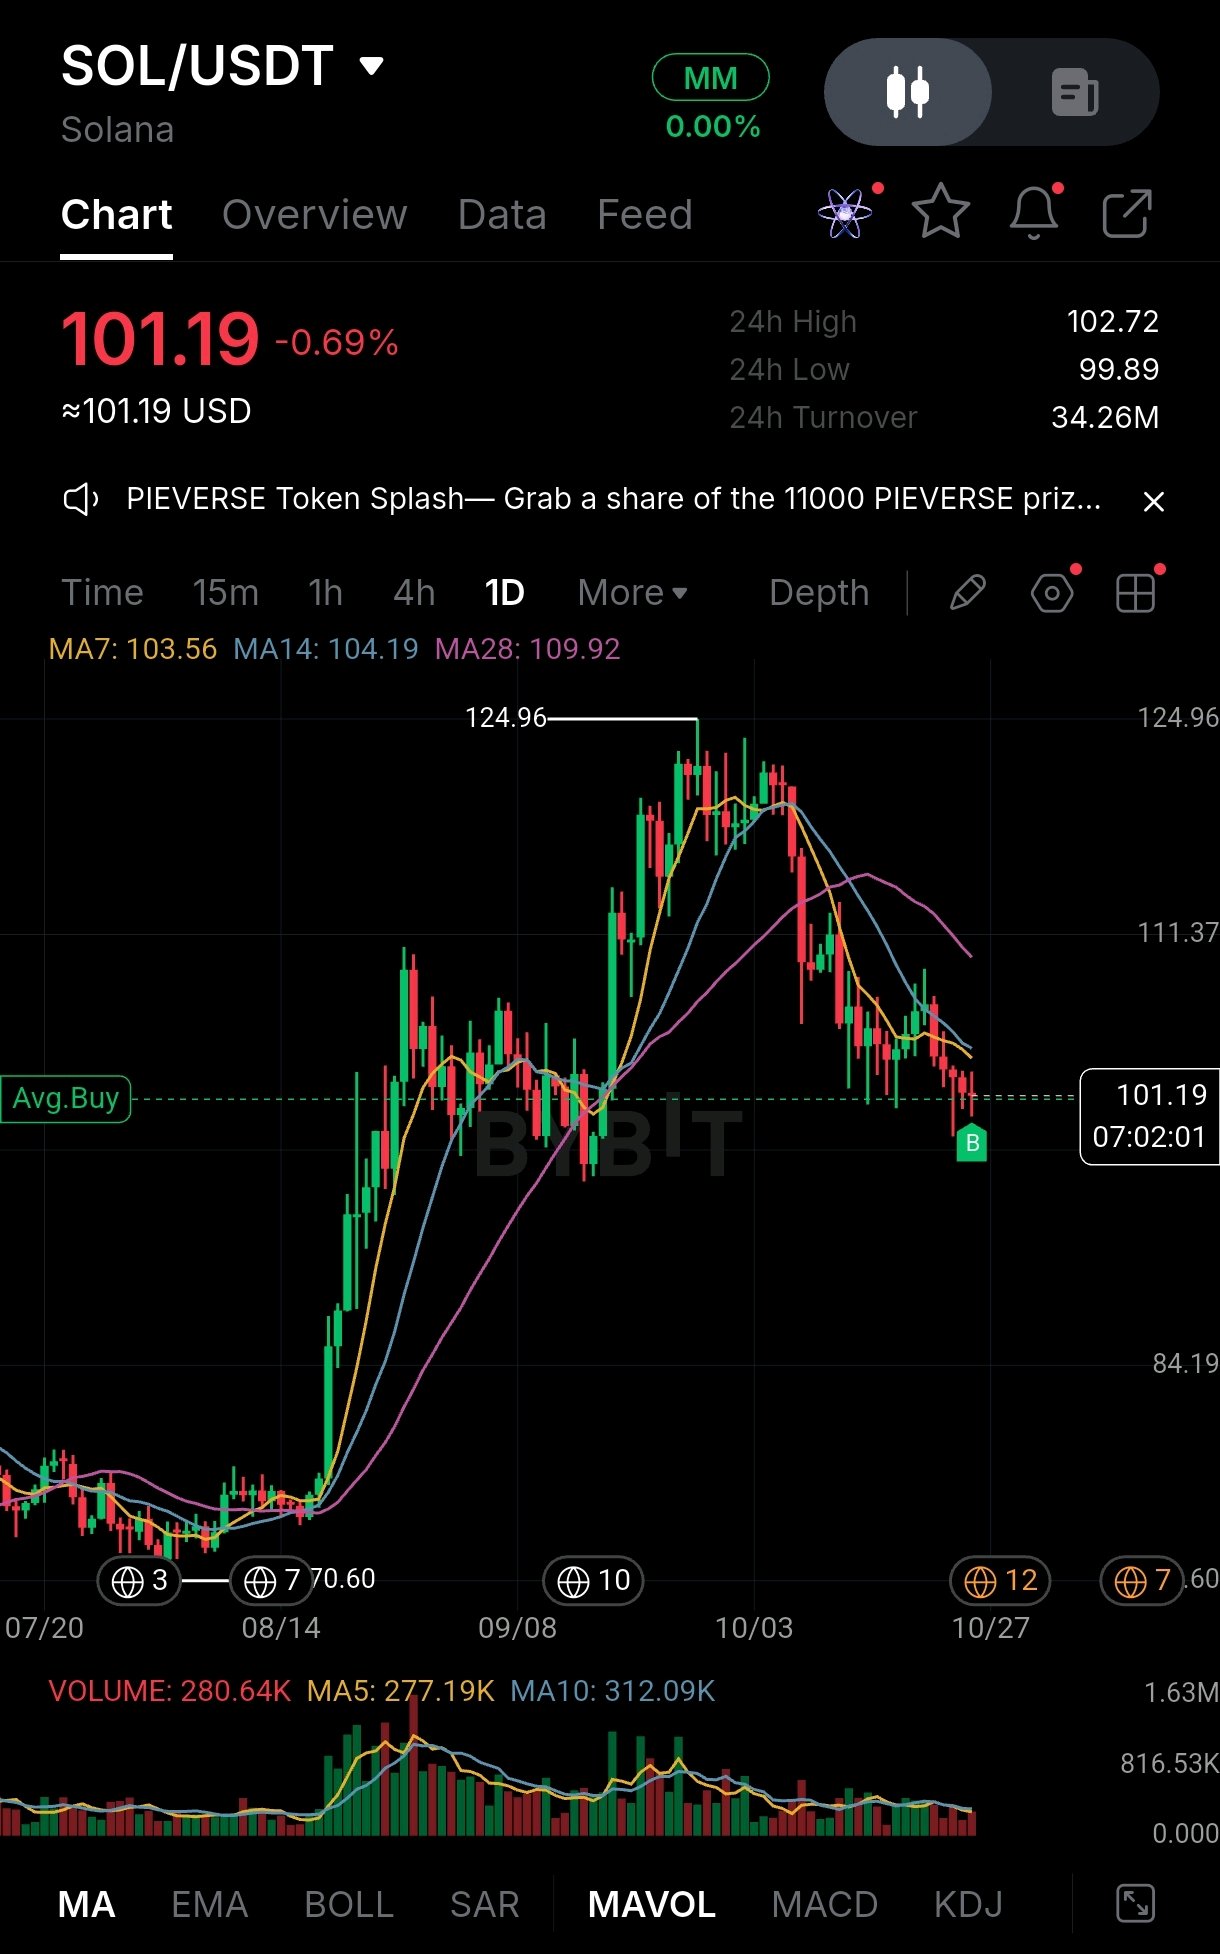
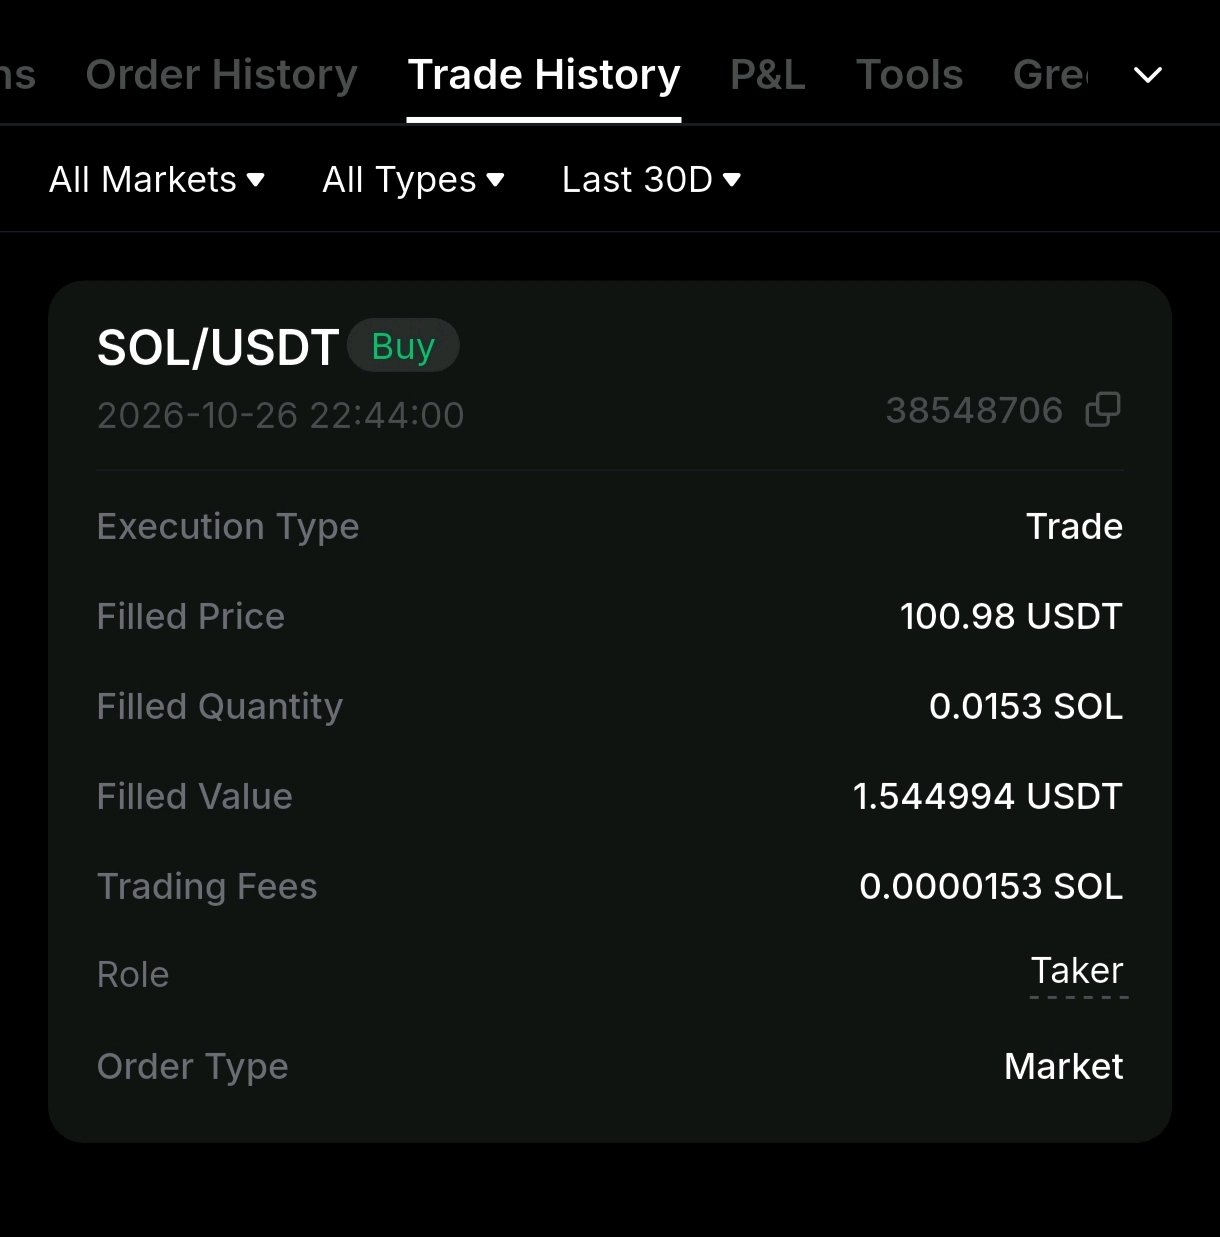
SOL/USDT: I bought the $100 floor with a market order. Is it holding? 🤔 I opened a spot long on SOL with a market order at 100.98, quantity 0.0153 SOL. My stop is 97.95 (about -3%). My first target is 107.04 (about +6%), a 2:1 reward-to-risk. The picture: damaged trend, but a floor is holding SOL trades near $102 today, below its daily 20 and 50 EMAs but still above its daily 200 EMA at $96.25. That’s a neutral setup with a bearish tilt, not a clean uptrend. The 14-day RSI sits around 43, under the neutral 50 line, so momentum is still weak. Why the $100 zone SOL fell 5.1% on Oct 12, then kept returning to the $100-$102 area: Oct 18 low at $100.62, Oct 23 low at $101.92. The daily first support sits at $100.26, right under my entry. Buyers defended $100 earlier this month and pushed price up to test the 50-day EMA. Where the sellers are SOL rejected at $107.45 on Oct 22 and dropped 3.2% that day. The Oct 21 intraday high was $108.26, which is the 50-day EMA area. That makes 107-108 my resistance zone, so my target of 107.04 sits just below it on purpose. Short term, price needs an hourly close above $102.62 to extend the rebound. My levels Entry: 100.98 Support: 100.26, then 100, then my stop at 97.95 Major support: daily EMA200 near 96.25 Target: 107.04, below the 107.45 to 108.26 resistance What could go wrong If 100 breaks on a daily close, the floor is gone and 97.95 is likely next, then the 96.25 EMA200. The daily structure is still damaged, so I’m not treating this as a trend trade. I’m trading a bounce off a tested floor. Honest critique of my entry A market order means I paid the spread and the taker fee. A limit order near 100.26 would have been a better price. The entry is still close to support, so the stop stays tight, but I chose speed over a cleaner fill. What I take away: A level that has held several times is better evidence than a guess, but it’s not a guarantee. Put the stop below the zone, not inside it. Set the target under resistance, not at it. I won’t move my stop just because price wobbles, and I won’t average down without confirmation. Conclusion: a tested floor is a reason to enter, not proof the floor will hold. I’m not predicting where SOL goes next. I’m watching whether buyers keep defending 100. #IMPACTbyTrade #MyByXTake #ByXIMPACT $SOLUSDT
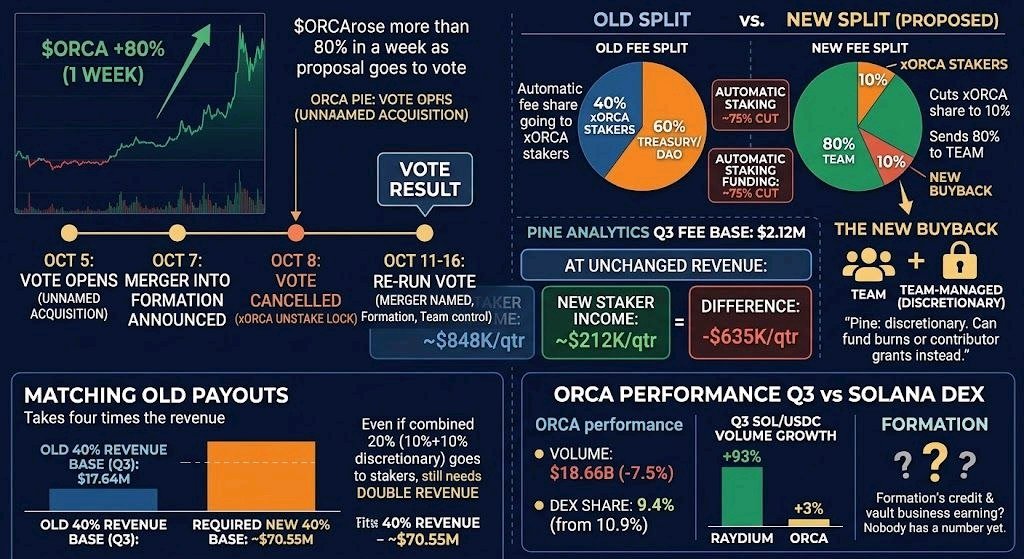
$ORCA rose more than 80% in a week as a proposal headlined by a new 10% buyback went to vote alongside the Loopscale merger, but the same proposal cuts the automatic fee share going to xORCA stakers from 40% to 10% and sends 80% of protocol fees to the team. Pine Analytics puts the Q3 fee base this split applies to at $2.12M, so at unchanged revenue, automatic staking funding falls by about $635K a quarter, a 75% cut. The new buyback sits in a team-managed account that Pine describes as discretionary, which means it can fund burns or contributor grants instead. Matching the old 40% payout under the new split takes four times the revenue, roughly $70.55M in quarterly swap fees against the $17.64M Orca reported for Q3. That was a quarter where volume fell 7.5% to $18.66B and Orca’s share of Solana DEX volume slipped from 10.9% to 9.4%, with Raydium’s SOL/USDC volume up 93% against Orca’s 3%. Even if the entire discretionary 10% went to staking, the combined 20% would still need double the revenue to match what stakers receive today. The vote itself changed shape halfway through. It opened October 5 with the acquisition target unnamed. Orca and Loopscale announced the merger into Formation on October 7, and the Council cancelled the vote on October 8 because xORCA holders couldn’t vote without a seven-day unstake that outlasted the five-day window. The re-run covered October 11 to 16 with the merger named. It also moves 14.2M ORCA, about 19.8% of supply, and 70,000 SOL into a team-controlled account, dissolves the Council, and leaves tokenholders voting on one thing, minting new ORCA. The buyback is the part the market priced. The 75% cut to stakers is in the proposal text, and what Formation’s credit and vault business will earn is the part nobody has a number for yet. #WSOT2026 #IMPACTbyTrade #MyByXTake #MidtermsMarketWatch #ByXIMPACT $XAUTUSDT $VELOUSDT
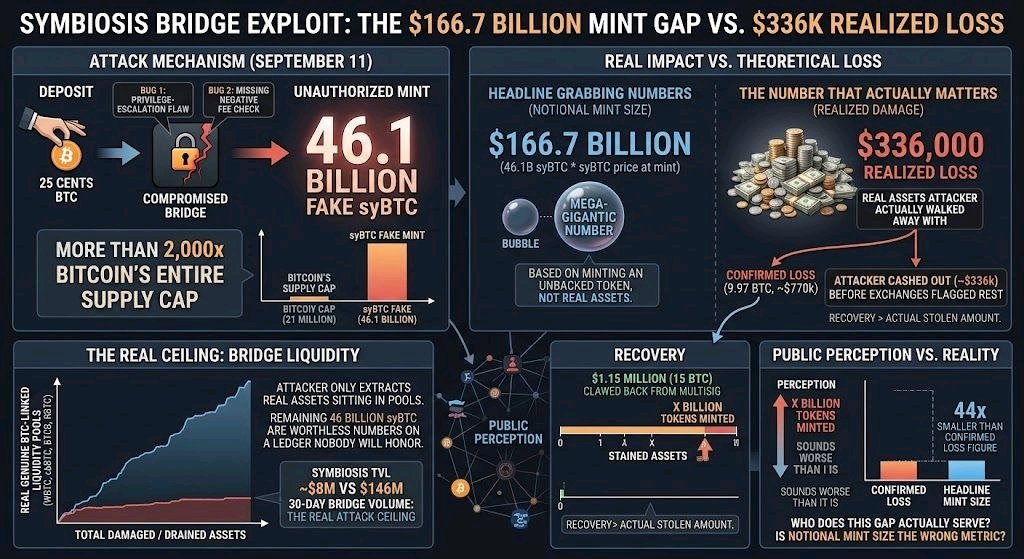
On September 11, an attacker deposited 25 cents worth of Bitcoin into Symbiosis's cross-chain bridge, chained two bugs together — a privilege-escalation flaw plus a missing check that let a transaction fee go negative — and minted 46.1 billion fake syBTC. That's more than 2,000 times Bitcoin's entire 21 million supply cap, generated from a quarter. The number that actually matters is nowhere near that. Symbiosis's confirmed loss sits at 9.97 BTC, about $770,000. The attacker only managed to cash out roughly $336,000 of it through Uniswap before exchanges and security firms flagged the rest. Then Symbiosis clawed back 15 BTC, about $1.15 million, from a team-controlled multisig — meaning the amount recovered may end up larger than what was actually stolen. The gap between those two numbers isn't a rounding error, it's the whole mechanism. Minting an unbacked token doesn't create real assets to redeem it with. The attacker could only extract value equal to whatever genuine BTC-linked liquidity was sitting in the pools they traded against — WBTC, cbBTC, BTCB, RBTC. Once that pool drains, the remaining 46 billion tokens are just numbers on a ledger nobody will honor. Symbiosis holds about $8 million in TVL against roughly $146 million in bridge volume over the past 30 days; that's the real ceiling the attacker was working against, not the theoretical supply of the token they minted. This isn't really a story about a badly-checked integer overflow, those happen. It's a story about how hack severity gets reported. "46 billion fake tokens" and "2,000x Bitcoin's supply" are the numbers every headline led with this week. The number that actually describes what happened to real users is 44x smaller than even the confirmed loss figure, and could shrink further once recovery efforts finish. If notional mint size is what shapes public perception of a bridge exploit rather than realized damage divided by available liquidity, every future headline-grabbing "X billion tokens minted" hack is going to sound worse than it is, almost by construction. Worth asking who that gap actually serves. #ByXIMPACT $BTCUSDT