CoinGru
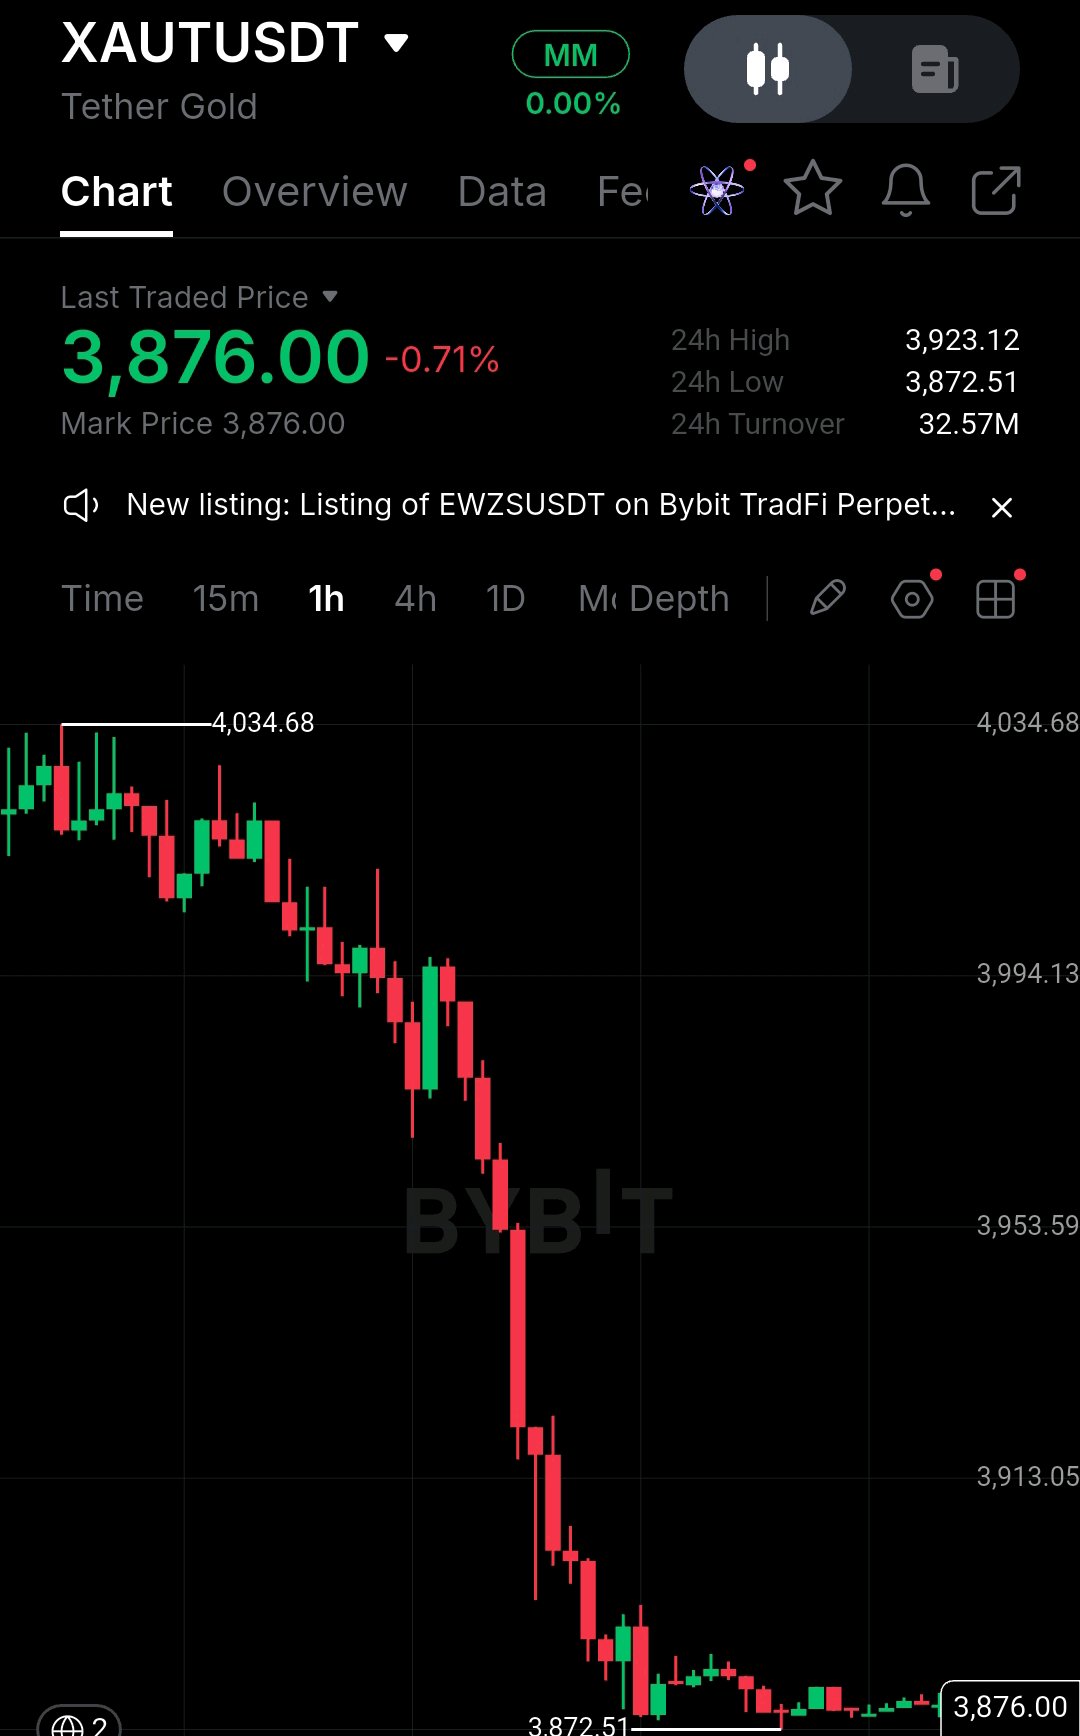
XAUT (Tether Gold): Sellers Are Still in Control, But Buyers Are Defending a Critical Support Zone I'm paying close attention to XAUTUSDT around $3,876 because the latest 1-hour chart shows a strong bearish move that has pushed price dangerously close to its 24-hour low of $3,872.51. What stands out is not just the speed of the decline, but how little recovery buyers have managed to produce afterward. The next important question is whether this support attracts genuine demand or becomes another level sellers eventually break. The Bigger Picture XAUT is different from ordinary cryptocurrencies. Tether Gold is designed to represent ownership of physical gold, with each XAUT token backed by one fine troy ounce of gold. This means its broader direction is closely connected to traditional gold-market conditions rather than Bitcoin sentiment alone. The US dollar, Treasury yields, inflation expectations, Federal Reserve policy, and safe-haven demand can all influence gold's direction. These factors deserve attention alongside the technical chart. Key Figures * Current Price: $3,876.00 * 24H Change: -0.71% * 24H High: $3,923.12 * 24H Low: $3,872.51 * 24H Turnover: 32.57M USDT * Immediate Support: $3,872.51 * First Resistance: $3,913.05 * Major Resistance: $3,953.59 * Higher Resistance: $3,994.13 ### Bullish Confirmation For buyers, defending $3,872.51 is the immediate priority. A successful bounce followed by a reclaim of $3,913 would be the first indication that selling pressure is easing. If momentum improves, $3,953.59 becomes the next important recovery level. A sustained move above it could open the door toward $3,994. Bearish Confirmation The bearish structure remains dominant after the aggressive sequence of lower highs and lower lows. A sustained hourly close below $3,872.51 would increase downside risk and suggest that buyers are losing their current support zone. A brief wick below this level would not be enough; I would want to see continued selling and a failed recovery. My Final Observation The next move in gold will depend on both technical demand and broader macroeconomic conditions, particularly dollar strength and interest-rate expectations. No specific upcoming catalyst is confirmed by the supplied information. For now, I'm not treating this consolidation as a confirmed reversal. XAUT needs to reclaim resistance before buyers can change the narrative. Until then, the support test remains the most important part of this chart. $XAUTUSDT #IMPACTbyTrade $HYPEUSDT

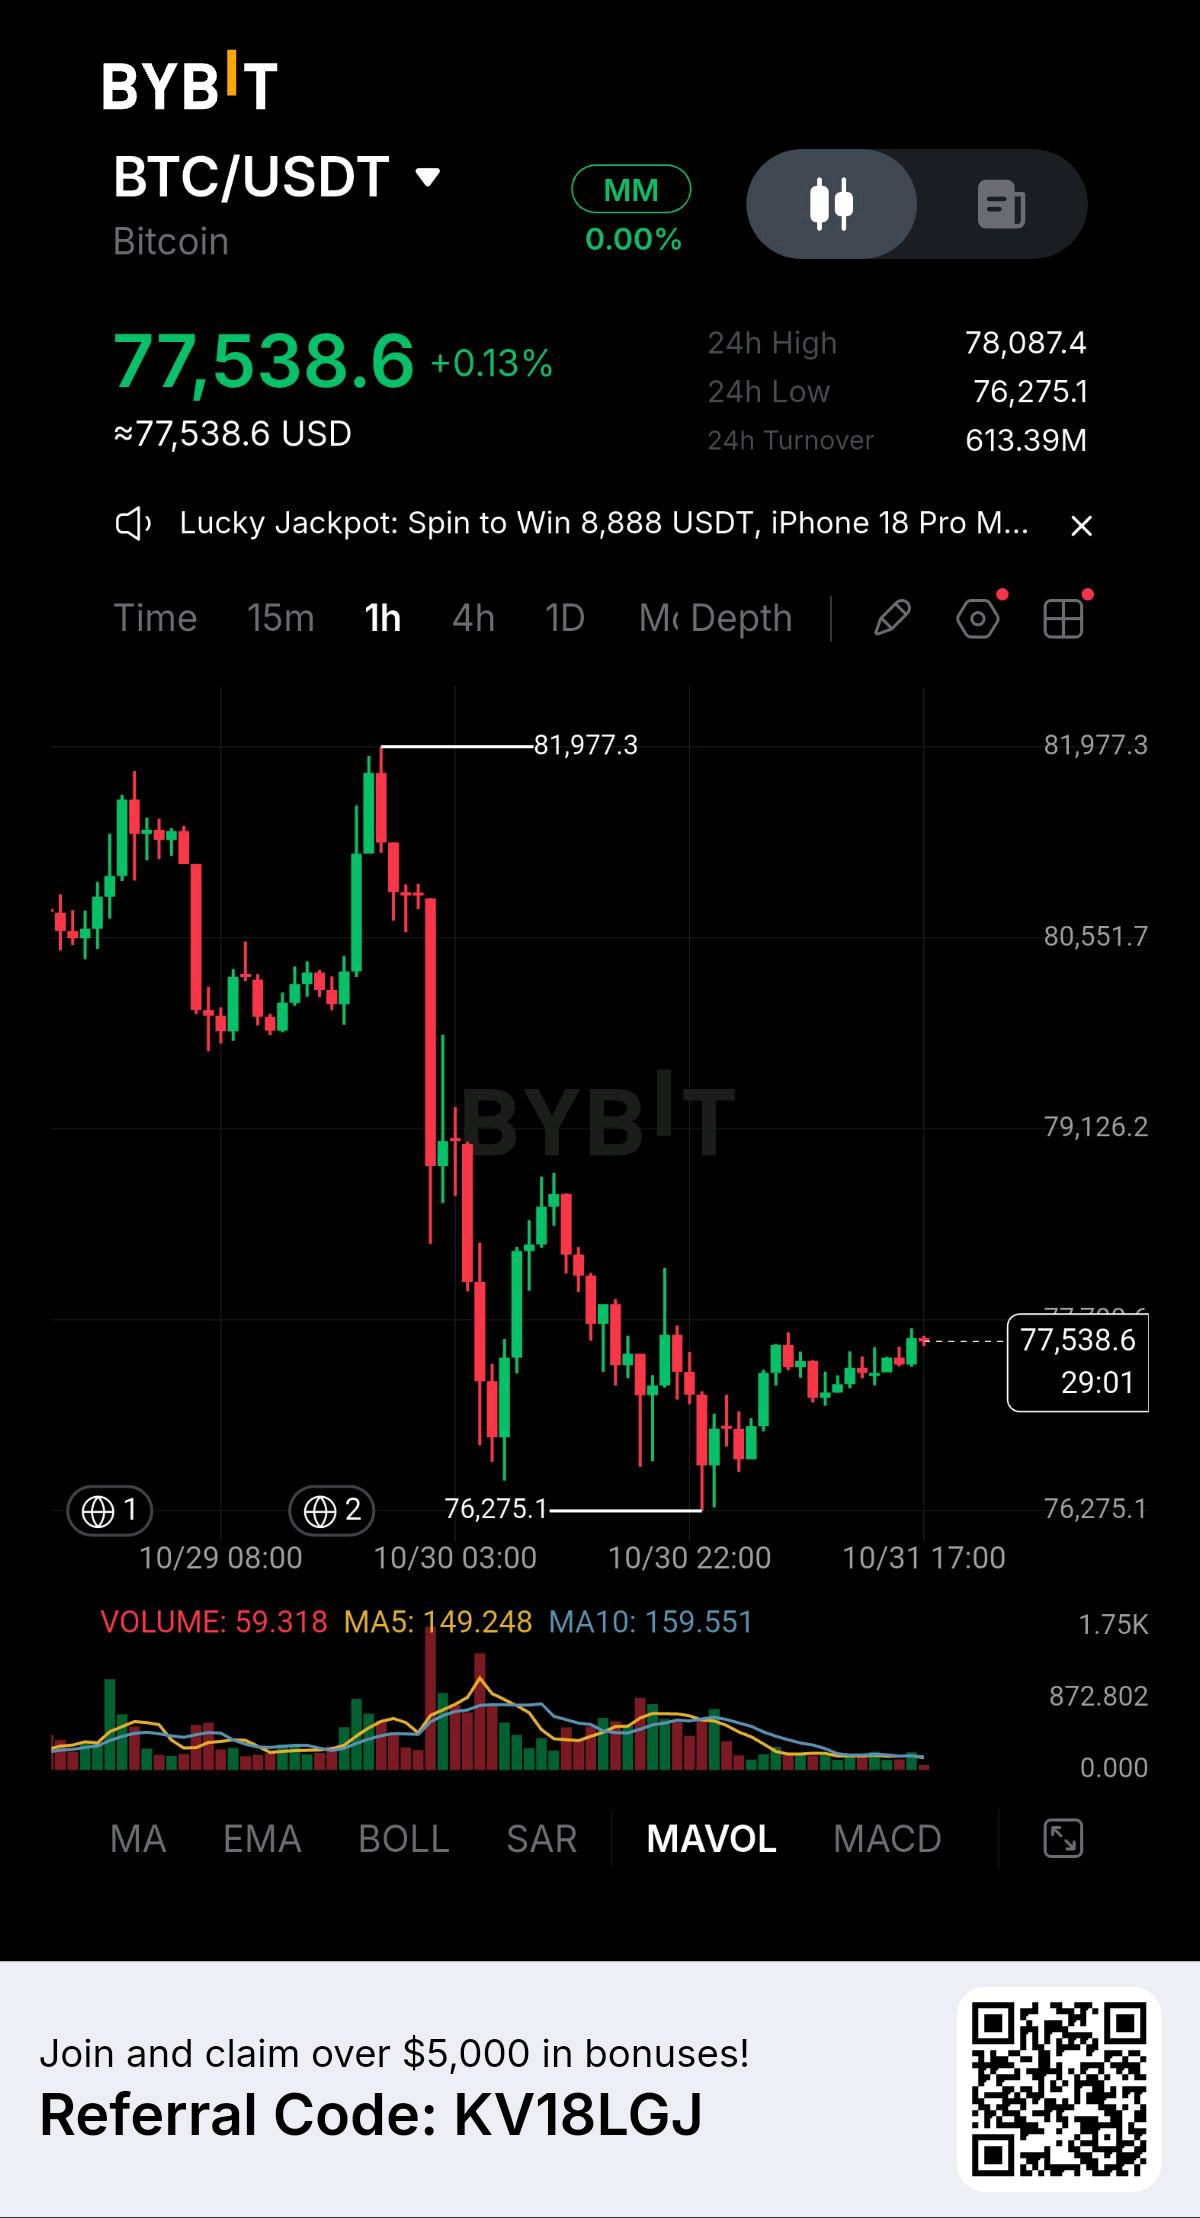
Bitcoin Is Compressing Near $77.5K — A Bigger Move Could Be Around the Corner! What caught my attention on the BTC chart is how quickly buyers recovered after the recent rejection. Bitcoin climbed to $78,087.40 on October 30 before dropping nearly 2.3% to $76,275.10. However, that weakness didn't last long. Buyers stepped back in and pushed the price toward $77,300. Since then, BTC has spent several hours moving sideways between $77,200 and $77,700. This isn't just random price action. Bollinger Bands have tightened to approximately 1.3%, while several short-term moving averages are converging around $77,350. Technically, there are a few encouraging signals. The Parabolic SAR remains below the current price, suggesting buyers still have some control. Meanwhile, MACD is gradually recovering from negative territory, hinting that bullish momentum could be building. Here are the levels I'm watching: - Entry Zone: $77,200–$77,400 - Stop Loss: $76,900 - Target 1: $78,087 - Target 2: $79,000 My preferred approach is to watch how BTC reacts around the $77,200–$77,400 support area. A successful hold could create an opportunity for another attempt at the previous high, followed by a potential move toward $79,000. However, compression doesn't guarantee an upside breakout. A decisive move below $76,900 would invalidate this bullish setup, so protecting capital matters more than chasing momentum. With October coming to an end, I'm watching closely for a volatility expansion. Would you rather buy this support zone or wait for a confirmed breakout above $77,700? Not financial advice. Always manage your risk. $BTCUSDT $ENAUSDT #ByXIMPACT
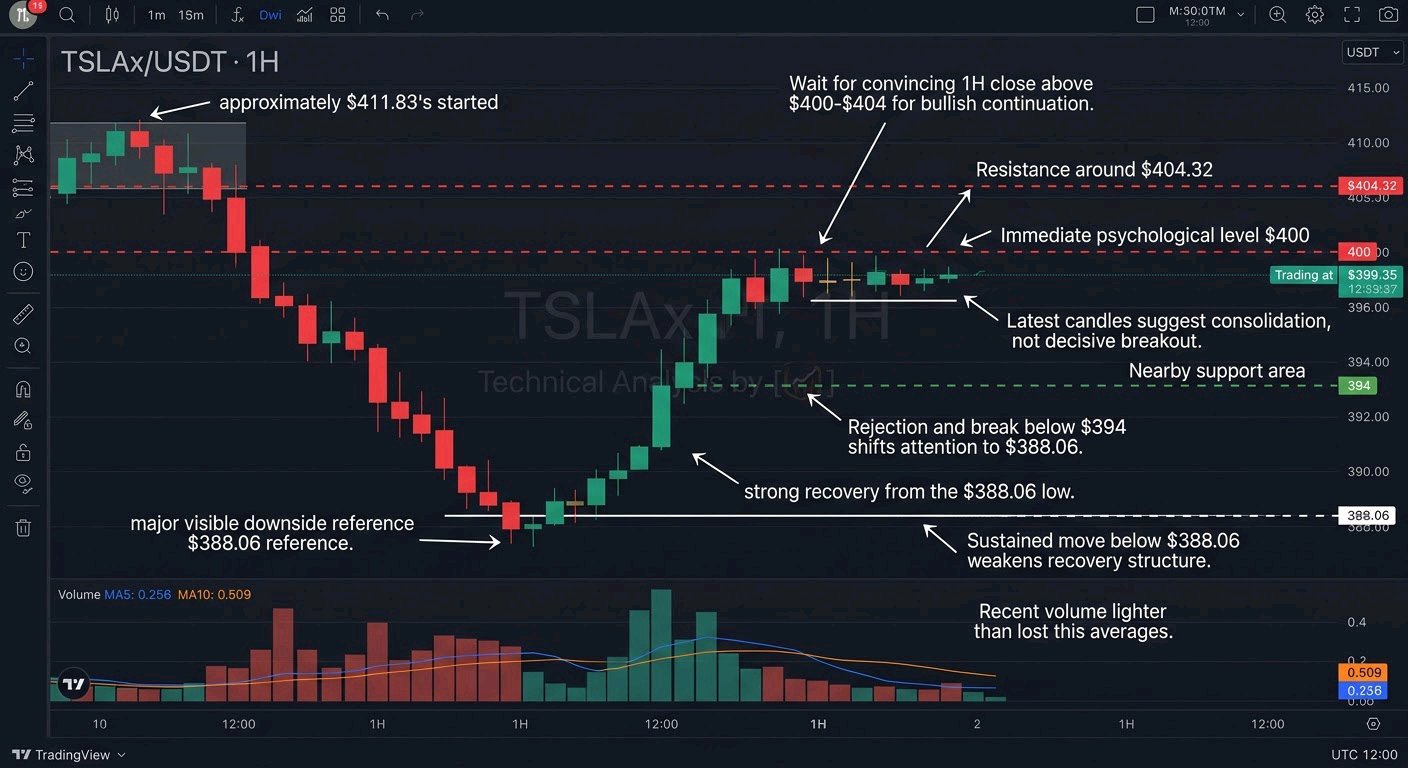
I’m watching TSLAx/USDT closely because the latest 1H candles are showing an interesting shift after a sharp downside move. What caught my attention is the strong recovery from the $388.06 low, followed by relatively tight price action around $399.35. Buyers have stepped in, but I’m not ready to call this a confirmed bullish reversal yet. Looking at the broader structure, TSLAx previously reached approximately $411.83 before losing momentum and moving lower. The price then tested the $388.06 area and bounced strongly. Currently trading at $399.35, up 1.28%, the market is attempting to stabilize. However, the recent recovery still needs confirmation from buyers. On the technical side, $394 is an important nearby support area, while $388.06 remains the major visible downside reference. On the upside, $400 is an immediate psychological level, followed by resistance around $404.32. The latest candles suggest consolidation rather than a decisive breakout. Volume MA5 is 0.256, while MA10 is 0.509, indicating that recent volume activity is relatively lighter than its 10-period average. I would avoid chasing green candles at this stage. Entering without confirmation could leave traders exposed to another rejection near resistance. My approach is to wait for a convincing 1H close above $400–$404 before considering a bullish continuation. A rejection followed by a break below $394 would shift my attention back toward $388.06. A sustained move below that low would weaken the recovery structure further. No precise entry, stop-loss, or take-profit levels are provided, so I wouldn't manufacture a trade setup or risk-to-reward ratio. Risk management comes first. This recovery is still developing, and protecting capital matters more than catching every move. My question: Can TSLAx break above $404.32 and attract fresh buying pressure, or are we about to see another rejection? $TSLAXUSDT $BTCUSDC #ByXIMPACT
AAVE Is Showing Signs of Another Bullish Move — Is $134.50 Next? AAVE caught my attention after spending hours in a tight consolidation range before buyers finally stepped in with stronger momentum. Price climbed from the $123 region and reached $132.23, supported by a series of bullish candles. What I find interesting is the reaction after that move. Instead of a sharp breakdown, AAVE pulled back toward $129 and found support around its short-term moving averages. Another positive detail is that volume cooled during the retracement, while the Parabolic SAR remained below price and MACD continued showing positive momentum. Key Levels I'm Watching: - Current Price: $130.25 - Entry Zone: $128.40–$129.60 - Stop Loss: $127.40 - TP1: $132.23 - TP2: $134.50 My view is that buyers still have an opportunity to extend this recovery, but reclaiming $132.23 would be an important confirmation. If momentum continues building, the $134.50 region becomes the next level to watch. I'm not interested in chasing green candles here. I'd rather wait for a controlled retest and clear confirmation before considering an entry. One thing I'm watching closely: can buyers defend $129 and push AAVE toward another local high? $AAVEUSDT $BCHUSDT #ByXIMPACT
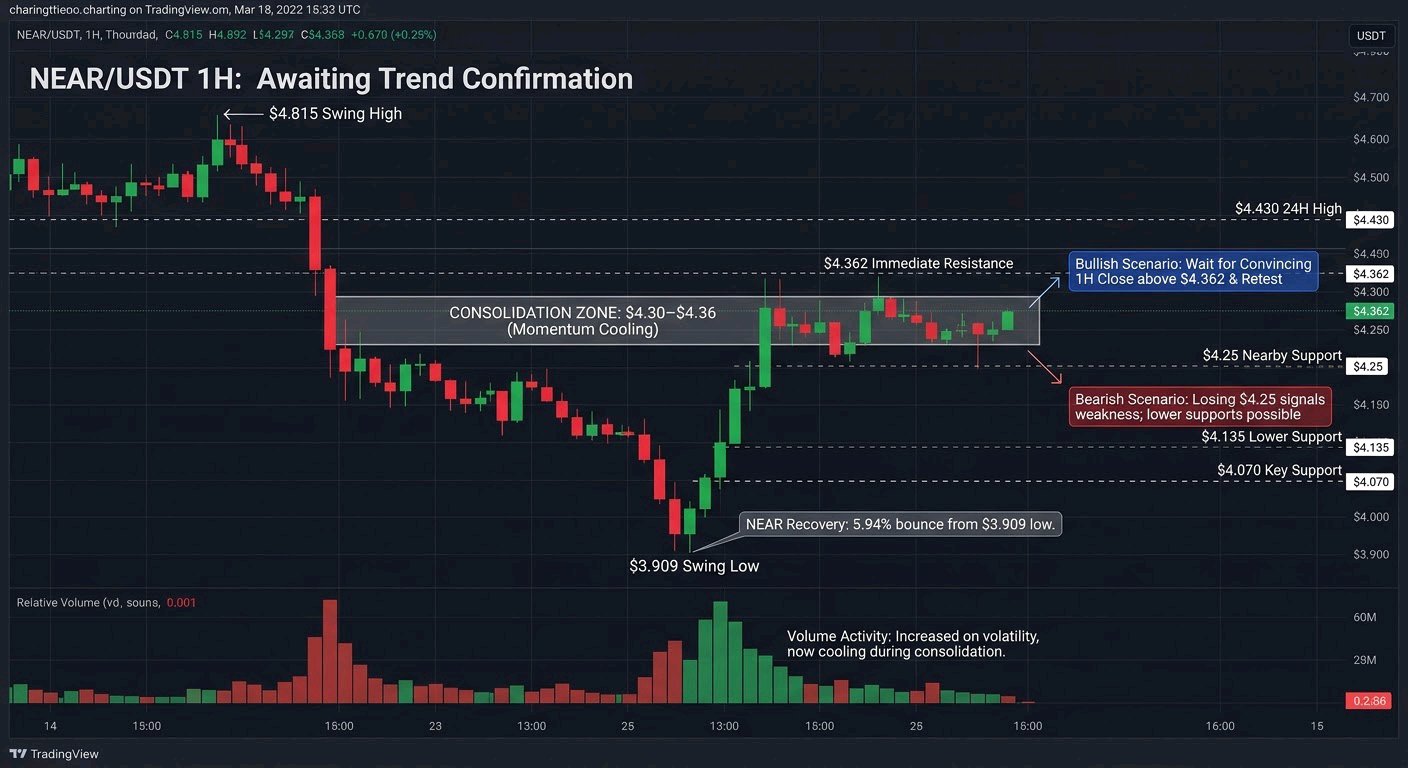
NEAR/USDT is showing signs of recovery, but I’m not ready to call this a confirmed trend reversal just yet. What caught my attention on the 1H chart is how aggressively buyers stepped in after NEAR dropped toward the $3.909 swing low. That recovery pushed price back to $4.316, bringing the pair approximately 5.94% higher. However, the bigger structure still deserves caution after the sharp decline from the $4.815 swing high. Right now, NEAR is consolidating around $4.30–$4.36. The immediate resistance sits near $4.362, followed by the 24H high around $4.430. On the downside, $4.25 is worth monitoring as nearby support, while $4.135 and $4.070 are important lower levels to watch. Volume activity increased significantly during the sell-off and subsequent rebound. However, recent candles suggest momentum is cooling as price moves sideways. I want to see stronger buying participation before treating this recovery as a sustained bullish move. I'm avoiding FOMO here. Entering simply because NEAR has printed a strong green move can be risky, especially when price is still struggling to break nearby resistance. My approach is to wait for a convincing 1H candle close above $4.362, ideally followed by a successful retest. That could strengthen the bullish case toward $4.430. If buyers reclaim that level with volume, further recovery becomes worth watching. On the other hand, losing $4.25 and then $4.135 would weaken the recovery structure and increase the possibility of another move toward lower support. I haven't identified a confirmed entry, stop-loss, or take-profit setup from this chart alone, so I'd rather wait than force a trade. Capital protection comes first. Do you think NEAR is preparing for another leg upward, or is this recovery simply a temporary bounce before sellers return? $NEARUSDT $BTCUSDT #ByXIMPACT
🚨 $HYPE EXPLODES AFTER MAJOR WALL STREET CONNECTION — IS $100 NEXT? Hyperliquid is attracting serious market attention after a major development connected to the New York Stock Exchange's parent company. HYPE has pushed higher, and the latest move could represent something bigger than a temporary speculative rally. The major catalyst is the agreement between Intercontinental Exchange (ICE) and Trade[XYZ] to develop regulated U.S. perpetual futures markets using Hyperliquid's infrastructure, subject to regulatory approval. This could open a new connection between traditional financial markets and decentralized trading. 📊 MARKET SNAPSHOT • HYPE price: Around $92.11 • 24H change: +4.31% • 7D performance: +18.88% • Market capitalization: $21.94B • 24H trading volume: $5B • Open interest: $2.38B • Previous ATH: $97.96 🔍 IMPORTANT PRICE LEVELS The bulls have gained momentum, but the next resistance zone will be important. 🟢 Bullish Levels - $92.83 — Immediate resistance - $97.96 — Previous all-time high - $100.00 — Major psychological target 🔴 Support Levels - $88.35 — First support - $85.00 — Important recovery zone - $82.00 — Deeper downside reference 🚀 WHAT COULD DRIVE THE NEXT MOVE? Institutional exposure, expanding trading infrastructure and Hyperliquid's growing ecosystem are important developments. However, the upcoming unlock of approximately 9.92 million HYPE tokens on November 6 is another factor traders should monitor. MY TAKE: HYPE has a strong narrative behind its latest move, but I don't want to confuse a news-driven rally with a confirmed long-term breakout. If buyers maintain momentum and push through $97.96, the $100 psychological level could become the next major target. On the other hand, losing $88 could invite profit-taking and a deeper correction. The real test is whether HYPE can turn institutional attention into sustained market demand. $100 is getting closer, but confirmation matters more than excitement. 👀 #IMPACTbyTrade $HYPEUSDT $BTCUSDT
NVIDIA & ANTHROPIC: A POTENTIAL $100 BILLION IPO THAT COULD SHAKE THE AI MARKET The AI industry may be approaching another major milestone, and this time, NVIDIA could be right at the center of it. Anthropic's potential IPO is attracting serious attention as reports point to NVIDIA considering an investment of up to $10 billion. With a possible fundraising target of $100 billion, this could become one of the biggest public offerings the technology sector has ever seen. But the interesting part isn't just the size of the deal. It's the valuation debate happening behind the scenes. 📊 THE NUMBERS THAT MATTER - $10B: Potential NVIDIA investment. - $100B: Reported IPO fundraising target. - $1.5T: Valuation some investors are reportedly considering. - $2T: Earlier valuation expectations. - $16.8B: Anthropic's reported Q3 revenue. - 45%: Reported quarterly revenue growth. - $518B: Estimated long-term commitments for cloud computing and infrastructure over a decade. WHY NVIDIA'S INVOLVEMENT MATTERS NVIDIA isn't just another potential investor here. Its chips power much of the infrastructure behind modern AI development, while Anthropic is building increasingly powerful AI models through Claude. A major investment could strengthen the connection between AI hardware and AI software, two sectors becoming increasingly dependent on each other. THE VALUATION QUESTION Anthropic's reported valuation expectations have reportedly shifted from around $2 trillion toward $1.5 trillion among some investors. That difference is significant. Even with impressive revenue growth, investors still need to consider infrastructure expenses, competition and the enormous capital required to remain competitive in AI. GROWTH VS. EXPENSIVE INFRASTRUCTURE The reported $16.8 billion in Q3 revenue and 45% quarter-over-quarter growth suggest strong commercial momentum. However, the estimated $518 billion in long-term infrastructure commitments raises another question: how much capital will it take to maintain that growth? MY TAKE I'm watching this development beyond the IPO headlines. NVIDIA, Amazon, Google and Microsoft all have important roles in the AI infrastructure ecosystem. If Anthropic successfully enters the public market at a strong valuation, it could influence how investors price the entire AI sector. But a massive valuation doesn't automatically make a company a good investment. The real test will be whether revenue growth can justify the cost of building the future of AI. Do you think Anthropic deserves a $1.5 trillion valuation, or has the AI market become too optimistic? $NVDAXUSDT $HYPEUSDT #ByXIMPACT
$BEAM is moving aggressively, and the recent price action has definitely caught my attention. A 36% rally is impressive, but I don't think chasing a move like this is the smartest decision right now. On the 1H chart, BEAM has climbed from around $0.0032 to $0.0047 in a short period. Buyers are clearly in control, but RSI near 96 suggests the market is extremely overheated. After such a sharp move, some cooling off or profit-taking wouldn't surprise me. I'm keeping an eye on the EMA7 around $0.004371. If price pulls back and buyers manage to defend this area, it could offer a better opportunity to enter. The EMA14 near $0.004065 is another important level I'm watching. My approach is simple: no FOMO, no emotional entries. I'd rather miss part of the move than jump in at the wrong time. If BEAM loses these support levels, I'll reassess the setup instead of trying to predict a reversal. And if buyers continue pushing higher, I'll wait for confirmation before making a decision. Strong momentum is exciting, but protecting capital always comes first. Are you still bullish on $BEAM, or do you think a correction is coming? #ByXIMPACT $BEAMUSDT $BTCUSDT
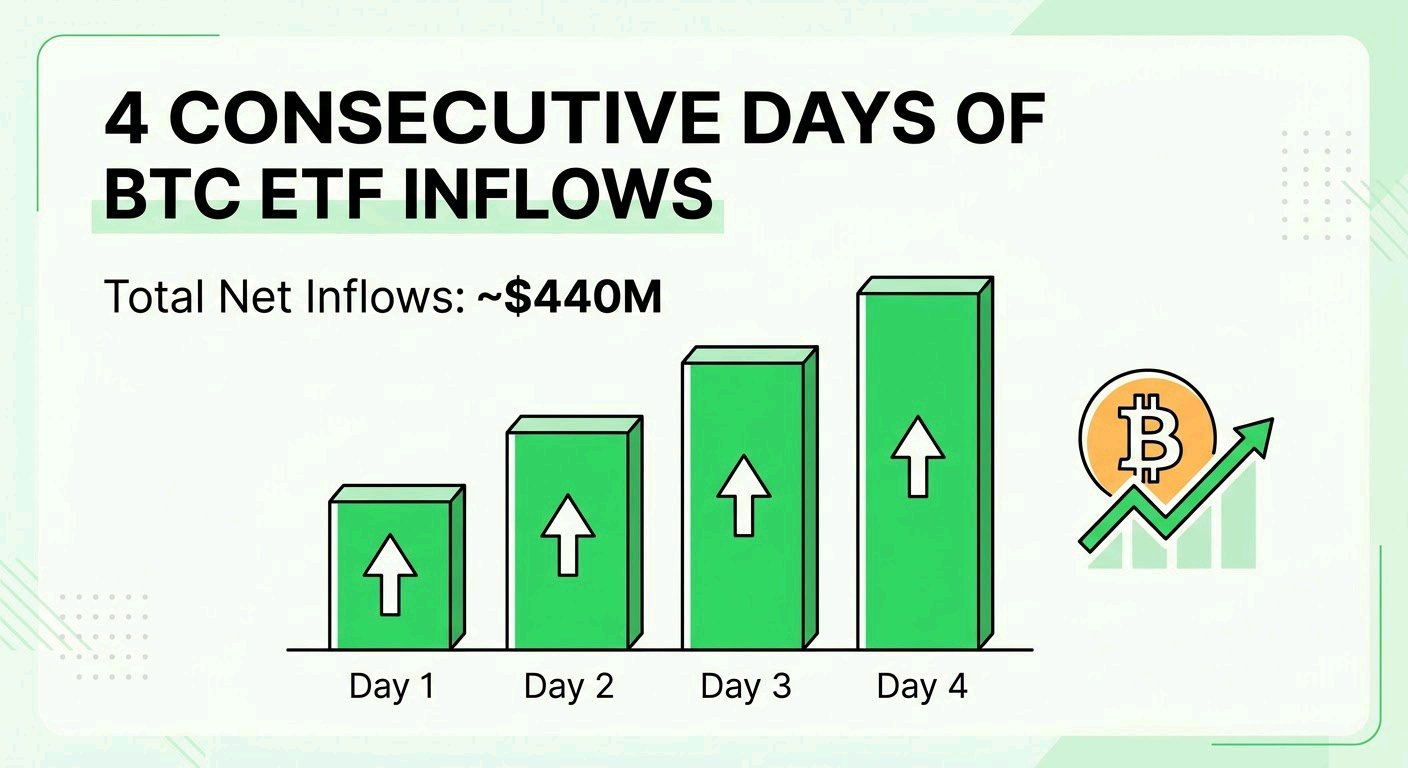
Bitcoin ETFs See 4 Straight Days of Inflows Is Institutional Confidence Returning? Something interesting is happening in the Bitcoin ETF market. U.S. spot Bitcoin ETFs have recorded four consecutive days of net inflows, with approximately $17.2 million entering the funds on October 29. Here's a closer look at the latest activity: - 4-Day Inflow Streak: Total cumulative inflows have reached approximately $440 million since October 26. - BlackRock IBIT: Recorded around $12.8 million in fresh inflows. - Fidelity FBTC: Added approximately $10.5 million. - Grayscale BTC: Experienced $15.3 million in net outflows. What Does This Mean for Bitcoin? The continued inflows suggest that institutional interest may be gradually returning. However, there's an important detail worth watching: the latest daily inflow was considerably smaller than the previous three sessions. This could indicate that buying momentum is cooling, even though the overall flow trend remains positive. My Perspective: I'm watching whether this institutional demand can translate into stronger and more sustainable price action for Bitcoin. Four consecutive days of inflows are encouraging, but confirmation requires consistency rather than a temporary improvement. The big question is: Are institutional investors preparing for Bitcoin's next major move, or are we simply witnessing a short-term recovery in ETF demand? What's your take on BTC right now? $BTCUSDT $SOLUSDT #ByXIMPACT
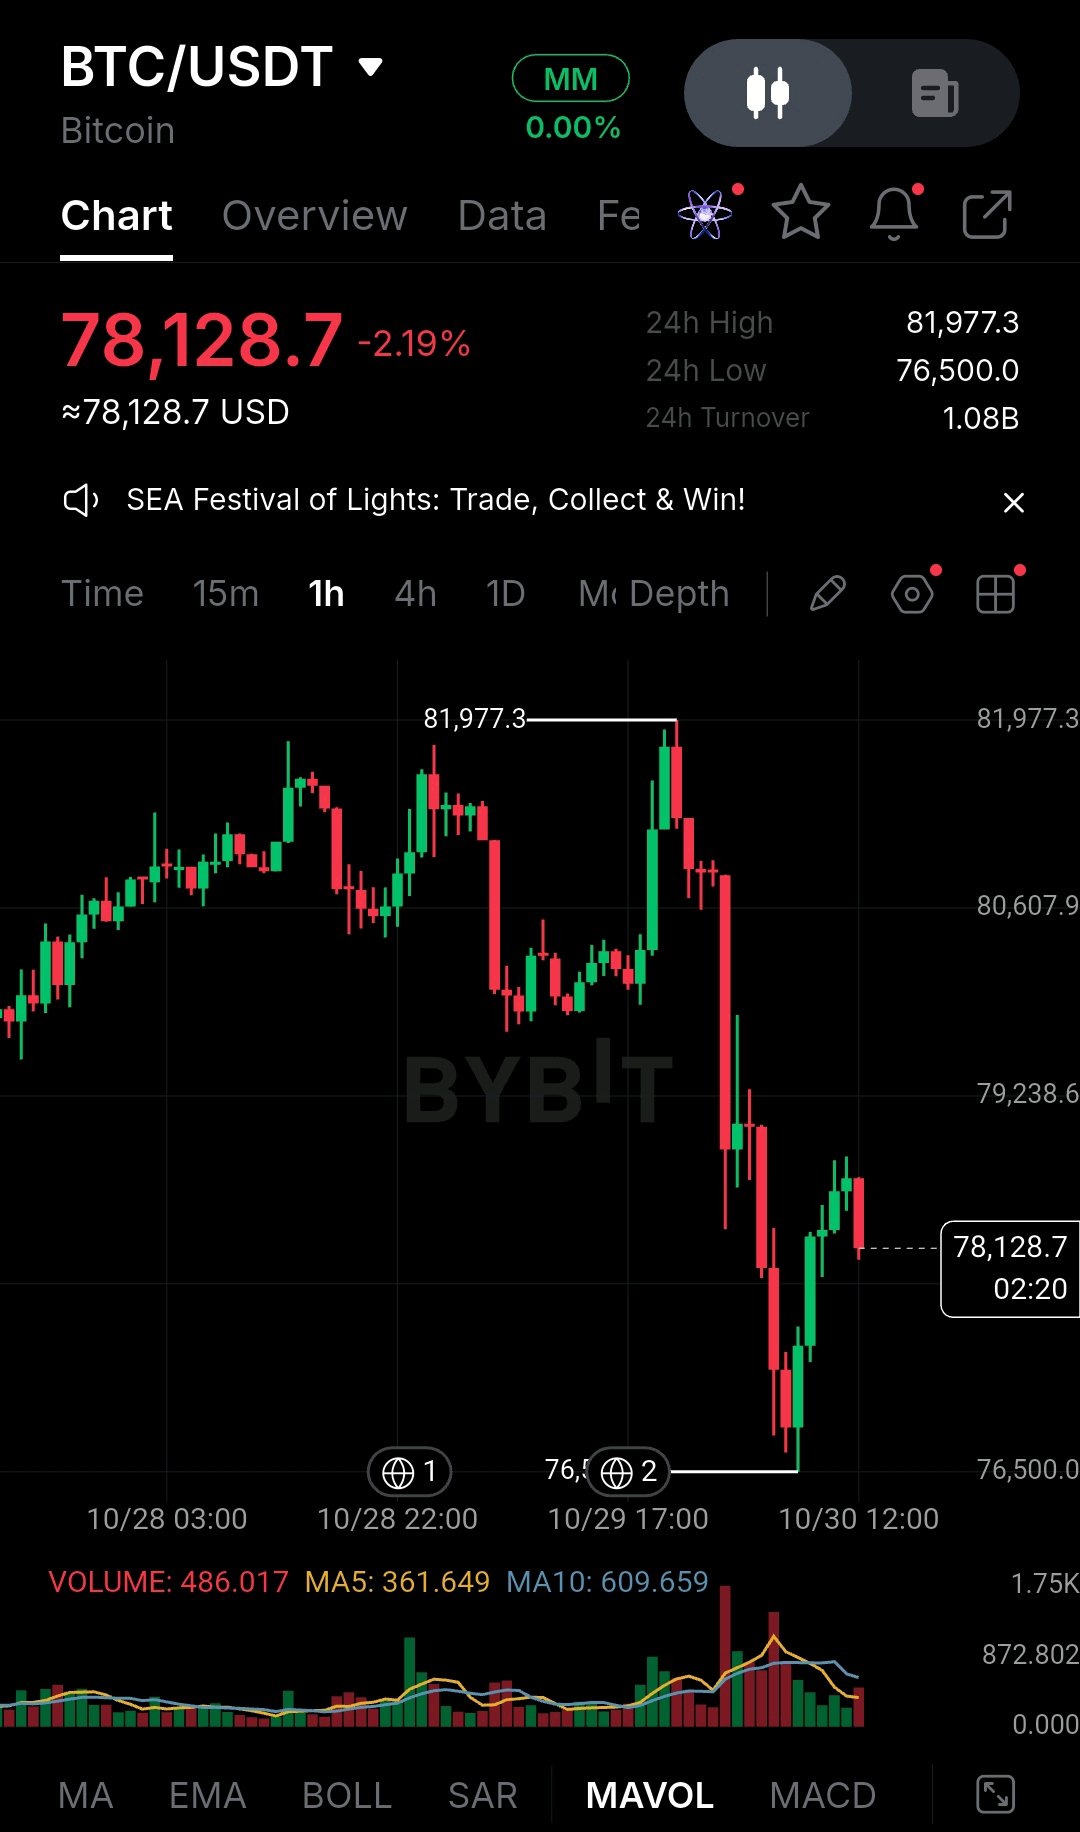
I keep coming back to how violent that flush on the 1h BTC/USDT chart was. Price dropped from the 81,977.3 high to the 76,500.0 low in a handful of candles, and the bounce since then has been much slower than the fall. Right now Bitcoin sits around 78,128.7, down 2.19% on the day. The earlier structure was a series of higher highs that peaked near 81,977.3, followed by a sharp rejection. The recovery has retraced part of the drop, but the latest candle is red, so buyers haven't taken control yet. On the indicator side, the volume spike on the sell-off was the heaviest in the window, which suggests real distribution rather than a quiet drift lower. Current volume is 486.017, between its MA5 (361.649) and MA10 (609.659), so participation is fading as the bounce develops. Support is the 76,500.0 low. Resistance stacks up at 79,238.6, then 80,607.9, then the 81,977.3 high. After a drop like this, a green candle can feel like the bottom is in. Chasing one without confirmation is how traders end up buying right into overhead supply. The bounce could easily be a relief rally inside a larger pullback. A conditional setup from the levels above: entry on a hourly close back above 79,238.6, stop below 76,500.0, targets at 80,607.9 and 81,977.3. That is about 2,739 points of risk against roughly 1,369 to the first target (0.5:1) and 2,739 to the second (1:1). That ratio is not attractive, so I'd rather wait for a pullback that gives a tighter stop. Confirmation would be a clean reclaim of 79,238.6 with expanding volume. Invalidation is a break below 76,500.0, which would expose the downtrend again. None of this is certain, and protecting capital matters more than catching every move. Size small and respect your stop. Do you see the 79,238.6 area as the level that decides this recovery, or do you expect another test of 76,500.0 first? $BTCUSDT $HYPEUSDT #ByXIMPACT
🚨 WLFI AT A CRITICAL TURNING POINT — CAN BUYERS PREVENT A NEW LOW? WLFI is facing a crucial test around $0.0505 as its price approaches the $0.0500 psychological support zone. While bearish momentum continues to pressure the market, a significant security development has brought fresh attention to the project. According to reports, Ripple and World Liberty Financial helped freeze approximately $27 million in assets connected to a suspected Binance hot-wallet security incident. This cooperation highlights the importance of cross-platform security coordination, although it does not automatically resolve investor concerns surrounding WLFI. 📊 MARKET OVERVIEW • Current price: $0.05052 • 24H change: -2.6% • 7D change: -4.3% • Market cap: $1.61B • 24H volume: $42.3M • Circulating supply: 31.78B WLFI • Maximum supply: 100B WLFI 🔍 IMPORTANT PRICE LEVELS The immediate battle is happening around $0.0500. 🟢 Resistance levels: - $0.05215 — First recovery target - $0.05486 — Major upside barrier - $0.05800 — Potential extended recovery target 🔴 Support levels: - $0.05000 — Critical psychological support - $0.04828 — Previous all-time low Another concern is the removal of the WLFI/U cross-margin trading pair on October 30. This could reduce one avenue for leveraged trading, although it does not mean all WLFI markets are shutting down. Meanwhile, perpetual open interest stands near $413.5M, with positive funding around +0.0099% every eight hours. Heavy derivatives exposure compared with spot activity could increase volatility and liquidation risks. 🚀 BULLISH SCENARIO If buyers defend $0.0500 and reclaim $0.05215 with stronger spot demand, WLFI could attempt a move toward $0.05486 and potentially $0.0580. ⚠️ BEARISH SCENARIO A decisive breakdown below $0.0500 could expose $0.04828, especially if leveraged longs begin unwinding. MY TAKE: WLFI is at a sensitive market junction. The reported $27M asset freeze is a notable security development, but price action, liquidity and investor confidence will ultimately determine the next move. The real question is simple: Will buyers defend support, or will WLFI print another low? Keep watching the $0.0500 level. The next move could be decisive. 👀 $WLFIUSDT $MNTUSDT #ByXIMPACT
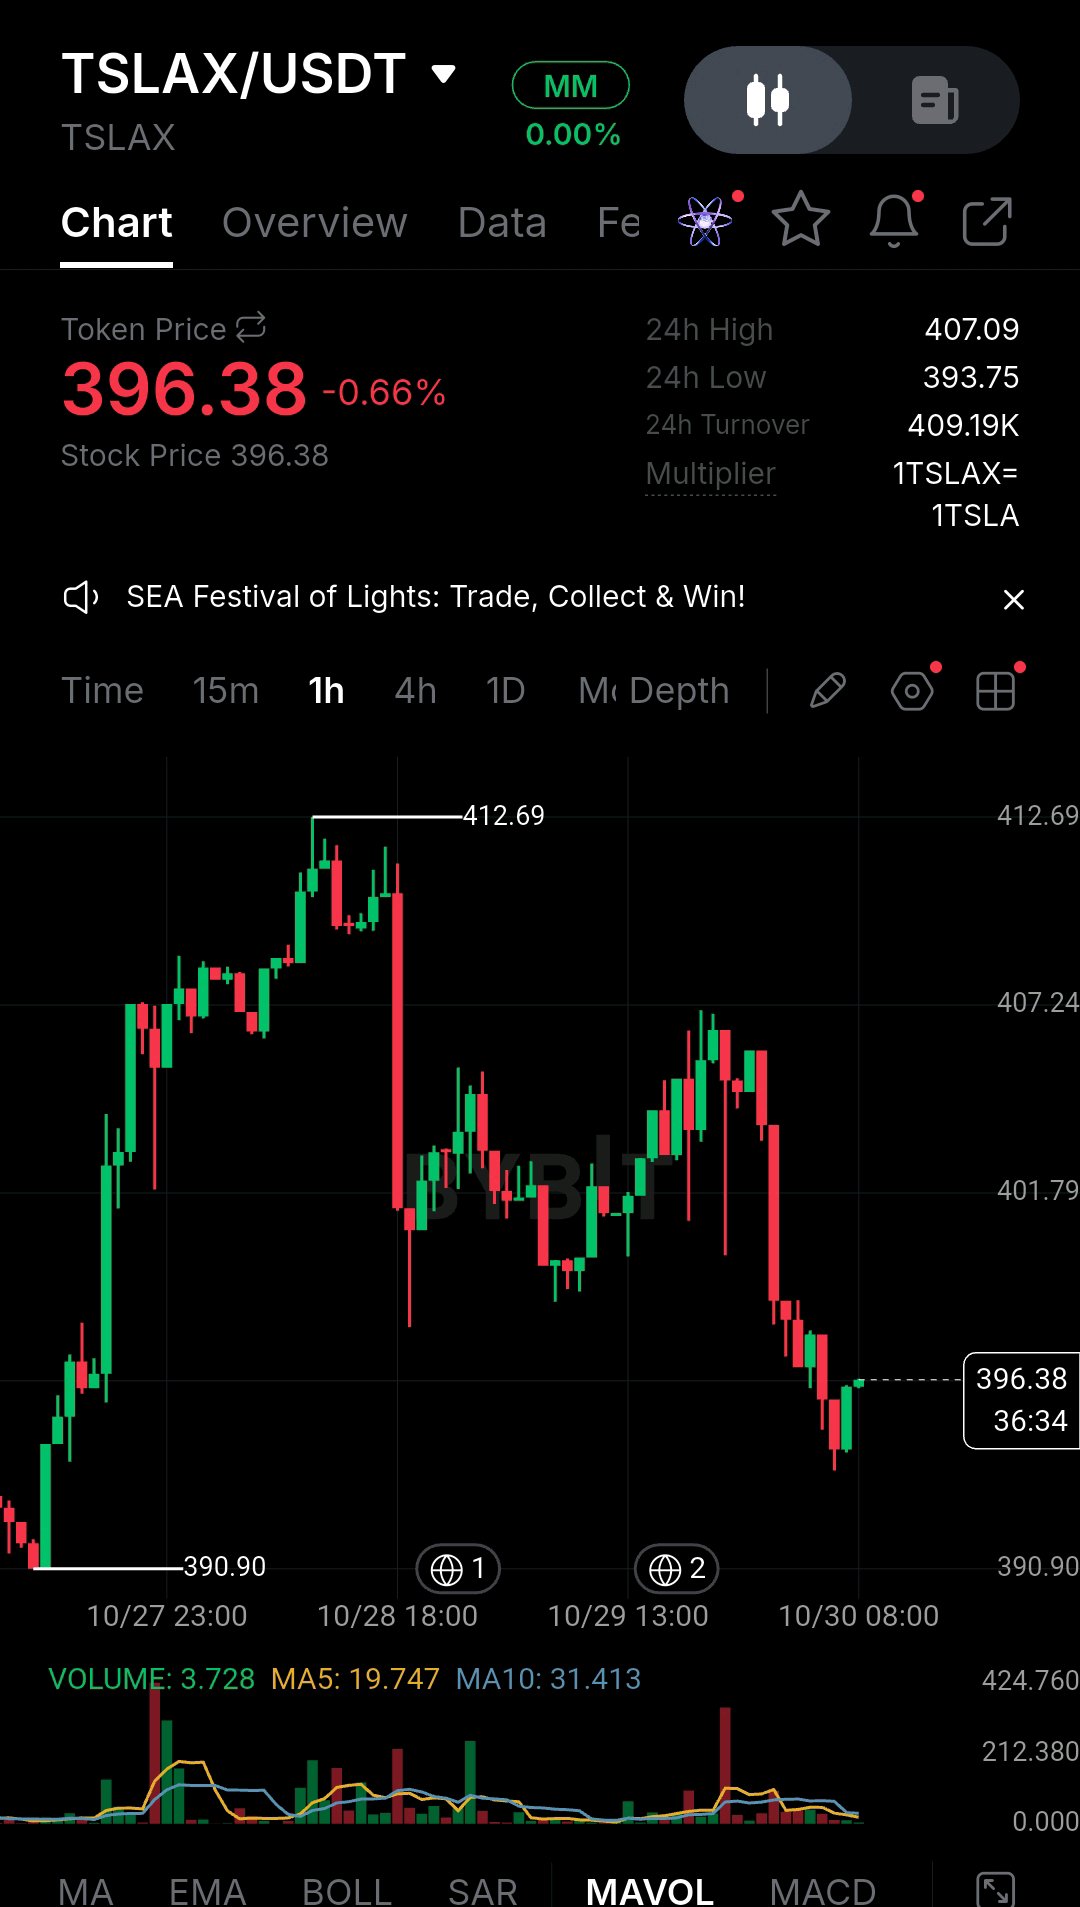
I’ve been watching the TS LAX/USDT 1-hour chart, and what stands out to me is the sharp rejection from the 407–412 resistance area followed by a steady decline. The recent bounce near 393.75 is interesting, but buyers still need to prove they can regain control. TSLAX is currently trading around 396.38, down 0.66%. After reaching a swing high of 412.69, price experienced a strong bearish move and lost the 401.79 area. The current structure suggests short-term weakness rather than a confirmed bullish reversal. However, the reaction near the 393.75–390.90 support zone shows that buyers are attempting to defend lower prices. Volume also deserves attention. The latest reading is 3.728K, compared with MA5 at 19.747K and MA10 at 31.413K. This suggests the current recovery lacks strong volume participation. No moving-average crossover or MACD confirmation is visible, so I would avoid assuming momentum has shifted. Personally, I would not chase this small green recovery. A possible bullish setup would require price to reclaim 398–400 and hold that zone on a successful retest. An aggressive entry could be considered around 398–400 after confirmation, with a protective stop near 393.00 and potential targets at 401.79 and 407.24. At a 399 entry and 393 stop, the approximate risk-to-reward ratios are 0.47:1 for the first target and 1.37:1 for the second. These levels are conditional, not confirmed signals. If price loses 393.75, the bullish scenario weakens considerably, while a break below 390.90 would invalidate the support-based recovery idea. On the other hand, a strong hourly close above 401.79 with improving volume would provide better evidence of a recovery. Risk management remains essential because a bounce after heavy selling can easily turn into another rejection. Do you think TSLAX can reclaim 400, or will sellers push it back toward 390.90? $TSLAXUSDT $BTCUSDT #ByXIMPACT
ONDO Price Analysis: Can Buyers Turn the Tide?
I’m keeping a close eye on ONDO as it trades around the $0.40 level. What stands out to me is the contrast between Ondo’s expanding tokenization ecosystem and the weakness currently visible on the price chart. The project continues to develop its presence in tokenized traditional assets, but the market still needs clear evidence that this progress can translate into sustained demand for the ONDO token. From a technical perspective, the $0.402 area is the first support level I’m watching, followed by stronger support near $0.396. If sellers push the price below this zone and buyers fail to recover it, the next downside area to monitor would be around $0.380. On the other hand, a recovery above $0.412 could provide some relief, while a decisive move beyond $0.422 would offer a stronger bullish signal. If momentum improves, the $0.439–$0.453 region could become the next potential target. Fundamentally, Ondo’s involvement in institutional tokenization initiatives and the expansion of tokenized assets across blockchain networks support its long-term narrative. However, ecosystem adoption and demand for the governance token are not necessarily the same thing. Investors should also monitor the token’s circulating supply and the substantial unlock expected in January 2027, as anticipated supply increases may influence market sentiment before the actual release. Derivatives data deserves attention as well. Positive funding rates indicate that long positions are paying shorts, while declining open interest may reflect reduced leveraged exposure. Neither metric independently confirms a reversal. My strategy: I would remain cautious until ONDO establishes support and reclaims resistance with convincing buying volume. A sustained break above $0.422 would strengthen the recovery scenario, whereas a confirmed loss of $0.396 would increase downside risk. For now, patience and price confirmation matter more than speculation. $ONDOUSDT $MNTUSDT #ByXIMPACT
UNI Bulls Are Fighting Back — Is a Trend Reversal Coming? 📈 I’ve been watching UNI closely, and what caught my attention is the strong recovery from the 6.915 support area. Buyers stepped in aggressively, pushing the price toward 7.197. This rebound looks promising, but I’m not calling it a confirmed reversal just yet. On the 4-hour chart, UNI is approaching an important technical decision zone. The price is testing the EMA cluster, which could determine whether bullish momentum continues or sellers regain control. Here’s what I’m watching right now: Momentum Is Improving: The MACD has formed a bullish crossover, suggesting that buying pressure is increasing. If the histogram continues expanding, it could support another upward move. RSI Shows Room to Move: The RSI is around 58.49, indicating positive momentum without entering overbought territory. This leaves room for buyers to push higher, although momentum can change quickly. The Key Resistance: The 7.337 level is my main area of interest because the Parabolic SAR is positioned nearby. A strong 4-hour candle close above this level would provide a more convincing bullish confirmation. My Trading Plan 🎯 I would watch for a confirmed breakout above 7.337 before considering a bullish continuation toward 7.355 and potentially higher levels if momentum remains strong. On the downside, 7.110 is an important level to monitor. A breakdown below this area could weaken the recovery and bring renewed selling pressure. The previous low near 6.915 remains an important support reference. For me, patience is the key here. A strong bounce can create an opportunity, but confirmation matters more than excitement. I’ll be watching price action around resistance before making a decision. What do you think — can UNI break above 7.337, or will sellers reject the move again? $UNIUSDT $TSLAXUSDT #ByXIMPACT
Pump.fun’s dominance in Solana’s meme-coin economy is no longer the sole metric worth tracking. A broader shift is taking place across the network’s trading ecosystem, as competition among launchpads intensifies and focus expands toward decentralized finance, tokenized assets, and institutional adoption. While Solana maintains a strong market share in spot DEX volume, launchpad activity alone will not dictate the direction of $SOL. The real narrative lies in underlying network growth. Solana-based applications generated roughly $299 million in Q3 2026 revenue—a 48% jump from the previous quarter—while spot SOL exchange-traded products drew about $492 million in net inflows over the same period. These metrics signal rising application usage and institutional interest, though neither guarantees an immediate price rebound. This shifts the focus for $SOL from meme-coin hype to key technical levels. With SOL hovering near the $100 support zone in late October, traders should monitor price reactions around immediate support and resistance, the consistency of ETF inflows, and sustained app revenue growth. Strong trading volume and persistent capital inflows could fuel a bullish recovery, whereas ongoing ETF outflows or a breakdown below support would weaken the market outlook. Ultimately, the decisive factor is whether genuine network demand can generate lasting buying pressure. $SOLUSDT $BTCUSDT #ByXIMPACT
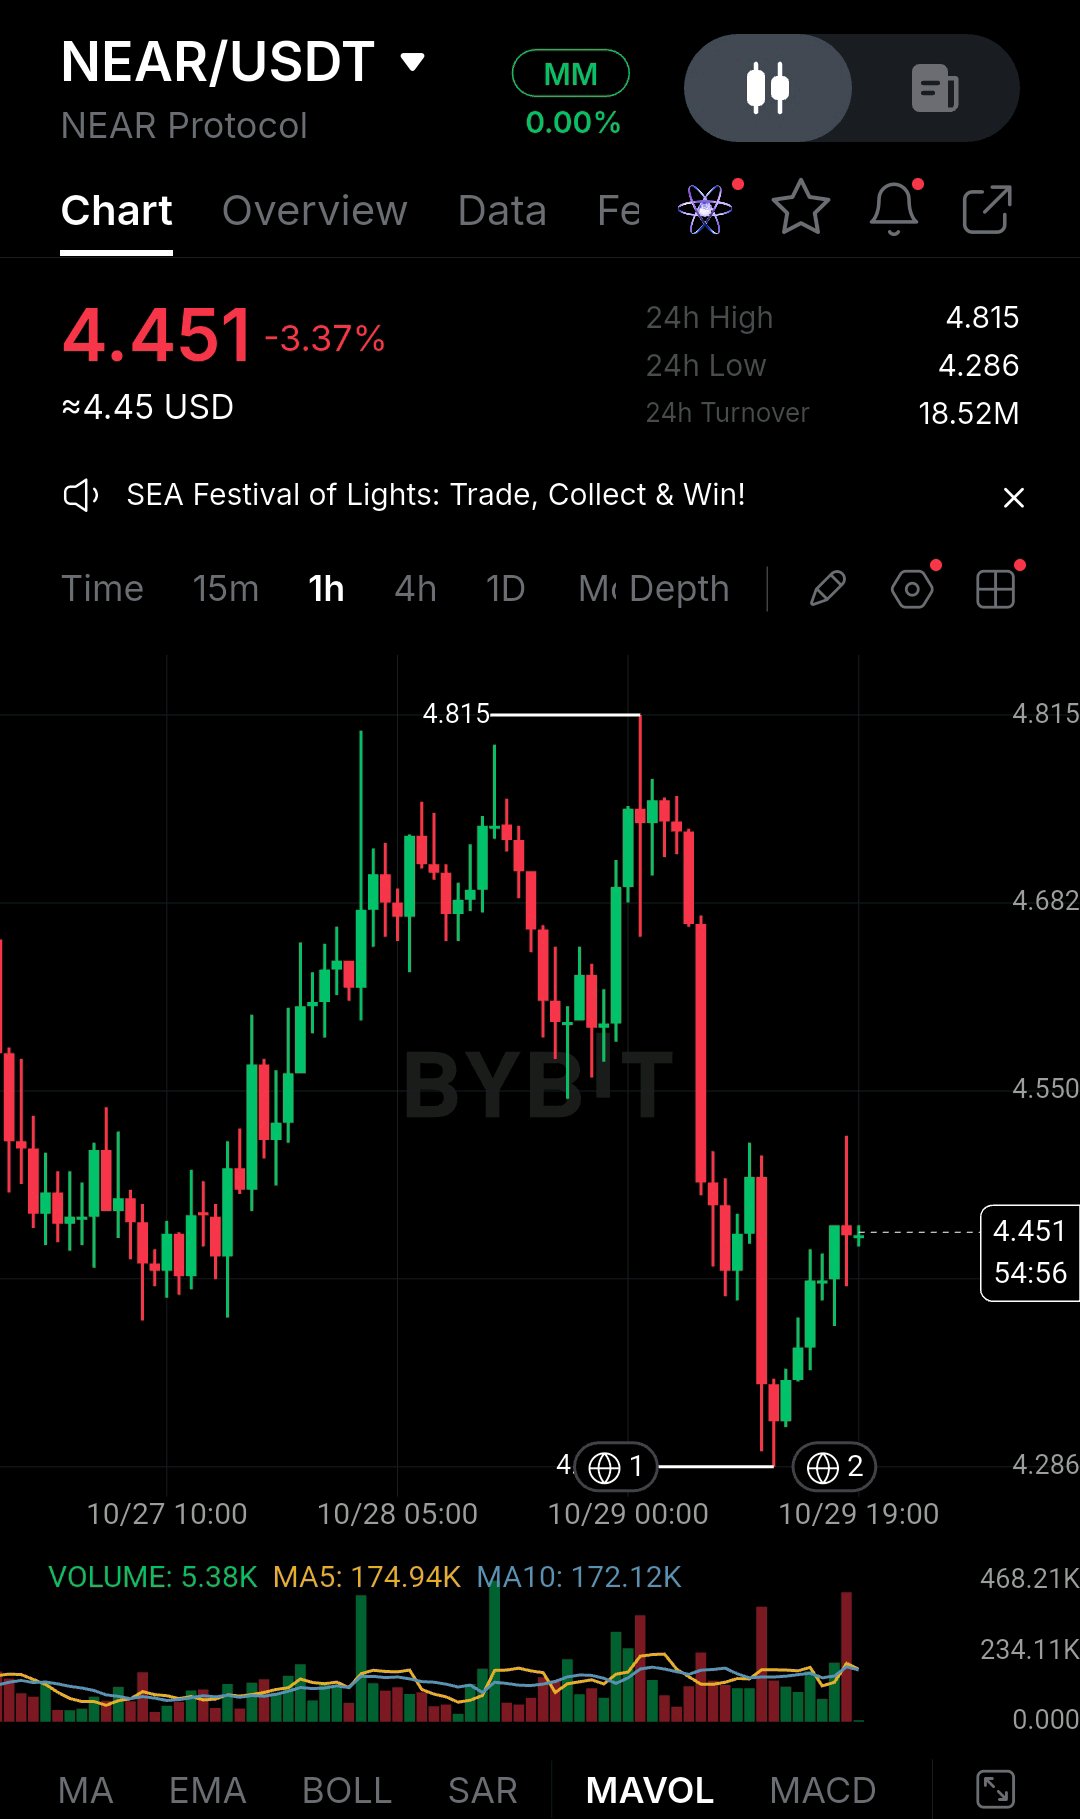
What caught my attention on the NEAR/USDT 1-hour chart is how sharply price rejected the 4.80 area before dropping toward 4.286. The bounce from that low is encouraging, but I’m not ready to call it a reversal just yet. NEAR is currently trading around 4.451, down 3.37%, after failing to hold its recent highs. The structure shows a strong sell-off followed by a short-term recovery. Buyers have stepped in near the lows, but price remains below the previous consolidation area around 4.55–4.68. For now, the market looks weak overall, with a possible relief bounce developing. From a technical perspective, the chart shows increased trading activity around the sharp decline and subsequent rebound. However, the displayed volume reading is only 5.38K, compared with MA5 at 174.94K and MA10 at 172.12K, so the latest volume figure needs context before drawing conclusions. Moving-average crossover data and MACD values are not visible, meaning momentum confirmation is still missing. Immediate resistance sits around 4.50–4.55, while 4.40 and the recent swing low at 4.286 are important downside areas to watch. I wouldn’t chase the green candles here. After a steep drop, short-covering can produce a convincing bounce that fades quickly. Entering without confirmation could leave traders buying directly into resistance. My preferred approach is to wait for a confirmed break and retest of 4.50–4.55 before considering a long. A possible entry zone would be 4.51–4.55 after confirmation, with a stop below 4.40 and an initial target near 4.68. These are conditional planning levels, not a validated signal; the exact risk-to-reward ratio depends on the confirmed entry and stop placement. A sustained move below 4.40 would weaken this recovery idea, while a break below 4.286 would invalidate the bullish structure more decisively. Capital protection matters more than catching the first bounce. I’d rather miss an early move than force a trade without evidence. Do you think NEAR can reclaim 4.55 and build a recovery, or is this bounce more likely to become another selling opportunity? $NEARUSDT $BTCUSDT #ByXIMPACT
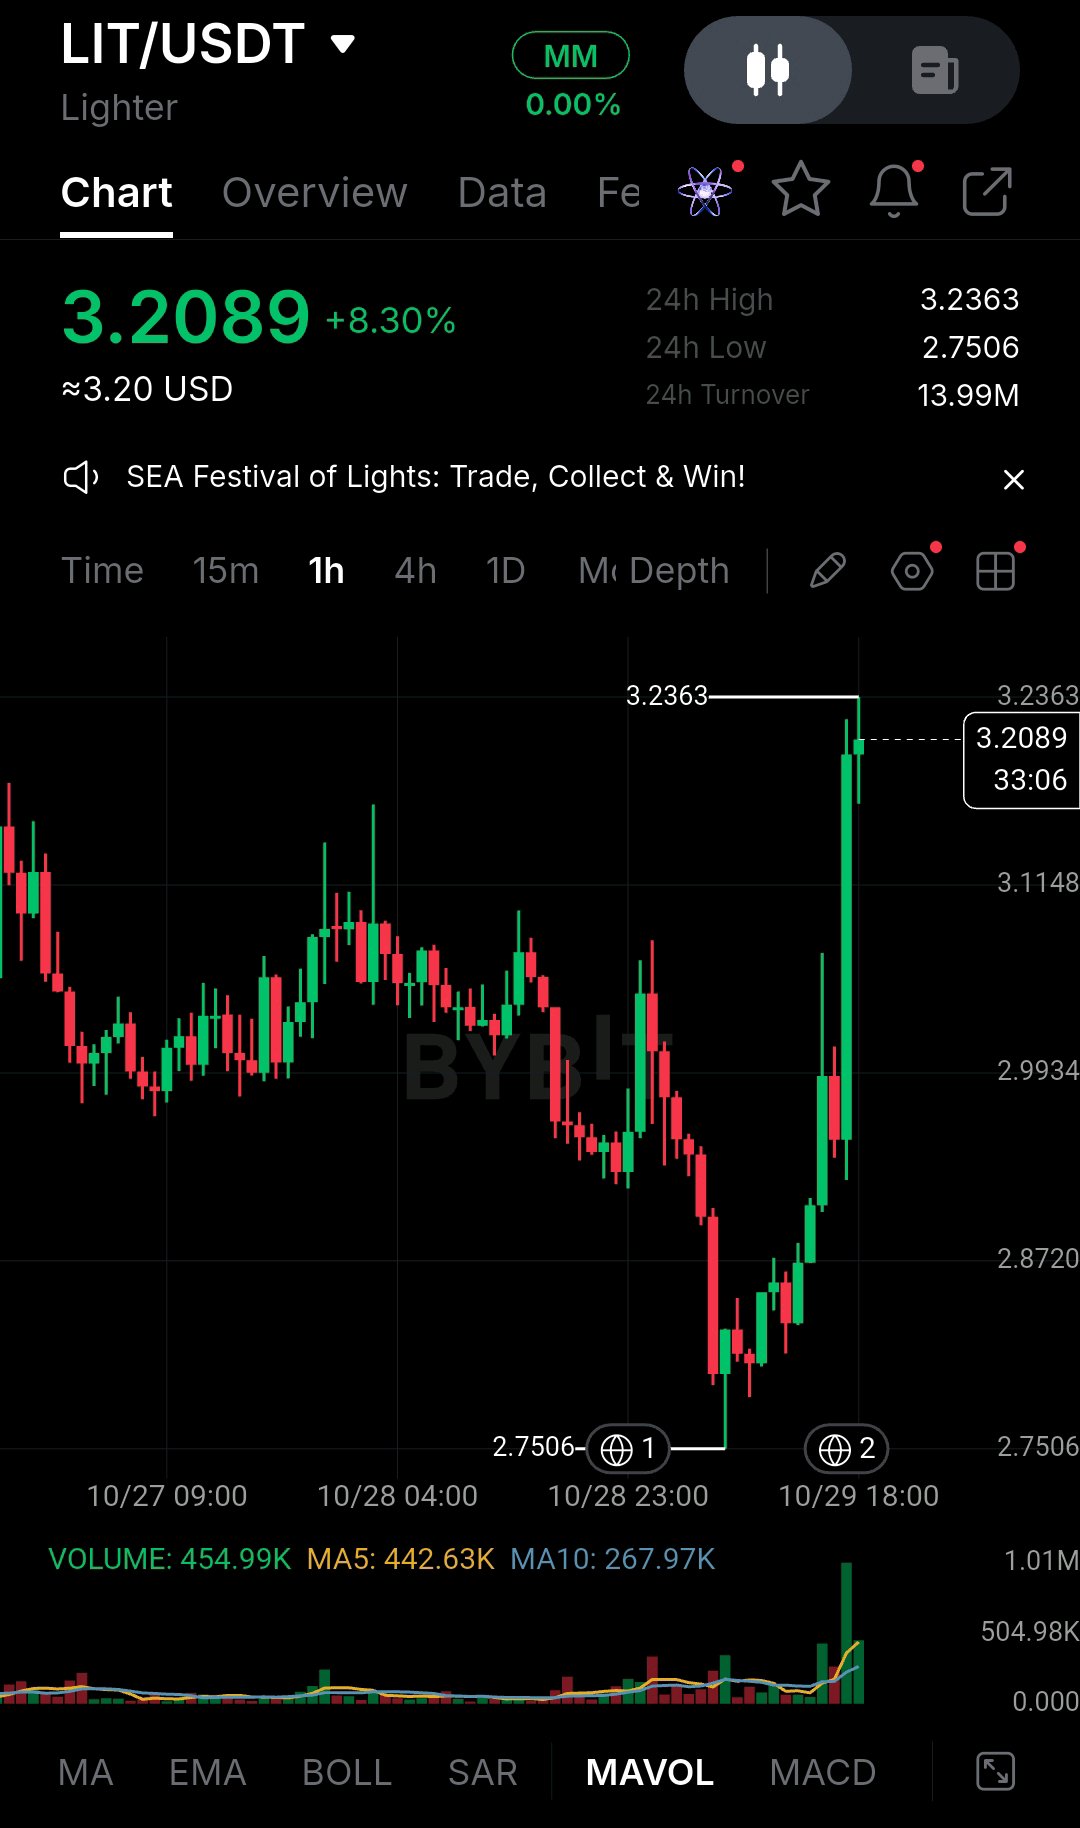
I’ve been watching LIT/USDT on the 1-hour chart, and the move that caught my attention is the explosive recovery from 2.7506 to a current price of 3.2089. LIT is up 8.30%, and the latest green candle shows a powerful burst of buying pressure. But after a move this sharp, I’m more interested in whether the breakout can hold than in chasing the rally. The broader structure has shifted from a decline into a strong short-term recovery. Price bounced from the 2.75 area, reclaimed the 2.8720 and 2.9934 levels, and surged above the previous consolidation zone. The next immediate challenge is the 3.2363 high, which is also the current visible resistance. A rejection there could trigger profit-taking, while a clean breakout may open the door to further upside. Volume adds weight to this move. The displayed volume is 454.99K, compared with MA5 at 442.63K and MA10 at 267.97K. That indicates stronger activity than the 10-period average, although sustained buying volume is still needed to support continuation. I wouldn’t buy simply because the latest candle is green. One possible long setup is a pullback into 3.00–3.05, provided that area holds as support and buyers confirm the retest. An illustrative entry at 3.03, stop-loss at 2.97, and targets at 3.15 and 3.2363 would offer approximate risk-to-reward ratios of 1:2 and 1:3.44, respectively. These are hypothetical levels, not confirmed signals. A successful retest followed by a strong hourly close would strengthen the bullish case. A decisive move below 2.9934 would weaken this setup and suggest the breakout may be failing. With volatility elevated, I’d keep position size controlled and never risk capital I cannot afford to lose. Will LIT break above 3.2363 and continue its momentum, or are we about to see a deeper pullback before the next move? $LITUSDT $BTCUSDT #ByXIMPACT
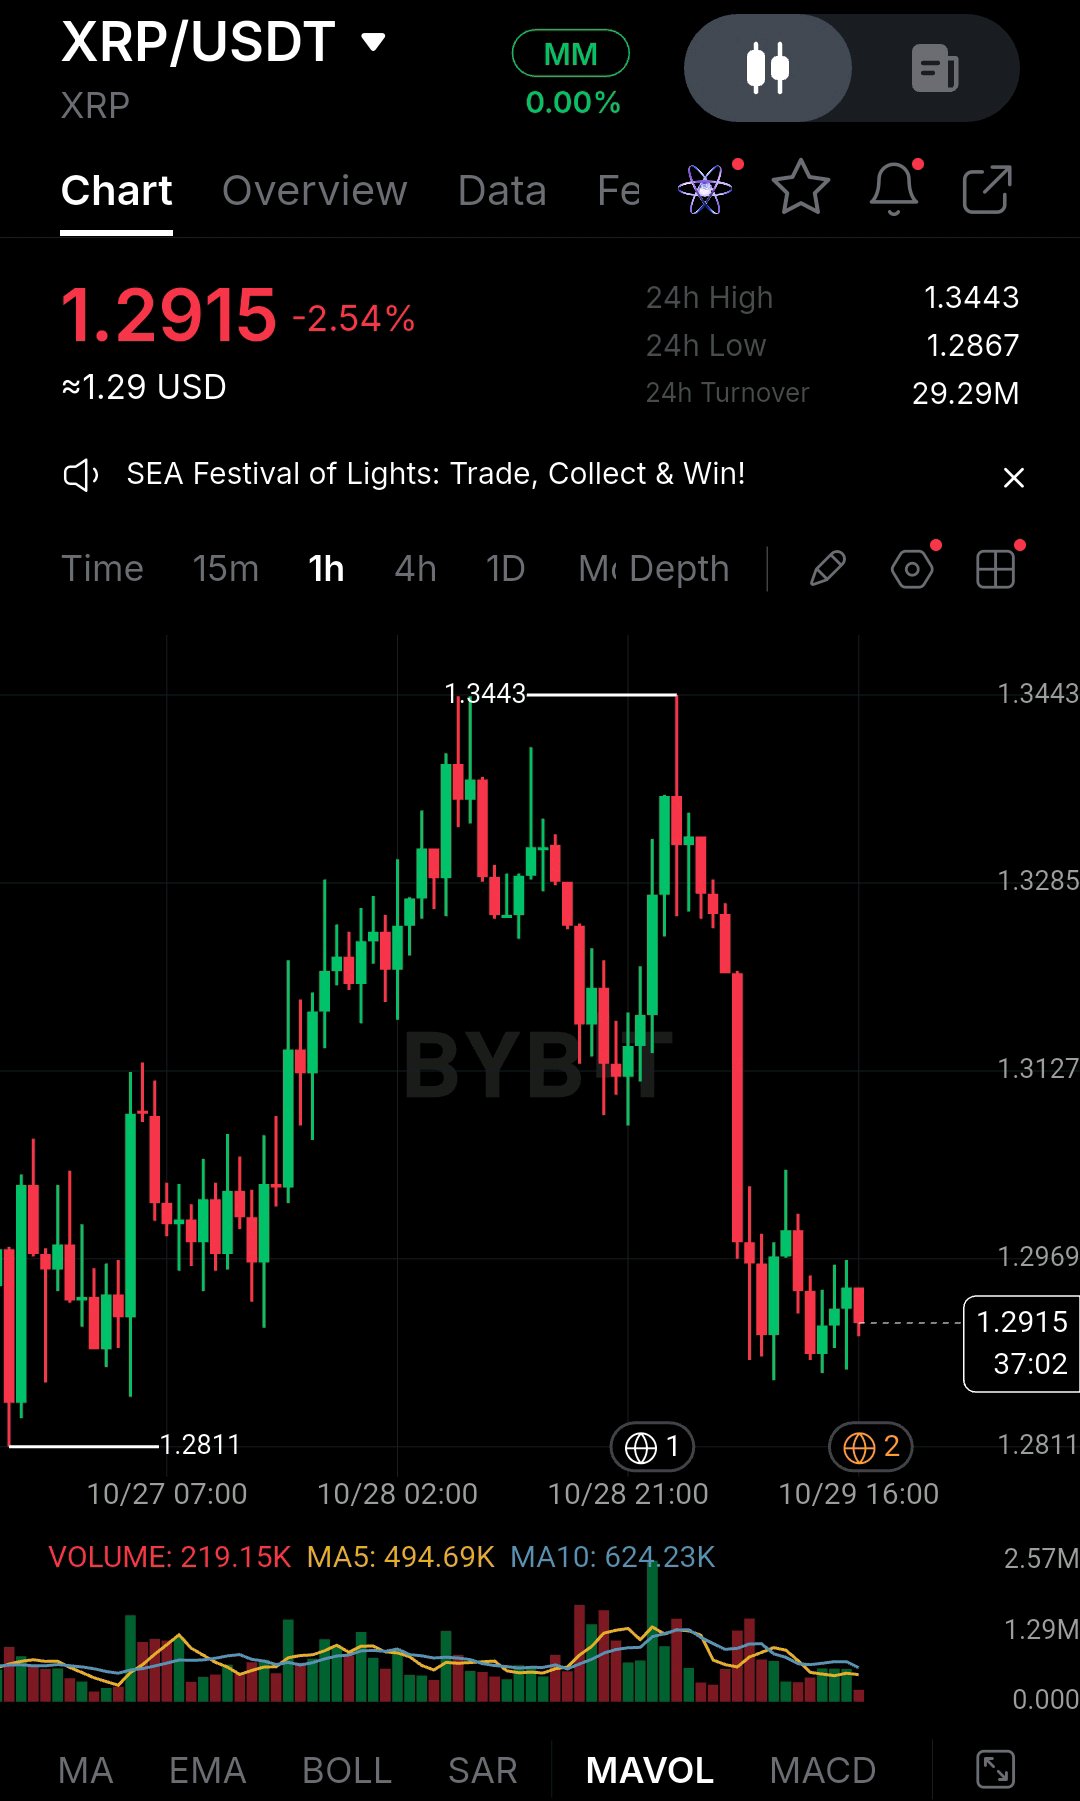
I’m watching XRP/USDT on the 1-hour chart, and what catches my attention is the aggressive sell-off from 1.3443. Buyers managed to push price higher twice, but both rallies failed to sustain momentum. The latest move has shifted the short-term structure toward the sellers, and XRP is now struggling to recover around 1.2915. Price is down 2.54%, trading close to the 24-hour low of 1.2867 and the visible swing low at 1.2811. The breakdown below 1.3127 was particularly important because it opened the door to further downside. Although the latest candles show some consolidation, I’m not treating this as a confirmed reversal yet. Volume also deserves attention. The displayed volume is 219.15K, below both the MA5 of 494.69K and MA10 of 624.23K. That suggests current trading activity is relatively subdued compared with those volume averages. A meaningful recovery would ideally come with stronger buying participation. Rather than chasing a green candle, I’d watch for a possible short opportunity if XRP rebounds into the 1.2969–1.3000 resistance zone and shows clear rejection. For an illustrative setup, an entry near 1.2980, a stop-loss at 1.3050, and targets at 1.2867 and 1.2811 would offer approximate risk-to-reward ratios of 1:1.61 and 1:2.41, respectively. These levels are conditional, not confirmed trade signals. The confirmation I want is a failed retest of resistance followed by renewed selling pressure. Conversely, a strong hourly close above 1.3050 would invalidate this particular short setup and make me reassess the bearish thesis. A clean break below 1.2811 could indicate further weakness, but it should not be assumed in advance. Risk management matters here. XRP can reverse sharply, so position sizing and a predefined stop are essential. Do you think XRP will break below 1.2811, or could buyers reclaim 1.3127 and trigger a stronger recovery? $XRPUSDT $ENAUSDT #ByXIMPACT
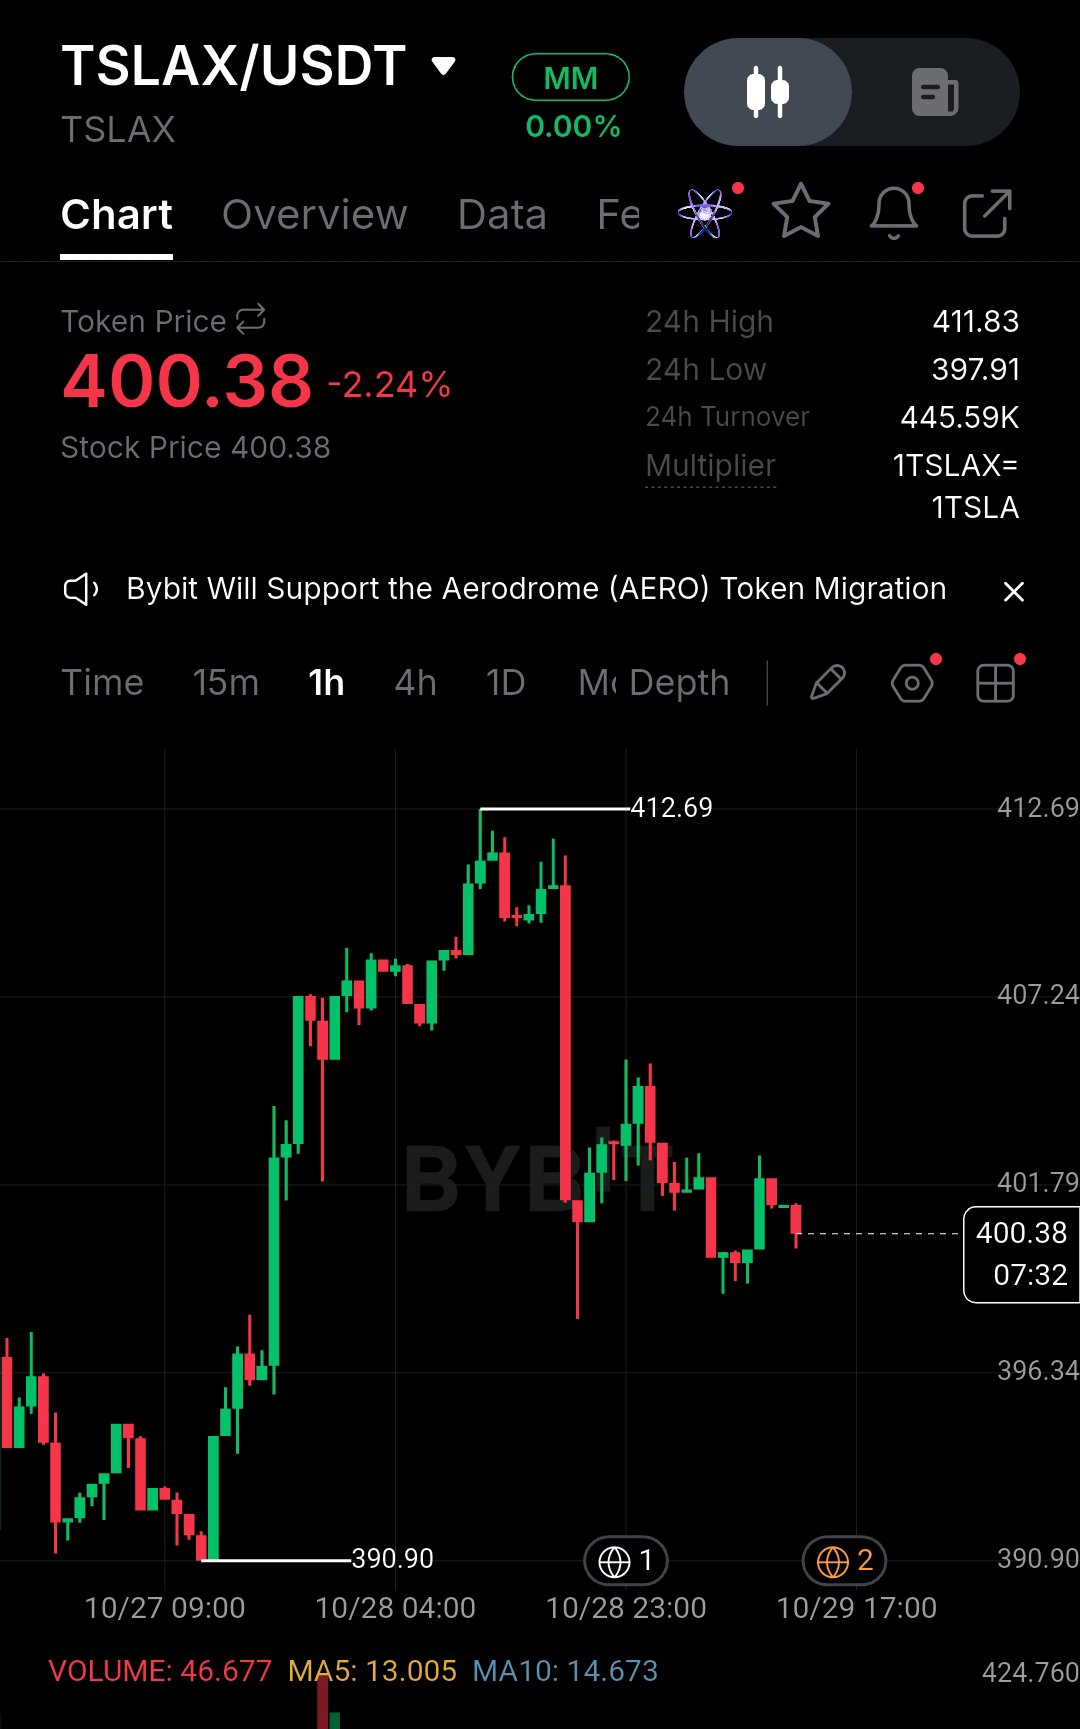
I'm watching TSLAX/USDT on the 1-hour chart, and what stands out to me is how quickly the market lost momentum after reaching 412.69. The rally looked strong initially, but the sharp sell-off that followed has changed the short-term structure. Now, the real question is whether buyers can defend the 398–400 area or whether another leg down is developing. TSLAX is currently trading around 400.38, down 2.24%, after retreating from its recent high. The chart shows a swing low near 390.90, followed by a strong recovery toward 412.69. However, sellers stepped in aggressively, pushing price back toward 400. The latest candles suggest consolidation, but the recovery remains unconvincing because price has not reclaimed the previous resistance zone around 401.79–407.24. One detail I wouldn't ignore is the volatility following the rejection. Price is moving within a tighter range after the initial drop, which could lead to another expansion. However, the screenshot doesn't provide actual moving-average values or an RSI reading, so I wouldn't rely on unconfirmed indicator signals. The immediate support zone sits around 397.91–398.50, while resistance begins near 401.79, with stronger resistance around 407.24. For a potential long setup, I'd watch the 398.50–400.00 zone, but only after buyers demonstrate a clear rejection of lower prices. An illustrative stop-loss below 397.50 would limit the trade's downside, while 403.00 and 407.00 could serve as potential targets. From a 400.00 entry, the risk would be 2.50 per token, against potential rewards of 3.00 and 7.00, giving approximate risk-to-reward ratios of 1:1.2 and 1:2.8, respectively. These are conditional levels, not confirmed signals. I wouldn't chase a sudden green candle here. A strong hourly close above 401.79, followed by a successful retest, would strengthen the recovery case. A decisive break below 397.91 would weaken it and could expose lower support. Capital protection comes first, especially with an asset showing sharp price swings. Would you favor a recovery toward 407, or do you think TSLAX will revisit 390.90 first? $TSLAXUSDT $BTCUSDT #ByXIMPACT
$BTC: Bitcoin Is Becoming More Than an Asset to Hold What interests me most about Bitcoin right now is how its role in finance is changing. For years, BTC was primarily viewed as an asset to buy, hold, or sell. Now, it's increasingly being used as collateral to access liquidity without giving up long-term exposure. The bigger question is whether this shift can create a sustainable lending market or whether it still depends too heavily on favorable market conditions. We've already seen Bitcoin-backed credit move beyond individual borrowers. In 2024, Sygnum arranged a reported $50 million Bitcoin-backed syndicated loan to Ledn. That was an important step because it showed how BTC collateral could support financing between institutional players, not just retail investors looking to borrow against their holdings. The market has continued to develop. Ledn offers Bitcoin-backed loans, while Sygnum's institutional lending framework includes BTC as eligible collateral. These products give borrowers another option when they need cash but don't want to sell their Bitcoin. However, the terms vary between providers, and advertised borrowing limits shouldn't be confused with the amount of credit actually being used. What makes this development interesting is the trade-off. Borrowing against BTC allows investors to retain exposure to potential price appreciation, but the debt doesn't disappear when the market turns negative. Falling prices can trigger additional collateral requirements or liquidation, turning a liquidity solution into a serious financial risk. On-chain lending introduces another dimension. It can connect Bitcoin-backed collateral with stablecoin liquidity and make certain lending processes more transparent. But smart-contract vulnerabilities, collateral management, counterparty exposure and withdrawal restrictions remain important considerations. For me, the real story isn't simply that more companies are offering Bitcoin-backed loans. It's whether borrowers keep using these services, repay successfully, return for additional financing and generate consistent demand even when BTC prices become volatile. That's the difference between a growing product category and a mature credit market. Announcements can attract attention, but actual borrowing activity is what matters. The question I'm watching is simple: Can Bitcoin-backed lending maintain strong, repeatable demand during a prolonged BTC downturn, or does the business mainly thrive when collateral prices are rising? $BTCUSDT $PEPEUSDT #ByXIMPACT