Parker
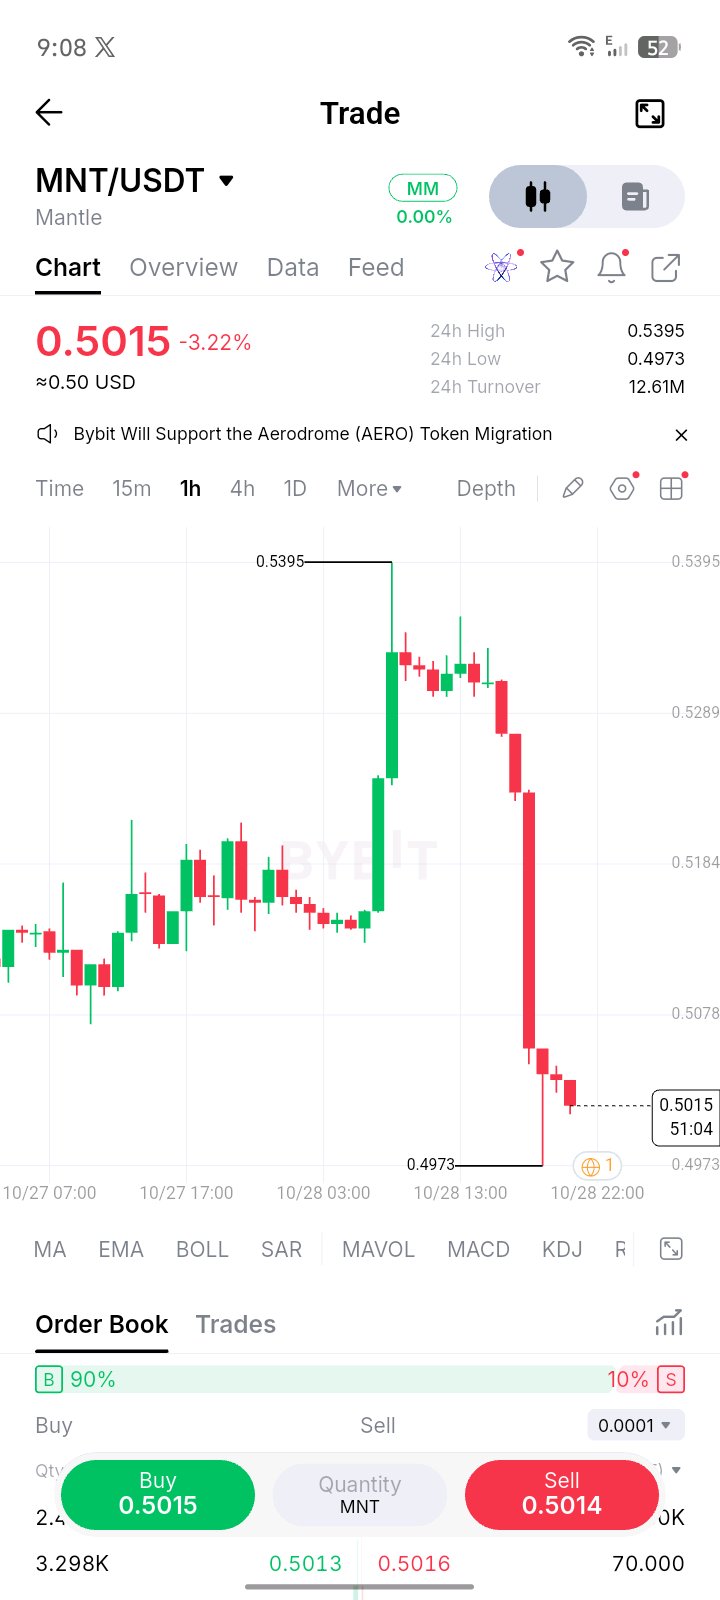
Mantle dropped almost 8% from its high within a single session, and the rebound so far is small. MNT spiked to $0.5395, sold off to a $0.4973 low, and is trading near $0.5015, down 3.22% on Bybit spot. The question is whether that low was absorbed by real demand or only paused. The hourly chart shows one clean push to the high, a brief range around $0.52–$0.53, then a steep drop with almost no pullbacks. Bybit spot turnover is about $12.6M, and CoinGlass lists a market cap near $1.64B. A bounce off $0.4973 is a reaction, not a reversal. A trend change needs a higher low and reclaimed resistance. I could not verify current whale accumulation or exchange-flow data for this window, so none is asserted here. The most recent reading I found, from Oct. 7, showed spot netflow of about -$928K, with more than $10M leaving exchanges. That is three weeks old. Withdrawals can mean self-custody, but they can also mean DeFi or OTC transfers. Exchange deposits likewise do not prove selling. Derivatives are the clearer signal. Futures volume is about $51.9M against $34.5M in spot, with open interest near $43.0M. Open interest was about $50M on Oct. 7 after a 14% drop, so leverage has thinned further. That fits positions closing, not fresh shorts building, but the data here cannot confirm liquidation size. I could not verify current funding, so I make no claim about it. **Key figures** Current price — $0.5015 (Bybit spot) 24h high / low — $0.5395 / $0.4973 Market capitalization — ~$1.64B Futures open interest — ~$43.0M Futures / spot volume — ~$51.9M / ~$34.5M **Bullish confirmation:** MNT needs to reclaim and hold the $0.52–$0.53 range, then clear $0.5395, with spot volume rising faster than futures volume. Only then does the $0.63 level flagged in early October become relevant. **Bearish confirmation:** A close below $0.4973 that fails to recover would expose the lower range. Messari lists a cycle low of $0.390 from July 31. Rising futures volume with falling spot demand, or fresh exchange inflows, would strengthen that case. **Conclusion:** The conflict is between a sharp reversal and a market that is already deleveraging. Lower open interest means less forced selling ahead, but it also means less fuel for a rally. The signal to watch is spot volume on any retest of $0.52. A sustained recovery needs spot buyers to lead. A bounce driven mainly by futures is more likely to fade. Whale activity and funding are left out because I could not verify current values. If you can share a CoinGlass or Nansen screenshot of either, I can work it in. #ByXIMPACT $MNTUSDT
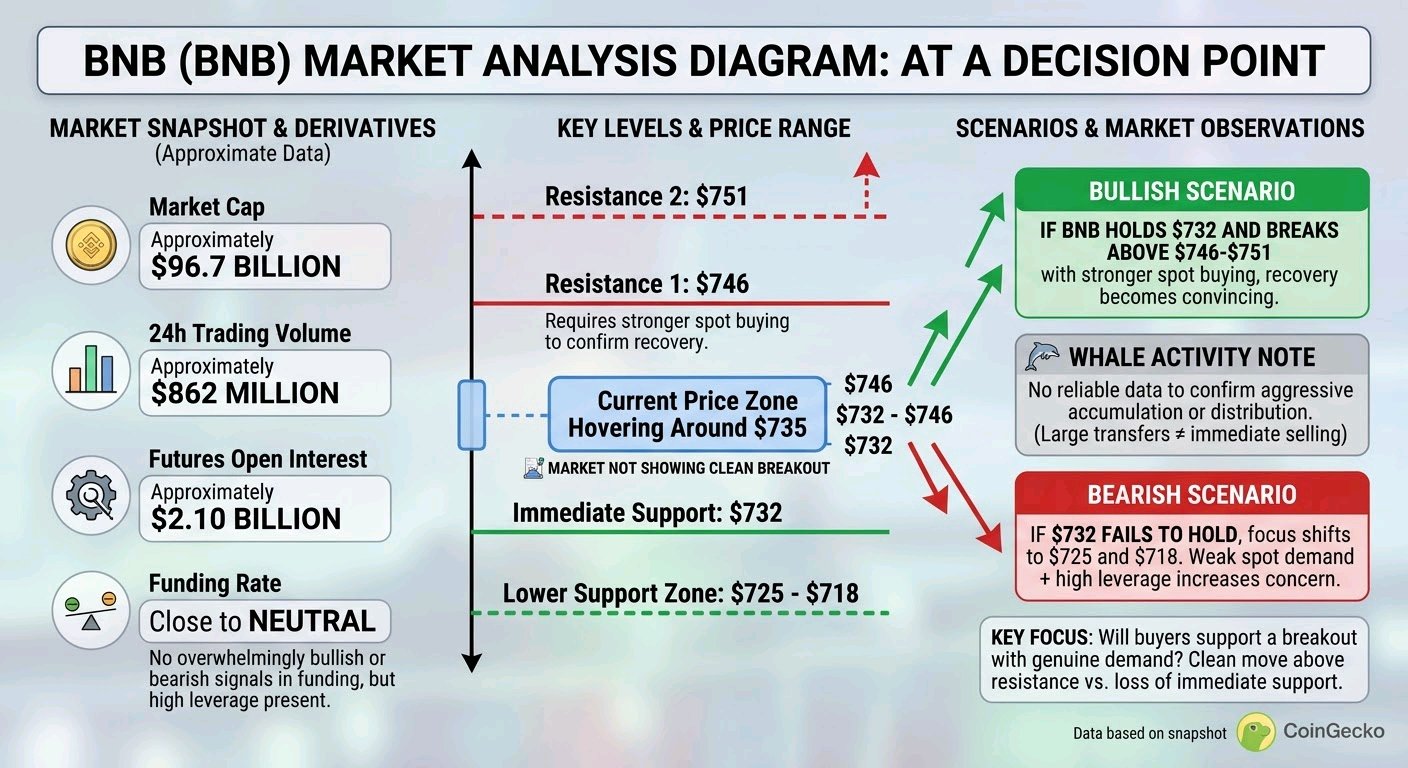
BNB is hovering around $735, and the next move could depend on whether buyers can defend support and push the price back toward resistance. The market isn’t showing a clear breakout yet, so the important question is whether this pause turns into another recovery or gives sellers an opportunity to push lower. According to CoinGecko’s latest available snapshot, BNB has a market cap of roughly $96.7 billion, with about $862 million in 24-hour trading volume. The price has been moving between approximately $732 and $746, keeping both buyers and sellers in the game. CoinGecko The immediate support sits around $732. If buyers hold that level, BNB could attempt another move toward $746 and $751. But if support breaks and the price fails to recover, the market may start looking toward $725 and $718. Derivatives data adds another piece to the picture. CoinGecko reports around $2.10 billion in perpetual futures open interest, showing that leveraged trading remains significant. Funding is close to neutral in the same snapshot, so there is no strong funding-based evidence of an overwhelmingly bullish or bearish market. Still, a sharp price move could trigger liquidations on either side. CoinGecko When it comes to whale activity, it’s important not to jump to conclusions. A large transfer to an exchange can raise questions about potential selling pressure, but it doesn’t confirm that the tokens were sold. Without reliable, current BNB exchange-flow data, there’s no solid basis to claim that whales are accumulating or distributing aggressively. Key levels to watch * Current price: approximately $735 * Immediate support: $732 * Lower support zone: $725–$718 * First resistance: $746 * Next resistance: $751 * Market capitalization: approximately $96.7 billion * Futures open interest: approximately $2.10 billion Bullish scenario: If BNB holds $732 and breaks above $746–$751 with stronger spot buying, the recovery would look more convincing. Bearish scenario: If $732 fails to hold, $725 and $718 become important downside levels to watch. Weak spot demand combined with rising leverage would make the situation more concerning. For now, BNB is at a decision point. The key isn’t simply whether the price moves up or down over the next few hours; it’s whether buyers can support a breakout with genuine demand. A clean move above resistance would strengthen the bullish case, while a loss of support would suggest sellers still have the upper hand. #ByXIMPACT $BNBUSDT $BTCUSDT
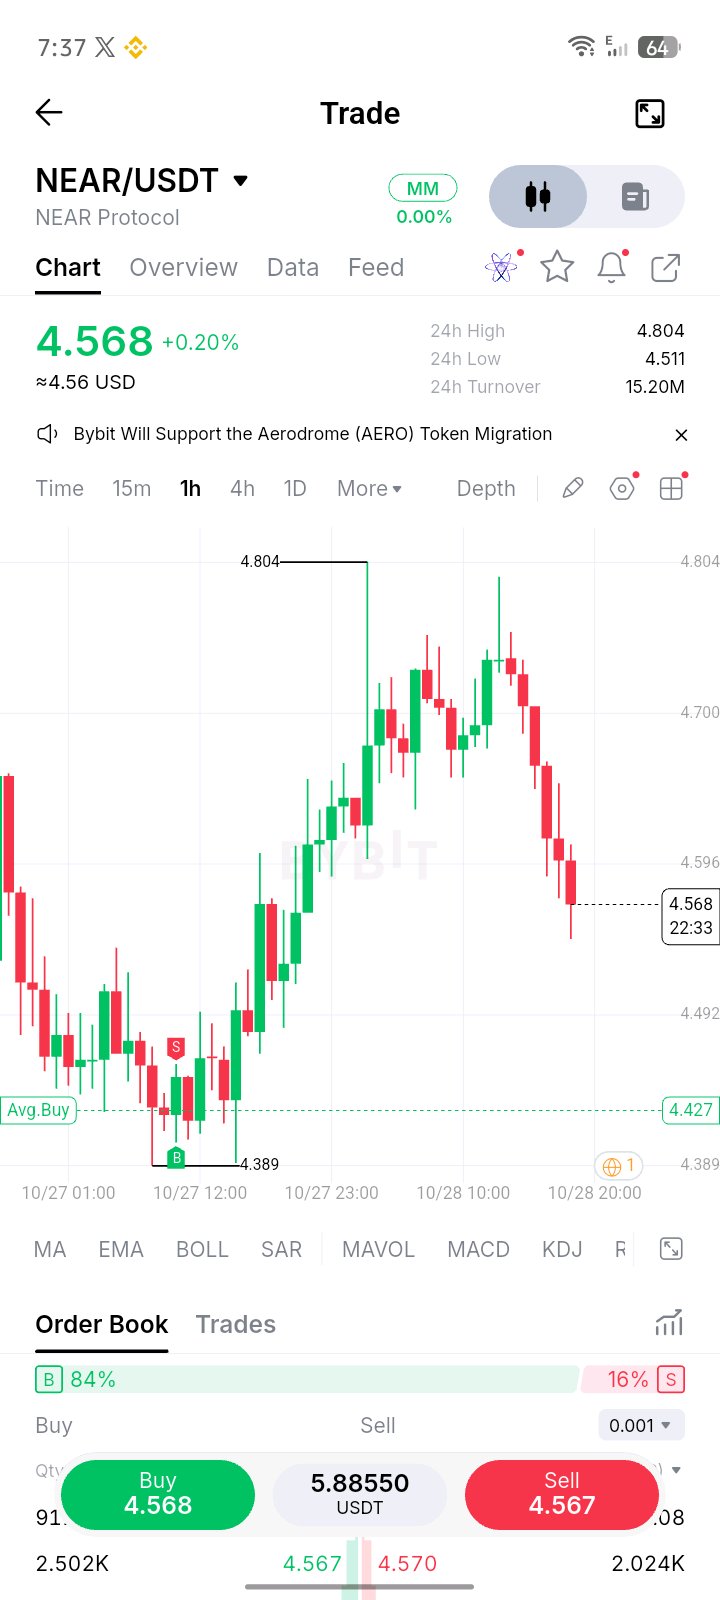
NEAR Protocol is facing an important test after its recent recovery. The price climbed from $4.389 to $4.804, but buyers couldn’t hold the highs, and NEAR has now slipped back to $4.568. The big question is whether this is simply a healthy pullback or the beginning of another move lower. Looking at the 1-hour chart, the recovery was strong, but the latest candles show sellers gaining momentum. The $4.70–$4.80 zone has become a key resistance area, while $4.51 is the first level buyers need to defend. Until NEAR can reclaim resistance, it’s too early to call this a confirmed bullish reversal. The derivatives market also deserves attention. One available dataset reported roughly $1.02 billion in NEAR futures open interest, with funding around +0.009% per eight hours and a long-heavy positioning bias. That suggests traders are leaning bullish, but crowded long positions can become a problem if the price keeps falling. Futures activity alone doesn’t tell us whether genuine spot demand is supporting the move. On the broader market side, an available snapshot placed NEAR’s market capitalization near $6.09 billion, with around $522 million in 24-hour trading volume. However, I couldn’t verify fresh whale accumulation or exchange netflows for this specific period, so there isn’t enough evidence to claim that large holders are buying or selling aggressively. Key levels to watch: * Current price: $4.568 * Immediate support: $4.511 * Next support: $4.427 * Major swing low: $4.389 * First resistance: $4.700 * Major resistance: $4.804 Bullish scenario: If NEAR holds above $4.51 and climbs back through $4.70, buyers could make another attempt at $4.804. A breakout backed by stronger spot volume would improve the chances of a move toward $4.90–$5.00. Bearish scenario: If $4.51 breaks and the price fails to recover it, attention shifts to $4.427 and $4.389. Weak spot demand, rising exchange inflows, or excessive leveraged long positions could add further pressure. For now, NEAR is caught between buyers trying to protect the recovery and sellers taking control near resistance. The next move will depend less on bullish sentiment and more on whether real buying demand returns. Holding support is important, but reclaiming $4.70 is what could start to change the picture. #ByXIMPACT $NEARUSDT $ORDERUSDT
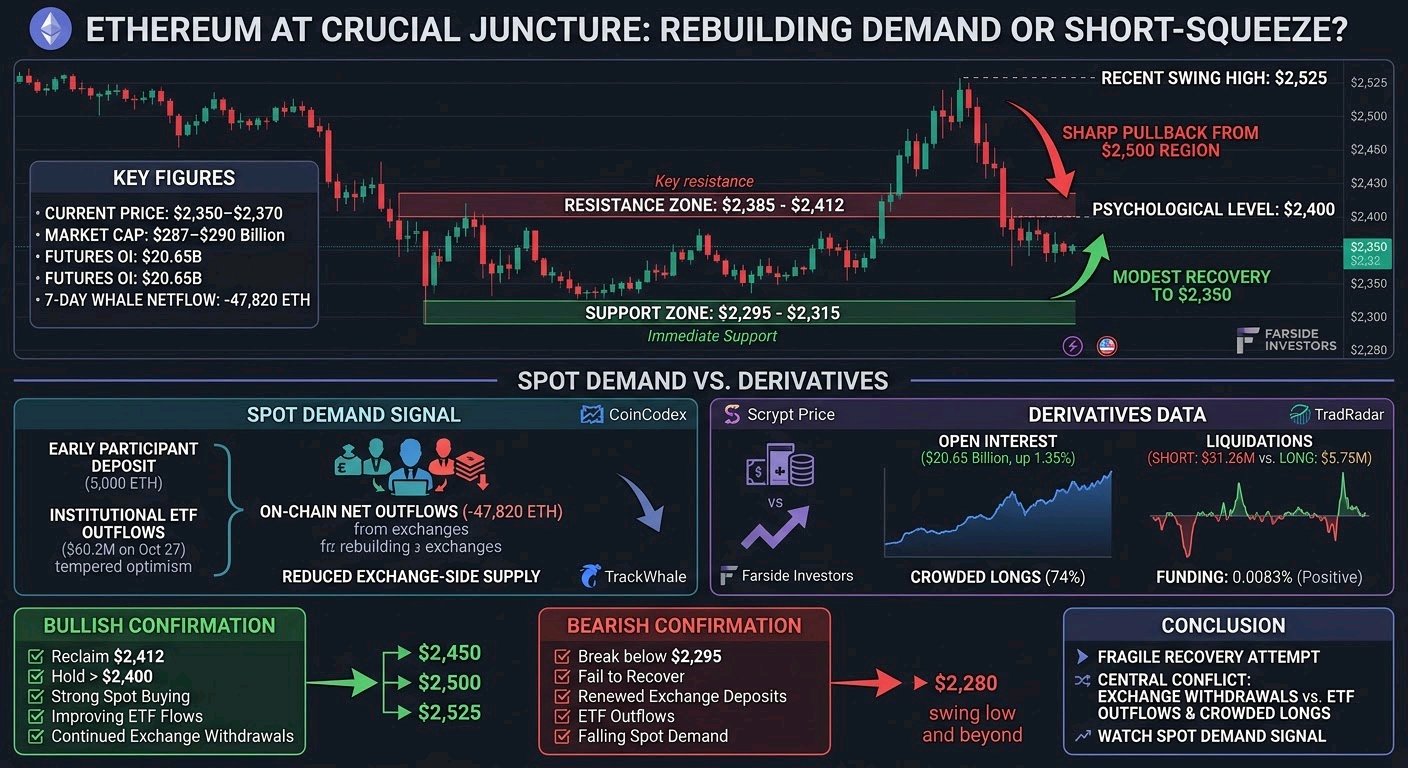
Ethereum ($ETH) is attempting to stabilize around $2,350 after a sharp pullback from the $2,500 region, but the key question is whether buyers are rebuilding genuine spot demand or simply benefiting from a derivatives-driven short squeeze. The latest market data shows a modest recovery, while positioning remains heavily tilted toward longs—a combination that deserves caution rather than immediate bullish conviction. CoinCodex +1 ETH's recent price structure remains fragile. The October 21 session reached approximately $2,525, followed by a decline toward $2,280–$2,300 over the subsequent sessions. ETH has since recovered toward $2,350, but it still needs to reclaim nearby resistance before the bounce can qualify as a stronger trend reversal. Scrypt Price +1 The first important resistance zone sits around $2,385–$2,412, with the psychological $2,400 level likely to attract attention. Support lies around $2,295–$2,315; a sustained break below this area would put the recent swing low near $2,280 back in focus. On-chain evidence is mixed. Tracked large-wallet activity over the past seven days shows approximately $640.93 million in exchange inflows versus $756.39 million in outflows, a net outflow of roughly 47,820 ETH. That leans toward reduced exchange-side supply, although the tracker covers only identified transfers. Meanwhile, an early Ethereum participant reportedly deposited 5,000 ETH to an exchange, worth about $11.59 million, creating a potential source of selling pressure—not proof that a sale occurred. TrackWhale +1 Institutional demand is another concern: U.S. spot ETH ETFs recorded $60.2 million in net outflows on October 27, according to figures attributed to Farside Investors. That weakens the immediate demand picture even as ETH rebounds. Looking for smartmoney onchain +1 Derivatives show a similar conflict. Aggregate futures open interest was approximately $20.65 billion, up 1.35% over 24 hours in one snapshot, while funding was positive at 0.0083% per eight hours. Around $31.26 million in short positions were liquidated versus $5.75 million in longs. This supports the possibility of a short squeeze, but roughly 74% of tracked accounts were long, leaving the market vulnerable if momentum fades. TradRadar Key figures * Current price: approximately $2,350–$2,370, depending on venue and timestamp. * Market capitalization: approximately $287–$290 billion. * Recent swing high: $2,525. * Immediate support: $2,295–$2,315. * First resistance: $2,385–$2,412. * Futures open interest: $20.65 billion on seven tracked exchanges. * Seven-day tracked whale exchange netflow: −47,820 ETH. Bullish confirmation: ETH needs to reclaim $2,412 and hold above $2,400 with stronger spot buying, improving ETF flows, and continued net exchange withdrawals. That would put $2,450 and then the $2,500–$2,525 region back in view. Bearish confirmation: A decisive break below $2,295, followed by failure to recover, would expose the $2,280 swing low. Renewed exchange deposits, ETF outflows, and falling spot demand would strengthen that downside case. The central conflict is clear: exchange withdrawals are supportive, but institutional outflows and crowded long positioning limit confidence in the recovery. Spot demand is the signal to watch most closely. Until ETH reclaims resistance with genuine buying volume, this remains a recovery attempt—not a confirmed trend reversal. TrackWhale +2 #ByXIMPACT $ETHUSDT
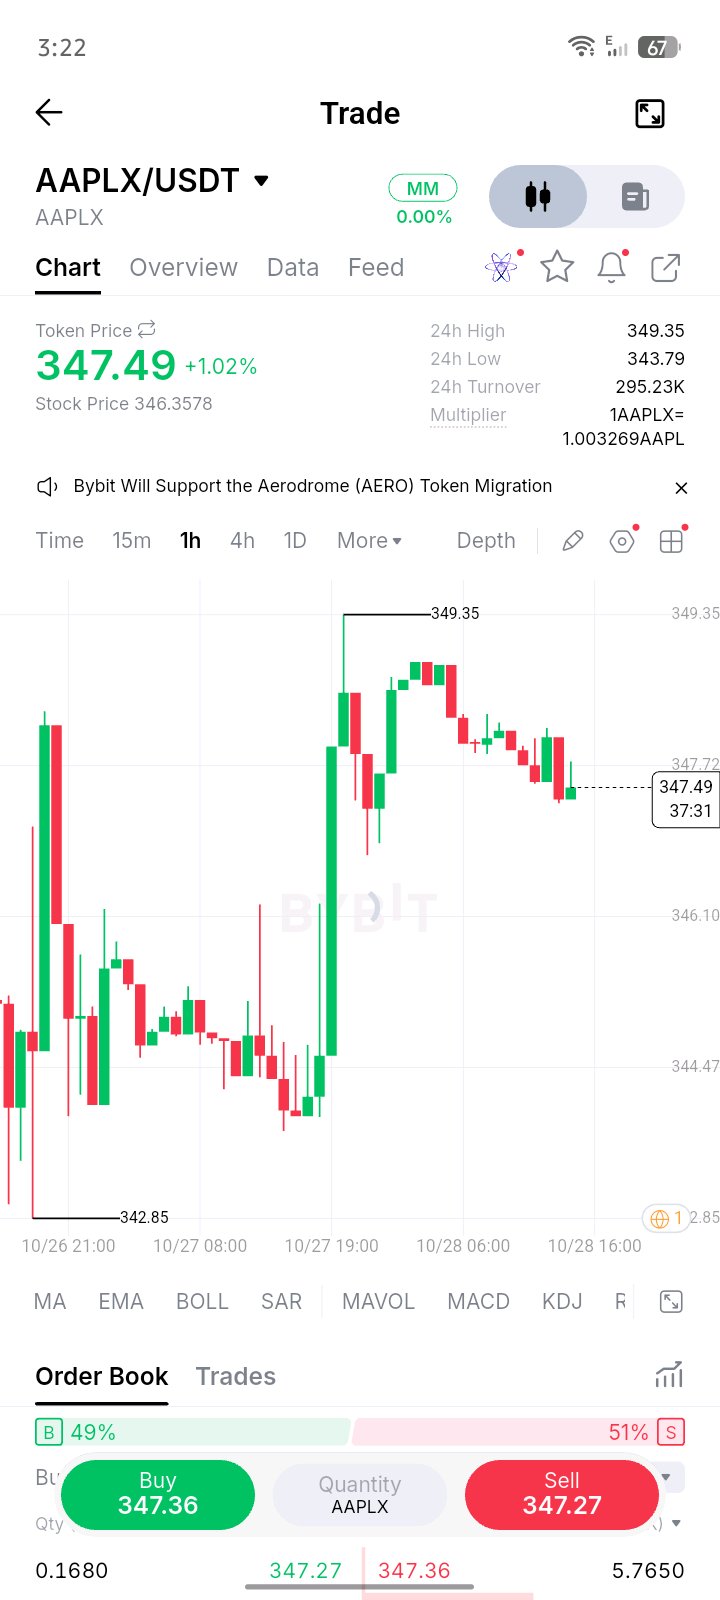
XAUT is attempting a recovery after a sharp rejection near $4,068, but the real question is whether buyers can reclaim resistance with sustained spot demand or whether this bounce is simply a pause in selling pressure. The Bybit chart provided shows Tether Gold trading at $4,050.54, up 1.26%, after climbing from the $3,993 area toward $4,068 before pulling back. Buyers have recovered from a subsequent dip near $4,026–$4,030, bringing price back above $4,050. That is constructive short-term price action, but the previous rejection means a confirmed reversal still needs evidence. XAUT is different from a typical speculative altcoin: it is designed to represent ownership of physical gold. Its price therefore reflects gold-market dynamics, token liquidity, and the premium or discount at which the token trades, rather than crypto demand alone. The key concern is participation beneath the rebound. CoinGlass reports approximately $277.85 million in 24-hour futures volume, $63.01 million in spot volume, and $811.19 million in open interest. Futures activity is substantially larger than spot turnover, making leveraged positioning an important factor in assessing the recovery. These are live aggregator readings, not Bybit-only figures. CoinGlass On-chain evidence remains inconclusive. I could not independently verify a current whale-accumulation trend or net exchange-flow signal for XAUT. Large transfers alone would not prove buying or selling, so claiming that whales are accumulating here would be premature. Key figures * Current price: $4,050.54 (provided Bybit screenshot) * 24-hour change: +1.26% * Recent high: $4,067.84 * Immediate resistance: $4,058–$4,068 * Immediate support: $4,030–$4,026 * Lower support: $3,996–$3,993 * Market capitalization: approximately $2.95 billion on CoinGlass; provider estimates vary. CoinGlass +1 * Futures open interest: $811.19 million, CoinGlass snapshot. CoinGlass Bullish scenario: A sustained break above $4,068, followed by a successful retest and stronger spot participation, would improve the recovery outlook. The next levels to monitor are $4,080 and $4,100, as conditional chart-based reference points rather than confirmed targets. Bearish scenario: Rejection below $4,068 followed by a loss of $4,026 would weaken the bounce. A decisive break beneath $3,993 could expose lower levels around $3,975–$3,960. Rising open interest during falling prices would warrant additional caution, particularly if liquidations accelerate. The central conflict is clear: XAUT has recovered sharply from its intraday dip, yet derivatives activity outweighs spot volume and verified whale-flow evidence is missing. The most important confirmation is whether buyers can hold above $4,030 and reclaim $4,068 with sustained spot demand. Until then, this is a promising recovery attempt, not a confirmed trend reversal. #ByXIMPACT $AAPLXUSDT

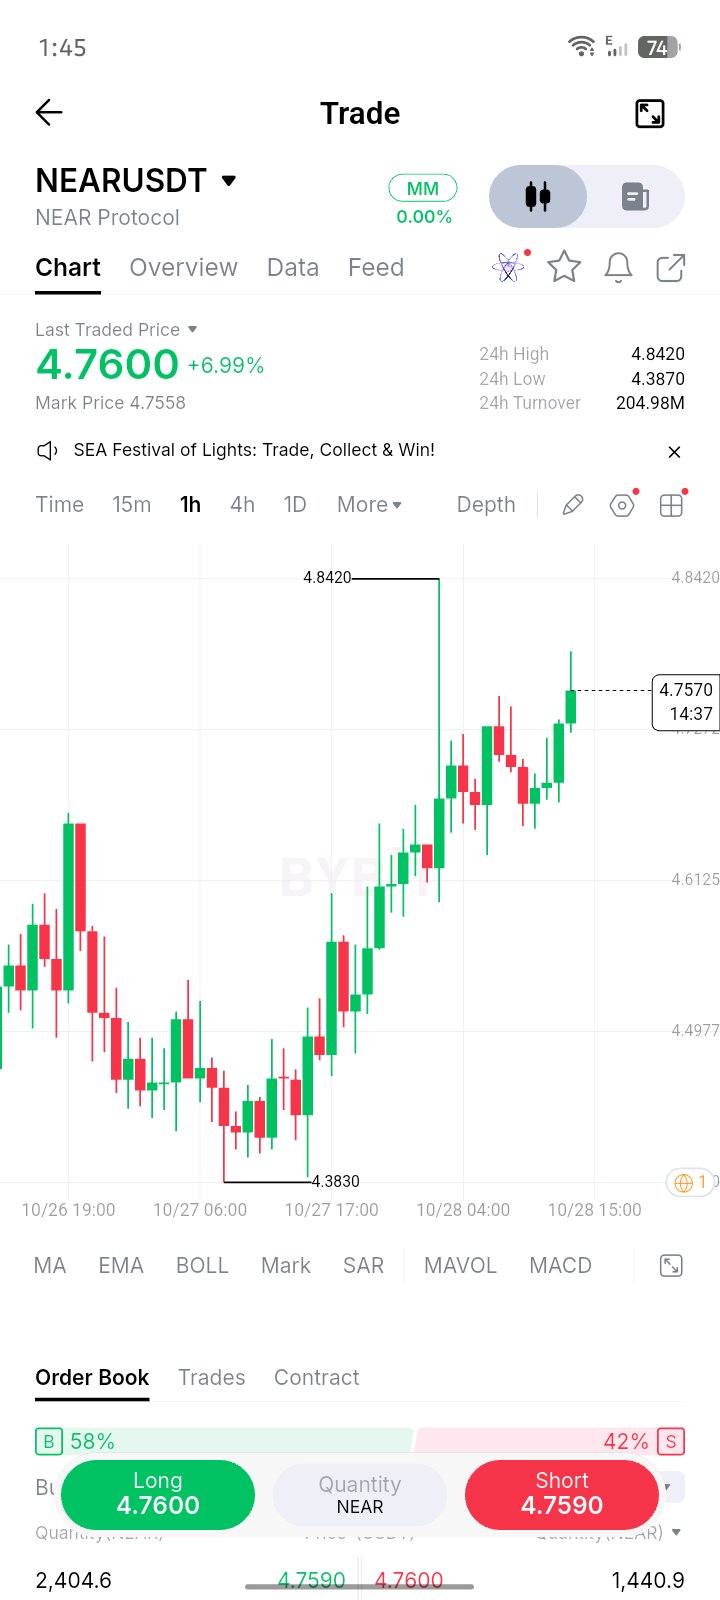
NEAR Protocol is showing a strong short-term recovery, but the key question is whether buyers can sustain the move above the recent breakout zone or whether this rally is running into profit-taking near resistance. The Bybit chart you shared shows NEARUSDT at $4.7600, up 6.99%, on the 1-hour timeframe. Price rebounded from a visible swing low of $4.3830 and reached a recent high of $4.8420. That is a meaningful recovery, but the price is now approaching the area where sellers could test the strength of the move. The broader data adds an important complication: NEAR’s recovery is occurring alongside substantial derivatives activity, so the rally needs confirmation from sustained spot demand rather than price action alone. CoinGlass reports approximately $1.33 billion in futures open interest, $1.31 billion in 24-hour futures volume, and $199 million in spot volume. Futures volume is therefore much larger than spot volume, indicating that leveraged trading is a major part of current market activity. This does not prove that the rally is leverage-driven, but it increases the importance of monitoring liquidations and funding rates. CoinGlass +1 On-chain evidence requires similar caution. DefiLlama’s October 23 snapshot recorded roughly $231 million in NEAR DeFi total value locked and $7.89 million in daily DEX volume. These figures provide ecosystem context, not proof of current whale accumulation. I could not independently verify a current exchange netflow figure that would establish whether large holders are accumulating or preparing to sell. DefiLlama +1 Key figures * Current price: $4.7600 on your screenshot; third-party quotes around $4.68–$4.70 at earlier UTC snapshots. * Market capitalization: approximately $6.1 billion. * Recent chart high: $4.8420. * Immediate resistance: $4.80–$4.8420. * Immediate support: $4.70, followed by $4.61. * Major swing low: $4.3830. * Futures open interest: approximately $1.33 billion. * Spot volume: approximately $199 million over 24 hours. MetaMask +2 Bullish confirmation: NEAR needs to break above $4.8420 and hold that level on convincing spot volume. A sustained move would put $4.90 and the psychological $5.00 level into focus. Falling exchange balances alongside improving spot demand would strengthen the case, if verified. Bearish confirmation: Rejection below $4.8420 followed by a loss of $4.61 would weaken the recovery. A break below $4.3830 would expose a deeper downside move. Rising open interest during falling prices, especially alongside long liquidations, would add to the risk. The central conflict is straightforward: NEAR’s price is recovering, but derivatives activity is considerably larger than spot volume. The next decisive signal is whether real spot buyers can sustain a breakout above $4.8420. Until that happens, this is a promising short-term rebound—not a confirmed trend reversal. #ByXIMPACT $NEARUSDT

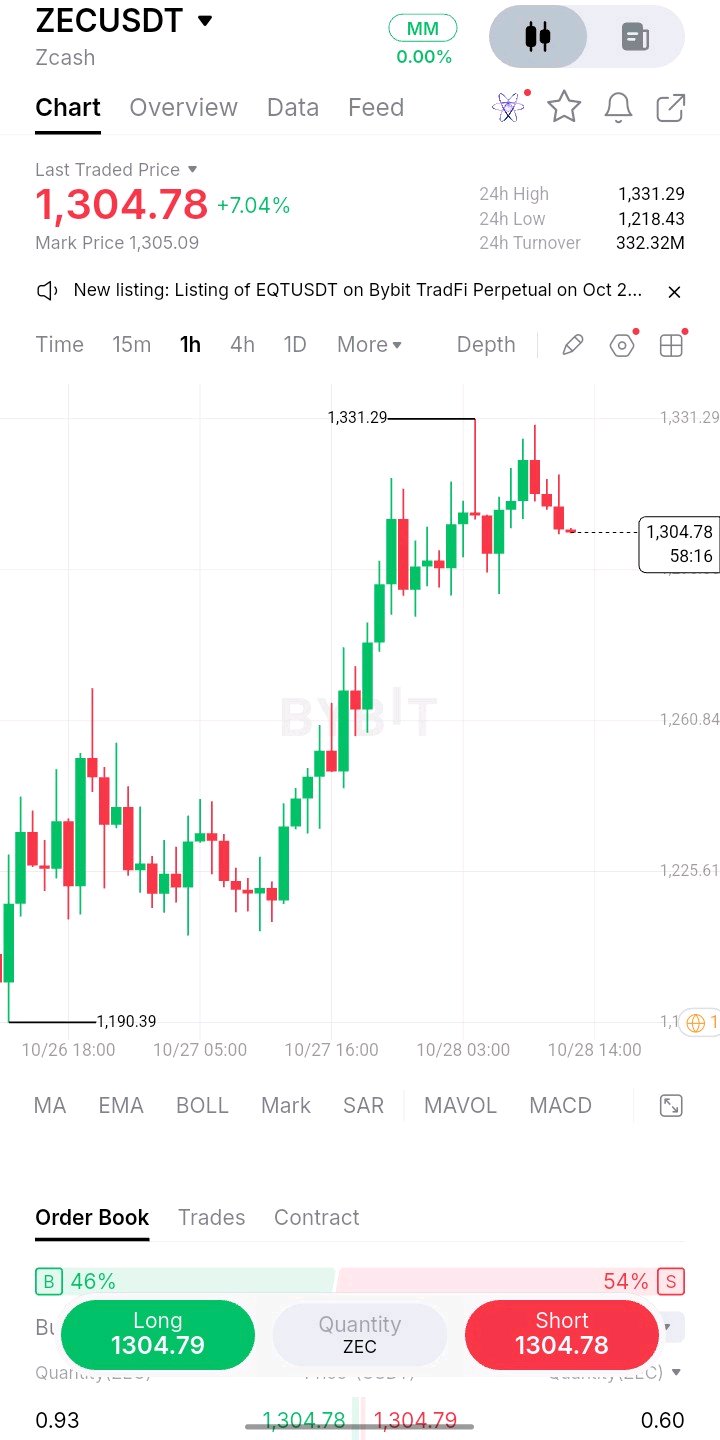
ZEC is showing a strong recovery on the 1-hour chart, but the real question is whether buyers can defend the breakout or whether this move is becoming an opportunity for short-term holders to take profits. The supplied Bybit screenshot shows ZECUSDT trading at $1,304.78, up 7.04%, after reaching $1,331.29. Price has rallied sharply from the displayed 24-hour low of $1,218.43, but the latest candles are pulling back from the local high. That makes the $1,300 area an important short-term test rather than proof that the rally will continue. The broader market data adds an important clue: ZEC's recovery is occurring alongside heavy derivatives activity. CoinGlass reports approximately $2.86 billion in futures open interest, $6.34 billion in 24-hour futures volume and $380.96 million in spot volume in its retrieved snapshot. These figures indicate substantial leveraged participation, but not necessarily equivalent spot buying. CoinGlass A separate derivatives snapshot reported roughly $7.48 million in short liquidations versus $717,510 in long liquidations, suggesting that short covering helped support the advance. Because provider timestamps and coverage differ, these numbers should be treated as snapshots, not perfectly synchronized measurements. TradRadar The on-chain picture is less straightforward. Zcash supports shielded transactions that conceal sender, recipient and transaction amounts, limiting what public blockchain data can establish about individual whale accumulation or distribution. I could not independently verify a current net exchange-flow figure, so claiming that whales are accumulating would go beyond the evidence. Zcash Documentation 6.12.2 documentation +1 Key figures * Current price: $1,304.78 (supplied Bybit screenshot) * 24-hour change: +7.04% * Recent high: $1,331.29 * 24-hour low: $1,218.43 * Market capitalization: approximately $22.4 billion in the retrieved market snapshot. ZecStats * Futures open interest: approximately $2.86 billion in the retrieved CoinGlass snapshot. CoinGlass * Verified whale net flows: unavailable. Bullish confirmation: ZEC needs to reclaim $1,331 and hold above it with expanding spot volume. A sustained breakout could bring $1,350 and then the $1,365–$1,370 region into focus, where previous daily price action showed resistance. Falling exchange supply, if independently confirmed, would strengthen the case. Bearish confirmation: Rejection below $1,331 followed by a loss of $1,300 would weaken immediate momentum. A break below $1,280 could expose $1,260, while $1,218 remains the key reference from the screenshot's 24-hour range. Rising open interest during a price decline would raise the risk of leveraged liquidations. The central conflict is clear: ZEC has strong upward momentum, but derivatives positioning and short covering may be amplifying the move. The next decisive signal is whether spot demand can absorb profit-taking above $1,331. Until that happens, this is a recovery attempt—not a confirmed continuation of the uptrend. #ByXIMPACT $ZENUSDT

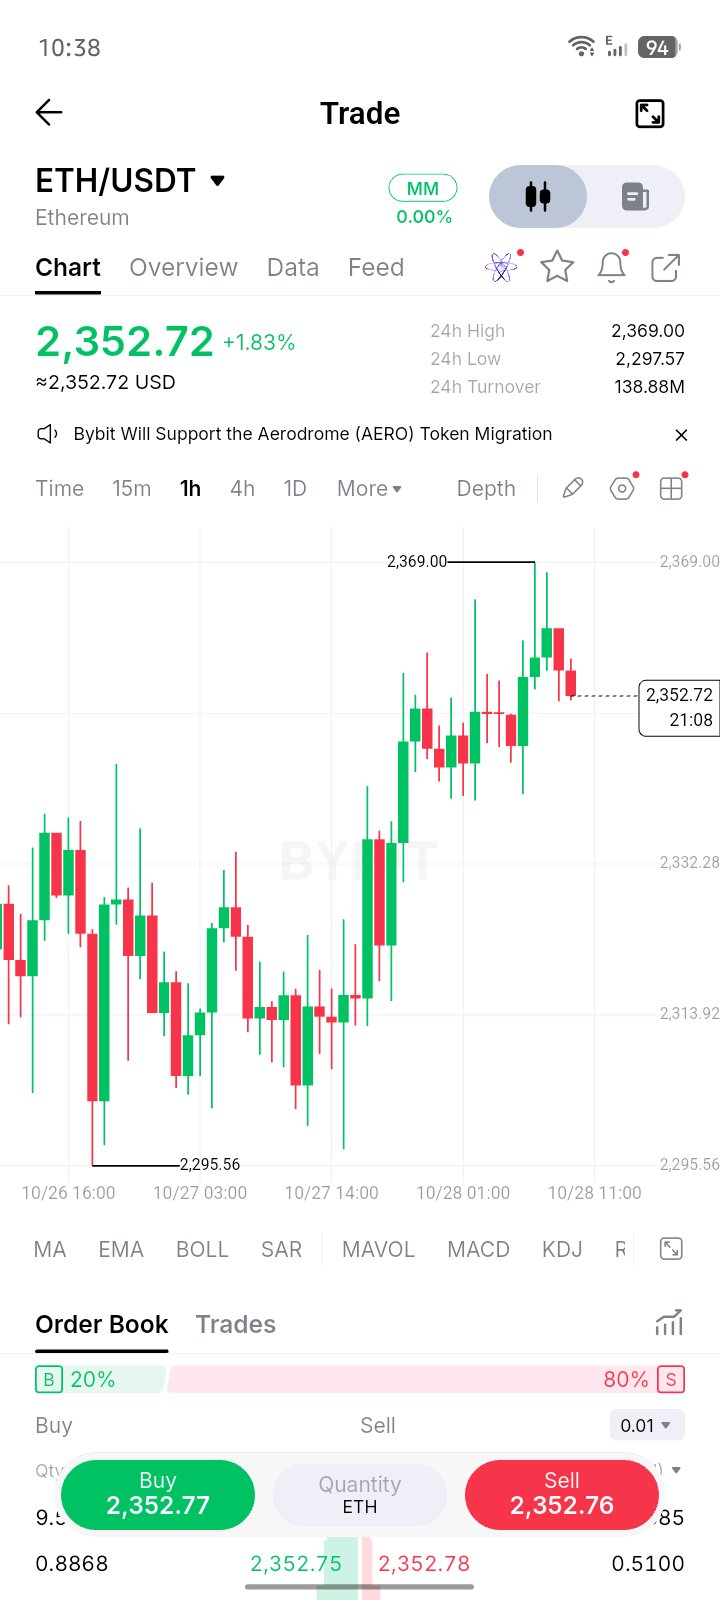
Ethereum is approaching a decision point around $2,350, and the important question is whether buyers can turn this recovery into a sustained breakout or whether sellers will defend the $2,369 area again. The one-hour chart shows a strong rebound from the $2,300 region, but price strength alone does not tell us whether fresh spot demand, whale accumulation, or leveraged positioning is driving the move. The key is to see whether ETH can hold its reclaimed levels while trading activity confirms the recovery. On-chain data adds an important complication. TrackWhale's October 28 snapshot reported approximately 266,290 ETH in exchange inflows versus 340,340 ETH in outflows over seven days, producing a net outflow of roughly 74,060 ETH. That leans toward reduced exchange-held supply, although transfers can reflect custody changes or internal wallet movements rather than genuine accumulation. TrackWhale +1 There is also a counterweight: Lookonchain reported that a long-dormant Ethereum ICO wallet transferred 1,500 ETH, worth approximately $3.48 million, to sell, while U.S. spot ETH ETFs recorded about $88.6 million in net outflows on October 26. These are signs of potential supply pressure, not proof that the entire market is distributing. Looking for smartmoney onchain +1 Derivatives positioning makes the breakout less straightforward. CoinGlass showed approximately $30.07 billion in futures open interest, $31.55 billion in futures volume, and $1.51 billion in spot volume in its latest displayed snapshot. TradRadar separately reported positive funding of 0.0088% per eight hours and approximately $37.28 million in liquidations, mostly shorts. Different providers and update times mean these figures should not be combined as if they were one synchronized snapshot. CoinGlass +1 Key figures — ETH/USDT * Current price: $2,352.72 (your screenshot) * Recent 24-hour high: $2,369.00 * Recent 24-hour low: $2,297.57 * First resistance: $2,369–$2,373 * Immediate support: $2,332, then $2,313 * Deeper support: $2,298–$2,295 * Market capitalization: approximately $286–$288 billion, depending on provider and timestamp. CoinGlass +1 Bullish confirmation: ETH needs to break and hold above $2,369–$2,373 with stronger spot participation. A successful reclaim would bring $2,390–$2,412 into view, based on recent price history. Continued net exchange outflows would strengthen this case. Bearish confirmation: Rejection near resistance followed by a sustained break below $2,332 would weaken the recovery. Losing $2,313 would expose the $2,298–$2,295 zone. Rising exchange inflows, persistent ETF outflows, or expanding long leverage without spot demand would reinforce downside risk. The central conflict is clear: ETH's price structure is recovering, but the strength of underlying demand remains unproven. The next signal worth watching is whether spot buying can absorb selling near $2,370 without excessive dependence on short liquidations. Until that happens, this looks like a recovery attempt—not a confirmed trend reversal. #ByXIMPACT $ETHUSDT

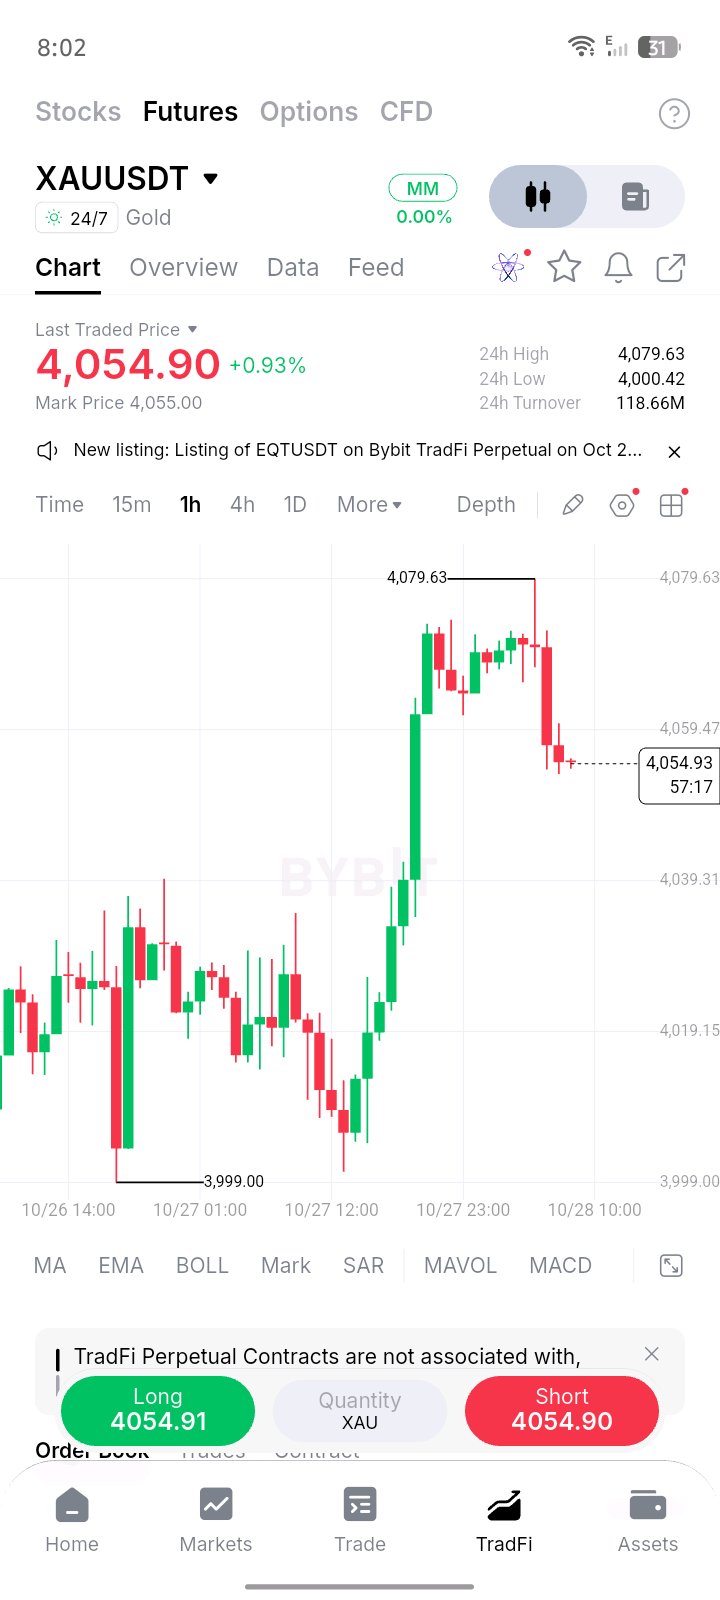
📊 XAUUSDT • GOLD • 1H CHART 🔥 GOLD MADE A BIG MOVE… BUT IS THE RALLY LOSING STEAM? I’m watching Gold closely right now. 👀 Price pushed up strongly from the $4,000 area and reached $4,079.63, but sellers stepped in near the top. Now Gold is trading around $4,054.90, and I want to see what happens next. The bullish momentum is still worth watching, but I wouldn’t rush into a trade without confirmation. 🚀 My Long Plan * Entry: $4,055–$4,060 after confirmation * TP1: $4,065 * TP2: $4,075 * TP3: $4,085 * SL: $4,044 🐻 My Short Plan * Entry: Below $4,039 after a confirmed breakdown and retest * TP1: $4,030 * TP2: $4,020 * TP3: $4,005 * SL: $4,052 📌 The levels I’m watching: * Resistance: $4,070–$4,080 * Support: $4,039–$4,045 Personally, I’d rather wait for a clear signal than jump into a trade just because the candles look exciting. Sometimes patience saves more money than a perfect entry. 🎯 Trading fam, what’s your view? 👇 🚀 Gold going higher or 🐻 another pullback coming? Share your thoughts with the trading fam! 🤝 #ByXIMPACT $XAUTUSDT

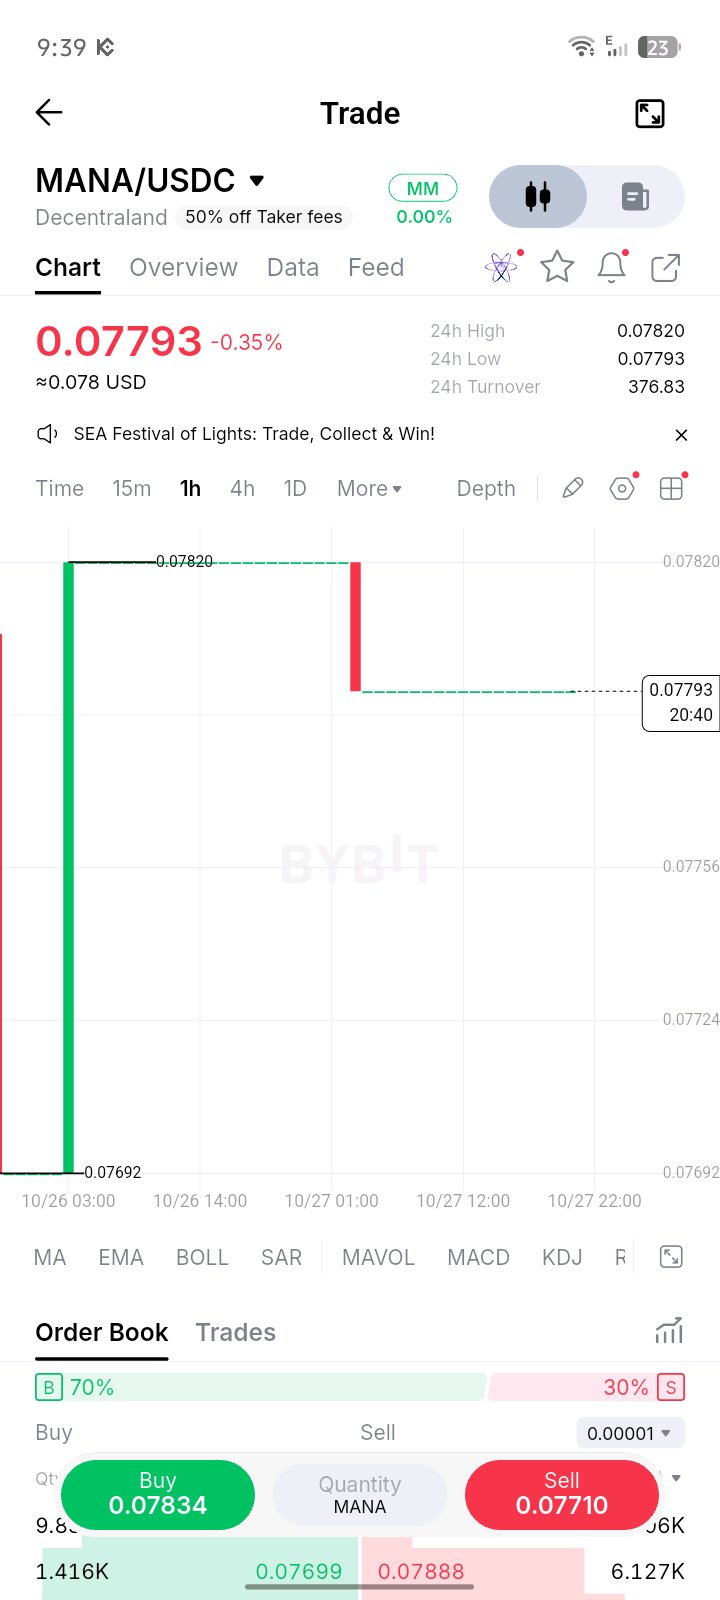
🚨 **$MANA JUST DID SOMETHING WEIRD, AND ALMOST NOBODY'S TALKING ABOUT IT** 🚨 Look at this 1H chart on Bybit 👇 📊 **MANA/USDC: 0.07793 (-0.35%)** 🟢 One giant green candle shot straight up from **0.07692** to **0.07820** 🔴 Then one red candle dropped, and the price has been sitting flat since ⚡ Price now sits right at the **24h low (0.07793)** **All the numbers:** • 24h High: 0.07820 • 24h Low: 0.07793 • 24h Turnover: just **376.83**, which is paper thin 👀 • Range: 0.07692 → 0.07820 • Order book: **70% buyers vs 30% sellers** 🟢 • Top bid: 0.07699 (1.416K) • Top ask: 0.07888 (6.127K) • Quick Buy: 0.07834 | Quick Sell: 0.07710 **🔥 Why this is wild:** 1️⃣ The candles are huge but the volume is tiny. Thin liquidity means a small order can move this chart a lot. 2️⃣ Buyers hold 70% of the book, yet price still sits at the day's low. Someone is stacking bids while the ask wall at 0.07888 stays heavy. 3️⃣ The spread between Buy and Sell is wide, so market orders here will cost you. 4️⃣ Bybit has **50% off taker fees** on this pair right now 💸 **🧠 What I'm watching:** ✅ A break above **0.07820** would flip the mood bullish ⚠️ A drop below **0.07692** would mean the bids gave up Either way, a move this quiet doesn't last long. 🌪️ ⚠️ *Not financial advice. Thin markets are risky. Use limit orders and do your own research.* #ByXIMPACT $MANAUSDT

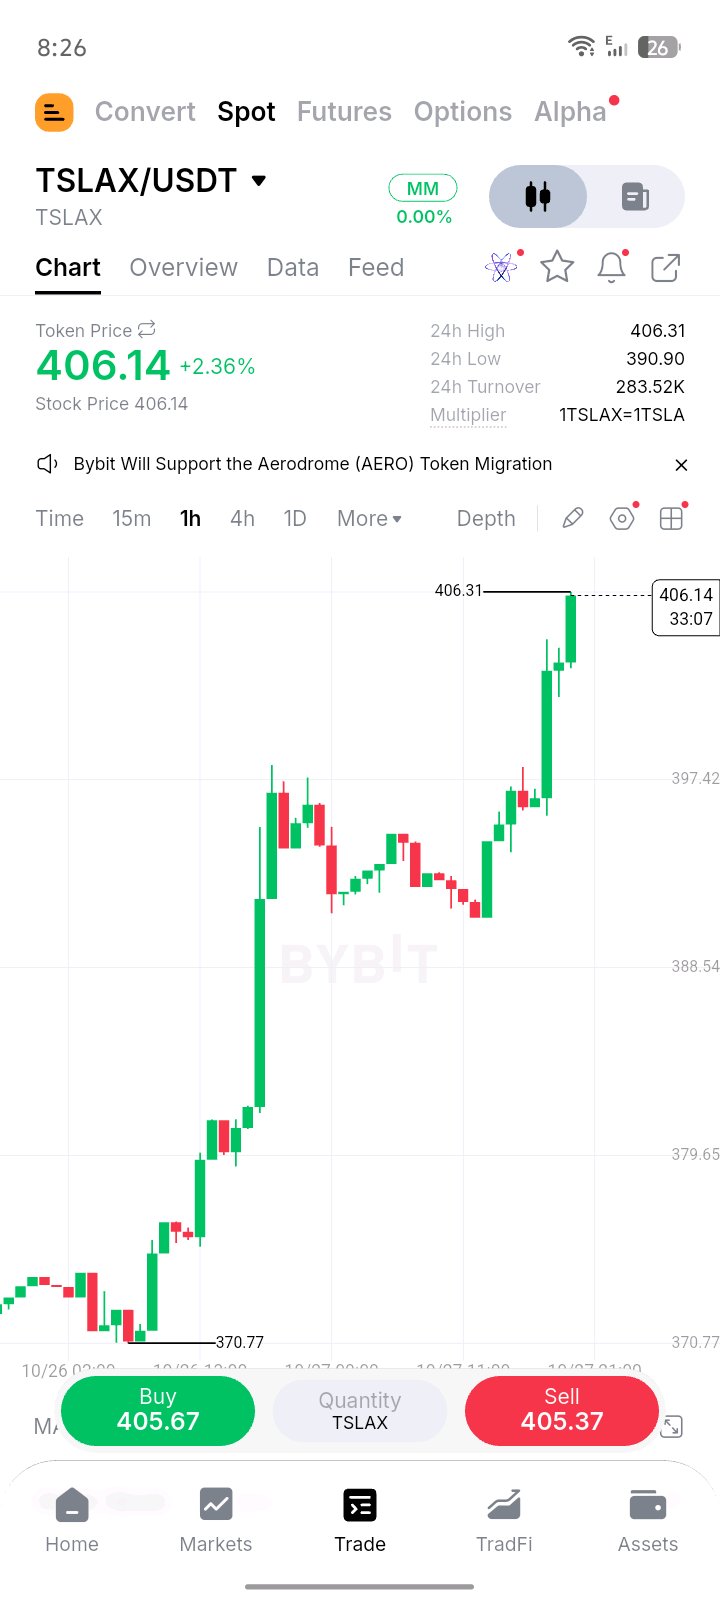
🚨 **TESLA JUST WENT NUCLEAR ON-CHAIN, AND THE 1H CHART DOESN'T LIE** 🚨 Most people were asleep. The chart wasn't. 👇 📉 **From 370.77...** 💥 **...to 406.31 in a straight-line vertical run!** That's roughly **+9.6% from the bottom**, with almost no pullback. 🟢🟢🟢 📊 **TSLAX/USDT on Bybit Spot** 💰 Token Price: **$406.14** (+2.36% today) 🔺 24h High: **406.31** 🔻 24h Low: **390.90** 💵 24h Turnover: **283.52K** ⚖️ Multiplier: **1 TSLAX = 1 TSLA** 🟢 Buy: 405.67 | 🔴 Sell: 405.37 🧠 **What the 1H chart shows:** - Price bottomed at 370.77, then a massive green candle ripped it up. - It consolidated around 388 to 397, with sellers failing to push it lower. - Then came a fresh breakout, with 4 to 5 strong green candles in a row, closing right near the high. 🔥 Buyers are in full control right now, and **the tokenized Tesla stock trades 24/7**. No bell, no waiting for Monday. 🌍⚡ ⚠️ **The big question:** is this the start of a breakout, or a blow-off top? Price is sitting right at the 24h high, so **406 is the line to watch**. ✅ Hold above it and the momentum continues. ❌ Lose it and the pullback could be fast. #ByXIMPACT $TSLAXUSDT

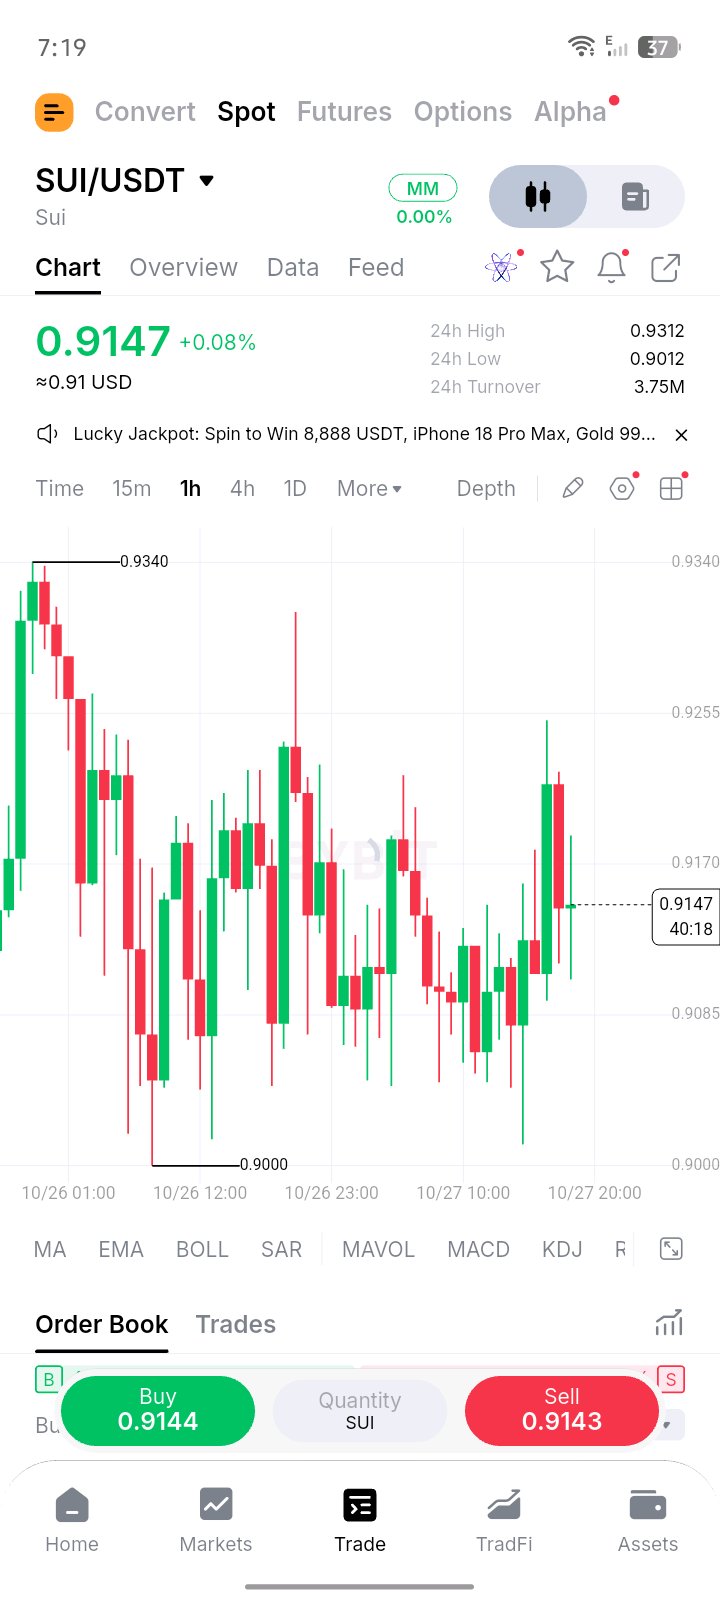
$SUIUSDT USDT — THE CALM BEFORE THE STORM?** 🚨 **$SUI is sitting at 0.9147 (+0.08%)**, and the 1H chart is telling a story most people are scrolling past. 👀 📊 **The Numbers** • Price: 0.9147 USDT (≈ $0.91) • 24h High: 0.9312 • 24h Low: 0.9012 • 24h Turnover: 3.75M • Chart high: 0.9340 | Chart low: 0.9000 🔥 **What the 1H chart shows** Price got rejected hard near **0.9340**, then bled down into a base around **0.9000**. That level has been defended again and again: long green wicks keep poking at it and buyers keep stepping in. 🛡️ Now look at the latest candles. A strong green push toward **0.9250**, a sharp red rejection, and then price stabilizing near **0.9147**. The market is **coiling**. 🌀 🎯 **Key Levels to Watch** 🟢 Support: 0.9085, then 0.9000 (the line in the sand) 🔴 Resistance: 0.9170, then 0.9255, then 0.9340 ⚡ **The Shocking Part** The whole move sits inside a tight **~3.5% range**. Compression like this rarely lasts. When it breaks, it usually breaks FAST. 💥 📈 **Bullish scenario:** A clean 1H close above **0.9170–0.9255** with volume could open the door to a retest of **0.9340**. 📉 **Bearish scenario:** Losing **0.9085** puts that 0.9000 floor under real pressure, and a breakdown there could get ugly. 🧠 **Pro Tip:** Don't chase the first candle. Wait for the close, confirm with volume, and always set your stop. Range breakouts love to fake out impatient traders. 🎣 💬 **Which way do YOU think it breaks, UP 🚀 or DOWN 🩸?** Drop your call below! 👇 Not financial advice. Crypto is volatile. Always DYOR and manage your risk.* #ByXIMPACT

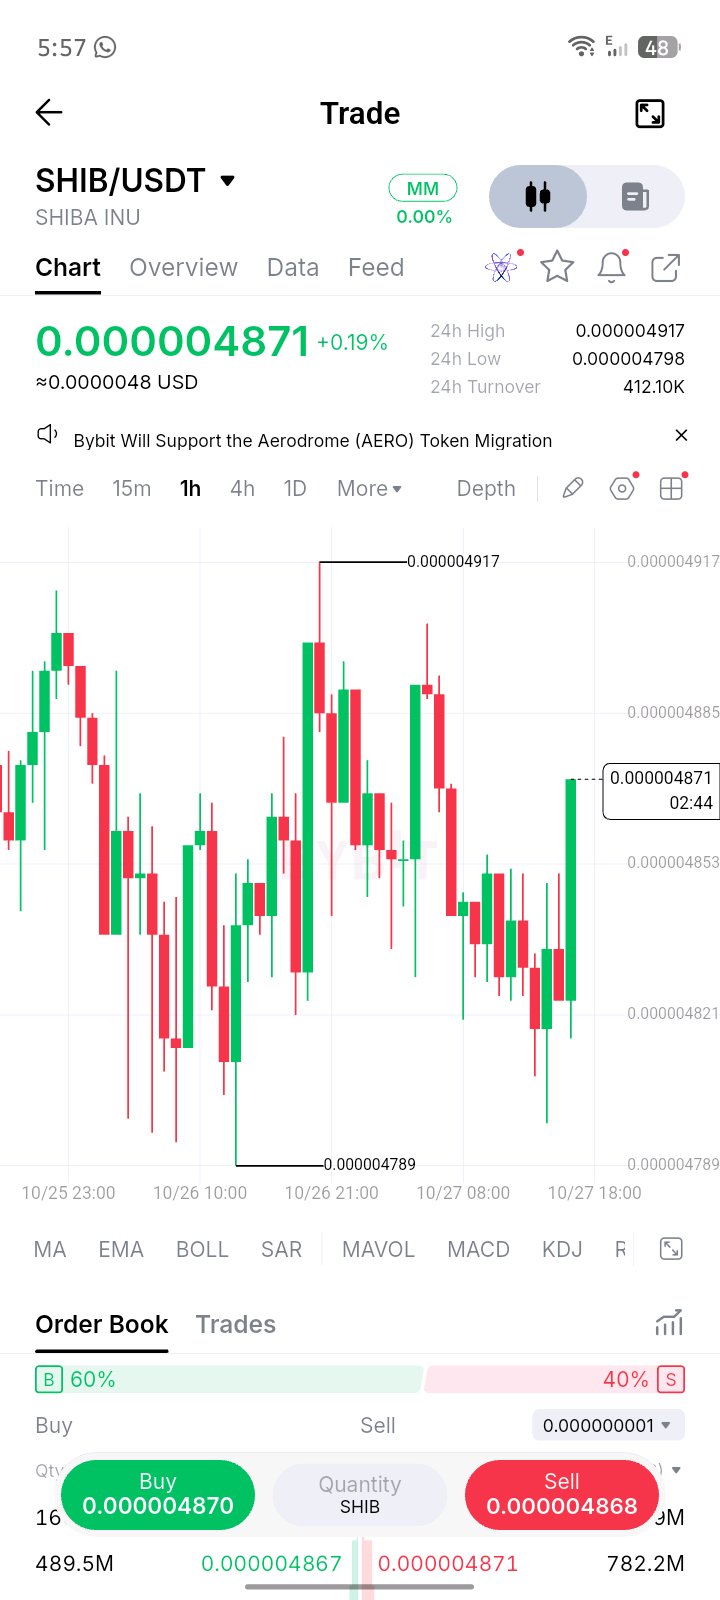
🚨🐕 SHIB IS WAKING UP… AND THIS MOVE COULD GET LOUD! 🔥 $SHIB / USDT is showing a serious momentum shift on the 1H chart. After chopping around the 0.00000482–0.00000486 zone, SHIB just printed a strong green candle and pushed back to: 🎯 CURRENT: 0.000004871 📈 24H: +0.19% 🔥 24H HIGH: 0.000004917 🧊 24H LOW: 0.000004798 💰 24H TURNOVER: ~412.1K But here’s what makes this interesting 👀👇 🟢 BUY SIDE: ~60% 🔴 SELL SIDE: ~40% That gives the bulls a noticeable edge in the displayed order-book snapshot. ⚡ THE LEVELS TO WATCH 🚧 Resistance 1: 0.000004885 🚨 Major resistance: 0.000004917 If SHIB breaks and holds above 0.000004917, the market could start looking for the next upside expansion. On the other hand… 🛡️ Support: 0.000004853 🛡️ Key support: 0.000004821 💥 Major downside level: 0.000004798 A clean loss of 0.000004798 would weaken this bullish setup significantly. 🐕🔥 THE SHIB MOMENT The chart spent hours consolidating, sellers repeatedly pushed price down, and then buyers suddenly stepped in with a powerful green candle. That’s exactly the kind of transition traders watch for: Compression → Liquidity → Momentum → Breakout attempt. ⚡ But don’t chase the candle blindly. The real confirmation is simple: 🔥 Break 0.000004917 + hold = bulls showing strength ⚠️ Reject resistance = possible range continuation 🔻 Lose 0.000004798 = bullish setup invalidated SHIB doesn’t need much movement for the percentage gains to become explosive. The question isn’t whether SHIB can move… The question is WHICH SIDE GETS TRAPPED FIRST. 👀🐕💥 #ByXIMPACT $SHIBUSDT

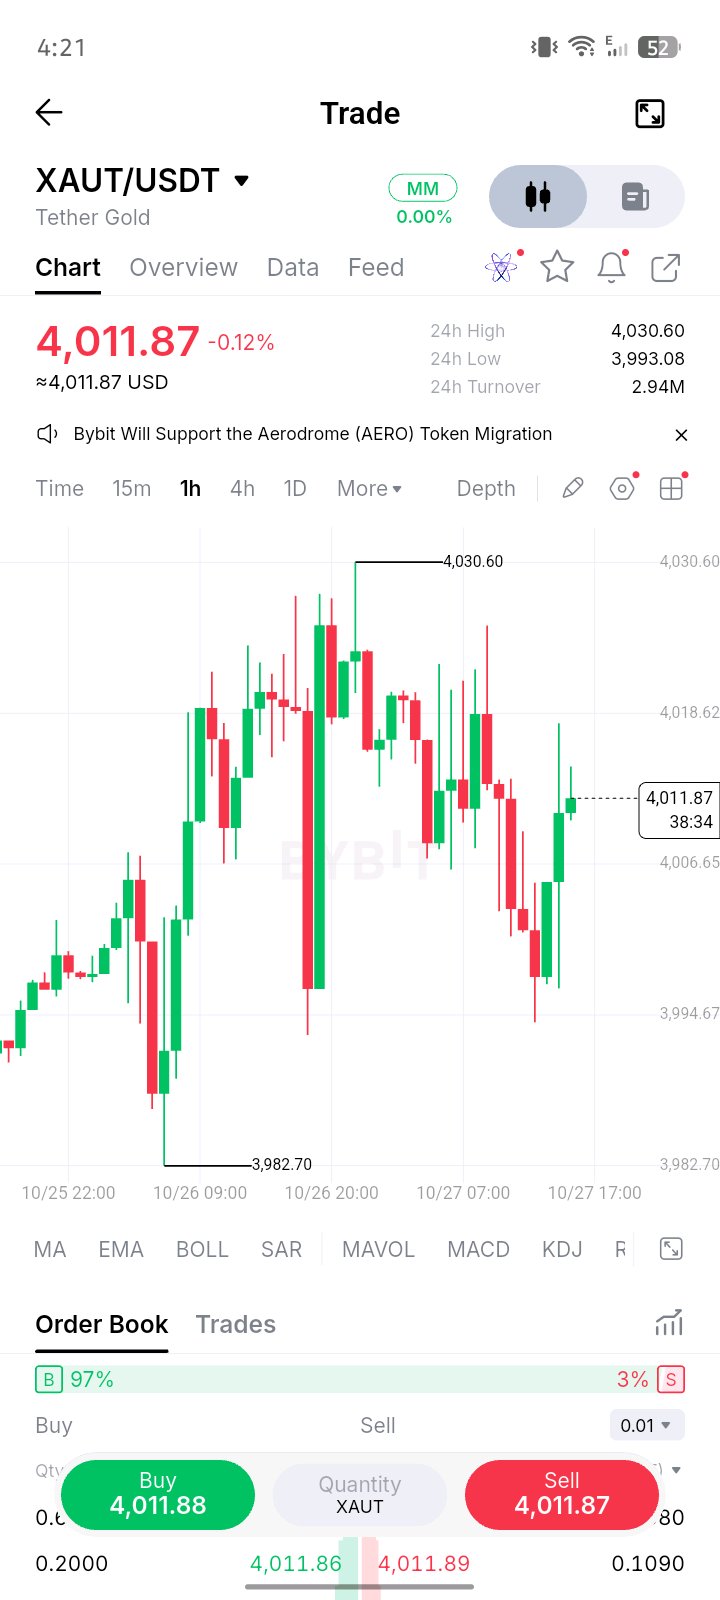
🚨🔥 XAUT/USDT — GOLD IS WAKING UP! 🔥🚨 Gold just pulled off a nasty shakeout… and now the chart is showing signs of a serious fight between buyers and sellers. 👀⚔️ 📊 CURRENT SETUP 💰 Price: $4,011.87 📉 Change: -0.12% 🔺 24H High: $4,030.60 🔻 24H Low: $3,993.08 📈 24H Turnover: 2.94M ⏱️ Timeframe: 1H But here’s where it gets interesting… 😳 The chart shows a sharp rejection toward the $3,982.70 area, followed by a strong recovery back above $4,000. And right now… 🟢 Order Book: ~97% BUY 🔴 SELL: ~3% That imbalance is absolutely eye-catching. 👀🔥 🎯 LEVELS TO WATCH 🚀 Resistance 1: $4,018–$4,030 🔥 Breakout zone: Above $4,030.60 🎯 If bulls reclaim that high with strength → $4,050+ becomes an interesting upside zone. ⚠️ Support 1: $4,006–$4,000 🛡️ Major support: $3,993 💥 Critical swing zone: $3,982.70 If $4,000 holds, buyers may attempt another attack on the $4,018–$4,030 region. But if $3,993 breaks decisively, the recent recovery could turn into another nasty flush. 👀 The real trigger: $4,030.60 A clean 1H breakout and hold above that level could completely change the short-term structure. ⚡ XAUT isn't giving a boring chart right now. The volatility is building, the key levels are tight, and that visible order-book imbalance makes this one worth watching closely. 🚨 Don't chase the candle. Watch the confirmation. Not financial advice — trade with a plan and manage your risk. #ByXIMPACT $XAUTUSDT

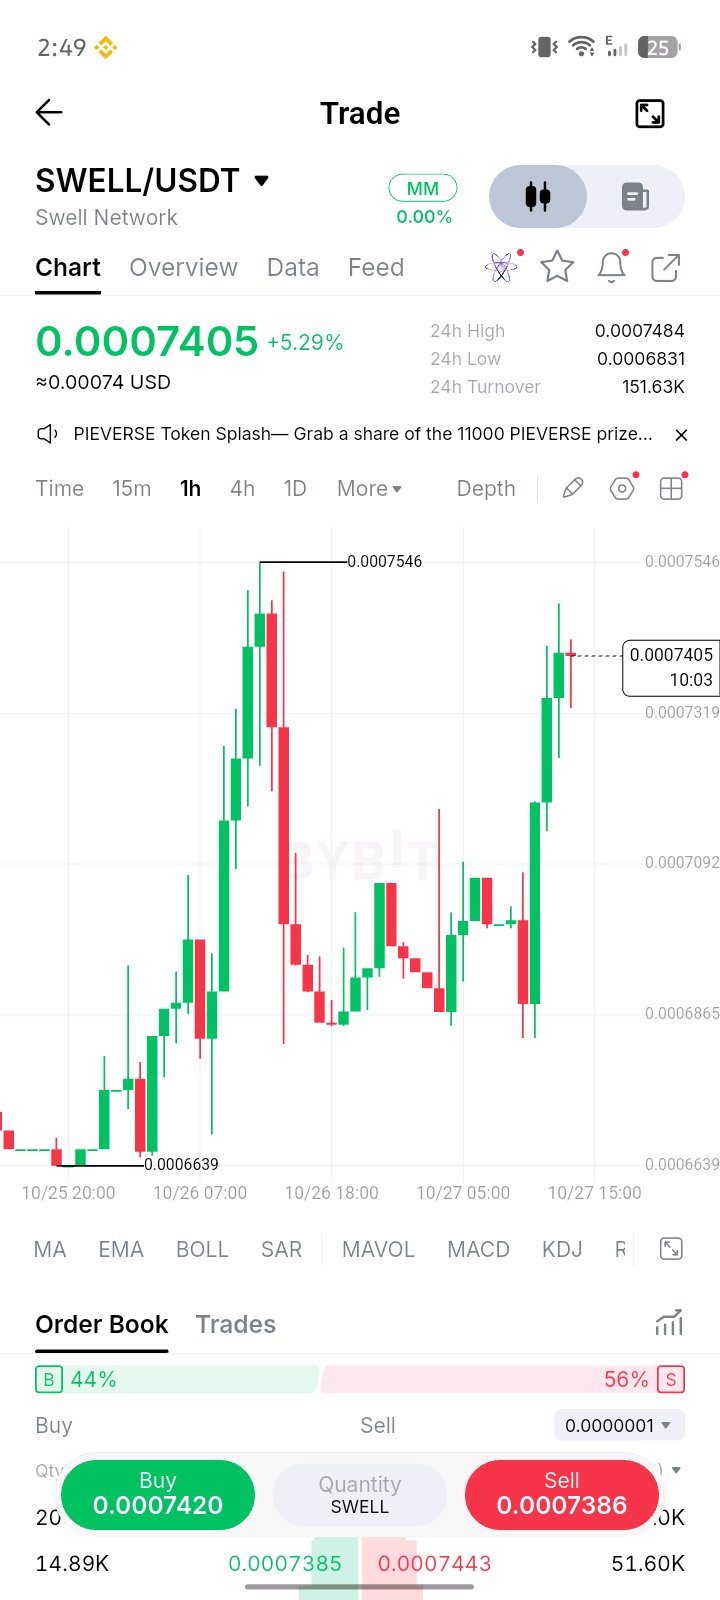
🚨 SWELL JUST WOKE UP… AND THIS MOVE IS GETTING SERIOUS! ⚡🔥 $SWELL / USDT is showing a +5.29% move, currently around 0.0007405 — and the 1H chart is flashing a setup traders will definitely want to watch. 👀 📊 WHAT THE CHART IS SAYING: • Current Price: 0.0007405 • 24H High: 0.0007484 • 24H Low: 0.0006831 • 24H Turnover: 151.63K • Key chart high: ~0.0007546 • Recent low/support zone: ~0.000686 • Buy/Sell order-book split: 44% Buy / 56% Sell 🔥 The interesting part? SWELL has pushed aggressively upward from the 0.000686 area, printing several strong green 1H candles and reclaiming the 0.00073–0.00074 zone. Now price is sitting just beneath the 0.000748–0.000755 resistance area. ⚠️ THIS IS THE DECISION ZONE. If bulls smash through 0.000755 with strong volume and hold it as support, the breakout could become much more interesting. 🚀 But if price gets rejected hard around that resistance, a pullback toward 0.00072 / 0.00070 could happen before another attempt. 🎯 LEVELS TO WATCH 🟢 Breakout zone: 0.000748–0.000755 🟢 Potential upside checkpoints: 0.00078 → 0.00080 → 0.00085 🟡 First support: 0.00072 🟡 Major nearby support: 0.00070–0.000686 🔴 Losing 0.000686 would weaken the current bullish structure. 💥 THE SHOCKING PART: SWELL has already made a sharp recovery from the recent lows, and price is now knocking directly on the previous peak. Break the ceiling → momentum traders may rush in. Reject the ceiling → patience becomes the weapon. No blind FOMO. No chasing green candles. Watch the breakout + volume + retest. 🧠📈 #ByXIMPACT $SWELLUSDT

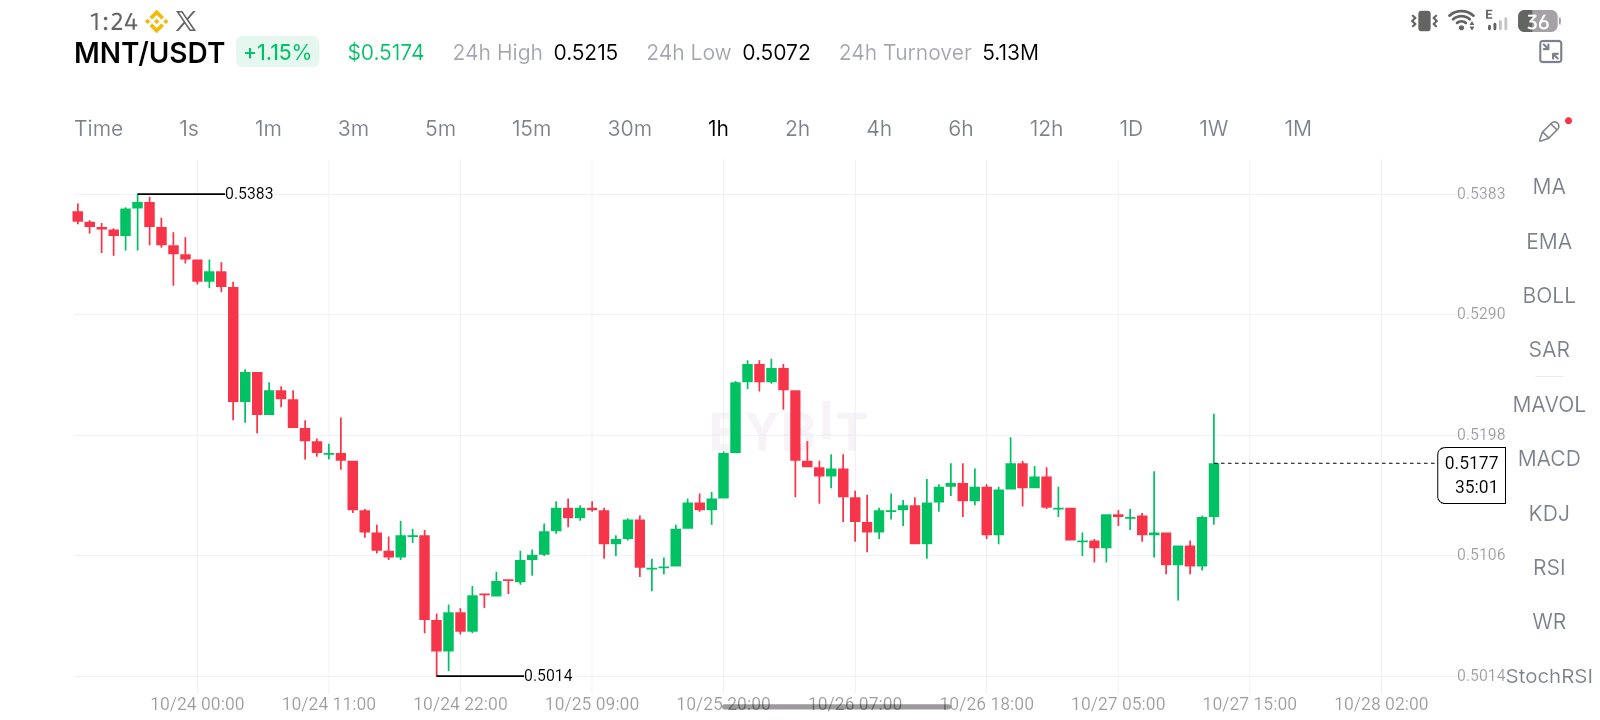
🚨 MNT/USDT — THE QUIET MOVE MAY BE OVER 👀🔥 MNT is sitting around $0.5174 (+1.15%), and the chart is starting to look VERY interesting. After falling from the $0.5383 area down to around $0.5014, MNT has spent days building a base instead of continuing the breakdown. Now look at what just happened… 👇 ⚡ PRICE: $0.5174 📈 24H HIGH: $0.5215 📉 24H LOW: $0.5072 💰 24H TURNOVER: 5.13M The latest 1H candle shows a powerful push upward from the $0.510–$0.512 zone. That makes the next few candles VERY important. 🎯 KEY RESISTANCE • $0.5198 — immediate breakout zone • $0.5215 — 24H high / first major test • $0.5290 — next psychological resistance • $0.5383 — major previous high 🛡️ KEY SUPPORT • $0.5120–$0.5106 — first support zone • $0.5072 — recent 24H low • $0.5014 — major chart support 🔥 THE INTERESTING PART If MNT can reclaim and hold above $0.5198–$0.5215 with strong volume, the market could suddenly start paying attention. A clean breakout could open the path toward: ➡️ $0.5290 ➡️ $0.5383 But here's the trap… ❌ A rejection around $0.5198–$0.5215 followed by a loss of $0.5106 could send price back toward $0.5072, with $0.5014 becoming the bigger downside level. So this isn't the moment to blindly chase a green candle. 👀 WATCH THE BREAKOUT. WATCH THE VOLUME. WATCH THE RETEST. MNT is approaching a decision point. The next move could turn this boring range into a very interesting chart. ⚡ Bullish above the resistance zone. Cautious below support. No confirmation = no chase. #ByXIMPACT $MNTUSDT

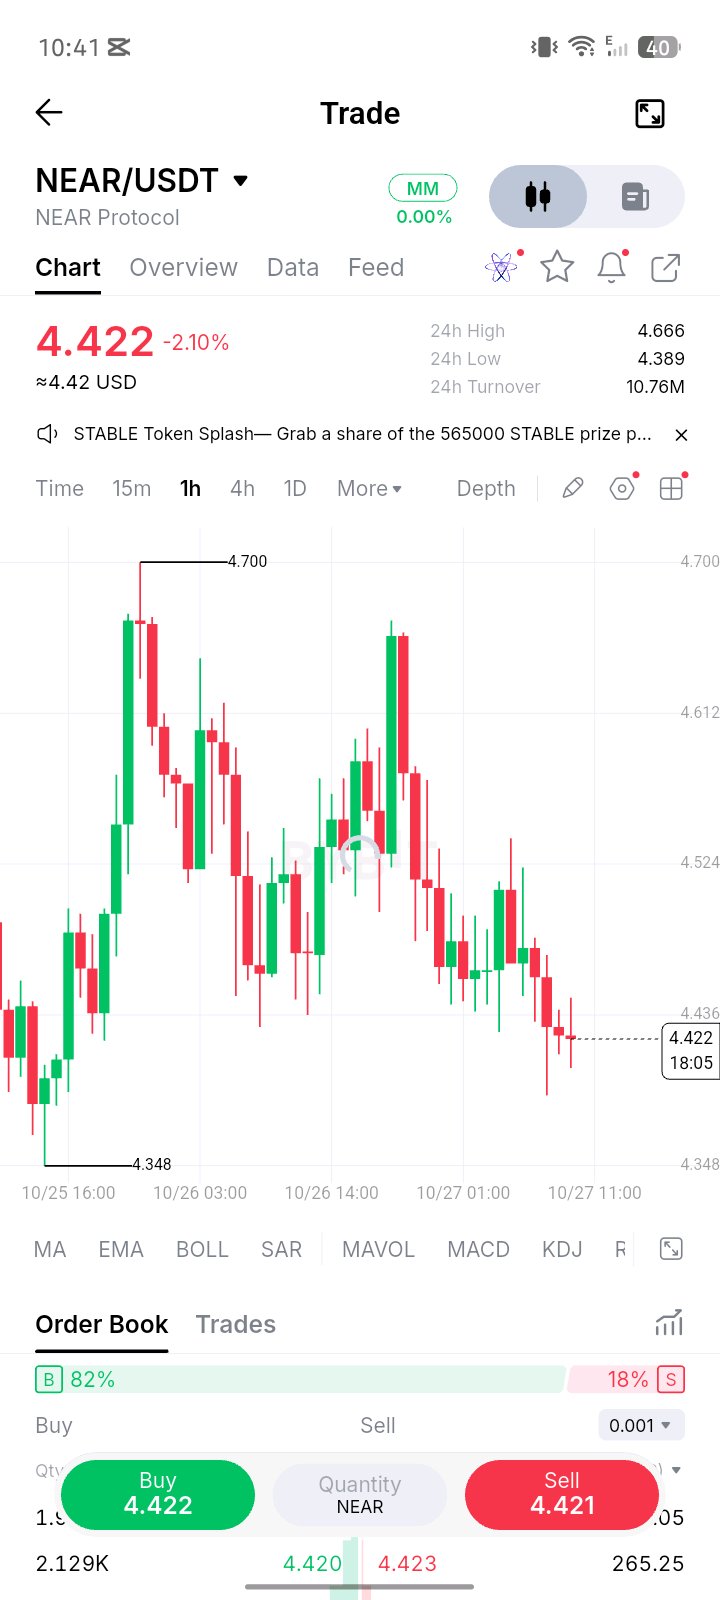
🚨 NEAR/USDT IS AT A DANGEROUS DECISION ZONE! 🚨 NEAR is currently trading around $4.422, down -2.10% on the 1H chart. But the interesting part isn’t the red candle… 👀 It’s WHERE the price is sitting. 📊 1H MARKET SNAPSHOT: 💰 Current: $4.422 🔻 24H Change: -2.10% 📈 24H High: $4.666 📉 24H Low: $4.389 💵 24H Turnover: $10.76M After getting rejected from the $4.60+ area, NEAR has been printing a series of lower highs and drifting toward the $4.39 support zone. And now comes the interesting part… ⚠️ 🔥 KEY SUPPORTS • $4.389 — immediate 24H low / critical zone • $4.348 — major visible chart support 🚀 KEY RESISTANCES • $4.436 — first hurdle • $4.524 — important recovery zone • $4.612 — major resistance • $4.700 — psychological breakout level If buyers defend $4.39–$4.35, a sharp relief move toward $4.52 → $4.61 could become interesting. BUT… 😳 If $4.35 breaks decisively, the current structure could deteriorate further. 👀 The order-book snapshot is also showing a heavily buy-weighted display — around 82% Buy vs 18% Sell — but remember, order-book ratios can change extremely fast and should NOT be treated as guaranteed support. 🎯 THE REAL BATTLE IS HERE: $4.35–$4.39 = DEFENSE ZONE 🛡️ $4.52 = FIRST RECOVERY TARGET ⚡ $4.61–$4.70 = BIG RESISTANCE WALL 🧱 NEAR is sitting at the kind of level where one strong volume candle can completely change the short-term story. Breakdown? 🩸 Reversal? 🚀 The next few 1H candles may decide it. 👀🔥 Not financial advice. Trade with your own risk management. DYOR. $NEARUSDT #ByXIMPACT

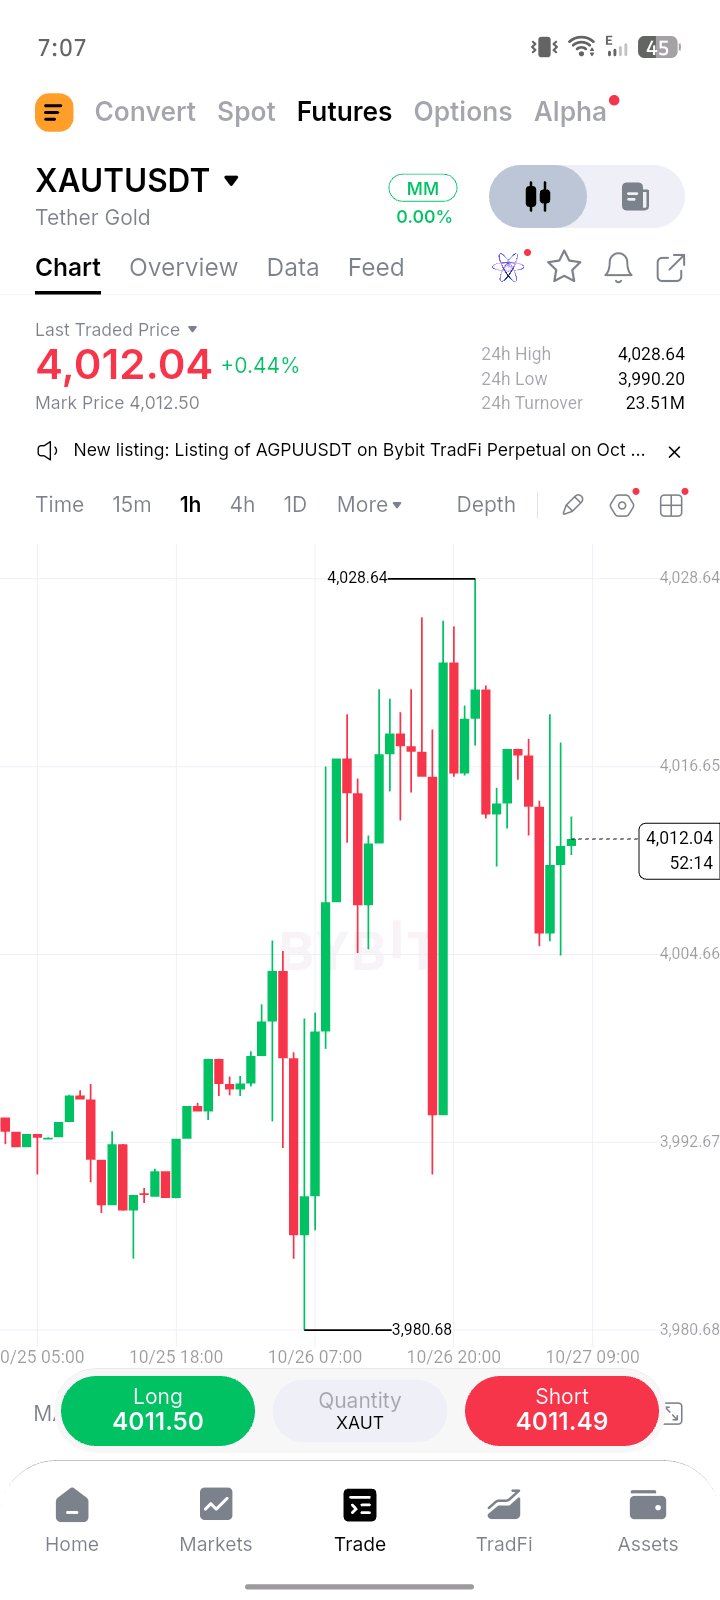
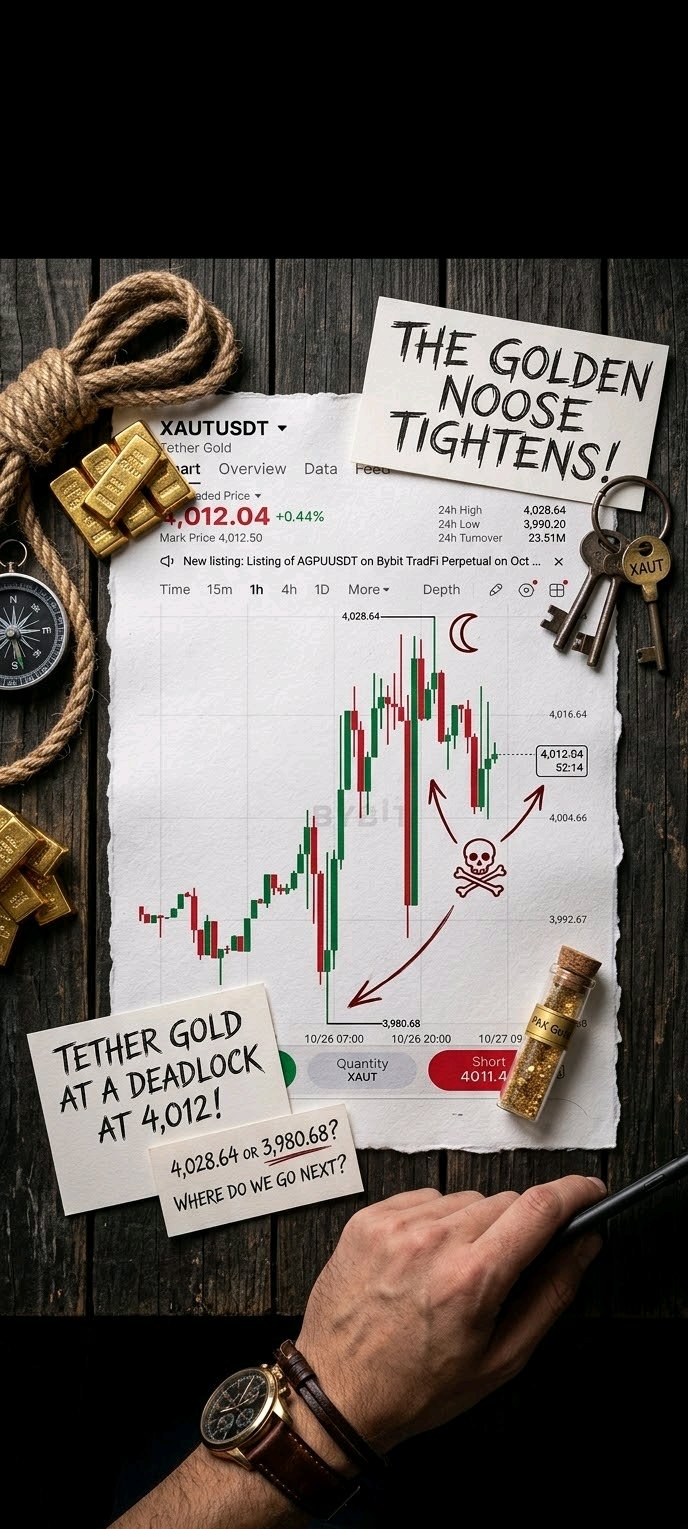
🚨 SHOCKING BREAKOUT: Gold Just Smashed Through New Territory! 💥 The markets are absolute chaos right now, and if you aren't paying attention, you are missing history in the making! Look at the numbers on the screen. This isn’t a drill—XAUTUSDT (Tether Gold Futures) is putting on a masterclass in volatility and raw market power. 📊 The Breakdown of the Madness: * Last Traded Price: 4,012.04—sitting up +0.44% and holding strong! * 24h High: Reached a blistering 4,028.64 before facing intense pressure. * 24h Low: Plunged down to a deep 3,990.20 earlier in the session, catching weak hands off guard. * 24h Turnover: A massive 23.51M flowing through the order books, showing insane liquidity and trader hunger. 🔥 What’s Happening on the Chart? Look at those 1-hour candles! The battle between bulls and bears is reaching a boiling point. After tapping that absolute ceiling at 4,028.64, a fierce rejection sent shockwaves down to the 3,980.68 floor, only for the buyers to step in with absolute aggression and claw their way back above 4,012. * Are the bulls about to reload for another legendary charge past 4,030? * Or are the bears setting a trap for a deeper retest? The tape is moving fast, emotions are running high, and every second counts in this arena. > ⚡️ The Takeaway: Fortune favors the bold, but volatility rewards the prepared. Keep your eyes glued to the charts—the next major move could happen in a heartbeat! > Are you riding the long wave or bracing for a short drop? Let’s talk about your strategy below! $XAUTUSDT #ByXIMPACT

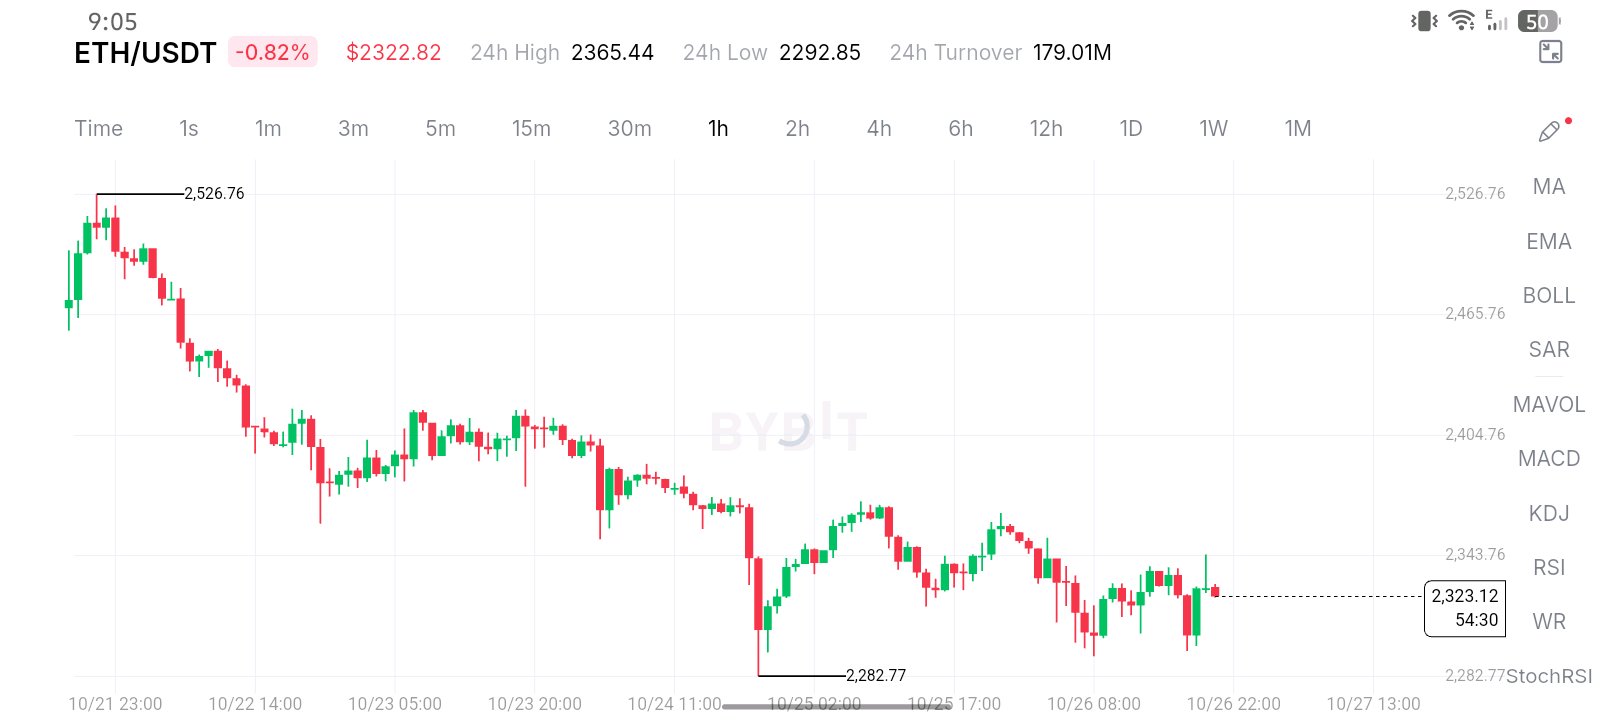
🚨⚡ ETHEREUM AT A CRITICAL CROSSROADS! THE NEXT MOVE COULD SHOCK THE MARKET! ⚡🚨 🔥 ETH/USDT — BEARS IN CONTROL, BUT BULLS ARE FIGHTING BACK! 🔥 Ethereum is trading around $2,322.82, and the 1-hour chart is revealing a battle that traders cannot afford to ignore! 📉🐂 The market has been bleeding from the highs, but repeated reactions near the lower support zone suggest that the next decisive move could bring a dramatic change in momentum. 👀💥 📊 🔥 ETHEREUM MARKET BREAKDOWN 🔥 💰 Current Price: $2,322.82 🔻 24H Change: -0.82% 🚀 24H High: $2,365.44 🩸 24H Low: $2,292.85 💎 24H Turnover: 179.01M USDT ⏰ Chart Timeframe: 1H 📉 Visible Chart High: $2,526.76 🛡️ Visible Chart Low: $2,282.77 🐻 BEARS' ADVANTAGE — THE DOWNTREND IS STILL ALIVE! Ethereum has fallen significantly from the visible chart high near $2,526.76. The chart continues to show lower highs and lower lows, suggesting that sellers still have the upper hand. ⚠️ If ETH loses the $2,292–$2,283 support zone, bearish pressure could intensify, potentially opening the door to another downside move. 🐂 BULLS' SECRET WEAPON — CAN SUPPORT SAVE ETH? Buyers have stepped in during previous dips, including a sharp rebound from the visible low near $2,282.77. 🔥 If bulls defend support and reclaim the nearby resistance levels, a recovery toward $2,344 and $2,365 could become possible. But remember: a bounce is not the same as a confirmed trend reversal! 🎯 KEY PRICE LEVELS TO WATCH 🟢 Support Zone 1: $2,300–$2,293 🟢 Major Support: $2,283 🔴 Resistance 1: $2,344 🔴 Resistance 2: $2,365 🚀 Next Upside Area: $2,400–$2,405 ⚠️ Major Trend Challenge: $2,450+ 📈 BULLISH SCENARIO: If ETH holds support, builds buying pressure, and breaks above $2,344, traders may watch for a move toward $2,365 and potentially $2,400–$2,405. 📉 BEARISH SCENARIO: If ETH fails to reclaim resistance and breaks below $2,292–$2,283, the downtrend could extend. A confirmed breakdown would be more significant than a temporary wick below support. 🧠 THE SMART TRADER'S GAME PLAN ✅ Watch for a confirmed 1H candle close above or below key levels. ✅ Look for volume confirmation before trusting a breakout. ✅ Avoid chasing sudden green or red candles. ✅ Use a stop-loss and manage position size carefully. ✅ Remember that fake breakouts can trap both bulls and bears. 💣 THE BIG QUESTION: WILL ETHEREUM REBOUND OR BREAK DOWN? The chart currently favors caution because the broader visible structure remains bearish. However, the support zone is where the next important battle may unfold. 🔥 No blind predictions. No guaranteed profits. Just levels, patience, and disciplined trading! 👇 YOUR TURN, CRYPTO COMMUNITY! #ByXIMPACT $ETHUSDC $ETHUSDT

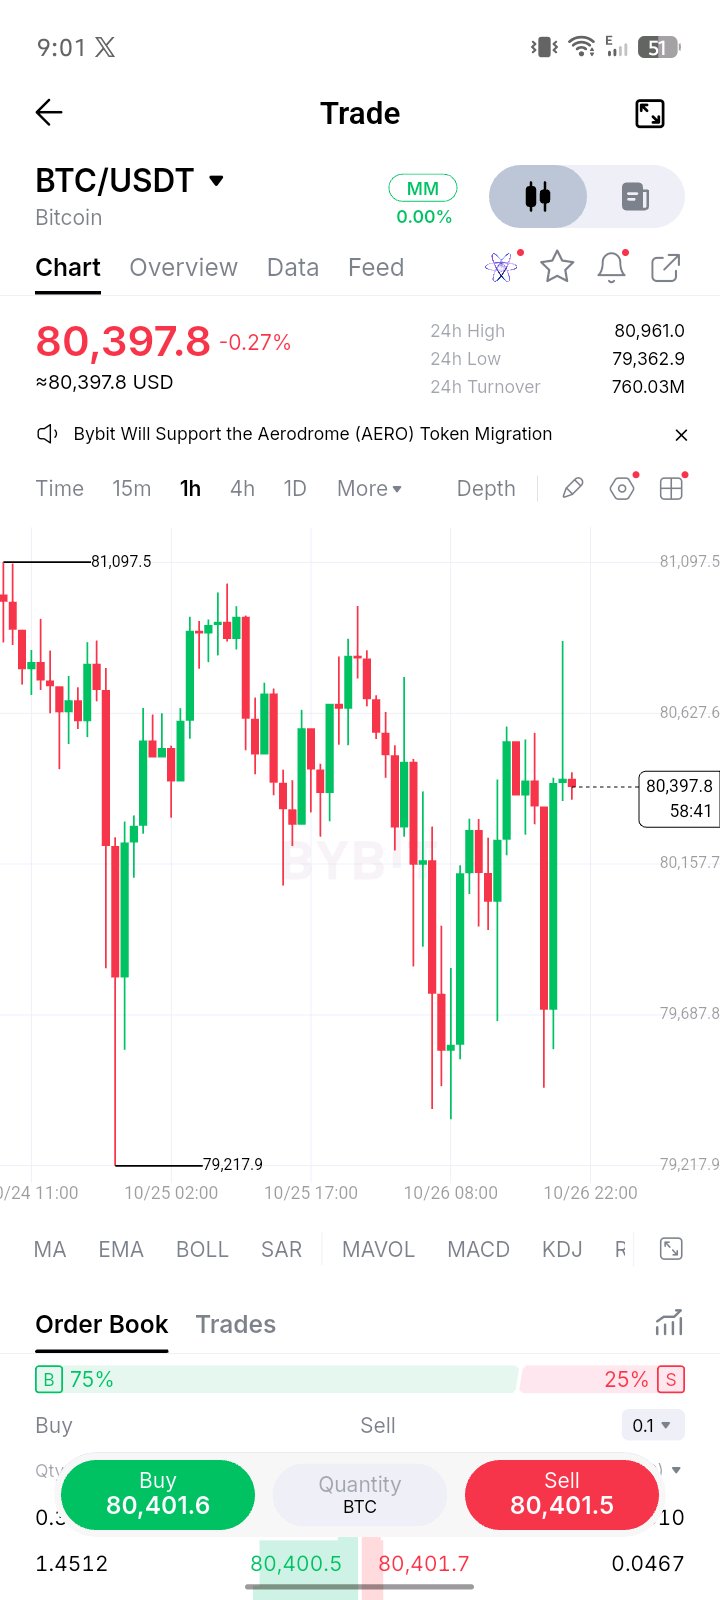
🚨⚡ BITCOIN AT A DANGEROUS CROSSROAD! $BTC IS PLAYING WITH FIRE 🔥📉📈 💥 BTC/USDT — THE NEXT BIG MOVE COULD SHOCK THE MARKET! Bitcoin is trading around $80,397.8 on the 1H chart, and the price action is getting WILD! 👀🐂🐻 One aggressive move up… one brutal rejection… and now BTC is fighting to find its next direction. Will the bulls take control, or will the bears drag Bitcoin back into the danger zone? ⚔️ 📊 LIVE CHART BREAKDOWN 🟢 Current Price: $80,397.8 🔴 24H Change: -0.27% 🚀 24H High: $80,961.0 🩸 24H Low: $79,362.9 💰 24H Turnover: $760.03M ⏳ Timeframe: 1 Hour (1H) 🎯 KEY LEVELS EVERY TRADER SHOULD WATCH 🟢 RESISTANCE ZONE • $80,600–$80,630 • $80,900–$80,960 A strong breakout and hold above resistance could open the door for another bullish push. 🚀 🔴 SUPPORT ZONE • $80,150–$80,200 • $79,680–$79,700 • $79,360–$79,220 If sellers regain control, these lower zones could come back into focus. A breakdown may trigger another wave of volatility. 🩸 🐂 BULLISH SCENARIO If BTC reclaims $80,630 and holds above it, buyers could challenge $80,900–$80,960 next. A convincing breakout is the confirmation bulls need. 🐻 BEARISH SCENARIO If BTC loses the $80,150 area and fails to recover, watch $79,700 and then the broader $79,360–$79,220 zone for potential downside tests. ⚠️ THE BIG WARNING: The chart shows sharp wicks in both directions. That means sudden reversals and stop-loss hunts are possible. Don't mistake one green candle for a confirmed trend reversal! 🧠 SMART TRADER GAME PLAN ✅ Wait for a candle close and confirmation. ✅ Watch volume around key levels. ✅ Set a stop-loss before entering. ✅ Keep leverage under control. ❌ Don't FOMO into a breakout. ❌ Never risk your entire account on one trade. 🔥 THE REAL QUESTION IS… Will Bitcoin explode above $80,960 and surprise the bears, or will another rejection send BTC tumbling toward $79,700? 👀 Keep your eyes on the levels. The next move matters—but confirmation matters MORE! #ByXIMPACT $BTCUSDT