Indicators
Technical analysis and tools are essential for traders and investors to assess an asset critically. We break down the complex concepts, and guide you in detail to help make sense of complicated candlesticks and wicks.
Total Articles
23
Learn From Smart Money: BTC’s Leverage Remains High as Traders Hedge Against Downside Risks
Traders seem to expect BTC’s momentum could slow down a bit after the price hit over $97,000.
View Details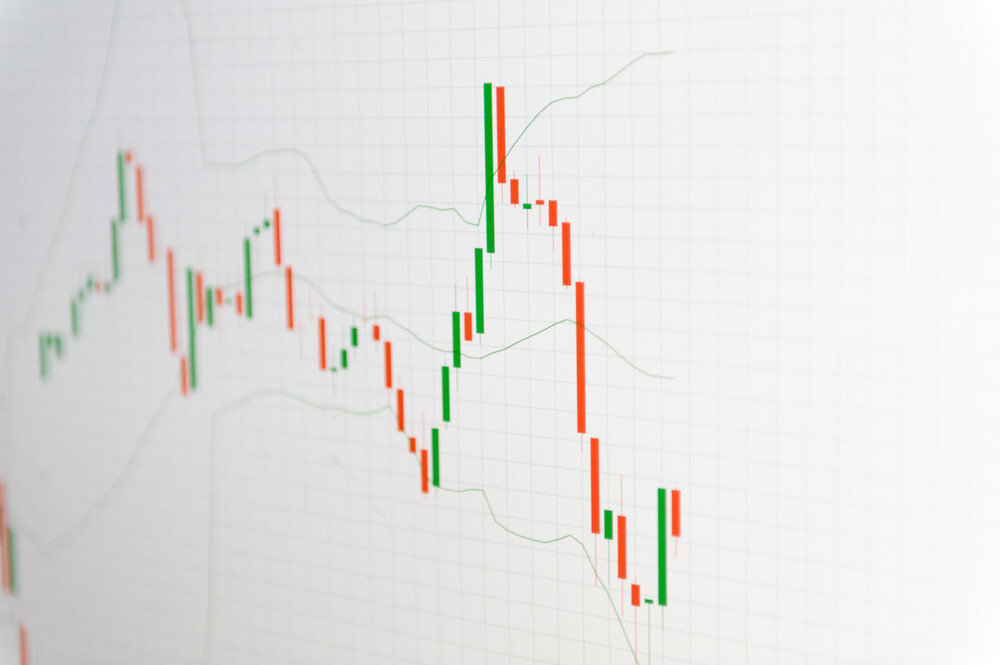
Explained: What Are Bollinger Bands & How to Use Them For Crypto Trading
Understanding how Bollinger bands work helps traders to critically identify the entry & exit points accurately. Learn the fundamentals now!
View Details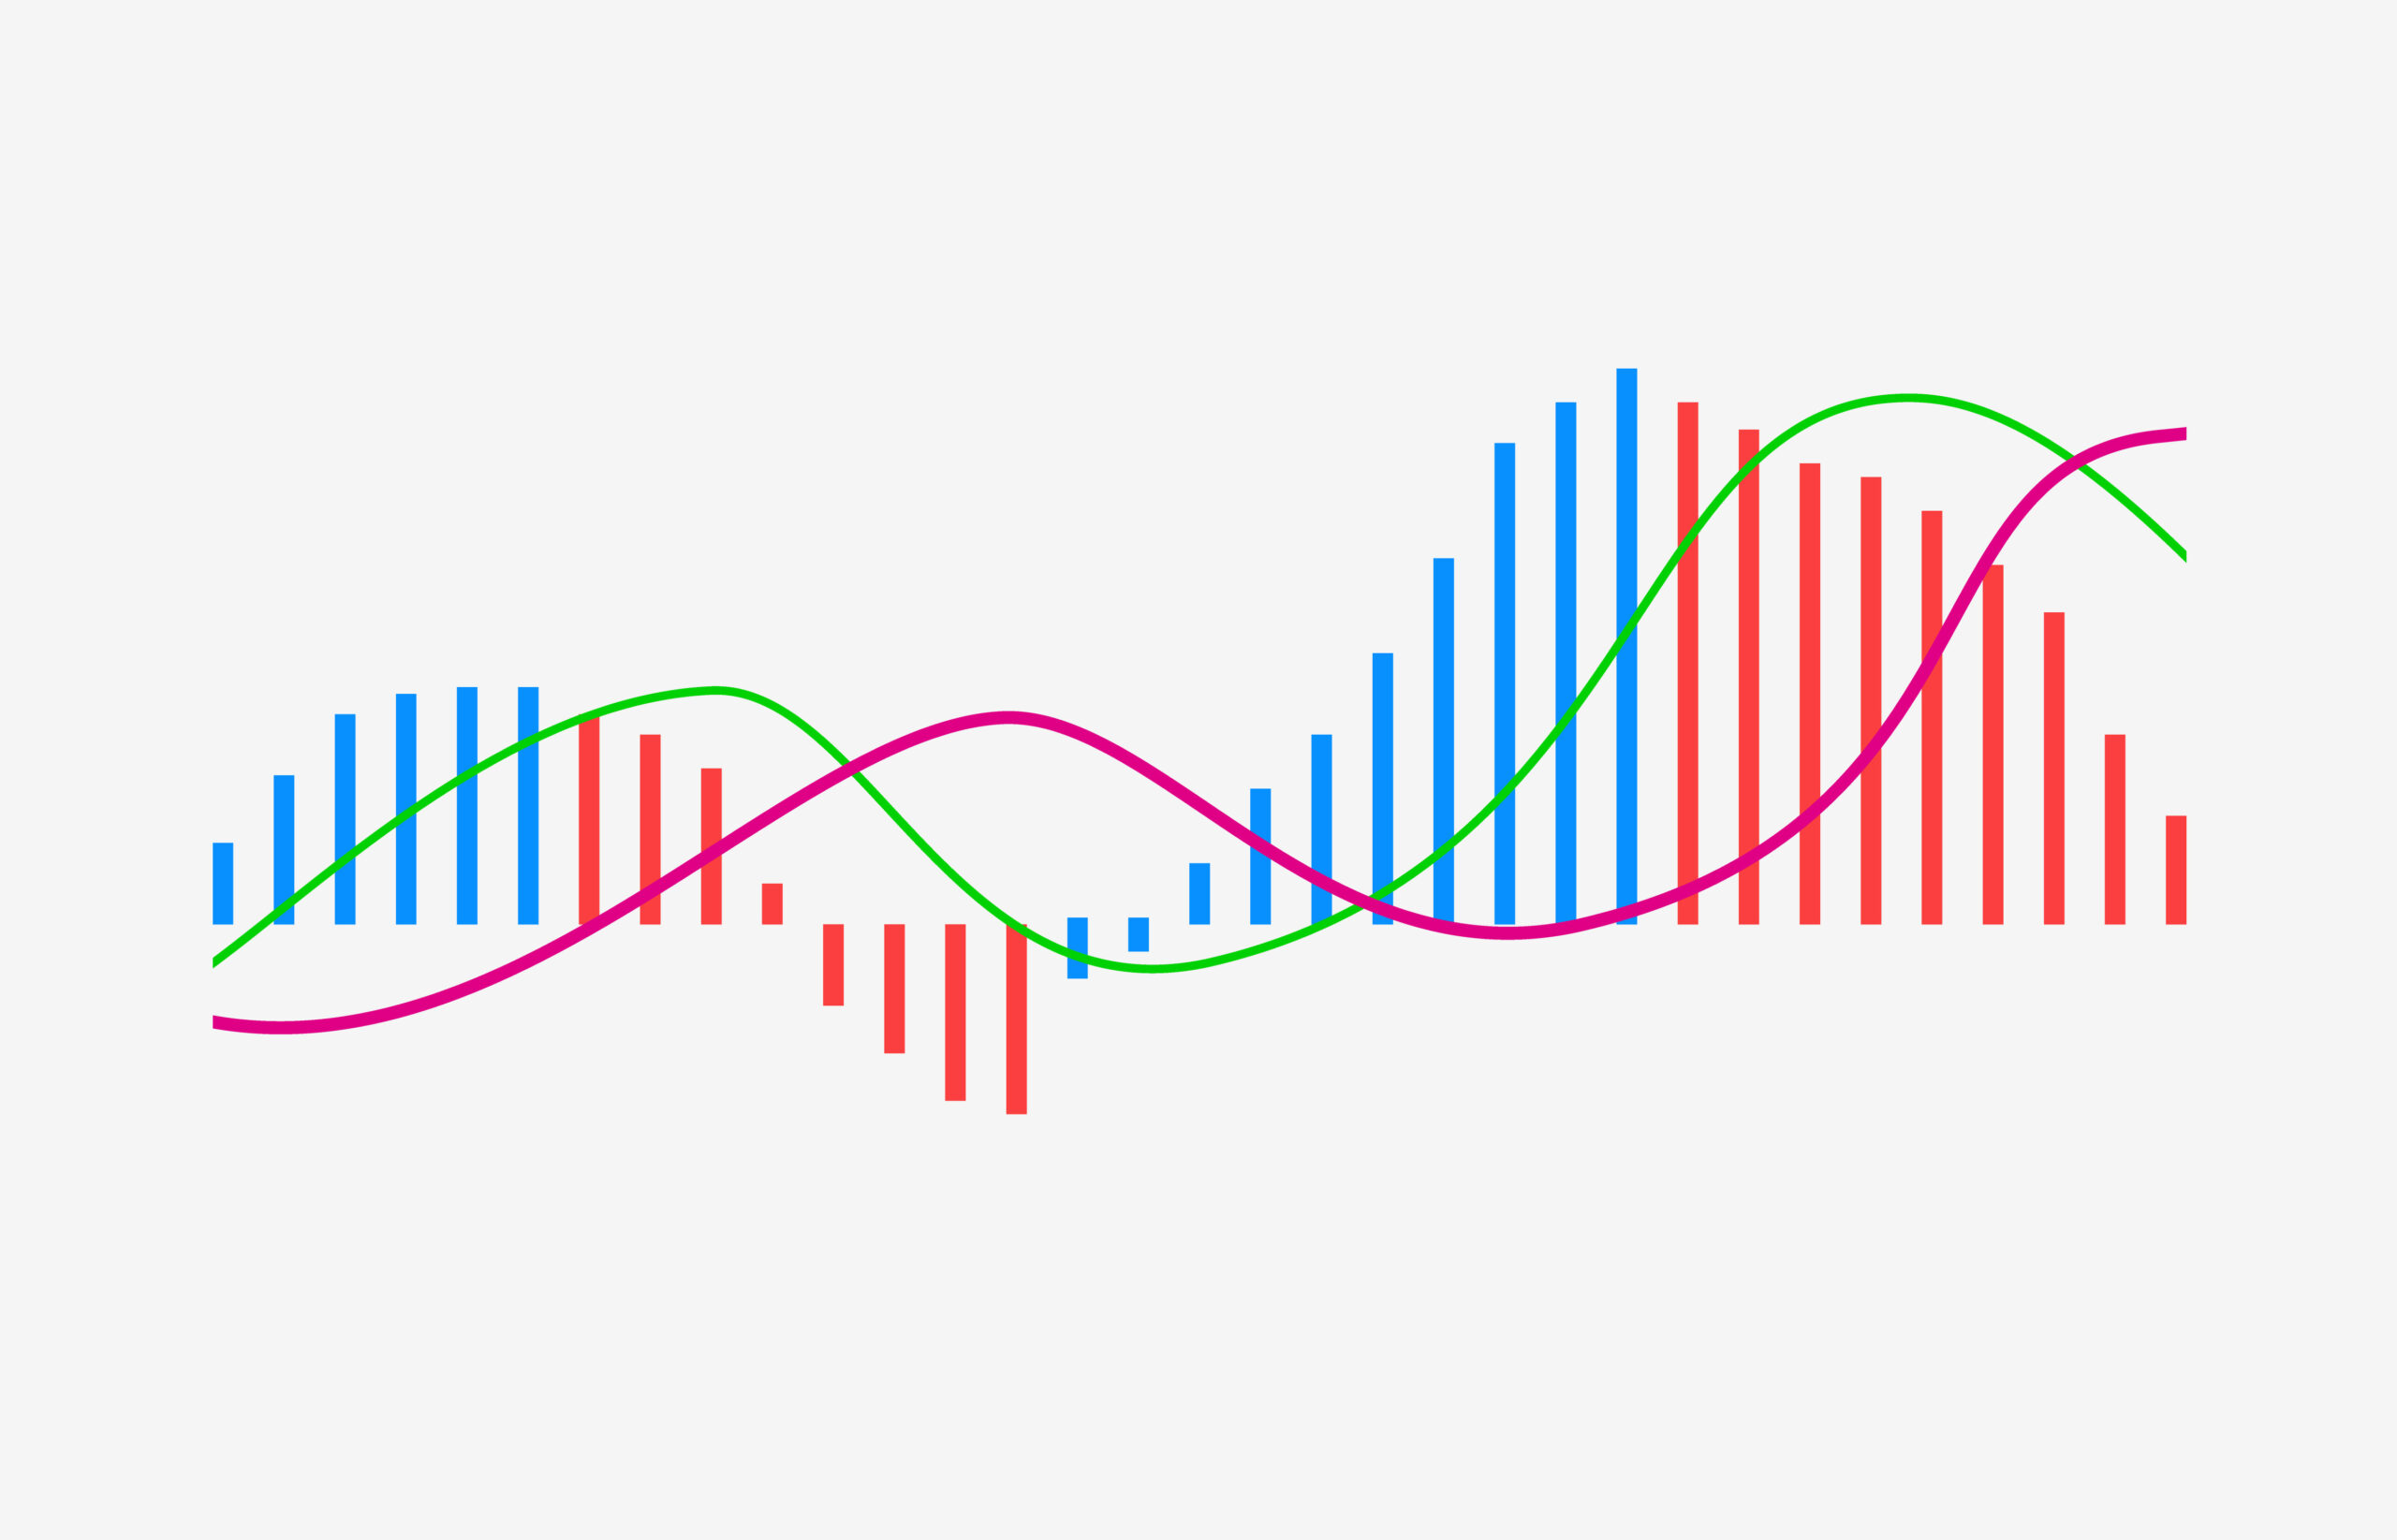
What is an MACD Indicator? (How to Use it in Crypto Trading)
Moving average convergence divergence (MACD) is one of the most popular trading indicators, but how do you use it? Find out in this article.
What Is RSI? The Ultimate Guide to Understanding the Relative Strength Index
Relative strength index (RSI) indicator is one of the most popular technical indicator. Here's how you can to apply it strategically when trading crypto.
Keltner Channel: What It Is and How to Use It
A Keltner Channel is a technical analysis tool retail traders use to in identifying trends, potential reversals and market volatility.
Weighted Moving Average (WMA): What It Is and How to Use It
Weighted moving average (WMA) is a technical analysis tool that is exceptionally sensitive to short-term market fluctuations as it prioritizes recent data points.
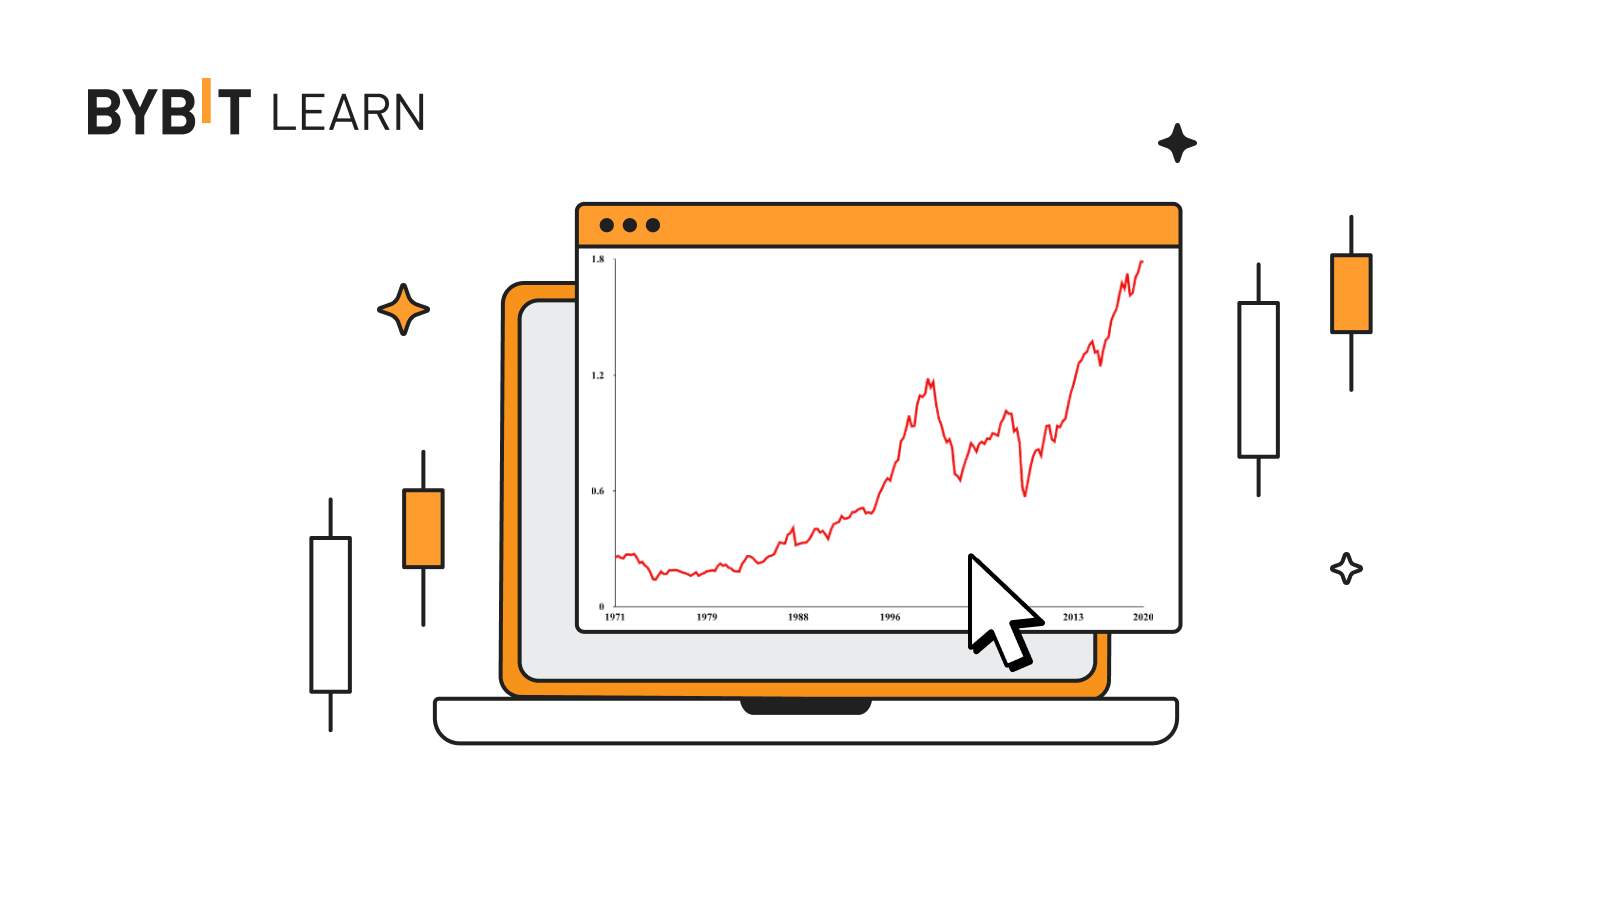
Can the Buffett Indicator Effectively Measure Crypto Market Valuations?
The Buffett Indicator is widely used to determine if the stock market pricing is overvalued or undervalued. But does it apply in the crypto market? Find out now!
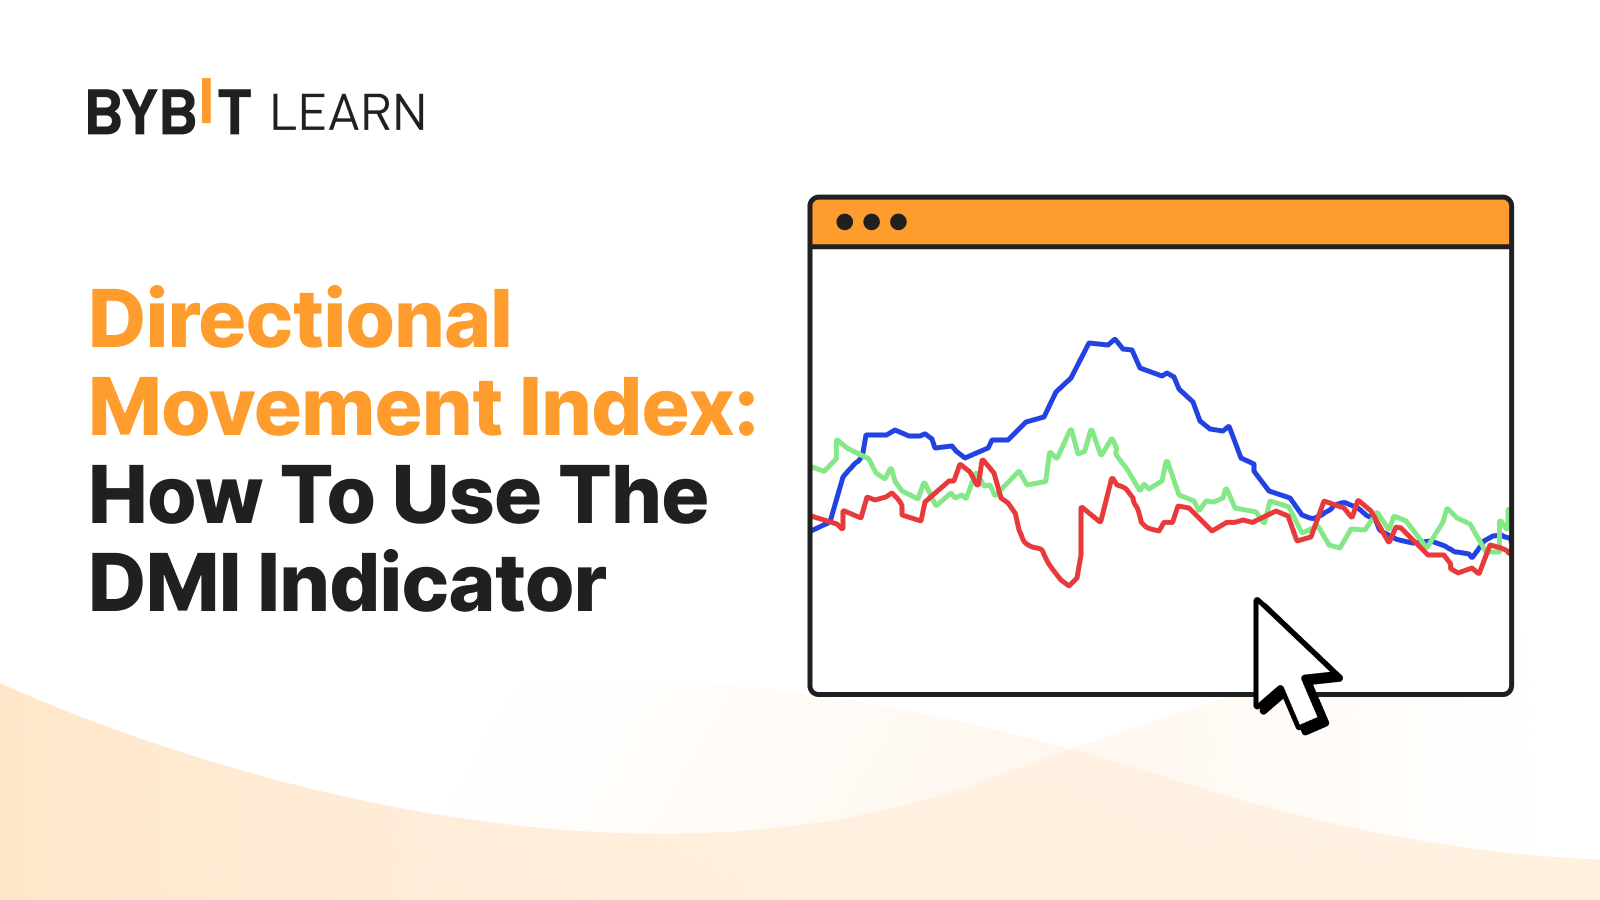
Directional Movement Index: How to Use the DMI Indicator
The directional movement index (DMI) is a widely used technical indicator in financial markets for assessing trend direction and strength.
Simple Moving Average (SMA): What It Is and How to Use It
Simple moving average calculates the average price of an asset over a specified period, providing an average and fair value for it.
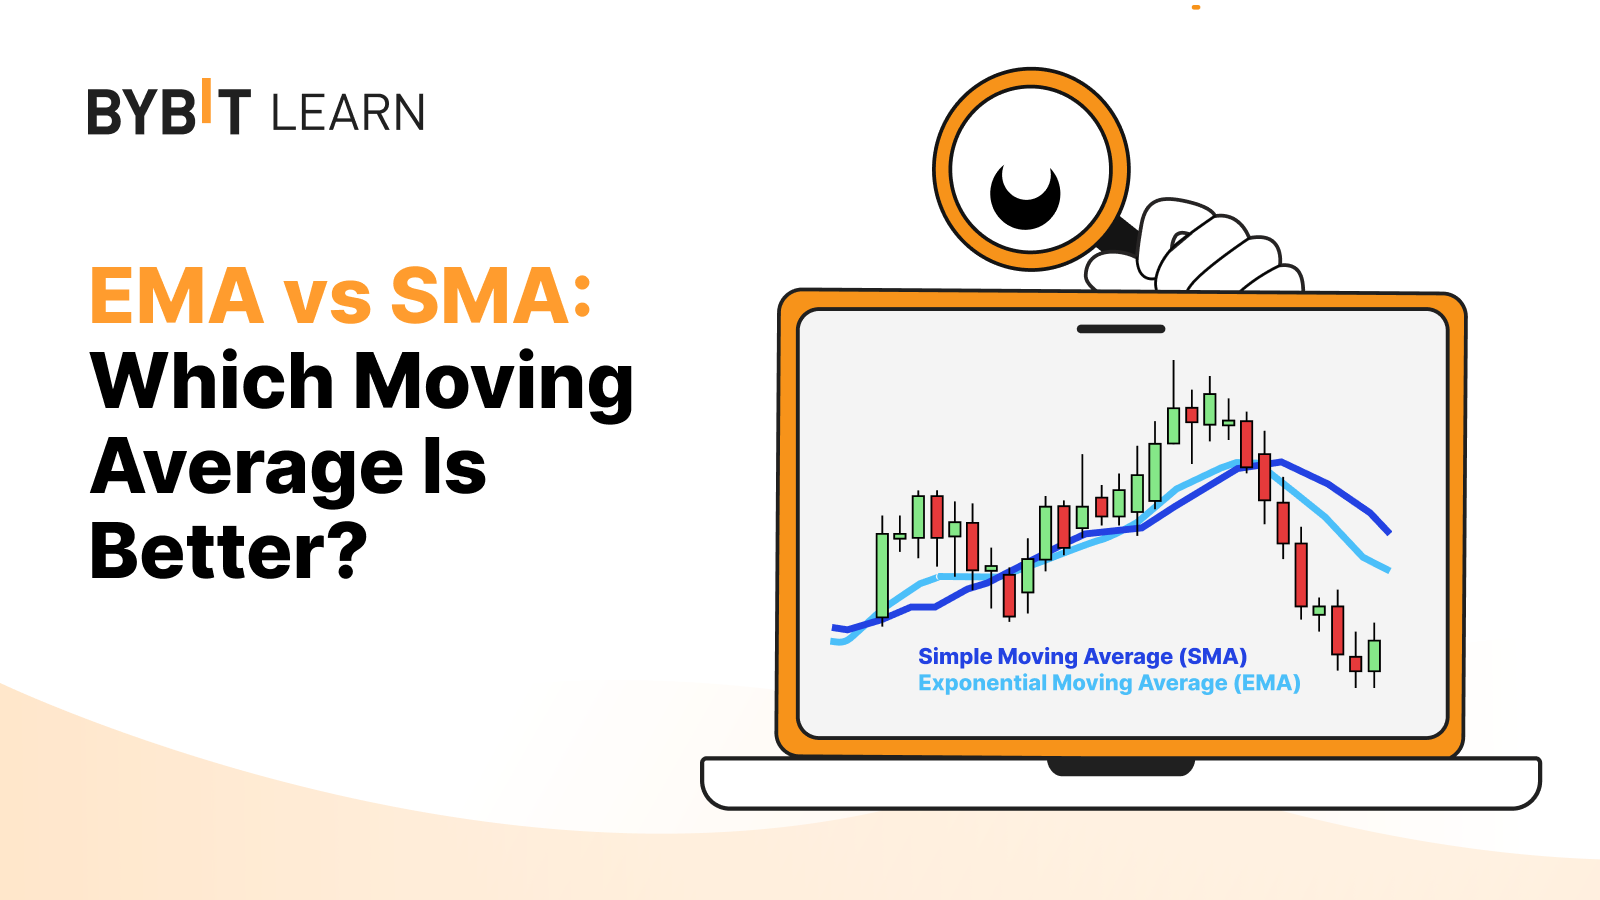
EMA vs. SMA: Which Moving Average Is Better?
Learn about the differences between exponential moving average (EMA) and simple moving average (SMA) and find out which is better for day trading and long-term trading to make more informed trading decisions.
Learn to get up to 80 USDT prize
Master crypto concepts, trade and earn from your expertise.

Your crypto growth roadmap
View All
Explorer
Lv.0
Practitioner
Lv.1
Specialist
Lv.2
Strategist
Lv.3