TMLTrader
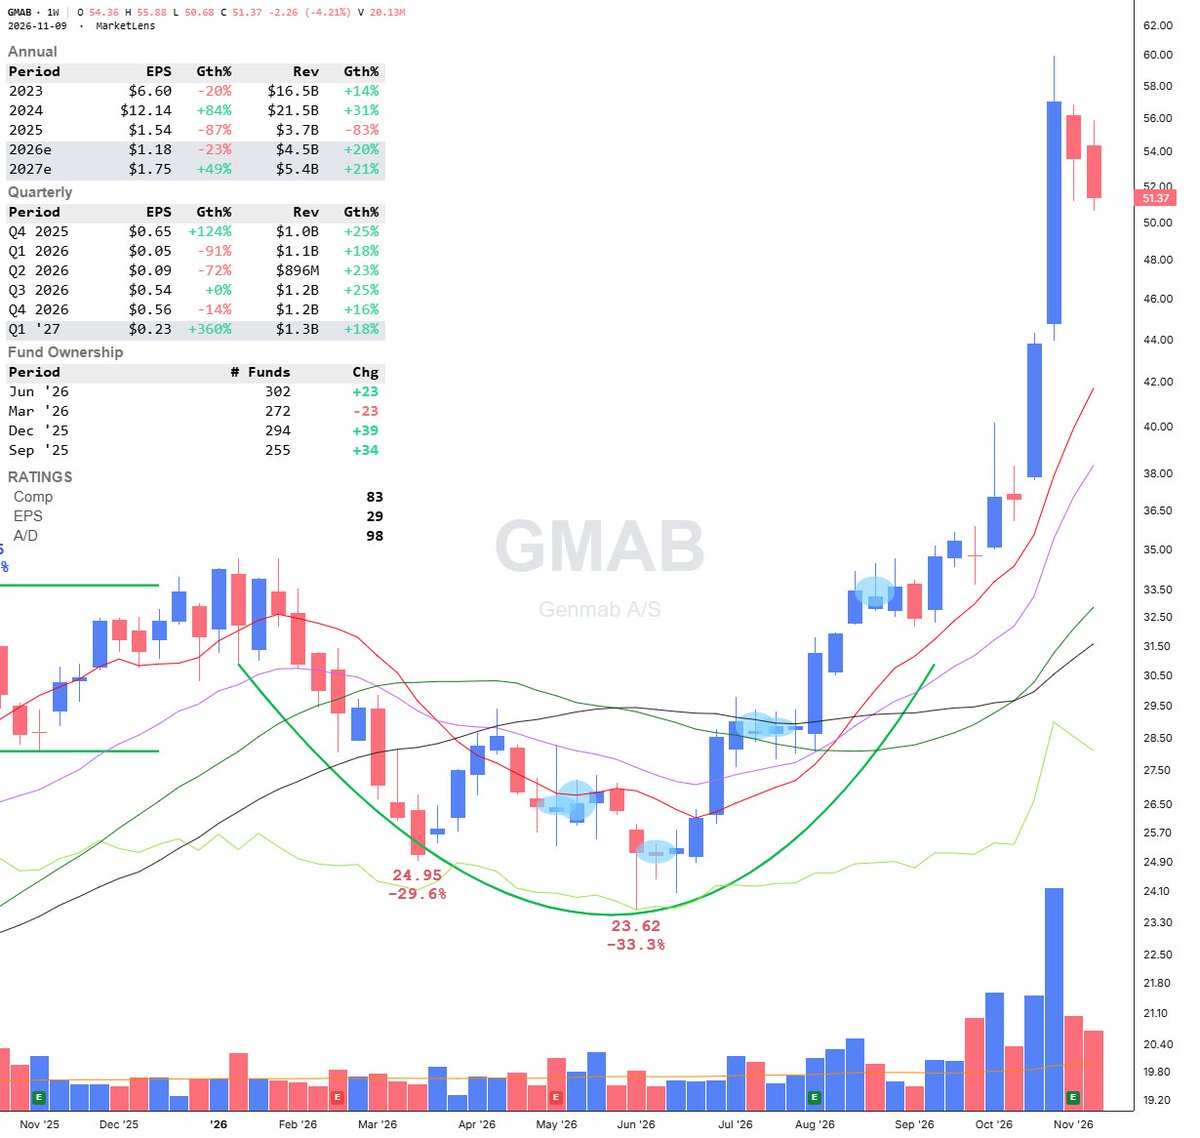
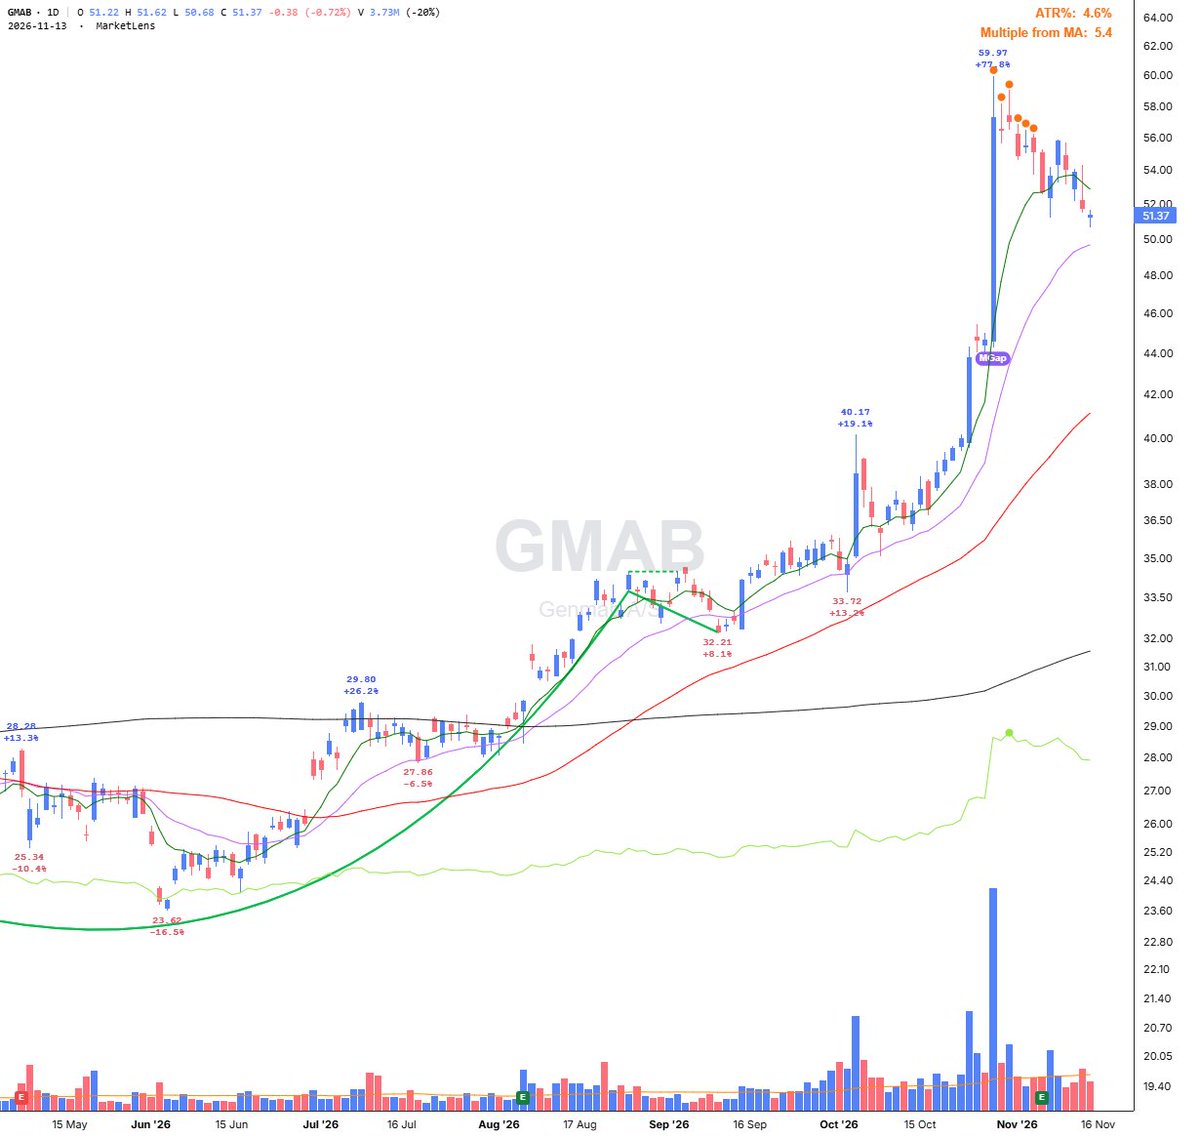
$GMAB slipped back below the short-term 8-day EMA while it’s been chopping around for a second straight week. If the pullback keeps going, the 21-day EMA is the next spot I’m watching intraday for support/response. It also looks like it could be building a high, tight flag (59.97 standard pivot, pole length: 86.2% over 8 weeks).
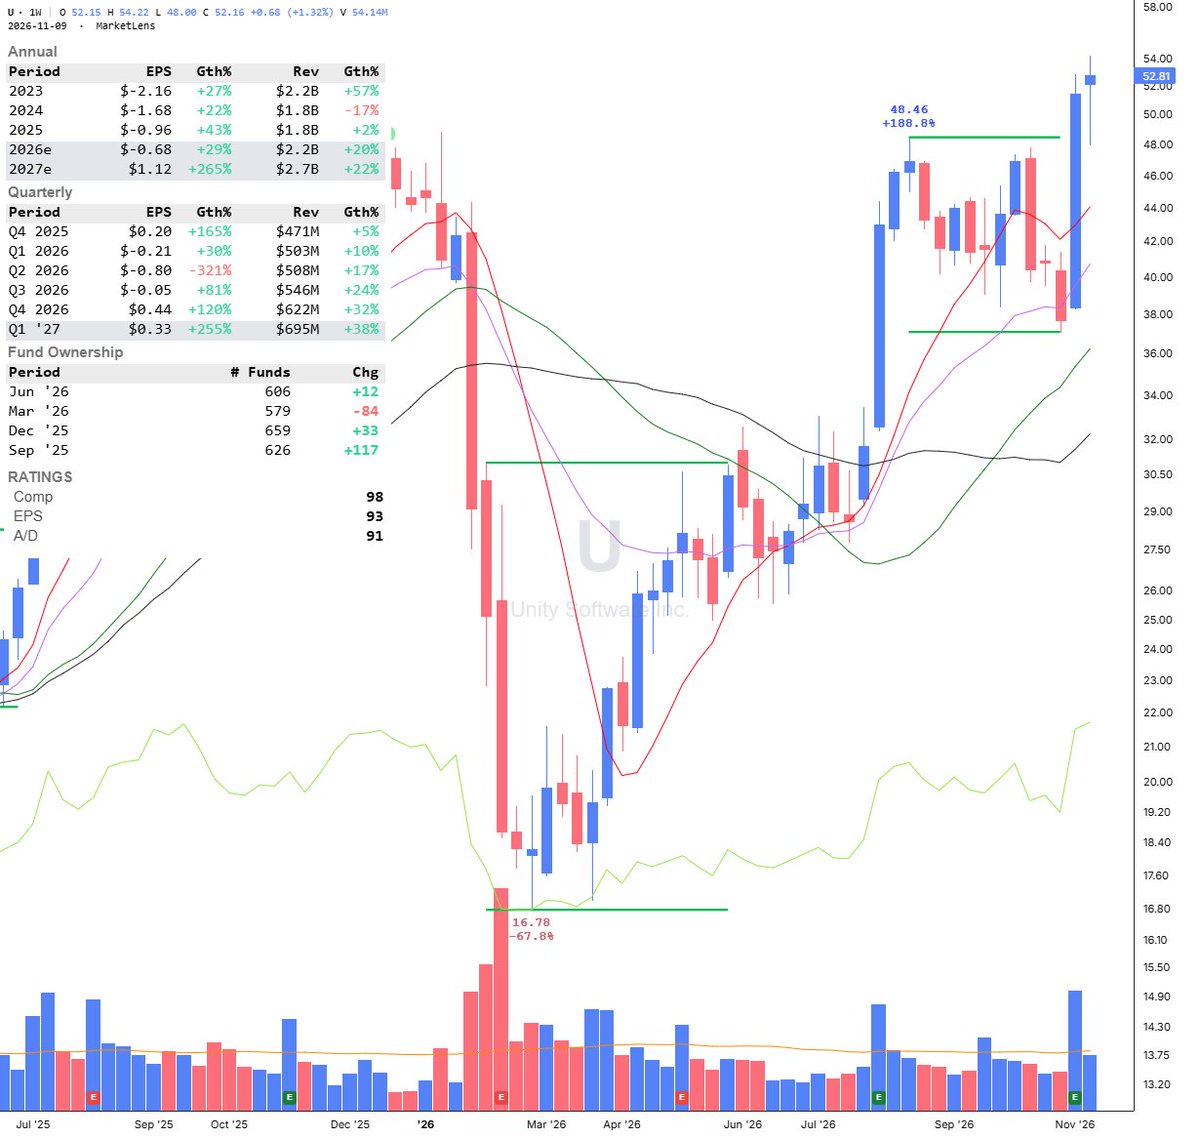
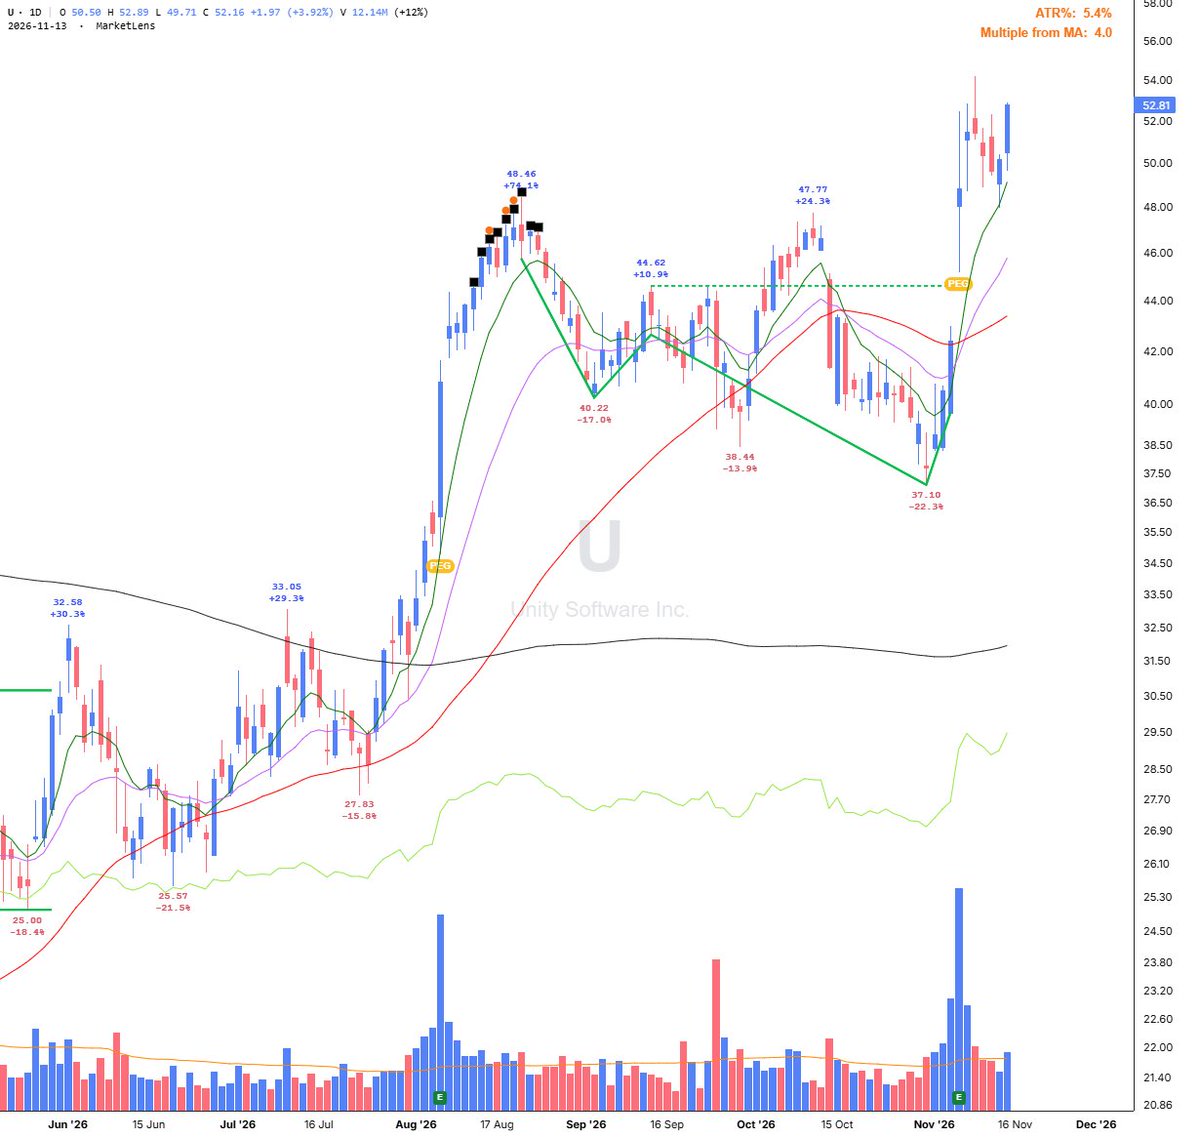
$U bounced off short-term support at the 8-day EMA and the top of the base (48.46 standard pivot). It then pushed back through the top of the Power Earnings Gap and printed a Day 2 higher high—this came off that earnings pop (+14% on 4x avg volume with a +1382% EPS surprise). It also reclaimed/cleared the 52.15 level from Dec 2025.
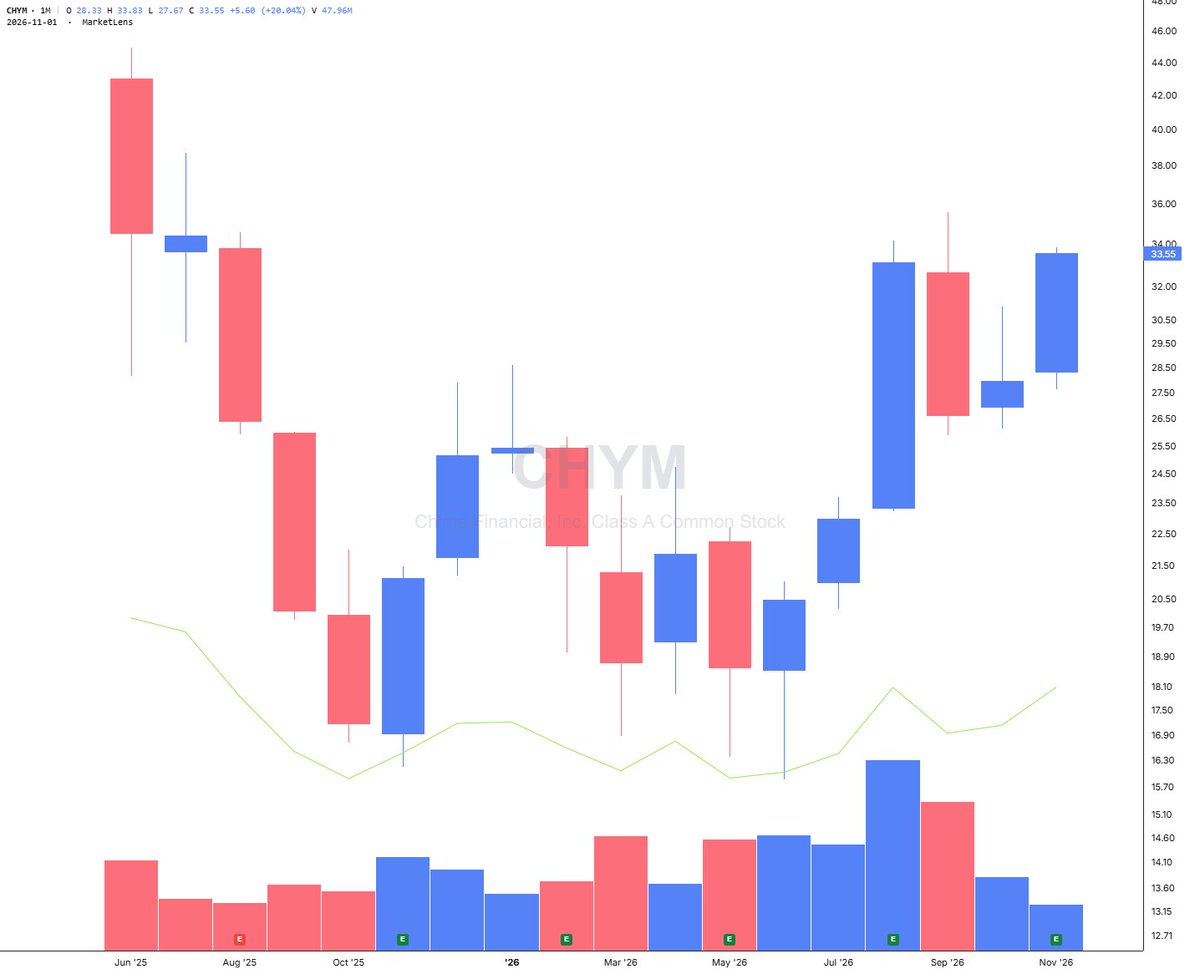
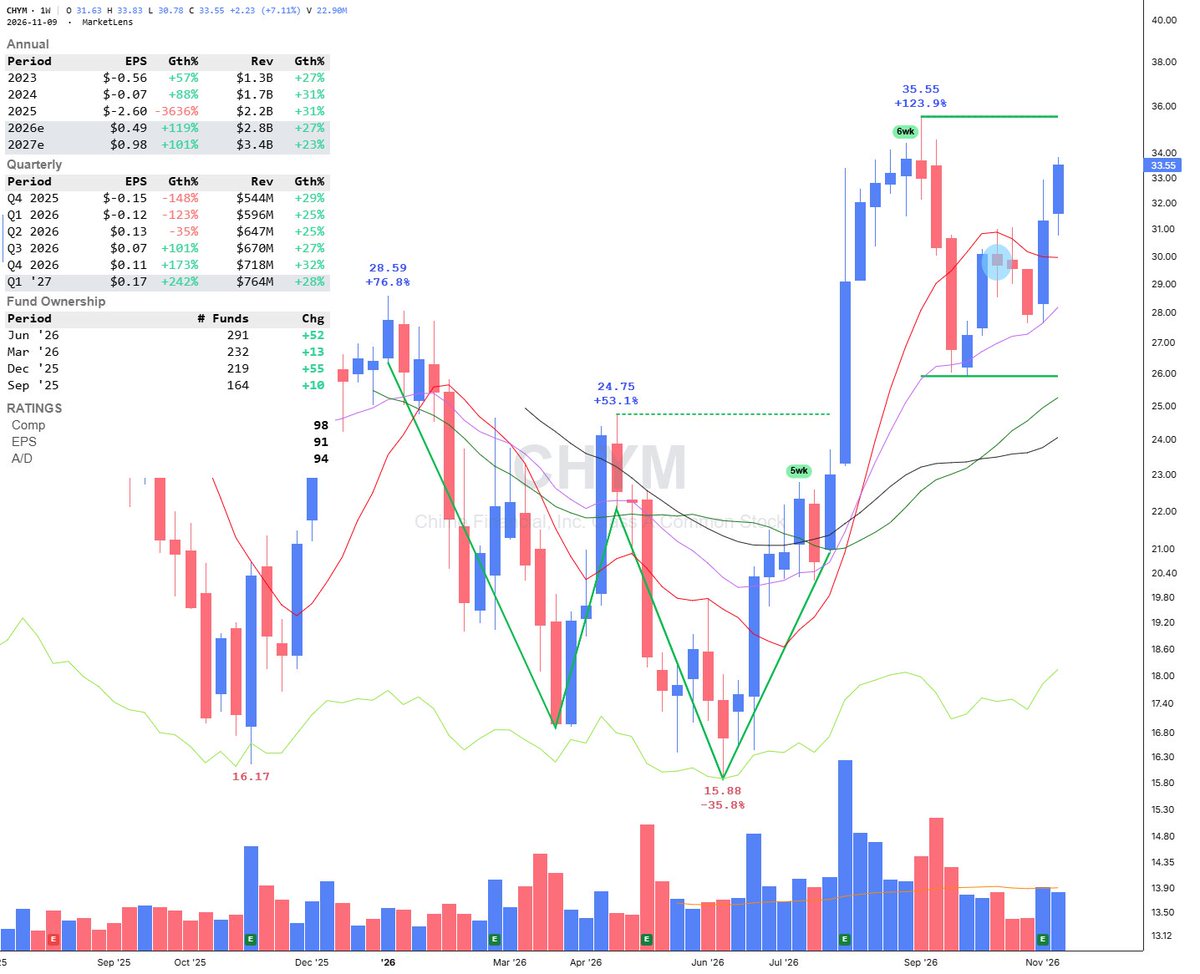
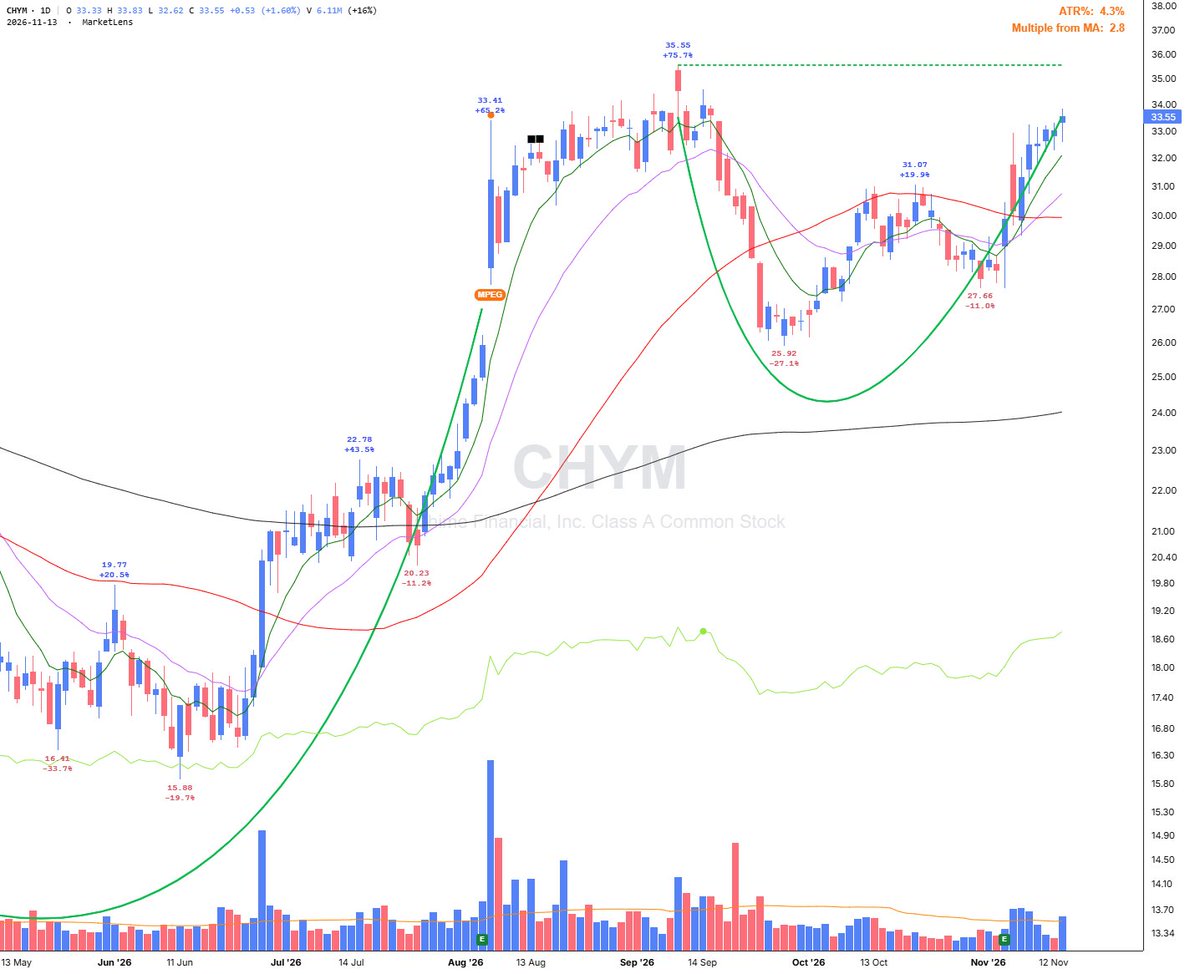
$CHYM pushed through last week’s high while it keeps building the right side of a cup base (35.55 standard pivot). Now I’m watching for a clean handle to set up.
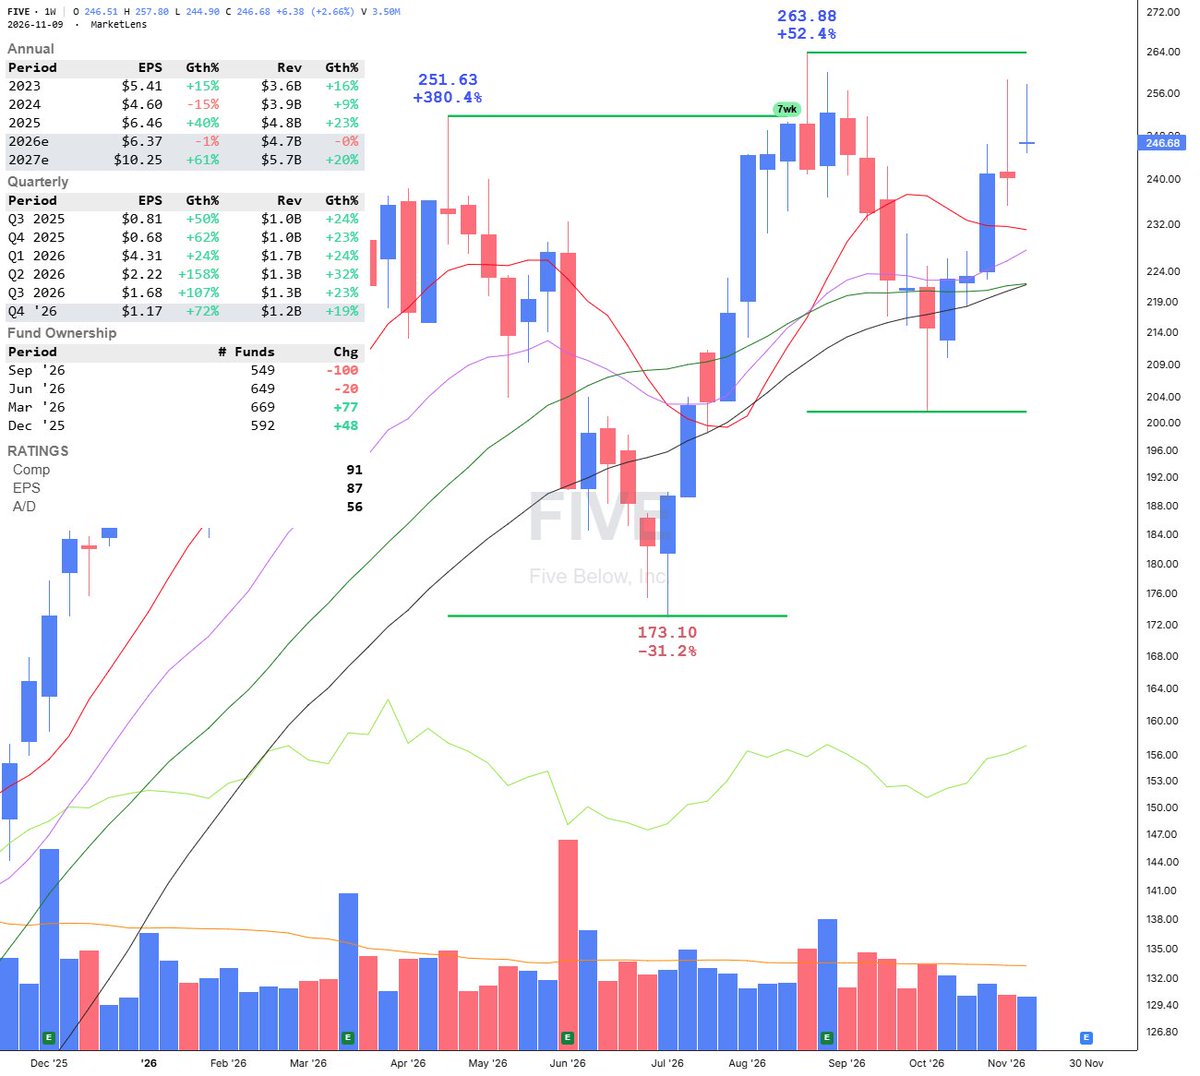
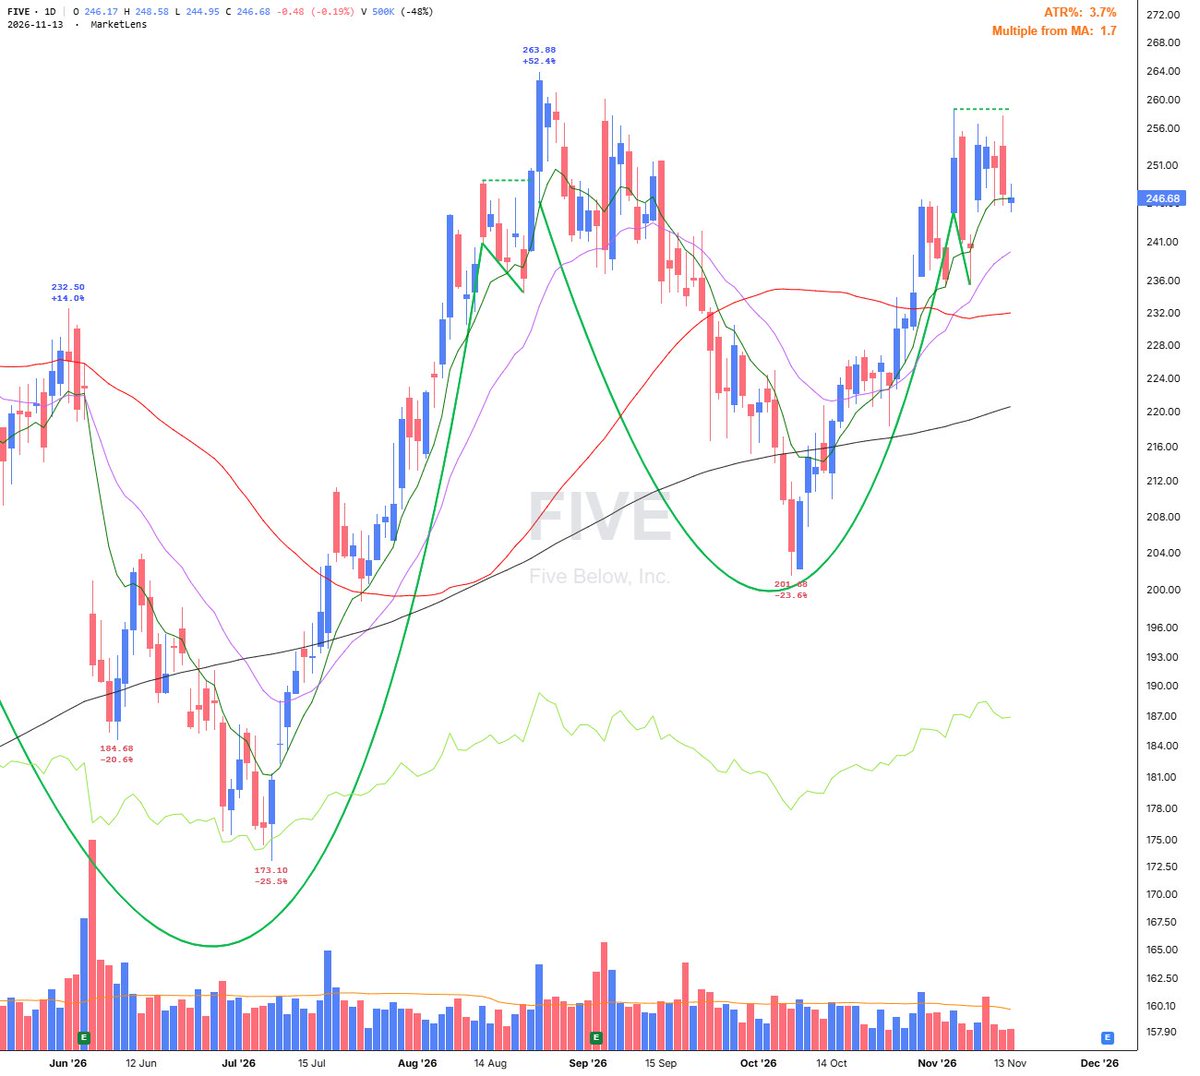
$FIVE carved out a clean cup-with-handle setup around the 258.59 standard pivot. The short-term 8-day EMA kept stepping in as support while the right side of the base was building out.
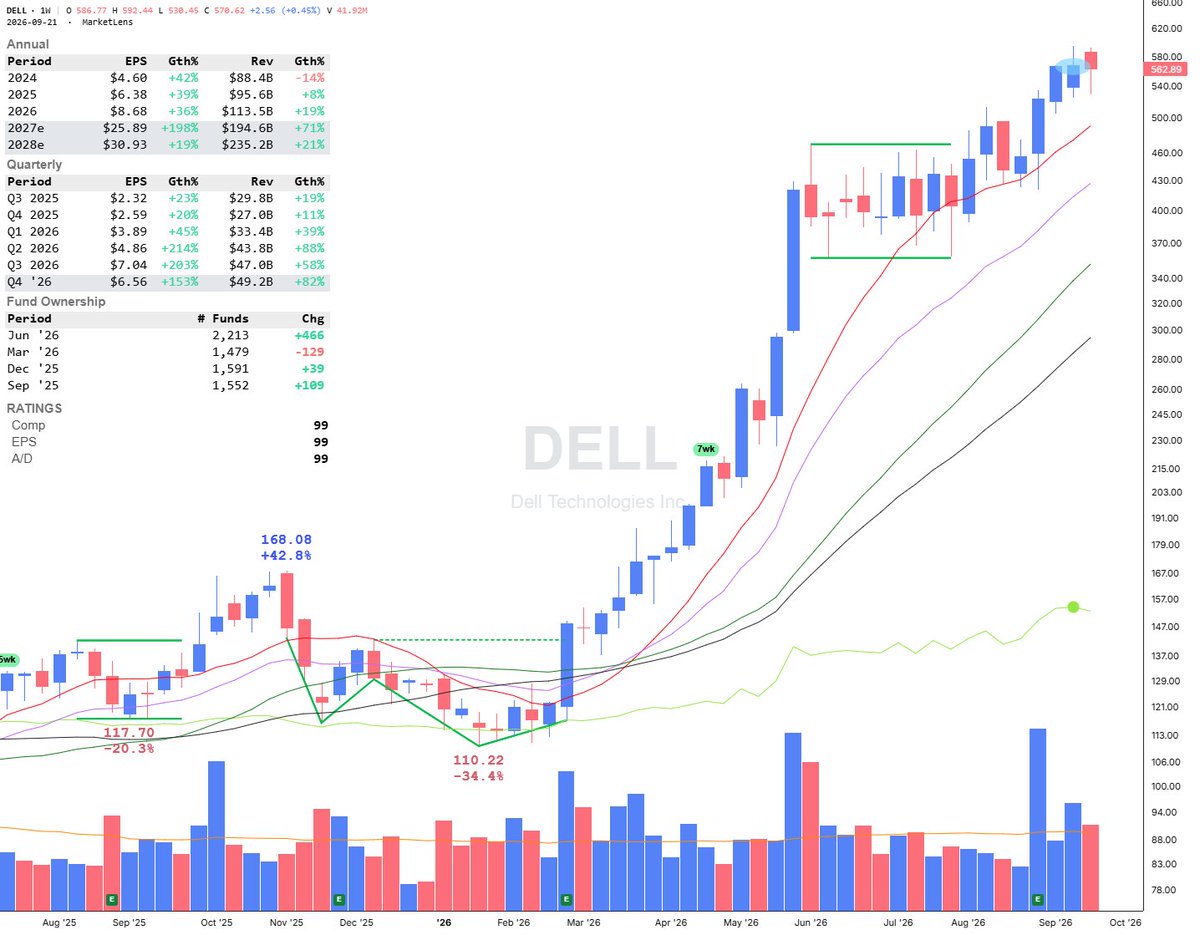
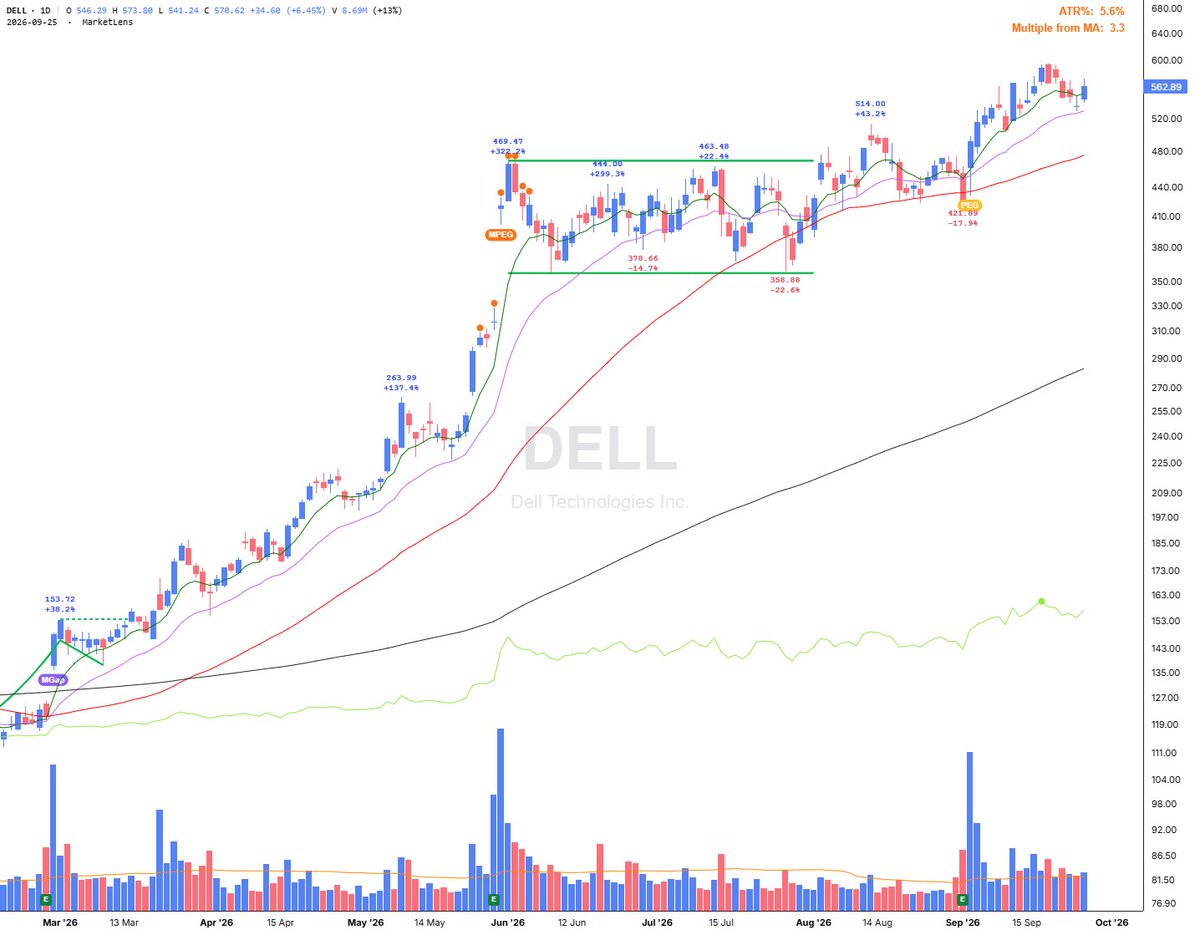
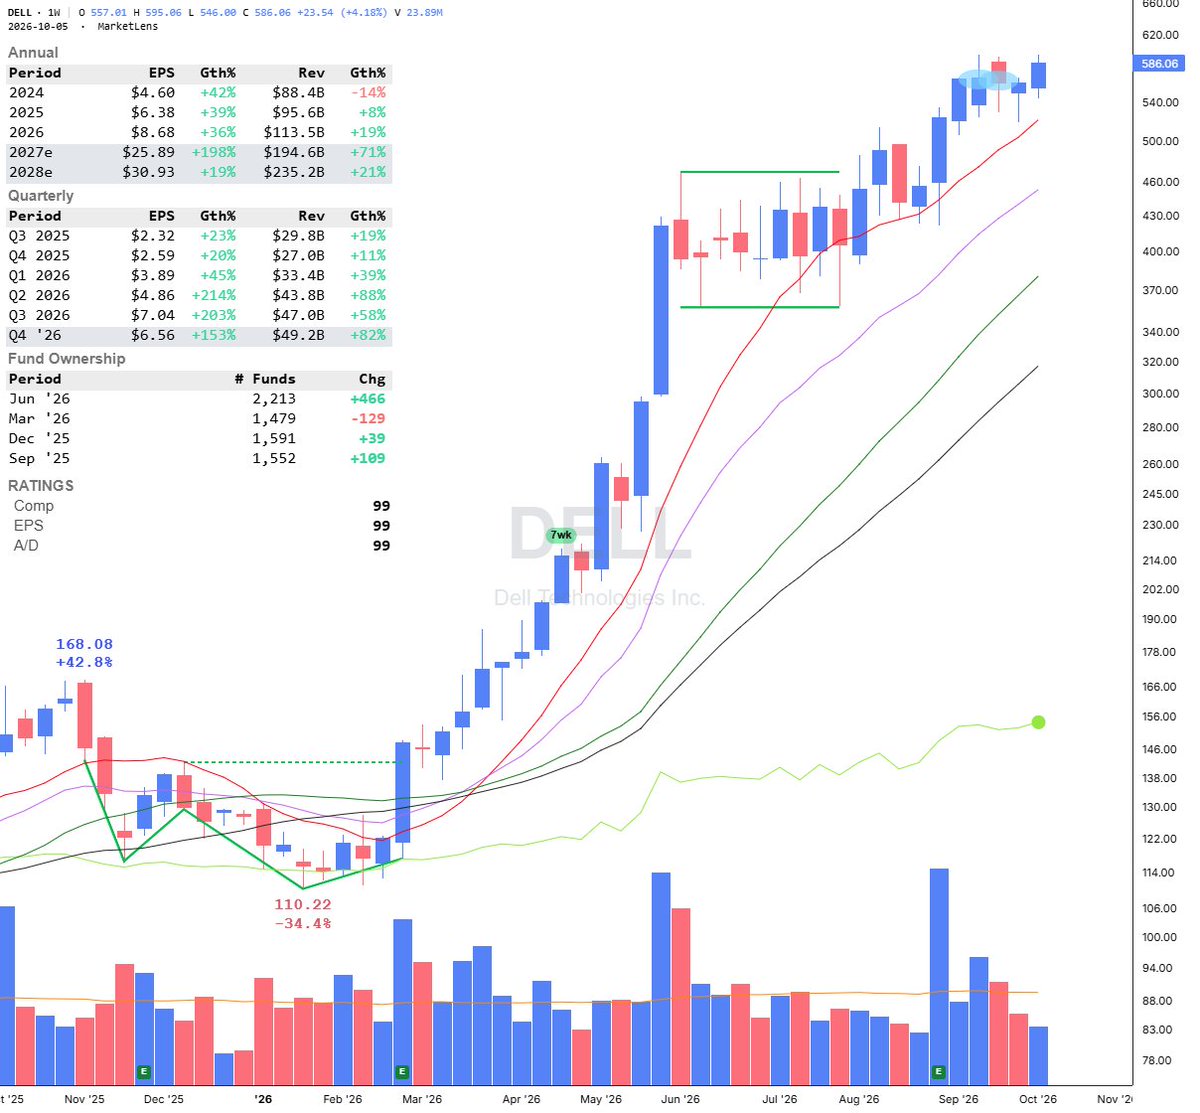
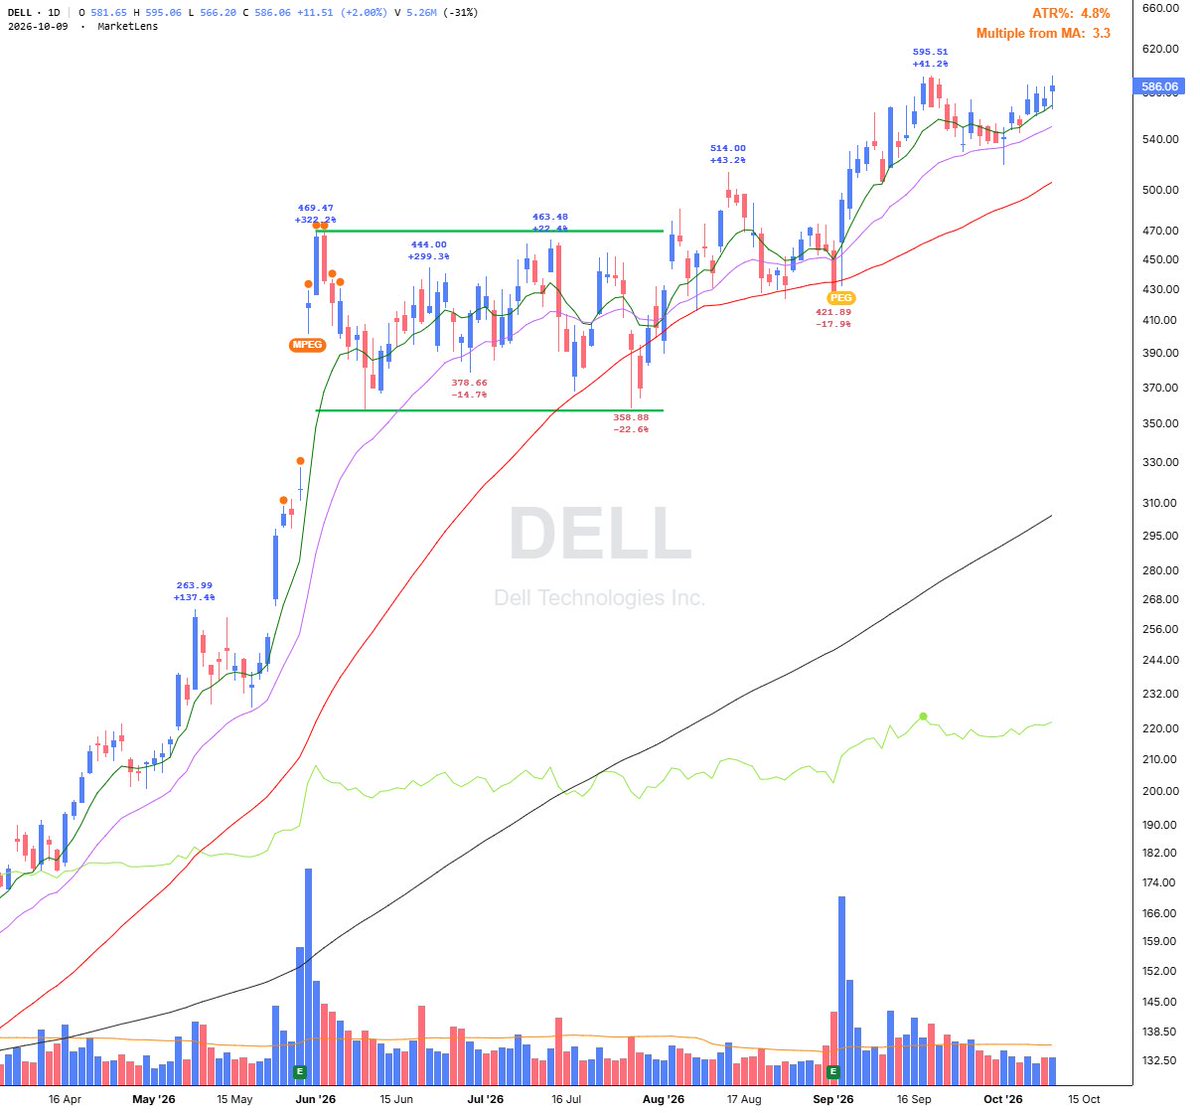
$DELL 突破了两个星期前的高点,在21天指数移动平均线(EMA)处干净利落地洗盘后。周线相对强弱指标(RS)创下新高。我会把它放在观察名单上,看它能否突破四周紧密枢轴点(标准枢轴点595.51),并可能重新夺回600整数大关。 图表由 @MarketLens_ 提供
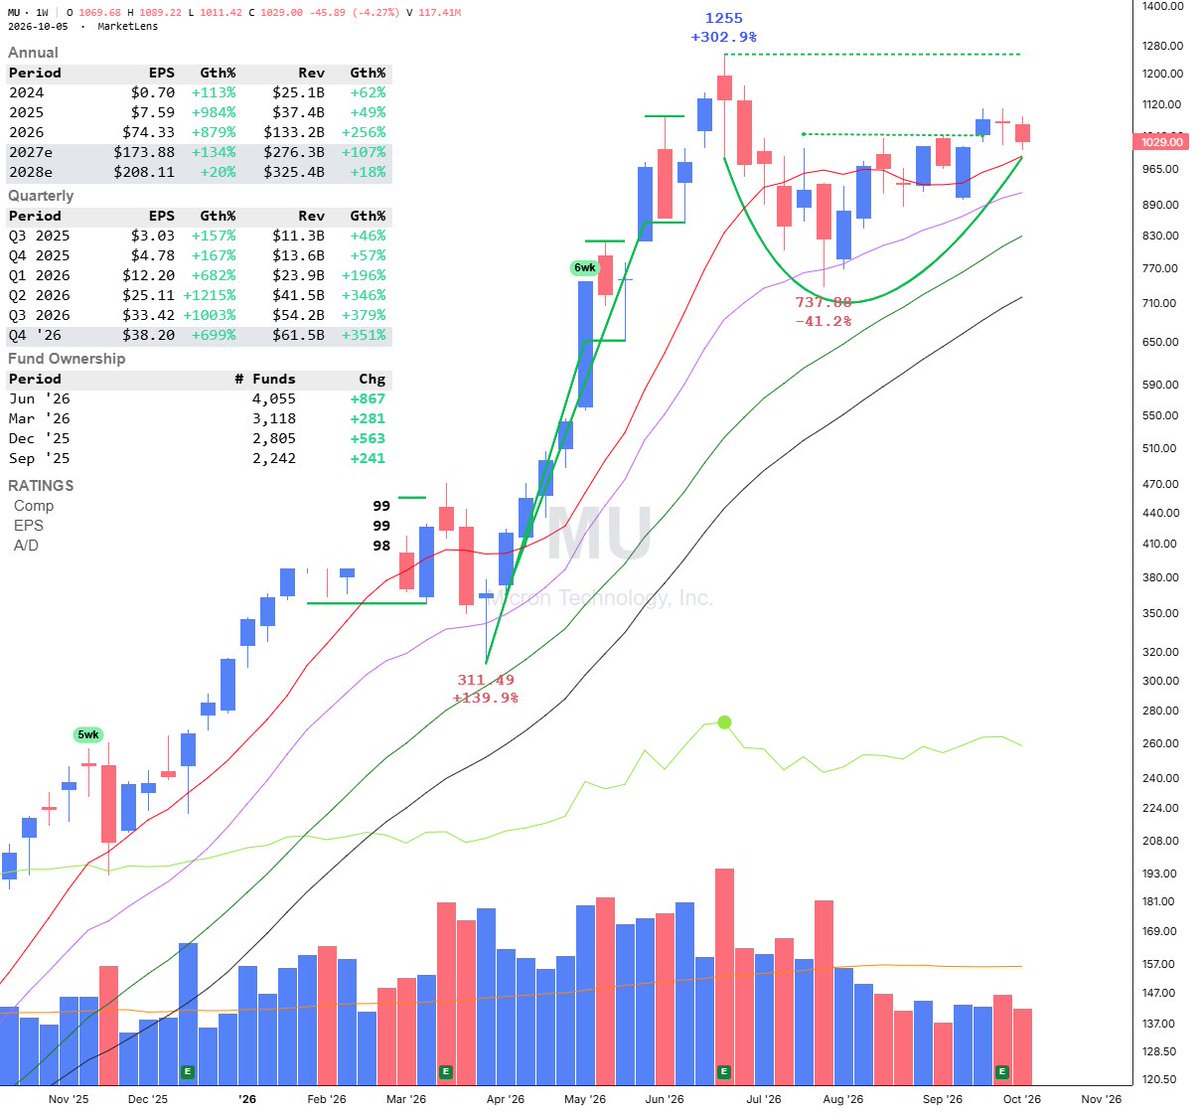
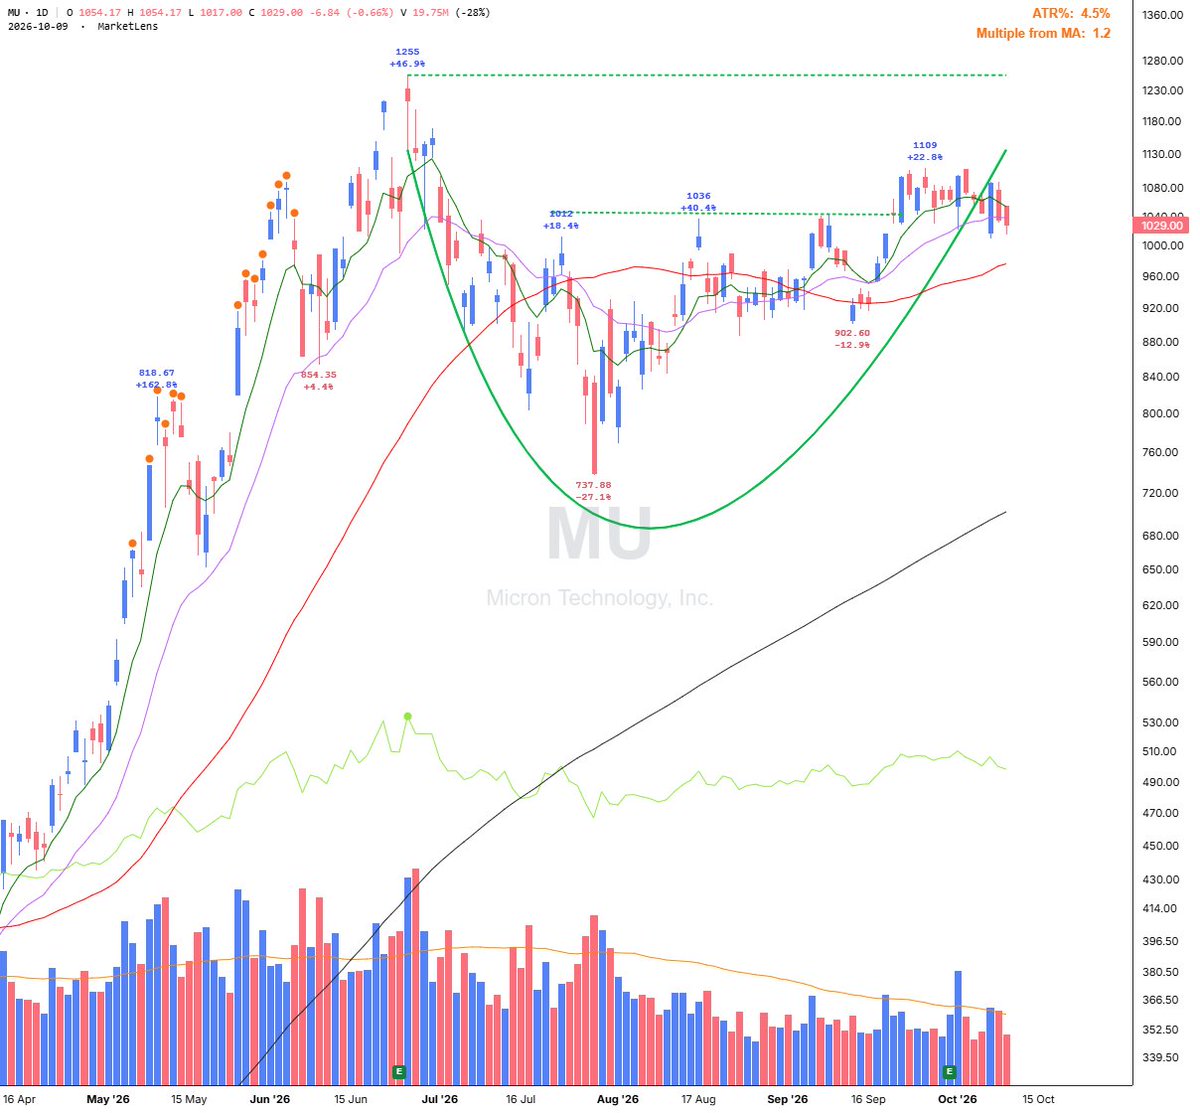
$MU 在过去两个交易日略微跌破了 21 天 EMA,收盘价在 1036.13 的早期枢轴点下方。它正在形成一个杯柄形态(1108.72 的标准枢轴点)。我希望看到它先回到 21 天 EMA 之上,然后留意杯柄的干净突破。
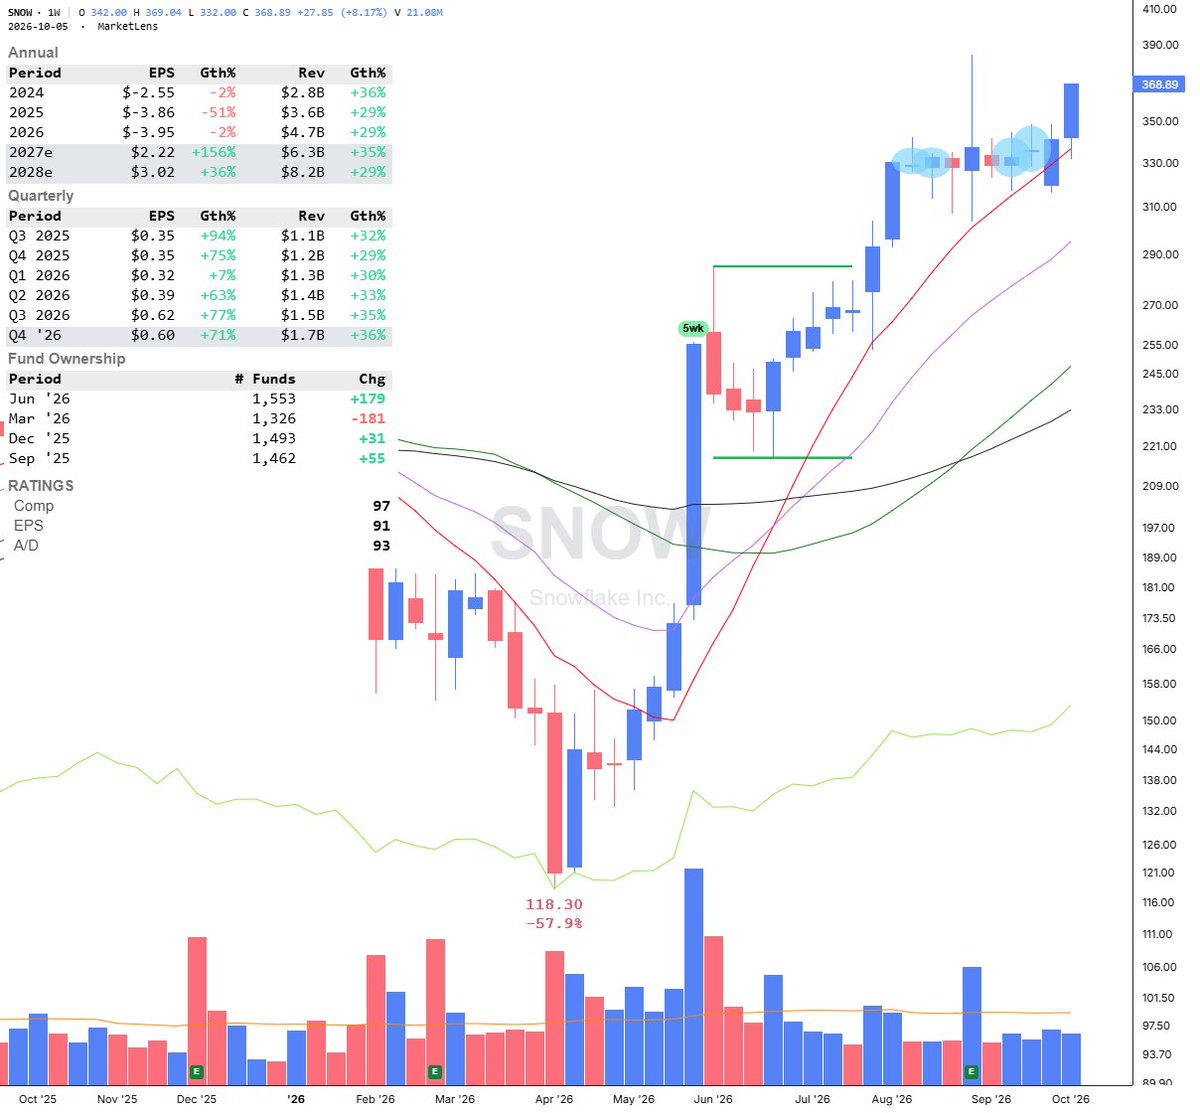
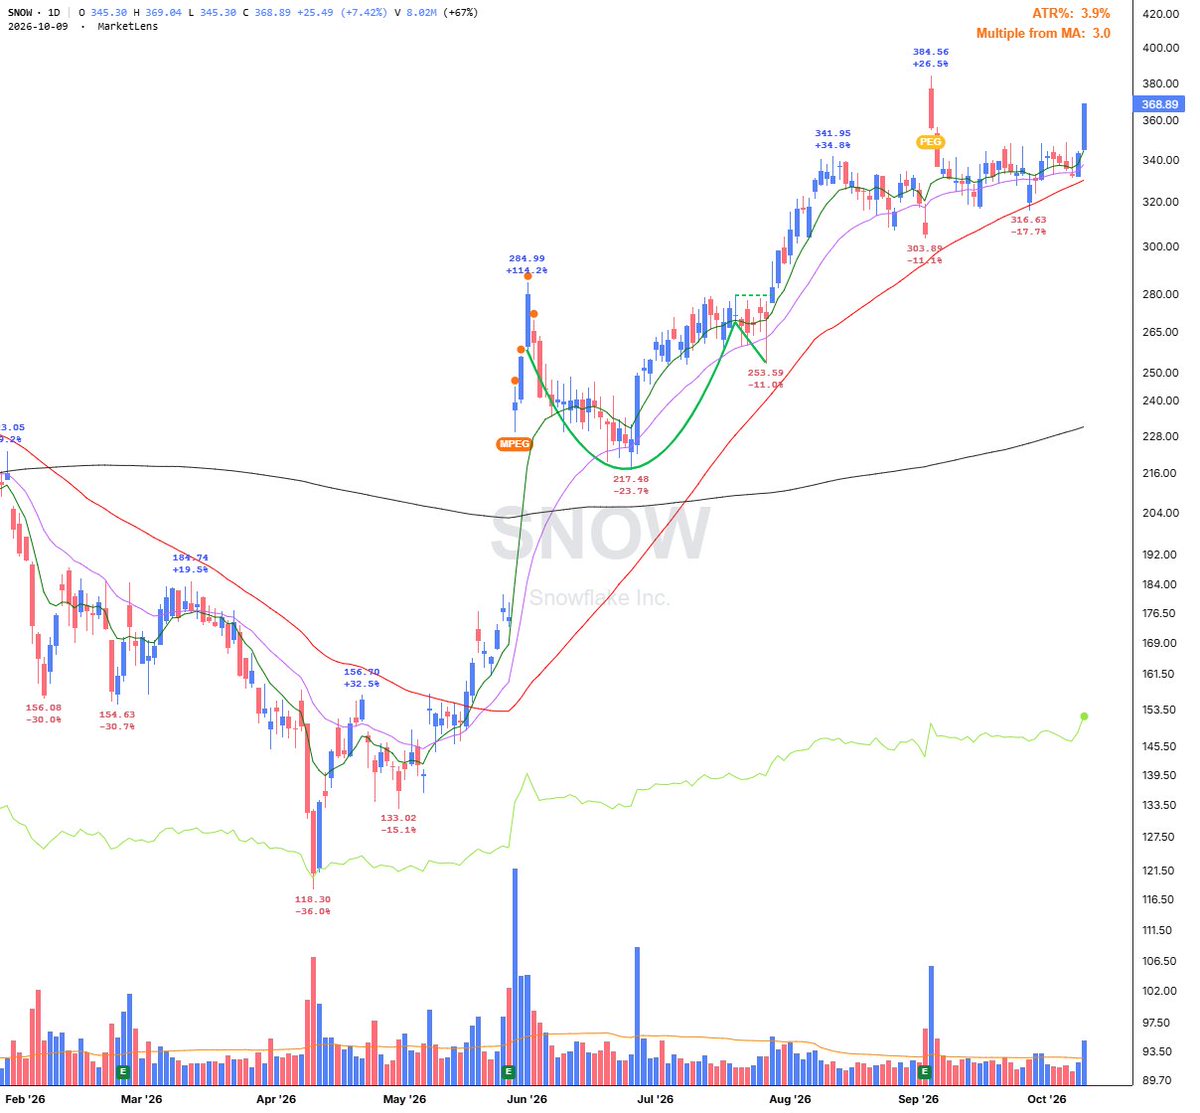
$SNOW 在大成交量下强劲反弹,守住了21日EMA和10周SMA。它突破了348.61的三周紧缩枢纽点,然后收于四年来的新高,RS线也创下了新高。我下一个关注的点是384.56 — 9月3日那个曾受阻的盈利缺口(PEG)的前高。
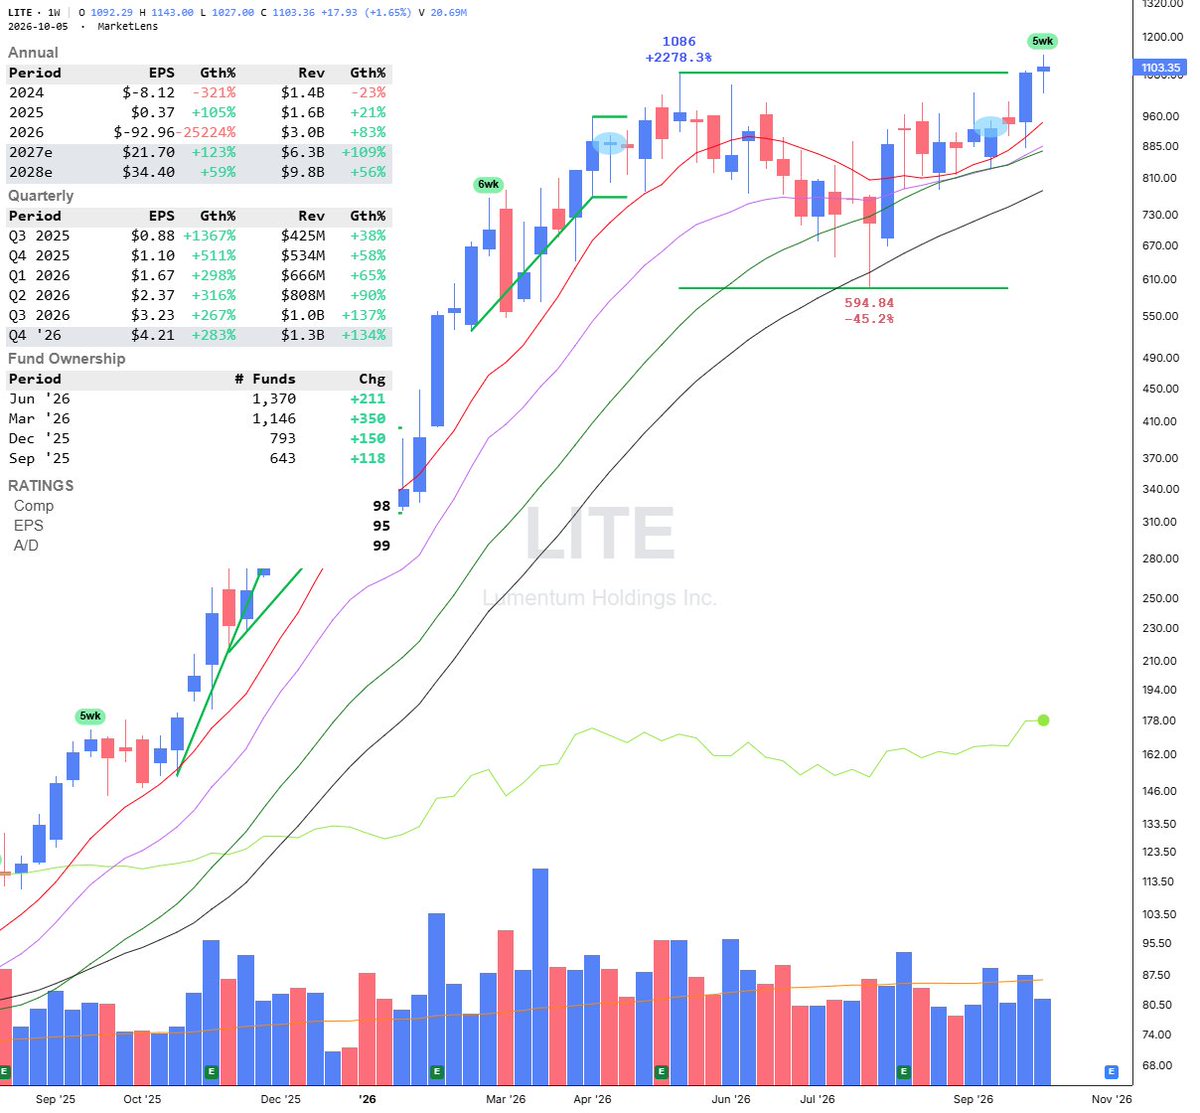
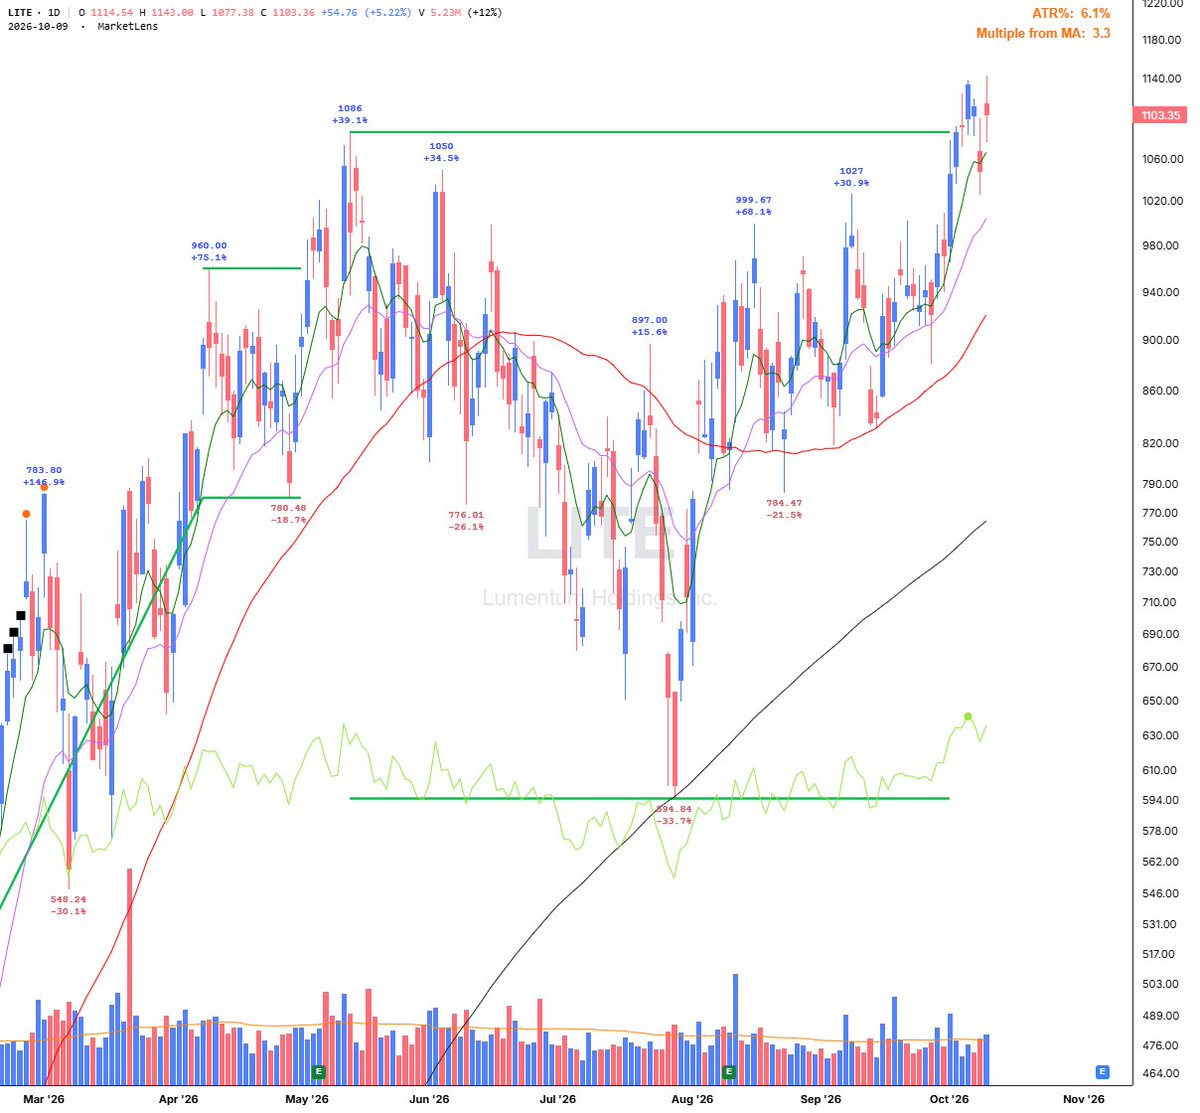
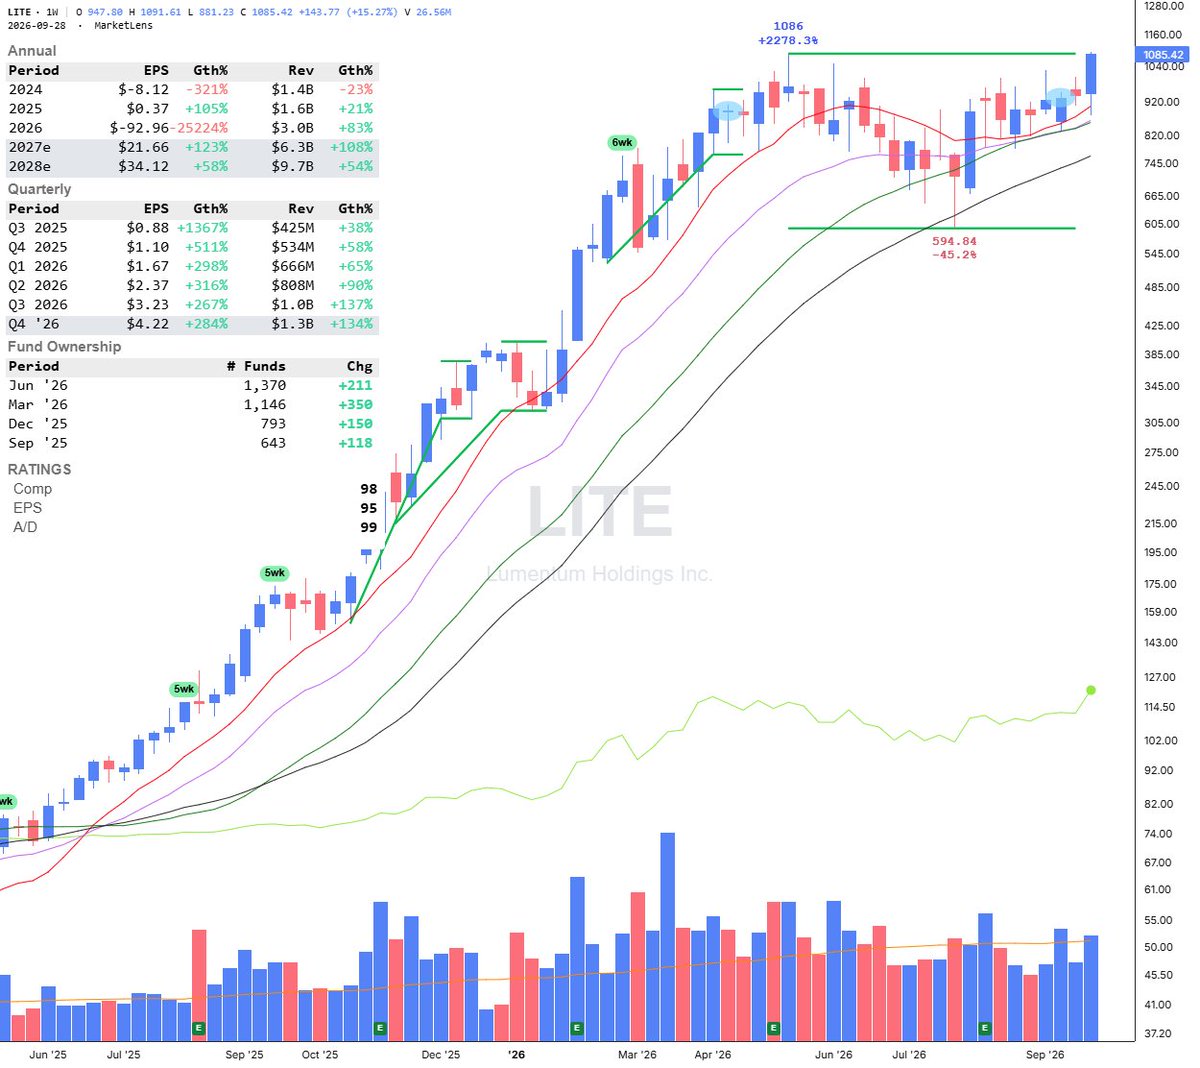
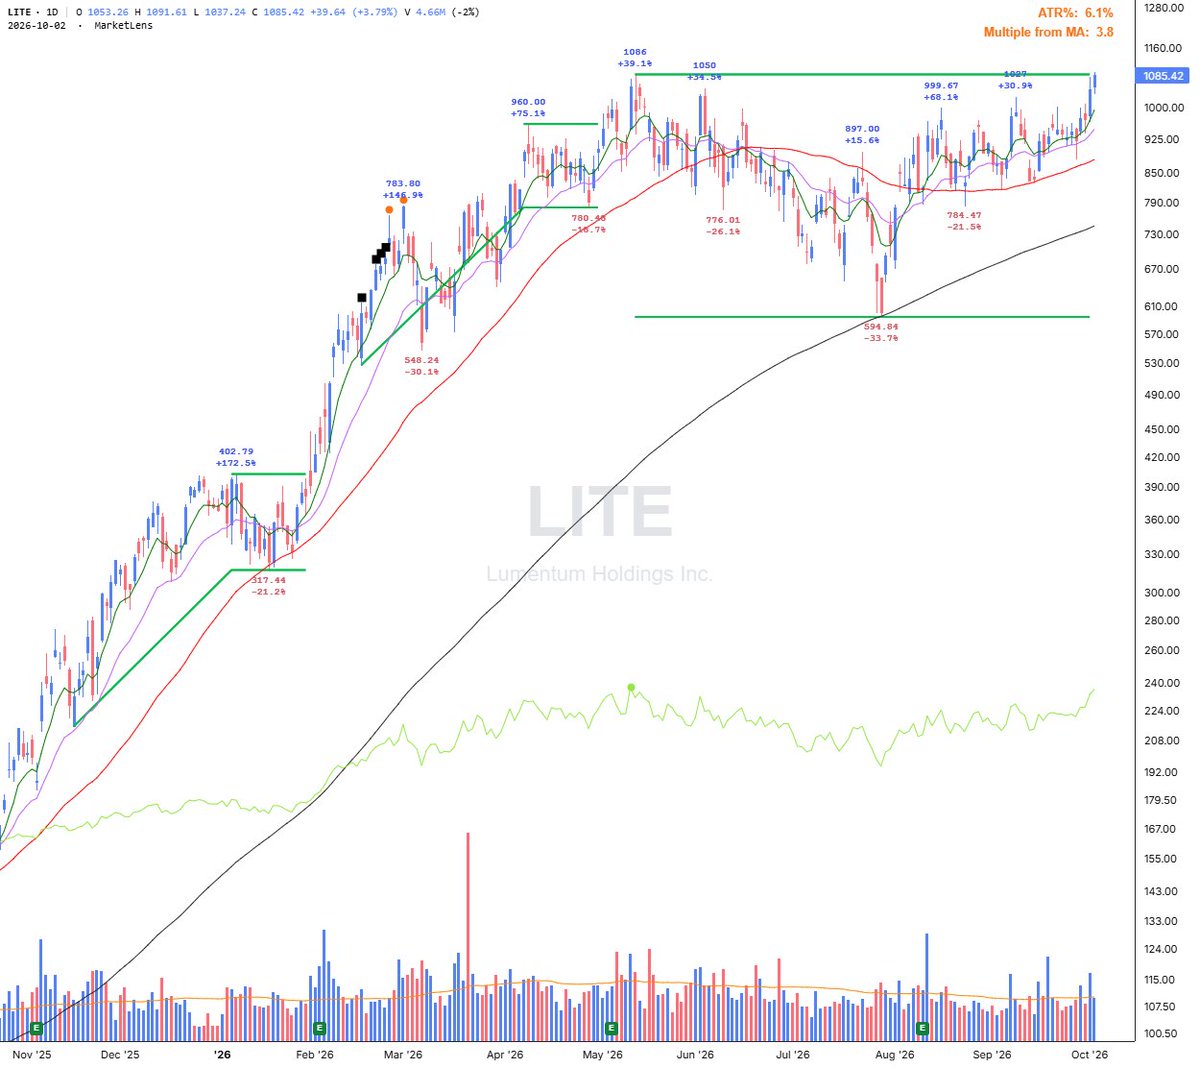
$LITE 突破了 45% 深度的底部形态的枢轴点(标准枢轴点 1085.68),在扫除了底部形态右侧的 3 周窄幅盘整后。周线图上,它已连续 5 周收红,并且出现了蓝色的“摩天大楼”成交量柱,周线 RS 线也正在创新高。
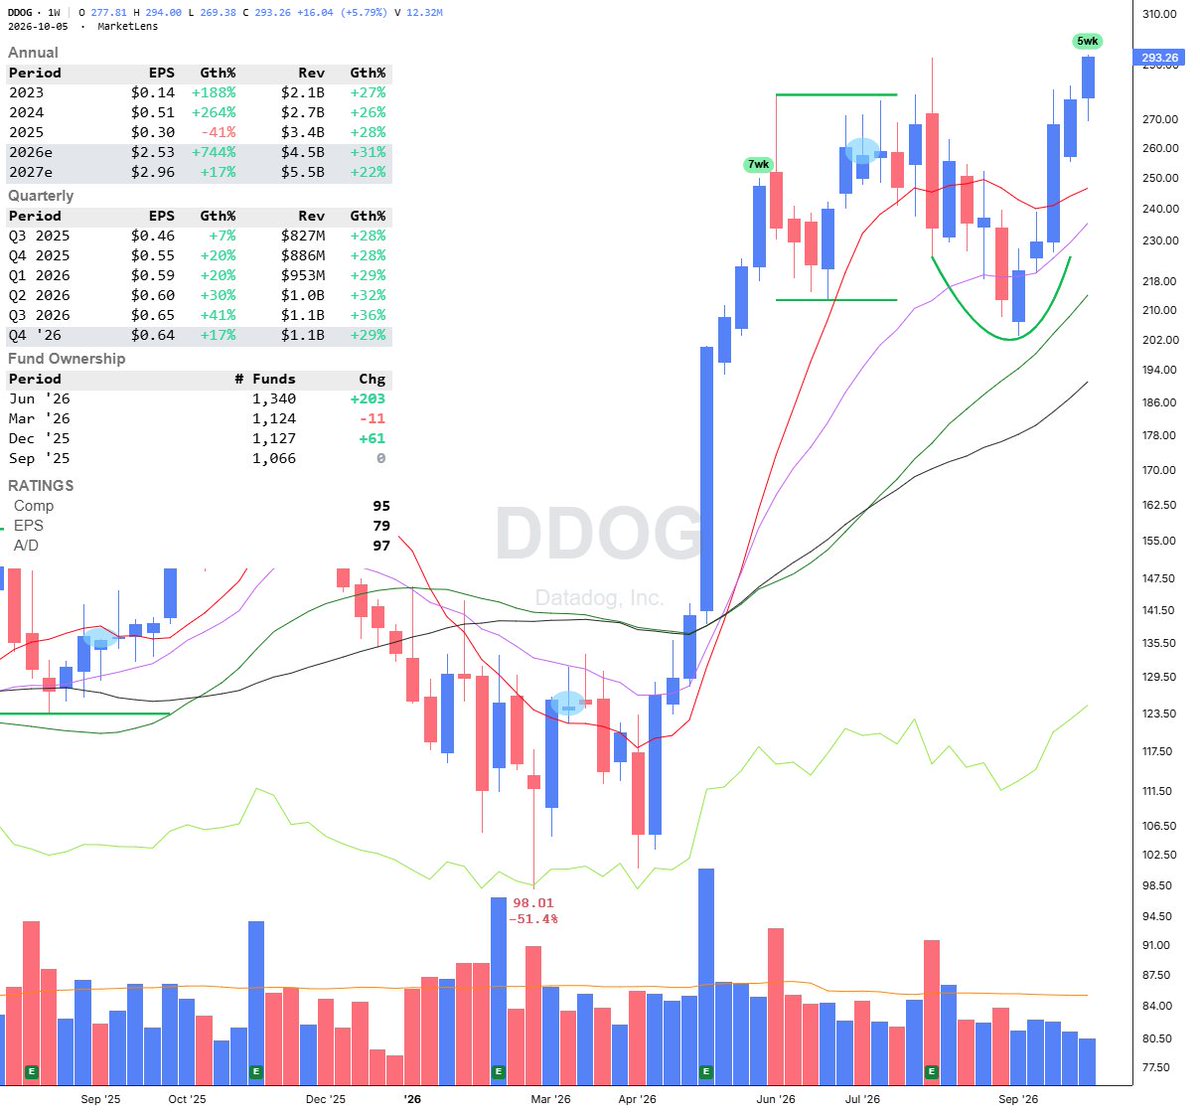
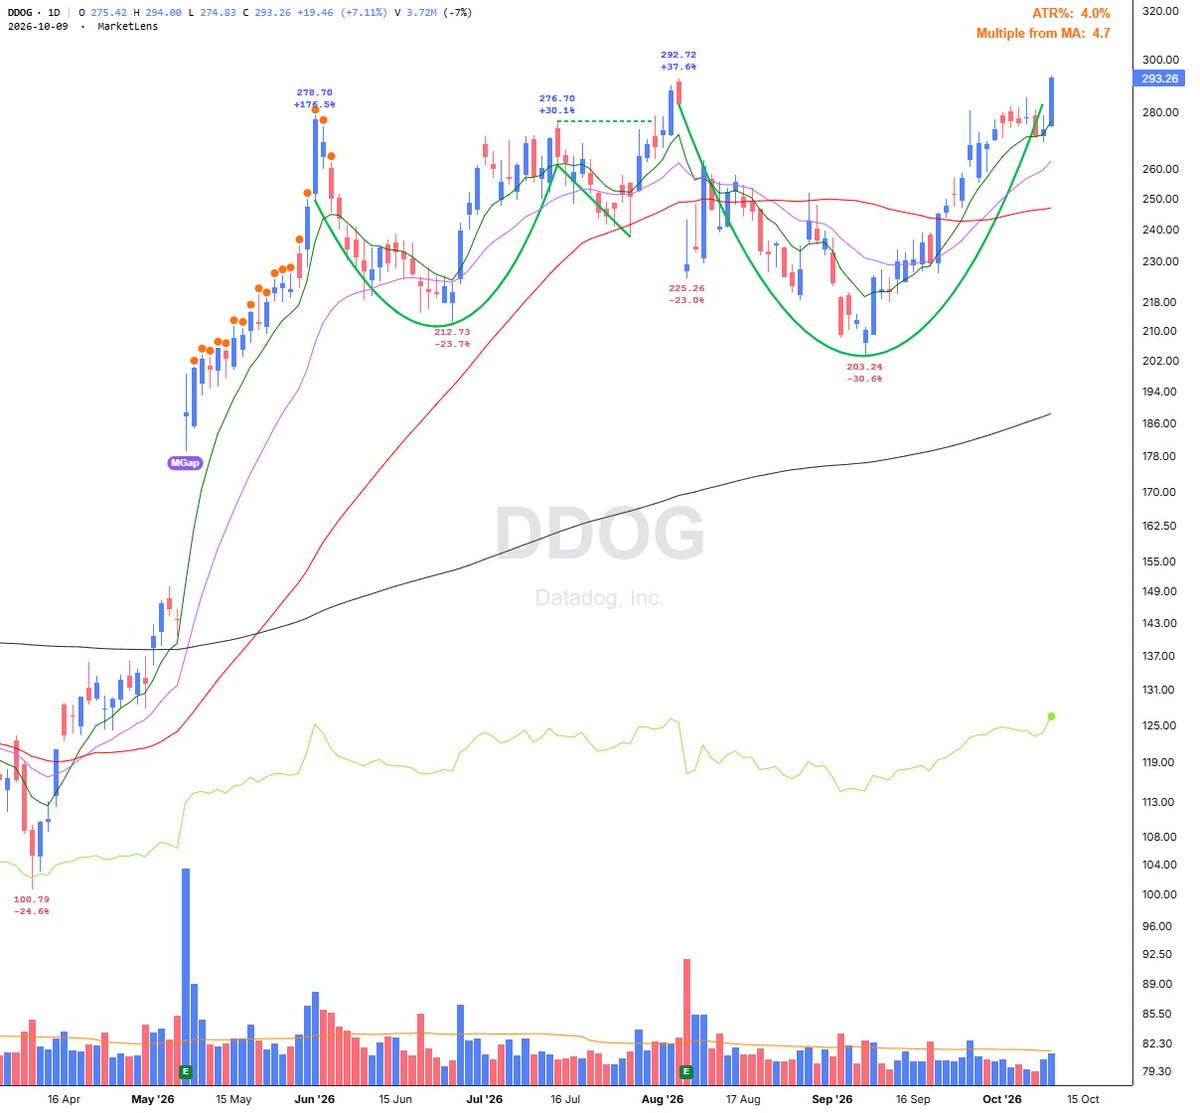
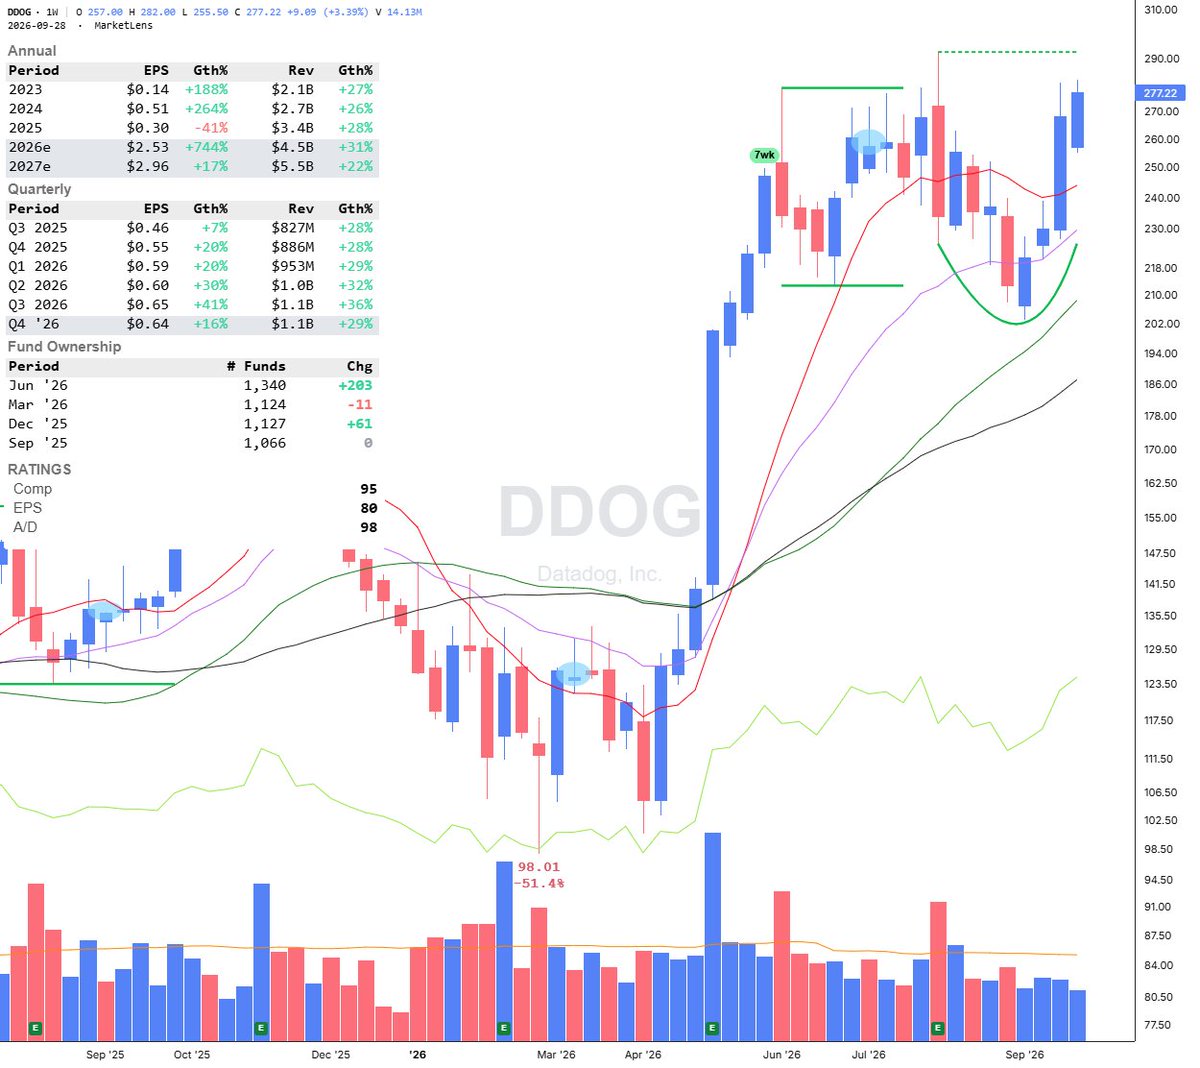
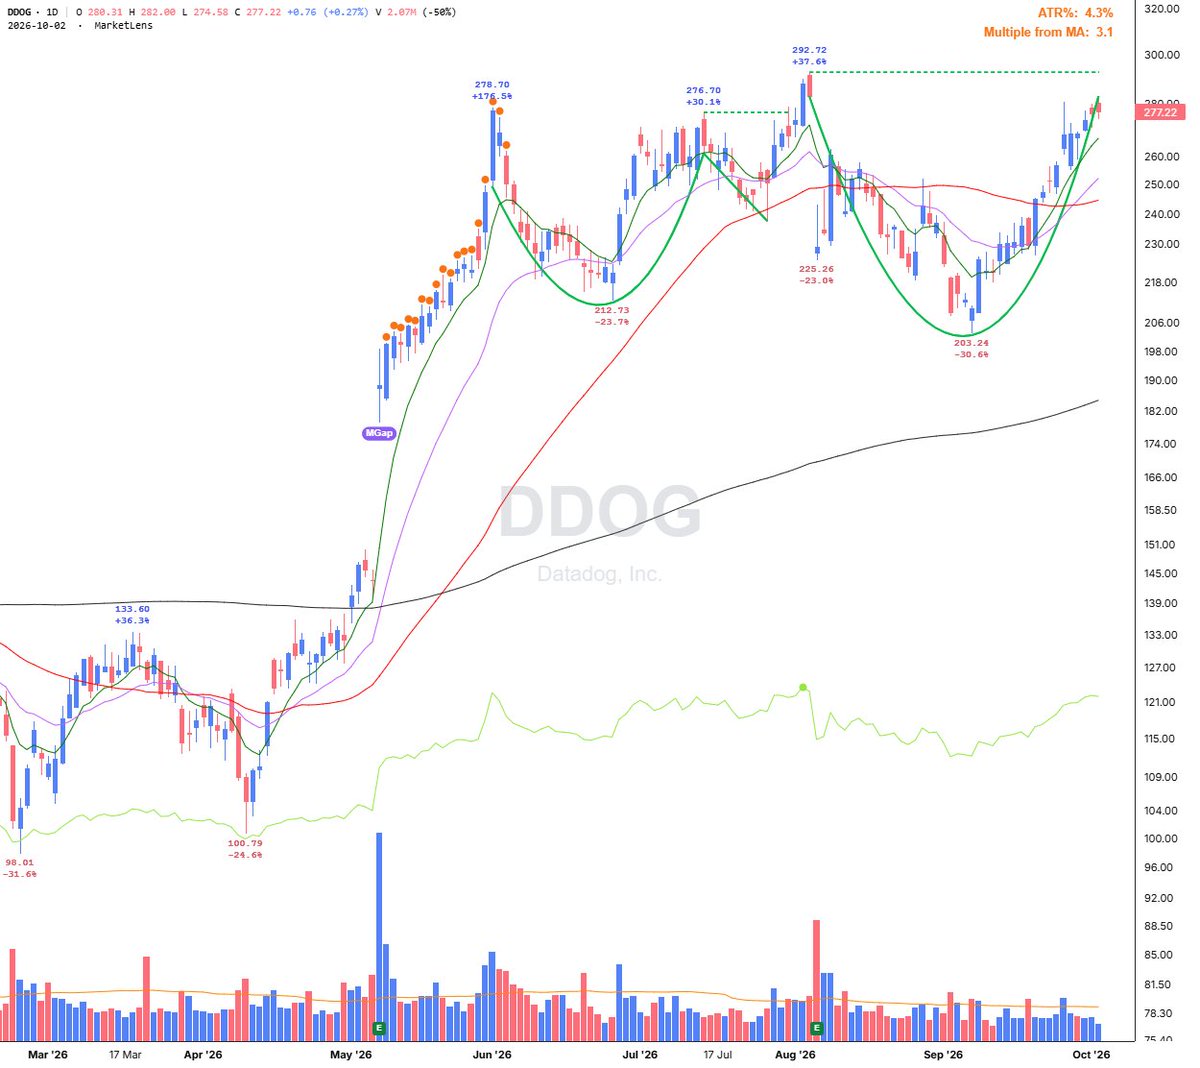
$DDOG 在守住短期 8 日 EMA 后反弹,收盘创下新高,同时 RS 线也录得新高。它突破了 292.72 点的杯柄形态突破点。周线上看,有明显的吸筹迹象,已连续上涨五个星期。接下来要观察的是,它能否形成一个紧凑的高位柄部。
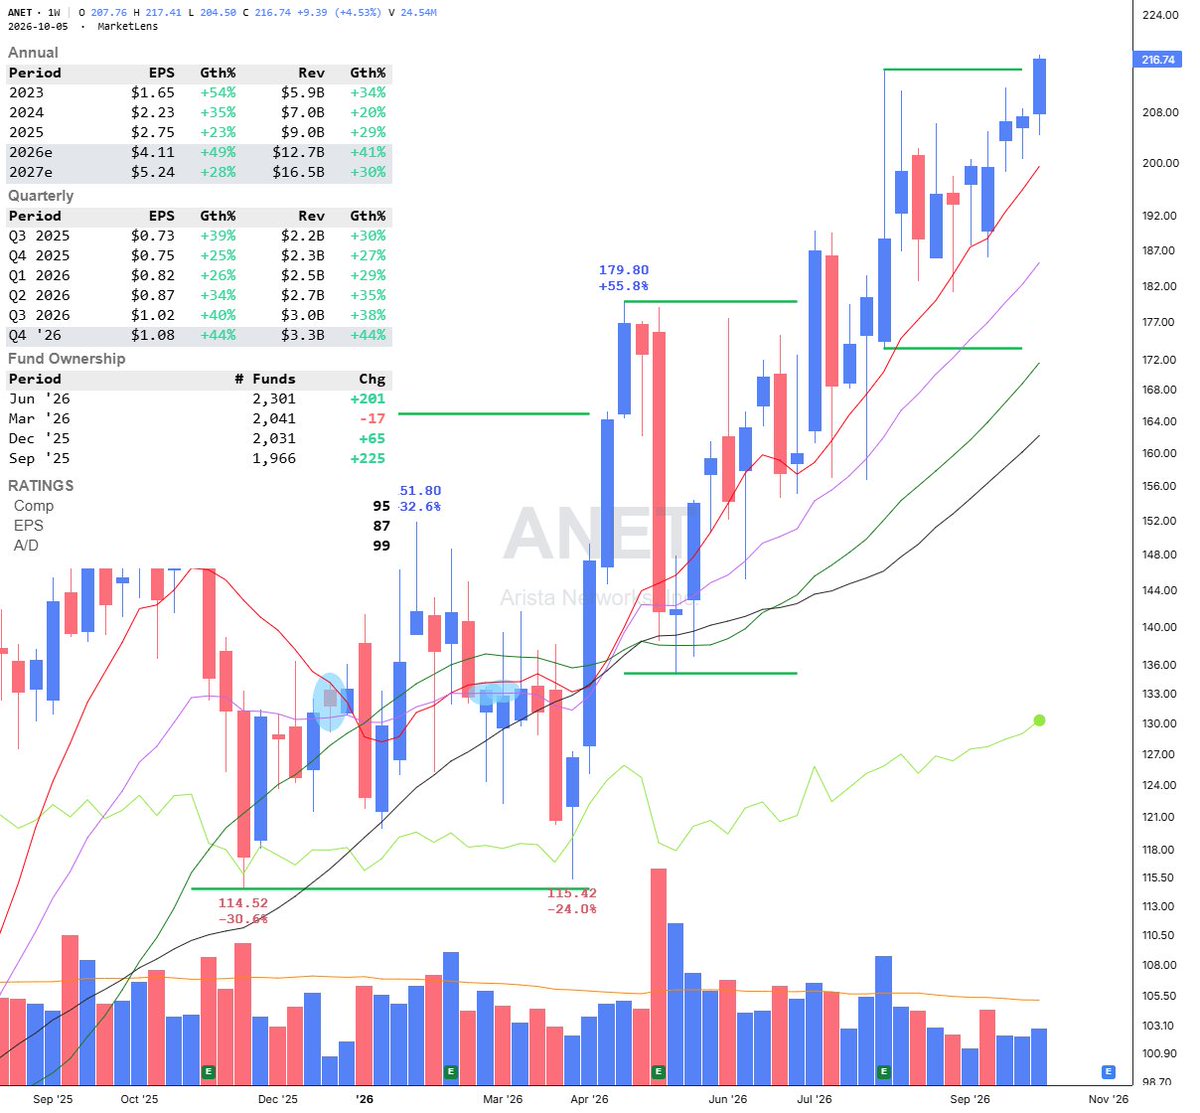
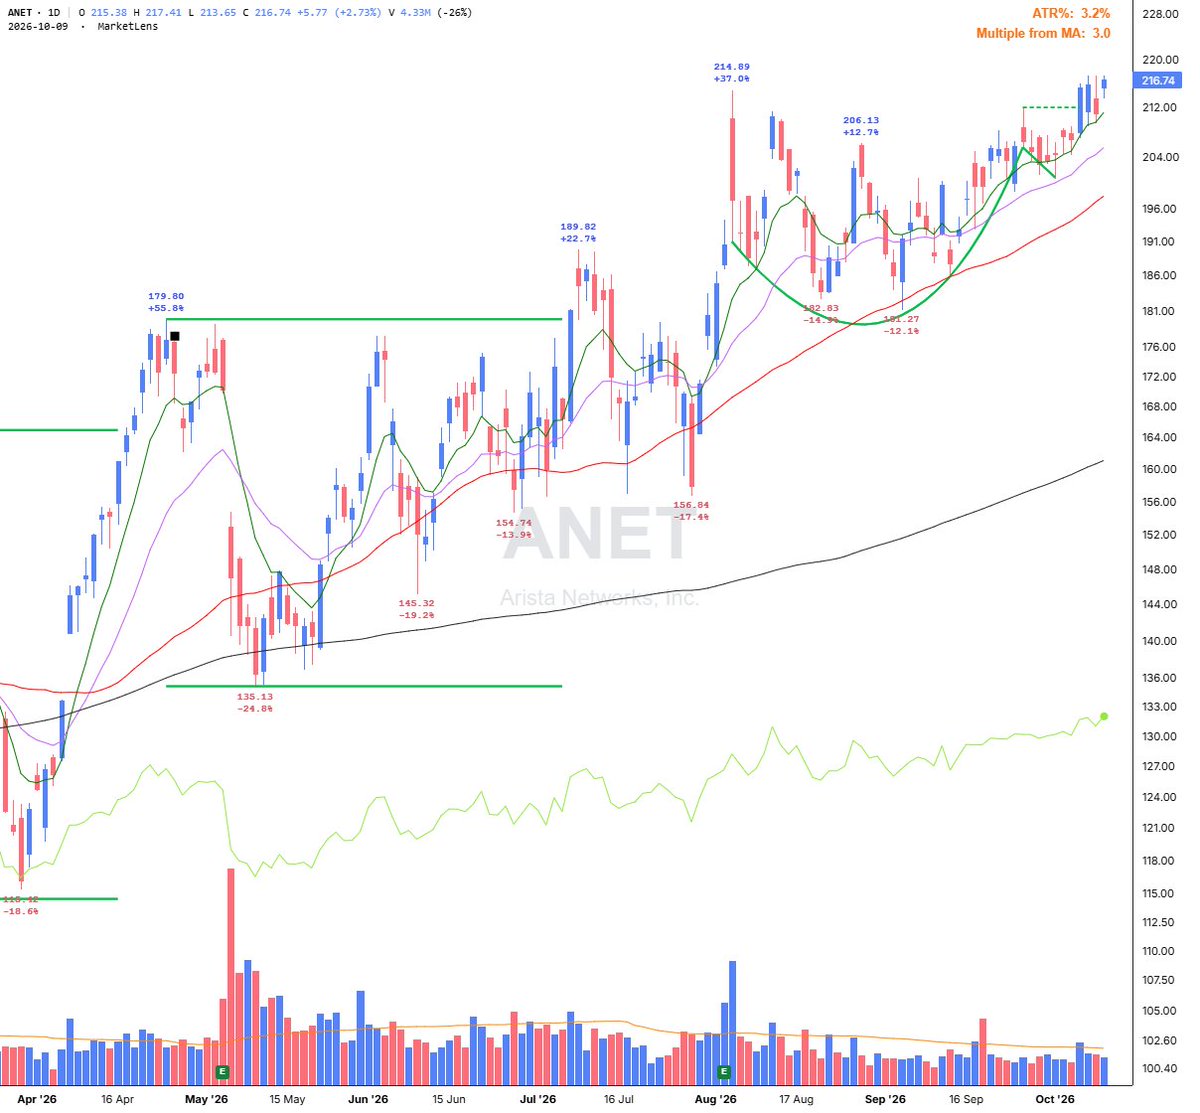
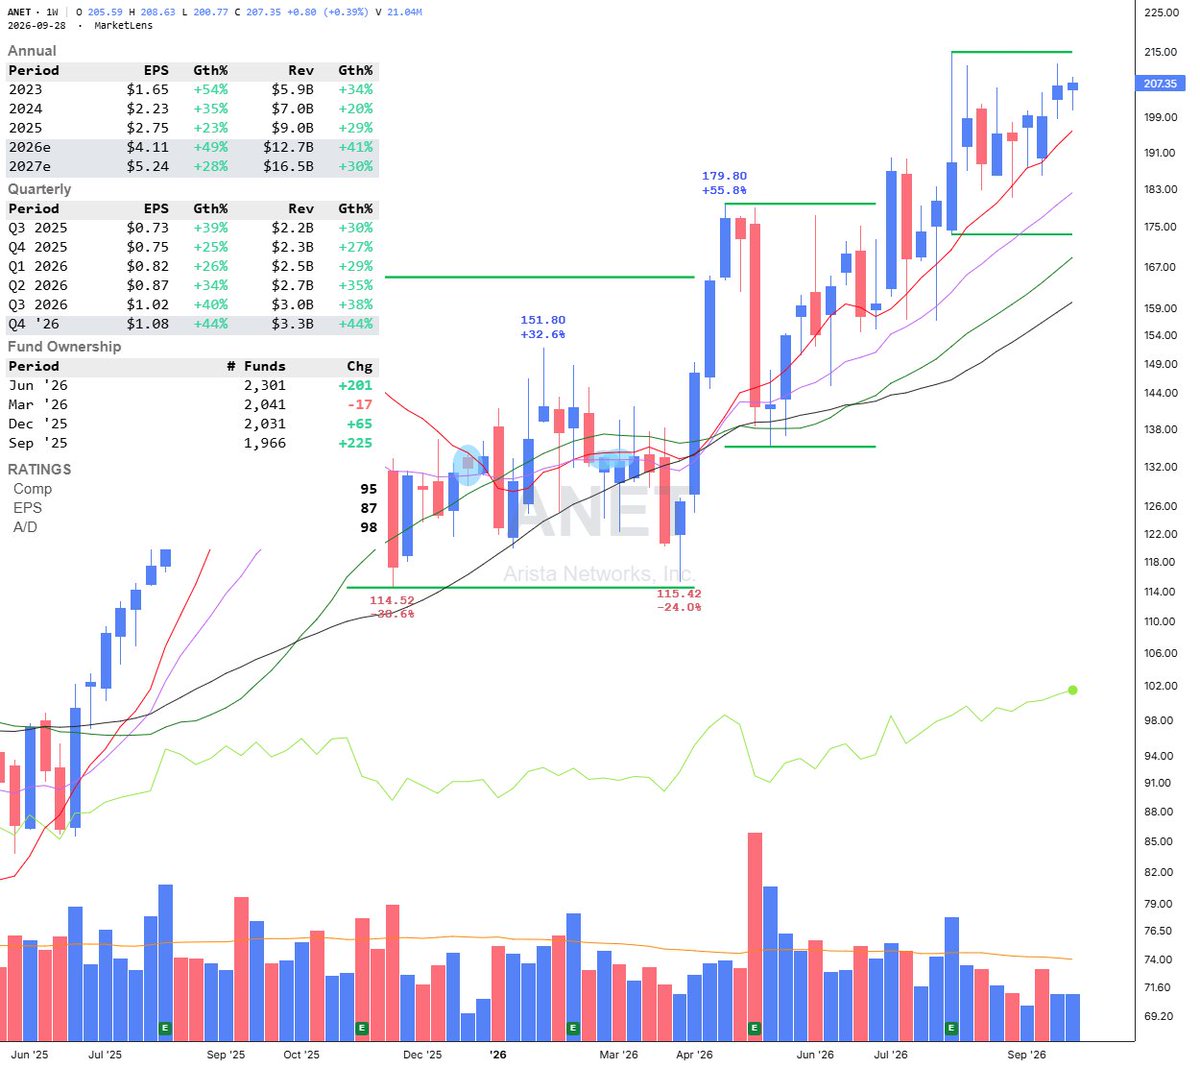
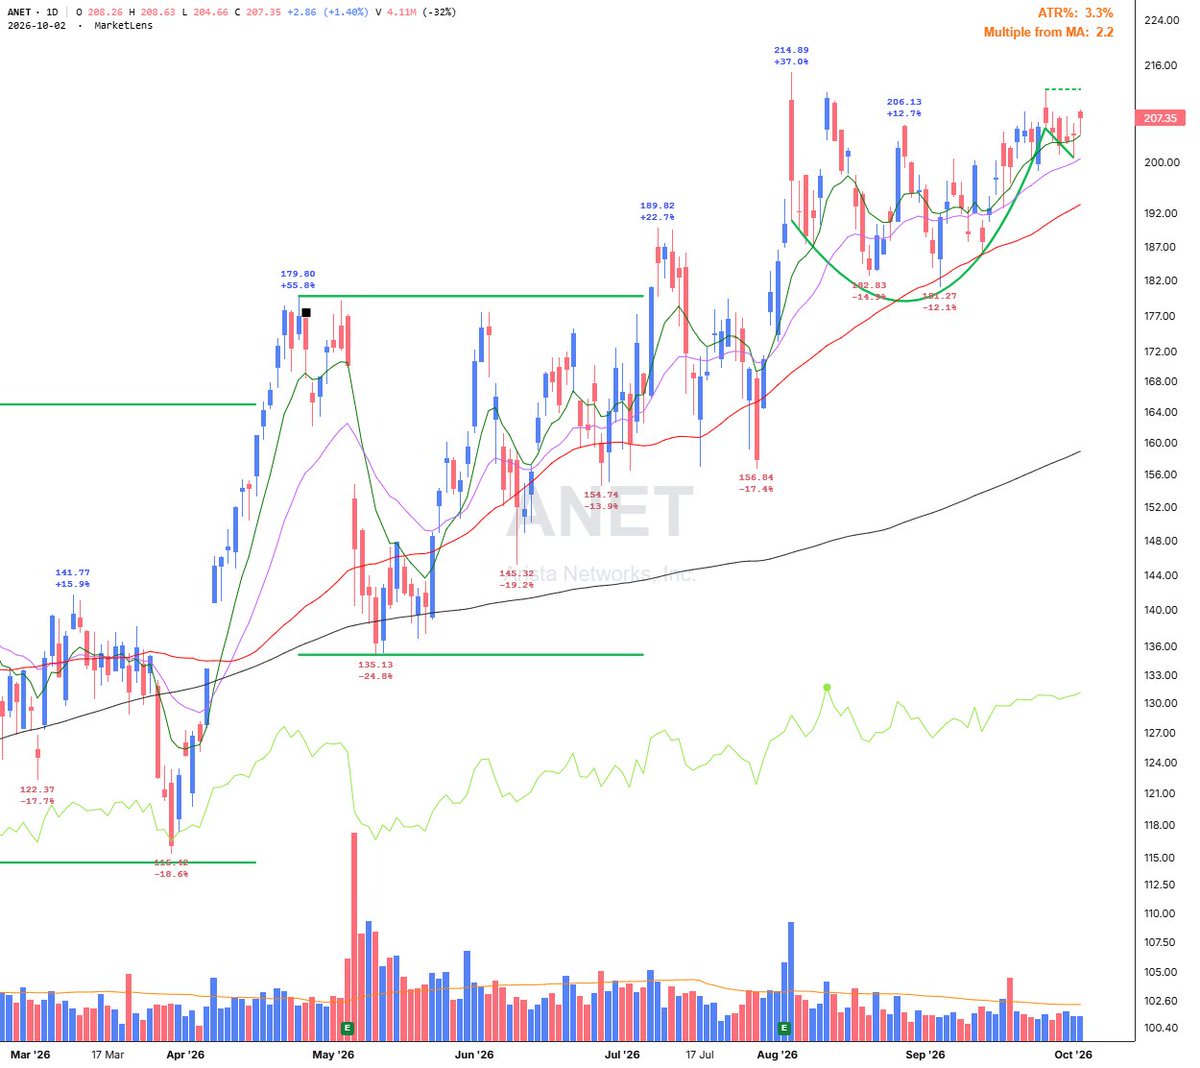
$ANET 星期二的交易量仅略高于平均水平,突破了其浅层杯柄形态的212关键位。它也攻克了那个趋于平坦的底部高点(标准关键位214.89 / 早期关键位206.13,深度-15.6%),基本呈现出同样的浅层杯柄形态。当天收盘价创下历史新高,相对强弱指标线(RS line)也触及新高。
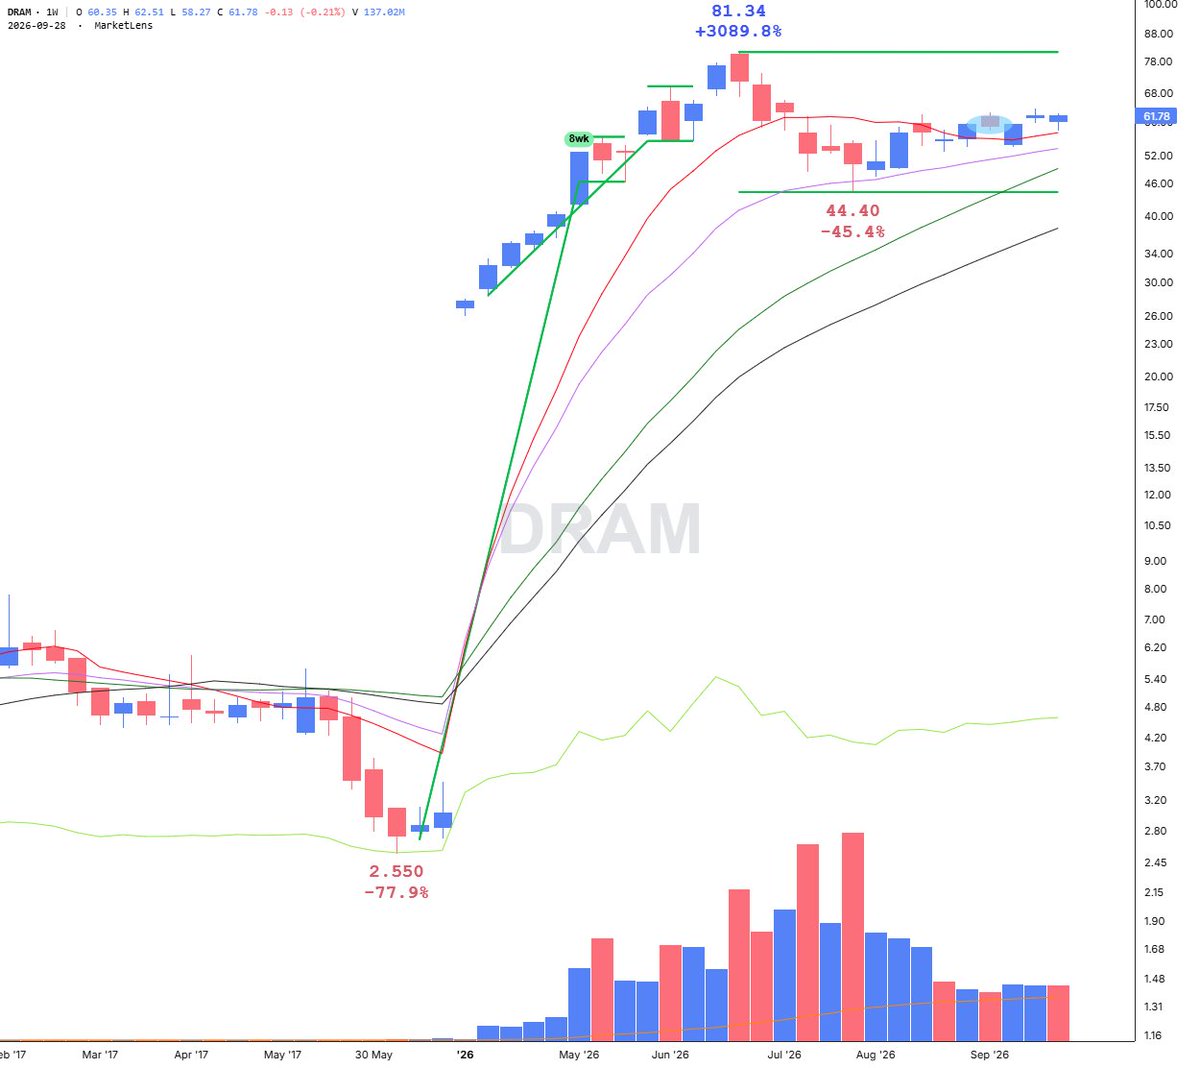
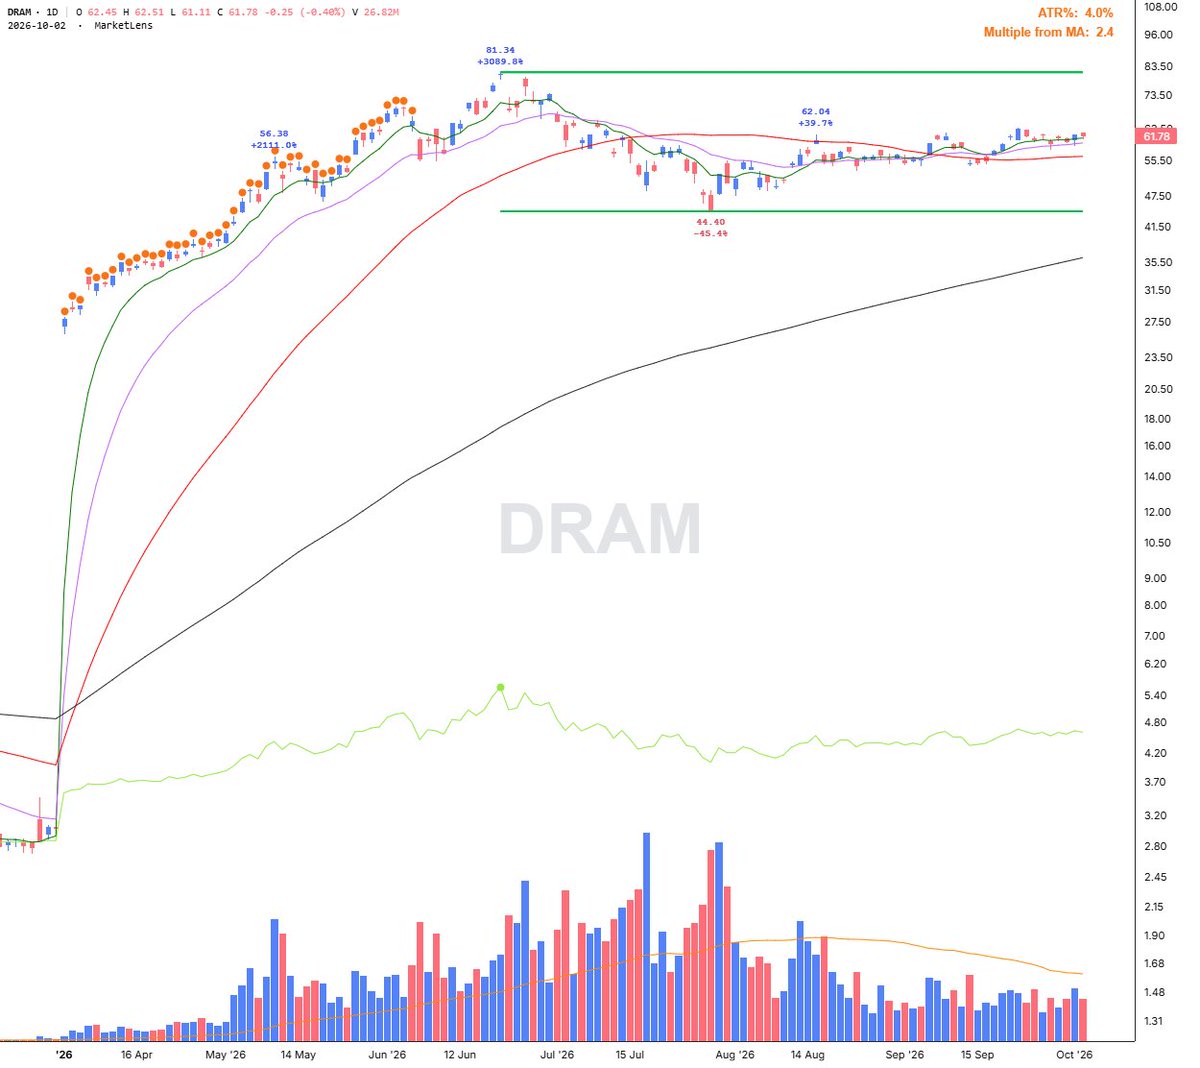
Roundhill Memory ETF $DRAM 依然在 21 天 EMA 处表现坚挺 — 买盘持续进场。它看起来正在构建一个新杯形底的右侧(81.34 标准枢轴点)。我关注的关键近期水平:首先是干净利落地突破 62.04,然后是 62.59(三周紧密价位)。
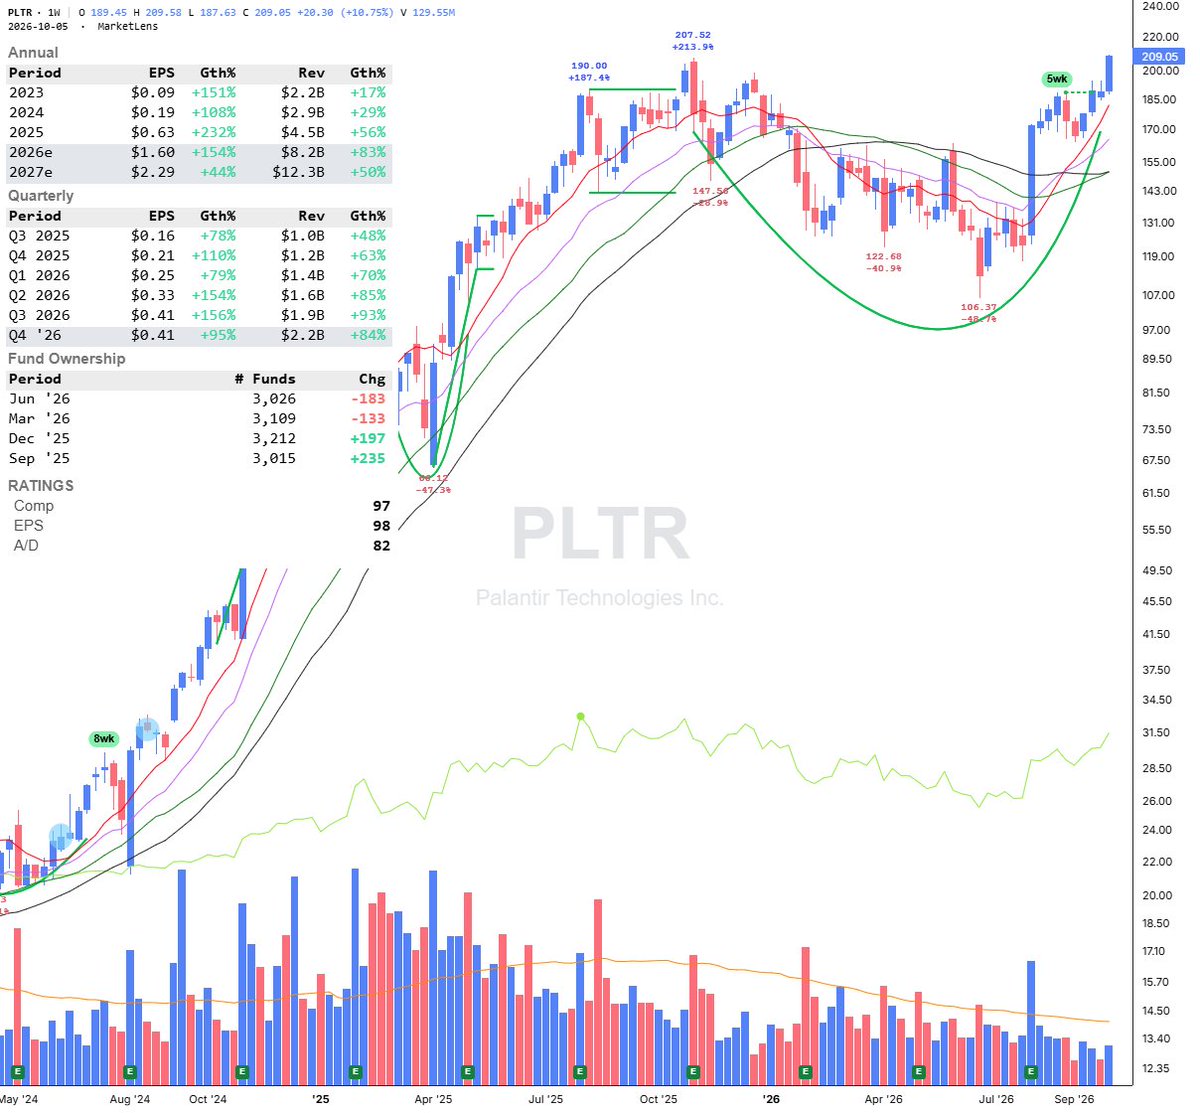
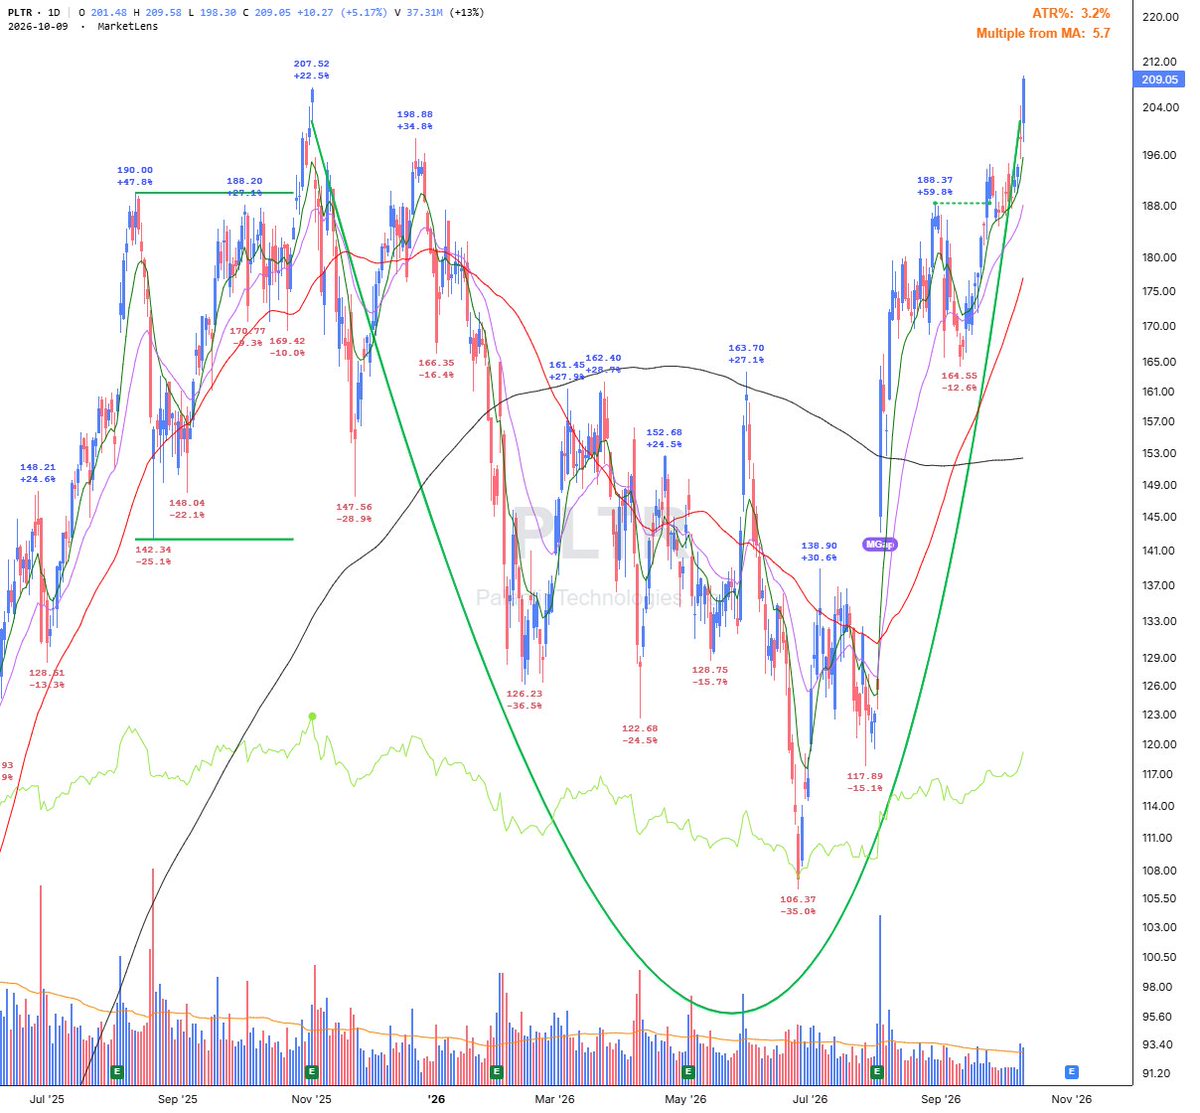
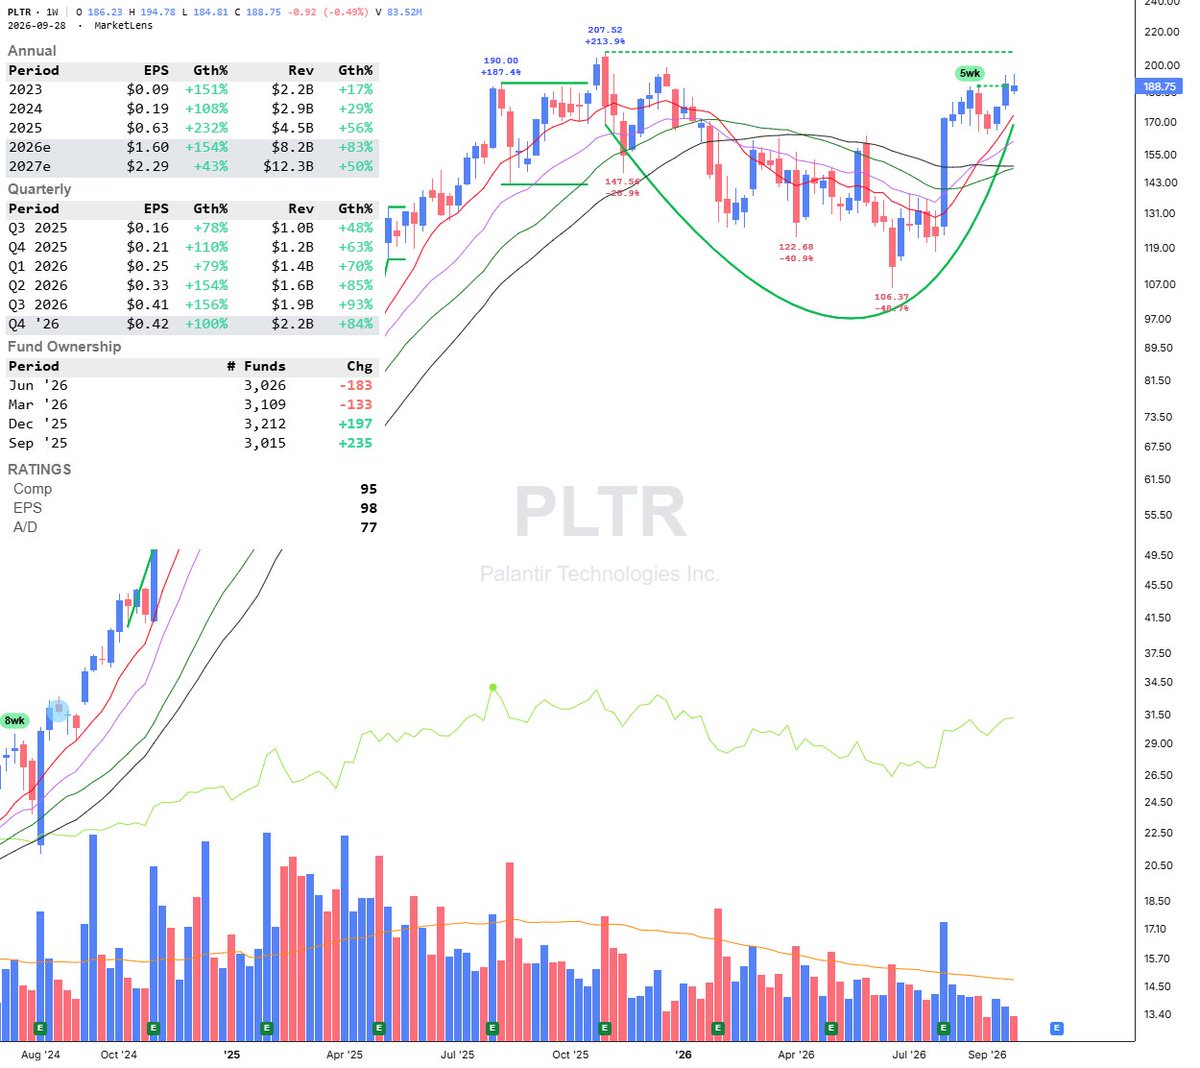
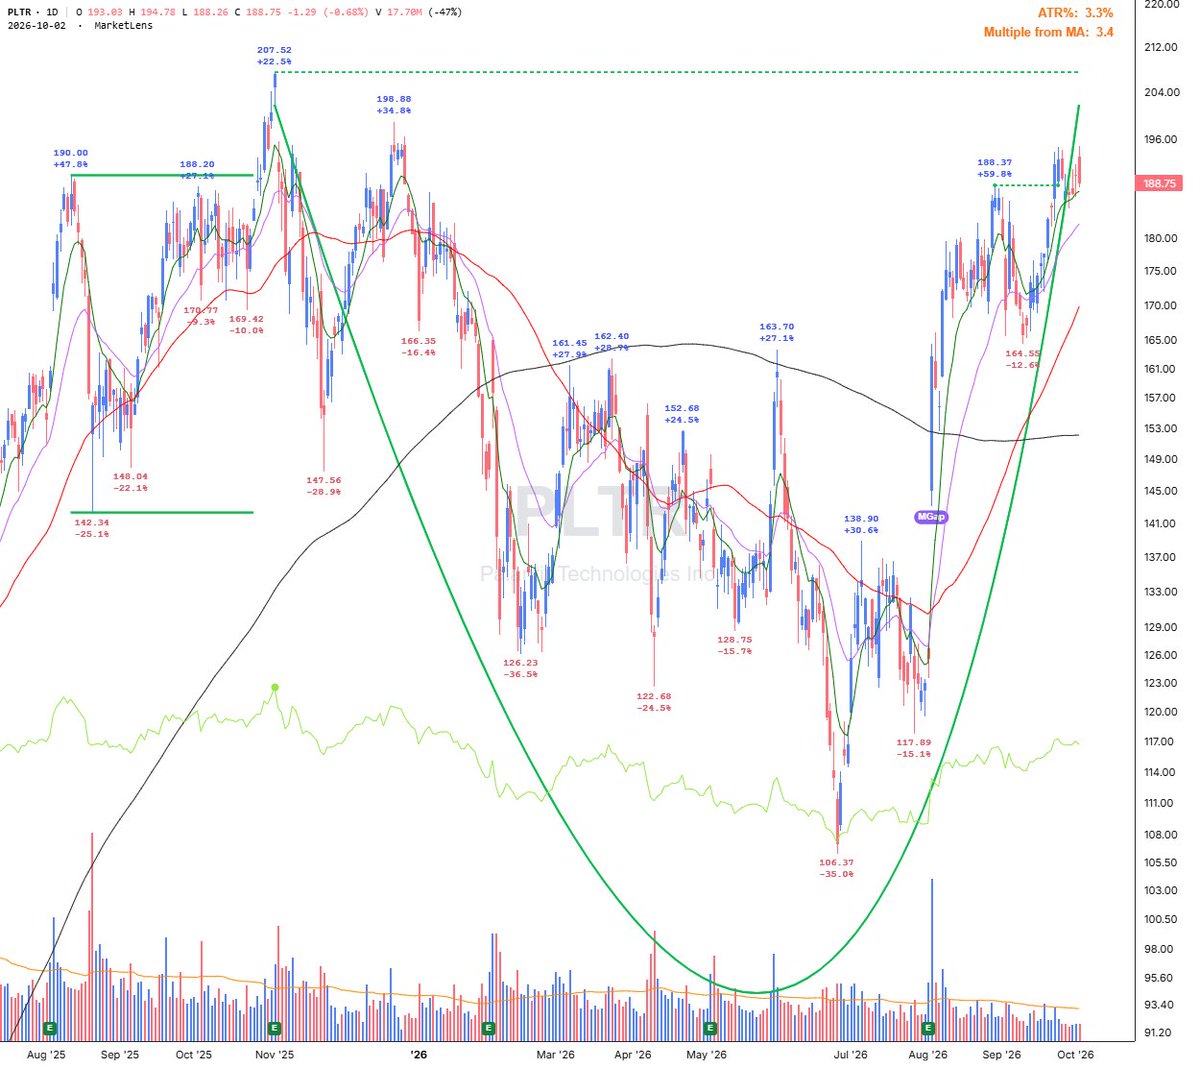
$PLTR 刚刚形成了一个内涵周,同时触及了 188.37 的关键价位,这是一个旗形 / 深杯柄形态的设置。现在就看它能不能突破 200 这个“世纪关口”,并在接下来的几周内,从这个更大的结构上,真正去冲击 207.52 的历史新高 (ATH)。
$LITE 突破了 1026.76 的关键价位,摆脱了为期三周的窄幅盘整形态。周五触及了历史新高,并且成功收盘于新的收盘高点,略低于源自那个 45% 深度的底部形态的 1085.68 关键价位。周线相对强弱指标 (RS) 也正在创下新高。
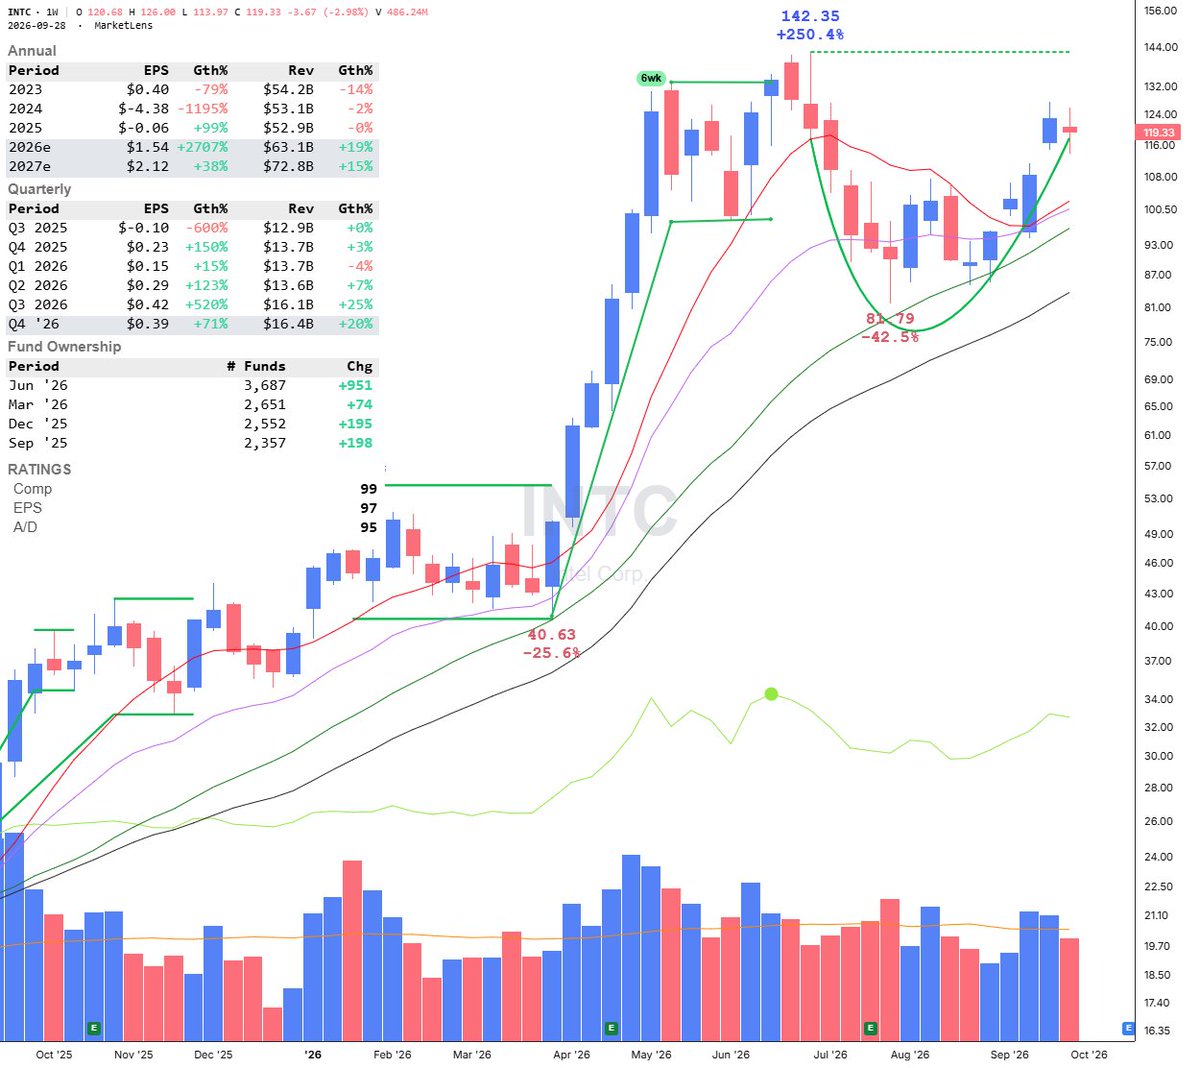
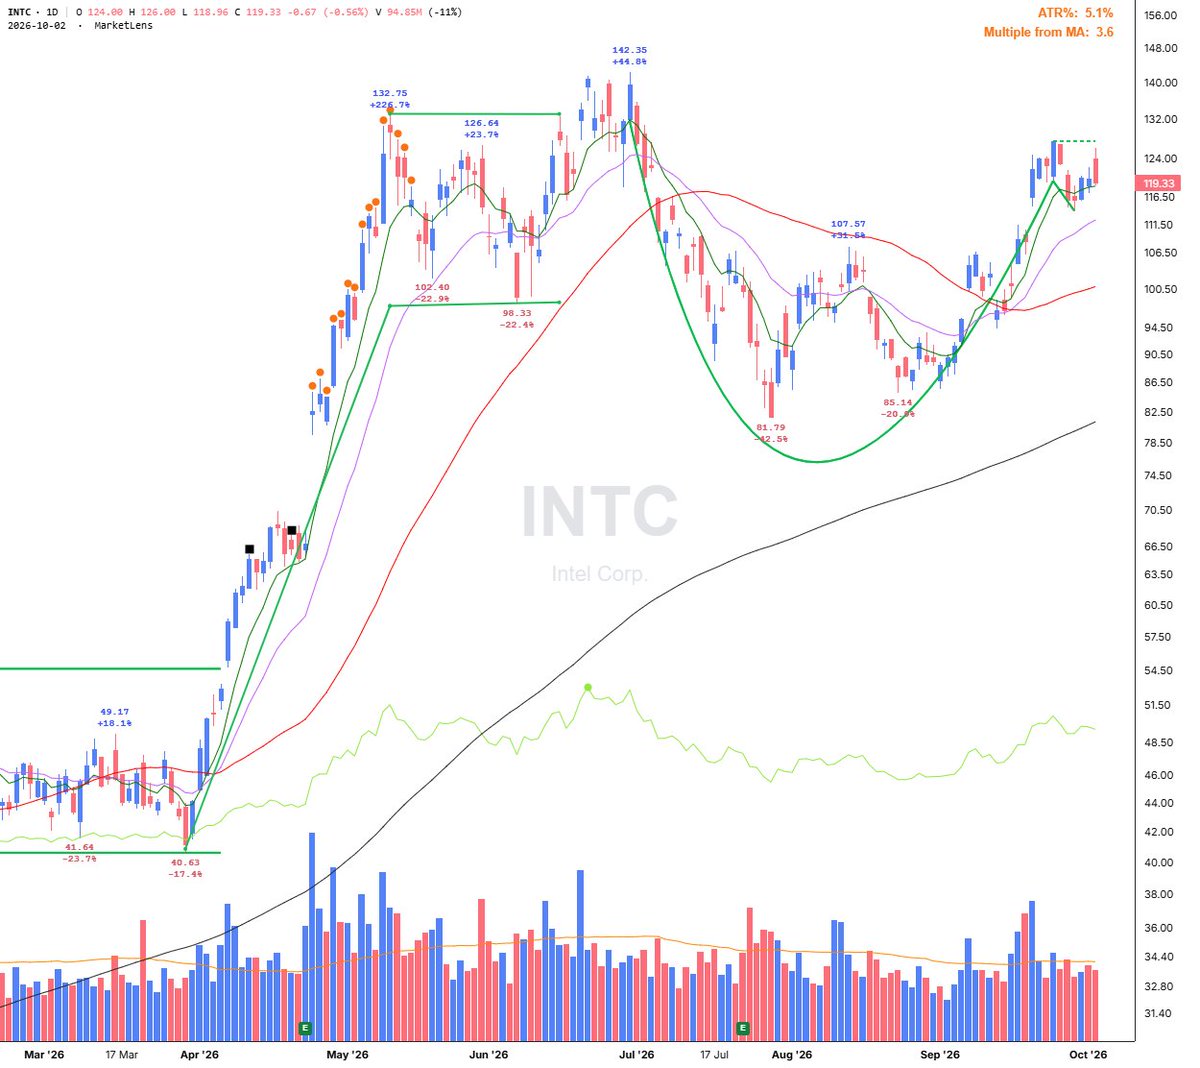
$ANET 从其底部形态突破了早期枢轴点 206.13。它正形成一个大致的平台型底部(标准枢轴点 214.89,早期枢轴点 206.13,深度:-15.6%),或者可能是一个浅的杯柄形态(212 标准枢轴点)。
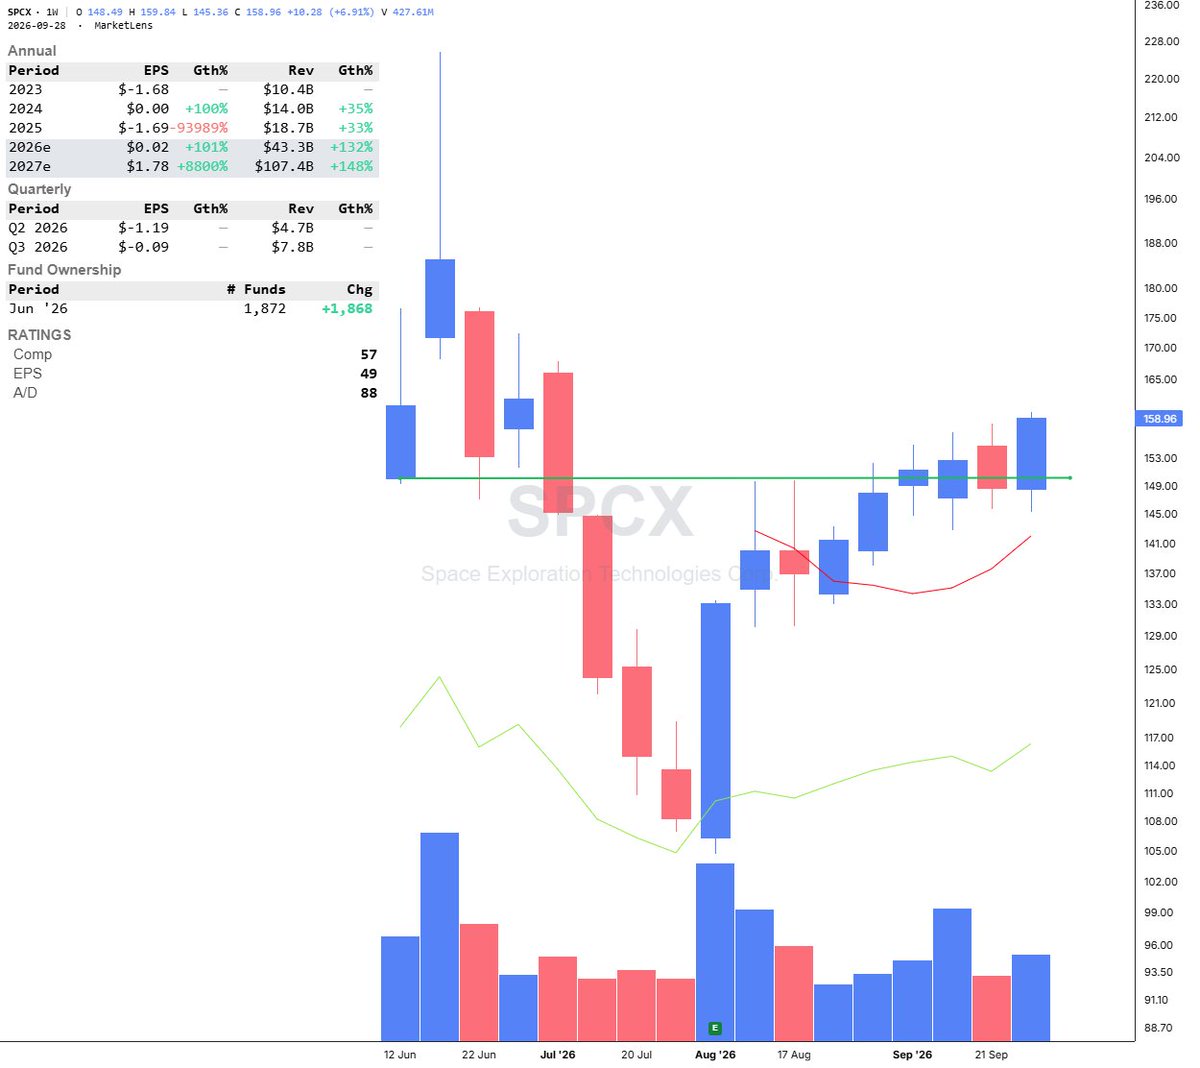
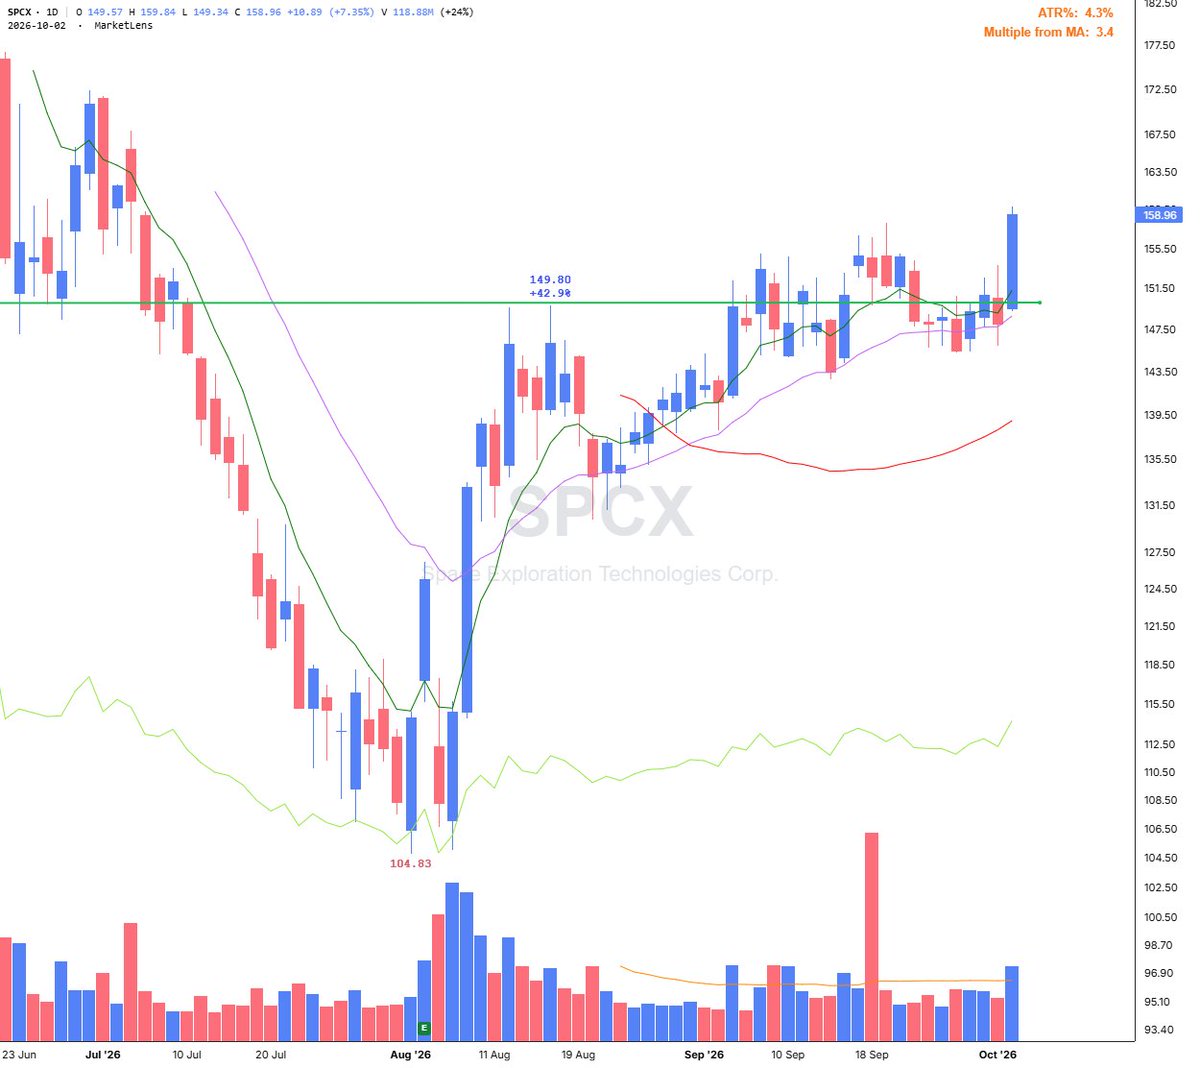
$SPCX 重新站上了 149.80 的盘中高点以及上市首日开盘价 150,此前在 21 日 EMA 处成功反弹,成交量大于平均水平。我接下来关注的区域是 160,并以 160.95 的上市首日收盘价作为关键参考。