QUICK
1351點贊0分享44粉絲68關注
🚀 Crypto Market Analyst | 📊 Technical Analysis | 🔥 Bullish & Bearish Signals | 📈 Spotting Opportunities | Knowledge • Discipline • Consistency.
🚀 Crypto Market Analyst | 📊 Technical Analysis | 🔥 Bullish & Bearish Signals | 📈 Spotting Opportunities | Knowledge • Discipline • Consistency.
XMLMUSDT
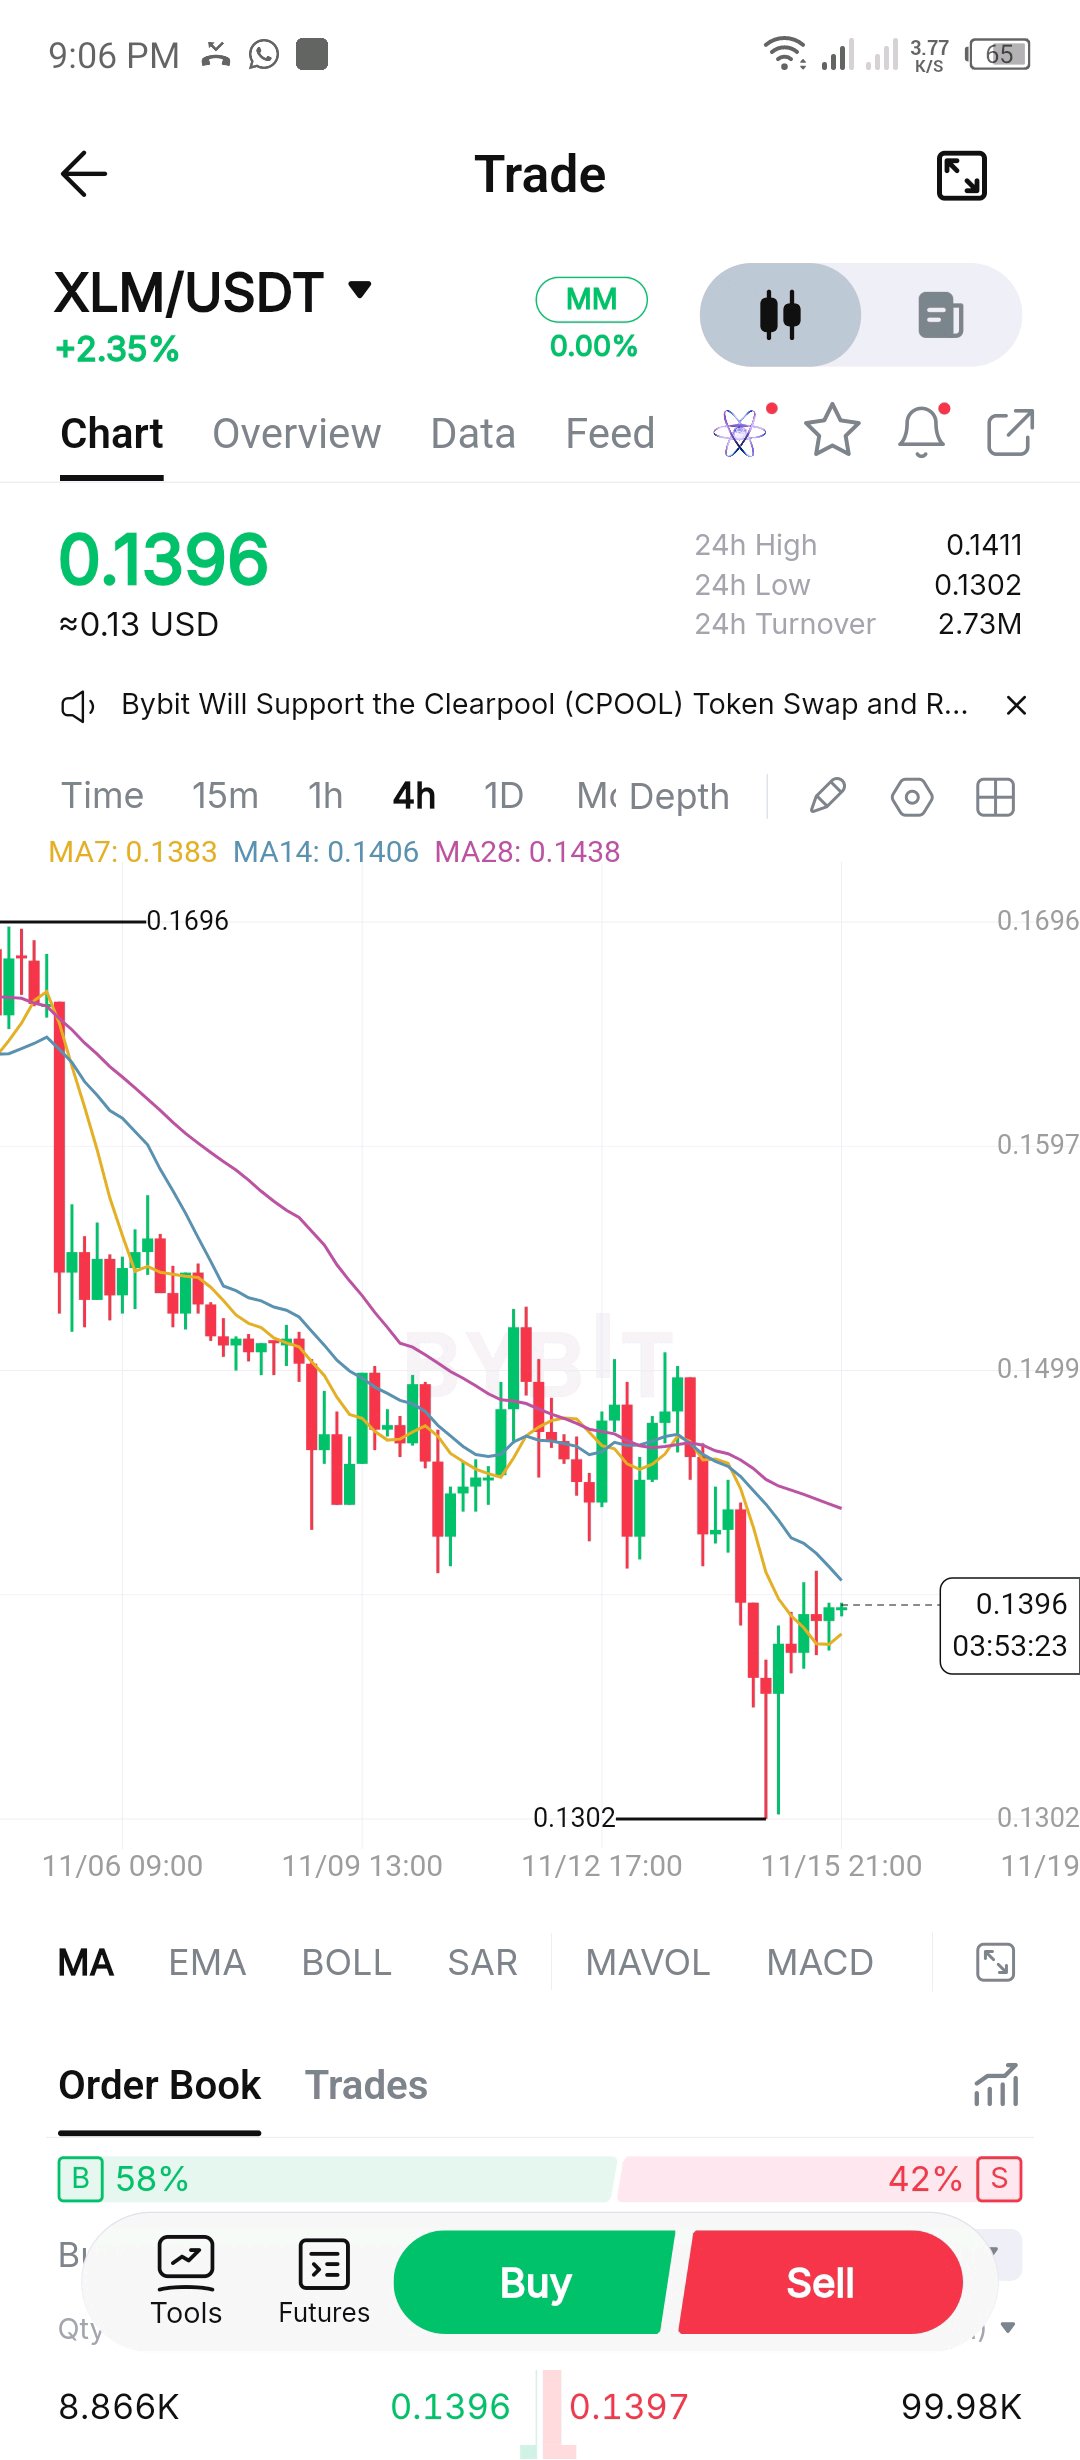
$XLMUSDT $XLMUSDT 技術分析 時間週期:4H 當前價格:$0.1396 24H 漲跌幅:+2.35% 1. 市場趨勢 整體趨勢仍為看跌 (DOWN)。 MA7:0.1383 MA14:0.1406 MA28:0.1438 價格高於 MA7,但低於 MA14 和 MA28。這顯示在更大的下跌趨勢中出現了短期回升。 2. 支撐位 $0.1380 – 即時支撐 $0.1350 – 次級支撐 $0.1302 – 主要支撐 3. 壓力位 $0.1406 – 第一壓力位 $0.1438 – 強壓力位 $0.1499 – 主要壓力位 4. 可能的市場走向 看漲情境:如果 XLM 突破並收在 4H K 線 $0.1406 上方,它可能會走向 $0.1438。 看跌情境:如果價格在 $0.1406 附近受阻,可能會下跌至 $0.1380 和 $0.1350。 5. 我的交易偏好 短期:小幅看漲回升。 整體:看跌。 我的偏好是等待確認後再進入交易。 避免急於買入或賣出。突破確認很重要。 結論:在 XLM 令人信服地突破 $0.1438 之前,維持看跌 (DOWN) 偏好。 #IMPACTbyTrade
dogeusdt
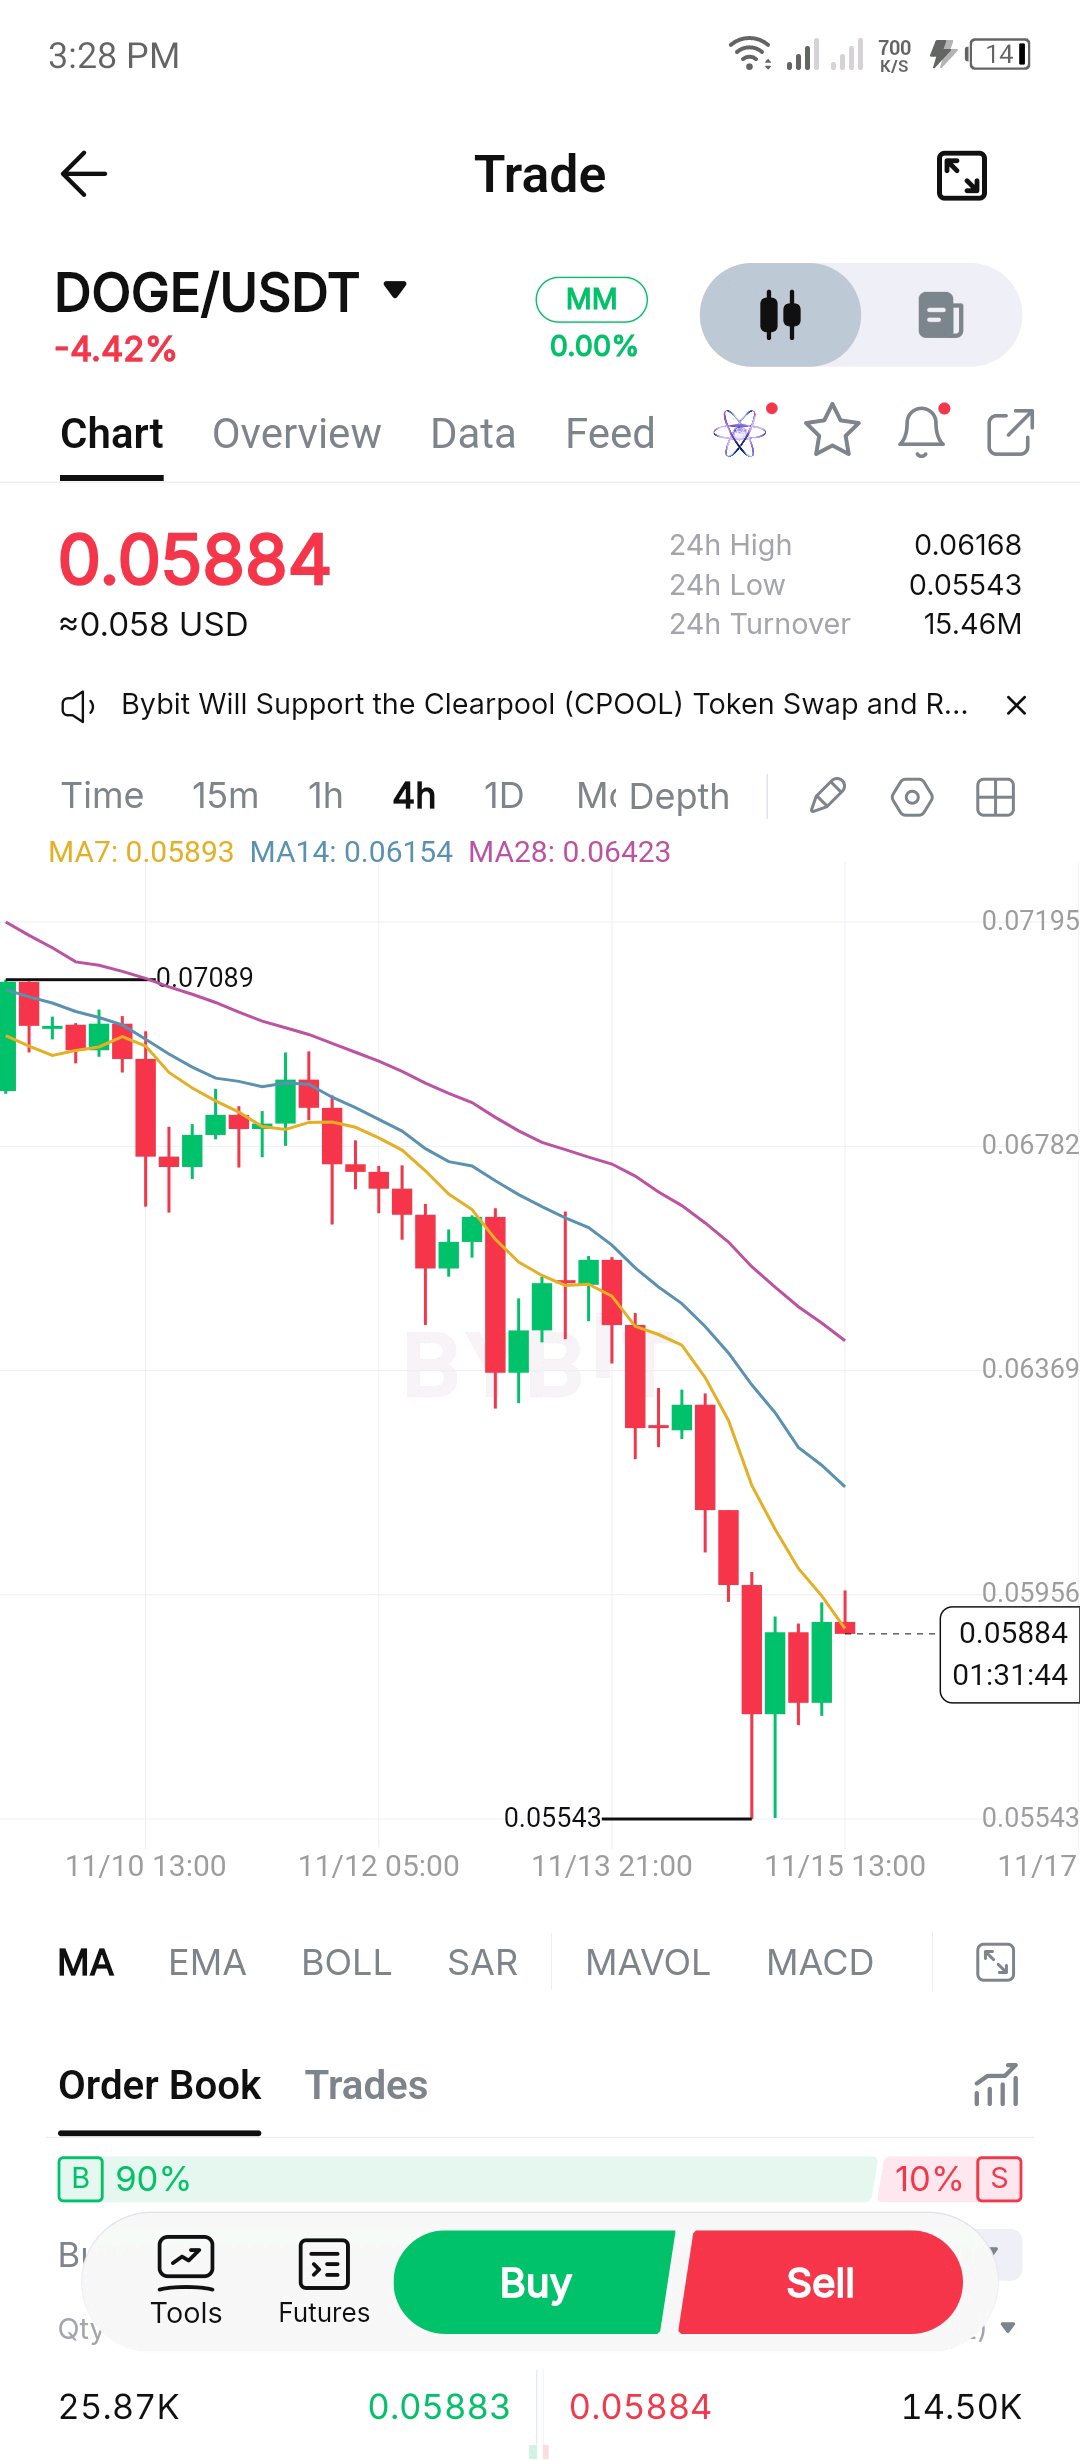
$DOGEUSDT – Detailed Technical Analysis Timeframe: 4H (4-hour chart) 1. Market Structure DOGE/USDT is currently in a strong bearish trend. The chart shows a sequence of lower highs and lower lows. The price has fallen from approximately 0.07089 to 0.05543, indicating significant selling pressure. Currently, DOGE is trading around 0.05884, following a small bullish recovery. 2. Moving Average Analysis Your chart shows: Indicator Value MA7 0.05893 MA14 0.06154 MA28 0.06423 Interpretation: MA7 is below MA14. MA14 is below MA28. Price is below all three moving averages. This is a bearish moving-average alignment. It suggests sellers are still controlling the market. 3. Support Levels These are important price levels to watch: Support Price Support 1 0.05700 Support 2 0.05543 Support 3 0.05350 If sellers break 0.05543 convincingly, further downside may follow. 4. Resistance Levels Resistance Price Resistance 1 0.05950 Resistance 2 0.06154 Resistance 3 0.06423 The 0.05950 area is particularly important because it is close to the MA7. A strong 4H candle closing above this level could indicate improving bullish momentum. 5. Bullish Scenario DOGE could start recovering if: Buyers defend 0.05700. Price breaks 0.05950. A 4H candle closes above resistance. Buying volume increases. Possible upside targets: 0.06150 0.06300 0.06420 6. Bearish Scenario DOGE could continue falling if: Price fails to break 0.05950. Sellers regain control. Price breaks below 0.05700. Possible downside targets: 0.05543 0.05350 7. Trading Decision Trading Direction My View BUY / LONG Wait for confirmation SELL / SHORT More favourable technically Overall Trend Bearish Short-term Movement Small bullish recovery Medium-term Trend Bearish 8. Final Verdict My current bias is SHORT (DOWN) The overall 4H structure remains bearish despite the recent recovery. However, I would not recommend entering a SHORT position blindly at 0.05884. Wait for rejection around 0.05950 or a confirmed breakdown below 0.05700. #IMPACTbyTrade
mntusdt
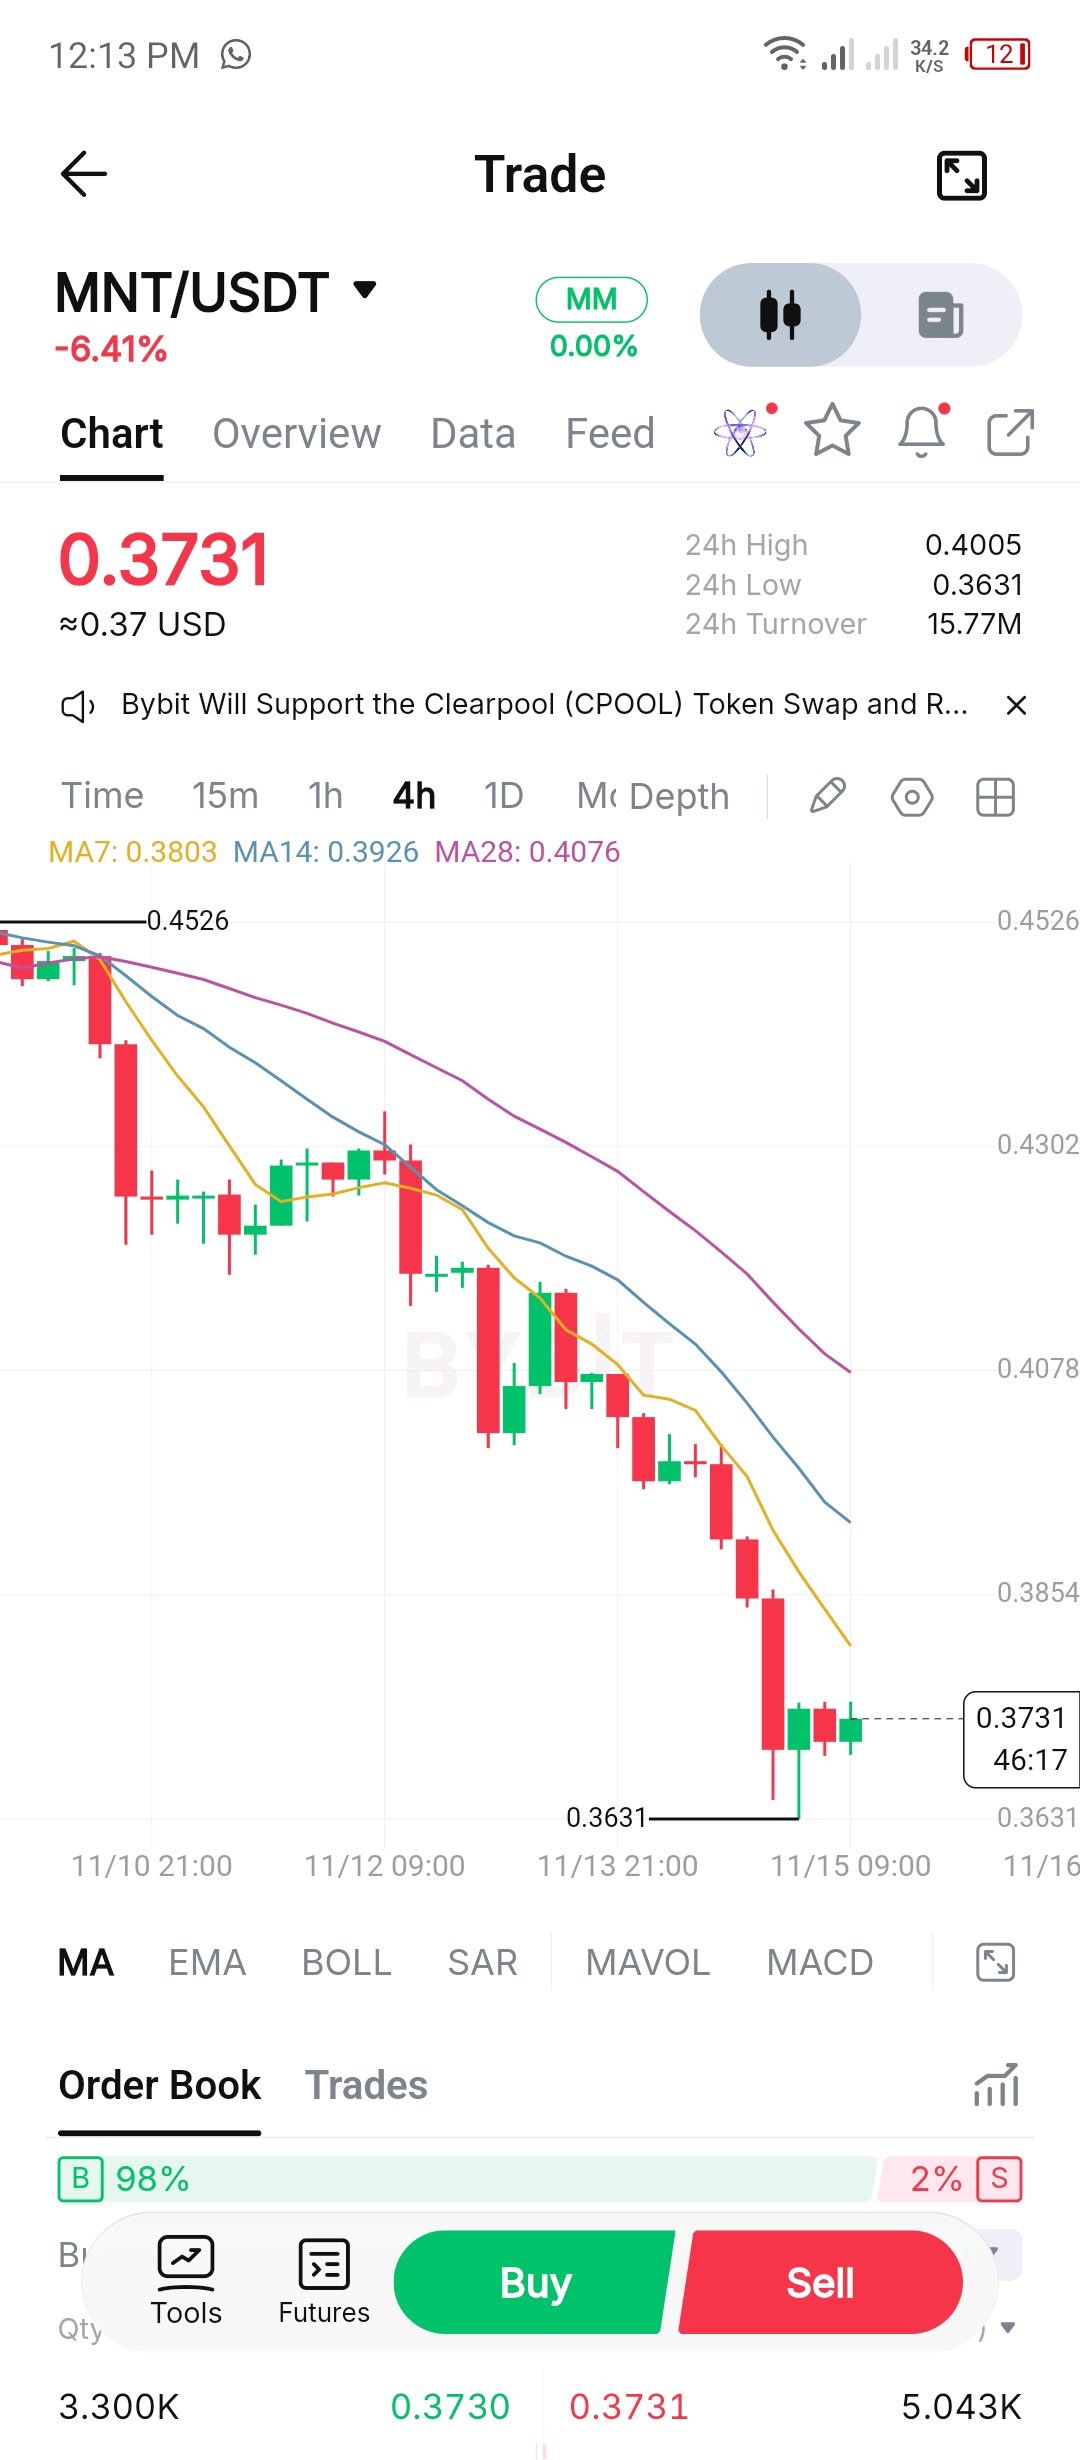
$MNTUSDT Technical Analysis (4H) **Current price:** 0.3731 **Market direction:** BEARISH (Downtrend) # 1. Trend Analysis - MA7: 0.3803 - MA14: 0.3926 - MA28: 0.4076 All three moving averages are above the current price. This indicates strong selling pressure. ## 2. Key Levels **Support:** - 0.3631 – Major support. - 0.3600 – Possible next support if 0.3631 breaks. **Resistance:** - 0.3800 – First resistance. - 0.3926 – Second resistance. - 0.4076 – Stronger resistance. ## 3. Trading Signal **SELL:** Bearish trend remains dominant. **BUY:** Wait for a strong bullish candle and confirmation above 0.3800. ## My Prediction - **Short-term:** DOWN - **Possible bounce:** YES, around 0.3631. - **Trend reversal:** Not confirmed. **My advice:** Don't rush into BUY yet. Wait for confirmation. A break below 0.3631 could trigger another downward move. This is a chart-based analysis, not a guaranteed prediction. I can also help you check the MNT/USDT trend again tomorrow. Check MNT/USDT trend tomorrow Tap to set up #IMPACTbyTrade
Pepe USDT
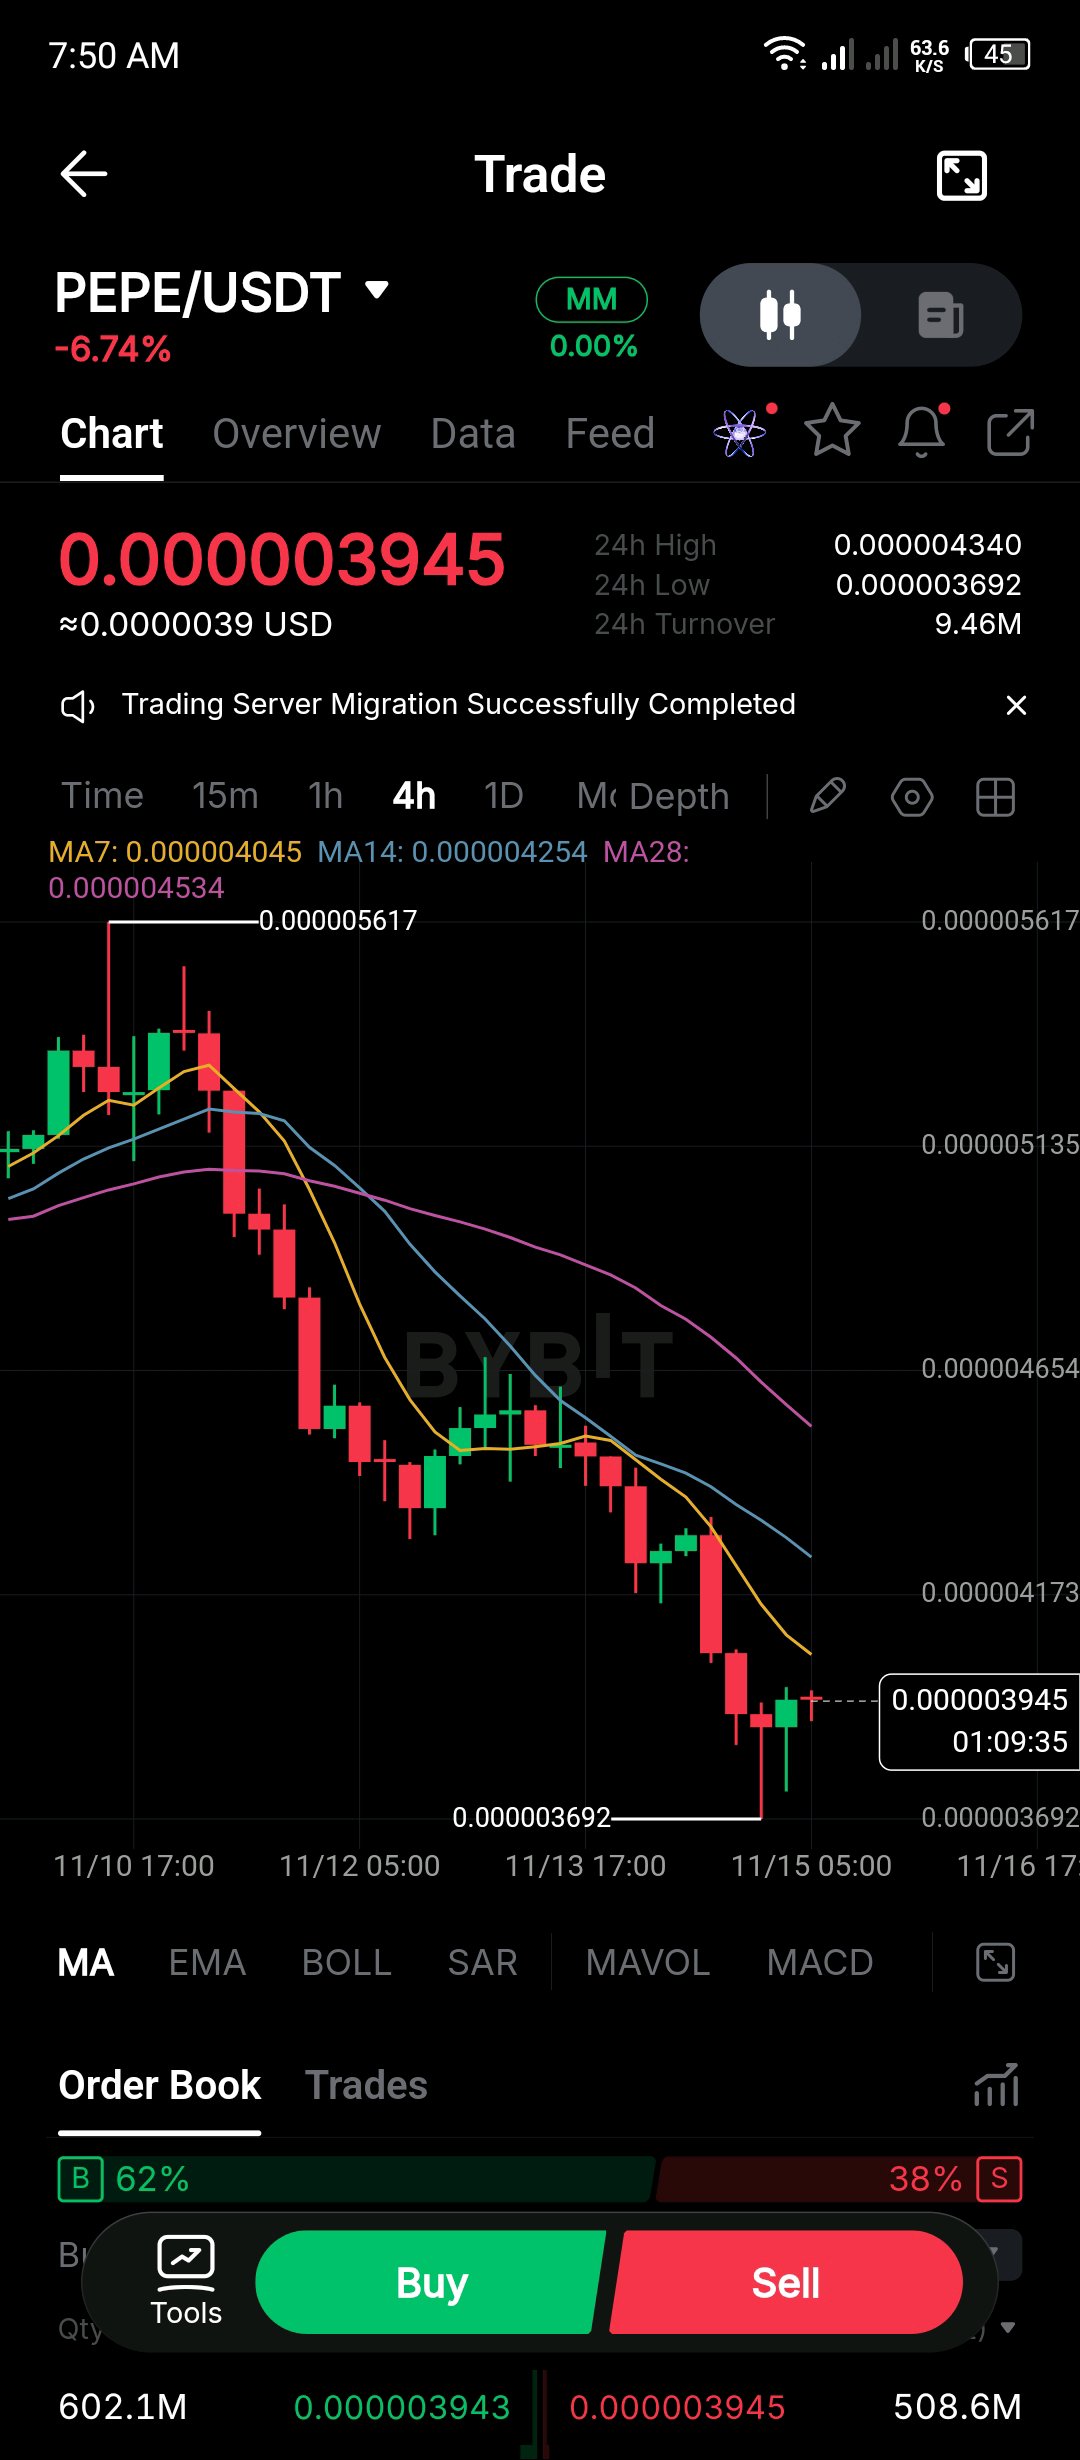
$PEPEUSDT 技術分析 **時間週期:4H** 當前價格:**0.000003945** 24小時漲跌幅:**-6.74%** # 1. 市場趨勢 PEPE 目前處於**強勁的看跌趨勢**中。 從您的圖表中可見: - 價格正在形成更低的高點和更低的低點。 - MA7:0.000004045 - MA14:0.000004254 - MA28:0.000004534 價格低於這三條移動平均線,顯示賣方仍掌控市場。 # 2. 支撐位 請關注這些重要價位: - **S1:** 0.000003900 - **S2:** 0.000003692(主要支撐位) - 若跌破 0.000003692,可能會引發進一步的下跌行情。 # 3. 阻力位 - **R1:** 0.000004045 - **R2:** 0.000004254 - **R3:** 0.000004534 PEPE 需要突破這些阻力位,才能顯示出復甦跡象。 ## 4. 買入還是賣出? **賣出情境 🔴** 如果價格跌破 0.000003692 並伴隨強勁的 4 小時 K 線收盤,可能會進一步下探。 **買入情境 🟢** 如果價格能守住 0.000003692 並突破 0.000004045,可能會出現短期復甦。 ## 5. 訂單簿 - 買方:62% - 賣方:38% 目前的訂單簿顯示買方佔比較高,但僅憑這一點並不能確認看漲反轉。 ## 我的交易觀點 🔴 **看跌 — 等待確認。** 在價格仍低於移動平均線的情況下,我建議避免倉促建立買入倉位。 **我的建議:** 密切關注 0.000003692。這是您圖表上最重要的支撐位。 每日監控 PEPE/USDT 支撐位與阻力位 點擊以設置 #IMPACTbyTrade
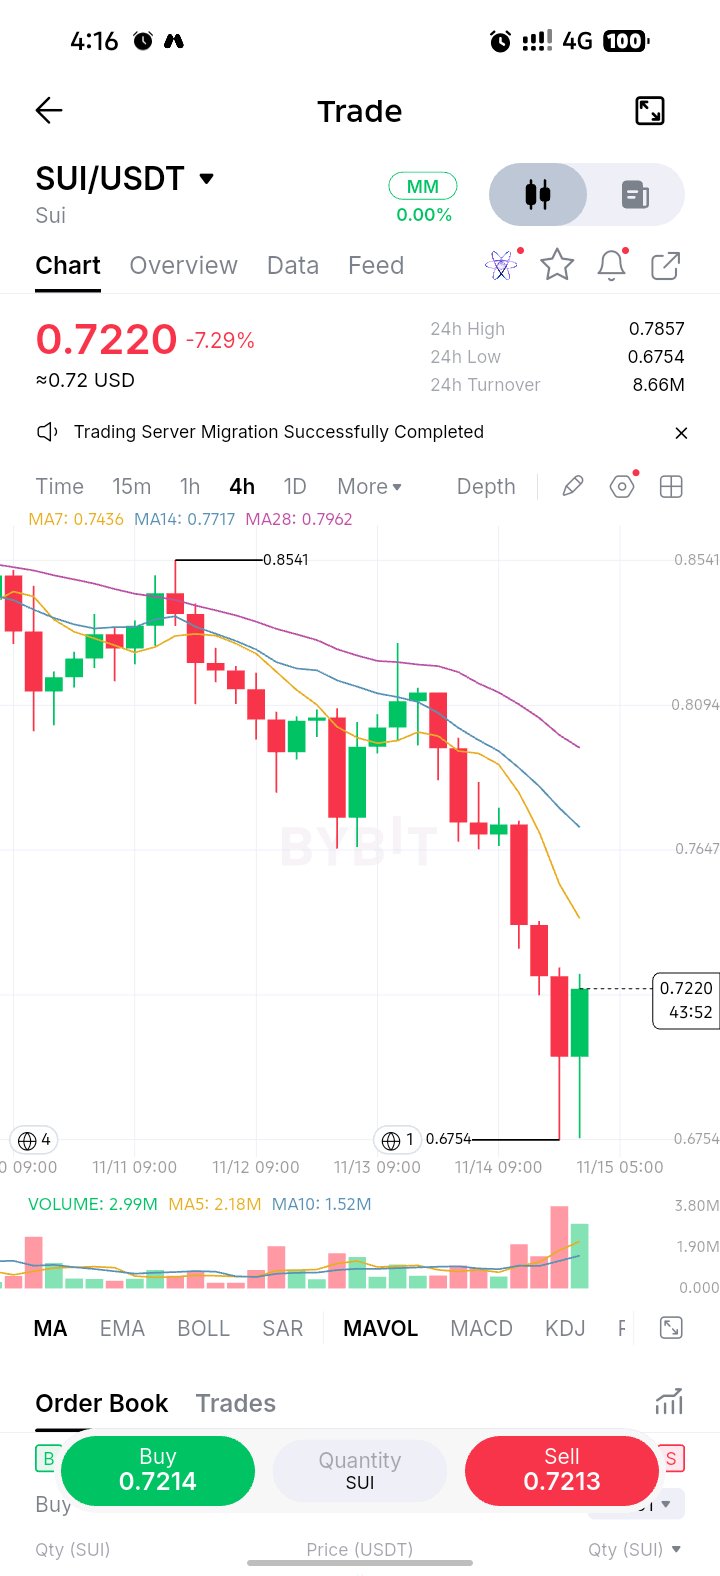
$SUIUSDT – 4H 技術分析 市場趨勢:看跌 📉 SUI 目前交易價格約為 $0.7220,下跌約 7.29%。4 小時圖顯示出強勁的賣壓,市場持續形成更低的高點和更低的低點。 1. 市場結構 整體結構維持看跌。賣方持續掌控市場,且價格低於所有三條移動平均線: MA7:0.7436 MA14:0.7717 MA28:0.7962 這表明看跌動能依然強勁。 2. 支撐位 $0.6754 – 主要支撐位。 若跌破此水平,可能會引發進一步下跌。 3. 阻力位 $0.7436 – 第一阻力位。 $0.7647 – 第二阻力位。 $0.7717 – 更強阻力位。 4. 可能的市場走向 看跌情境 📉 若賣方持續控制盤面且價格跌破 $0.6754,SUI 可能會經歷另一波下跌。 看漲情境 📈 最新的綠色蠟燭圖顯示可能從支撐位反彈。然而,買方需要將價格推升至 $0.7436 以上並維持該走勢,才能暗示出現更強勁的反轉。 SUI 在 4H 時間框架上維持看跌。雖然可能會出現暫時的反彈,但目前還不足以確認多頭反轉。 進場交易前請等待確認。請務必謹慎管理風險。 --- 我的建議:目前維持「做空」偏向,但不要盲目進場。等待確認信號。 #IMPACTbyTrade
GRAMUSDT
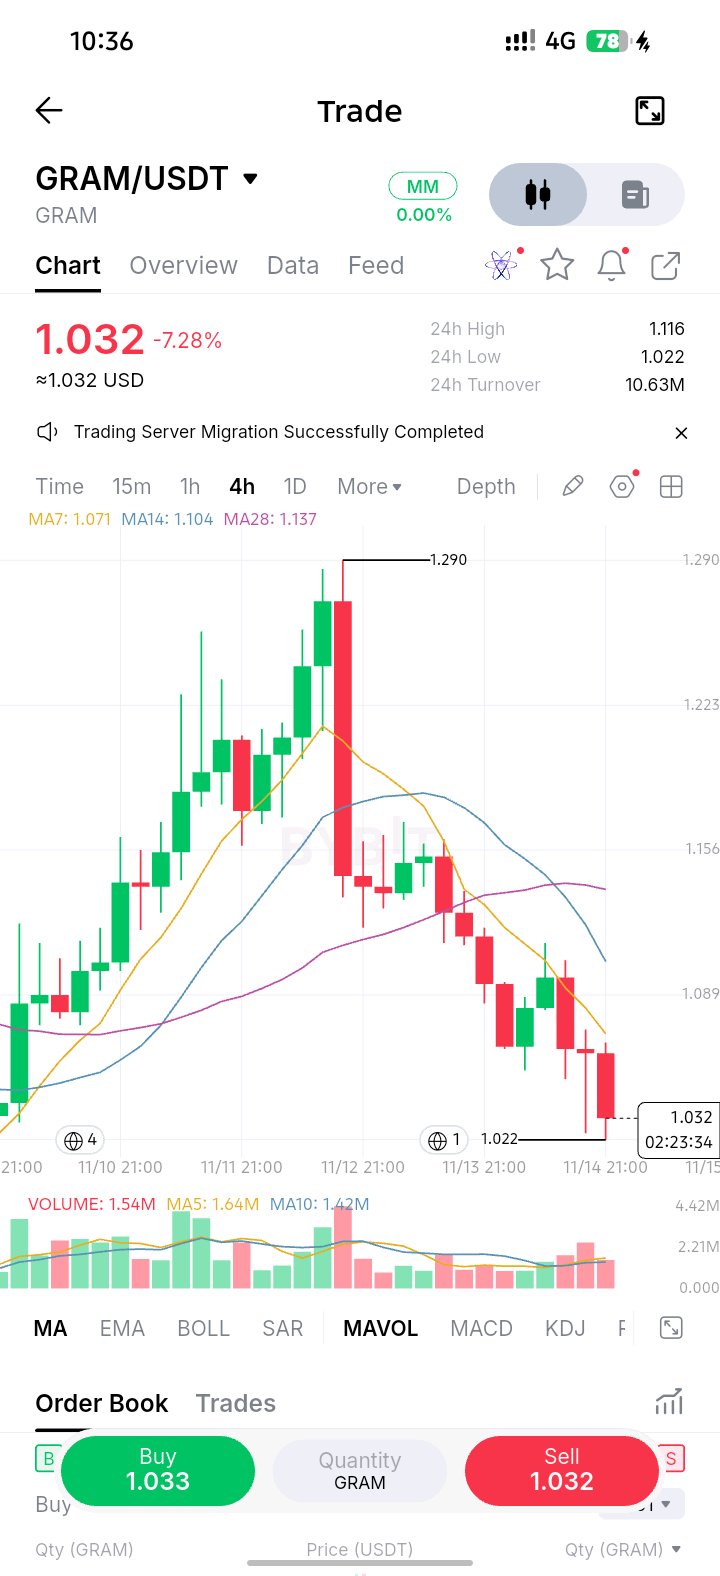
$GRAMUSDT – 市場正接近一個關鍵的決策區,我更傾向於觀察買賣雙方的反應,而不是假設當前價格就是底部。 4 小時圖顯示,在從接近 $1.290 的前高顯著下跌後,GRAM 目前在 $1.032 附近交易。引人注目的是自那次回調以來,市場持續形成的看跌結構。市場不斷形成更低的高點和更低的低點,這表明賣方仍掌控著更廣泛的短期趨勢方向。 一個重要的細節是,GRAM 目前正處於其主要移動平均線下方交易。MA7 約在 $1.071,MA14 約在 $1.104,而 MA28 約在 $1.137。這種排列告訴我,市場尚未展現出足夠的實力來確認有意義的趨勢反轉。 然而,當前價格正接近 $1.022 附近的一個重要支撐區。我認為這將是下一個重大決策可能發展的地方。 我並沒有將 $1.022 視為絕對的底部。相反,我想觀察買方是否能守住這一水平,並開始建立更強勁的復甦結構。若能成功防守,可能會創造一個讓 GRAM 回升至 $1.070 甚至 $1.104 的機會。 第一個有意義的看漲跡象將是強勁反彈至 $1.070 上方,隨後持續突破 $1.104。這將表明買方正在逐漸奪回控制權。 另一方面,如果 GRAM 在強大的賣壓下失守 $1.022 支撐,市場可能會將跌勢延伸至 $1.000 的心理關口,甚至可能下探至 $0.950。 目前,我的重點在於市場行為、成交量和確認訊號。我不希望將暫時的反彈與真正的反轉混為一談。 我的總體看法:GRAM 在 4 小時時間框架內仍保持看跌,但 $1.022 支撐區值得密切關注。下一個確認的走勢可能會為市場方向提供更清晰的指引。 市場不需要我的預測。它需要透過價格行為來展現其方向。 #IMPACTbyTrade
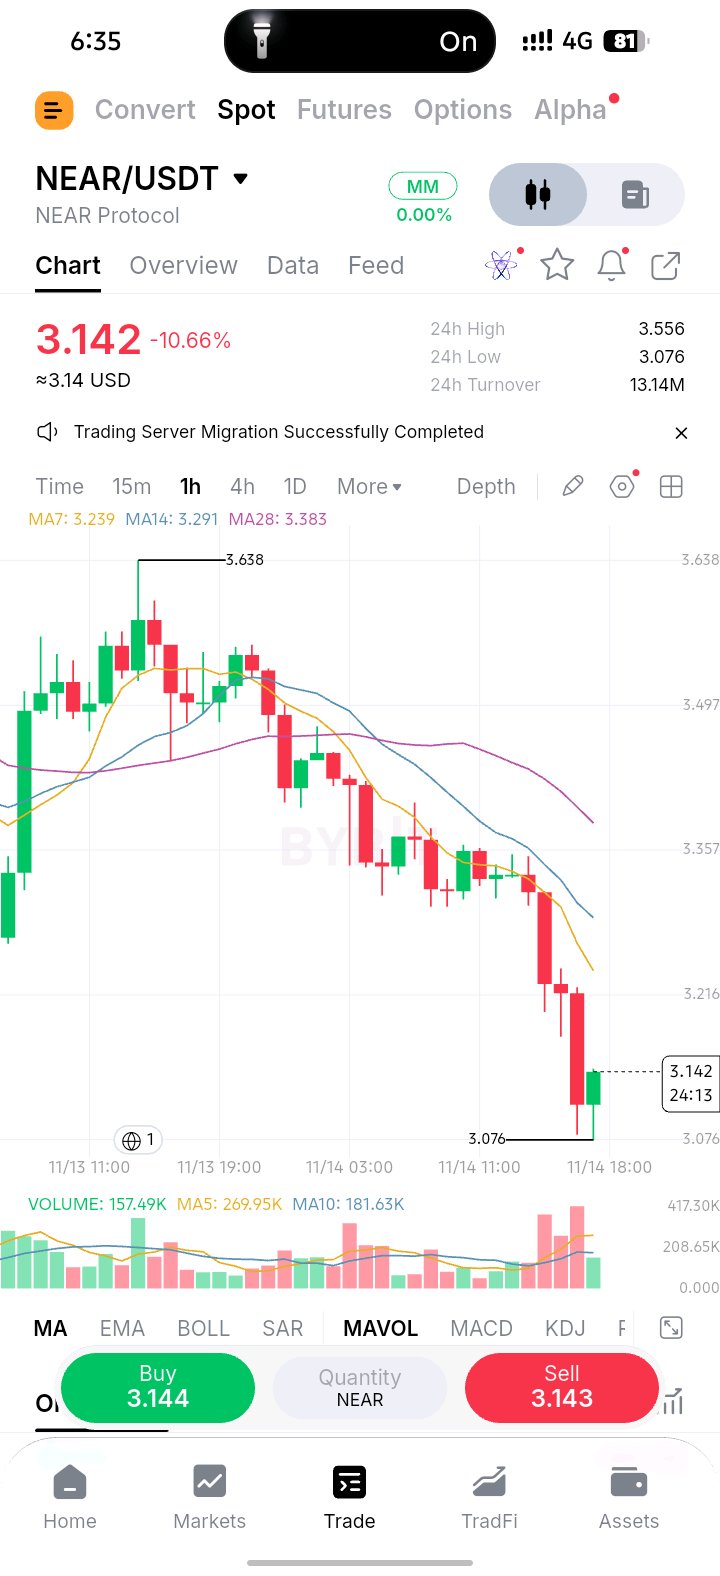
$NEARUSDT – I am not looking at NEAR simply because the price has dropped more than 10%. I am interested in understanding whether the current selling pressure is reaching an important decision zone or whether sellers still have enough strength to push the market lower. The 1-hour chart shows NEAR trading around $3.142 after an extended bearish movement. What stands out to me is the structure behind this decline. The market has continued producing lower highs and lower lows, showing that sellers have maintained control over the short-term direction. Another important observation is the position of the moving averages. MA7 is around $3.239, MA14 around $3.291, and MA28 around $3.383. Price is currently trading below all three averages, which tells me that the overall short-term momentum remains weak. However, I am paying particular attention to the $3.076 area. This is the recent low visible on my chart, and it represents an important support zone where buyers have started showing some reaction. My approach here is based on confirmation, not prediction. I am not assuming that NEAR has already reached its bottom simply because it has experienced a significant decline. I want to see whether buyers can defend the $3.076 region and gradually establish stronger price action. For a meaningful bullish recovery, the first important level I want to see reclaimed is around $3.200, followed by the MA7 region near $3.239. A sustained move above these levels would be an early indication that buying pressure may be returning. On the other hand, if NEAR fails to hold the $3.076 support and breaks below it with strong selling volume, the market could open the door to another downward move, with the psychological $3.00 region becoming an important area to watch. My current position is cautious and bearish. I would rather wait for the market to demonstrate a clear change in behaviour than enter a position simply because the price appears oversold. For now, sellers remain in control, but the reaction around $3.076 could provide important information about what comes next. The next major decision for NEAR will be whether buyers can build a sustainable recovery or whether sellers will continue extending the current downtrend. The key is not guessing the bottom. It is waiting for the market to confirm its next direction. #IMPACTbyTrade
BTCUSDT
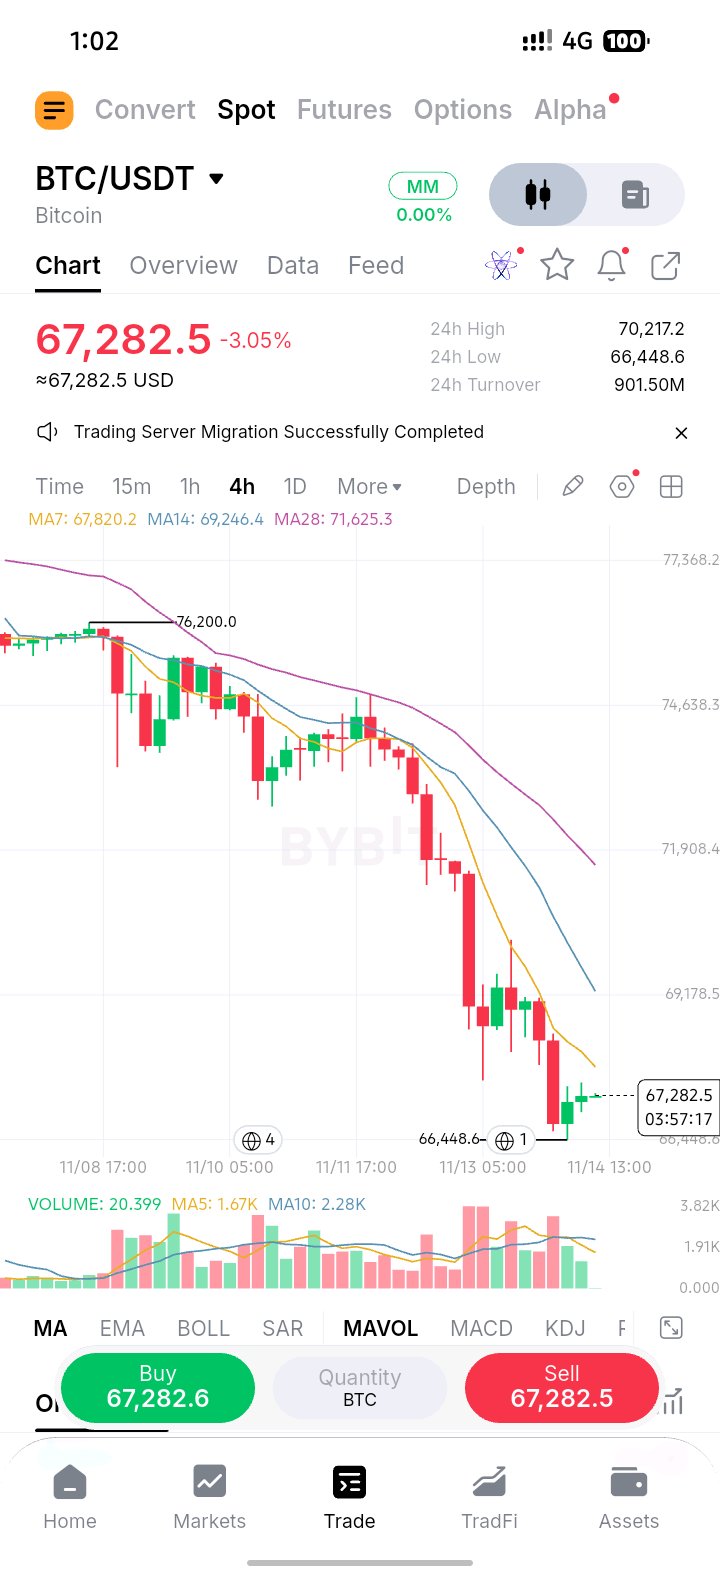
$BTCUSDT – 我關注比特幣並非僅僅因為價格大幅下跌。我感興趣的是,BTC 已回到一個重要的支撐區域,而下一個重大的市場決策可能正由此開始發展。 4 小時圖顯示,在經歷了一波長時間的看跌行情後,比特幣目前的交易價格約在 67,282 美元左右。值得注意的是,賣壓非常強勁,將價格從 76,200 美元區域推向了 66,448 美元附近的當前支撐區。 市場結構仍然疲軟。比特幣持續形成更低的高點和更低的低點,這說明賣方仍控制著短期的大方向。移動平均線也支持這一觀察:MA7 約在 67,820 美元,MA14 約在 69,246 美元,MA28 約在 71,625 美元。價格目前正處於這三條均線下方。 然而,我正在密切關注 66,448 美元附近的反應。這個水平很重要,因為買方最近已表現出保衛該區域的意願。最新 K 線上可見的小幅回升表明賣壓可能暫時放緩,但我認為這還不足以確認會出現看漲反轉。 我現在的焦點在於市場行為,而不是試圖預測確切的底部。 如果比特幣能夠守住 66,448 美元的支撐位,並逐漸建立更強的買盤動能,我會首先關注 67,820 美元區域。若能成功收復該水平,可能會打開通往 69,246 美元的大門,屆時可能會出現更強的阻力。 另一方面,如果 BTC 在強勁的看跌 K 線和成交量增加的情況下失守 66,448 美元支撐位,市場可能會進一步下探至 66,000 美元和 65,000 美元區域。 對我來說,最重要的訊號將是市場結構的改變。我希望看到比特幣停止產生疲軟的反彈,建立一個更高的低點,並最終收復重要的阻力位。 在那之前,我仍會將目前的走勢視為大趨勢下跌中的潛在緩解性反彈,而不是預設市場已經觸底。 我目前的觀點:比特幣在 4 小時級別上仍偏向看跌,但 66,448 美元的支撐位值得密切關注。圍繞此水平的下一個確切走勢,可能會更明確地指示買方是否正在準備反彈,或是賣方是否正準備發起下一波下跌。 我相信耐心比急於建立倉位更重要。市場最終會透過價格行為和成交量揭示其方向。 $BTCUSDC #IMPACTbyTrade
XRPUSDT
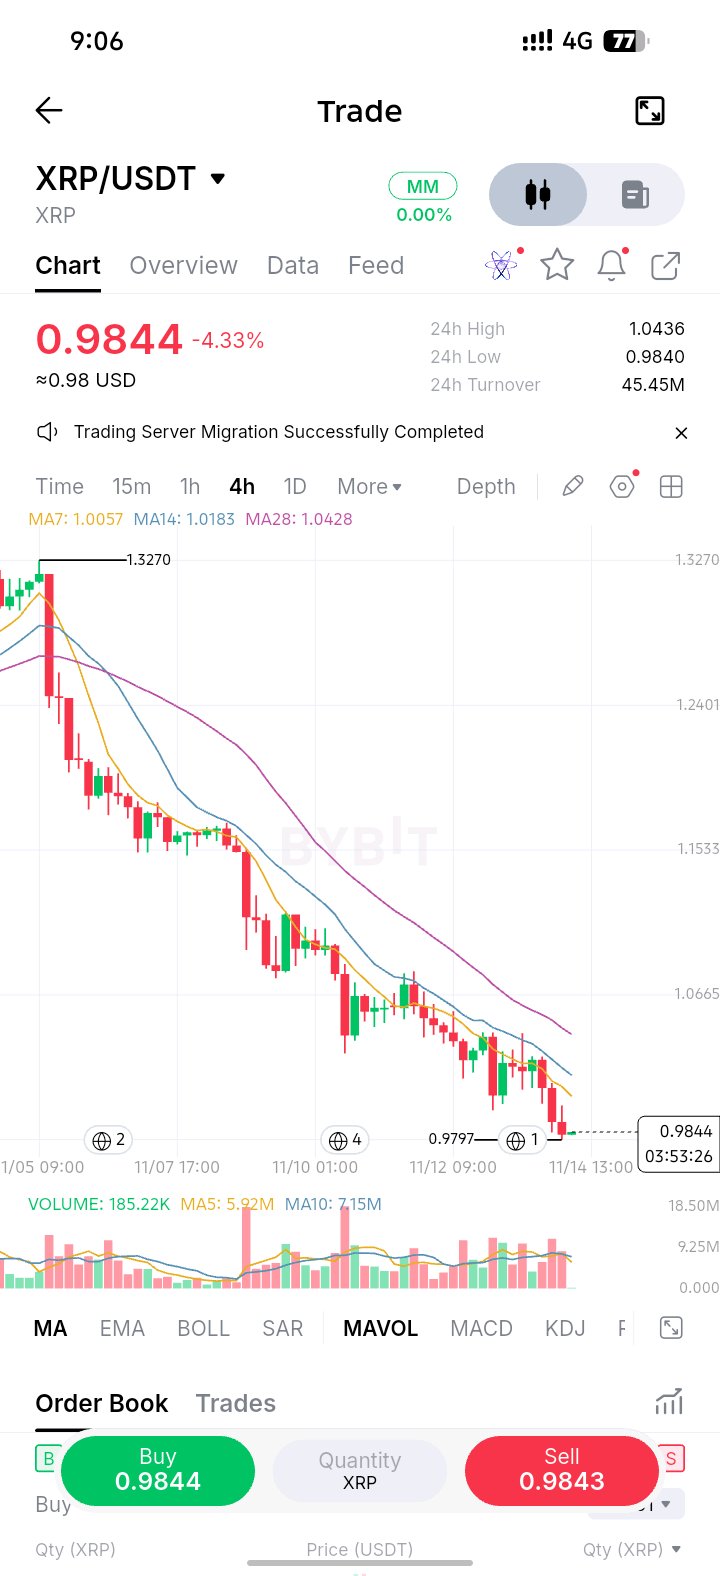
$XRPUSDT – The market is approaching an important decision zone, and I believe the next reaction around support could reveal where XRP is heading next. The 4-hour chart shows XRP trading around $0.9844, down approximately 4.33%. What interests me most is not simply the recent decline, but the consistency of the selling pressure and the way price continues to form lower highs and lower lows. XRP has experienced a prolonged bearish movement from the $1.32 region. Throughout this decline, buyers have made several attempts to recover, but those recovery attempts have struggled to establish a sustainable upward structure. This tells me that the market has not yet demonstrated convincing evidence of a trend reversal. The Moving Average Structure One important detail on the chart is the position of the moving averages. MA7 is currently around $1.0057, MA14 is around $1.0183, and MA28 is around $1.0428. Price is trading below all three moving averages, while the averages themselves remain positioned in a bearish structure. This suggests that sellers continue to control the broader 4-hour trend. Any short-term recovery should therefore be treated carefully until XRP begins reclaiming these important levels. The Support Zone That Matters The immediate area I am watching is around $0.9797. This level represents an important short-term support area because price is currently trading very close to it. If buyers manage to defend this region, XRP could attempt a relief recovery toward $1.0057, followed by the $1.0183 area. However, I would not automatically interpret a bounce from support as a confirmed bullish reversal. I want to see stronger buying pressure, improved candle structure, and the ability to hold higher levels. What Happens If Support Breaks? The bearish scenario becomes more important if XRP loses the $0.9797 support with a strong 4-hour candle close below it. Such a breakdown could expose lower price regions, with $0.9500 becoming an area worth monitoring. If selling pressure continues beyond that region, the market could experience another leg lower. For now, confirmation is more important than prediction. My Trading Perspective I am not interested in assuming that XRP has reached its bottom simply because the price has declined significantly. A falling market can remain bearish longer than many traders expect. What I want to observe is whether buyers can finally interrupt the sequence of lower highs and lower lows. A meaningful recovery above $1.0057 would be an early sign of improving momentum. Reclaiming $1.0183 would provide additional evidence that buyers are becoming more active. Until then, the bearish structure remains dominant. Final Market Outlook XRP is currently at an important technical area where the next reaction could influence its short-term direction. The $0.9797 support deserves close attention. A successful defence could create room for a recovery, while a confirmed breakdown could increase downside pressure. My approach is to remain patient, monitor price behaviour, and wait for confirmation rather than trying to predict the exact bottom. Current Bias: BEARISH The market does not reward impatience. Sometimes the best trading decision is simply waiting for the right confirmation. #IMPACTbyTrade
BERAUSDT
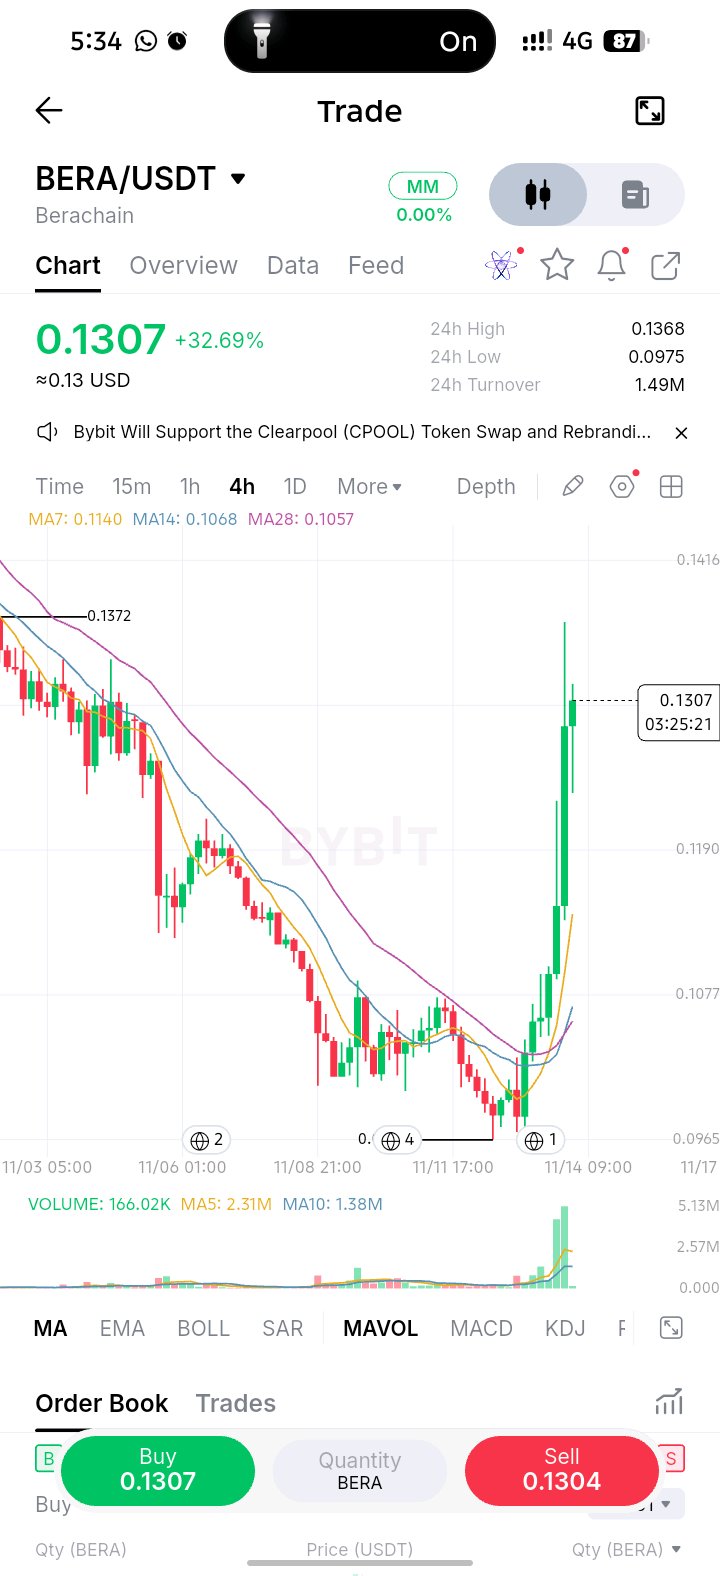
$BERAUSDT – I am not looking at BERA simply because it has gained more than 32% in a single day. What interests me is the change in market behaviour after an extended period of downward pressure. The important question now is whether this move represents the beginning of a larger recovery or simply a temporary bullish reaction. The 4-hour chart shows BERA trading around $0.1307 after recovering strongly from the $0.0975 area. What stands out is the sequence behind this movement: a prolonged decline, a period of consolidation near the lows, and then a powerful upward move accompanied by a noticeable increase in trading volume. This is an important development because the price has now moved above the MA7, MA14 and MA28. It suggests that buyers have gained short-term control of the market. However, I would not automatically interpret this as confirmation of a long-term trend reversal. The next important area is around $0.1368–$0.1372. This is where I want to see how the market behaves. A strong 4-hour candle close above this resistance, supported by sustained buying volume, would provide better evidence that the recovery has room to continue. My approach here is based on market behaviour rather than prediction. I am more interested in seeing whether BERA can maintain its recent gains and establish higher support levels instead of immediately chasing the current bullish candles. After such a sharp increase, a temporary pullback would not necessarily invalidate the recovery. In fact, a controlled correction followed by renewed buying pressure could provide a healthier structure. The first important support area is around $0.1190. If buyers successfully defend this level, the market may have an opportunity to challenge the recent high again. Below that, the $0.1077 region becomes another important area to watch. A deeper correction toward this zone would suggest that the market is losing some of its recent bullish momentum. On the upside, a confirmed breakout above $0.1372 could bring the $0.1450 region into focus, followed by $0.1550 if buying pressure remains strong. However, if BERA fails to hold above its recent breakout area and begins producing lower highs, I would become more cautious about the strength of this recovery. For now, BERA is showing encouraging bullish behaviour, but I am not treating one powerful upward move as proof that the entire market structure has changed. My key focus is simple: Can BERA hold higher levels, defend its new support zones, and successfully break through resistance? That is the behaviour I want to see before becoming more confident about the next major move. The market does not need to move upward every hour to remain bullish. Sometimes, the quality of the correction tells us more than the strength of the initial breakout. Key Levels to Watch: Support 1: $0.1190 Support 2: $0.1077 Major Support: $0.0975 Resistance 1: $0.1368–$0.1372 Resistance 2: $0.1450 Next Target: $0.1550 Overall Outlook: Bullish recovery, but breakout confirmation is still important. $BERAUSDT #ByXIMPACT
DOGEUSDT 技術分析師
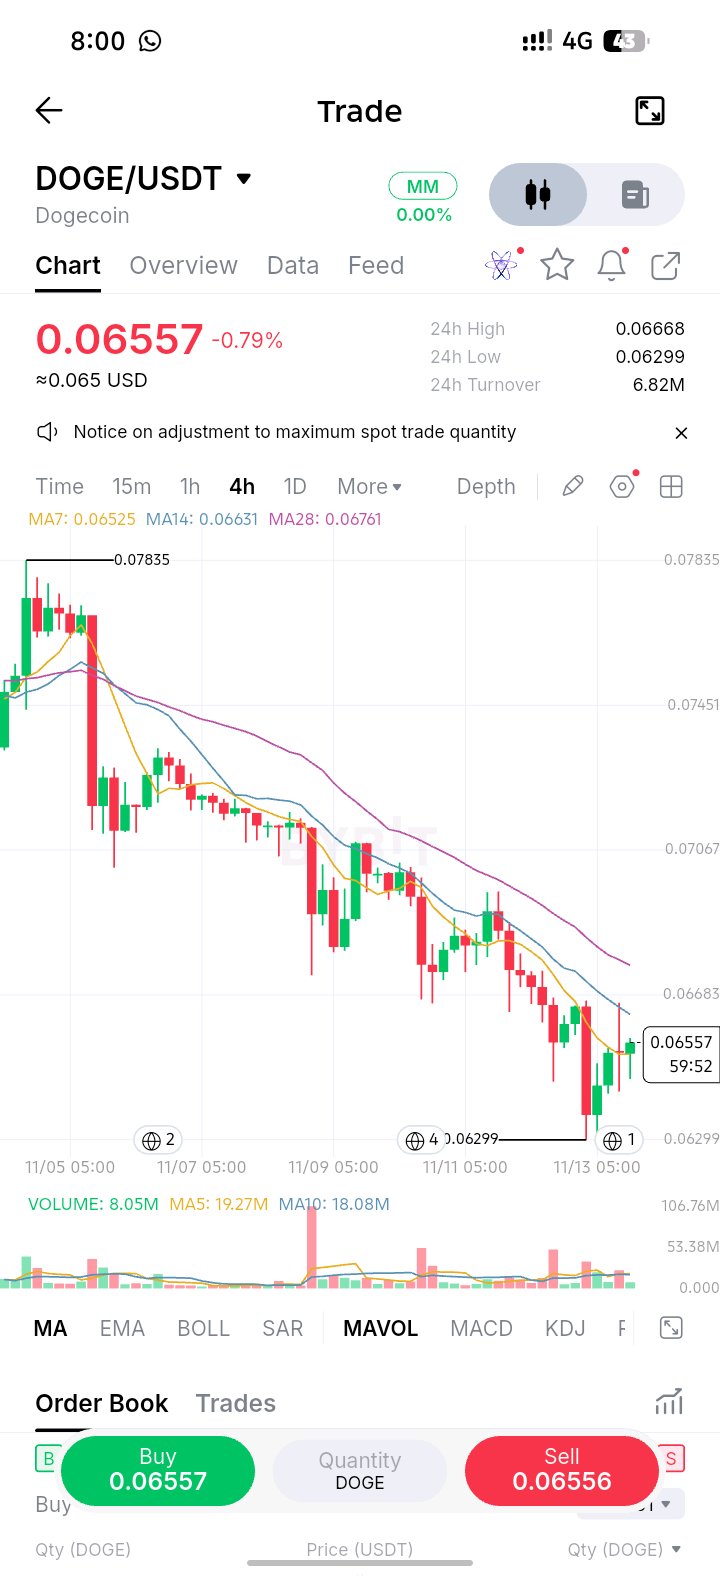
$DOGEUSDT — 需要確認的復甦嘗試 我在 DOGE 上觀察到的盤勢不單純只是近期下跌後出現的小綠K。最重要的是買方能否將這種反彈轉化為市場結構的真正轉變。 在 4 小時圖上,DOGE 一直處於明顯的看跌結構中,從約 $0.07835 一路下跌,近期低點觸及約 $0.06299。 這是一個相當顯著的跌幅,整體結構仍顯示賣方佔據優勢。 在截圖當下,DOGE 的交易價格約為 $0.06557。 這裡有一個有趣的發展。 價格已從 $0.06299 區域反彈,目前交易價格略高於 MA7(約 $0.06525)。然而,它仍低於 MA14(約 $0.06631)和 MA28(約 $0.06761)。 這告訴我,短期買方正在嘗試復甦,但更廣泛的 4 小時趨勢尚未確認看漲反轉。 那麼,接下來我會觀察什麼? 第一個重要的阻力區位於 $0.06630–$0.06680 附近。 如果買方能收復此區域並在其上方建立支撐,下一個我會關注的區域大約是 $0.06760。 若能強勢突破該水平,將改善看漲前景,並開啟向 $0.07000 復甦的可能性。 然而,這個盤勢還有另一面。 如果 DOGE 無法收復附近的阻力位,且賣壓回歸,那麼這次復甦可能會演變成另一個「更低的高點」(lower high)。 在這種情況下,$0.06400 將成為一個需要監測的重要區域,其次是近期低點 $0.06299 附近。 若明確跌破 $0.06299,將削弱復甦結構,並暗示賣方可能仍掌控局勢。 我目前的觀點: 我正在謹慎觀察 DOGE,而不是直接判斷為看漲反轉。 我首先希望看到的證據是成功收復 $0.06630,隨後出現更強的買盤成交量以及 4 小時時間框架上的「更高低點」(higher low)。 在那之前,再次下跌的可能性依然存在。 關鍵觀察水平: 即時支撐:$0.06400 主要支撐:$0.06299 第一阻力:$0.06630–$0.06680 第二阻力:$0.06760 主要復甦目標:$0.07000 最後的想法: DOGE 在經歷長期下跌後顯示出初步的復甦跡象,但反彈並不等同於趨勢反轉。 在對看漲方產生信心之前,我需要價格行為(price action)的確認。 耐心在這裡很重要。讓市場在做出決定前顯示出它的方向。 #DOGE #DOGEUSDT #技術分析 #加密貨幣交易 #Bybit #ByXIMPACT
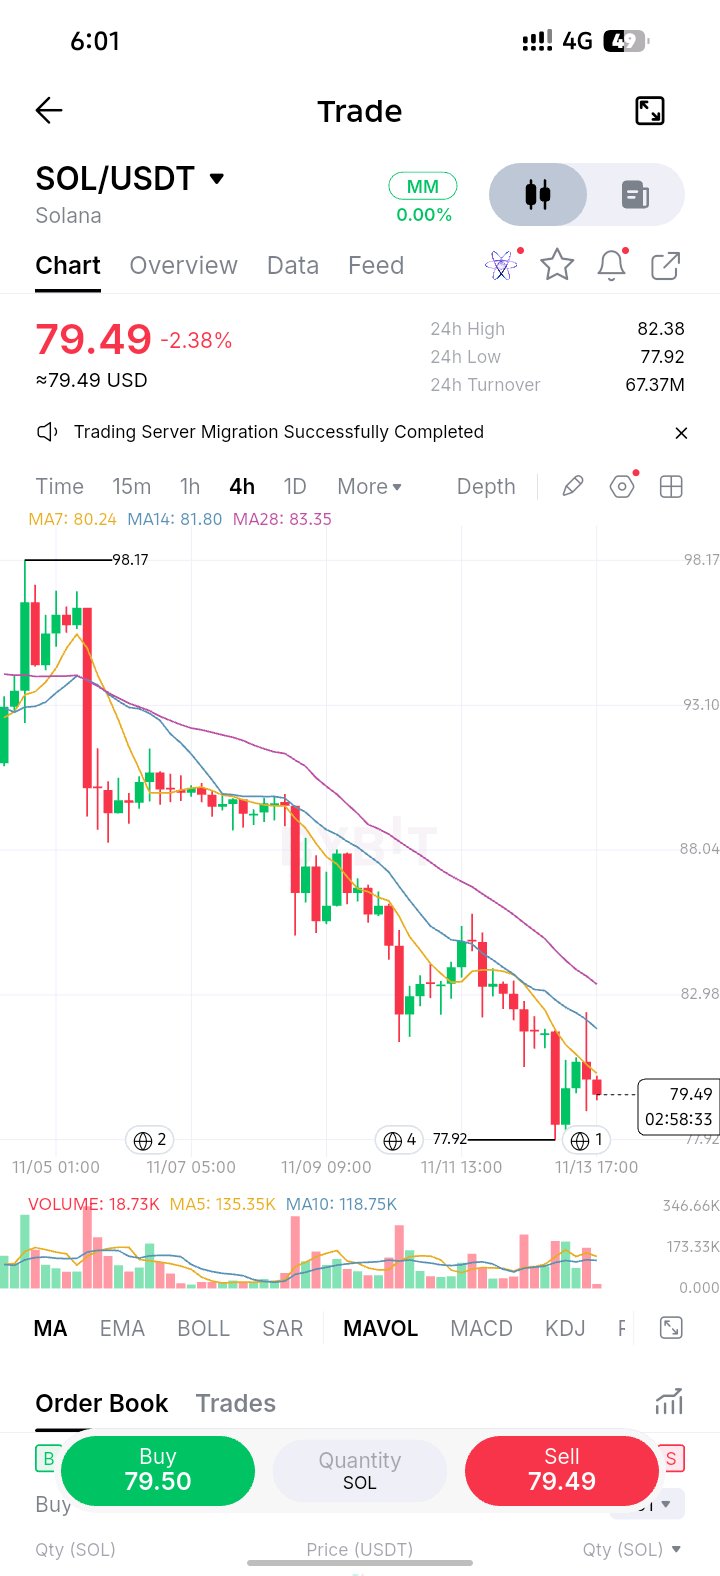
SOL USDT 技術分析師
$SOLUSDT 技術分析 時間週期:4 小時 (4H) 當前價格:$79.49 24小時漲跌幅:-2.38% 24小時最高:$82.38 24小時最低:$77.92 1. 市場趨勢 SOL 目前呈現強勁的「看跌趨勢」。 圖表顯示: 高點持續降低,低點也在降低。 賣方正在掌控市場。 價格交易在 MA7、MA14 和 MA28 之下。 移動平均線指向下方。 這表明看跌動能仍然佔據主導地位。 2. 移動平均線分析 MA7:$80.24 MA14:$81.80 MA28:$83.35 所有三條移動平均線均高於當前價格。 這意味著 SOL 若試圖上漲,可能會面臨阻力。 3. 重要支撐位 請關注以下點位: $77.92:主要的直接支撐位。 $77.00:潛在的下一個支撐位。 $75.00:進一步下跌目標。 如果 SOL 在強勁賣盤成交量的推動下跌破 $77.92,可能會進一步下跌。 4. 重要阻力位 $80.24:第一阻力位。 $81.80:第二阻力位。 $83.35:更強的阻力位。 若能成功突破 $81.80,可能預示著可能出現看漲反彈。 5. 可能的市場情境 看跌情境 如果 SOL 無法突破 $80.24 且賣壓增加,價格可能會重新測試 $77.92。 確認跌破後,可能會下探 $77.00 和 $75.00。 看漲情境 如果買方守住 $77.92 並將價格推升至 $80.24 以上,SOL 可能會嘗試觸及 $81.80。 若 4H K 線能強勢收在 $81.80 以上,將提供更好的看漲確認信號。 6. 市場最終預測 短期傾向:看跌 SOL 仍處於看跌壓力之下,儘管可能會出現暫時的反彈。 我關注的關鍵點位: 支撐位:$77.92 阻力位:$80.24 看漲確認:$81.80 看跌確認:跌破 $77.92。 避免僅憑價格方向進行交易。請等待 K 線確認和成交量配合。 --- BYBIT FEED 貼文 SOLANA (SOL) 技術分析 SOL 在 4 小時週期內正面臨看跌壓力。 價格目前在所有三條主要移動平均線下方交易,表明賣方仍掌控局勢。 關鍵支撐位於 $77.92,阻力位於 $80.24 和 $81.80 附近。 跌破支撐位可能會引發進一步的下跌,而若能強勢突破阻力位,則可能釋出反彈信號。 市場情緒:看跌 #SOL #Solana #加密貨幣分析 #技術分析 #BYBIT $ByXIMPACT
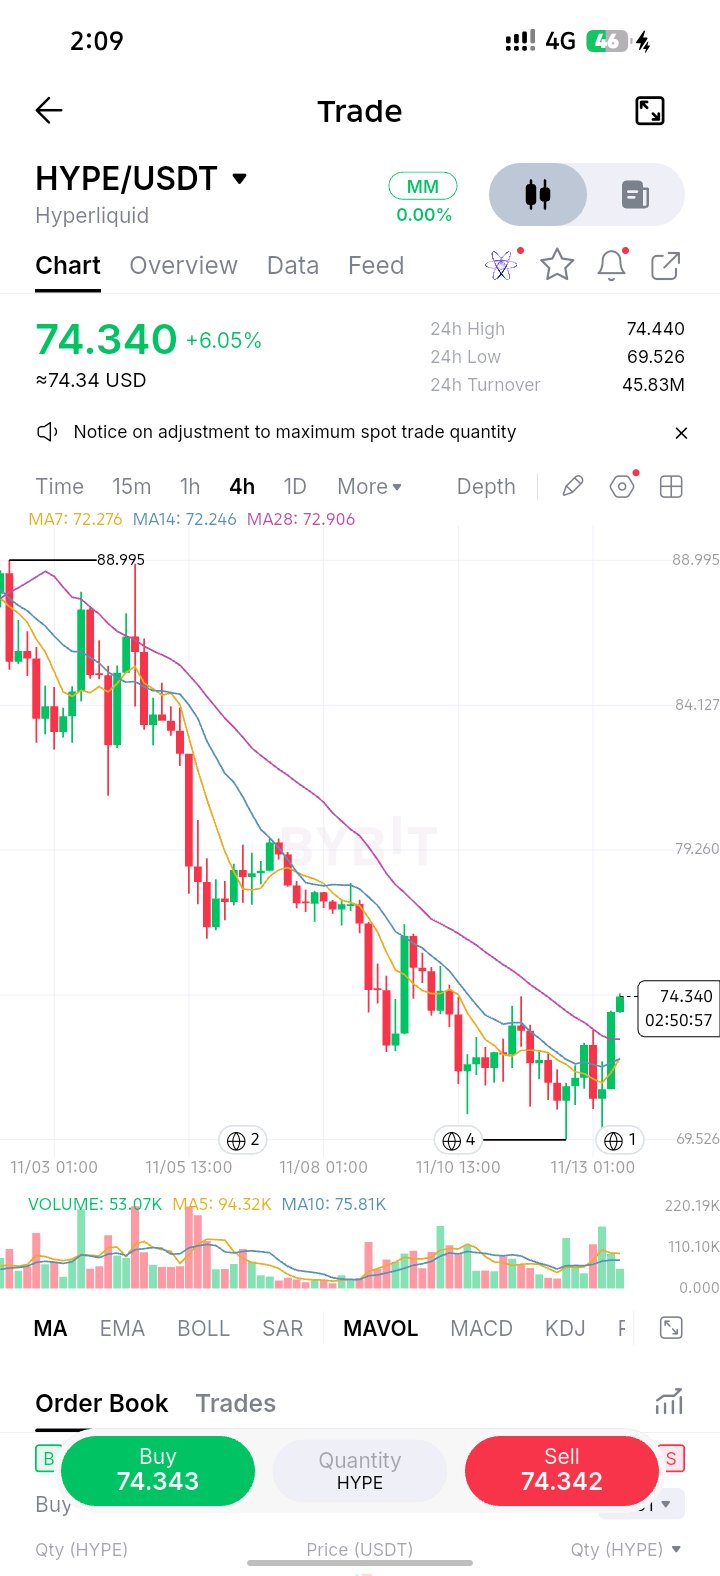
$HYPEUSDT 技術分析 **時間週期:4小時 (4H)** **當前價格:$74.340** **24小時漲跌幅:+6.05%** # 1. 市場趨勢 HYPE 在經歷了長期的看跌趨勢後,正顯示出看漲回升的跡象。 圖表顯示: - 買方正變得更加活躍。 - 出現了幾根陽線。 - 價格已突破 MA7、MA14 和 MA28。 - 短期動能正在轉為看漲。 然而,整體 4 小時趨勢尚未完全轉為看漲。 # 2. 移動平均線分析 - MA7:$72.276 - MA14:$72.246 - MA28:$72.906 價格目前位於所有三條移動平均線之上。這對買方來說是一個積極的訊號。 # 3. 重要支撐位 這些是需要關注的重要點位: - **$72.00:** 第一支撐位。 - **$70.50:** 第二支撐位。 - **$69.50:** 主要支撐位。 如果賣方將價格推低至 $72 以下,可能會隨後出現更深度的回調。 # 4. 阻力位 關注這些阻力區間: - **$74.44:** 即時阻力位。 - **$76.00:** 第二阻力位。 - **$79.00:** 主要阻力位。 強勁的 4 小時收盤價若能站穩在 $74.44 上方,可能會為進一步上漲打開空間。 # 5. 成交量分析 當前成交量約為 53.07K。 成交量低於其 MA5 和 MA10 平均值。這意味著買方需要更強的成交量來確認看漲走勢。 # 6. 看漲情境 如果 HYPE 在強勁的買盤支撐下突破 $74.44: - 目標 1:$76.00 - 目標 2:$77.50 - 目標 3:$79.00 # 7. 看跌情境 如果 HYPE 未能突破 $74.44 且賣方掌握控制權: - 目標 1:$72.00 - 目標 2:$70.50 - 目標 3:$69.50 # 8. 最終市場預測 **短期展望:看漲回升** HYPE 顯示出正向動能,但在 $74.44 上方的確認非常重要。 我建議避免追漲當前的陽線。等待突破並成功回測將提供更可靠的佈局機會。 --- 結論 HYPE/USDT 在經歷大幅下跌後正試圖進行看漲反轉。買方目前掌握短期動能,但市場必須突破阻力位才能確認進一步的上漲空間。 **需關注的關鍵點位:$74.44。** *此為技術分析,並非保證的價格預測或財務建議。* $ByXIMPACT
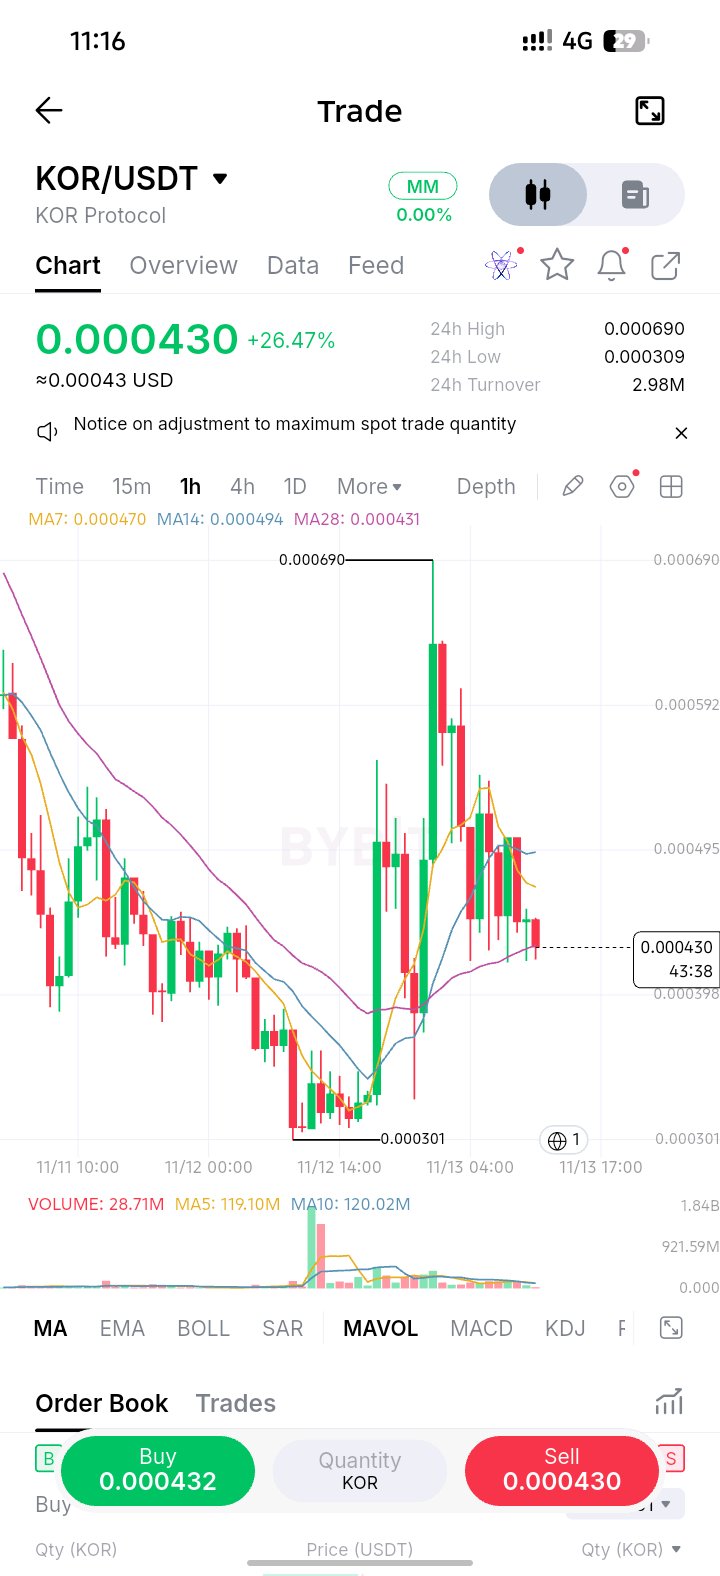
$KORUSDT – 技術分析 時間週期:1H(1 小時線) 當前價格:0.000430 USDT 24 小時漲跌幅:+26.47% 24 小時最高價:0.000690 USDT 24 小時最低價:0.000309 USDT 1. 市場概況 KOR/USDT 經歷了一波強勁的看漲行情,從約 0.000301 上漲至 0.000690 的高點。然而,在達到該頂部後,價格面臨強大的拋售壓力,隨即進入修正階段。 目前,KOR 在 0.000430 附近交易,在急劇上漲後顯現出盤整跡象。 2. 移動平均線分析 當前移動平均線數值: MA7:0.000470 MA14:0.000494 MA28:0.000431 價格目前低於 MA7 和 MA14,顯示短期內存在看跌壓力。 不過,價格正處於 MA28 附近,此處可能成為重要的支撐區域。 3. 重要支撐位 0.000410:即時支撐。 0.000398:重要支撐區。 0.000350:額外下行支撐。 0.000301:先前主要低點。 4. 重要阻力位 0.000470:第一阻力位。 0.000494:強阻力位。 0.000550:下一個看漲目標。 0.000592:主要阻力位。 0.000690:前高。 5. 市場預測 看漲情境 如果買方能夠守住 0.000410–0.000398 的支撐區,並將價格推升至 0.000470 以上,KOR 可能會嘗試挑戰 0.000494。 若能成功突破 0.000494,則可能打開進一步漲向 0.000550 甚至 0.000592 的空間。 看跌情境 如果賣方保持控制,且價格跌破 0.000398,可能會進一步下探至 0.000350。 若跌勢加劇,則可能再次測試先前 0.000301 的低點。 6. 成交量分析 在最初的看漲反彈期間,交易量顯著增加。然而,在隨後的修正過程中,成交量有所下降。 這顯示買盤動能已減弱。若能出現新的買量增加,將有助於確認下一波潛在的上漲行情。 7. 最終總結 在經歷顯著的看漲反彈後,KOR/USDT 目前呈現短期看跌壓力。 市場正接近 0.000410–0.000398 附近的重要支撐區。 我的觀點:短期內持中立至看跌態度。 若價格能回升至 0.000470 以上,將增強看漲前景;而若跌破 0.000398,則可能加劇拋售壓力。 交易策略:密切關注支撐區域,待信號確認後再考慮進場。避免追高價格波動。 此分析基於 1 小時線,僅供參考,不構成財務建議。 --- 建議 BYBIT 發文標題: KOR/USDT:看漲行情面臨修正 – 買方能否奪回主導權? #ByXIMPACT
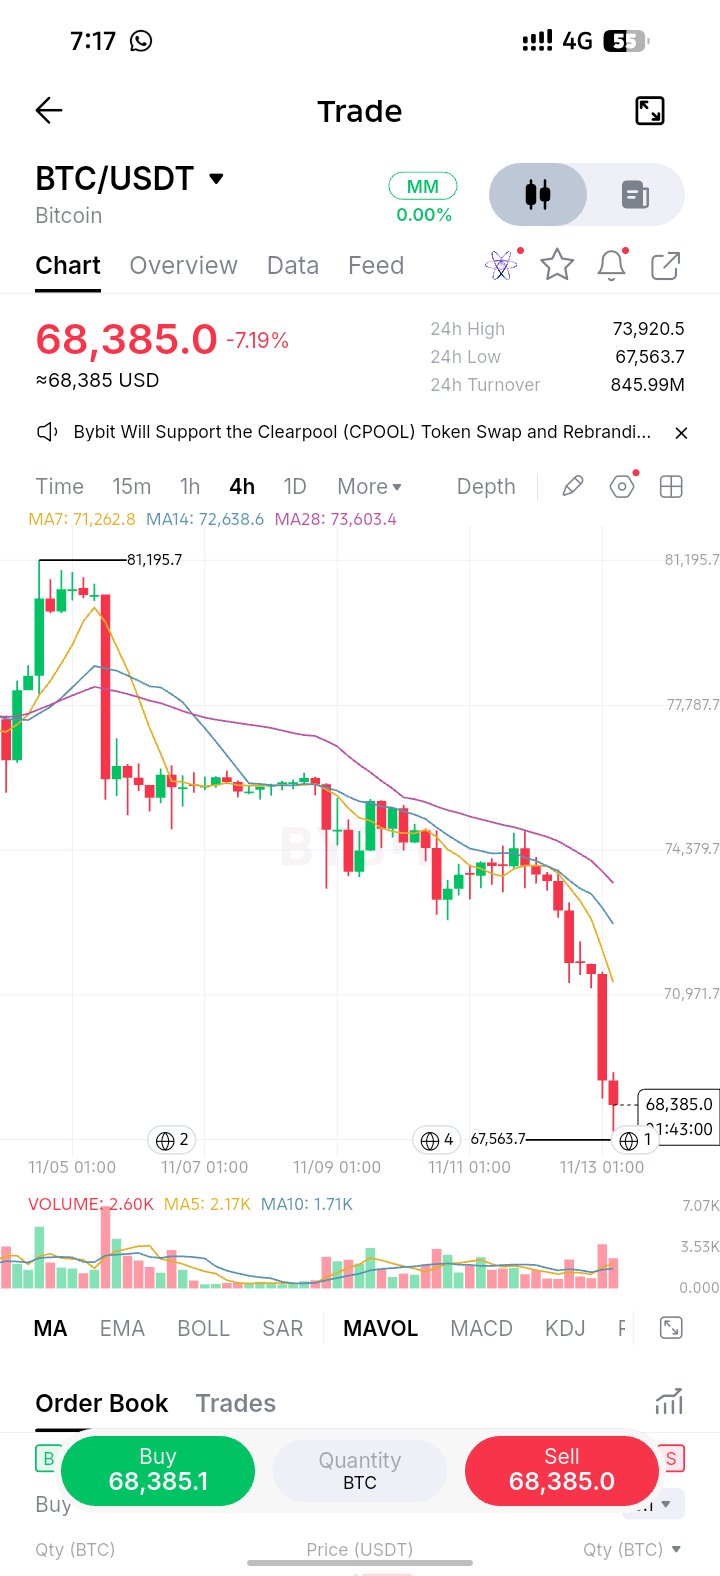
$BTCUSDT 技術分析 時間週期:4小時 當前價格:$68,385 24小時漲跌幅:-7.19% 市場概況 比特幣在4小時時間週期內表現出強勁的看跌動能。市場經歷了顯著的拋售壓力,導致價格從 $81,195 區域大幅下跌。 目前 BTC 的交易價格低於 MA7、MA14 和 MA28 移動平均線。這表明賣方維持著市場控制權,而買方難以重拾動能。 技術指標 移動平均線 (MA): - MA7: $71,262.8 - MA14: $72,638.6 - MA28: $73,603.4 這三條移動平均線均高於當前價格,證實了看跌的市場結構。 交易量分析: 近期的賣出K線顯示交易活動有所增加。這表明賣方參與度很高。然而,在預期下一次重大下跌之前,交易量的確認至關重要。 關鍵支撐位 - $67,563 – 即時支撐。 - $67,000 – 心理支撐。 - $66,000 – 下一個潛在支撐。 - $65,000 – 需要關注的主要下行區域。 關鍵阻力位 - $69,500 – 第一阻力位。 - $70,970 – 重要阻力位。 - $71,262 – MA7 阻力。 - $72,638 – MA14 阻力。 - $73,603 – MA28 阻力。 看跌情境 如果 BTC 在強勁的拋售交易量下跌破 $67,563 並確認突破,價格可能會向 $67,000 甚至 $66,000 移動。 看漲情境 如果買方成功守住 $67,563 的支撐區,並且 BTC 形成強勁的看漲反轉 K 線,我們可能會看到短期內反彈至 $69,500 和 $70,970。 交易策略 交易者應避免情緒化進場。請等待 K 線確認,監控交易量,並觀察 BTC 在關鍵支撐和阻力區域附近的反應。 市場最終展望 在 4 小時時間週期內,BTC/USDT 保持看跌。賣方目前佔據優勢,但如果在 $67,563 支撐位附近出現強勁反應,可能會改變短期市場方向。 請務必使用適當的風險管理,並在進行任何交易前設置止損。 💬 你怎麼看?BTC 會跌破 $67,563,還是買方會將價格推升回去? #比特幣在美國中期選舉後跌至兩個月低點 #ByXIMPACT
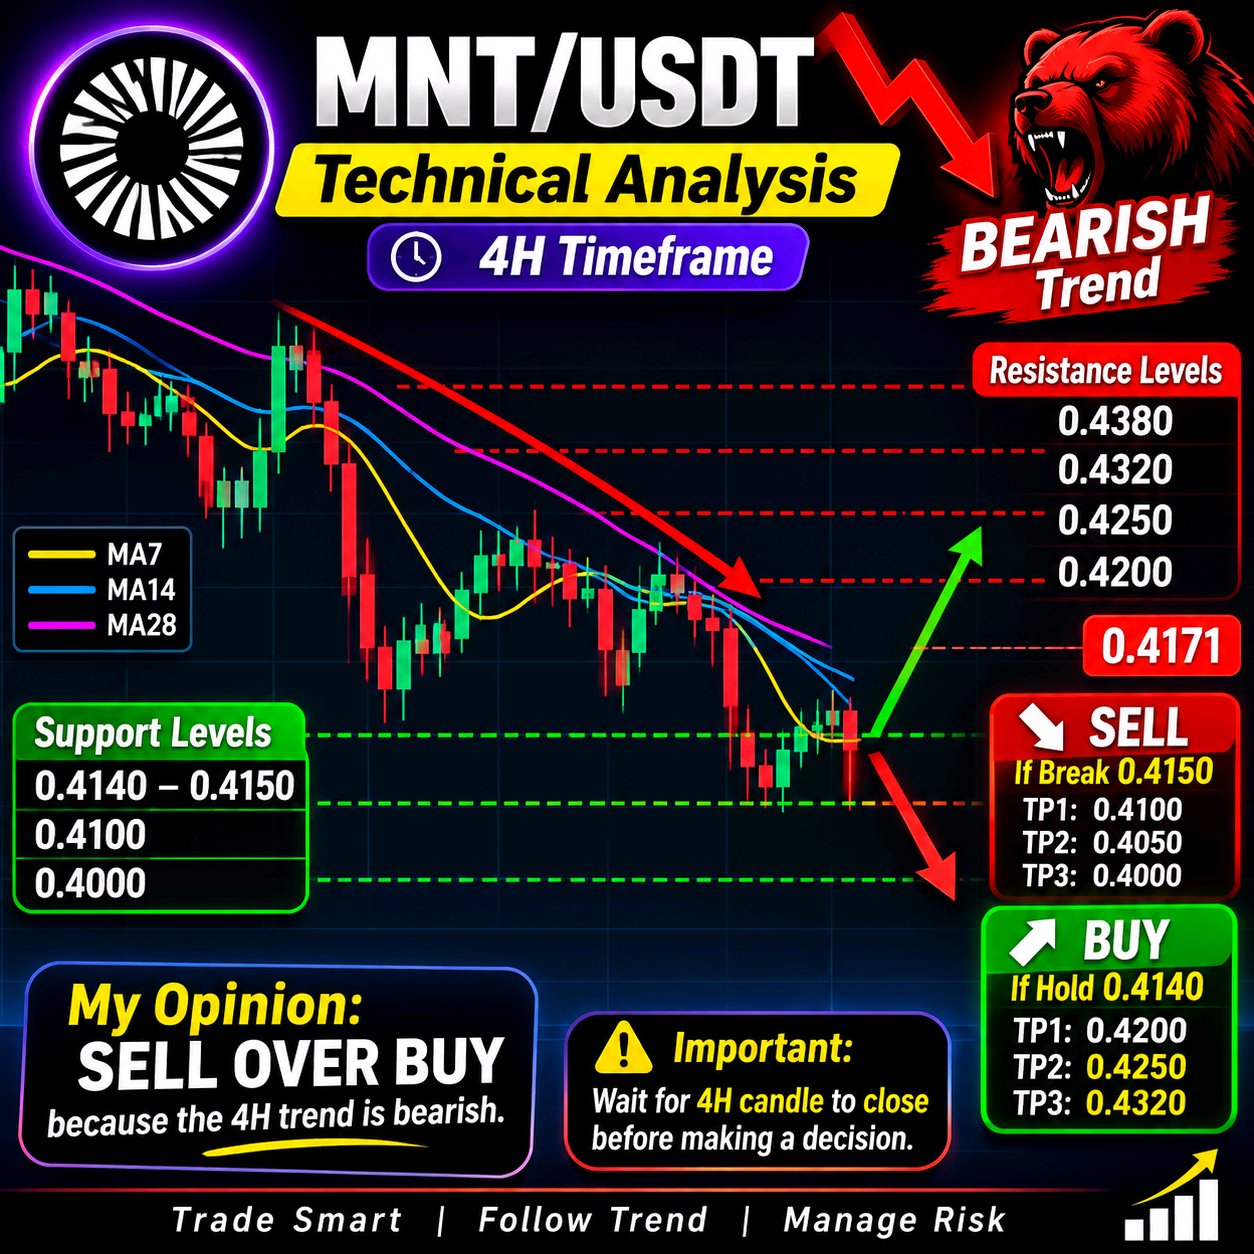
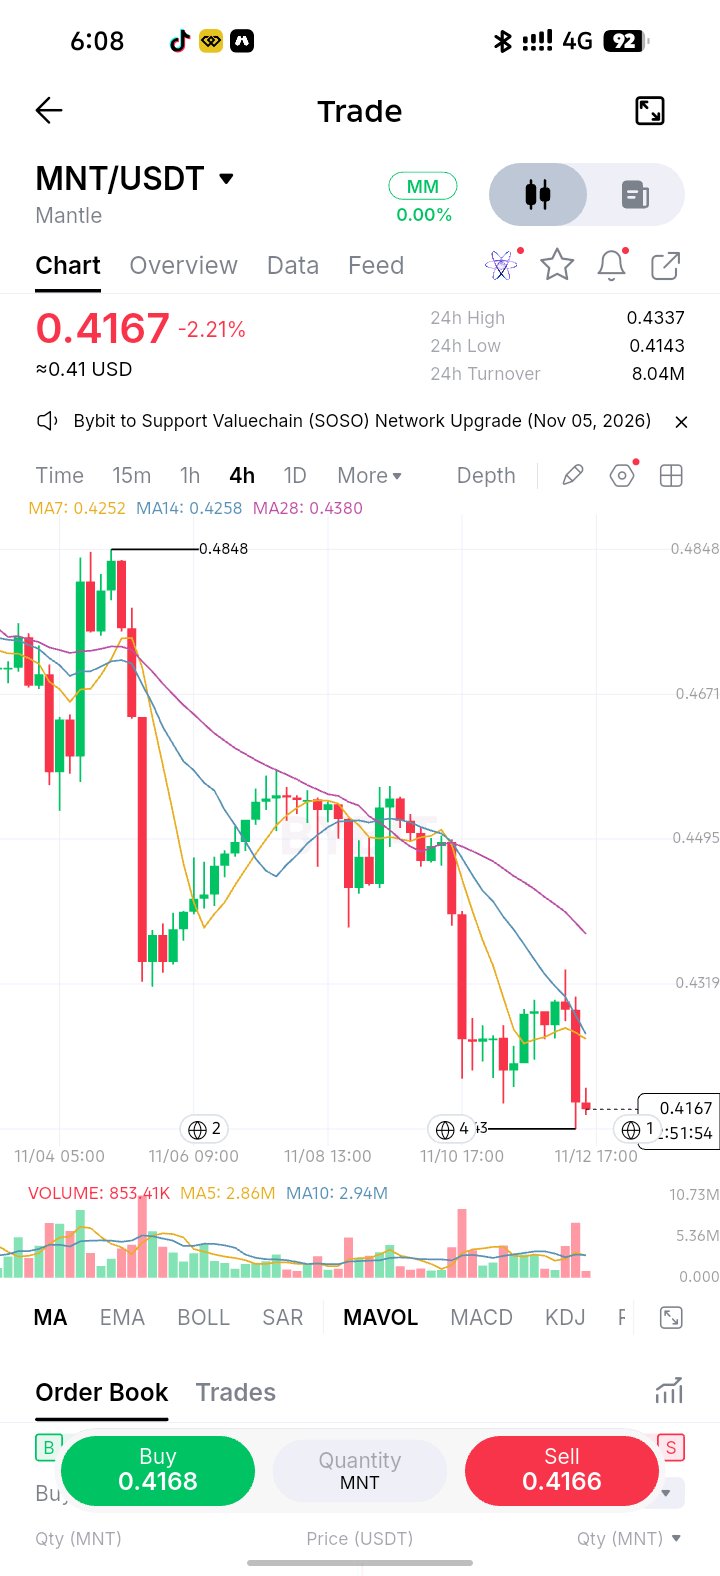
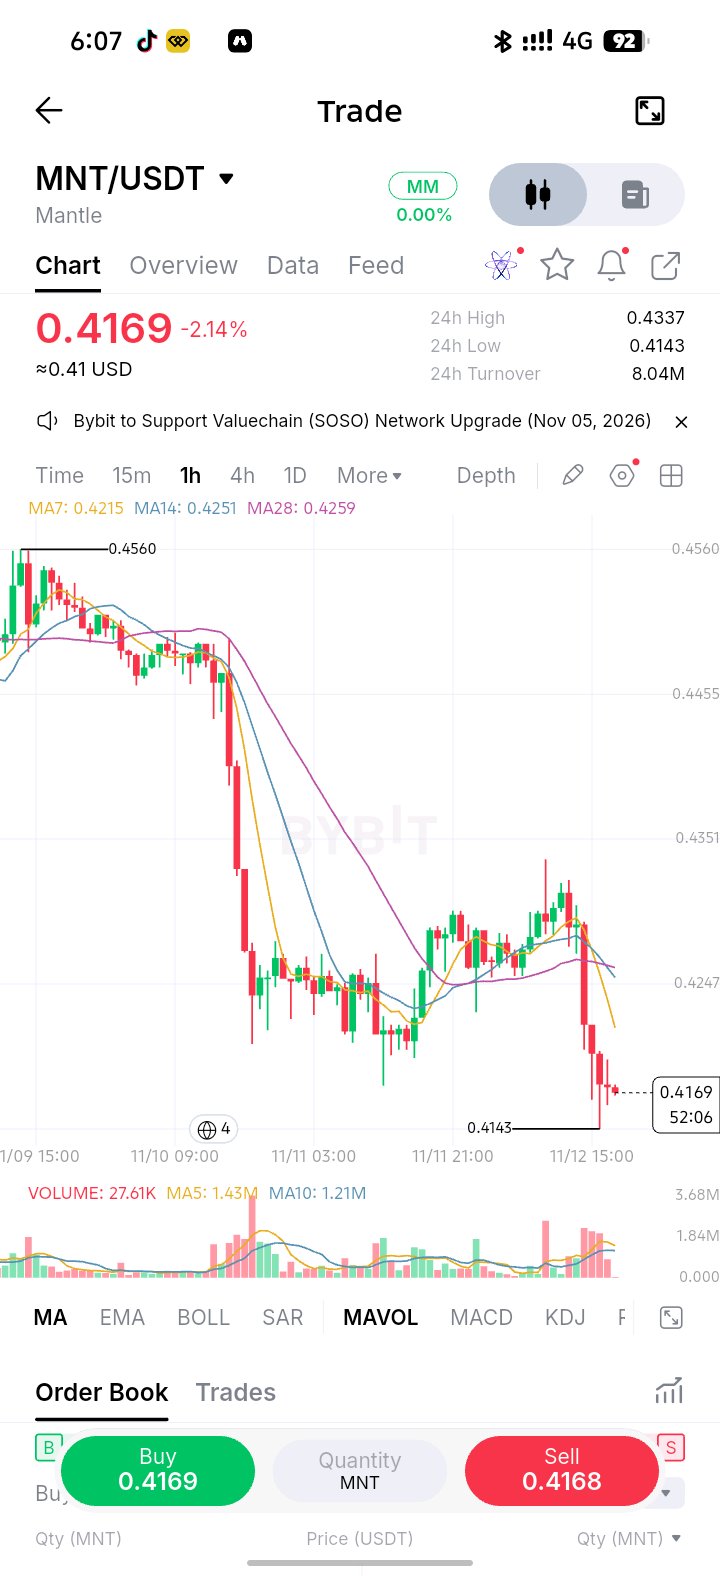
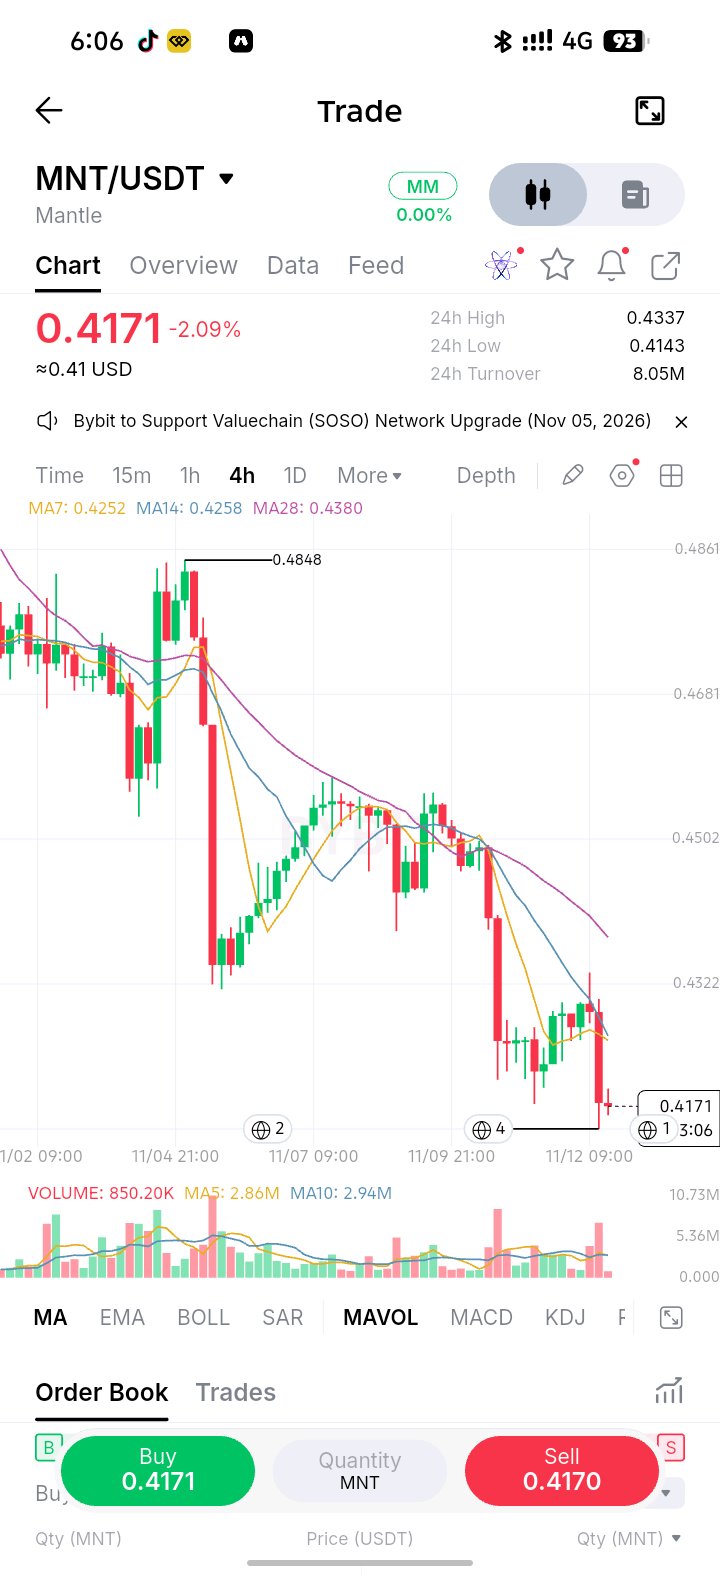
$MNTUSDT Technical Analysis Timeframe: 4H (4 Hours) Current Price: 0.4171 USDT 24H Change: -2.09% Market Trend: BEARISH 1. Market Structure MNT is currently in a strong downtrend. Price is making lower highs and lower lows. Sellers are controlling the market. The price is trading below MA7, MA14 and MA28. All three moving averages are pointing downward. This indicates bearish momentum. 2. Support Levels Watch these important levels: 0.4140 – 0.4150: Immediate support. 0.4100: Next possible support. 0.4000: Major psychological support. 3. Resistance Levels 0.4200: Immediate resistance. 0.4250: Stronger resistance. 0.4320: Major resistance. 0.4380: Additional resistance. 4. Trading Signals SELL Scenario If MNT breaks below 0.4140 with strong selling volume, the next possible targets are: TP1: 0.4100 TP2: 0.4050 TP3: 0.4000 BUY Scenario If MNT holds 0.4140 and produces a strong bullish reversal candle, watch for a recovery towards: TP1: 0.4200 TP2: 0.4250 TP3: 0.4320 5. My Professional Opinion BEARISH BIAS I currently favour SELL over BUY because the 4H trend is bearish. However, don't enter SELL without confirmation of a support breakdown. The price is already close to support. Important: Wait for the 4H candle to close before making a decision. --- Let me test your technical analysis knowledge. If MNT breaks below 0.4140, what do you expect? A. Market will go UP B. Market will go DOWN #ByXIMPACT @PERROUQ_LTC @Crypto BOSS @RoYoK @BlockchainMaster @RichardWyckoff
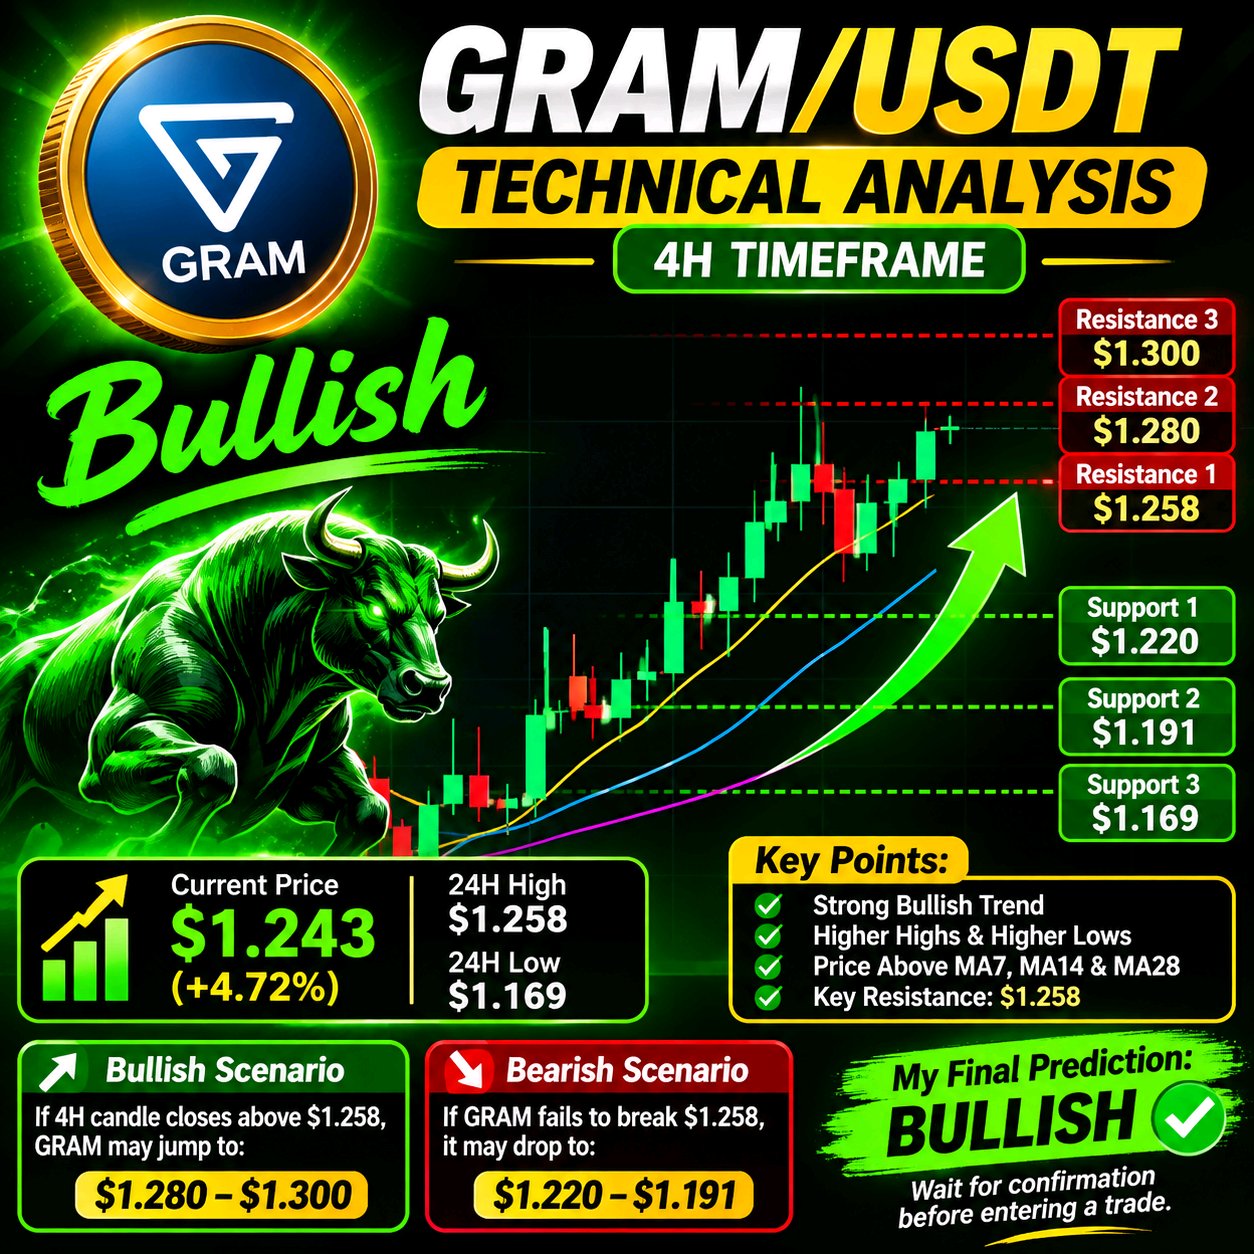
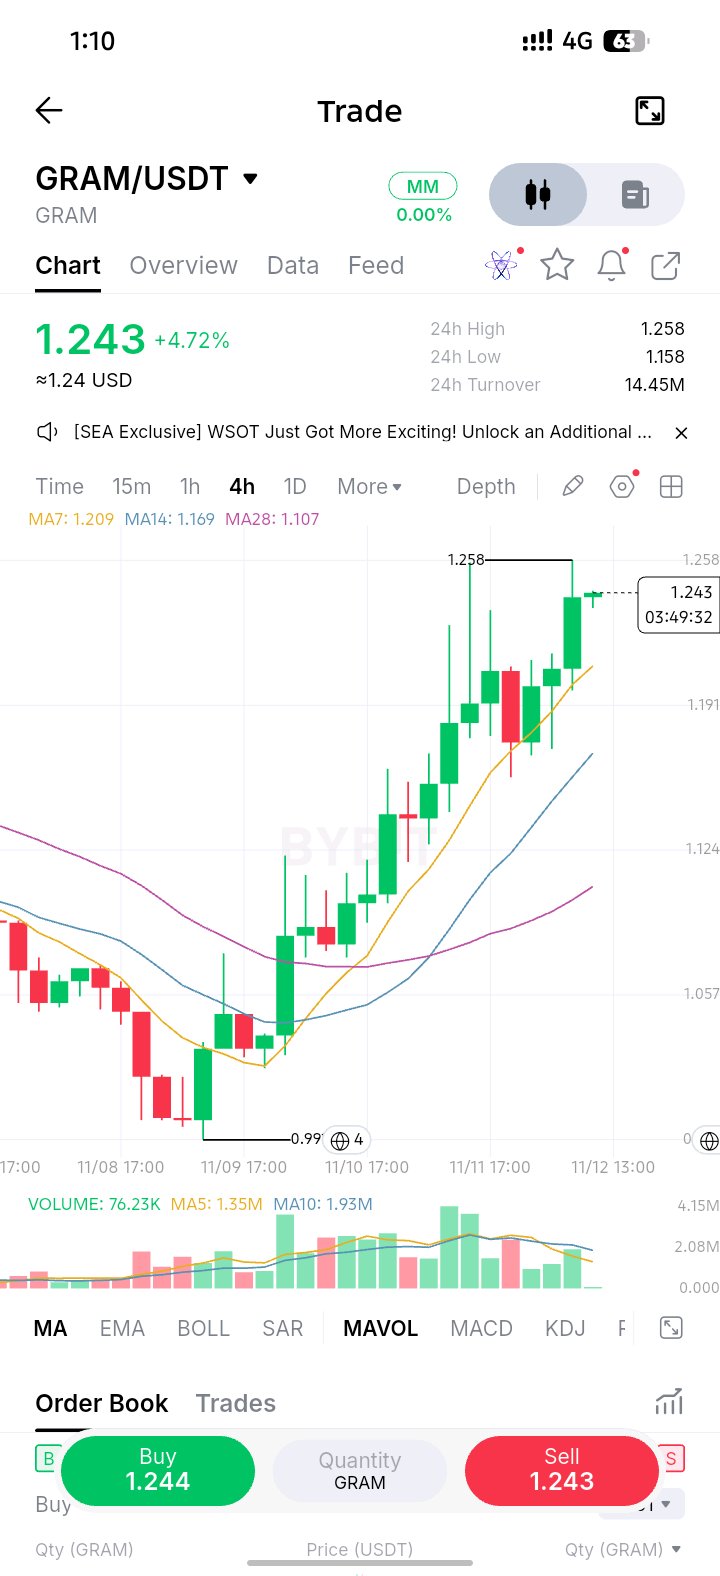
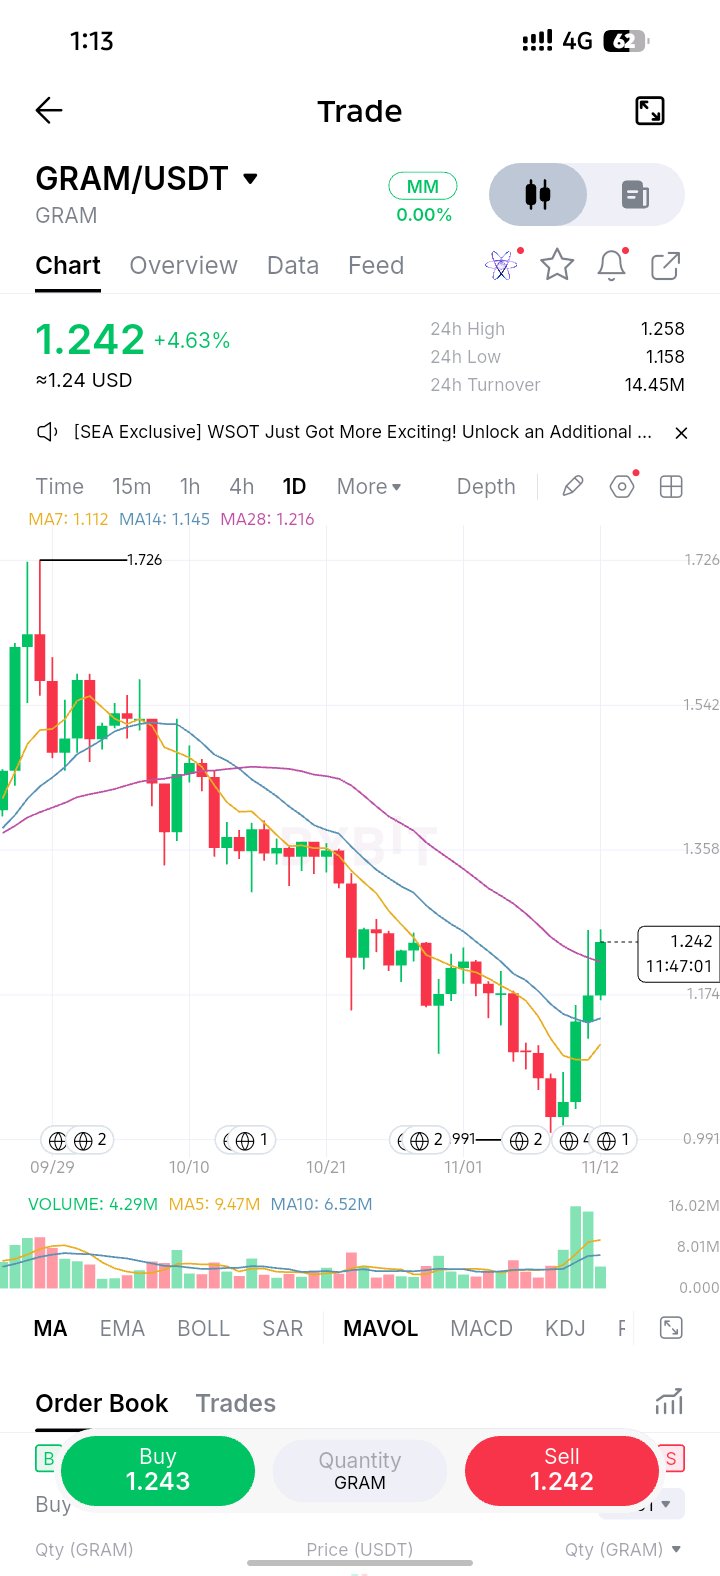
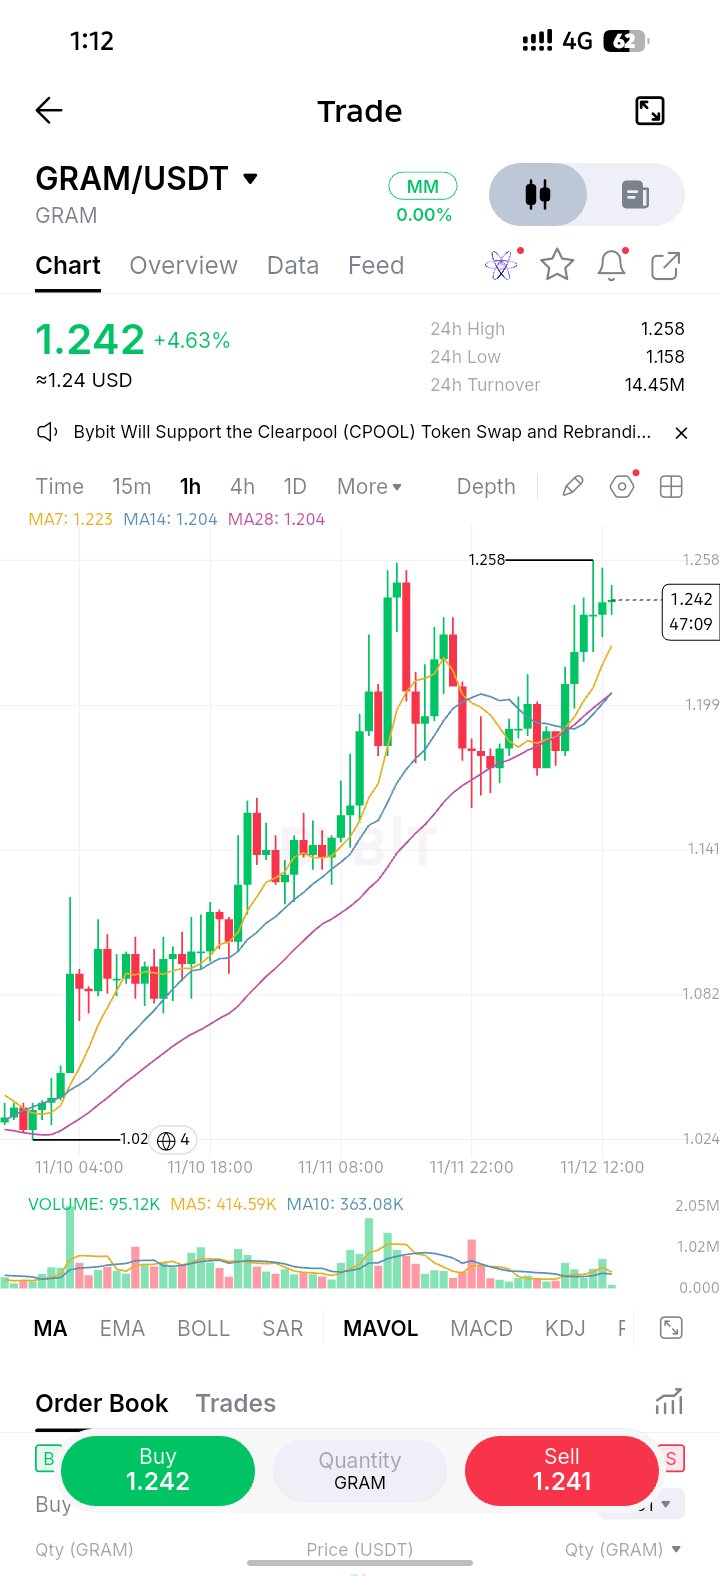
$GRAMUSDT Technical Analysis **Timeframe: 4 Hours (4H)** **Current Price:** $1.243 **24H Change:** +4.72% **24H High:** $1.258 **Market Trend:** BULLISH # 1. Market Structure GRAM is currently in a strong bullish trend. - Higher highs and higher lows are forming. - Buyers are controlling the market. - Price is trading above MA7, MA14 and MA28. - Moving averages are showing bullish alignment. ## 2. Support and Resistance | Level | Price | |---|---:| | Resistance 1 | $1.258 | | Resistance 2 | $1.280 | | Resistance 3 | $1.300 | | Support 1 | $1.220 | | Support 2 | $1.191 | | Support 3 | $1.169 | # 3. What Happens Next? **Bullish Scenario** If a 4H candle closes above $1.258 with strong volume, GRAM could continue towards: - $1.280 - $1.300 **Bearish Scenario** If GRAM fails to break $1.258, sellers may push the price down towards: - $1.220 - $1.191 # 4. Trading Strategy - Avoid chasing the price at resistance. - Wait for a confirmed breakout. - Alternatively, wait for a pullback towards support. - Watch volume before entering a trade. My Final Prediction **BULLISH GRAM has a strong bullish structure, but $1.258 is the key resistance to watch. **Important:** Wait for confirmation before opening a position. This is a chart-based analysis, not a guaranteed prediction. #ByXIMPACT
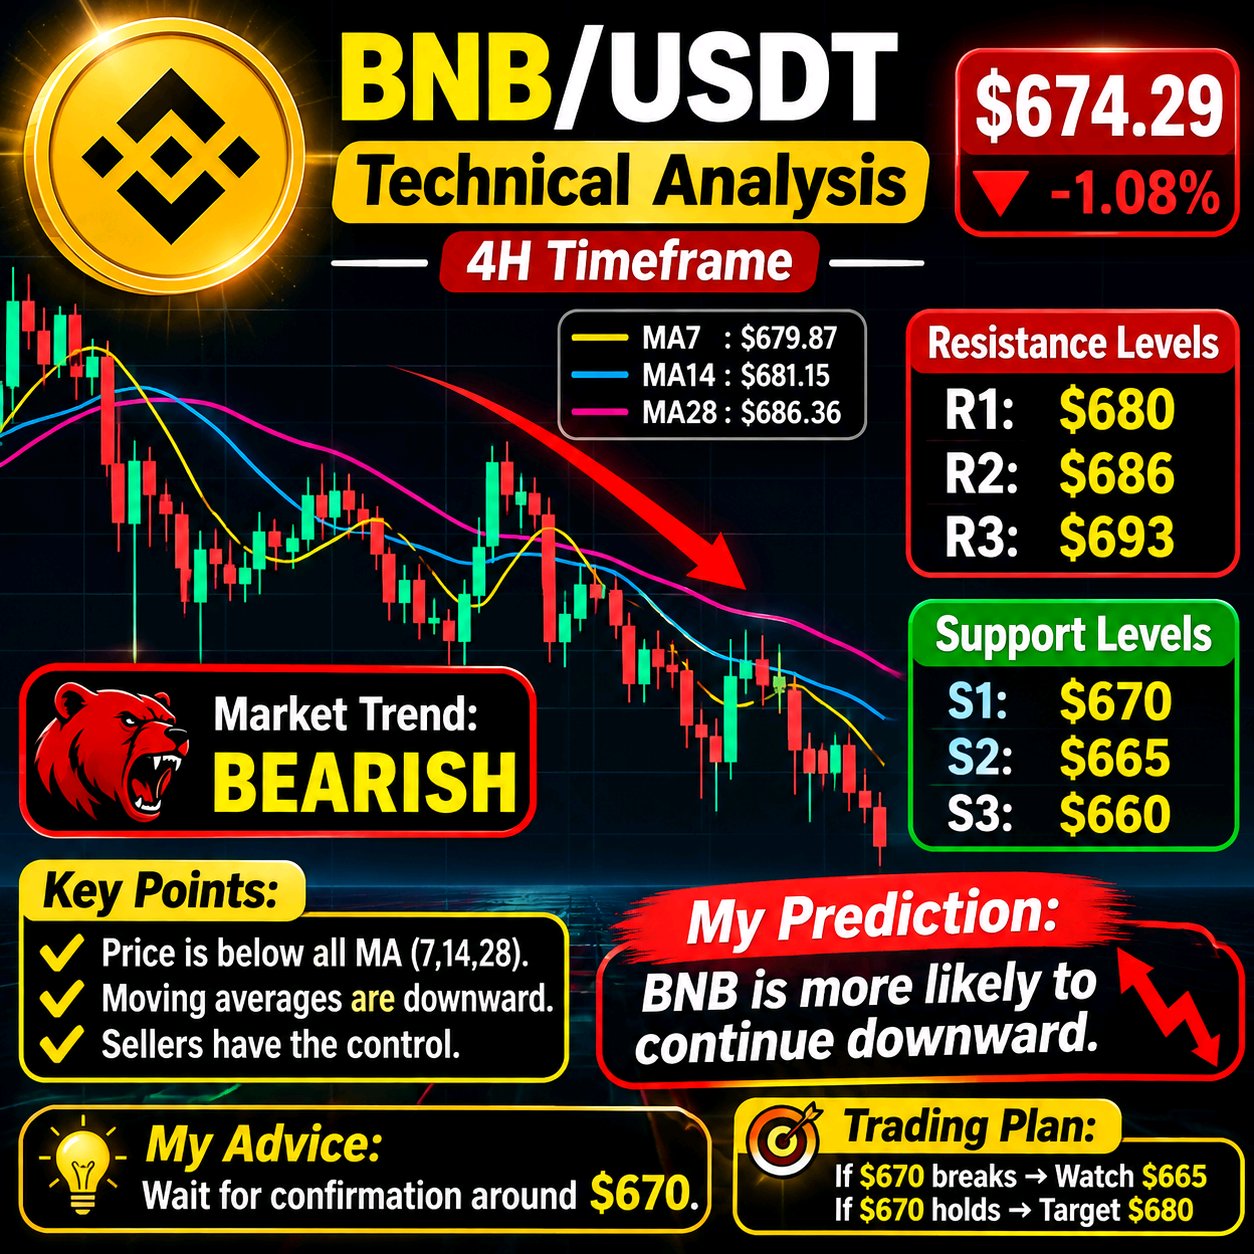
BNBUSDT analysis
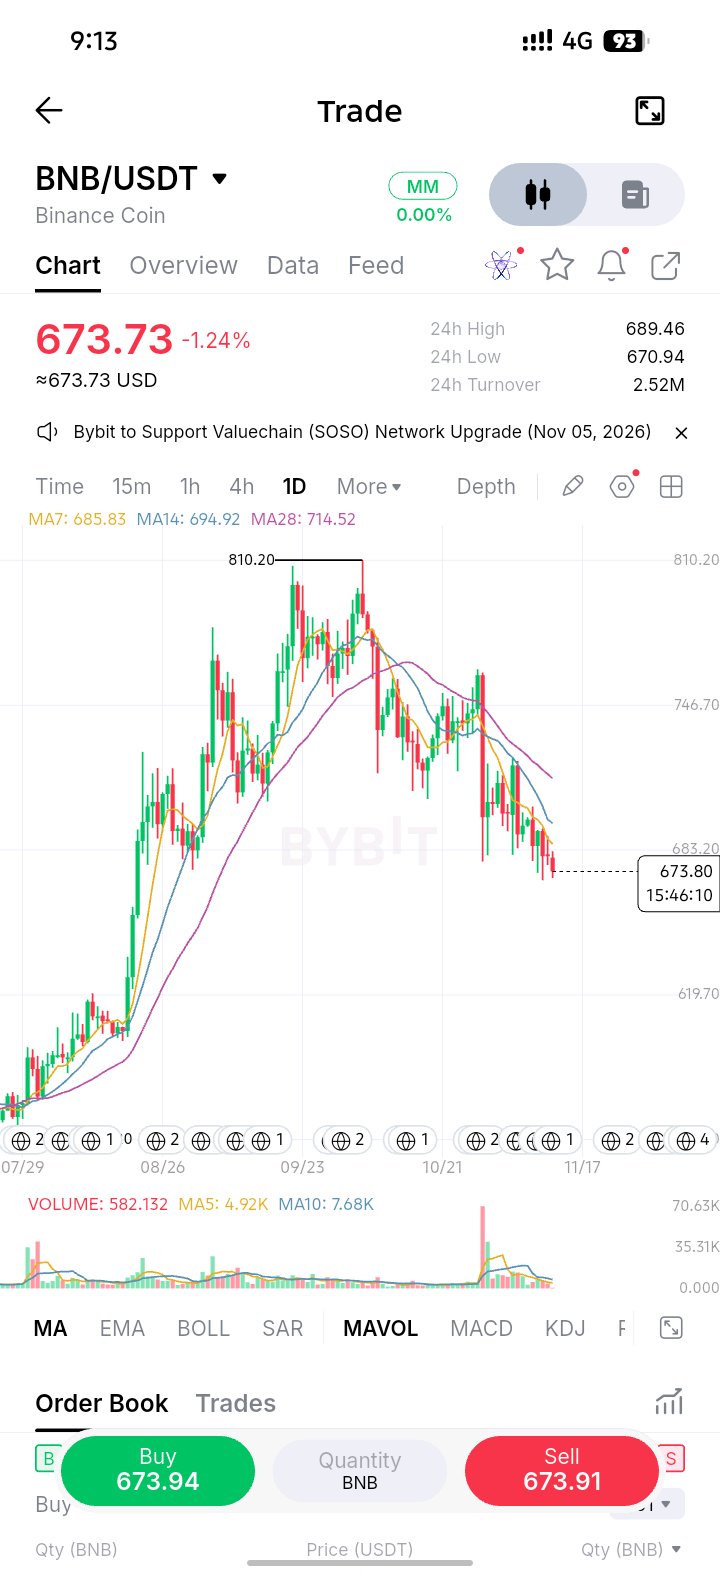
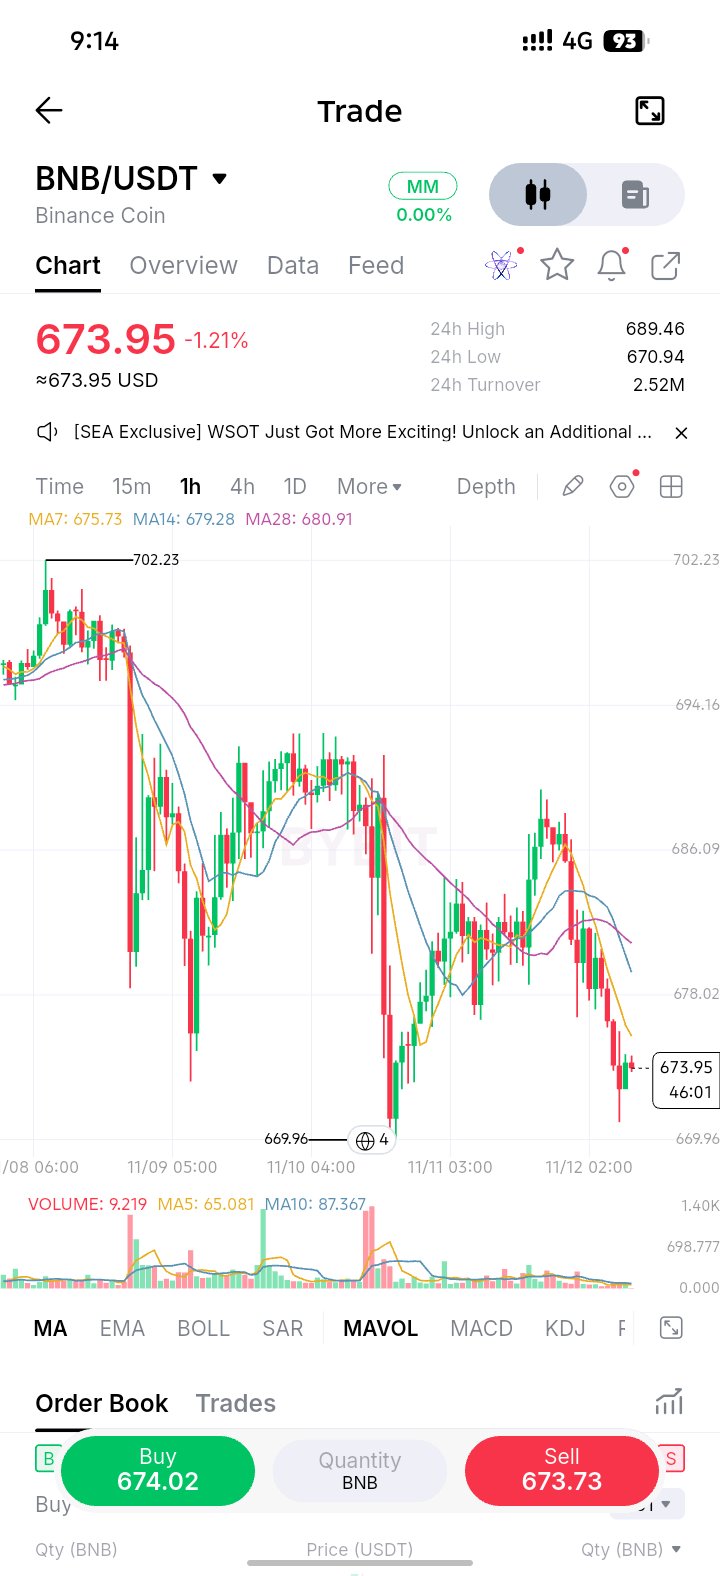
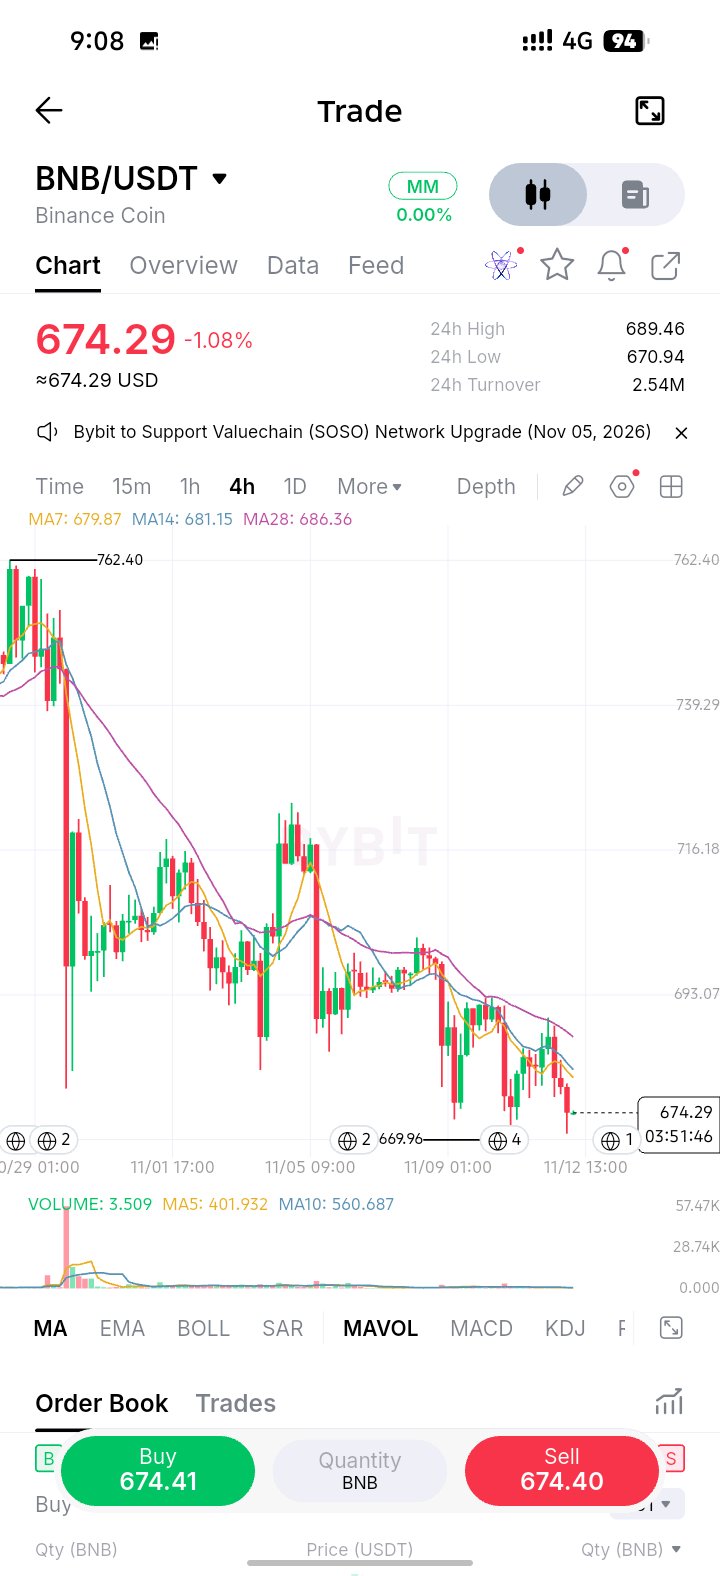
$BNBUSDT Technical Analysis Timeframe: 4 Hours (4H) Current Price: $674.29 24H Change: -1.08% Market Trend: BEARISH (Downtrend) 1. Market Direction BNB is currently showing bearish momentum. Reasons: Price is below MA7 ($679.87). Price is below MA14 ($681.15). Price is below MA28 ($686.36). All three moving averages are pointing downward. Sellers currently have more control of the market. 2. Support Levels Support 1: $670 Support 2: $665 Support 3: $660 If BNB breaks below $670 with a strong 4H candle, further downside is possible. 3. Resistance Levels Resistance 1: $680 Resistance 2: $686 Resistance 3: $693 BNB needs to break above $686 and hold to show signs of a stronger bullish reversal. 4. Trading Signals Signal Direction Current trend Bearish Moving averages Bearish Support $670 Resistance $680–686 Short-term outlook Bearish 5. My Prediction BNB is more likely to continue downward than upward in the short term. However: If $670 breaks, watch for $665. If $670 holds and a bullish reversal candle appears, a bounce towards $680 is possible. My advice: Don't rush to BUY. Wait for confirmation around $670. --- Technical Analysis Lesson Remember this important rule: When MA7 < MA14 < MA28, it often indicates a bearish trend. When MA7 > MA14 > MA28, it often indicates a bullish trend. #ByXIMPACT
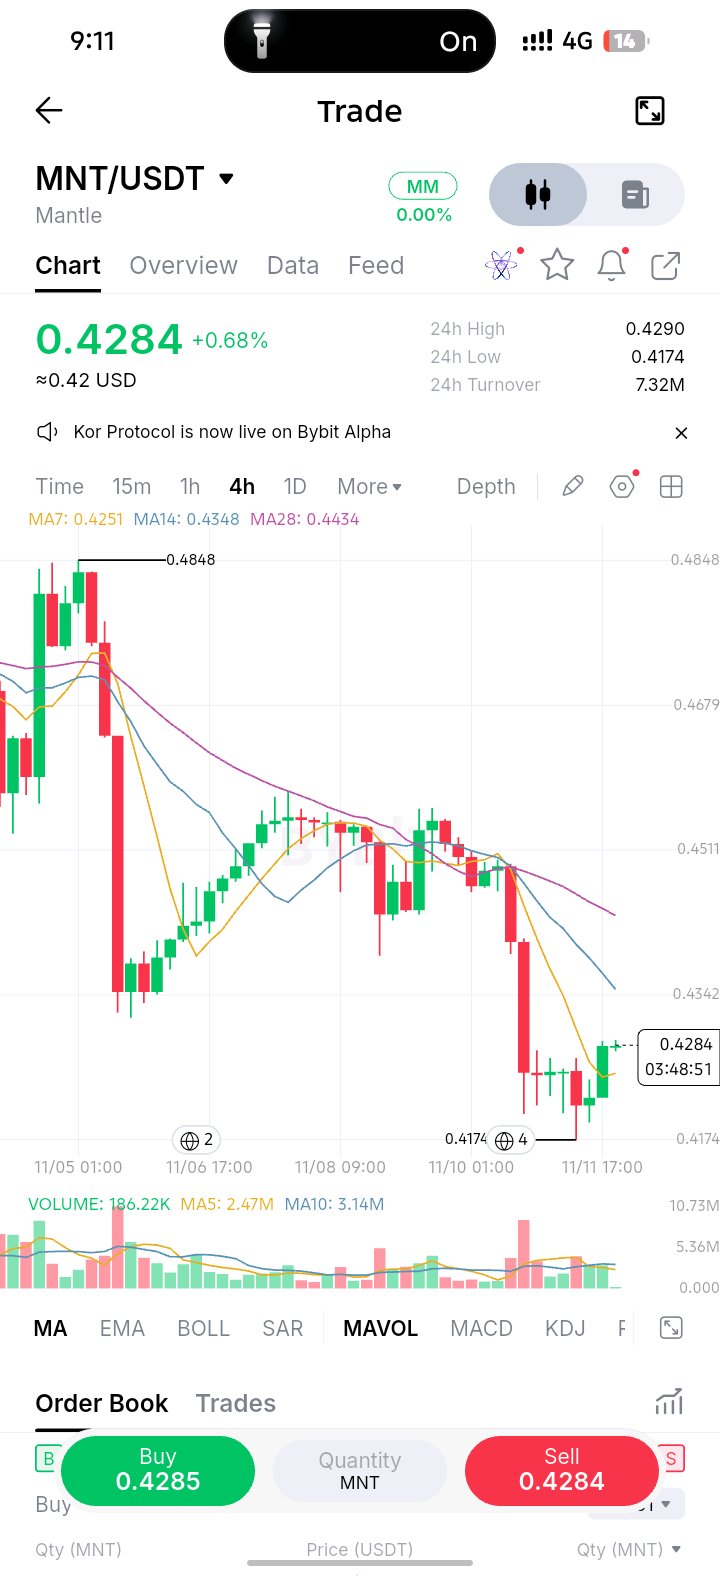
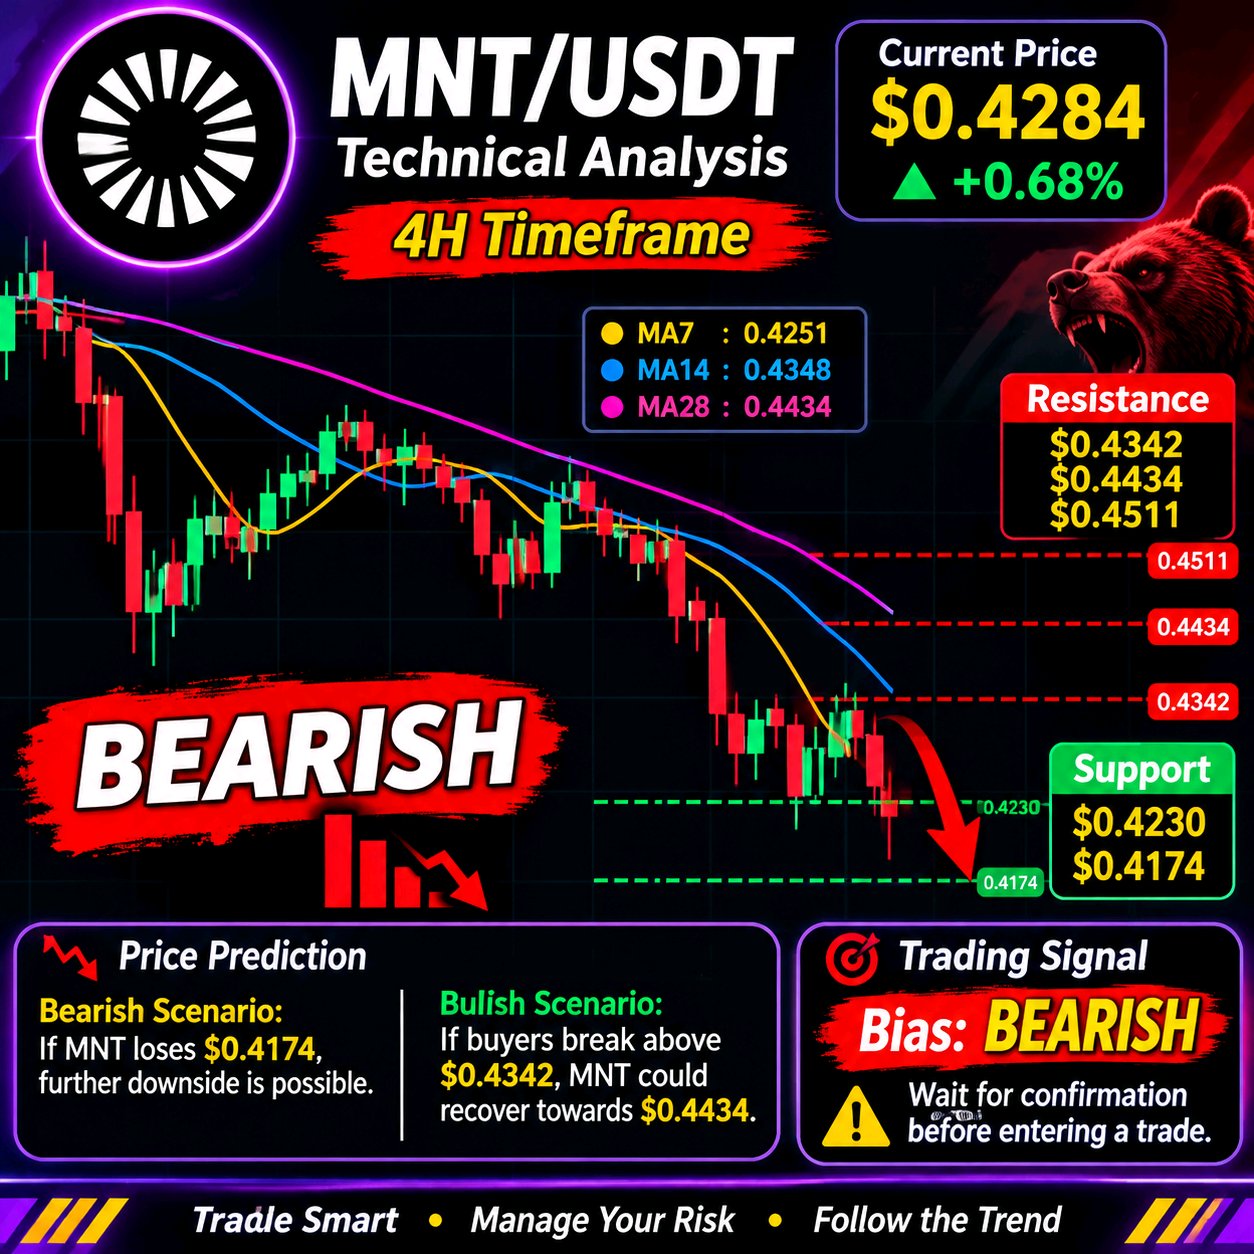
$MNTUSDT Technical Analysis (4H) Current Price: $0.4284 24H Change: +0.68% Trend: Bearish Market Analysis MNT is currently showing a bearish market structure after a strong downward move. MA7: 0.4251 – Short-term recovery. MA14: 0.4348 – Resistance. MA28: 0.4434 – Major resistance. Buyers are attempting a small recovery after touching the $0.4174 support area. The overall trend remains bearish until price breaks above key resistance levels. Key Levels Resistance: $0.4342 $0.4434 $0.4511 Support: $0.4230 $0.4174 Price Prediction Bearish scenario: If MNT loses $0.4174, further downside is possible. Bullish scenario: If buyers push above $0.4342 and maintain momentum, MNT could recover towards $0.4434. Trading Signal Bias: BEARISH I would wait for confirmation before entering a trade. The current upward movement could be only a temporary recovery. #ByXIMPACT
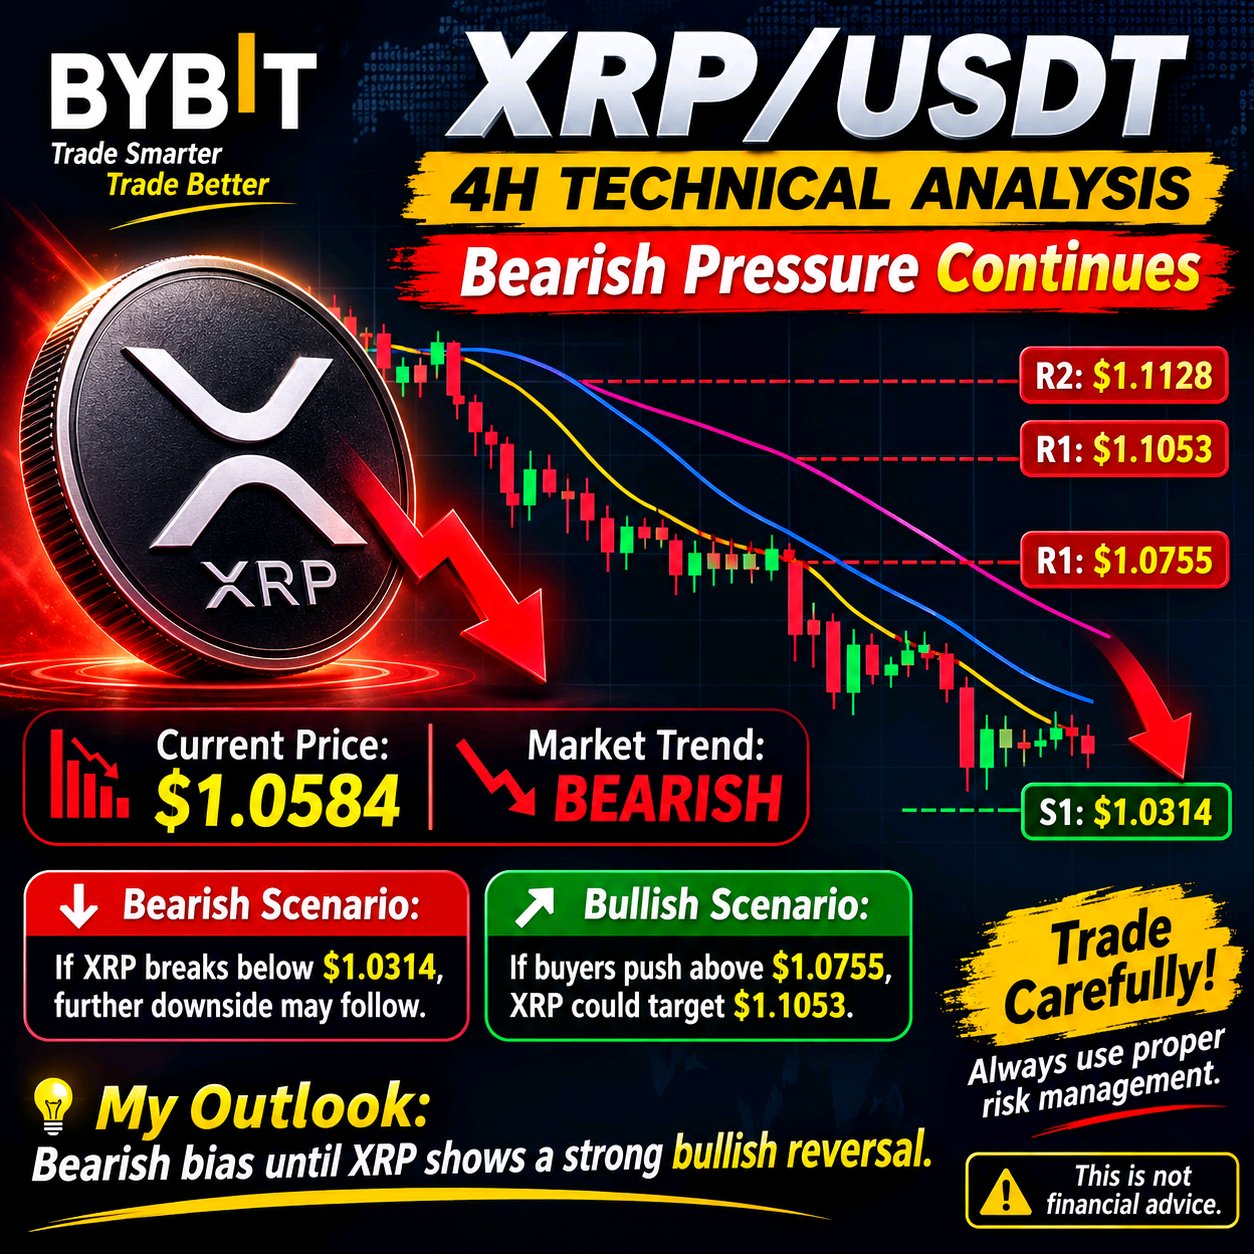
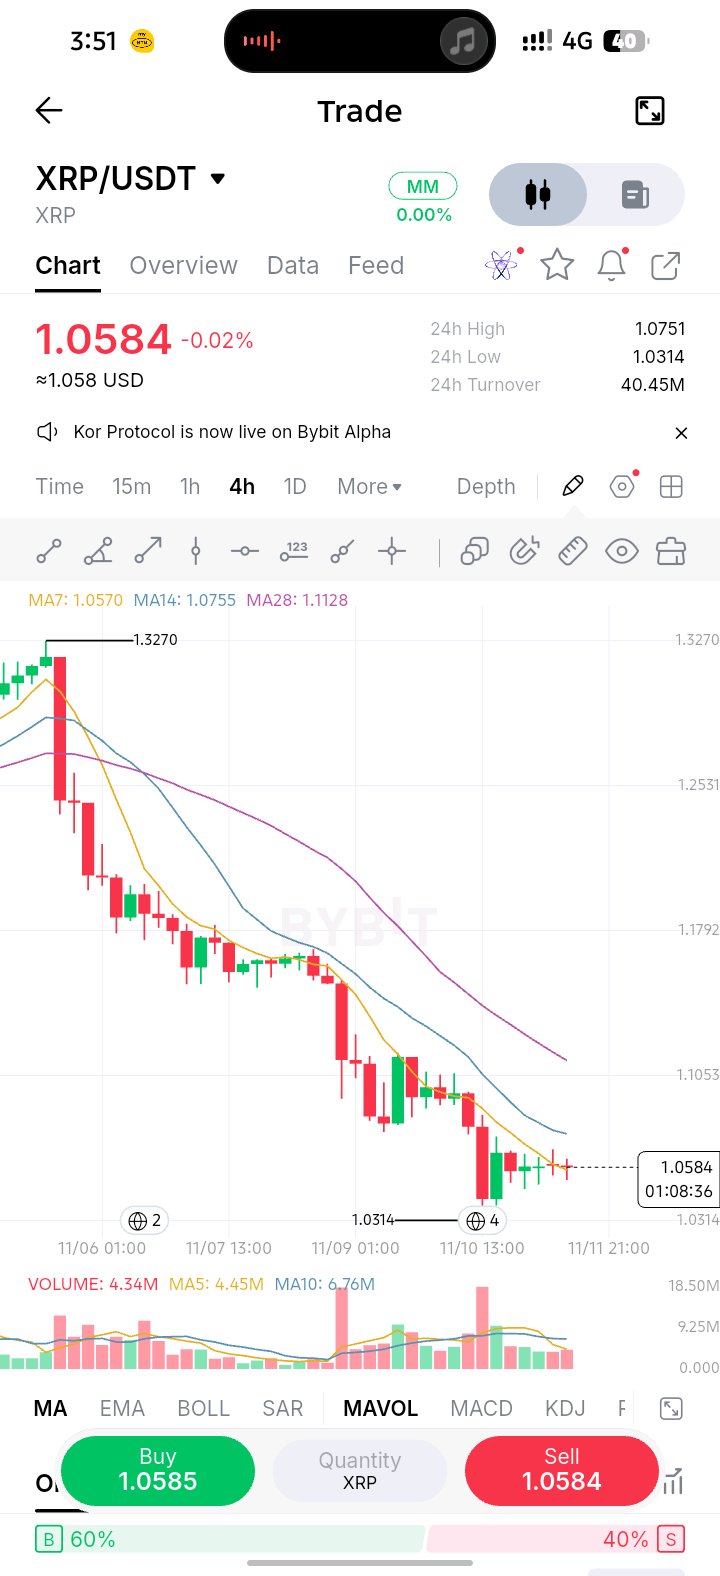
$XRPUSDT – 4H Technical Analysis | Bearish Pressure Continues XRP/USDT – 4H MARKET ANALYSIS Current Price: $1.0584 Market Trend: BEARISH XRP is still showing strong bearish momentum on the 4-hour timeframe. The price remains below MA14 and MA28, indicating that sellers are still controlling the market. Key Levels: Support 1: $1.0314 Resistance 1: $1.0755 Resistance 2: $1.1053 Major Resistance: $1.1128 Bearish Scenario: If XRP breaks below $1.0314, further downside movement may follow. Bullish Scenario: If buyers regain control and push the price above $1.0755, XRP could attempt a recovery toward $1.1053. My Outlook: Bearish bias until XRP shows a strong bullish reversal. Trade carefully. Always use proper risk management. This is not financial advice. #ByXIMPACT