ezi***@****
1377點贊0分享23粉絲21關注
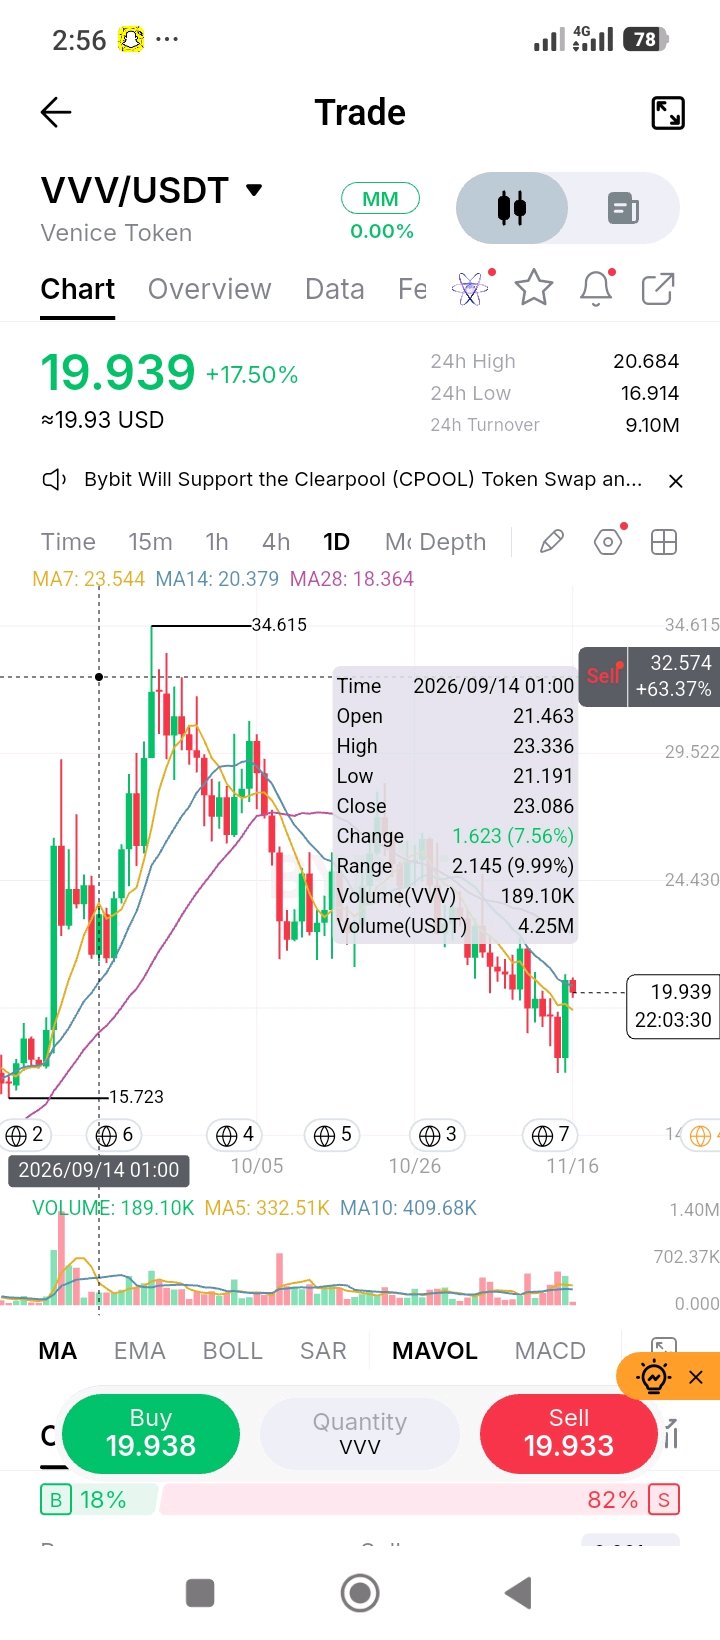
#ByXIMPACT $VVVUSDT is staging a massive relief bounce on the Daily chart, currently trading at 19.939, up a staggering 17.50% on the day. Happy new week. If you want to make the Top 100 on ByX this week, this is exactly the type of high conviction setup you need to master. The macro structure has been a bloodbath. Price collapsed from a major high of 34.615 all the way down to a swing low of 16.914. However, today is a different story. After bleeding for days, the market finally found a hard floor. Buyers aggressively stepped in at the lows, and the current daily candle is printing a massive, full bodied green candle, completely engulfing the recent selling pressure. This is a classic mean reversion bounce after an extended downtrend. Turnover 24 hour turnover is sitting at 9.10M USDT. For a daily chart, this is a moderate but not deep liquidity environment. The key data point here is the historical context you pulled up in the tooltip. Back on September 14th, during the initial breakdown phase, a single candle saw 4.25M USDT in volume with a range of 9.99%. That tells us there is real capital moving this asset when it trends. The current daily turnover shows enough liquidity to trade, but it is still sensitive to sudden flow. Volume Current volume is tracking solidly. Looking at the visual volume profile, the recent red selling candles were losing volume as they dropped, which signaled seller exhaustion. Now, this massive green bounce candle is accompanied by an uptick in volume. The tooltip shows that historical September candle traded 189.10K VVV. If today’s volume closes near or above that historical average, it confirms that real buyers, not just short covering, are driving this reversal. Moving Averages MA7 is at 23.544, MA14 is at 20.379, and MA28 is at 18.364. This is the most important technical setup on the chart. Price aggressively dumped, sliced through the MA14, but found perfect, textbook support exactly at the MA28 at 18.364. It has now bounced violently and is currently battling the MA14 at 20.379. The MA7 is still far above price, meaning the macro trend is still down, but the short term momentum has completely flipped. Levels to Watch • 16.914 is the daily swing low and the hard floor. • 18.364 is the MA28. The structural support that just held perfectly. • 20.379 is the MA14. This is the immediate battleground. A daily close above this confirms the momentum shift. • 23.544 is the MA7. The next major resistance. • 34.615 is the macro high. Consideration Look at the order book. It is extremely skewed, showing 18% buyers and 82% sellers. Retail is aggressively trying to short this bounce. They are looking at the macro downtrend and assuming this is a dead cat bounce. This is a massive trap. When price rejects a major moving average like the MA28 and rips 17% in a day, shorting it is dangerous. If price pushes through the MA14 at 20.379, those 82% of sellers will be forced to cover, creating a violent short squeeze that could easily push the price back to the 23.00 region. Trade Plan • The Bullish Path: A confirmed daily close above 20.379 (MA14). This traps the 82% of short sellers and opens a run to the MA7 at 23.544. • The Bearish Path: A rejection here leaving a long upper wick, followed by a daily close back below the MA28 at 18.364. This invalidates the bounce and sends price back to the lows. • My take: The setup is incredibly juicy, but you do not chase a candle that is already up 17.50%. I want to see how the daily candle closes. If it closes strong above the MA14, I will look for an intraday pullback to enter a long and ride the short squeeze. If it rejects here, I will wait for a daily close to look for a short. Support and Resistance Support is heavily layered at 18.364, followed by the major floor at 16.914. Resistance sits at the immediate battleground of 20.379, followed by 23.544. Invalidation and Risk Note The bullish thesis is invalidated on a daily close below 18.364 (MA28). The biggest risk here is a failed breakout at the MA14. In a macro downtrend, relief rallies often die at the first major moving average. If it rejects here, the 18% of buyers will get trapped. Do not use market orders. Wait for the daily candle to close. Size your position so you can survive a 15% wick in either direction.
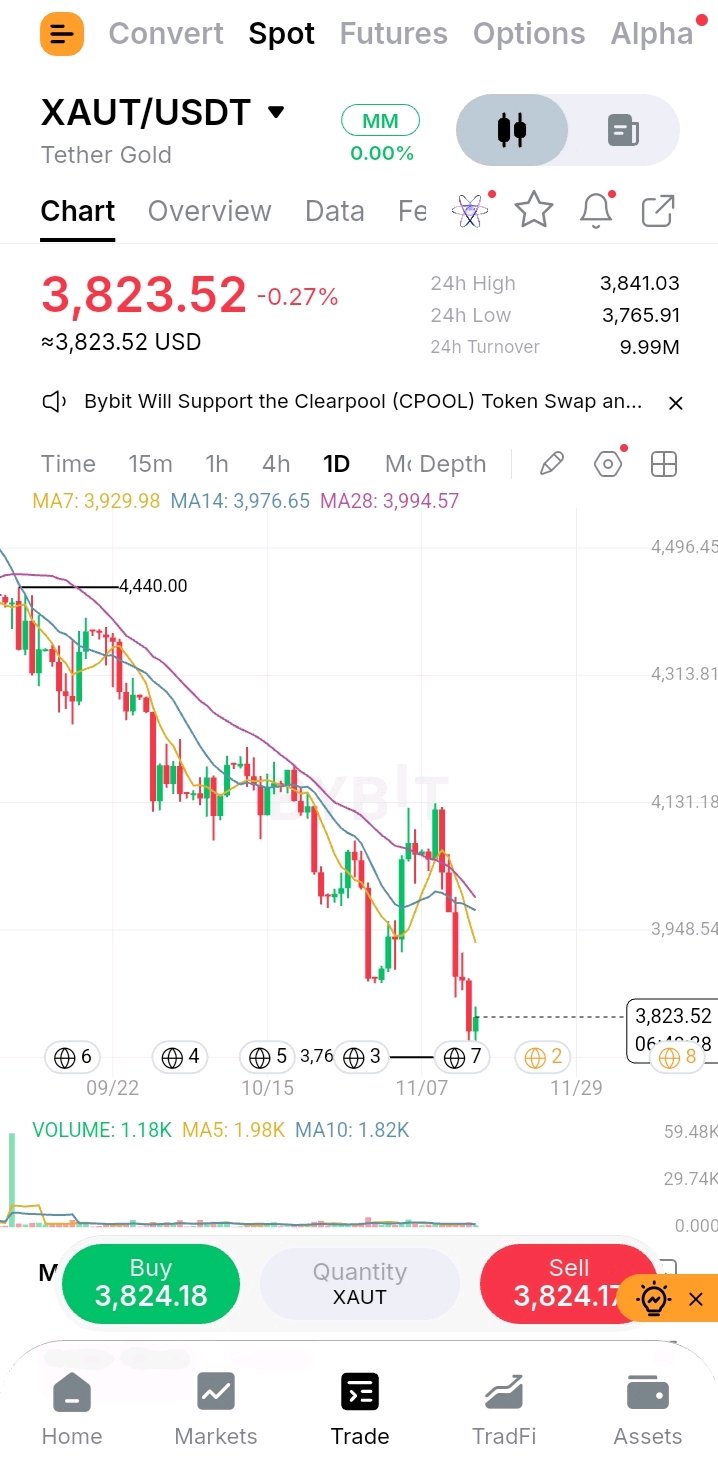
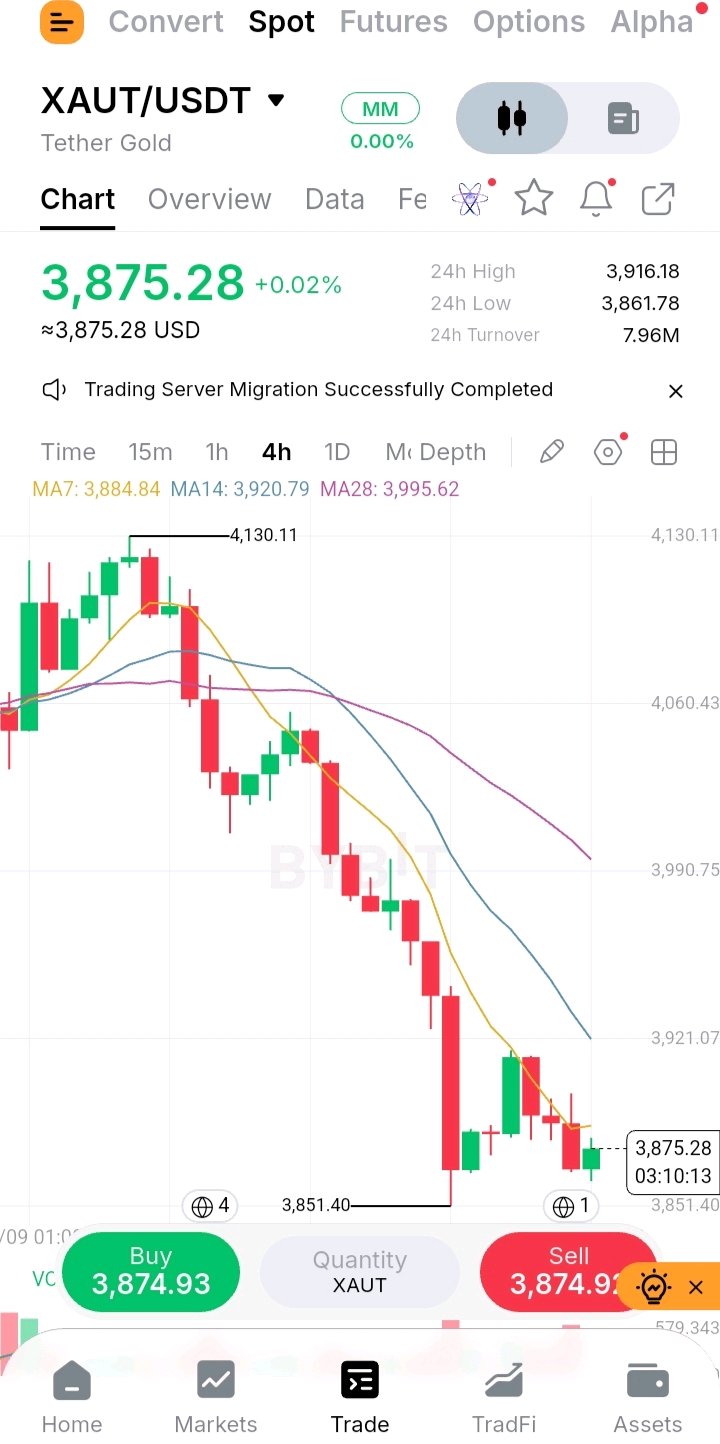
#ByXIMPACT $XAUTUSDT is closing the trading week on a heavily bearish note, currently trading around 3,875.28, down a marginal 0.02% but deeply scarred from the weekly price action. The macro structure on the 4 hour chart is a relentless downtrend. Price has collapsed from a major structural high of 4,130.11, cascading through every support level to print a brutal swing low of 3,851.40. Looking at the current price action, the market is completely exhausted. The aggressive selling has paused, and the last several candles are printing small bodies and dojis, indicating the market is trying to find a temporary floor. However, this is not a bullish reversal. There is zero buying pressure stepping in. The price is simply drifting sideways at the bottom of the range after a violent flush, leaving the macro bias firmly to the downside. Turnover The 24 hour turnover profile reflects heavy institutional distribution throughout the week. The visual turnover peaked drastically during the cascading red candles on the way down. The current sideways chop is happening on declining turnover. This tells a very specific story. It is not that the sellers have disappeared, it is that the aggressive market selling has stopped. The lack of buyer participation means the market is vulnerable. Any fresh wave of sell orders will easily break this temporary floor. Volume The current volume is extremely low relative to the moving averages. The visual volume profile shows red bars dominating the recent decline, with the green bars during this current pause being noticeably smaller. This indicates the market is catching its breath. The caveat is that low volume consolidation in a downtrend almost always resolves to the downside, as it represents a lack of demand rather than smart money accumulation. Buyers are simply not interested at these prices. Moving Averages MA7 is at 3,884.84, MA14 is at 3,920.79, and MA28 is at 3,995.62. The averages are stacked in a perfect, widening bearish fan. Price is currently trading below all three, pinned down by the MA7. The distance between the MA7 and MA28 is wide, confirming the strength of the macro downtrend. Until price can reclaim the MA7 on a closing basis, the bears remain in absolute control of the trend. Levels to Watch • 3,851.40 is the current swing low. Losing this level opens the door to a deeper flush. • 3,884.84 is the MA7. The immediate dynamic resistance. Reclaiming it is the first sign of life. • 3,920.79 is the MA14. The first major structural hurdle for any bounce. • 4,130.11 is the macro high and the ultimate resistance. Consideration Tether Gold tracks the spot price of physical gold, which means the technicals are highly influenced by traditional macro factors. We are approaching the weekend close. The traditional commodity markets are closed, but XAUT trades 24/7 on crypto exchanges. This creates a dangerous liquidity vacuum. Spreads can widen, and price can wick violently on very low volume. The current candle shape shows a slight upper wick, meaning sellers are still active on minor pushes. The lack of a strong lower wick on the swing low means the floor is still vulnerable. Trade Plan • The Bullish Path: A 4 hour close above 3,884.84 (MA7) with an expansion in volume. That opens a relief bounce to test the 3,920.79 (MA14). • The Bearish Path: A close under 3,851.40 continues the macro downtrend, opening a move toward the 3,800 psychological level. • My take: I am not trying to catch this falling knife while price is pinned under the MA7. The weekend liquidity risk makes holding positions dangerous. I would wait for the weekly close. Next week, I want to see a confirmed 4 hour close above 3,884.84 to look for a short term long scalp toward the MA14. If price rejects the MA7 and prints a bearish reversal candle, I will look for a short back down to the lows. Support and Resistance Support rests at 3,851.40, followed by the 3,800 psychological level. Resistance sits at 3,884.84, followed by 3,920.79 and the major 3,995.62 region. Invalidation and Risk Note The bearish read is invalidated on a 4 hour close above 3,920.79 (MA14). The biggest risk here is a sudden macro shift in the spot gold market that causes a gap in the tokenized price over the weekend. Because this asset moves slower than high beta altcoins, volatility is lower, but the liquidity gap is real. Use limit orders and wait for confirmed 4 hour closes. NFA
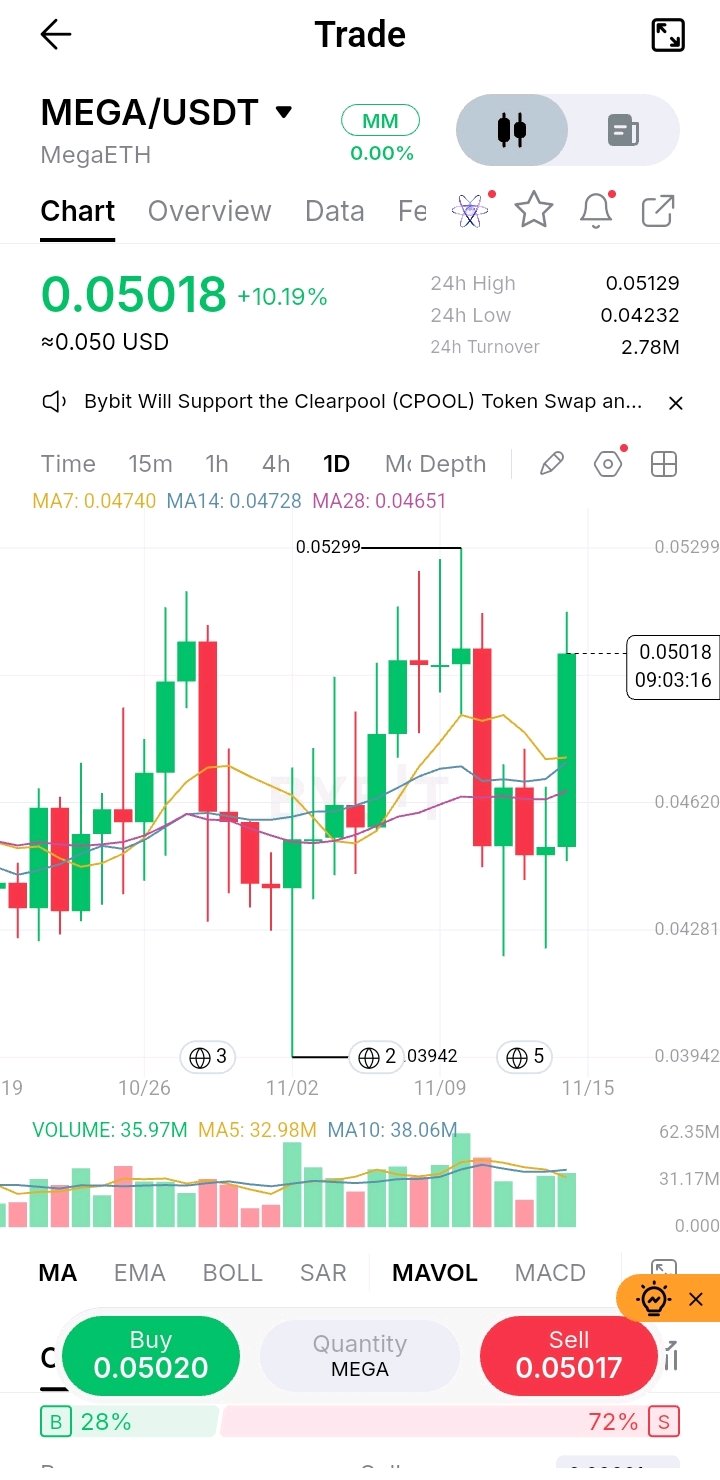
#ByXIMPACT MEGA is showing a violent breakout attempt from a highly compressed and volatile range on the Daily chart, currently trading at 0.05018, up 10.19% on the day. The historical price action on this chart is incredibly messy. We have seen massive wicks in both directions, with price sweeping from a macro low of 0.03942 all the way up to a local high of 0.05299. Today's daily candle is a strong, full bodied green candle pushing aggressively to the upside. It has completely engulfed the previous red candle and is now testing the upper boundary of this multi day chop zone. Buyers have stepped in decisively, reclaiming control and attempting to break the market structure to the upside. Turnover 24 hour turnover is 2.78M USDT. For a daily chart, this is a very thin liquidity environment. This low turnover is the underlying reason for the violent wicks we see across the chart. When a token trades on such thin volume, the order book is easily manipulated. Relatively small market orders can push the price around violently, meaning we must treat these daily candles with caution and rely on confirmed closes rather than intrabar moves. Volume Current volume is 35.97M against a 5 day average of 32.98M and a 10 day average of 38.06M. Volume is tracking slightly above the 5 day average and is relatively consistent with the 10 day average. This is a healthy sign. The breakout attempt is not happening on dead volume. Buyers are showing up with actual participation to support this move. If this volume holds into the daily close, it adds significant credibility to the breakout. Moving Averages MA7 is at 0.04740, MA14 is at 0.04728, and MA28 is at 0.04651. The moving averages are tightly clustered in a perfect bullish fan, and price has decisively broken above all three. This tight cluster between 0.04651 and 0.04740 is acting as a solid, thick dynamic support base. As long as price holds above this cluster, the short term momentum is firmly in the hands of the bulls. Levels to Watch • 0.05299 is the immediate local high and the critical breakout level. A daily close above this confirms the continuation. • 0.04740 is the MA7. The immediate dynamic support. • 0.04728 is the MA14. The middle of the moving average cluster. • 0.04651 is the MA28. The structural floor of the current trend. • 0.03942 is the macro swing low and the ultimate invalidation level. Consideration The most critical data point on this chart is the order book. It is flashing a massive anomaly, showing only 28% buyers and 72% sellers. Retail is heavily trying to short this green daily candle. When retail is this heavily skewed to the short side while price is breaking above moving averages, it creates a perfect setup for a short squeeze. If price pushes through 0.05299, those 72% of sellers will be forced to cover, providing the fuel for an aggressive move upward. Trade Plan • The Bullish Path: A confirmed daily close above 0.05299. This traps the heavily shorted retail crowd and opens a run into price discovery. • The Bearish Path: A rejection here, leaving a long upper wick, followed by a daily close back below the MA cluster at 0.04651. This invalidates the breakout and sends price back to the lower range. • My take: The heavy short skew makes this a very attractive long setup. However, chasing the green candle right under resistance is poor risk management. I want to see a daily close above 0.05299. If it closes strong, I will enter on a retest. If it pulls back, a limit buy near the MA cluster at 0.04700 with a tight stop below 0.04500 is a fantastic risk to reward entry. Support and Resistance Support is layered at 0.04740, followed by 0.04651 and the major floor at 0.03942. Resistance sits at the immediate local high of 0.05299. Invalidation and Risk Note The bullish thesis is invalidated on a daily close below 0.04651 (MA28). The biggest risk here is the thin liquidity. A daily turnover of 2.78M means a single large market order can instantly wipe out the bid depth and crash the price. Do not use market orders. Wait for the daily candle to close and use limit orders exclusively. $MEGAUSDT NFA
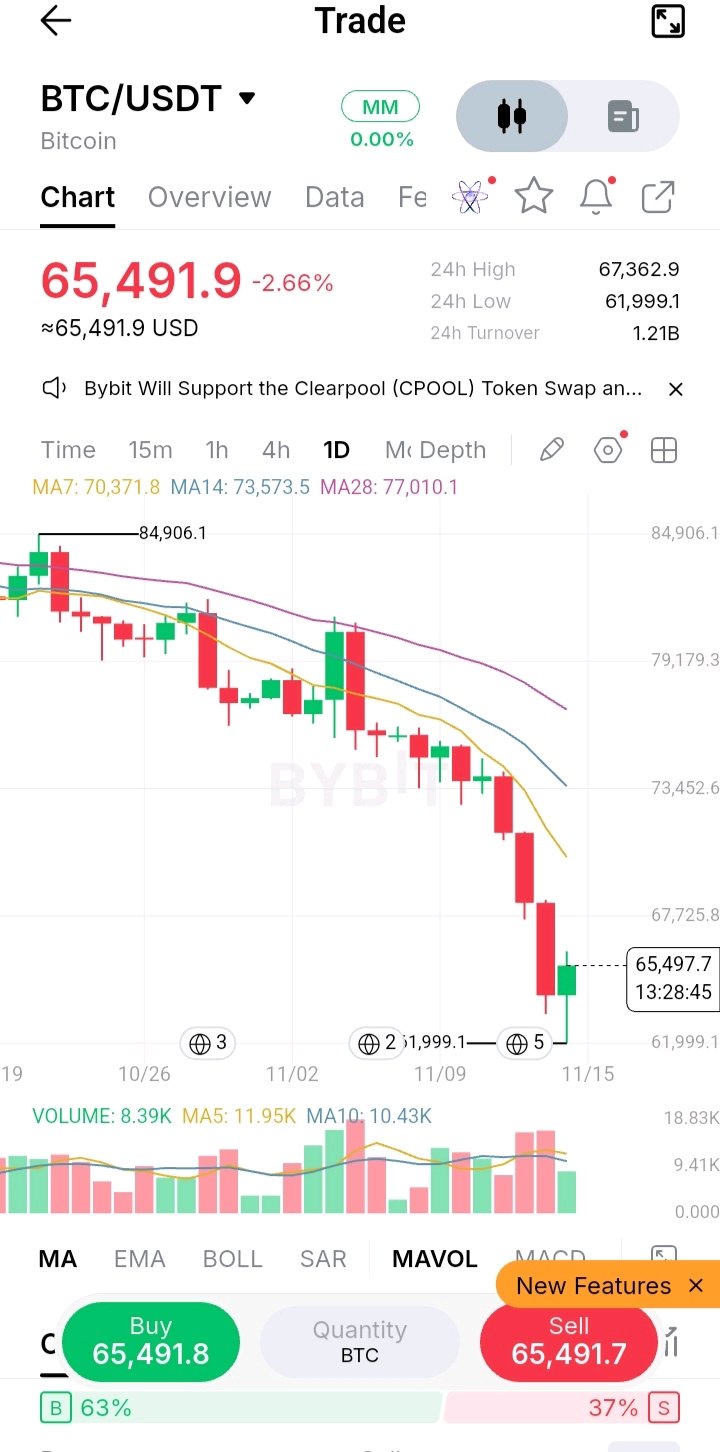
ByXIMPACT $BTCUSDT 目前在日線圖上處於完全投降狀態,現價為 65,491.9,單日下跌 2.66%。宏觀結構簡直是一場災難。價格從 84,906.1 的結構性高點一路崩跌,高點不斷降低,低點持續下探,徹底抹殺了路徑上的所有主要支撐位。 然而,目前的日線蠟燭終於出現了一絲生機。在觸及 61,999.1 的殘酷低點後,買盤介入並拉出一根帶有長下影線的強勢陽線。這是一個經典的超跌反彈。市場此前嚴重超賣,這是對那種極度拋壓的反應。問題在於,這到底是真正的反轉,還是下一波下跌前的死貓反彈。 成交額 24 小時成交額高達驚人的 12.1 億 USDT。這可是大戶級別的體量。當比特幣在單日下跌過程中成交額超過 10 億美元時,這絕非散戶的恐慌拋售。這是機構層面的大規模出貨、演算法觸發止損以及強制清算在訂單簿中連鎖反應的結果。這裡的流動性極大,意味著價格變動是由真實資本支撐,而非假突破。 成交量 目前成交量為 8.39K,對比 5 日均線 11.95K 和 10 日均線 10.43K。看看下跌時的成交量柱,那些紅色蠟燭是由巨大的成交量高潮推動的。目前的這根反彈陽線是在相對較低的成交量下發生的,這屬於看跌背離。買盤介入的力度遠不如賣盤。在成交量萎縮的情況下反彈,通常反彈力道疲軟。 移動平均線 MA7 位於 70,371.8,MA14 位於 73,573.5,MA28 位於 77,010.1。均線呈現出劇烈擴散的看跌排列。目前價格比 MA7 低了足足 7%。這種與均線的極端背離證實了市場在下行方向過度延伸。雖然這使得均值回歸反彈的可能性增加,但在價格能夠日線收盤站上 MA7 之前,趨勢依然極度看跌。 觀察點位 • 84,906.1 是宏觀高點,也是終極阻力位。 • 70,371.8 是 MA7,即即時動態阻力位。日線收盤高於此處是趨勢轉變的第一個訊號。 • 65,491.9 是現價,正在努力守住反彈。 • 61,999.1 是日線低點,也是關鍵的波段底線。失守這裡將觸發新一輪清算。 市場觀察 訂單簿發出了警告訊號,顯示 63% 為買方,37% 為賣方。散戶正瘋狂地試圖接這把下落的尖刀。當比特幣跌得這麼慘而散戶立即傾向做多時,造市商往往會再向下砸一次,掃掉這些止損單,然後才可能出現真正的反轉。目前的蠟燭形態是錘子線,單獨看是看漲的,但由於缺乏高成交量支撐,其真實性存疑。 交易計畫 • 看漲路徑:日線收盤站上 70,371.8 (MA7)。這將打破即時的看跌結構,開啟邁向 73,573.5 (MA14) 的反彈行情。 • 看跌路徑:在此處遭遇日線級別拒絕,重新收在 64,000 以下,隨後跌破 61,999.1 的低點。這將套牢那 63% 的買方,並開啟朝 60,000 心理關口的跌勢。 • 個人觀點:我絕對不會買入這根陽線。宏觀趨勢向下,且散戶過度集中在多頭。我會等待日線收盤,看看買方是否真的有信心。如果價格突破並站穩 MA7 上方,我會考慮尋找做多回測的機會;如果這裡遭到拒絕並失守 62k 底線,我會尋找做空機會,延續跌勢至 60k。 支撐與阻力 支撐位位於關鍵的波段低點 61,999.1,隨後是 60,000 的心理關口。阻力位在於即時的 MA7 (70,371.8),其次是 MA14 (73,573.5)。 失效條件與風險提示 當日線收盤高於 70,371.8 (MA7) 時,看跌論點失效。這裡最大的風險是劇烈的空頭擠壓。隨著散戶堆積多單,且下方留有巨大的下影線,若能奪回移動平均線,可能會迫使空頭猛烈回補。然而,在宏觀下跌趨勢中,在未確認收盤前去接日線蠟燭簡直是自殺行為。 不要使用市價單。等待日線收盤,並嚴格管理您的風險。
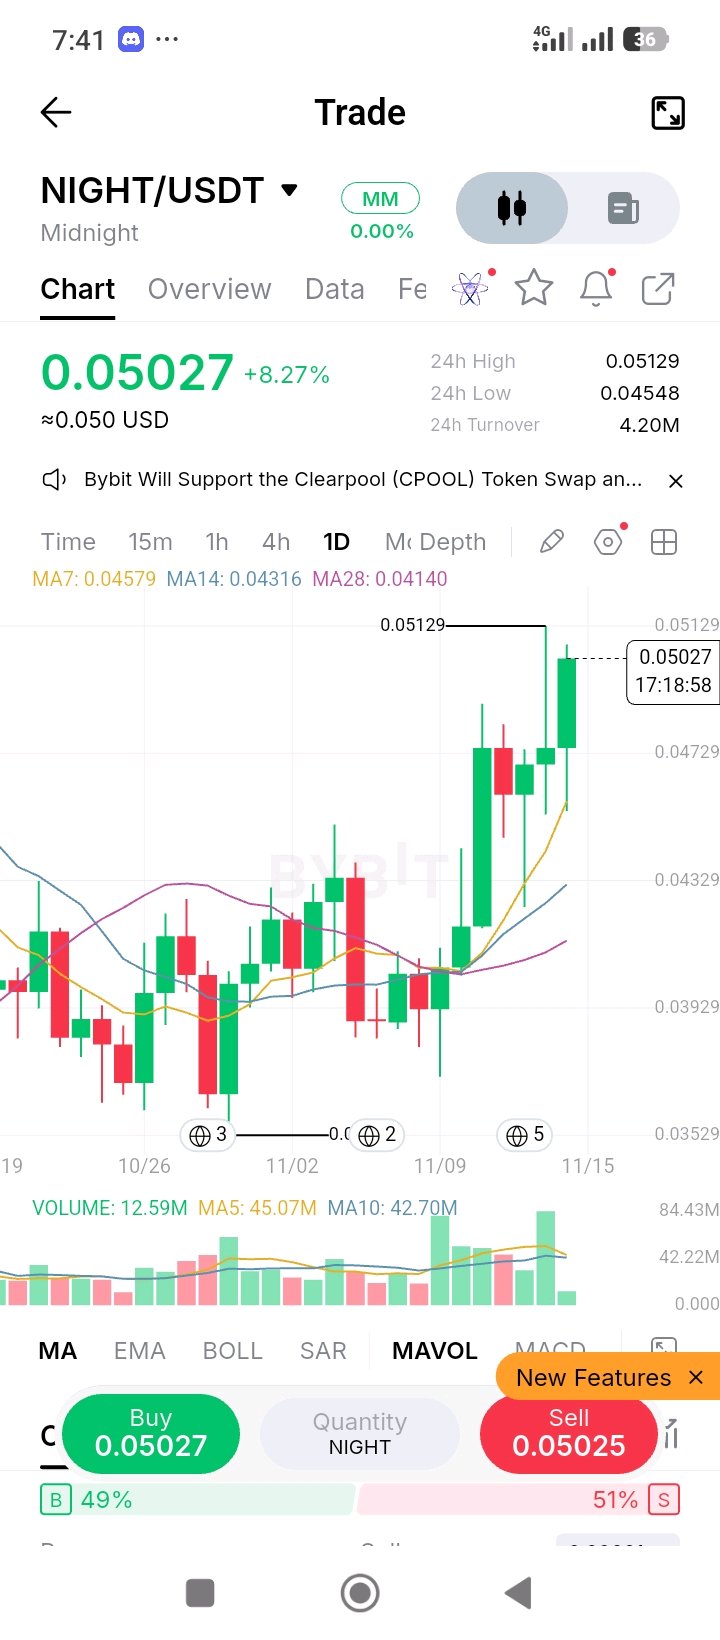
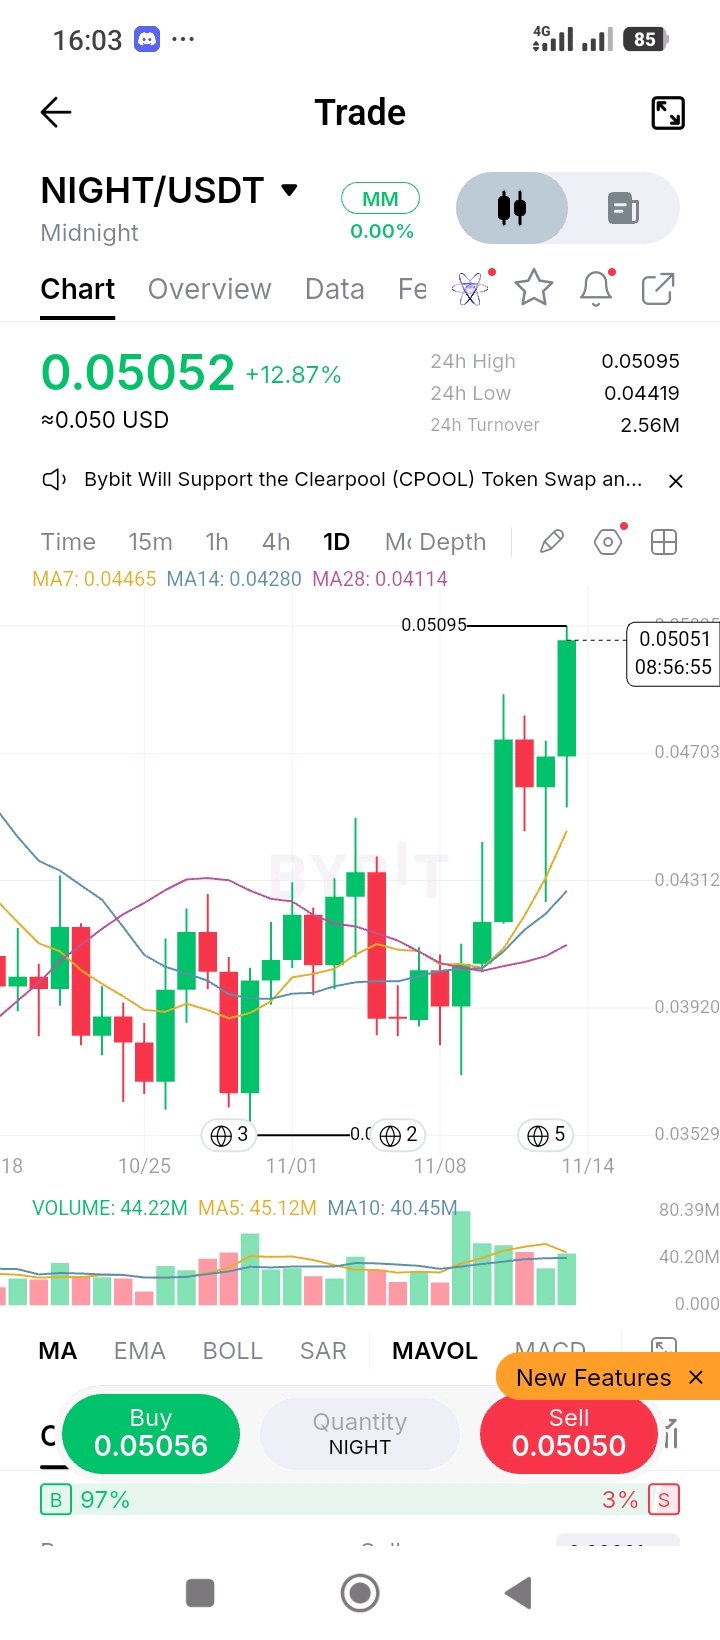
ByXIMPACT NIGHT 在日線圖上正執行教科書式的趨勢延續,目前交易價格為 0.05027,日內漲幅 8.27%。這是我們昨天分析的技術型態的直接延續。這波行情始於從 0.03529 宏觀底部的大幅擴張,將價格垂直推升至 0.05129 的局部高點。昨天,市場進行了一次經典的洗盤,下探至 0.04548 的低點,隨後買方積極反擊,留下一根長下影線。今天,買方重整旗鼓,強勢拉升,收出一根堅實的陽線,正逼近 0.05129 的阻力天花板。低點不斷抬高的結構依然完好。 成交額 24 小時成交額為 420 萬 USDT。在日線圖上,這屬於流動性偏低的環境。我們交易的並非高流動性的大市值幣種。訂單簿深度較淺,意味著該資產對資金流入極度敏感。相對較小的市價單就能推動價格幾個百分點的變動,這正是我們看到這些劇烈日內波動和長影線的原因。這種低成交額顯示市場是由投機動能驅動,而非深厚的機構現貨累積。 成交量 目前成交量為 1,259 萬,對比 5 日均量 4,507 萬及 10 日均量 4,270 萬。這看起來像是參與度下降,但必須結合語境來看。日線蠟燭圖才剛開始,還有超過 17 小時才會收盤。在交易時段結束前,無法評估最終的日成交量。真正重要的是昨天的成交量特徵。上一根蠟燭顯示了在 0.045 附近強有力的防守。如果今天收盤接近 4,500 萬的均量,就驗證了這次突破。這裡出現死氣沈沈的成交量是一個警訊。 移動平均線 MA7 在 0.04579,MA14 在 0.04316,MA28 在 0.04140。移動平均線呈現完美的看漲排列(Bullish Fan),是強勁日線上升趨勢的明確指標。然而,目前價格約在 MA7 上方 9.7% 處。這種距離顯示價格過度延伸,跑得比動態基準線還快。MA7 是眼前的關鍵防線。它扮演了完美的跳板,在最近一次回調中成功接住了價格並再次啟動漲勢。除非這條斜率趨平,否則阻力最小的路徑依然是向上。 關注點位 • 0.05129 是局部高點及關鍵突破位。日線收盤站上此處將開啟價格發現空間。 • 0.04579 是 MA7。這是即時的動態支撐位,也是維持此趨勢必須守住的關鍵。 • 0.04548 是昨日流動性掃蕩的低點。跌破此處將破壞低點抬高的結構。 • 0.04316 是 MA14。若 MA7 失守,這裡是更深層的結構支撐。 • 0.03529 是整個擴張行情發源的宏觀底部。 市場考量 今天關鍵的發展在於訂單簿,買方佔 49%,賣方佔 51%。昨天我們看到的是 97% 買單過度集中的情況。散戶的亢奮情緒已被徹底洗出。意志不堅的籌碼已出局,市場已達到健康的平衡。這種平衡對於突破來說是看漲的。沒有堆積如山的被套多單會引發連鎖止損。阻力最小的路徑已清晰可見,若買方主力進場,市場可以在沒有上方賣壓阻礙的情況下順勢上漲。 交易計畫 • 看漲路徑:確認日線收盤站上 0.05129。這確認了宏觀上升趨勢的延續,並開啟進入純粹價格發現的走勢。我會在突破位回測時進場。 • 看跌路徑:在 0.05129 處出現強烈拒絕,留下長上影線,隨後日線收盤跌回 MA7(0.04579)下方。這確認了高點降低,並預示著回調至 MA14 的走勢。 • 我的觀點:型態很乾淨,但直接追高 0.05129 風險控管很差。我想觀察日線收盤情況。如果乾淨突破,我會等待回測再進場做多。如果受阻回調,在 MA7(0.04579)附近掛限價單買入,並將止損設在 0.04400 下方,是勝率較高的操作。 支撐與阻力 支撐位依序為 0.04579、0.04316 以及主要底部 0.03529。阻力位於即時高點 0.05129,圖表上暫無進一步的結構性阻力。 失效與風險提示 當日線收盤低於 0.04579 (MA7) 時,看漲論點失效。這裡最大的風險是假突破。在這種低流動性環境下,主力經常將價格推至阻力位上方以誘發散戶追漲,隨後拋售籌碼並讓日線收回區間內。 不要使用市價單。請使用限價單,等待日線收盤,並針對這種單日輕易波動 15% 的資產調整您的倉位大小。 $NIGHTUSDT
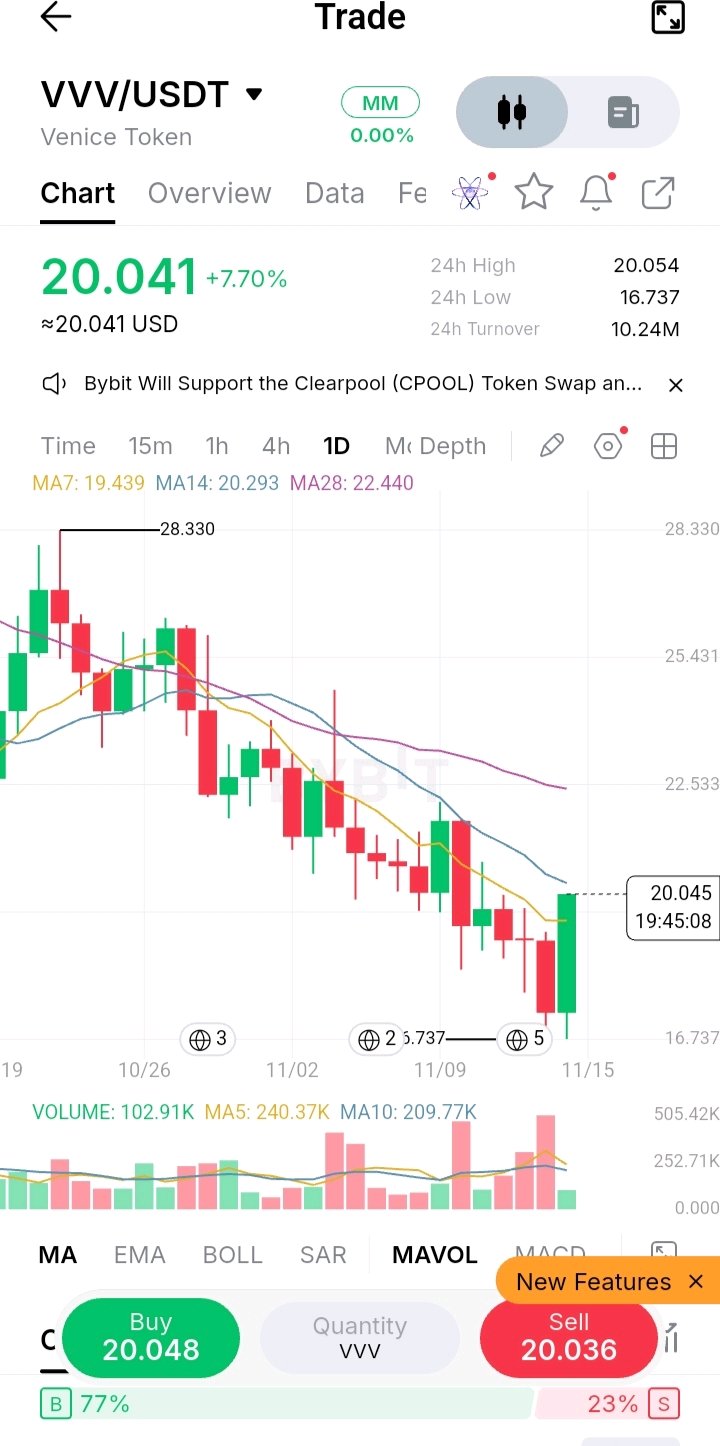
#ByXIMPACT $VVVUSDT 正試圖在日線圖上進行一次重大的日內反轉,目前交易價格為 20.041,日內漲幅達 7.70%。圖表顯示出一個殘酷且無情的宏觀下跌趨勢。價格從 28.330 的高點一路跌至 16.737 的波段低點,呈現持續失血狀態。 然而,今天的日線蠟燭圖正在進行反擊。它掃過了低點,留下了一根巨大的下影線,現在正積極向上推升,並重新站上了 7 日移動平均線。我們正目睹著典型的「V 型反彈」,但價格直接撞上了 14 日移動平均線。儘管宏觀結構依然極度看跌,但短期動能已經出現轉變。 成交額 24 小時成交額為 1,024 萬 USDT。在日線圖上,這個數值相對偏低。之前的重大利空下跌過程中,伴隨的是大量的成交額。目前的反彈僅基於溫和的資金流。這說明這只是對「超賣狀態」和「短期獲利了結」的反應,並非聰明錢(Smart Money)在大規模結構性建倉。 成交量 當前成交量為 102.91K,對比 5 日平均值 240.37K 和 10 日平均值 209.77K。令人驚訝的是,在這根巨大的陽線上,成交量竟然在萎縮。價格上漲迅速,但缺乏成交量的支撐。這種背離意味著買壓不足。需要提醒的是,日線蠟燭圖距離收盤還有 19 小時,數據仍會變動,但在低成交量支撐下的反彈,通常會被視為「死貓反彈」(dead cat bounce),除非後續有進一步驗證。 移動平均線 MA7 為 19.439,MA14 為 20.293,MA28 為 22.440。 價格已重回 MA7 上方,但目前正在挑戰 MA14。均線仍呈現典型的空頭排列(bearish fan)。除非日線能收在 MA14 之上,否則空頭在高時間框架上仍佔據優勢。MA7 開始走平,這是下跌趨勢力道減弱的第一個跡象。 觀察點位 • 20.293 是 MA14,為直接阻力位。日線收盤價若高於此處,是強勢的第一個真實信號。 • 19.439 是 MA7,為直接動態支撐位。守住此處才能延續反彈行情。 • 16.737 是今日低點,也是本次反彈的結構性地板。 • 22.440 是 MA28,為下一個主要上方壓力點。 • 28.330 是宏觀高點。 考量因素 訂單簿顯示買方佔 77%,賣方佔 23%,呈現嚴重傾斜。散戶正積極地試圖抄底(接住下落的飛刀)。雖然目前的蠟燭圖有強勁的陽實體和長下影線,但它正面臨 MA14 的直接阻力。如果在此處遇阻並收出更低的高點,將確認下跌趨勢依然未變。價差(spread)很緊,當前價格的流動性尚可,但日成交額依然偏低。 交易計畫 • 多頭路徑:日線收盤價高於 20.293 (MA14),且成交量放大至 240K 以上。這將確認短期趨勢轉變,並打開通往 MA28(22.440)的空間。 • 空頭路徑:在 MA14 遇阻並留下長上影線,隨後跌回 MA7(19.439)之下。這將困住那 77% 的買方,並推動價格再次下探 16.737 的低點。 • 我的看法:我不會在這根陽線直接撞擊阻力時買入。成交量太弱,不足以信任這次反彈。我會等待日線收盤的結果。如果收在 MA14 之上,我會尋找回測時做多的機會。如果在此處受阻,我會尋找跌破 MA7 時做空的機會,目標回到低點。 支撐與阻力 支撐位位於 19.439,其次是 16.737。阻力位位於 20.293,其次是 22.440,以及宏觀高點 28.330。 失效與風險提示 當日線收盤高於 20.293 時,看跌論點失效。最大的風險是「軋空」(short squeeze)。由於 77% 的訂單簿為多單,且正處於急劇反彈中,若收盤站上 MA14,可能會迫使空頭激進回補。然而,在確認收盤前買入反彈是有風險的。請使用限價單並耐心等待日線收盤。當前的日線柱狀圖距離關閉還早得很。
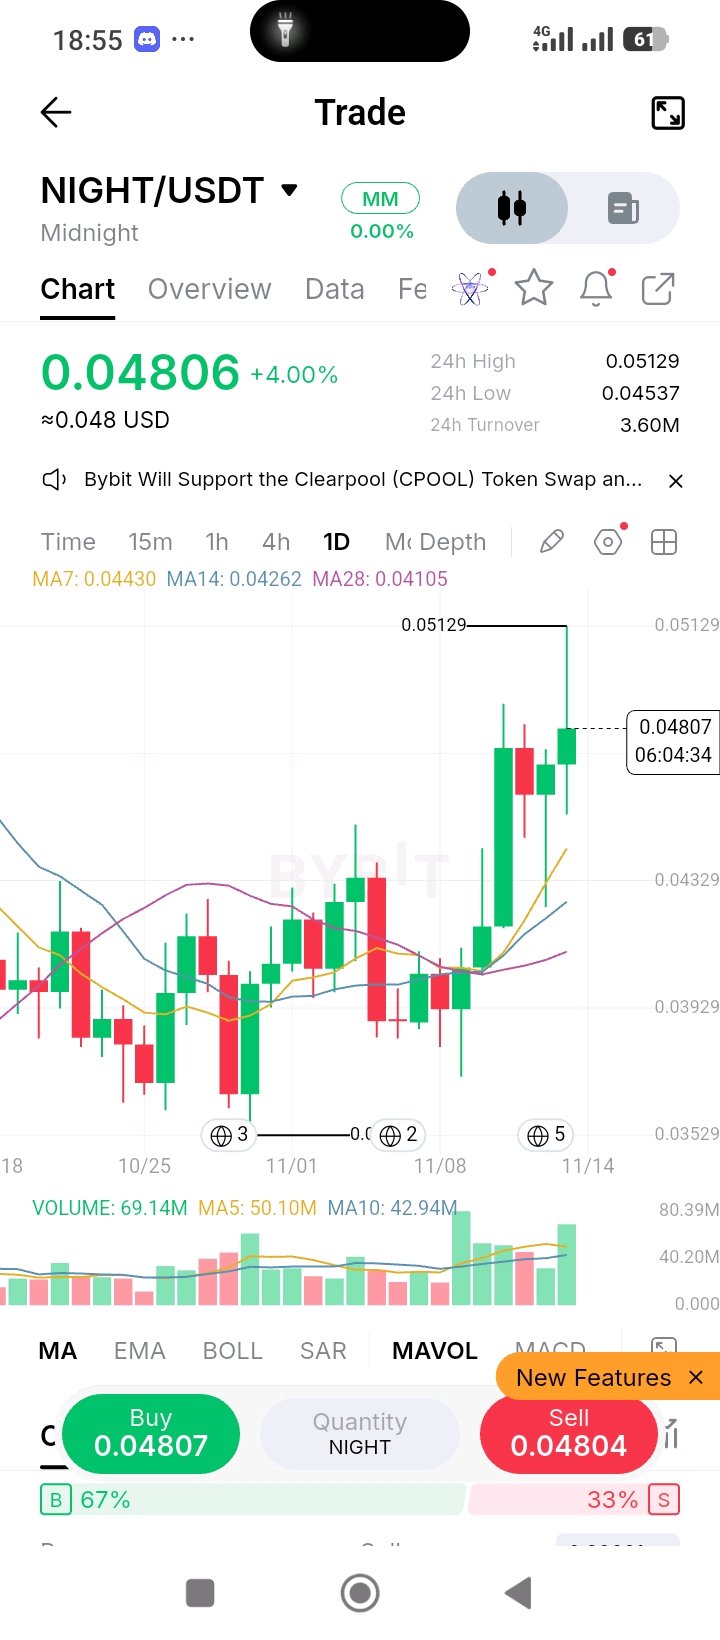
#ByXIMPACT $NIGHTUSDT is showing a textbook post pump consolidation on the Daily chart, currently trading at 0.04806, up 4.00% on the day. This is a follow up to the previous setup we looked at. Price pushed up to a local high of 0.05129 but faced a sharp rejection, leaving an upper wick on the previous daily candle. However, the current daily candle tells a different story. Instead of cascading lower, price dipped to a low of 0.04537, found buyers, and is now pushing back up to form a green body. The market is digesting the massive move from the 0.035 base. The structure remains intact as long as we hold above the daily moving averages. Turnover 24 hour turnover is still incredibly thin at just 3.60M USDT. On a daily chart, this remains a massive liquidity vacuum. Even though the price is moving, the absolute capital backing it is very small. This means the order book is thin, and price can move violently in either direction with very little friction. You are trading in a highly manipulated environment. Volume Current volume is 69.14M against a 5 day average of 50.10M and a 10 day average of 42.94M. This is the most important data point on the chart. Despite the pullback from the highs, volume is actually expanding on this current daily candle. Buyers are stepping in with size to defend the dip. This is a bullish signature. The caveat is that the daily candle is still open with 6 hours remaining, so volume and price can change before the close. Moving Averages MA7 is at 0.04430, MA14 is at 0.04262, and MA28 is at 0.04105. Price is still trading above all three moving averages, currently sitting about 8.5% above the MA7. The averages are stacked in a strong bullish fan. The MA7 is acting as the immediate dynamic support. The distance between price and the MA14 is still wide, showing the daily trend is stretched but holding. Levels to Watch • 0.05129 is the immediate high and the local resistance. A daily close above this confirms the continuation. • 0.04430 is the MA7. The critical dynamic support. Losing this on a daily close breaks the current structure. • 0.04262 is the MA14. The next major floor if the MA7 fails. • 0.03529 is the origin of the entire move. The macro invalidation. Consideration The order book has shifted since our last look. It now shows 67% buyers and 33% sellers. Retail is still long biased, but the extreme 97% skew has cooled off, which is healthier for the chart. The current candle shape shows a lower wick, proving buyers are actively defending the 0.045 to 0.046 zone. The spread is tight, and the market is attempting to front run a breakout above the local high. Trade Plan • The Bullish Path: A daily close above 0.05129 with volume holding above 50M. That opens a run into price discovery toward the 0.055 region. • The Bearish Path: A daily rejection here, followed by a close below the MA7 at 0.04430. That traps the recent buyers and sends price flushing toward the MA14 at 0.04262. • My take: The expanding volume on the dip is a promising sign. I would not chase the green candle here in the middle of the range. I want to see a daily close. If it closes strong, I will look for an intraday pullback to enter long. If it rejects the 0.05129 high and loses the MA7 on a daily close, I will look for a short down to the MA14. Support and Resistance Support rests at 0.04430, followed by 0.04262 and the major floor at 0.03529. Resistance sits at the current high of 0.05129. Invalidation and Risk Note The bullish thesis is dead on a daily close below 0.04430 (MA7). The biggest risk remains illiquidity. A daily turnover of 3.60M means a single whale can wipe out the bid depth and crash the price. Do not use market orders. Use limit orders, wait for the daily close, and size your position for a market that can swing 15% in a day.
#ByXIMPACT $NIGHTUSDT 在日線圖上正處於拋物線式突破中,目前交易價格為 0.05052,單日大漲 12.87%。我們正在觀察日線級別的走勢,這意味著這根單一的綠色 K 線代表了一整天持續不斷的買壓。 價格在 0.035 低點附近進行了幾天的窄幅盤整後向上爆發,拉出了三根強勁的日線連陽。當前這根 K 線正衝擊 0.05095 的局部高點。圖表上目前看不到上方的結構阻力,意味著資產處於純粹的價格發現階段,但這種垂直向上的角度對任何追高的人來說都是一個巨大的警訊。 成交額 24 小時成交額非常稀薄,僅為 256 萬 USDT。在日線圖上,這是一個流動性真空。這說明巨大的價格擴張是建立在很少的實際資金基礎上。當日線圖僅憑 250 萬的成交額就拉出 12% 的漲幅時,意味著訂單簿(Order Book)很薄,摩擦力很小。拉抬價格很容易,但一旦買盤停止,崩盤也會同樣容易。 成交量 當前成交量為 4422 萬,而 5 日均量為 4512 萬,10 日均量為 4045 萬。成交量完全處於平均水準。這是一個關鍵細節。儘管價格大幅飆升,但並沒有相應的巨量支撐。這是一個背離訊號。價格是靠動能和稀薄的流動性在運行,而不是靠大量的機構現貨買盤。 移動平均線 MA7 在 0.04465,MA14 在 0.04280,MA28 在 0.04114。 看看當前價格與移動平均線之間的距離。價格比 MA7 高出約 13%,比 MA28 高出超過 22%。這是極度的過度延伸。日線移動平均線排列成漂亮的牛市扇形,但橡皮筋已經被拉到了極限。回歸均值的回調極有可能發生。 關注點位 • 0.05095 是即時高點。如果收盤價高於此點位,即為突破觸發點。 • 0.04465 是 MA7。這是第一個主要的動態支撐位,也是維持此趨勢必須守住的關卡。 • 0.04280 是 MA14。如果 MA7 失守,這裡是結構性地板。 • 0.03529 是整個行情的起點。這是宏觀上的失效點位。 考量 看看底部的訂單簿。顯示 97% 為買方,3% 為賣方。這是一個巨大的、閃爍的紅色警示燈。散戶正湧入日線拋物線走勢的絕對頂部。群眾幾乎全部做多。當 97% 的訂單簿位於一側時,造市商(Market Maker)通常會去獵殺那些流動性。價差(Spread)很窄,這很好,但散戶倉位極度失衡,意味著發生暴力「多頭擠倉」(Long Squeeze)的風險極高。 交易計畫 • 看漲路徑:日線收盤高於 0.05095,且成交量終於放大。這能讓拋物線動能維持住,開啟下一波漲勢。 • 看跌路徑:出現日線級別的拒絕 K 線,隨後收盤低於 MA7(0.04465)。這將困住 97% 的多頭,並將價格沖向 MA14(0.04280)。 • 我的看法:我絕對不會在 97% 做多偏斜且沒有成交量支撐的情況下,去買入這根垂直的日線 K 線。趨勢中應該在回調時買入,而不是在拋物線延伸的頂部追價。我會等待深度回調至 MA7(0.04465)。如果價格觸及該水準並收出強勁的看漲反轉 K 線,我可能會考慮做多。如果日線收盤失守 MA7,我會考慮順勢做空,目標看向 MA14。 支撐與阻力 支撐位位於 0.04465,其次是 0.04280 和主要地板 0.03529。阻力位於當前高點 0.05095。 失效與風險提示 看漲論點在日線收盤低於 0.04465 (MA7) 時失效。這裡最大的風險在於流動性不足。由於 24 小時成交額僅 256 萬,一筆來自巨鯨(Whale)的大額賣單就可能抹去所有可見的買單深度。不要使用市價單,也不要追這根綠色 K 線。等待日線收盤來確認這是一次真正的突破,還是一次流動性掃蕩。
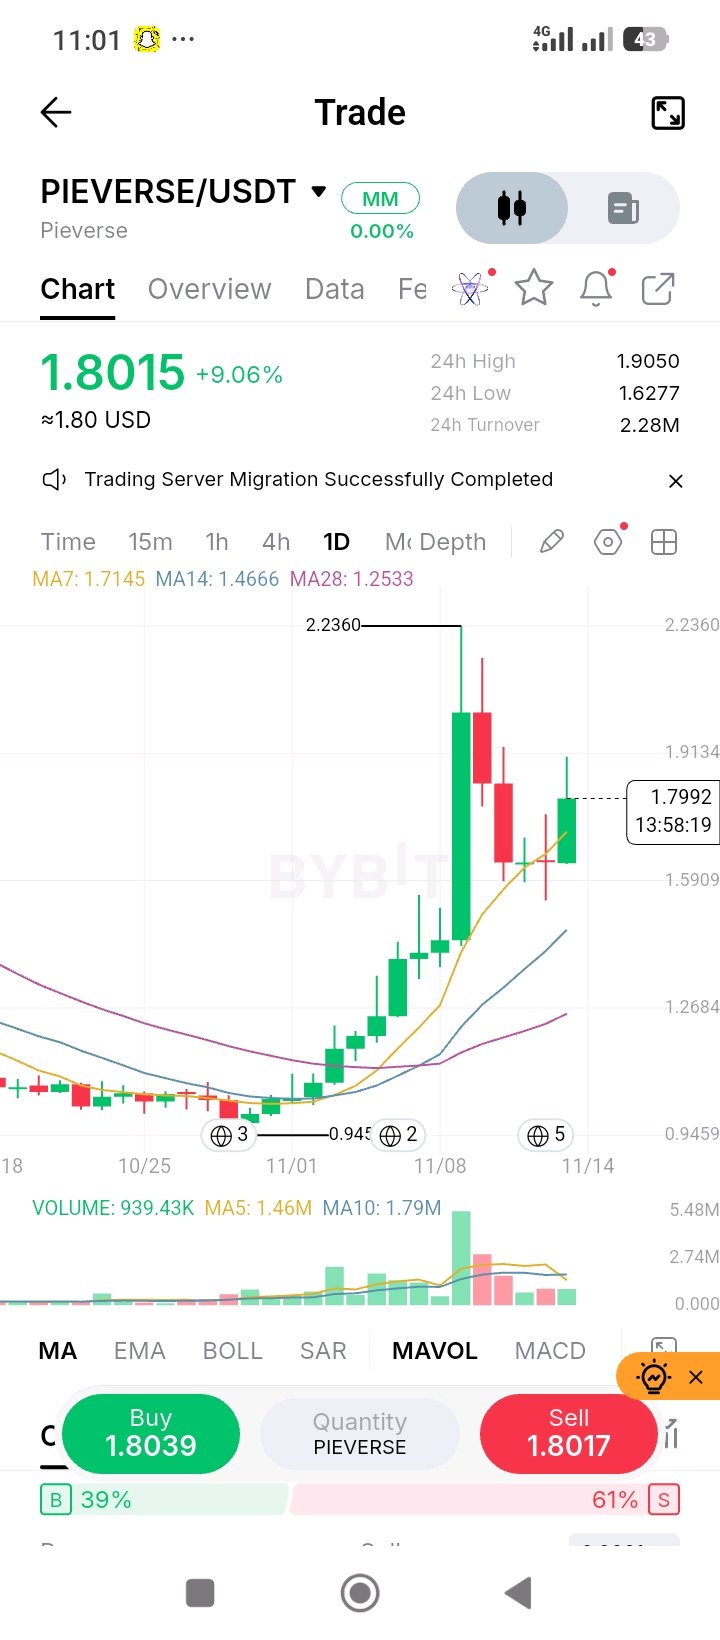
# ByXIMPACT $PIEVERSEUSDT 在 1 日線圖上呈現大規模暴漲後的盤整,目前交易價格為 1.8015,當日上漲 9.06%。這張圖表講述了一個極端擴張後竭力守住漲幅的故事。價格從 0.9459 的基點一路飆升至 2.2360 的高點,拉出了一根巨大的垂直日線實體。 自從觸及該峰值後,我們看到了一根劇烈的回調K線和一天的回調下跌,買盤剛好在 7 日移動平均線處獲得支撐。當前的日線呈綠色,從該支撐位反彈,但與之前暴漲的走勢相比,其實體小得多。市場正在喘息,但仍被困在 1.9050 的局部高點之下。 成交額 24 小時成交額非常稀薄,僅為 228 萬 USDT。在日線圖上,這簡直是流動性真空。這說明我們所看到的巨大價格波動,實際上是建立在非常少的資金基礎上的。當一個代幣在日成交額極低的情況下出現如此大的波動,意味著訂單簿非常薄弱,且市場很容易被操縱。你交易的不是流動性資產,而是一個高度波動的小盤股代幣。 成交量 當前成交量為 93.943 萬,對比 5 日平均值 146 萬和 10 日平均值 179 萬,成交量正在急劇萎縮。最初的拉升伴隨著參與度的激增,但最近的回調和當前的反彈卻發生在成交量下滑的過程中。這是一個經典的背離訊號。買家並沒有拿出足夠的資金將價格推回高點,他們只是任由價格在流動性匱乏的情況下漂浮上漲。 移動平均線 MA7 位於 1.7145,MA14 位於 1.4666,MA28 位於 1.2533。 這些均線呈現出劇烈的看漲排列,但看看 MA7 和 MA14 之間的距離,價格的交易位置比 MA14 高出 22% 以上。這是極端的過度擴張。當前價格正在利用 MA7 作為跳板,但如果日線收盤跌破該線,圖表很可能會向 MA14 進行劇烈的均值回歸。 需關注的點位 • 2.2360 是絕對高點,即拉升的頂峰。 • 1.9050 是即時的日線阻力位。需要日線收盤高於此處才能延續上漲趨勢。 • 1.7145 是 MA7。這是目前的「沙中防線」(關鍵支撐)。守住這裡才能維持反彈。 • 1.4666 是 MA14。如果 MA7 失守,這是下一個主要的結構性支撐位。 • 0.9459 是整個行情運作的起始點。 看法 訂單簿顯示買方佔 39%,賣方佔 61%。散戶嚴重偏向做空,試圖抓到拉升的頂部。然而,他們正在對抗日線移動平均線的支撐。目前的日線型態有些猶豫不決,下影線顯示買家正在捍衛 MA7,但缺乏突破初期那種激進的買盤成交量。這看起來像是典型的「死貓反彈」格局。 交易計畫 • 看漲路徑:日線收盤價帶量重新站上 1.9050。這將清除局部供應,並開啟對 2.2360 高點的重新測試。 • 看跌路徑:日線收盤價跌破 MA7(1.7145)。這將打破當前的支撐結構,並打開通往 MA14(1.4666)的下行空間。 • 我的觀點:我不會買入這次的日線反彈。成交量枯竭,且價格位於 MA14 之上 22% 的位置。日線崩跌的風險太高。我會等待價格更深地回調至 1.4666 至 1.5000 區間(MA14 附近)再考慮波段做多。如果日線收盤跌破 MA7,我會尋求做空至 MA14。 支撐與阻力 支撐位於 1.7145,其次是 1.4666,以及 0.9459 的主要底部。阻力位於 1.9050,其次是 2.2360 的主要峰值。 失效與風險提示 若日線收盤跌破 1.7145(MA7),看漲觀點即告失效。這裡最大的風險是日線崩盤。由於成交量極其稀薄(228 萬成交額),一旦支撐破位,將沒有足夠的掛單深度來承接跌勢。單筆大額賣單就足以使其單日下跌 20%。 請勿使用市價單。請等待日線收盤。
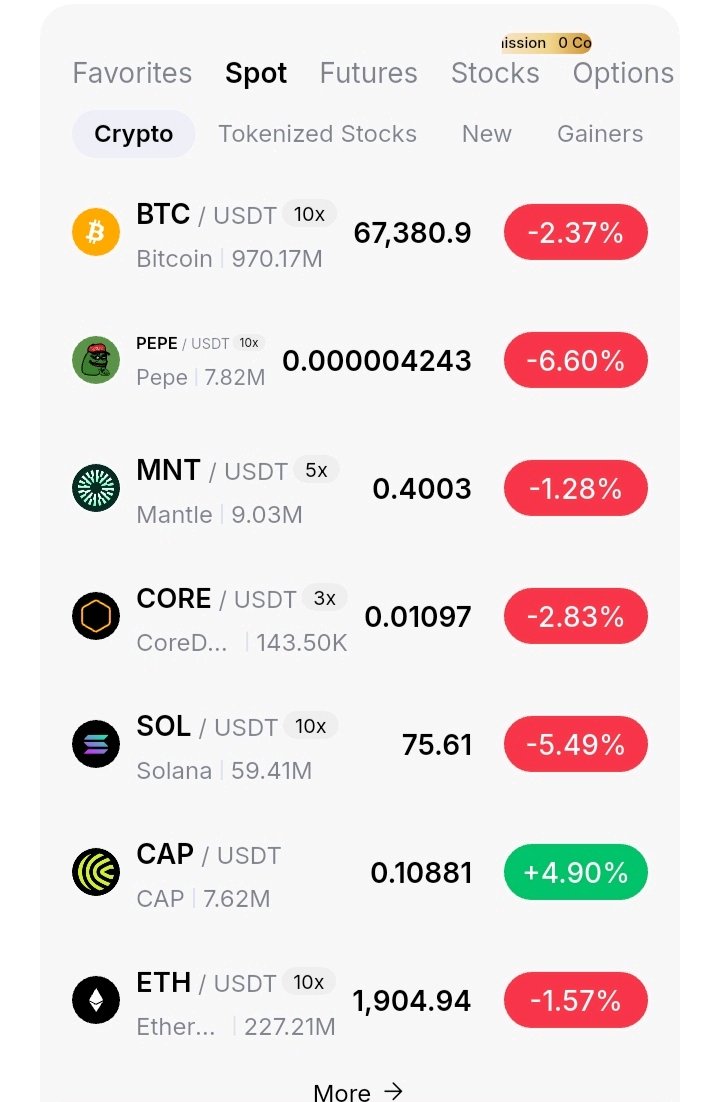
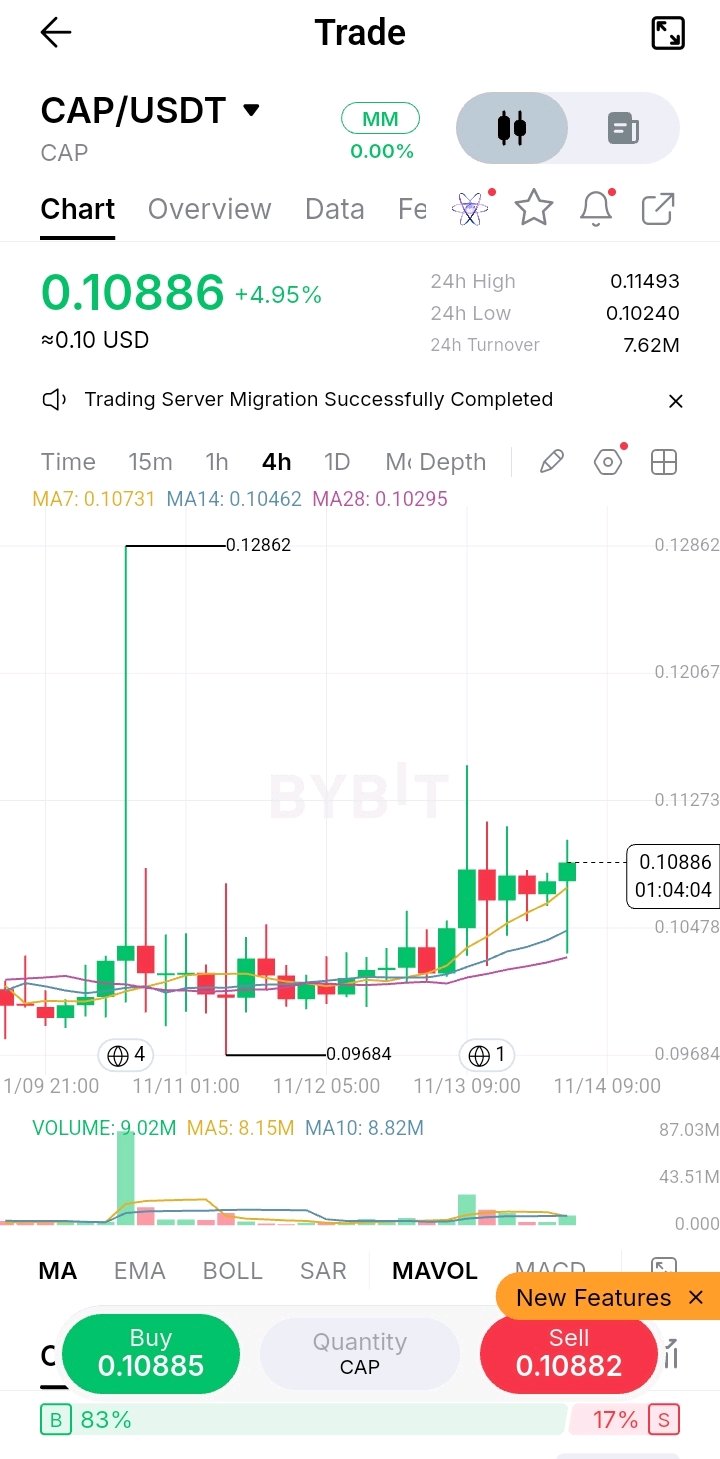
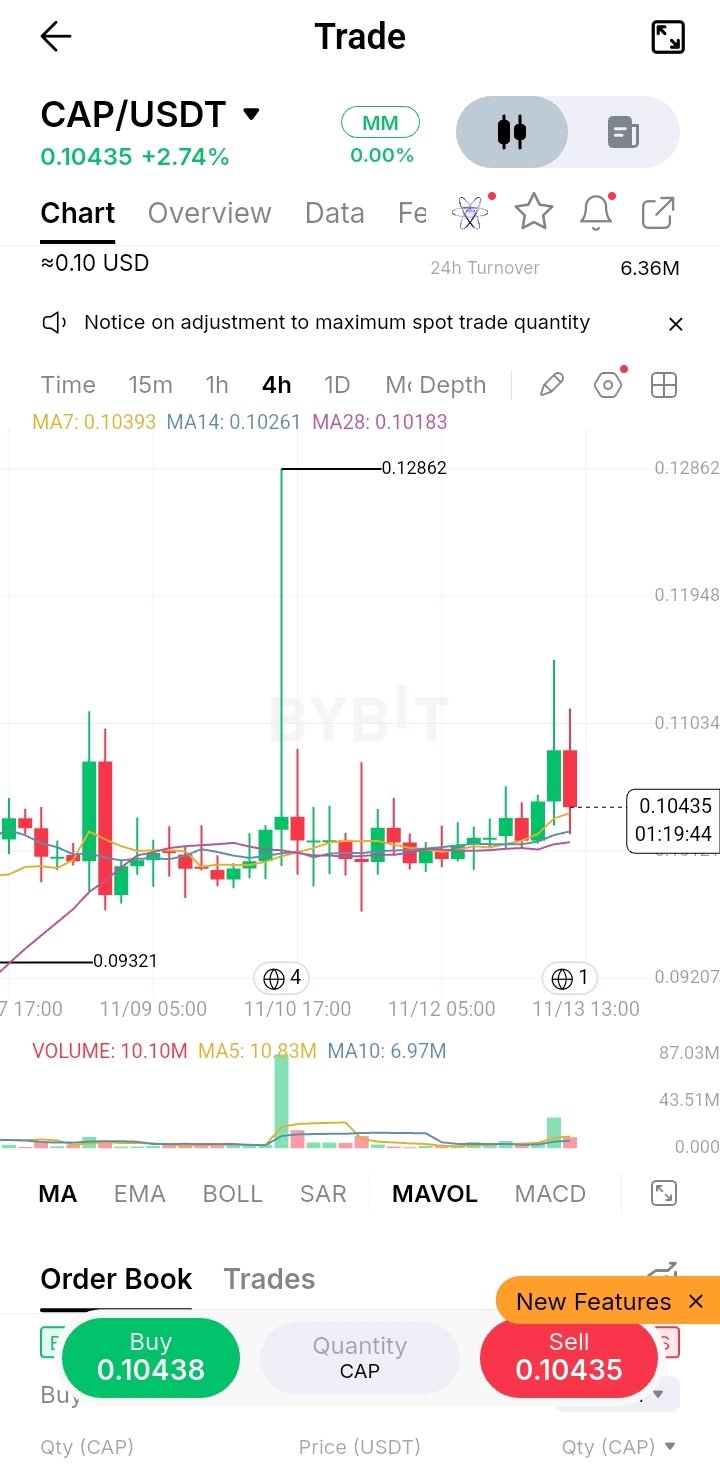
#ByXIMPACT $CAPUSDT is showing a clear display of relative strength on the 4 hour chart, currently trading at 0.10886, up 4.95% on the day. While the broader crypto market is bleeding, with BTC dropping below $69,000 and SOL hitting multi-month lows, CAP is holding its ground and building a base above its moving averages. The defining feature of this chart remains the massive liquidity sweep. Price previously shot to 0.12862, leaving a colossal upper wick, before dumping to 0.09684. Recently, price has coiled tightly above its moving averages, and the current 4 hour candle is green and pushing higher. However, the asset is still trading below the upper wick, showing that overhead supply remains a factor. Turnover 24 hour turnover is 7.62M USDT. Because this is a 4 hour chart, the average turnover per candle is roughly 1.27M USDT. The visual profile shows that the heaviest turnover was concentrated during the initial spike and dump. The current consolidation and grind higher are happening on moderate, steady turnover, which is a healthy sign. It indicates that buyers are accumulating on dips rather than just chasing a violent pump. Volume The current highlighted volume is 9.02M against an MA5 of 8.15M and an MA10 of 8.82M. The current bar is running slightly above both averages, showing that participation is expanding as price pushes up. This is a bullish volume signature. The dead volume often seen in low liquidity pumps is absent here, replaced by consistent trading activity. The 4 hour candle is still open with 1 hour and 4 minutes remaining, so volume will continue to build. Moving Averages MA7 is at 0.10731, MA14 is at 0.10462, and MA28 is at 0.10295. The averages are stacked in a perfect bullish fan, and price is riding above all three. This tight cluster between 0.10295 and 0.10731 is acting as a thick dynamic support floor. As long as price holds above the MA28, the short term structure remains constructive. Levels to Watch • 0.12862 is the swing high and the ultimate resistance. The liquidity sweep level that must be reclaimed. • 0.11493 is the immediate 24 hour high and the first local hurdle. • 0.10731 is the MA7. The immediate dynamic support and current battleground. • 0.10295 is the MA28. The structural floor of the moving average cluster. • 0.09684 is the macro swing low where the initial expansion originated. Consideration The fundamental backdrop here is critical. CAP is the native token of an on chain credit and stablecoin yield protocol positioned at the intersection of RWA and institutional finance, with verified backing from Franklin Templeton, Susquehanna, and GSR. The protocol has real business, with over $4 billion in cumulative credit volume and TVL exceeding $330 million. However, the structural risks are severe. The circulating supply is extremely low, with roughly 84% of the 10 billion total supply still locked, creating a massive dilution overhang. On chain data shows the top four addresses control 82.55% of the supply, meaning this is a market dominated by whales. The recent rally was reportedly driven by a short squeeze on KuCoin rather than a fundamental catalyst, which is a transient driver. The order book on the chart shows a heavy 83% buy skew, indicating retail is piling in. This combination of low float and heavy retail long positioning makes the asset vulnerable to a sharp long squeeze if support breaks. Trade Plan • The Bullish Path: A 4 hour close above 0.11493 with volume expanding above 9M. That clears the local supply and opens a run to retest the 0.12862 sweep high. • The Bearish Path: A close under 0.10731 (MA7) sends price to retest the 0.10295 (MA28) cluster. A break there exposes the 0.09684 swing low. • My take: I am not chasing this in the middle of the range. The fundamental narrative is strong, but the token structure is weak, and the broader market is selling off. I would wait for a pullback into the 0.10295 to 0.10500 zone to look for a long with a tight stop below 0.09800, targeting a bounce back to the 0.11500 region. A confirmed breakout above 0.11500 on strong volume is the safer momentum entry. Support and Resistance Support rests at 0.10731, followed by 0.10295 and the major floor of 0.09684. Resistance sits at 0.11493, followed by the major 0.12862 sweep high. Invalidation and Risk Note The bullish read is invalidated on a 4 hour close below 0.10295 (MA28). The biggest risk here is a long squeeze. The low float and high whale concentration mean that if support cracks, the exit liquidity is thin, and the 83% of retail buyers will be forced to sell into a vacuum. The broader market weakness in BTC and SOL is a macro headwind that could drag CAP down regardless of its relative strength. Use limit orders exclusively, and wait for confirmed 4 hour closes. The current 4 hour bar is still open, so its shape can change before the close.
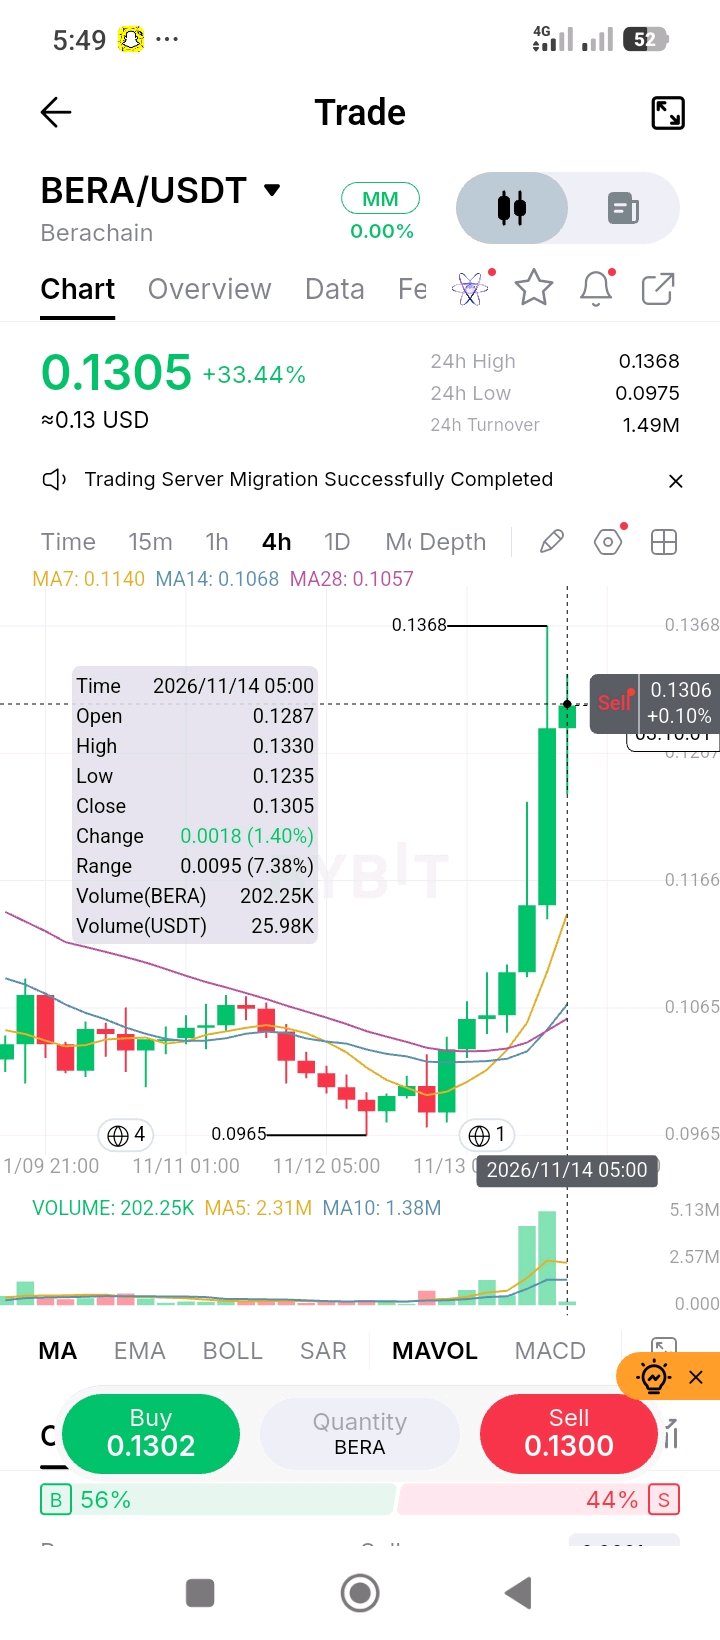
#ByXIMPACT $BERAUSDT is printing a violent, vertical V-shaped recovery on the 4-hour chart, currently trading at 0.1305, up a massive 33.44% on the day. The market structure on this timeframe has completely flipped, with price rocketing from a 0.0965 swing low to a local high of 0.1368. However, this price action must be viewed through the lens of the macro reality. This is a dead-cat bounce, not a trend reversal. Verifiable data shows BERA is down roughly 98% from its September 2026 all-time high near $7.48 to $9.18, and down over 99% from its $14.83 launch high, with the entire network's Total Value Locked (TVL) collapsing from a $3.3 billion peak to just $26 million to $37 million. The highlighted 05:00 candle opened at 0.1287, pushed to 0.1330, and closed at 0.1305, leaving a significant lower wick down to 0.1235. This confirms that while buyers are stepping in for a trade, the underlying asset is fundamentally broken. Turnover 24-hour turnover is extremely thin at just 1.49M USDT. For a 4-hour chart, this means the average turnover per candle is roughly 248K USDT. The tooltip for the highlighted 05:00 candle shows just 25.98K USDT traded in that window. The real volume happened during the initial vertical breakout, not during this consolidation at the highs. This low absolute turnover makes the price action highly susceptible to erratic wicks and manipulation. Volume The highlighted candle's volume is 202.25K against an MA5 of 2.31M and an MA10 of 1.38M, running at a mere 0.08 times the 5-period average. This is a massive volume contraction. The visual profile shows that the actual breakout was driven by spikes near 5.13M, but the current dead volume at 0.1300 indicates a severe lack of aggressive buyers willing to chase the price. In a low-liquidity environment, this divergence often precedes a sharp pullback. Moving Averages MA7 is at 0.1140, MA14 is at 0.1068, and MA28 is at 0.1057. The averages are in a steep bullish fan, but the price is dangerously overextended, trading roughly 14% above the MA7. This extreme distance from the baseline makes a mean-reversion pullback mathematically highly probable. Levels to Watch • 0.1368 is the 24-hour high and the current swing peak. The immediate breakout trigger. • 0.1305 is the current price and the close of the highlighted candle. • 0.1235 is the low of the highlighted candle. Losing this on a close confirms the immediate pullback. • 0.1140 is the MA7. The first logical dynamic support and pullback zone. • 0.1068 is the MA14. The structural floor of this recent speculative move. Consideration The most critical factor here is the verifiable fundamental deterioration. On November 5, 2026, BERA faced a massive $81 million token unlock, which was equal to its entire market capitalization at the time, posing a severe supply overhang. Furthermore, the project's July 2026 "PoL Next" hard fork, which deprecated the BGT token and shifted rewards to sWBERA, has failed to restore confidence or stabilize demand, with TVL continuing to bleed out. Adding to the caution, Binance only recently reopened withdrawals for BERA on November 13, 2026, after a temporary suspension, which may have contributed to the volatile price action. With over 200 million BERA tokens (roughly 38% of supply) still locked with no confirmed unlock schedule, the dilution risk remains enormous. This is a fundamentally distressed asset experiencing a low-liquidity speculative pump. Trade Plan • The Bullish Path: A 4-hour close above 0.1368 with a massive surge in volume. That opens a run into price discovery, but given the fundamental backdrop, this is a low-probability scenario. • The Bearish Path: A close under 0.1235 sends price to retest the 0.1140 (MA7). If the MA7 breaks, the MA14 at 0.1068 is the next target, and a full retracement to the 0.0965 origin remains on the table. • My take: I am absolutely not buying this vertical extension. The combination of 14% overextension above the MA7, dead volume, and a fundamentally broken token with a massive supply overhang makes this a trap. I would wait patiently for a pullback into the 0.1140 to 0.1200 zone. I want to see a confirmed bullish rejection candle there before even considering a short-term long. If it breaks the MA7 on a close, I would look for short momentum down to the MA14. Support and Resistance Support rests at 0.1235, followed by 0.1140 and the major floor of 0.1068. Resistance sits solely at the 0.1368 swing high. Invalidation and Risk Note The bullish read is invalidated on a 4-hour close below 0.1140 (MA7). The biggest risk here is a violent retracement. A 33% pump on thin liquidity and deteriorating fundamentals can easily retrace 15% to 20% in a heartbeat, especially with the November unlock still weighing on market sentiment. Do not use market orders. Use limit orders and wait for confirmed 4-hour closes before acting. The current 4-hour bar is still open, so its shape can change drastically before the next print.
#ByXIMPACT $XAUTUSDT is in a sustained downtrend on the 4 hour chart, currently trading at 3,875.28, up a marginal 0.02 percent on the day. The market structure is heavily bearish. Price has cascaded from a structural high of 4,130.11 down to a recent swing low of 3,851.40. Looking at the current price action, the aggressive selling has paused. The last several 4 hour candles are printing small bodies and dojis, indicating the market is trying to find a temporary floor. However, there is no strong buying pressure stepping in. The price is simply drifting sideways at the bottom of the range after a violent flush, leaving the macro bias firmly to the downside. Turnover 24 hour turnover is 7.96M USDT. Because this is a 4 hour chart, a 24 hour period consists of 6 candles, meaning the average turnover per candle is roughly 1.32M USDT. The visual turnover peaked heavily during the drop from 4,100 down to the current lows. The current sideways chop is happening on declining turnover, suggesting seller exhaustion but also a complete lack of buyer conviction. Volume The current highlighted volume is extremely low relative to the moving averages. The visual volume profile shows red bars dominating the recent decline, with the green bars during this pause being noticeably smaller. This indicates the market is catching its breath. The caveat is that low volume consolidation in a downtrend usually resolves to the downside, as it represents a lack of demand rather than accumulation. Moving Averages MA7 is at 3,884.84, MA14 is at 3,920.79, and MA28 is at 3,995.62. The averages are stacked in a perfect, widening bearish fan. Price is currently trading below all three, pinned down by the MA7. The distance between the MA7 and MA28 is wide, confirming the strength of the macro downtrend. Until price can reclaim the MA7 on a closing basis, the bears remain in full control. Levels to Watch • 3,851.40 is the current swing low. Losing this level opens the door to a deeper flush. • 3,884.84 is the MA7. The immediate dynamic resistance. Reclaiming it is the first sign of life. • 3,920.79 is the MA14. The first major structural hurdle for any bounce. • 4,130.11 is the macro high and the ultimate resistance. Consideration Tether Gold is a tokenized asset that tracks the spot price of physical gold. This means the technicals are highly influenced by traditional macro factors and the underlying commodity market, rather than just crypto native flows. The spread on the chart is extremely tight, indicating deep liquidity. The current candle shape shows a slight upper wick, meaning sellers are still active on minor pushes. The lack of a strong lower wick on the swing low means the floor is still vulnerable. Trade Plan • The Bullish Path: A 4 hour close above 3,884.84 (MA7) with an expansion in volume. That opens a relief bounce to test the 3,920.79 (MA14). • The Bearish Path: A close under 3,851.40 continues the macro downtrend, opening a move toward the 3,800 psychological level. • My take: I am not trying to catch this falling knife while price is pinned under the MA7. I would wait for a confirmed 4 hour close above 3,884.84 to look for a short term long scalp toward the MA14. If price rejects the MA7 and prints a bearish reversal candle, I would look for a short back down to the lows. Support and Resistance Support rests at 3,851.40, followed by the 3,800 psychological level. Resistance sits at 3,884.84, followed by 3,920.79 and the major 3,995.62 region. Invalidation and Risk Note The bearish read is invalidated on a 4 hour close above 3,920.79 (MA14). The biggest risk here is a sudden macro shift in the spot gold market that causes a gap in the tokenized price. Because this asset moves slower than high beta altcoins, volatility is lower, but patience is required. Use limit orders and wait for confirmed 4 hour closes. The current bar is still open, so its shape can change before the close.
ByXIMPACT $CAPUSDT 在 4 小時線圖上呈現出波動劇烈、長影線頻繁的結構,目前交易價格為 0.10435,日內上漲 2.74%。此圖表最顯著的特徵是大規模的流動性掃蕩。價格先前曾急劇拉升至 0.12862 的極端高點,留下一根巨大的上影線,隨後立即遭拋售並回落至 0.09321 的底部。 近期,價格試圖再次向上推升,但目前的 4 小時K線又拉出一根長上影線,顯示賣方正在積極防守上方壓力區。市場目前被困在這個寬幅震盪區間的中間,在均線上方緊縮盤整,等待明確的方向性催化劑。 成交額 24 小時成交額為 636 萬 USDT。由於這是 4 小時線圖,平均每根K線的成交額約為 106 萬 USDT。從視覺形態來看,絕大多數的成交額發生在最初衝高至 0.12862 的那波急漲急跌期間。目前的盤整階段成交額明顯萎縮,顯示市場處於觀望態度。 成交量 當前標記的成交量為 1010 萬,對比 MA5(5 期均線)的 1083 萬與 MA10(10 期均線)的 697 萬。目前的K線成交量約為 5 期平均值的 0.93 倍,但卻是 10 期平均值的 1.45 倍。左側巨大的綠色成交量柱完美對應了 0.12862 的影線,證實了那是一次資金流驅動的事件。目前的成交量尚可,但缺乏突破上方供給區所需的強勁衝擊力。當前 4 小時K線尚未收盤,距離結束還有 1 小時 19 分鐘。 移動平均線 MA7 為 0.10393,MA14 為 0.10261,MA28 為 0.10183。 均線呈現多頭排列,價格目前正穩穩落在 MA7 上方。0.10183 到 0.10393 之間的緊密區間正作為穩固的動態支撐基礎。只要價格能守在 MA28 之上,短期結構就依然完好。 關注點位 • 0.12862 為波段高點與最終壓力位。這是造市商的流動性掃蕩點位。 • 0.10393 為 MA7。即時動態支撐與目前的交戰區。 • 0.10183 為 MA28。均線密集區的結構性地板。 • 0.09321 為最初漲勢發起的宏觀波段低點。 觀察與建議 買賣價差(Spread)極小,買單 0.10438 對賣單 0.10435,顯示儘管影線極端,但流動性依然深厚。目前的主要顧慮在於K線形態。市場已兩度在 0.11 到 0.12 的上方區域遭遇拒絕,這導致上方堆積了大量的套牢買盤。目前的價格走勢正在築底,但除非能收復那些上影線,否則阻力最小的路徑仍是震盪盤整。 交易計劃 • 看漲路徑:4 小時收盤價站上 0.11000,且成交量擴大至 1083 萬以上。這將清除眼前的短期供給,並打開重新測試 0.12862 影線的空間。 • 看跌路徑:收盤跌破 0.10183 (MA28),破壞均線支撐區,價格將回測 0.09321 的結構性低點。 • 個人觀點:我不會在區間中間操作。影線太過隨機且成交量正在衰減。我會等待價格回踩至 0.10183 到 0.10393 區域,再尋找做多機會,並將止損設在 0.09800 下方。或者,等待確認突破 0.11000 後,再進行較安全的動能交易。 支撐與壓力 支撐位位於 0.10393,其次是 0.10183,以及關鍵地板 0.09321。壓力位位於 0.11000 附近的局部影線高點,以及 0.12862 的主要掃蕩高點。 失效與風險提示 看漲觀點在 4 小時收盤跌破 0.10183 (MA28) 時失效。最大的風險在於再次出現突發性的流動性掃蕩。該資產已證明能在單一 4 小時窗口內出現 20% 的劇烈影線波動,因此市價單(Market orders)將會遭受懲罰。請務必使用限價單(Limit orders),並等待確認收盤。當前 4 小時K線尚未結束,收盤前的形態仍可能出現劇烈變化。
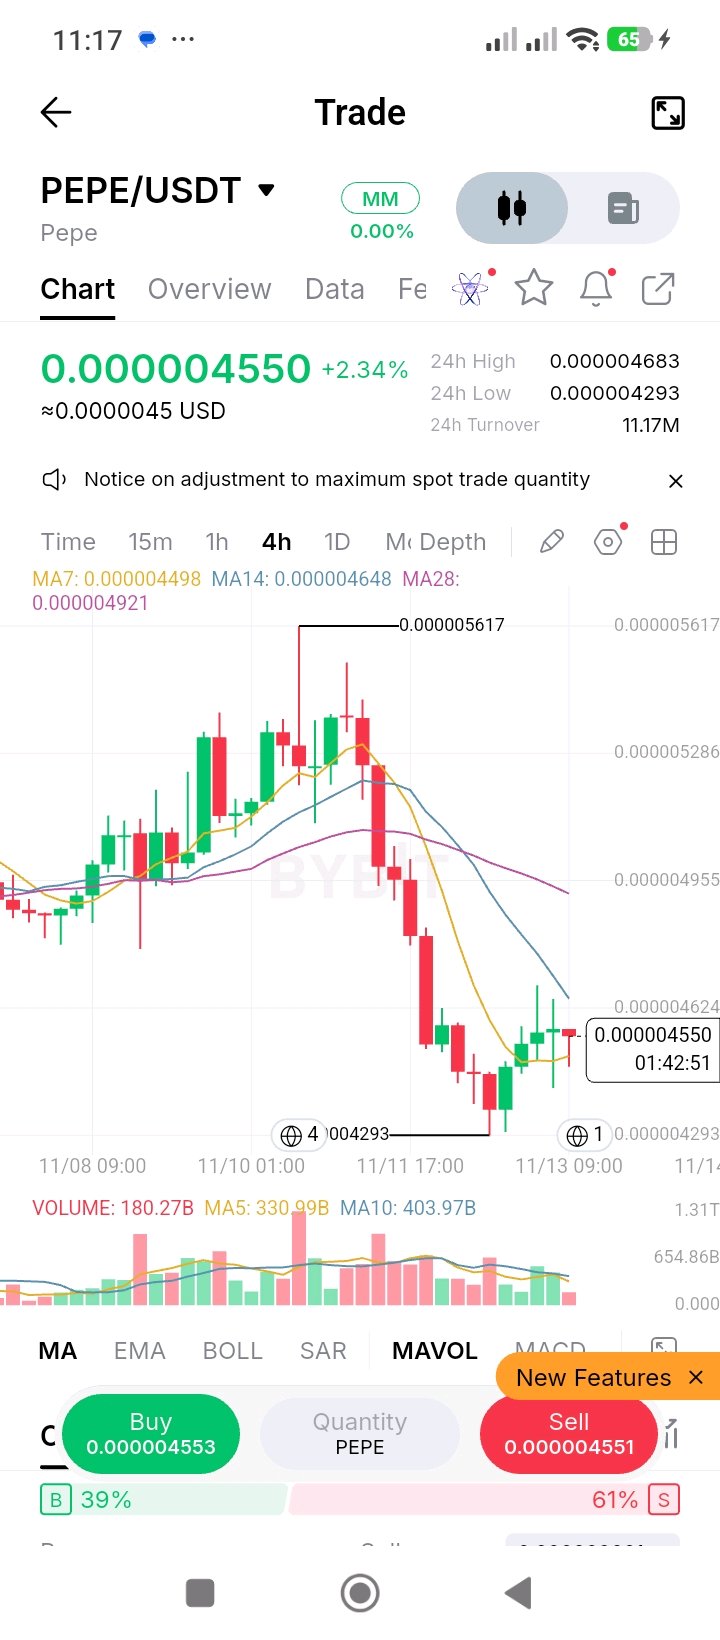
#ByXIMPACT $PEPEUSDT 在經歷了一波急劇且持續的下跌趨勢後,正試圖在 4 小時圖上尋找底部。價格此前從 0.000005617 的高點崩跌至 0.000004293 的低點,但近期的蠟燭圖顯示買方正試圖進場守住地板價。目前該資產交易價格為 0.000004550,日內漲幅 2.34%。 觀察圖表,24 小時價格區間在 0.000004293 和 0.000004683 之間。市場結構此前極度看跌,呈現出一系列猛烈的高點下移,但近期的價格走勢顯示出潛在的轉變。價格掃過了 0.000004293 的低點,並連續拉出幾根 4 小時綠色蠟燭,試圖打破短期的看跌動能。賣壓依然存在,但目前的壓力已經緩解。 成交額 24 小時成交額為 1117 萬 USDT。由於這是 4 小時圖,一個 24 小時週期包含 6 根蠟燭,意味著每根 4 小時蠟燭的平均成交額約為 186 萬 USDT。從視覺成交量分佈圖來看,成交最密集的部分發生在恐慌拋售期間。目前的反彈是在溫和的成交量下進行的,這表明買方已入場,但並沒有積極地搶先拉抬價格。 成交量 當前標註的成交量為 1802.7 億,對比 MA5 的 3309.9 億和 MA10 的 4039.7 億。當前蠟燭的成交量約為 5 日平均值的 0.54 倍,10 日平均值的 0.44 倍。向左觀察,暴跌期間出現了巨大的成交量激增。這裡需要注意的是,此次反彈缺乏強勁的買入量。市場是在成交量縮減的情況下緩步走高,這通常意味著這是技術性反彈(relief rally),而非宏觀趨勢的反轉。請注意,該 4 小時蠟燭尚未收線(還剩 01:42:51),成交量還會繼續累積。 移動平均線 MA7: 0.000004498 | MA14: 0.000004648 | MA28: 0.000004921 (註:此圖表圖例未顯示 EMA) 平均線仍處於看跌排列(MA7 < MA14 < MA28),但短期動能正在轉變。價格剛剛收復了 MA7 (0.000004498) 並維持在上方。眼前的阻力是 MA14 (0.000004648)。MA28 (0.000004921) 依然是宏觀的天花板。快線 (MA7) 開始走平,表明下行壓力正在減弱。 關注點位 0.000004293 — 24 小時低點與波段地板價。必須守住的結構性支撐。 0.000004498 — MA7。即時動態支撐,守住此點位才能延續反彈。 0.000004648 — MA14。首個重大上方阻力。4 小時收盤價若能站穩此處,即確認趨勢轉變。 0.000005617 — 宏觀暴跌的原點,結構性高點。 考慮事項 (MACD 在此圖表視圖中不可見,但動能正轉向積極)。 訂單簿顯示買方佔 39%,賣方佔 61%,顯示出輕微的看跌傾斜,因為散戶預期會出現高點下移。價差很小(買單 0.000004553 對賣單 0.000004551),顯示作為迷因幣(meme coin)流動性尚可。當前 4 小時蠟燭出現了小小的上影線,表明賣方在 MA14 附近表現活躍。61% 的賣方傾斜度加上價格收復 MA7,顯示空方與逢低買入者之間正展開博弈。 交易計劃 看漲路徑:4 小時收盤價高於 0.000004648 (MA14),且成交量擴大至 3300 億以上。這將開啟測試 0.000004921 (MA28) 的走勢,隨後是 0.000005000。 看跌路徑:收盤價跌回 0.000004498 (MA7) 以下,價格將回測 0.000004293 波段低點,若跌破該處則繼續宏觀下行趨勢。 我的觀點:反彈雖好,但伴隨成交量萎縮直接撞上 MA14 阻力。我會選擇觀望。如果價格在此受阻並形成更低高點,我會在跌破 MA7 時做空。如果價格突破並收於 MA14 之上,我會尋求回測後做多,目標看向 MA28。 支撐與阻力 支撐:0.000004498 → 0.000004293 阻力:0.000004648 → 0.000004921 → 0.000005617 無效點與風險提示 看漲觀點在 4 小時收盤價低於 0.000004293 時失效。最大的風險是在 MA14 處突破失敗,這會形成一個更低高點,並可能引發回測低點的拋售。像 PEPE 這類迷因幣波動性極大。在操作前,請等待確認的 4 小時收盤價,不要根據盤中走勢操作。 當前蠟燭尚未收線,因此在下一根蠟燭生成前,其最低價、最高價和收盤價都有可能發生變化。
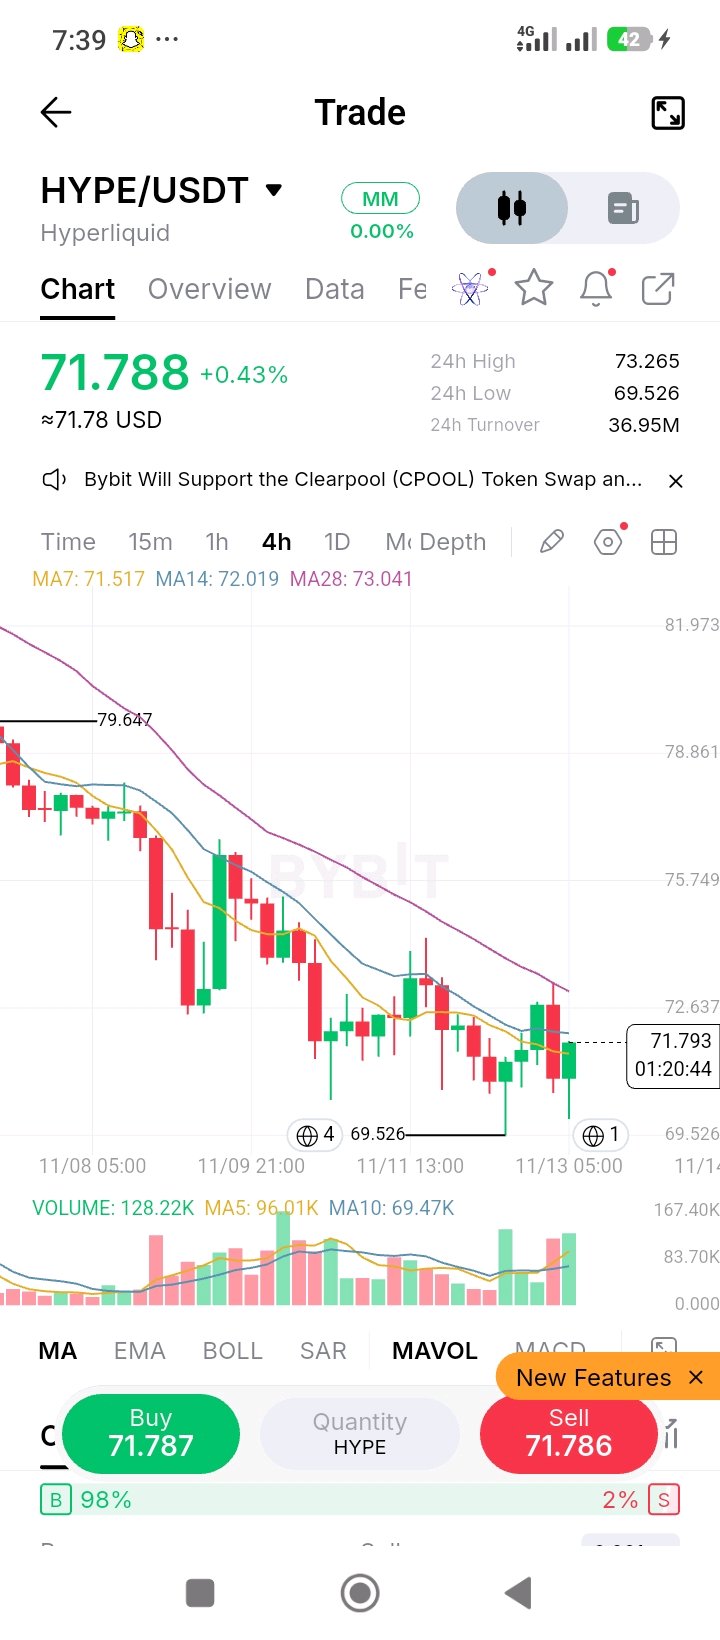
#ByXIMPACT $HYPEUSDT 正試圖在 4 小時圖的長期下跌趨勢後築底。價格此前從 79.647 的高點跌至 69.526 的低點,但近期的價格走勢顯示買方正進場防守。該資產目前交易價格為 71.788,日內上漲 0.43%。 觀察圖表,24 小時區間在 69.526 至 73.265 之間。最顯著的特徵是最近一根 K 線下探至 69.526 的低點,留下長下影線(拒絕更低價格),並隨即反彈回升。目前的 4 小時 K 線為陽線且正在上揚,試圖打破短期看跌結構。在此次反彈之前,市場處於無情的連跌狀態,但對低點的拒絕表明賣方枯竭的情況正在發生。 成交額 24 小時成交額為 3695 萬 USDT。由於這是 4 小時圖,24 小時週期大約包含 6 根 K 線,這意味著每根 4 小時 K 線的平均成交額約為 615 萬 USDT。視覺成交量分佈顯示在恐慌拋售階段(紅色 K 線)成交額很大,但目前的反彈伴隨著成交額的溫和、穩定增長。這表明真正的參與者正在入場買入低點,而不是低流動性的「死貓反彈」。 成交量 當前標註的成交量為 12.822 萬,MA5 為 9.601 萬,MA10 為 6.947 萬。當前 K 線的成交量強勁,為 5 期平均值的 1.3 倍,10 期平均值的 1.8 倍。這是一個看漲背離。雖然價格仍遠低於近期高點,但這波上漲行情的成交量高於近期平均水平,顯示出在這些折扣價位有強勁的買入意願。需要注意的是,目前的 4 小時 K 線尚未收盤(還有 1:20:44),因此成交量和 K 線形態在收盤前仍可能發生變化。 移動平均線 MA7: 71.517 | MA14: 72.019 | MA28: 73.041 (註:此圖表圖例未顯示 EMA) 平均線仍呈看跌排列(MA7 < MA14 < MA28),但價格剛剛收復了 MA7 (71.517)。這是短期動能轉變的第一個跡象。直接障礙是位於 72.019 的 MA14。收盤價高於此水平將確認趨勢反轉。MA28 (73.041) 是宏觀阻力位。 觀察點位 69.526 — 24 小時低點和震盪底部。必須守住的結構性支撐。 71.517 — MA7。即時的動態支撐。維持在此之上對反彈至關重要。 72.019 — MA14。第一個主要阻力位。4 小時收盤價高於此即為看漲觸發點。 73.041 — MA28。宏觀阻力位。 考量 (此圖表視圖未顯示 MACD,但動能正轉向正面)。 訂單簿顯示出極端情況:98% 買方與 2% 賣方。散戶正瘋狂地搶先佈局此次反彈。點差極窄(71.787 買入 vs 71.786 賣出),顯示流動性充足。98% 的多頭傾向是一把雙面刃:它顯示了對底部的信念,但也意味著若無法突破 MA14 (72.019),可能會觸發強烈的多頭擠壓,導致被困的多頭恐慌拋售。 交易計畫 看漲路徑:4 小時收盤價高於 72.019 (MA14),且成交量放大至 9.6 萬以上。這將開啟測試 73.041 (MA28) 的漲勢,隨後是 75.000。 看跌路徑:收盤價回落至 71.517 (MA7) 以下,價格將重新測試 69.526 的震盪低點,若跌破該處則將延續宏觀下跌趨勢。 個人觀點:現在買入風險較高,因為正處於 MA14 下方。然而,成交量特徵和對 69.526 低點的拒絕令人看好。我會尋找在微幅回調至 MA7 (71.517) 時做多,止損設在 70.800 下方,目標看向 72.019。在高成交量突破 72.019 時追多是較穩妥的動能交易。 支撐與阻力 支撐位:71.517 → 69.526 阻力位:72.019 → 73.041 → 79.647 無效化與風險提示 當 4 小時收盤價低於 69.526 時,看漲觀點即告失效。最大的風險是在 MA14 (72.019) 處形成較低的高點,這將困住 98% 的多頭買家,並導致價格崩跌回低點。 由於這是 4 小時週期,影線可能很長,因此請等待確認收盤。當前 K 線尚未結束。

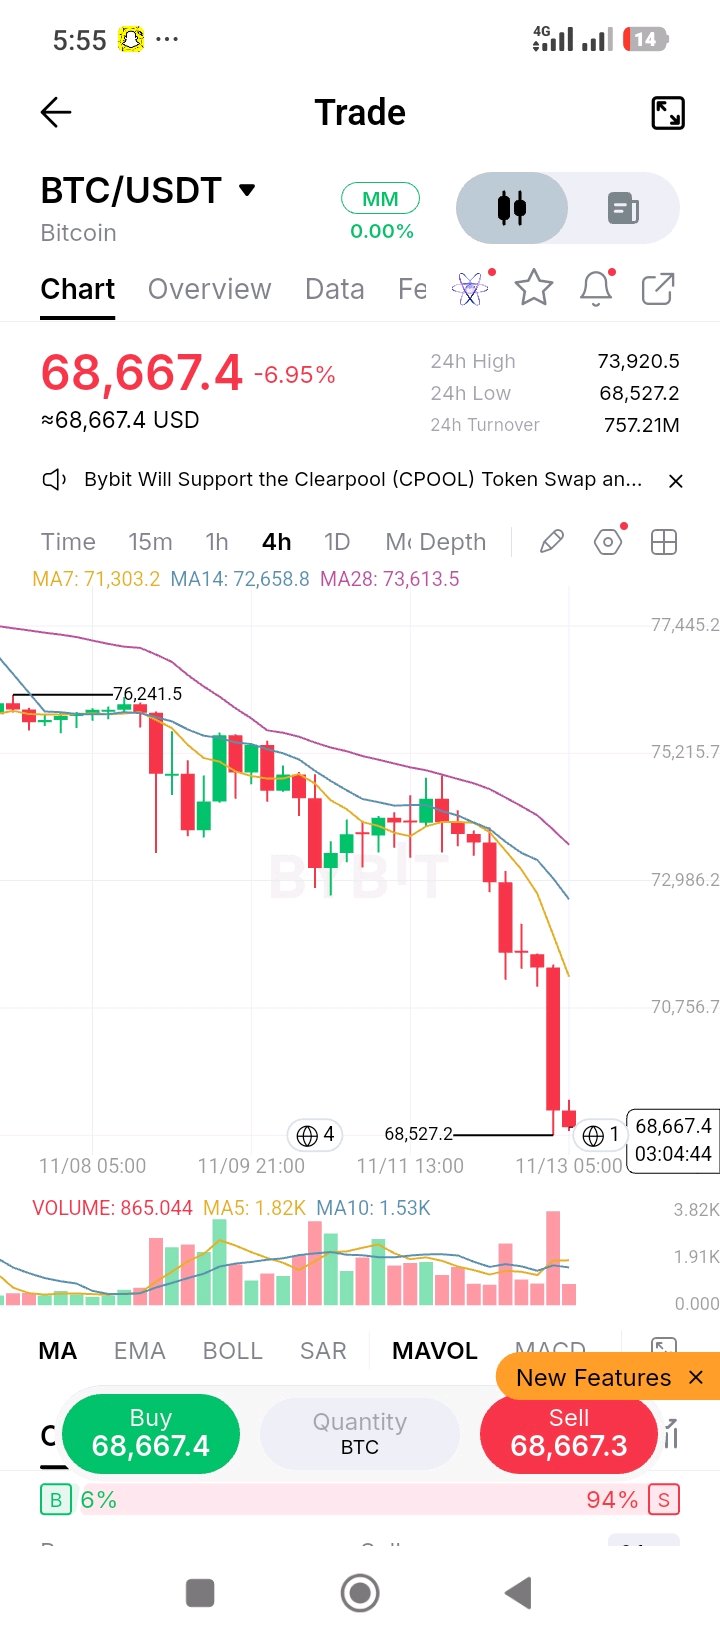
#ByXIMPACT $BTCUSDT 正處於絕對投降狀態,切換到 4 小時時間框架後,這次崩跌的嚴重程度顯露無遺。價格已從 76,241.5 的結構高點徹底崩潰,直線抹去了數千美元的價值。該資產目前交易價格為 68,667.4,日內重挫 6.95%。 觀察圖表,24 小時區間處於 73,920.5 至 68,527.2 的巨大震盪中。前一根 4 小時 K 線是一根巨大的紅色長棒,毫不猶豫地穿透了每一個支撐位。當前的 K 線是一個微小、猶豫不決的實體,懸在 68,527.2 的低點上方。在這波級聯式下跌之前,價格處於緩慢的磨損下跌趨勢中,但這最後一跌是一次猛烈的清洗。賣方完全掌控局面,買方完全缺席。 成交額 24 小時成交額高達 7.5721 億 USDT。由於這是 4 小時圖,24 小時週期僅包含 6 根 K 線。這意味著每根 4 小時 K 線的平均成交額約為 1.26 億 USDT。成交量分布顯示,在投降式拋售的 K 線期間,成交額出現了巨大飆升。目前的停滯發生在成交額略微降低的情況下,但絕對數值仍然龐大,顯示出沉重的機構或演算法拋售壓力。 成交量 目前盤面成交量為 865.044,對比 MA5 的 1.82K 和 MA10 的 1.53K。當前 K 線的運行量能約為 5 週期平均值的 0.47 倍。然而,請記住這根 4 小時 K 線剛剛開盤(剩餘 03:04:44),因此成交量會隨時間累積。向左看,成交量刻度顯示巨大的紅色柱狀體佔據主導地位,證實這次崩跌是由沈重的真實成交量支撐的,而不僅僅是流動性不足造成的針線。 移動平均線 MA7: 71,303.2 | MA14: 72,658.8 | MA28: 73,613.5 (註:此特定圖表圖例未顯示 EMA) 平均線呈現出完美、劇烈擴張的看跌扇形排列(MA7 < MA14 < MA28)。價格目前交易價格比 MA7 低 3.8%,比 MA28 低 7.2%。與移動平均線的這種極端距離表明該資產在下行方向上被嚴重超賣。雖然數學上可能出現向 MA7 回歸均值的反彈,但趨勢仍然堅定看跌。 關注點位 · 68,527.2 — 當前波段低點。4 小時收盤價若低於此處,即為觸發下一波下跌的訊號。 · 71,303.2 — MA7。即時上方阻力。反彈很可能會在此處受阻。 · 72,658.8 — MA14。下一個主要阻力位。 · 76,241.5 — 宏觀崩盤發生的結構高點。 考量 (此圖表視圖未顯示 MACD,但動能顯然極度負面)。 訂單簿顯示出一種極端異常:6% 買單與 94% 賣單。散戶正在恐慌性拋售,或在絕對底部激進地湧入空頭倉位。由於 BTC 流動性深厚,價差可忽略不計。當前的 K 線形態正試圖築底,但缺乏強有力的下影線來顯示對低點的真正拒絕。在 4 小時時間框架內,94% 的賣壓偏差是一個巨大的反向指標;市場很少讓 94% 的參與者輕易獲利。 交易計畫 · 看漲路徑:4 小時收盤價重回 71,303.2 (MA7) 之上,並伴隨巨大的成交量飆升。這將標誌著暫時性底部,並可能出現回補空頭的反彈,目標指向 MA14。 · 看跌路徑:4 小時收盤價低於 68,527.2。這將開啟一波連鎖清算,直指 67,000 的心理關口。 · 我的觀點:去接這種下墜的刀子無異於自殺。94% 的空頭偏差意味著下行空間過度擁擠。我會等待價格反彈至 71,303.2 (MA7) 區域,尋找高勝率的做空機會。或者,如果價格掃過 68,527.2 並立即在 4 小時線上打出一根巨大的看漲反轉 K 線(如錘子線),我會尋找超短線做多的機會。 支撐與阻力 支撐:68,527.2 → 67,000 → 65,000 阻力:71,303.2 → 72,658.8 → 76,241.5 失效條件與風險提示 若 4 小時收盤價高於 71,303.2 (MA7),看跌觀點失效。最大的風險是突發的「死貓反彈」或由 94% 賣壓偏差引發的軋空。然而,試圖在剛下跌 7% 且未出現確認反轉形態的 4 小時 K 線上做多,無異於賭博。請根據巨大的波動性調整倉位大小,並以確認的 4 小時收盤價為準,而非盤中波動。 當前的 4 小時 K 線仍未收盤,因此在下一次更新前,其低點、高點和收盤價仍有變動可能。
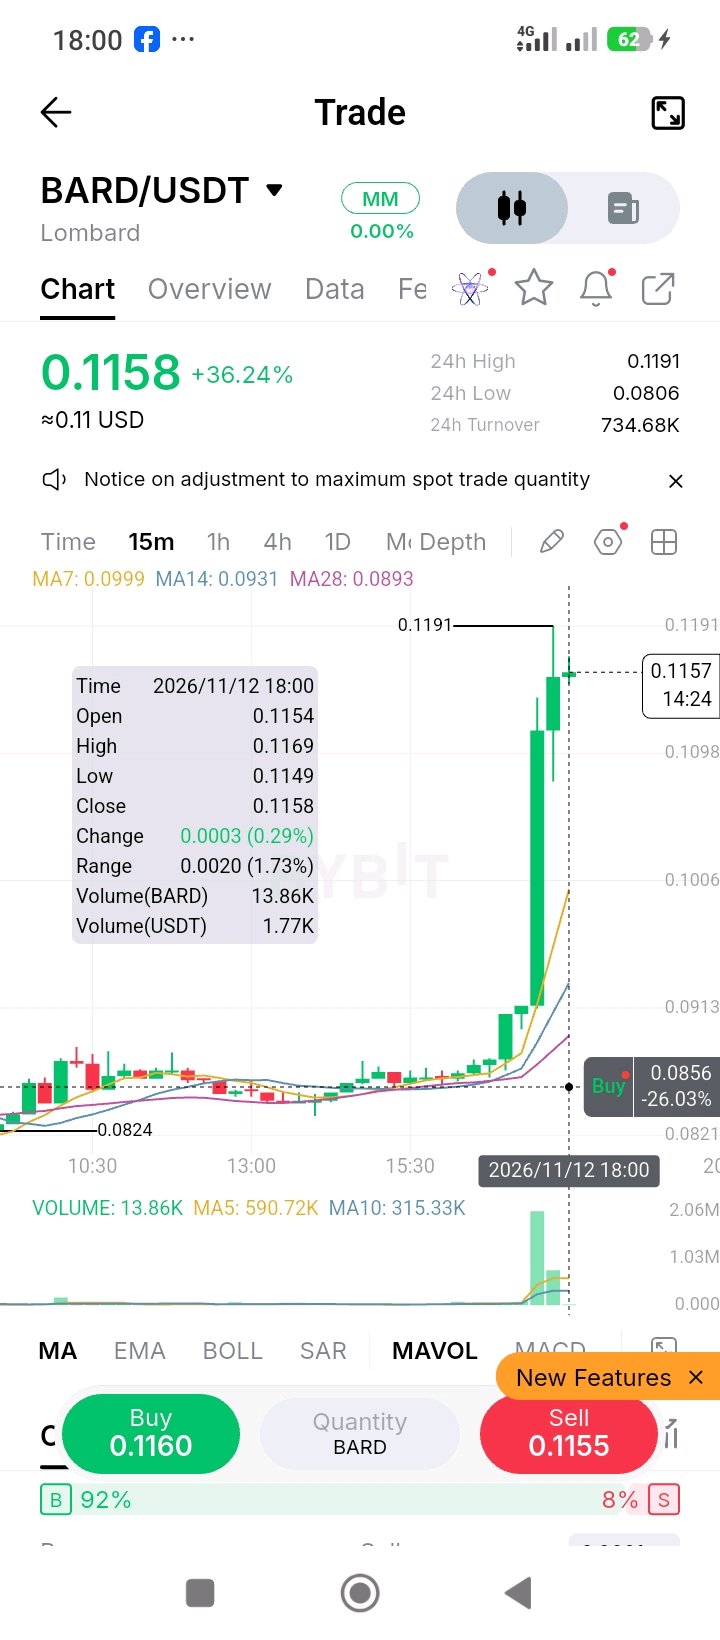
#ByXIMPACT $BARDUSDT is in the middle of a parabolic, flow-driven vertical expansion. Price aggressively rocketed from a 0.0824 base to a 0.1191 high in a very short window. The asset is currently trading at 0.1158, up a massive 36.24% on the day. Looking at the chart, the 24h range is extremely wide, sitting between a low of 0.0806 and the current high of 0.1191. The highlighted 18:00 candle opened at 0.1154, swung between 0.1149 and 0.1169, and is currently sitting at 0.1158. Before this breakout, price was grinding flat near 0.0850 for hours. The current candle is printing a small body (doji-like), showing the market is pausing to catch its breath after the aggressive push. Sellers haven't mounted a heavy rejection yet, but the extreme verticality is a warning sign. Turnover 24-hour turnover is 734.68K USDT. The pop-up for the 18:00 candle shows a mere 1.77K USDT (13.86K BARD) traded in that single 15-minute window. Given a 24-hour period has 96 windows of 15 minutes, the average pace would be roughly 7.65K USDT. This means the highlighted candle is running at about 0.23x the average daily pace. The turnover was heavily concentrated in the initial breakout burst, and the current pause is happening on drastically reduced flow. Volume The highlighted candle's volume is 13.86K BARD against an MA5 of 590.72K and an MA10 of 315.33K. It is running at a microscopic 0.02x the 5-period average. Looking left, the volume scale shows a massive burst of green bars during the initial breakout. The current volume has completely dried up. The caveat here is that this is a "liquidity vacuum" at the top. Buyers are unwilling to chase at these prices, and sellers aren't aggressive enough to dump it yet. The market is holding its breath. Moving Averages MA7: 0.0999 | MA14: 0.0931 | MA28: 0.0893 (Note: EMAs are not displayed on this specific chart legend) The averages are stacked in a violent, steep bullish fan (MA7 > MA14 > MA28). Price is currently towering 15.9% above the MA7 and a massive 29.6% above the MA28. This is extreme overextension. Price has run so far ahead of its trend that a mean reversion (pullback) is mathematically highly probable. The fast lines are pointing almost vertically. Levels to watch · 0.1191 — The 24h high and peak. A 15-minute close above it continues the price discovery. · 0.1149 — The low of the highlighted candle. Losing it on a close signals the start of a deeper pullback. · 0.0999 — MA7. The first logical dynamic support if the pump fades. · 0.0931 — MA14. The structural floor of the breakout. Consideration (MACD is not visible on this chart view). The order book is showing extreme euphoria: 92% buyers and 8% sellers. Retail is heavily chasing this pump. The spread is relatively wide, with a 0.1160 buy against a 0.1155 sell quote (about 0.43%). There is a visible buy limit order on the right axis at 0.0856 (-26.03% below current price). This order is placed near the origin of the pump, indicating a trader is waiting for a complete round-trip flush. The 92% long skew is a major risk; if the price breaks down, the long squeeze will be brutal. Trade plan The Bullish Path: a 15-minute close above 0.1191 with a massive surge in volume (above 590K). That opens a move into uncharted territory. The Bearish Path: a close under 0.1149 triggers a slide to retest the MA7 (0.0999), and a break there exposes the MA14 (0.0931). My take: I am absolutely not buying this. You don't buy the top of a 36% vertical candle with dead volume and a 92% long skew. I would wait for a deep pullback into the MA7 (0.0999) or MA14 (0.0931) and look for a bullish reversal pattern to catch the next leg up. If it loses the MA7 on a close, the momentum is dead, and I would look for a short. Support and resistance Support: 0.1149 → 0.0999 → 0.0931 → 0.0824 Resistance: 0.1191 Invalidation and risk note The bullish read is invalidated on a 15-minute close below 0.0999 (MA7). The biggest risk is a violent long squeeze. With retail heavily long (92%), a break below the current consolidation at 0.1149 could trigger a cascading sell-off as late buyers panic. The token has only 734K daily turnover, meaning liquidity is thin. Size for extreme volatility and use limit orders to avoid terrible slippage. The current bar is still open, so its low, high, and close can all change before the next print.
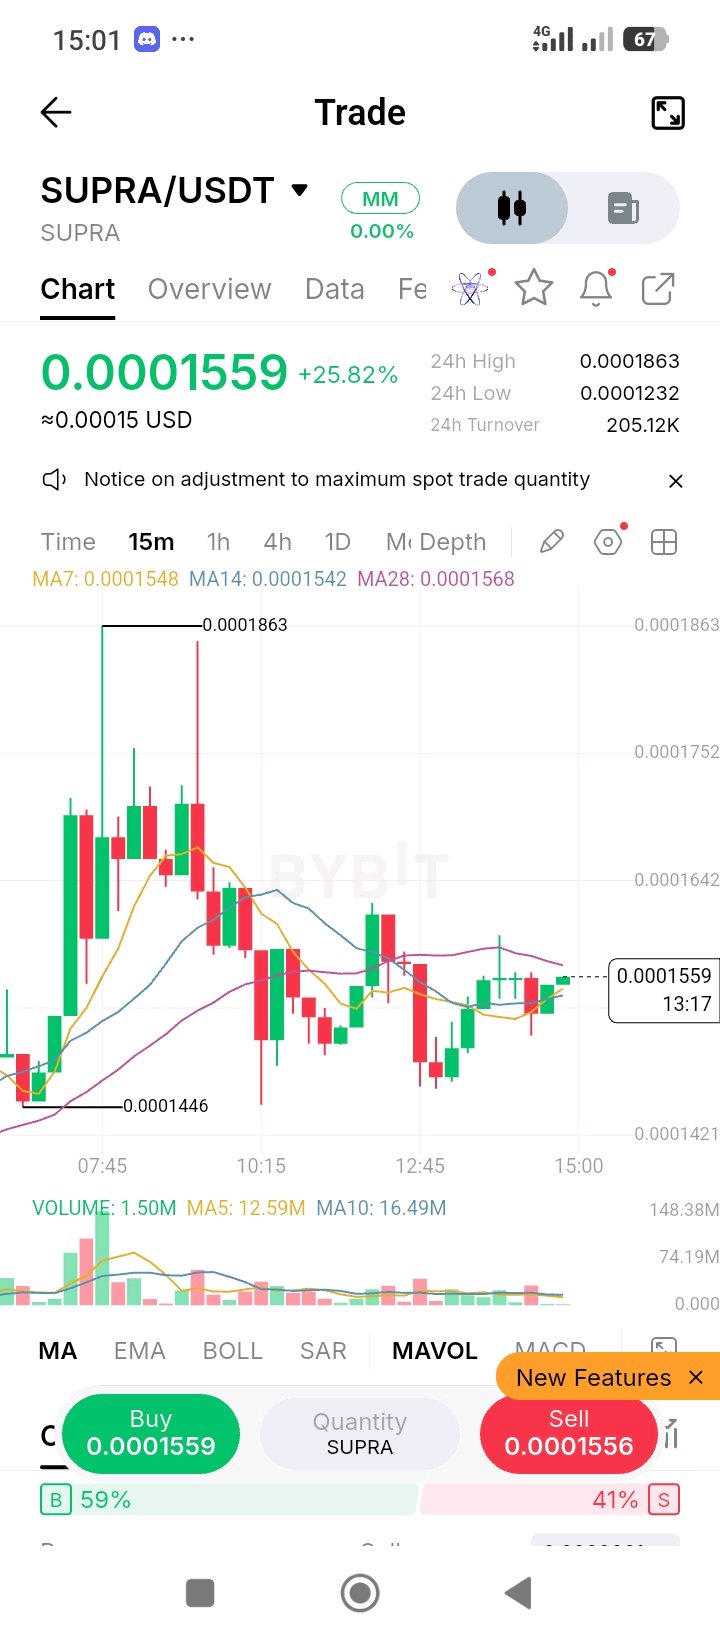
#ByXIMPACT $SUPRAUSDT is consolidating after a massive, violent pump-and-dump structure. Price initially rocketed from a 0.0001446 base to a 0.0001863 high, but immediately faced heavy rejection and bled out, forming a series of lower highs. The asset is currently trading at 0.0001559, up 25.82% on the day. Looking at the chart, the 24h range is extremely wide between 0.0001232 and 0.0001863. After the initial peak, price aggressively dumped below all moving averages, finding a temporary floor near 0.0001450. Since then, it has been chopping sideways in a tight compression range, trying to build a base. The current candles are printing small bodies, showing the market is waiting for a directional catalyst. Sellers heavily defended the top. Turnover 24-hour turnover is exceptionally low at just 205.12K USDT. Because there is no specific candle pop-up, we look at the visual volume profile. The turnover peaked massively during the initial vertical push to 0.0001863 (visible on the left). The current consolidation phase is occurring on practically zero turnover, suggesting the flow-driven spike is over and the market has entered a dead zone. Volume The current volume is 1.50M against an MA5 of 12.59M and an MA10 of 16.49M. The current bar is running at a mere 0.11x the 5-period average and 0.09x the 10-period average. Looking left, the volume scale topped out near 148.38M during the pump. The massive drop-off in participation indicates a complete lack of interest from both buyers and sellers at this level. The caveat is that in a liquidity vacuum like this, price can easily drift or be manipulated by a single moderately sized order. Moving Averages MA7: 0.0001548 | MA14: 0.0001542 | MA28: 0.0001568 (Note: EMAs are not displayed on this specific chart legend) The averages are tangled, reflecting the current chop. The MA7 and MA14 have crossed slightly bullishly, sitting just below the current price. However, the MA28 (0.0001568) is acting as a heavy ceiling directly overhead. Price is currently wedged between the short-term support and the macro resistance. Levels to watch · 0.0001863 — The 24h high and swing peak. · 0.0001568 — MA28. The immediate overhead resistance. A 15-minute close above it is the first sign of life. · 0.0001542 — MA14. The immediate dynamic support. Losing it turns the tone bearish. · 0.0001446 — The swing low of the recent pullback. The structural floor. Consideration (MACD is not visible on this chart view). The order book is split 59% buyers and 41% sellers, showing a slight long skew. The most glaring issue is the spread: a 0.0001559 buy against a 0.0001556 sell quote (about 0.19% spread). On a 15-minute timeframe with such low turnover, this spread will eat into any scalp. The recent candle shapes are tiny dojis, showing total indecision. Trade plan · The Bullish Path: a 15-minute close above 0.0001568 (MA28) with a sudden expansion in volume. That opens a retest of the 0.0001650 region. · The Bearish Path: a close under 0.0001542 (MA14) sends price to retest the 0.0001446 swing low, and a break there exposes the 0.0001232 daily low. · My take: I would not trade this. The liquidity is too thin, and the volume is dead. The chart is trapped in a tight chop zone between the MAs. If forced, I would wait for a breakout above 0.0001568 or a breakdown below 0.0001446, and only trade the retest of those levels. Support and resistance Support: 0.0001542 → 0.0001446 → 0.0001232 Resistance: 0.0001568 → 0.0001650 → 0.0001863 Invalidation and risk note The bullish read is invalidated on a 15-minute close below 0.0001542 (MA14). The biggest risk here is getting chopped up or slippage. With a daily turnover of only 205K, there is almost no liquidity. A single market order can cause a 5-10% wick in either direction. Use limit orders exclusively, and do not use market orders. The current bar is still open, so its low, high, and close can all change before the next print.
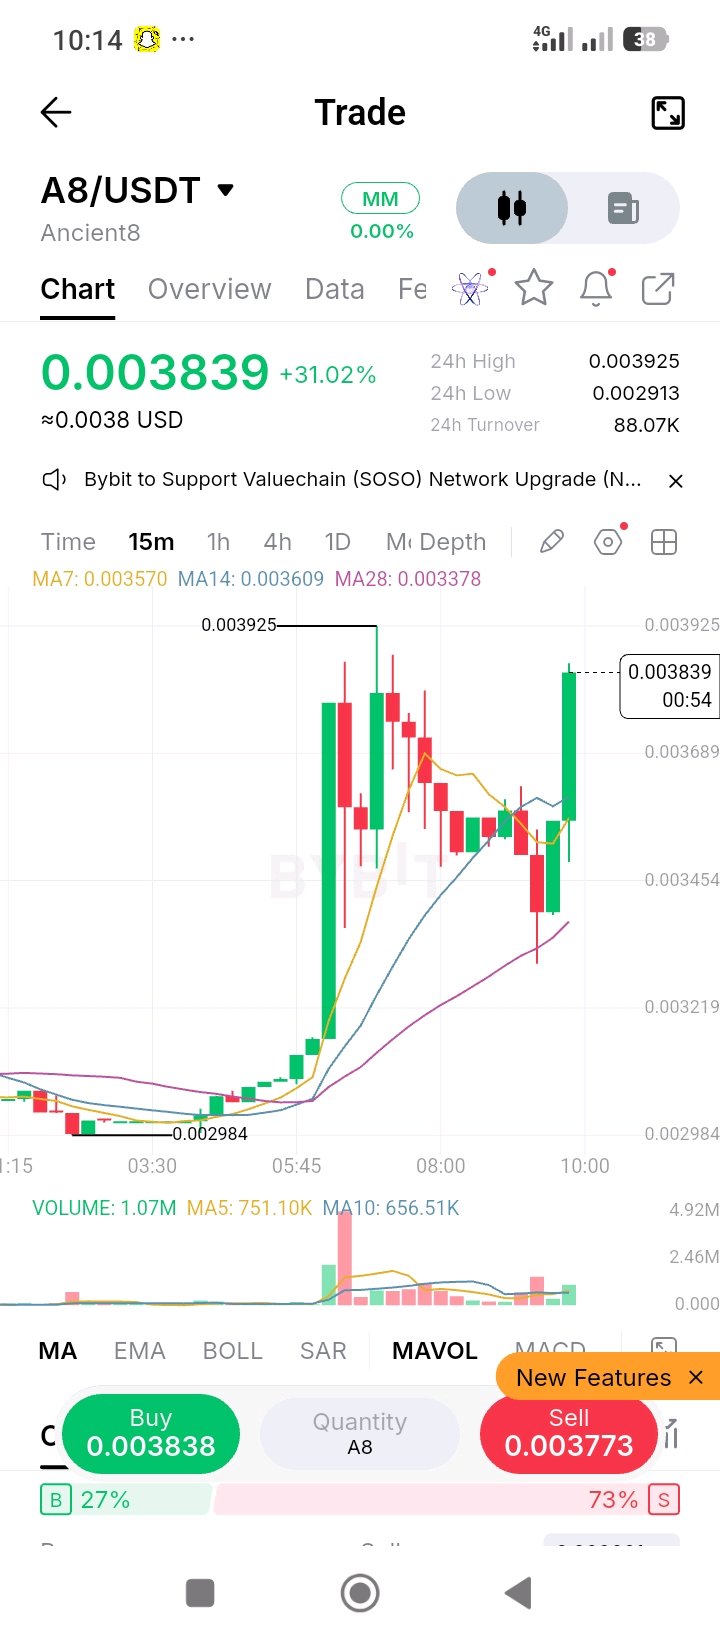
#ByXIMPACT $A8USDT 正展現出極端波動,在經歷了一波劇烈的拉升與回調後,出現了明顯的 V 型反轉。價格最初從 0.002984 的底部拉升至 0.003925 的高點,隨後跌破移動平均線至 0.003454 附近的局部低點。該資產剛剛收出一根巨大的陽線,飆升回 0.003839,日內漲幅達 31.02%。 觀察圖表,24 小時價格區間巨大,介於 0.002913 至 0.003925 之間。當前的 15 分鐘 K 線正在強勢吸收近期的賣壓,並正在測試前高。在最初拉升之前,價格在 0.0030 附近窄幅整理。市場目前正處於區間頂部的「交戰」區,當前 K 線正試圖突破。 成交額 24 小時成交額極其稀薄,僅為 88.07K USDT。由於沒有特定的彈窗數據,我們查看視覺化成交量分布。成交額在最初垂直拉升至 0.003925 時達到頂峰。當前這根巨大的陽線相較於回調階段成交量有所回升,但市場的絕對流動性實際上幾近於零(全天不足 100K)。這是一個微型市值(micro-cap)環境,滑點是巨大的風險。 成交量 當前成交量為 1.07M,對比 MA5 的 751.10K 和 MA10 的 656.51K。當前 K 線的成交量約為 5 週期平均值的 1.4 倍,10 週期平均值的 1.6 倍。向左看,成交量規模在最初拉升時最高達到 4.92M 左右。當前成交量的激增正在支撐價格的強勁反彈,顯示出回到高點的強烈意圖。需要注意的是,在如此低迷的日成交額下,這些成交量很可能僅由極少數參與者所推動。 移動平均線 MA7: 0.003570 | MA14: 0.003609 | MA28: 0.003378 (註:該圖表圖例未顯示 EMA) 均線目前交織在一起但正轉向上方。價格目前高踞於所有三條均線之上,約高於 MA7 7.5%。近期回調曾觸及 MA14,該均線成為當前巨大陽線的跳板。均線目前正作為當前價格走勢下方厚實的動態支撐基礎。 關注點位 · 0.003925 — 24 小時高點及波段峰值。15 分鐘線收盤價高於此處即為突破觸發點。 · 0.003839 — 當前價格。正在測試先前的供應區。 · 0.003609 — MA14。即時動態支撐位。 · 0.003378 — MA28。結構性地板位。 考量 (MACD 在此圖表視圖中不可見)。 訂單簿顯示 27% 為買單,73% 為賣單,表明散戶正大量嘗試做空此次拉升。然而,最令人擔憂的數據點是價差(spread):0.003838 的買單報價與 0.003773 的賣單報價之間存在巨大差距(約 1.7% 的價差)。這是流動性不足的巨大危險信號。當前 K 線正試圖軋空這 73% 的賣方,但巨大的價差意味著市價單將以極差的價格成交。 交易計畫 · 看漲路徑:15 分鐘收盤價站上 0.003925 且伴隨持續成交量。這將開啟通往 0.004000 的價格發現之旅。 · 看跌路徑:此處遭遇阻力(留下長上影線)並收盤回落至 0.003609 (MA14) 以下,將導致價格重新測試 0.003454 的局部低點,若跌破該點位則會暴露 MA28 的支撐。 · 我的觀點:我絕對不會用市價單交易這個標的。1.7% 的價差會瞬間吃掉所有利潤,且 73% 的空頭偏斜意味著軋空可能非常劇烈,但稀薄的流動性使這裡如同賭場。如果非要交易,我會掛限價單。在 0.003609 (MA14) 附近掛買入限價單,並在 0.003400 下方設置止損,或者等待確認突破並回測 0.003925。 支撐與阻力 支撐位: 0.003609 → 0.003454 → 0.003378 → 0.002913 阻力位: 0.003925 失效與風險提示 若 15 分鐘收盤價低於 0.003570 (MA7),看漲觀點失效。這裡最大的風險是極端的流動性匱乏。88K 的日成交額意味著單筆適中規模的市價賣單就可能瞬間讓價格崩跌 10-20%。對於價差寬大且成交量虛假或轉瞬即逝的市場,請務必控制倉位大小。嚴格使用限價單,並以確認的收盤價而非盤中波動作為進場依據。 當前 K 線仍在進行中,因此在下一根 K 線生成前,其最低價、最高價和收盤價都有可能發生變化。
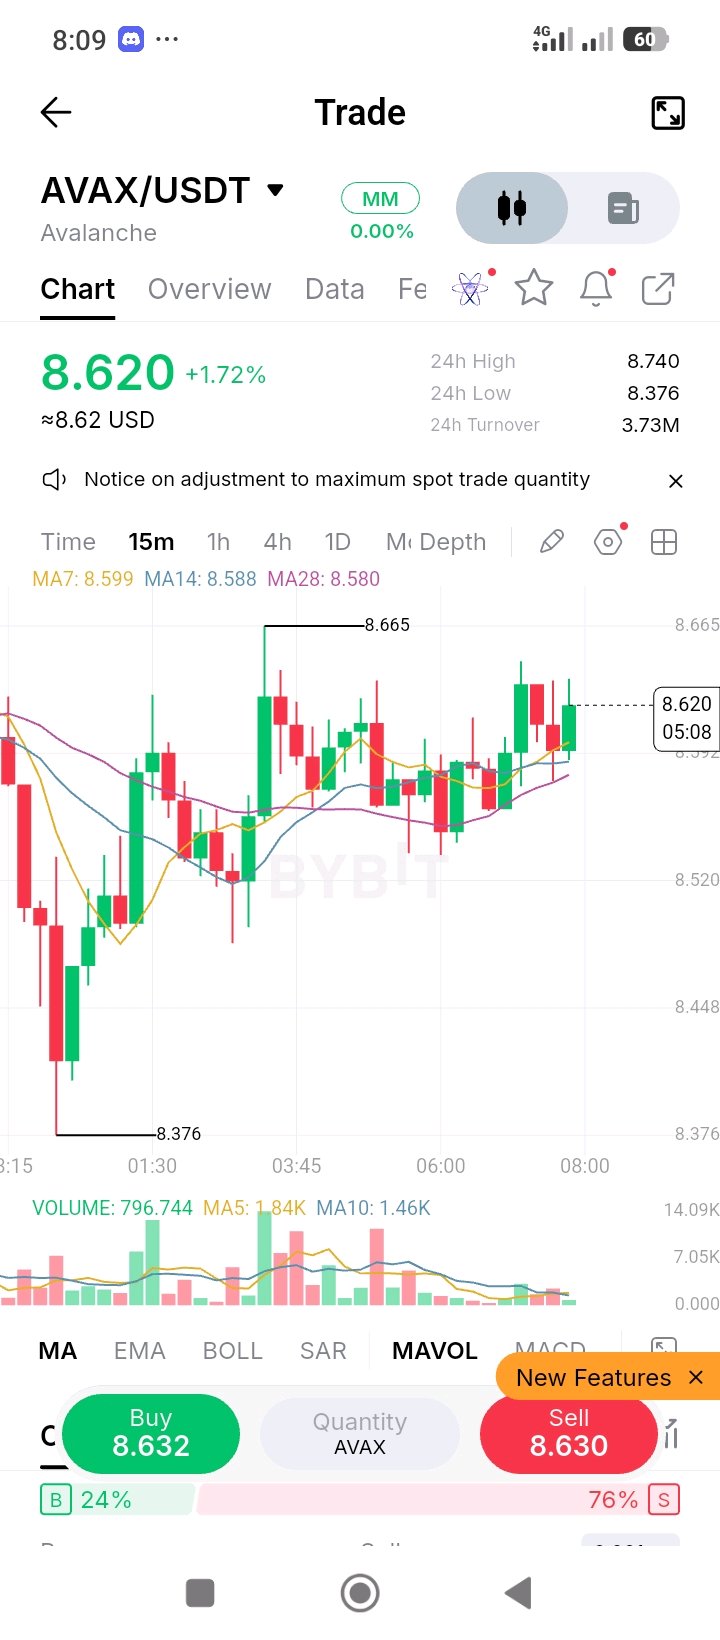
#ByXIMPACT $AVAXUSDT is showing clear relative strength, While the broader market is selling off, AVAX recovered from a sharp drop to 8.376 and has climbed back to 8.620, up 1.72% on the day. Looking at the chart, the 24h range is between 8.376 and 8.740. The asset took a heavy hit earlier in the session but immediately printed a V-shaped recovery, pushing back to a local high of 8.665. Since then, it has established a series of higher lows, holding firmly above its moving averages. This resilience—holding the mid-range while others bleed—is a hallmark of accumulation or a strong spot bid defending the asset. Turnover 24-hour turnover is 3.73M USDT. Because there is no specific candle pop-up, we look at the visual volume profile. The turnover peaked during the initial flush down to 8.376 (visible on the left side). The current consolidation is happening on noticeably lower turnover, which is healthy. It suggests the sellers are exhausted and there is no heavy selling pressure hitting the bid right now. Volume The current highlighted volume is 796.744 against an MA5 of 1.84K and an MA10 of 1.46K. The current bar is running at roughly 0.43x the 5-period average and 0.54x the 10-period average. Looking at the volume scale, the bars are shrinking as the price consolidates. This is a classic coiling pattern. The caveat is that for AVAX to break out past the local high, we need to see a sudden expansion in buy volume; otherwise, it may chop sideways. Moving Averages MA7: 8.599 | MA14: 8.588 | MA28: 8.580 (Note: EMAs are not displayed on this specific chart legend) The averages are stacked in a perfect bullish fan (MA7 > MA14 > MA28) and are extremely compressed, with only a 0.019 gap between the MA7 and MA28. Price is trading above all three, using them as a dynamic springboard. This tight cluster is acting as a concrete base. As long as price stays above 8.580, the short-term trend belongs to the bulls. Levels to watch · 8.665 — The local high. A 15-minute close above this is the breakout trigger. · 8.599 — MA7. The immediate dynamic support. · 8.580 — MA28. The base of the cluster. Losing this on a close weakens the relative strength thesis. · 8.376 — The swing low. The structural floor. Consideration (MACD is not visible on this chart view). The order book is showing a 24% buyer / 76% seller skew. This is highly interesting. Despite the chart showing strength and recovery, retail is heavily leaning short. When an asset shows relative strength while the rest of the market is selling, and retail order flow is 76% short, it creates the perfect conditions for a short squeeze. If price pushes past 8.665, those sellers will be forced to cover, fueling the next leg up. Trade plan · The Bullish Path: a 15-minute close above 8.665 with volume expanding above 1.84K. That confirms the relative strength and opens a run toward the 8.740 (24h high) and beyond. · The Bearish Path: a close under 8.580 (MA28) invalidates the local strength, sending price to retest the 8.500 psychological level, and a close under 8.376 resets the macro structure. · My take: Because you pointed out the relative strength, this is a prime setup for a long. I would look to enter on a slight dip into the MA cluster (8.580–8.599) with a tight stop below 8.520, risking about 0.06 to make about 0.12 toward 8.665, for a 2R trade. Alternatively, a breakout entry above 8.665 with a retest confirmation is a safer momentum play. Support and resistance Support: 8.599 → 8.580 → 8.500 → 8.376 Resistance: 8.665 → 8.740 Invalidation and risk note The bullish read is invalidated on a 15-minute close below 8.580 (MA28). If this holds, the relative strength is intact. The biggest risk is a delayed reaction to the broader market sell-off; if a major coin like BTC or ETH suddenly dumps, AVAX will likely get dragged down despite its current strength. Size normally as AVAX has good liquidity (3.73M turnover), but always use confirmed closes, not intrabar moves, for entries. The current bar is still open, so its low, high, and close can all change before the next print.