IBRAHIMcrypto
64394點贊0分享1782粉絲40關注
PRO CRYPTO TRADER / MENTOR CRYPTO GUY 💯 /NFTs lover🎨/GAMER💻🎮/🏋
PRO CRYPTO TRADER / MENTOR CRYPTO GUY 💯 /NFTs lover🎨/GAMER💻🎮/🏋
If you think $HYPEUSDT has permanently topped just because the rest of crypto is digital trash, take a hard look at its ever expanding fundamentals Why does this matter? Because Hyperliquid is a revenue machine where every dollar of collateral and every dollar of trading volume contributes to deflationary $HYPEUSDT buybacks More adoption → less circulating $HYPE overtime. Its that simple and no other asset has this. $TSLA ran hard off its early-November low, broke the prior swing high, and is now pulling back. I'm leaning long, but I'm not buying here. I want price to come down into a specific pullback zone first. Chasing the middle of a pullback is how you get a bad entry. The drop from the recent high looks like a retracement inside the up-leg, not a trend change. The 12h still prints higher lows. Why the zone matters: - The 4h, 12h and daily moving averages stack at the same level - The 62% retracement of the last up-leg lands there too - Recent equal lows sit just below it Four separate reasons on one shelf make a bounce there mean more. The ICT read: those equal lows hold a pool of stop orders. A sweep through them that snaps back into the discount zone is the setup I'd take. Targets are the liquidity resting above the recent swing highs. Where I'm wrong: if price gives up the 12h swing low, the daily 200-day average and the bottom of the optimal retracement band together, the pullback read is dead and I step aside. Risks: Nvidia earnings on Nov 18 and December rate-hike worries could shake AI and high-beta names. Thin weekend pricing means the Monday open can gap. Not investment advice. All decisions and responsibility are your own. $BTC has only been oversold on the weekly 4 times in it's entire history 📉 But, an oversold weekly RSI hasn't always marked the final bear-market bottom. 📉 2015: BTC bottomed 210 days later. 📉 2019: Oversold RSI coincided with the bottom. 📉 2022: BTC bottomed 147 days later. 2026: Already 280 days since the initial oversold signal, with a definitive bottom still to be confirmed. When BTC first became oversold this cycle, it was trading around $60,000. Yesterday's flush saw BTC trade as low as $62,000, meaning price has spent 280 days without establishing a sustained recovery. This is the longest period between an initial weekly oversold RSI signal and a confirmed cycle bottom among the historical examples examined. Only in 2019 did the oversold RSI coincide with the final bottom. The other examples tell us, an oversold weekly RSI doesn't guarantee an immediate reversal. Historically, it has often been followed by months of further consolidation or downside before a definitive bottom forms. #IMPACTbyTrade
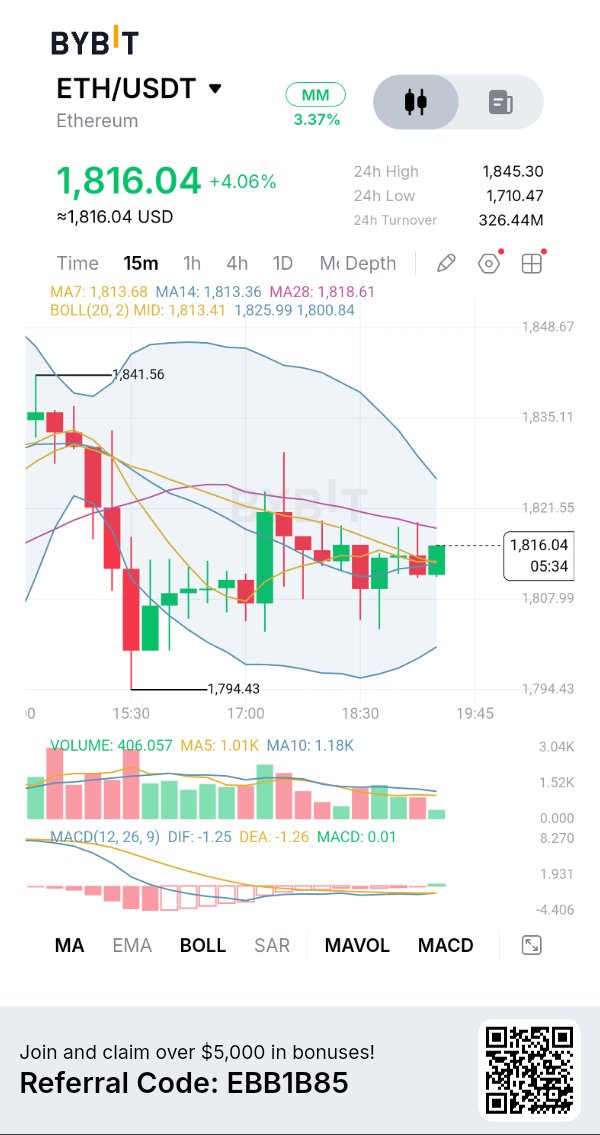
ETH 試圖在 1,816 美元上方反彈:買方是否在醞釀更強勁的逆轉? 在經歷了相當大的拋售壓力後,以太坊 (ETH) 正顯示出短期企穩的跡象,但目前的復甦仍需確認。在跌至 1,794.43 美元後,ETH 已成功收復 1,800 美元區域,目前買方正試圖在 1,816 美元附近積聚動能。 關鍵問題在於,這種復甦能否發展成可持續的上漲走勢,還是賣方會利用目前的反彈作為再次奪回控制權的機會。 圖表 + 技術分析 我的 Bybit $ETHUSDT 15 分鐘線圖顯示,ETH 目前交易價格約為 1,816.04 美元,上漲約 4.06%,24 小時高點為 1,845.30 美元,低點為 1,710.47 美元。 近期的價格結構顯示為急劇下跌後隨之而來的復甦與盤整。買方已守住 1,794.43 美元的波段低點,但價格仍接近幾個上方的阻力位。 移動平均線提供了一個有趣的畫面。MA7 約為 1,813.68 美元,MA14 約為 1,813.36 美元,MA28 約為 1,818.61 美元。ETH 的交易價格高於較短週期的均線,但仍低於 MA28,這使得 1,818.61 美元成為一個重要的即時阻力參考點。 布林通道的中軌約在 1,813.41 美元,上軌在 1,825.99 美元附近,下軌約在 1,800.84 美元。持續站穩中軌之上可能會增強復甦力道,而若在上軌附近遭遇拒絕,則表明買方仍面臨相當大的阻力。 MACD + 交易量分析 MACD 顯示出初步改善,DIF 為 -1.25,DEA 為 -1.26,柱狀圖約為 +0.01。 略微轉正的柱狀圖表明看跌動能正在減弱。然而,兩條 MACD 線仍低於零軸,這意味著完全的看漲動能逆轉尚未得到確認。 目前交易量約為 406.057,低於 MA5(1.01K)和 MA10(1.18K)。這是一個重要的隱憂,因為目前的復甦缺乏強大的參與度。 我傾向於看到向上突破時伴隨交易量放大,才會將此視為一次令人信服的逆轉。 看漲情境 如果 ETH 能維持在 1,813–1,814 美元附近的支撐,並成功收復 1,818.61 美元,我將觀察其是否會持續上漲至 1,821.55 美元。 若出現更強勁的突破,可能會開啟通往 1,825.99 美元的道路,該位置與布林通道上軌吻合。 我傾向的進場方式是等待 15 分鐘線決定性地收在阻力位之上,隨後進行成功的回測並伴隨交易量增加。 若持續跌破 1,807.99 美元,將削弱此即時看漲佈局。 我的交易計畫 當 ETH 在支撐位和阻力位之間震盪時,我不會去追逐當前的復甦。 對於多頭部位,我希望看到買方收復 1,818.61 美元,確認突破並展現出更強的交易量。 對於空頭部位,我會等待確認跌破 1,807.99 美元且復甦嘗試失敗。 #IMPACTbyTrade
QNT 上漲 10%,多頭進逼 157 美元
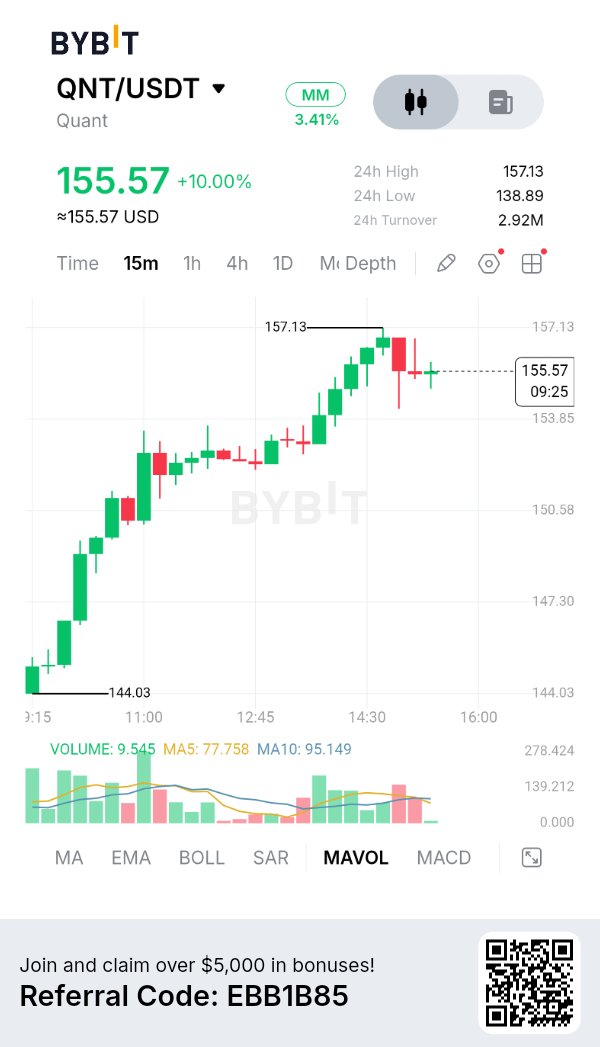
Quant 的 QNT 正展現出強勁的日內買盤動能,價格從 144 美元區間一路漲至 157.13 美元,隨後遭遇了一些賣壓。約 10% 的漲幅相當可觀,但近期的盤整顯示,在嘗試下一波上漲之前,買方可能需要先消化市場上的可用供應。 我的 Bybit $QNTUSDT 15 分鐘線圖顯示,目前價格在 155.57 美元附近徘徊,24 小時高點為 157.13 美元,低點為 138.89 美元。目前結構呈看漲態勢,一連串的高低點抬升表明買方在觀察期間的大部分時間裡都保持著控制權。 圖表與技術分析 最值得注意的發展是從 144.03 美元的明顯低點強勁反彈。QNT 在突破 147.30 美元和 150.58 美元區域後,進一步向 157.13 美元延伸。 這一走勢顯示出相當可觀的短期買盤興趣。然而,在接近盤中高點受阻後,價格目前正圍繞 155.57 美元進行盤整。 目前的即時阻力位在 157.13 美元。若能得到更強成交量的支撐並有效突破此水平,可能會為下一波漲勢創造空間。 下行方面,我正在關注 153.85 美元作為第一個重要的支撐參考點。若跌破該價位,150.58 美元將成為下一個更關鍵的監測水平,隨後是 147.30 美元區域。 成交量與市場參與度 根據提供的圖表,目前成交量約為 9.545K,而 MA5 為 77.758K,MA10 為 95.149K。 這是一個重要的觀察點。儘管 QNT 記錄了令人印象深刻的漲幅,但近期的交易活動明顯低於其成交量均值。 我的解讀是,市場需要新的參與者進場才能維持下一波突破。如果沒有更強的買盤活動,目前的盤整可能會演變成更深度的回調。 我會特別關注當價格再次接近 157.13 美元時,成交量是否會放大。 基本面視角 Quant 憑藉其 Overledger 技術,在區塊鏈基礎設施領域佔據了有趣的地位。 其更廣泛的願景聚焦於互操作性,允許不同的分佈式帳本網絡和現有的金融基礎設施進行通信和信息交換。 隨著金融機構探索代幣化、數字資產基礎設施以及將區塊鏈技術整合到現有系統中,這一點顯得尤為重要。 QNT 在 Quant 生態系統中也具備實用性,包括在訪問網絡服務和支持平台經濟模型方面的作用。 看漲情境 如果 QNT 能維持在 153.85 美元附近的支撐,並在強勁買盤成交量的配合下成功突破 157.13 美元,我會考慮出現另一波看漲延續的可能性。 我的下一個上行目標參考是 160 美元,隨後是 163 美元的進一步延伸區域。 在考慮進場之前,我傾向於等待 15 分鐘級別的確認突破,隨後再進行一次成功的重新測試。 若持續跌破 153.85 美元,將削弱當前的看漲勢頭。 看跌情境 如果 QNT 反覆無法克服 157.13 美元,並隨後在 15 分鐘線收盤時果斷跌破 153.85 美元,我會觀察是否存在失敗的重新測試,然後再考慮看跌機會。 下一個下行參考位將是 150.58 美元,其次是 147.30 美元。 向這些水平的深度修正不會自動破壞更廣泛的復甦走勢,但這將表明買方正在失去即時優勢。 若能強勢收復 157.13 美元,則會使這個短期看跌情境失效。 我的交易計畫 在經歷了約 10% 的日內漲幅後,我不會去追高 QNT。在沒有確認信號的情況下直接在阻力位下方進場,可能會讓倉位面臨不必要的波動風險。 對於看漲設置,我希望看到價格守住 153.85 美元,突破 157.13 美元,並在突破時展現出更強的成交量。 對於看跌設置,我會等待確認跌破 153.85 美元以及嘗試反彈失敗後的信號。 倉位規模應保持受控,並設有預定的止損位,以及在第一個目標位進行部分獲利了結。 我的解讀 令人鼓舞的發展是 QNT 從 144.03 美元強勁復甦,並形成了清晰的日內上漲結構。 然而,當前價格附近的成交量下滑表明,在能夠自信地預期下一波大幅上漲之前,買方需要展現出更多的投入。 只要 153.85 美元不破,我的短期觀點保持謹慎看漲。 157.13 美元的阻力位是即時的考驗。如果買方以令人信服的成交量克服它,復甦可能會持續。如果失敗,重新測試下方支撐的可能性就會越來越大。 目前,我寧願等待確認,也不願去追逐已經延伸的走勢。圍繞 157.13 美元的下一次反應可能決定 QNT 的下一個重要方向。 IMPACTbyTrade
INTERESTING IS HAPPENING WITH $HYPE
While $HYPEUSDT continues to experience significant price volatility, CoinStats data reveals a completely different trend beneath the surface. The percentage of CoinStats users holding $HYPE has climbed from approximately 0.59% to over 1.10%. That's an increase of more than 85% in the proportion of users holding the token. And the most interesting part? The chart shows a sustained upward trend, with new highs appearing even after temporary pullbacks. To me, this suggests that interest in holding $HYPE has been expanding within the CoinStats user base, despite the uncertainty surrounding short-term price movements. Of course, this data represents CoinStats users rather than the entire Hyperliquid investor population, and it doesn't tell us how much $HYPE each person holds. Still, the direction is worth paying attention to. Prices can fall while the proportion of portfolio trackers holding an asset continues to rise. That's exactly the kind of divergence I like to monitor when evaluating market sentiment. The price chart shows volatility. The ownership trend shows growing participation. #IMPACTbyTrade
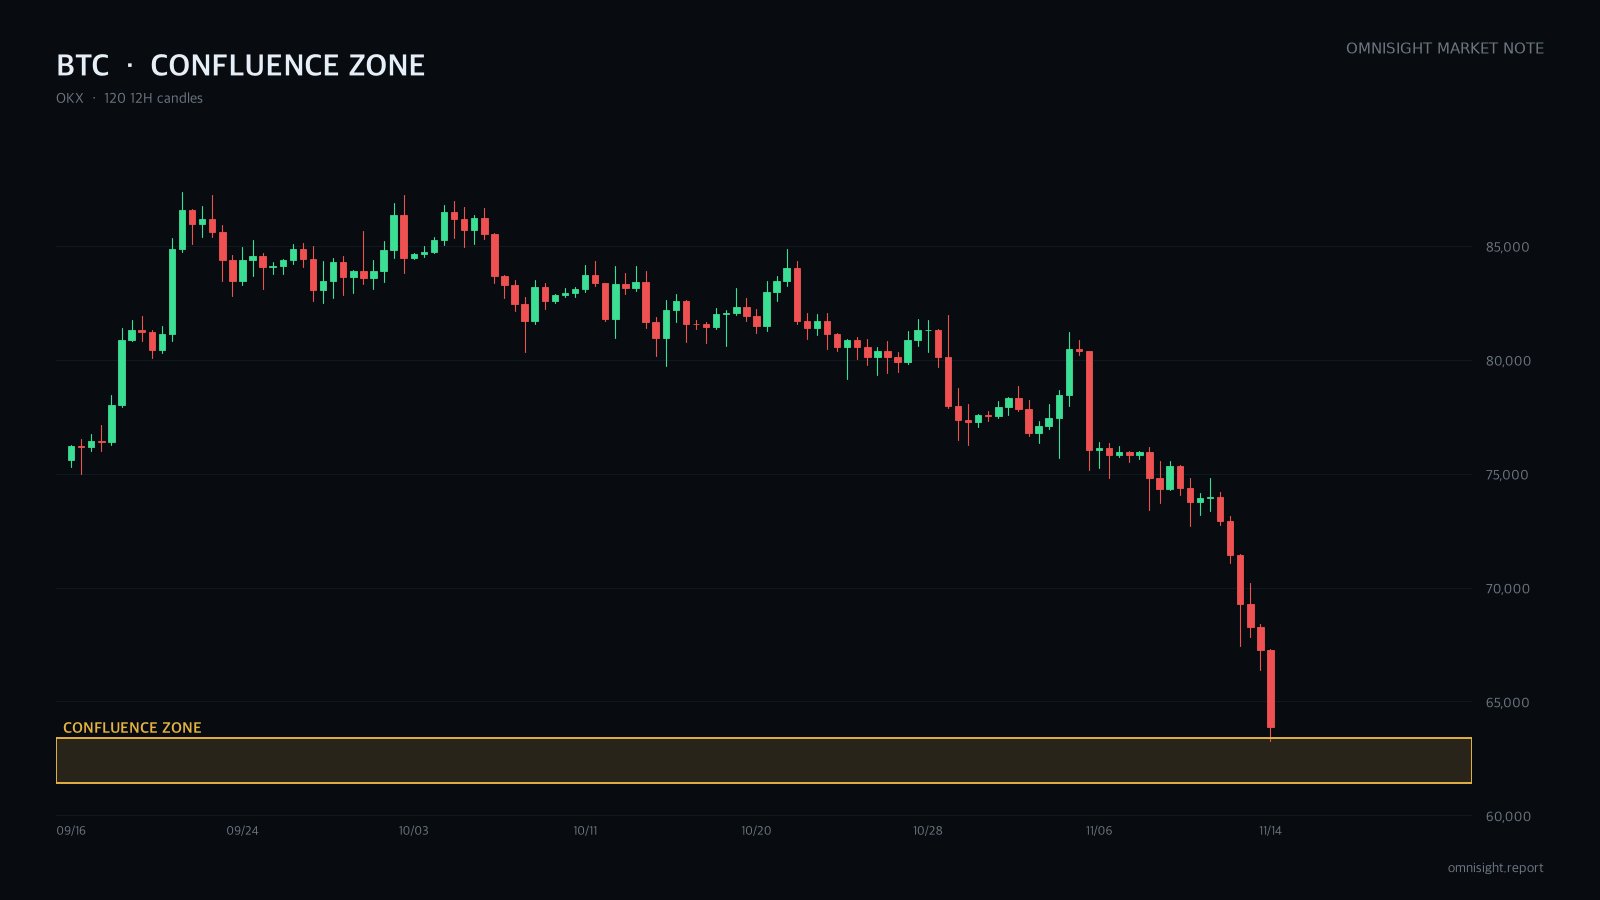
我傾向於做多 $BTCUSDT,但不是現在這個價格。它在不到兩週內大幅下跌,現在正處於上次漲勢開始前的舊底部支撐位。我想在跌破低點後掛單限價買入。問題是:所有時間週期的趨勢仍然向下。 背景:今天早上它就下跌了近 6%,並且位於所有移動平均線下方。資金費率為負,市場充滿恐懼情緒。 為什麼我仍然看漲: - 四種技術分析方法中有三種指向做多,且這三種方法都指向同一個區域。 - 日線、小時線和 15 分鐘線的成交量都創下了區間高點。這看起來像是拋售恐慌(capitulation)。 - 在 1 小時圖上,價格創下了更低低點,但 RSI 卻出現了更高低點。下行壓力正在減弱。 不同的方法,指向同一區域。這種重疊就是我會在那裡掛單的原因。 艾略特波浪分析:從頂部下跌的走勢是一個清晰的五浪結構。第 5 浪已經超過了第 1 浪的長度,所以這波趨勢已接近尾聲。我正在等待最後一波下跌結束,並在擴展目標位上方掛單。 如果我看錯了:日線收盤價跌破舊的累積底部,這也會破壞擴展波浪計數。那意味著這不是底部,而是會進一步下跌。 風險:聯準會升息機率和 ETF 資金外流使宏觀面保持看跌。週末流動性不足可能會導致止損單迅速被觸發。 以上非投資建議。所有決定與責任皆由您自行承擔。 #IMPACTbyTrade
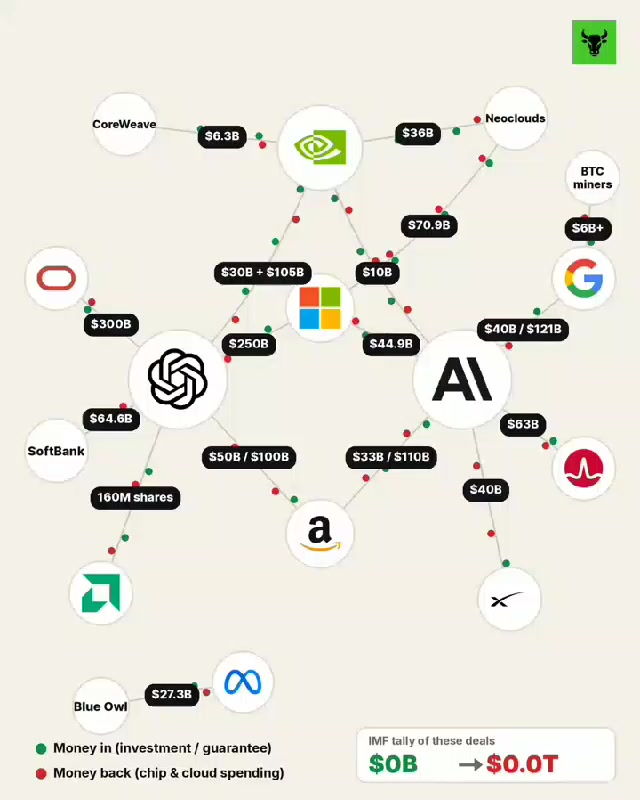
IMF 已正式發出警告,稱與 AI 熱潮掛鉤的循環融資交易總額高達 1.4 兆美元(約 1,900 兆韓元)🤯 簡而言之,大型科技公司與晶片製造商正在投資其產品客戶並為其債務提供擔保,隨後資金繞了一圈,又以營收的形式回流到這些大型科技公司手中。這簡直是一個巨大的循環套利計畫 lol 以下是目前向市場披露的 17 項 AI 循環交易總覽。這些數字真的瘋狂。 1. Nvidia $NVDAXUSDT ↔ OpenAI Nvidia 向 OpenAI 投資 300 億美元,並為其俄亥俄州數據中心的租賃合約提供高達 1,050 億美元的擔保。而 OpenAI 正用 Nvidia 的晶片填滿該數據中心。 2. Oracle $ORCL ↔ OpenAI OpenAI 與 Oracle 簽署了一份價值 3,000 億美元的雲端合約。Oracle 正在最大限度地利用借貸來完成建設。 3. Microsoft $MSFT ↔ OpenAI 微軟擁有 OpenAI 約 27% 的股份,而 OpenAI 已承諾在微軟的 Azure 雲端服務上支出 2,500 億美元。 4. SoftBank ↔ OpenAI 軟銀已向 OpenAI 投入 646 億美元,而 OpenAI 則向軟銀子公司 SB Energy 租賃數據中心。 5. Amazon $AMZN ↔ OpenAI 亞馬遜向 OpenAI 投資高達 500 億美元,而 OpenAI 將其與亞馬遜雲端的合約額外擴大了 1,000 億美元。 6. AMD $AMD ↔ OpenAI AMD 給予 OpenAI 購買其高達 1.6 億股股票的認股權證,價格為每股 0.01 美元(基本上是免費)。作為回報,OpenAI 購買 AMD 的晶片。 7. Google $GOOGL ↔ Anthropic Google 向 Anthropic 投資高達 400 億美元,而 Anthropic 已承諾在 Google Cloud 上至少支出 1,210 億美元。 8. Amazon ↔ Anthropic 亞馬遜向 Anthropic 投資高達 330 億美元,而 Anthropic 已承諾在 AWS 上至少支出 1,100 億美元。 9. Broadcom $AVGO ↔ Anthropic 銀行向一家特殊目的公司 (SPC) 貸款 630 億美元以購買 Broadcom 晶片並將其租賃給 Anthropic。Broadcom 甚至為這些二手晶片的殘值提供擔保。 10. Microsoft + Nvidia ↔ Anthropic 兩者共同投資高達 150 億美元,而 Anthropic 已承諾在微軟雲端服務上至少支出 449 億美元。 11. SpaceX $SPCXXUSDT ↔ Anthropic SpaceX 申請了一筆 400 億美元的貸款用於購買 Nvidia 晶片,並將該運算能力轉售給 Anthropic。順帶一提,Nvidia 也是 SpaceX 的股東。 12. Nvidia ↔ CoreWeave $CRWV Nvidia 擁有 CoreWeave 約 11% 的股份,並保證將購買價值 63 億美元的閒置產能。當然,CoreWeave 購買的是 Nvidia 的晶片。 13. Nvidia ↔ Neoclouds Nvidia 已承諾從中小型 AI 雲端公司購買價值 360 億美元的產能。這些公司利用這筆有保障的收入作為抵押品來借款並購買 Nvidia 晶片。 14. Microsoft ↔ Core Scientific, Nebius $NBIS, IREN $IREN 微軟與它們簽署了價值高達 709 億美元的合約,而它們利用這筆資金購買 GPU。 15. Google ↔ 前比特幣礦工 Google 為 TeraWulf $WULF 和 Cipher Mining $CIFR 的數據中心租賃合約提供數十億美元的擔保,以換取股權。 16. Meta $META ↔ Blue Owl $OWL 他們透過合資企業共同建造一個價值 273 億美元的數據中心,由 Meta 提供 280 億美元的擔保。 17. Anthropic IPO 晶片與雲端供應商 Nvidia、Google、AMD、Micron $MU、Broadcom 和微軟正在購買價值 260 億美元的 Anthropic IPO 股份。與此同時,僅 Anthropic 一家公司未來就欠這些公司數千億美元 😂 這為什麼重要?只要資金持續流動、債務不斷展期,從大型科技公司、半導體到數據中心,看起來營收都在飛漲,每季都能帶來獲利驚喜。 但問題在於,這場 1.4 兆美元的派對只有在終端消費者大舉消費 AI 服務的情況下才能持續。IMF 的警示炸彈指出,一旦供應鏈末端的商業化表現不如預期,為了資本支出 (CAPEX) 而舉債的 AI 模型公司和新興雲端廠商將首當其衝,而那些涉及股權投資和租賃擔保的大型科技公司,也可能因連鎖反應而遭受重創。 結論:當資金流動時,這是世界上最耀眼的永動機,但一旦抽水停止,它可能會演變成一場歷史性的多米諾骨牌崩盤。因此,你絕對必須審視營收數字背後的擔保和債務結構。 這不構成買賣任何特定股票的建議,也不是投資建議。請自行決策並承擔責任 (Not Financial Advice) #IMPACTbyTrade
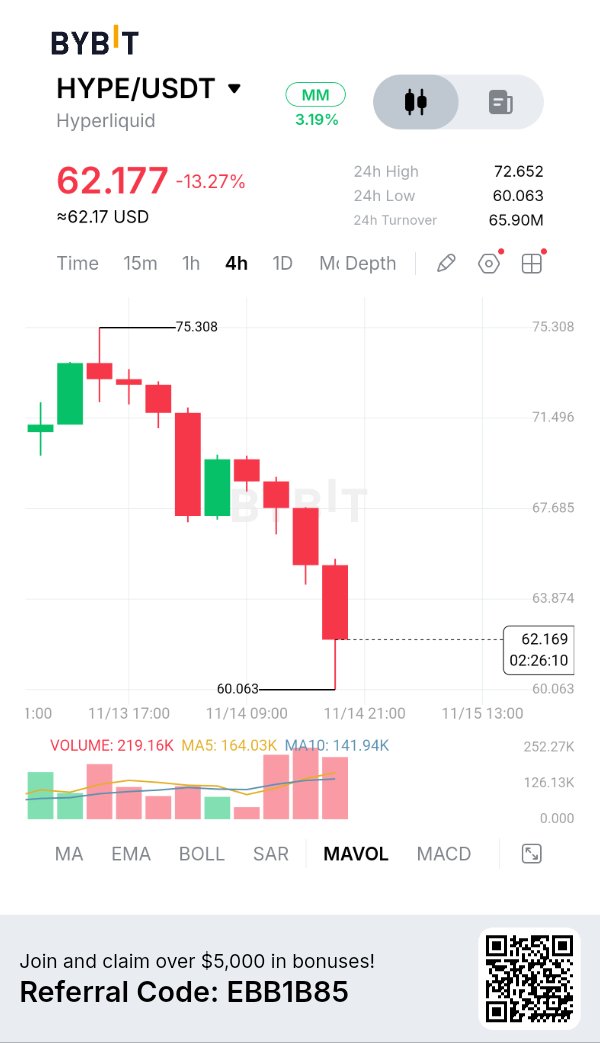
$HYPEUSDT 在單日收盤內跌破了其 1 年平均線和之前的波段低點,跌幅超過 12%。 我的偏好是看空,但我現在不會賣出。我希望看到價格反彈回這次下跌留下的區間。在價格低點拋售通常是成交最差的時候。 下跌趨勢的結構很清晰。4 小時和 12 小時圖上均出現更低的高點。EMA 指數移動平均線呈看跌排列。 綜合研判的基礎在於: - 四種技術分析方法中有三種指向走低 - 日線收盤價低於年度平均線和之前的支撐位 - 市場避險情緒:CPI 數據過熱、利率處於高位、ETF 資金外流 多重因素集中在一個狹窄區間內,為賣方提供了掩護。 ICT 視角:價格目前處於該波段的深折扣區(discount end)。溢價區(premium side)包含了下跌過程中未回補的缺口、被跌破的 4 小時低點、1 小時 EMA20 和深度的斐波那契回撤,所有這些點位重疊在一起。那才是我會選擇賣出的地方。在此之下,近期低點下方的賣方流動性是第一個吸引力所在。 如果我看錯了:價格突破 4 小時內部高點和被跌破的年度平均線。那將是結構反轉,而非回撤。 風險:每個時間框架都處於深度超賣狀態,且艾略特波浪理論(Elliott Wave)顯示會有反彈。如果價格直接滑落而沒有反彈,掛單就不會成交,我也不會去追單。 以上非投資建議。所有決定與責任請自負。 #IMPACTbyTrade
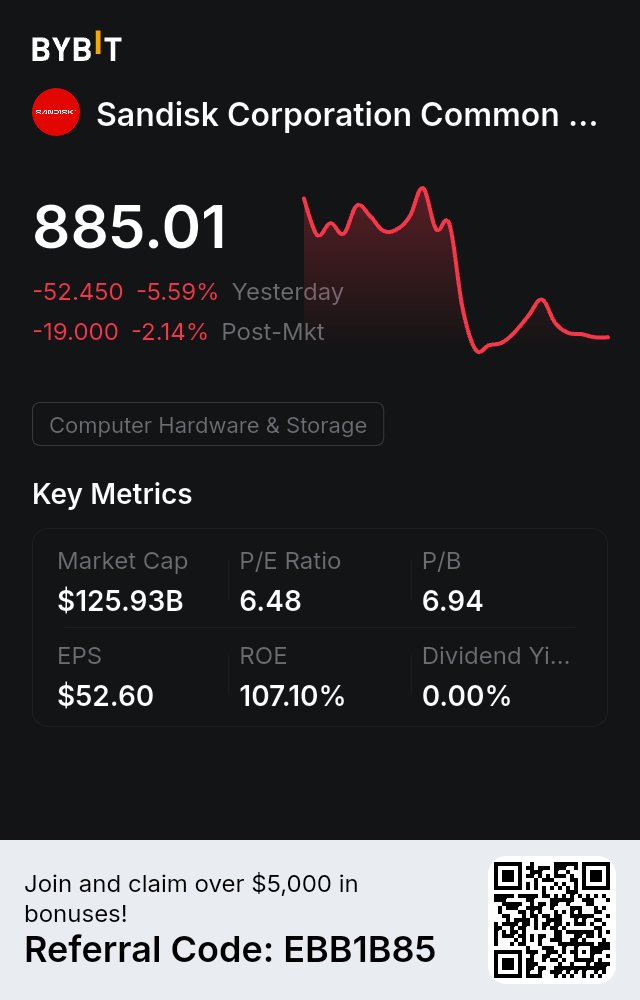
$SNDK 今天又跌了大約 8%,兩天內跌了快 15%。$MU 跌了 4% 到 5%,SK hynix 也跌了約 5%。 首先,把基本面和股價分開來看。 $MU 上季營收達 542 億美元,高於一年前的 113 億美元,GAAP 毛利率為 86.8%。其指引預期下季還會再成長約 13%。這種表現放在任何產業都是頂尖的。然而,$MU 在過去一個月卻下跌了約 20%,較高點跌幅超過 30%。 數據這麼好,為什麼股價還在跌? 記憶體類股最危險的階段往往不是虧錢的時候,而是當毛利率高得驚人,且市場開始提前反應下一波供給過剩的時候。在一個以劇烈波動聞名的產業中,86.8% 的毛利率本身就足以讓人徹夜難眠。拋售潮並不是針對這一季的財報,而是市場在折價預期「這個巔峰還能維持多久?」 這週還有另一層壓力。$NVDA 要換執行長了,市場擔心下游 AI 運算訂單的節奏可能會被打亂。HBM 與 $NVDA 關聯最密切,所以它是第一個被重新定價的。$SNDK 做的是 NAND,離 $NVDA 稍微遠一點,但它先前的漲勢更猛。週三它曾隨 $MU 單日大漲超過 10%,所以這兩天它正以同樣快的速度吐回這些漲幅。 但有幾件事沒變。 記憶體供給依然緊張。$MU 在台灣耗資 45 億美元的新廠最近因勞資糾紛停工,產能擴張只會更慢。SK hynix 已經賣光了未來兩年一半的產能。$NVDA 並不是唯一一家運行 AI 的公司;其他公司的加速器也需要高頻寬記憶體。$NVDA 的領導層變動影響的是時程,而不是需求來源。 所以我依然看好記憶體產業。 但看好記憶體並不代表現在要去接掉下來的刀子。對這些股票來說,單日 5% 的波動很正常。自十月以來,$MU 有三分之一的交易日漲跌幅都超過 5%。隨著 $NVDA 的財報和 $ANT 的上市即將到來,波動只會更大。看好一個產業與決定何時進場、部位要開多大,是兩回事。 我會等兩件事:第一,$NVDA 在財報中對 HBM 和訂單的說法;第二,$MU 和 $SNDK 停止下跌並形成第一個較高低點。到時候我會分批買進,而不是在半山腰就跳進去。 需求還在,週期也還在。這兩點都必須承認。 $NVDAXUSDT #SanDisk 宣佈 8 比 1 股票分割 #AI科技股拋售使納斯達克100指數蒸發2.5兆美元 #IMPACTbyTrade
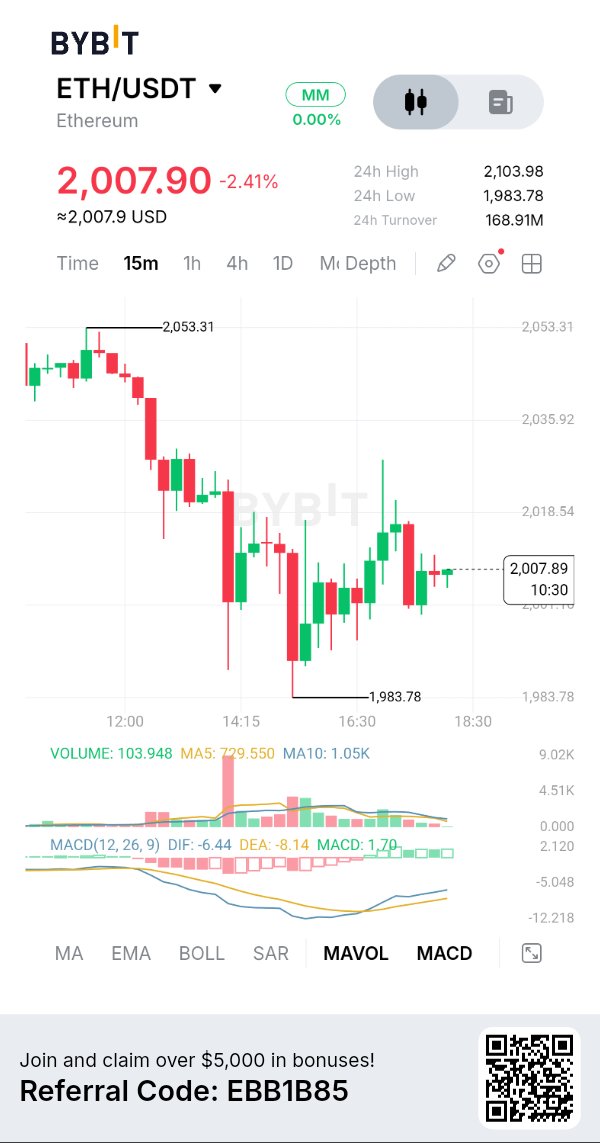
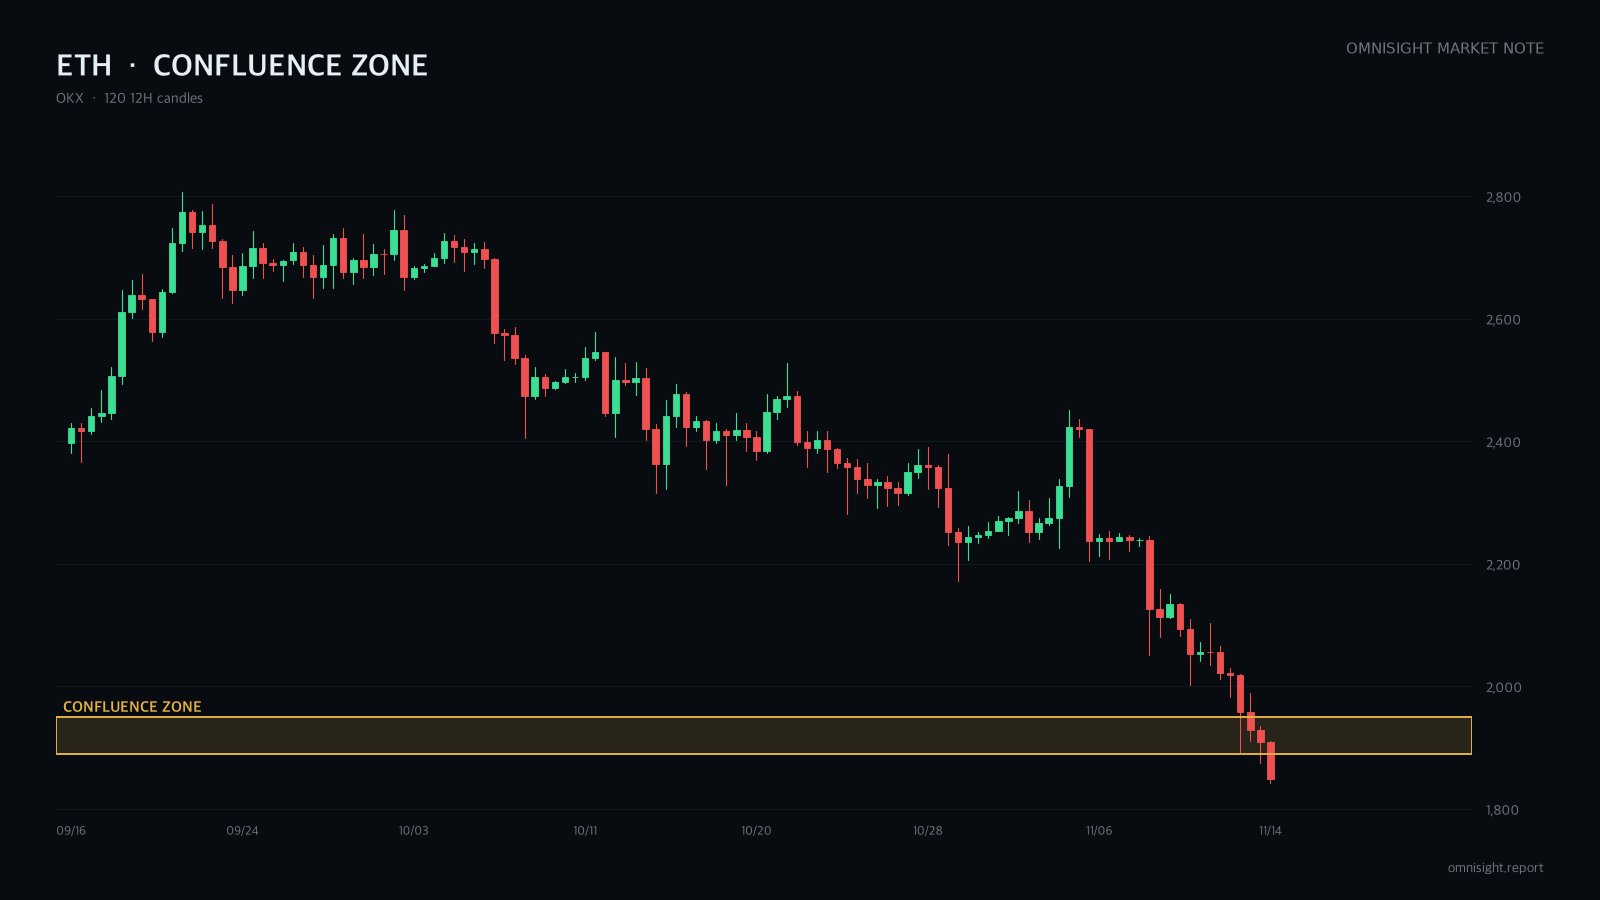
$ETHUSDT 剛剛在一小時內暴跌至 50 天來的最低價。我依然看空,但我不會在這個點位拋售。 我在等待反彈至支撐轉阻力的區域。 問題在於:目前極度超賣,這是雙刃劍。 日線、12 小時線和 4 小時線都呈現低點更低、高點更低(lower highs and lower lows)的走勢。價格低於這些時間週期的所有移動平均線。 看空理由: - 所有高時間週期的結構都向下。 - 看漲背離只出現在 4 小時線和 1 小時線,並未出現在 12 小時線或日線上。 - 市場避險情緒與 ETF 資金流出是助攻,而非觸發因素。 四種技術分析方法中有兩種傾向看空。高時間週期的趨勢打破了僵局。 ICT 觀點:4 小時線破位支撐、下跌前的最後一根陽線,以及最後一段下跌的 50% 位置,這些因素在同一區域重疊。在反彈的高位做空是這裡最乾淨的空單操作。 我判斷錯誤的情況:若價格突破昨日的反彈高點,就打破了「低點更低」的序列。如果 4 小時線收盤價高於反彈前的最後高點,我就撤銷掛單。 風險:極度超賣和負資金費率可能會引發劇烈的軋空(squeeze)。如果價格持續滑落而不反彈,那麼掛單將無法成交。 以上非投資建議。所有決定與責任請自負。 #IMPACTbyTrade
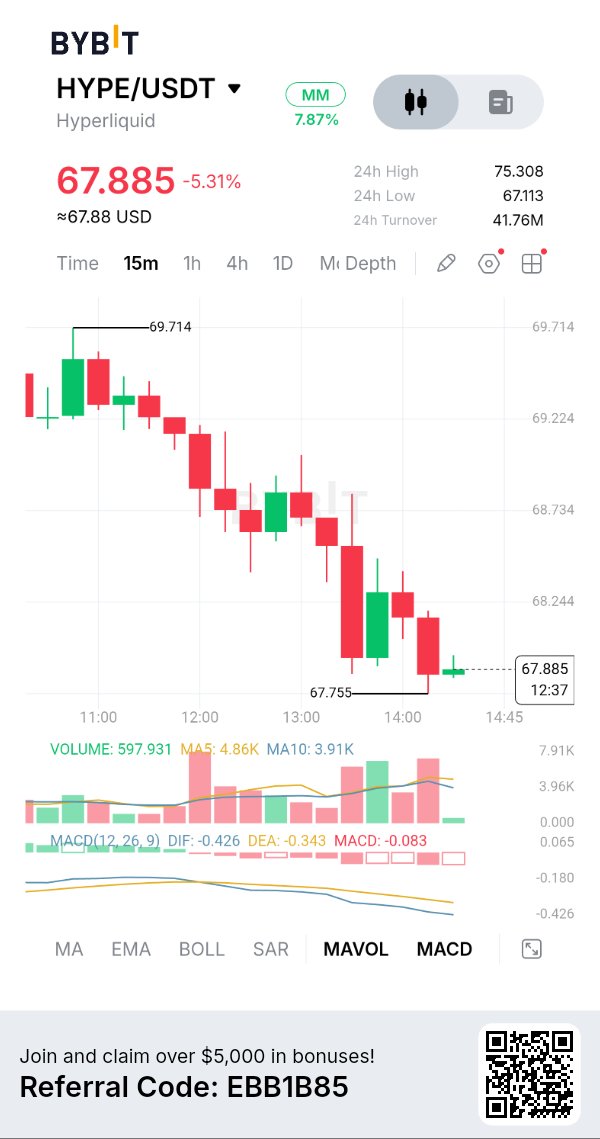
$HYPEUSDT lost the floor it held for two days, and it didn't just wick it. Two big hourly candles closed through on roughly 4x normal volume. I'm short-biased, waiting for a bounce back into that broken floor. The catch: it's already oversold, so no chasing. Since the cycle high, both highs and lows have been stepping lower on the daily and 12h. Why the retest area matters: - The broken floor, the daily 200 EMA and today's unfilled hourly gap stack in one place. - It also lines up with the deep retracement of today's drop. - A first retest of old support is where sellers tend to reappear. That overlap is why it's a zone, not a single line. On ICT, the liquidity below the floor wasn't swept and reclaimed. It was taken with closes. That turns the old floor into resistance, and the upper half of today's drop becomes the area to sell into, not chase. I'm wrong if a 4h close reclaims today's high along with the short-term averages. That's a reversal, not a pullback, and the short case is gone. Risks: BTC just hit a 12-week low after heavy liquidations, so sharp squeezes can hit. HYPE's own tailwinds (rising open interest, buybacks) may slow the drop. Not investment advice. All decisions and responsibility are your own. #IMPACTbyTrade
🚨 This is why Bitcoin keeps crashing
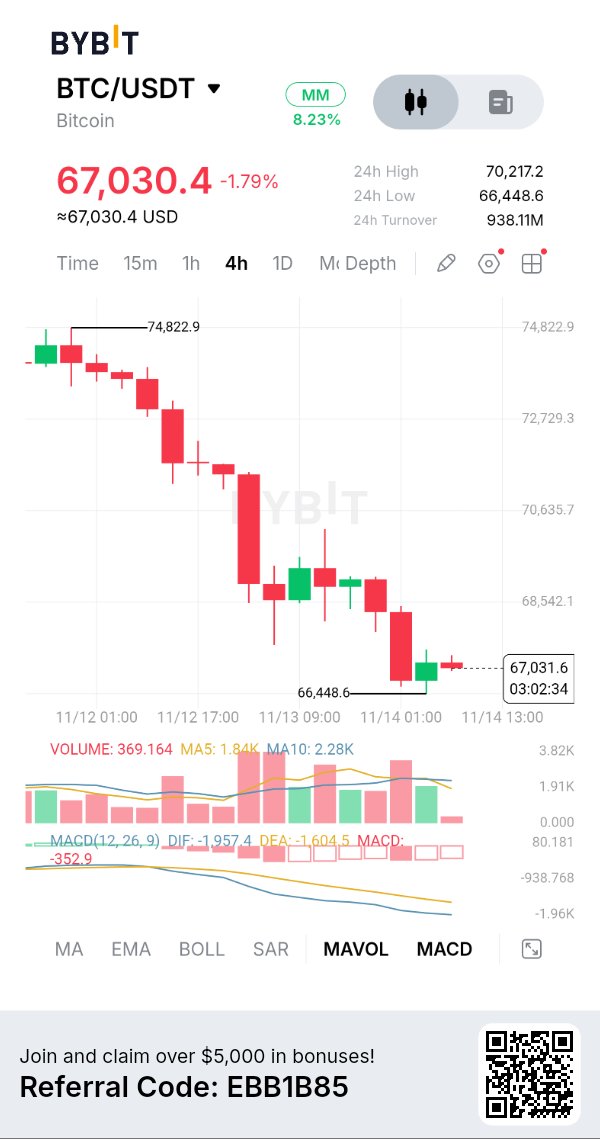
If you still think $BTCUSDT trades like an asset whose price is determined by supply and demand, you need to read this carefully. Because that market no longer exists at all. What you're seeing right now is not normal price action. This isn't just an AI stock sell-off. This isn't just a higher-than-expected inflation reading. And this is definitely not retail investors panic-selling. Most people have no idea what's happening. And by the time everything becomes obvious, the damage has already been done. And by the time everything becomes obvious, the damage has already been done. This cycle didn't start today. It's been quietly brewing beneath the surface for years. And now it's accelerating. The truth is: Once Bitcoin exposure can be created on paper, the 21 million coin cap no longer determines the price. And when paper determines the price, Bitcoin follows leverage and forced selling. That's exactly what's happening to Bitcoin. And it's the same kind of breakdown that has already hit these markets: → Gold → Silver → Oil → Stocks Once derivatives take over, real buyers lose control. Bitcoin's original investment thesis has collapsed. Bitcoin's value was built on two ideas: → A hard cap of 21 million coins → No coin being lent out twice The moment Wall Street built the following on top of it, that framework died: → Futures settled in cash rather than coins → Perpetual contracts → Options → ETFs → Broker loans, wrapped BTC and swaps Since then, paper Bitcoin has effectively become unlimited. Not on-chain. But in the market that determines the price, and that's what really matters. Liquidations. The one metric that explains everything. Over $1.6 billion in leveraged bets wiped out in 24 hours. $870 million hit Bitcoin longs. Spot Bitcoin ETFs saw $1.88 billion in outflows this month. Once paper selling overwhelms real buyers, the price no longer responds to demand. It responds to positions, hedging and cascading liquidations. Wall Street can now sell Bitcoin. They're not guessing the direction. They're doing what they do in every derivatives-driven market: 1⃣ Create paper BTC 2⃣ Short the bounce 3⃣ Force liquidations 4⃣ Close out at lower prices 5⃣ Repeat This isn't “betting.” This is inventory creation. One real BTC can now be counted as: → One ETF share → One futures contract → One perpetual contract → One broker loan All at the same time. That's four claims on a single coin. That's not a free market. That's a Wall Street pricing system wearing a Bitcoin mask. You can choose to ignore it, but don't pretend nobody warned you. $BTC is trading at $68,658, down 4.28% in 24 hours, its lowest level since August and 45.6% below its high of $126,200. If it loses $65,000, traders will next watch $62,500. Throughout the weekend, liquidation data and ETF fund flows will keep showing up on our screens. Follow us to get confirmed data first. #IMPACTbyTrade
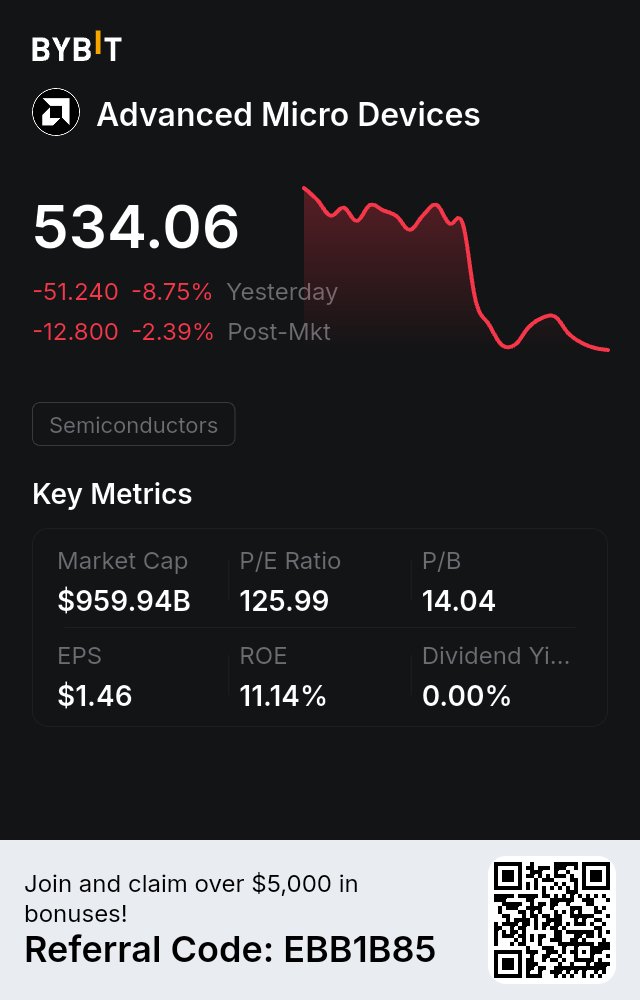
$AMD fell 10% in a single day, even harder than $NVDA. That’s the key thing to understand today. On Thursday, the day Jensen Huang stepped down, the market’s first reaction was to pull money out of $NVDA and move it into $AMD and $AVGO, betting that if Nvidia ran into trouble, orders would flow to its rivals. Today, that trade was unwound entirely: $AMD fell about 10% intraday, $AVGO about 5%, while $NVDA fell only 2% to 3%. The positions that had been moved over were pulled back in a single day, showing that the market wasn’t betting on who would take market share from whom, but was marking down the entire AI supply chain together. The reason for the markdown also came out into the open today. While Jensen Huang was there, $NVDA had been financing and guaranteeing loans for new cloud companies downstream, using its own money to help customers buy its own chips. The moment he left, the market’s first concern was whether that circular financing could keep turning. So the hardest hit today were new cloud companies like $CRWV and $NBIS, both down about 9% intraday. Britain’s Nscale revised its prospectus, with its net loss for the first nine months widening to $1.7 billion. $MSFT is also rumored to be reexamining its contracts with new cloud companies and planning to use fewer of them. Optical modules $LITE and $COHR, and servers $DELL and $HPE, fell anywhere from 6% to 11%. Where the money is flowing out is clear from the order of the declines: those most dependent on financing fell first, those living off $NVDA orders fell next, and the giants with the thickest cash flows fell the least. Interest rates are also working against the market. The 10-year U.S. Treasury yield climbed back above 5% on Thursday, rose above 5.1% intraday today, and the 30-year is around 5.4%. PPI was actually milder than expected, but the bond market isn’t buying it. Tech stocks with high valuations and heavy capital spending are the most sensitive to this number. The Nasdaq 100 fell about 1.7% intraday, the Dow was basically flat, and consumer staples were actually rising. Then there’s next week’s $ANT. Pricing is Wednesday, listing is Thursday, 825 million shares at $70 to $78 per share, raising as much as over $60 billion. With a subscription of that size, funds have to free up cash in advance, and the easiest way is to sell the AI stocks they already hold that have risen and are liquid. $NVDA itself also committed to subscribing for $10 billion in the placement, and now that Jensen Huang is gone, the market is also guessing whether that money will still come through. With these three things stacked on top of each other, a drop like today’s is not surprising at all. So why isn’t this a crash yet? Because only the AI chain is falling; the broader market hasn’t collapsed with it. The S&P fell less than 1% intraday, and the Dow was flat. Money is rotating within tech and hiding in defensive sectors, not selling everything. The kind of panic that sent the SOX down 12% in a single day on 11/5 did not show up today. Positioning has to be calculated carefully too. Through Thursday’s close, the SOX was about 12% higher than last Friday. The earlier rebound was too fast, and part of today’s drop is giving back that rebound. What comes next comes down to two things. One is $NVDA’s earnings on 11/17: how the new management talks about orders, and how it talks about financing for customers. The other is $ANT’s pricing and its first-day performance. If $ANT goes smoothly, it means the primary market is still willing to pay up for AI assets, and the money that was pulled out has a chance to flow back. If pricing is pushed to the bottom of the range or it even opens below the offering price, this round of selling will most likely go back to test the 11/5 lows. I won’t catch a falling knife like $AMD’s 10% drop in a single day this week, and I won’t bet on $NVDA’s earnings night either. Trim on the rebound, buy in batches when it reaches a level, and keep cash to get through next week. The companies are still the same companies. It’s just that right now, no one is willing to carry a bit more exposure before $ANT lists. #JensenHuangExitTestsNvidiasAILeadership $NVDAXUSDT #IMPACTbyTrade
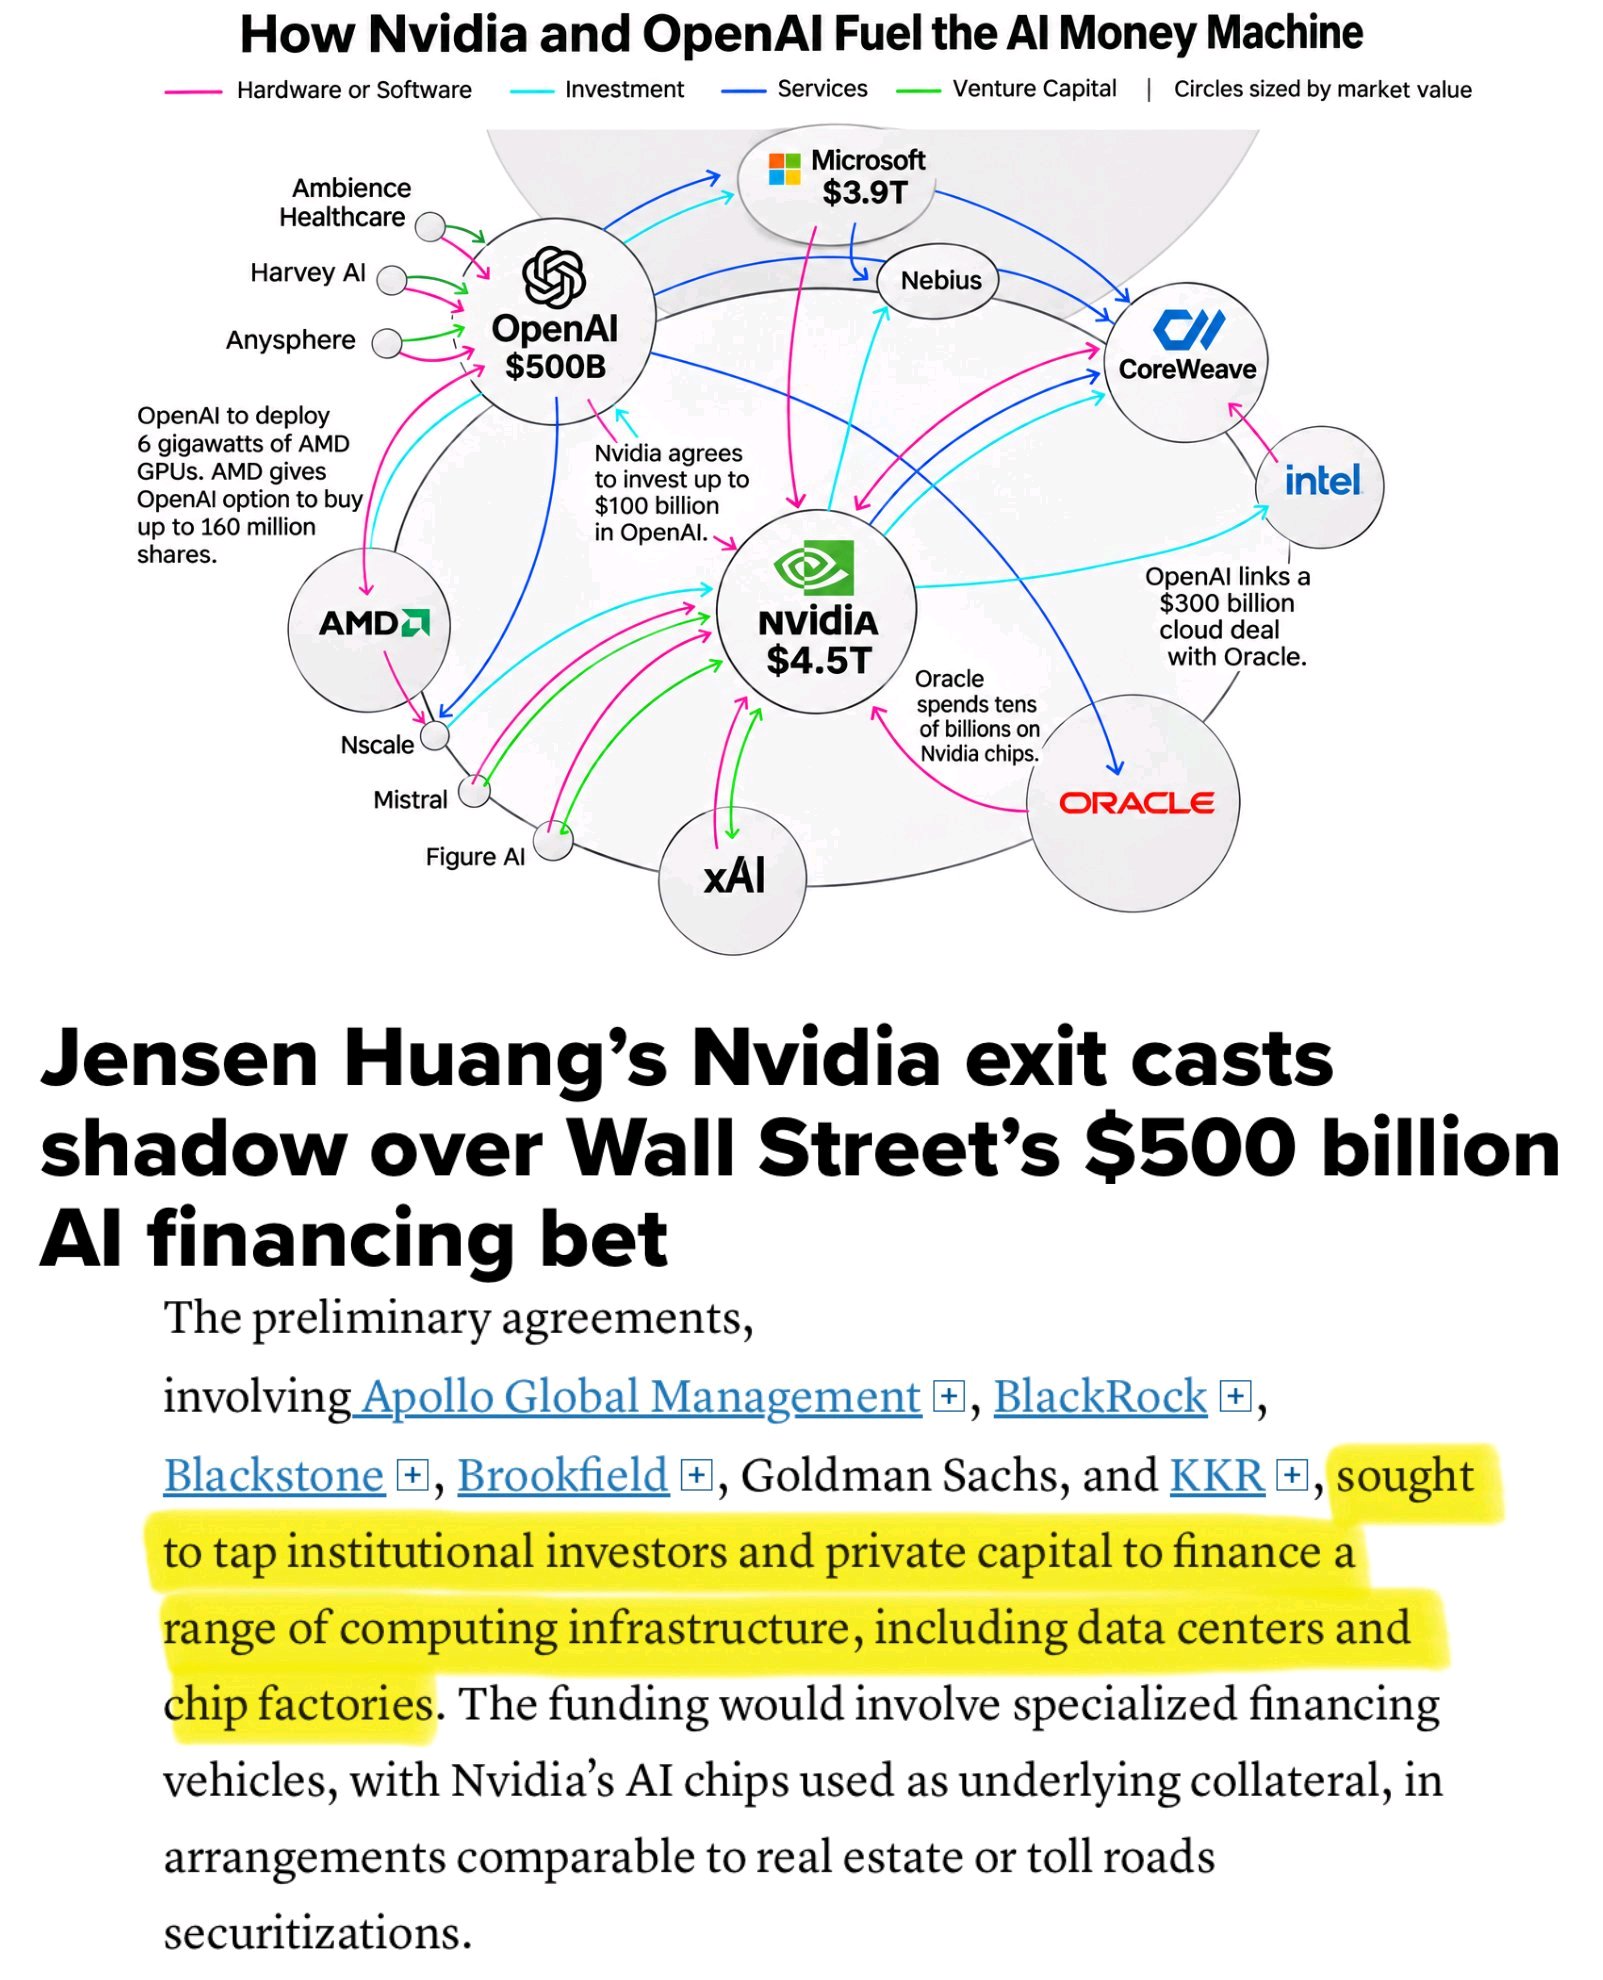
IMF FLAGGED $1.4 TRILLION IN CIRCULAR AI DEALS.
Big Tech is funding its own customers so they can keep buying from Big Tech. Here is every known AI circular financing loop right now: 1. Nvidia ↔ OpenAI: Nvidia invested $30 billion in OpenAI and guarantees up to $105 billion of its Ohio data center leases. OpenAI fills those data centers with Nvidia chips. 2. Oracle ↔ OpenAI: OpenAI signed a $300 billion cloud deal with Oracle. Oracle is borrowing heavily to build the data centers for it. 3. Microsoft ↔ OpenAI: Microsoft owns about 27% of OpenAI. OpenAI committed $250 billion to Microsoft's Azure cloud. 4. SoftBank ↔ OpenAI: SoftBank invested $64.6 billion in OpenAI. OpenAI rents data centers from SoftBank's SB Energy. 5. Amazon ↔ OpenAI: Amazon is investing up to $50 billion in OpenAI. OpenAI expanded its Amazon cloud deal by $100 billion. 6. AMD ↔ OpenAI: AMD gave OpenAI the right to buy up to 160 million AMD shares for $0.01 each. In return, OpenAI buys AMD chips. 7. Google ↔ Anthropic: Google is investing up to $40 billion in Anthropic. Anthropic committed at least $121 billion to Google Cloud. 8. Amazon ↔ Anthropic: Amazon is investing up to $33 billion in Anthropic. Anthropic committed at least $110 billion to Amazon's cloud. 9. Broadcom ↔ Anthropic: Banks lent $63 billion to a special company that buys Broadcom chips and leases them to Anthropic. Broadcom backs the chips' resale value. 10. Microsoft + Nvidia ↔ Anthropic: They are investing up to $15 billion combined. Anthropic committed at least $44.9 billion to Microsoft's cloud. 11. SpaceX ↔ Anthropic: SpaceX borrowed $40 billion to buy Nvidia chips and sells the computing power to Anthropic. Nvidia is a SpaceX shareholder. 12. Nvidia ↔ CoreWeave: Nvidia owns about 11% of CoreWeave and agreed to buy $6.3 billion of its unused capacity. CoreWeave buys Nvidia chips. 13. Nvidia ↔ neoclouds: Nvidia agreed to buy $36 billion of cloud capacity from smaller AI cloud companies. They use that guaranteed income to borrow and buy Nvidia chips. 14. Microsoft ↔ Nscale, Nebius, IREN: Microsoft signed up to $70.9 billion in contracts with them. They use the money to buy GPUs. 15. Google ↔ former bitcoin miners: Google guarantees billions in leases at TeraWulf and Cipher and gets their shares in return. 16. Meta ↔ Blue Owl: A $27.3 billion data center was built through a joint company, with Meta backing it with a $28 billion guarantee. 17. Anthropic IPO: Its chip and cloud suppliers, Nvidia, Google, AMD, Micron, Broadcom and Microsoft, are buying $26 billion of its shares. Anthropic owes those same companies hundreds of billions in future spending. When money keeps flowing, these loops make everyone's revenue look strong. $NVDAXUSDT #IMPACTbyTrade
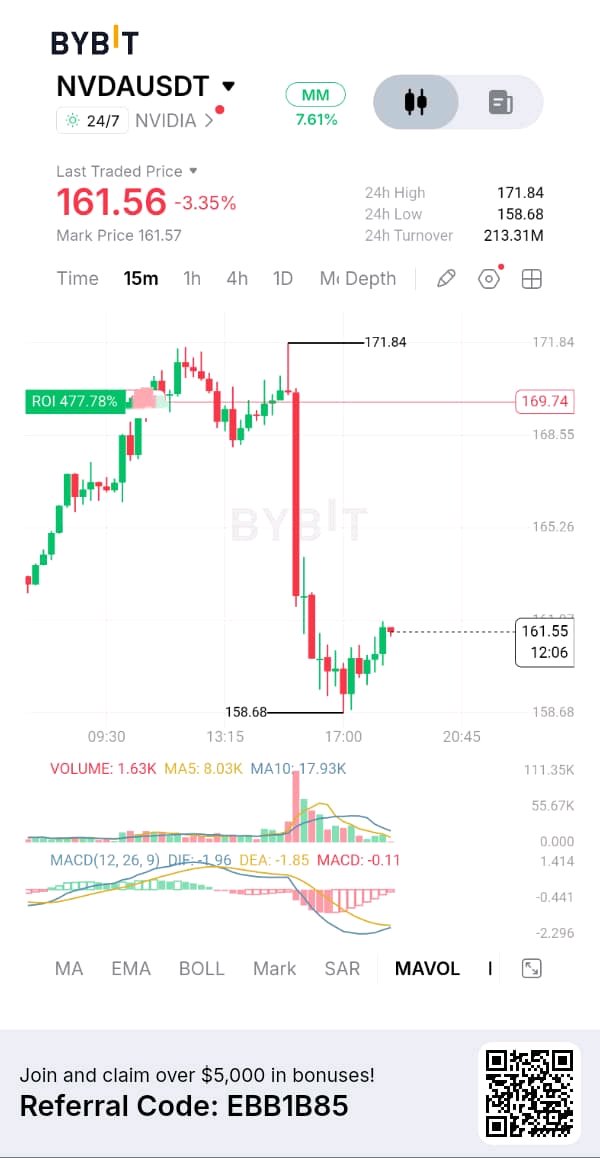
NVIDIA's NVDAUSDT market is experiencing significant selling pressure after a sharp intraday reversal from the $171.84 high. Although buyers have started defending the $158.68 region, the recovery remains relatively weak, and the market has not yet confirmed that the selling pressure is over. My Bybit 15-minute chart shows $NVDAXUSDT trading around $161.56, down approximately 3.35%. The price action suggests that sellers have regained short-term control following an earlier bullish move. The next reaction around $158.68 could determine whether this is simply a temporary correction or the beginning of another downward leg. CHART + TECHNICAL ANALYSIS The most important development is the aggressive bearish candle that pushed price from the $169 region toward $160, followed by another move that established an intraday low of $158.68. Buyers have attempted to recover from that low, gradually pushing price toward $161.56. However, the recovery has not yet reclaimed the previous breakdown structure. MACD remains negative, with DIF at -1.96, DEA at -1.85 and histogram around -0.11. Although the negative histogram suggests bearish momentum is easing slightly, the indicator has not confirmed a bullish reversal. FUNDAMENTAL PERSPECTIVE NVIDIA remains one of the most important companies in the global semiconductor industry, with its GPUs playing a central role in artificial intelligence training, data centers and accelerated computing. Its long-term growth opportunity is connected to continued AI infrastructure investment, demand for advanced chips and expansion of enterprise computing. However, strong company fundamentals do not prevent short-term market corrections. Valuation, earnings expectations, capital expenditure trends and broader technology-sector sentiment can all influence price performance. MACRO + MARKET CONDITIONS Technology stocks are sensitive to interest-rate expectations, liquidity conditions and changes in investor appetite for risk. A weaker broader equity market could increase pressure on NVDA, even if its company-specific fundamentals remain strong. I would also monitor the performance of major semiconductor stocks and the wider Nasdaq market. A recovery supported by the broader technology sector would provide stronger confirmation than an isolated bounce. MY TRADING PLAN I wouldn't chase the current bounce or enter blindly during the consolidation. For a bullish position, I want to see buyers defend $158.68, reclaim resistance and demonstrate stronger volume. For a bearish position, I would prefer a confirmed breakdown followed by a failed attempt to recover the lost support. Position sizing will remain controlled, with a predefined stop-loss and partial profit-taking at the first target. #IMPACTbyTrade
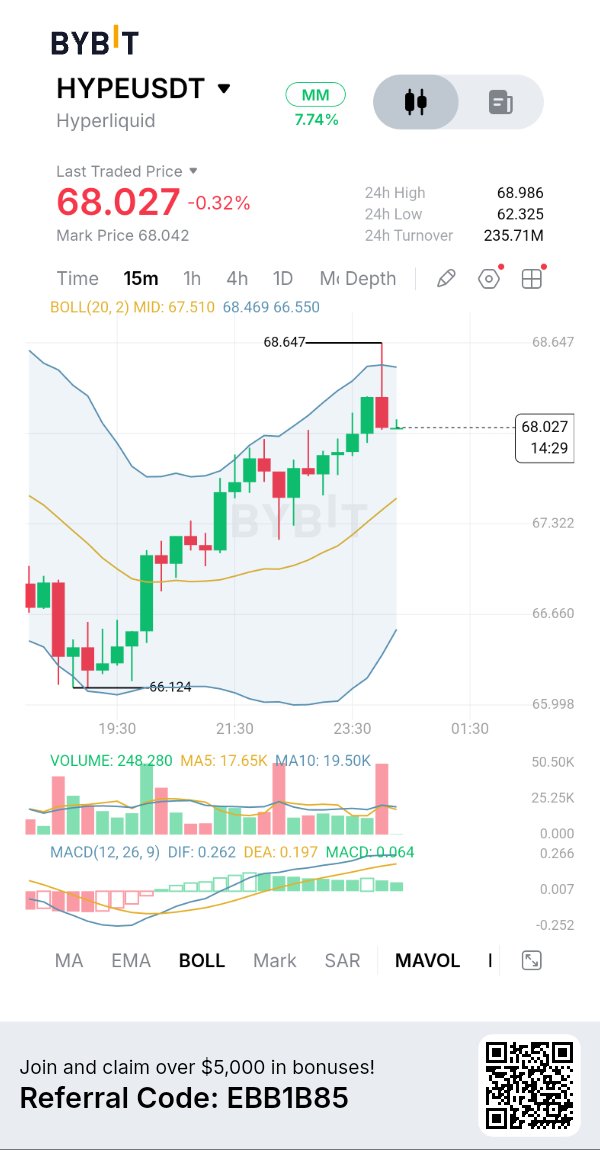
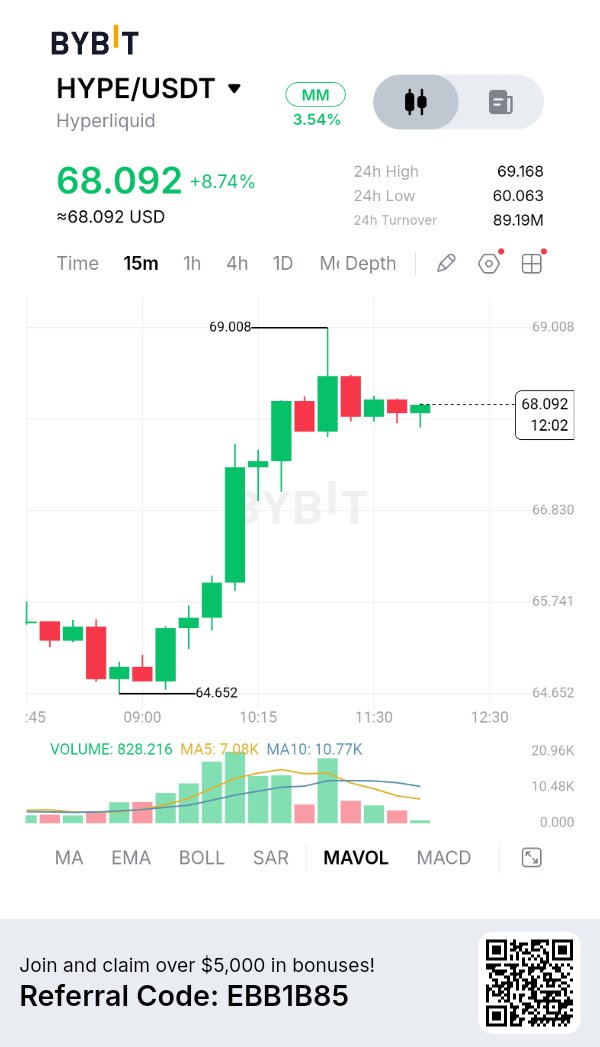
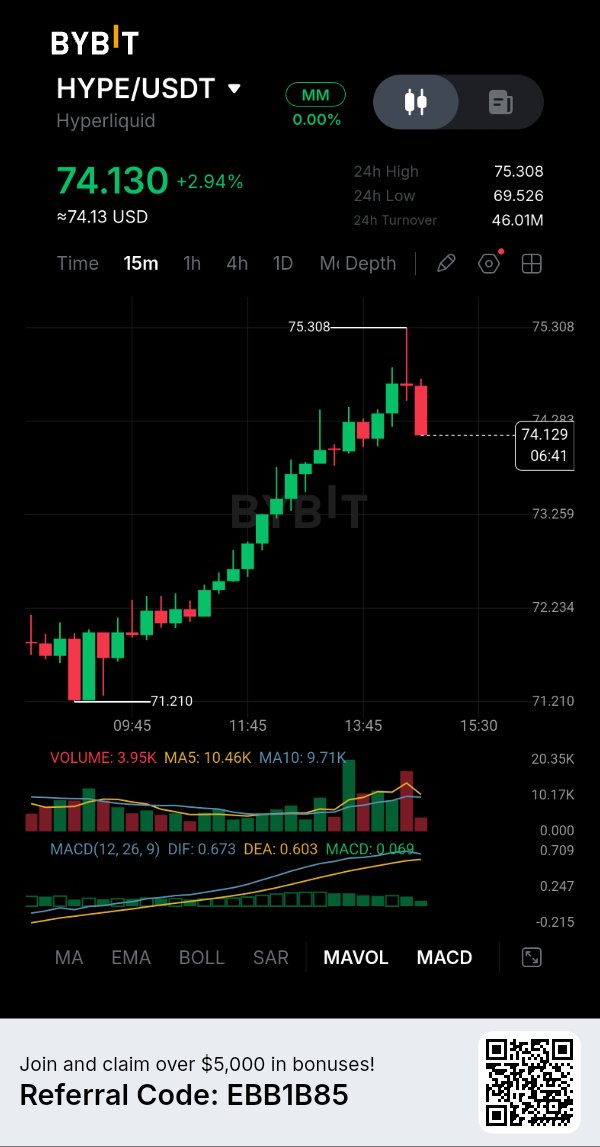
$HYPEUSDT is showing renewed buying strength after recovering from the $71 region, but the latest rejection near $75.30 suggests that the market is approaching an important decision point. Buyers have made considerable progress during this intraday recovery, although the next move will depend on whether they can overcome resistance with stronger volume and maintain the newly established bullish structure CHART + TECHNICAL ANALYSIS My Bybit $HYPEUSDT 15-minute chart shows price trading around $74.13, up approximately 2.94%. Price advanced from an intraday low of $71.210 to a high of $75.308, representing a strong recovery within the observed session. For HYPE, the important question is how increasing platform activity translates into sustainable token demand. A growing ecosystem can strengthen long-term fundamentals, but token appreciation still depends on market demand, liquidity and the economic value captured by the token. TOKENOMICS AND VALUE ACCRUAL HYPE has utility within the Hyperliquid ecosystem, including staking, validator participation and trading-related mechanisms. An important component of its token economics is the Assistance Fund, which uses protocol revenue to acquire HYPE through its fee-related mechanism. This creates a potential connection between platform activity and token supply reduction. The key levels on my chart are $75.308 resistance, $73.259 immediate support, $72.234 secondary support and $71.210 as the major visible intraday swing low. FUNDAMENTAL ANALYSIS Hyperliquid continues to develop its position as a major decentralized trading infrastructure platform. Its ecosystem includes perpetual futures, spot markets and HyperEVM, which expands the possibilities for decentralized applications and financial services. The HIP-3 framework is particularly interesting because it allows approved third-party deployers to introduce additional perpetual markets. This potentially expands the range of assets and trading opportunities available within the ecosystem. The candle structure shows a sequence of higher highs and higher lows, suggesting that short-term buyers have gained control. However, the latest rejection candle indicates that sellers are becoming active around the $75.30 resistance region. MACD remains positive, with DIF at 0.673, DEA at 0.603 and histogram around +0.069. This indicates that bullish momentum is still present, although the narrowing difference between the MACD lines makes it important to monitor whether momentum continues improving. Volume currently reads approximately 3.95K, below MA5 at 10.46K and MA10 at 9.71K. This is an important observation because a breakout without stronger trading participation may struggle to sustain itself. #IMPACTbyTrade

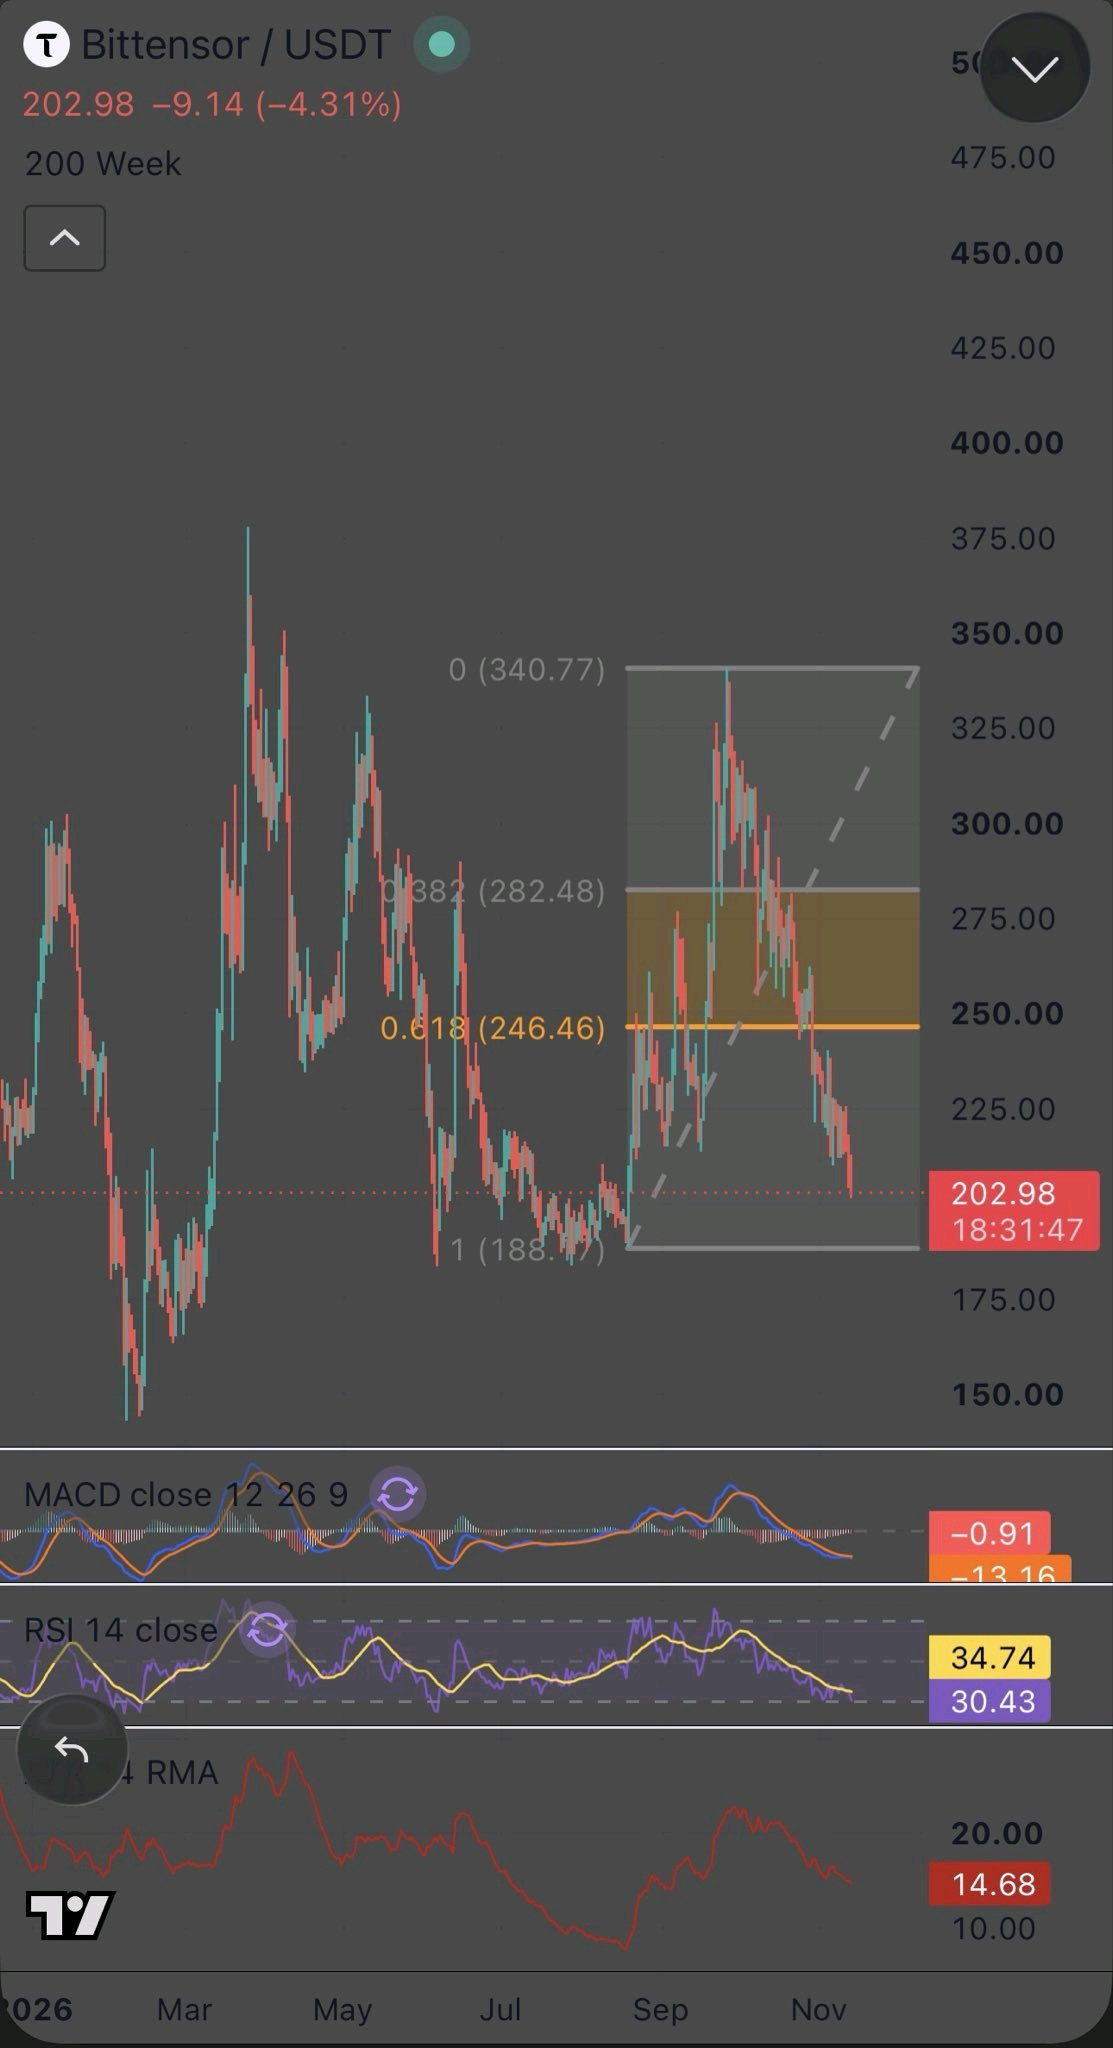
你因為覺得 $TAO 終於安全了,所以在 $280 時買進。 現在你打開圖表,看到 $203,然後在有人問你套牢狀況如何之前,趕緊關掉 App。 我懂那種感覺。這正是為什麼我幾週來一直發文提到這個價位的原因。 從 $188 低點到 $340 高點畫出的斐波那契回撤: 0.382 落在 $282 0.618 落在 $246 完全回撤點落在 $188 黃金分割區(Golden pocket)是那條底線。一旦它在 10 月下旬被跌破,每一次反彈都死在它下方。 現在 $TAO 交易價格為 $203。 這大約比我一直指出的地板價高出 7%,而當時大多數人還在等著 $340 回來。 目前動能顯示: RSI 接近 30,正在叩關超賣區 MACD 仍低於訊號線,但柱狀圖正在縮小 賣方正變得疲軟,但還沒結束 決策點位是 $188。 守住它,這就會形成與 7 月底部構成的雙重底。第一個要收復的牆是 $246。 如果在日線收盤時失守,論點就失效了。3 月接近 $150 的低點將會重新進入視線。 我並沒有猜測它會走向何方。我在幾週前就畫好了地圖,而價格只是跟著它走而已。 你今天感受到的痛苦,早在價格到達你的投資組合之前,就已經印在這張圖表上了。 $QNTUSDT $NVDAXUSDT #IMPACTbyTrade
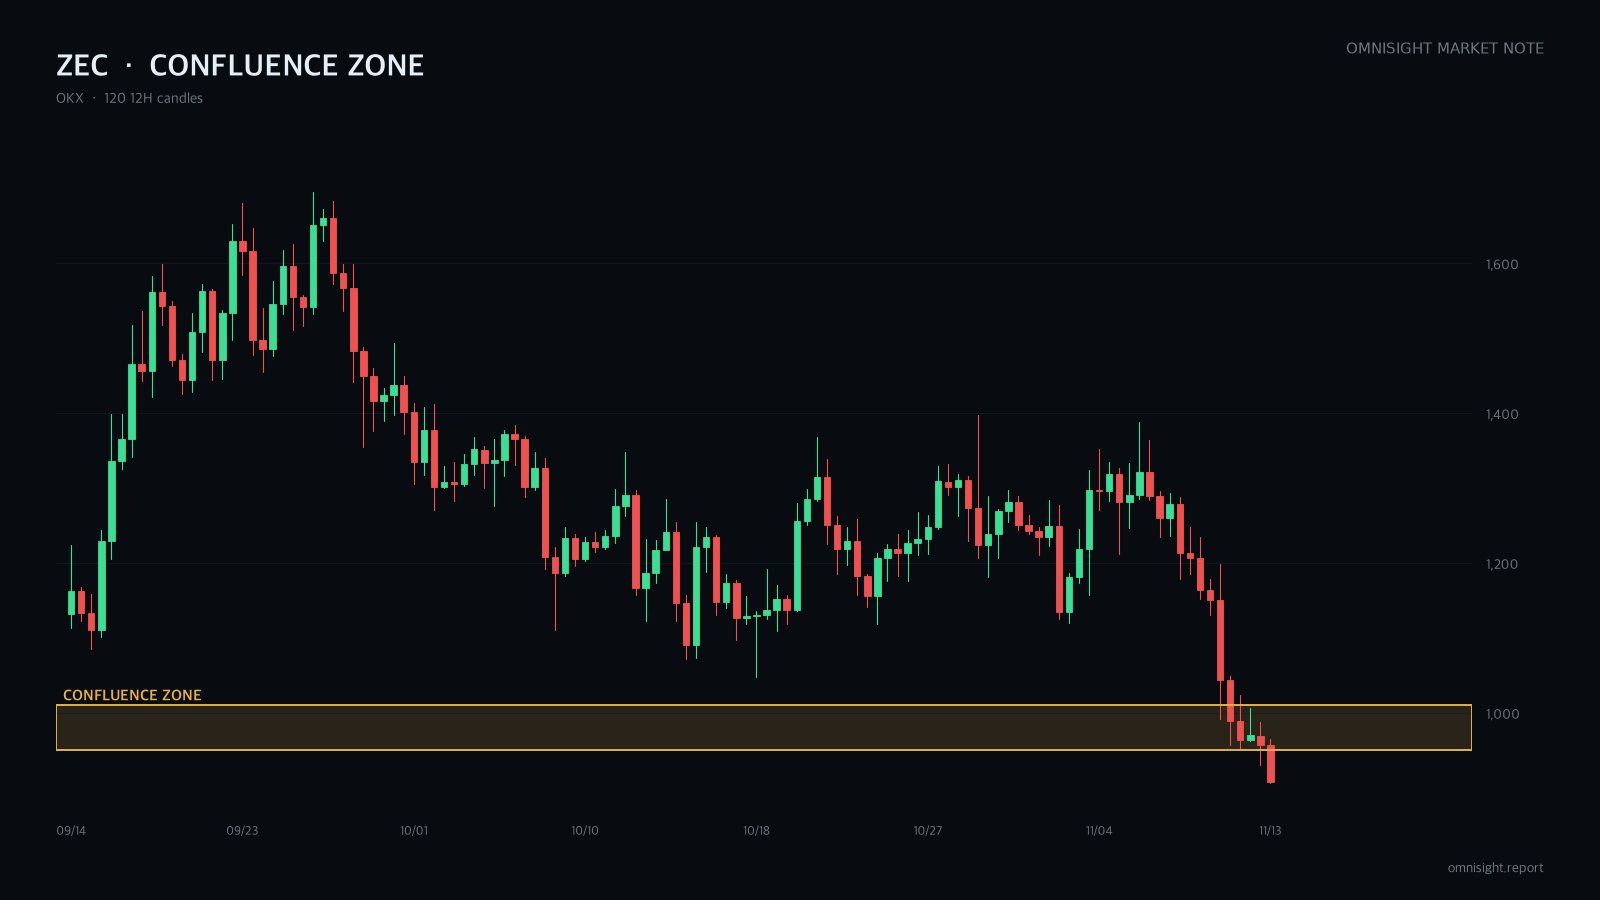
$ZEC lost a six-week floor on heavy volume and has now printed four lower highs on the daily. I'm leaning short, but I'm not selling here. I want a bounce back into the area where the break happened. The catch: it's already deeply oversold, so that bounce may never come. The floor held for six weeks before two heavy sell days took it out. Price then lost the 12h long-term average too. Every daily rally since has stalled lower than the last. What lines up in the sell area: - the 50-79% retracement of the latest 4h leg down - the recent 1h bounce highs - the underside of the broken floor, where trapped buyers may want out Three reasons in one area is why I wait instead of chasing. From an ICT view, higher-timeframe structure has already broken down, so retracements are premium to sell, not a reversal. Buy-side liquidity sits above the recent 4h and 12h swing highs. The stop goes beyond that, so a sweep alone doesn't take me out. I'm wrong if a 4h candle closes back above the 12h swing high. That ends the lower-high sequence. Risks: price may fall straight to the daily 200 EMA without retracing, leaving the order unfilled. Post-crash BTC swings can whip both ways. Not investment advice. All decisions and responsibility are your own. $BTCUSDT #IMPACTbyTrade
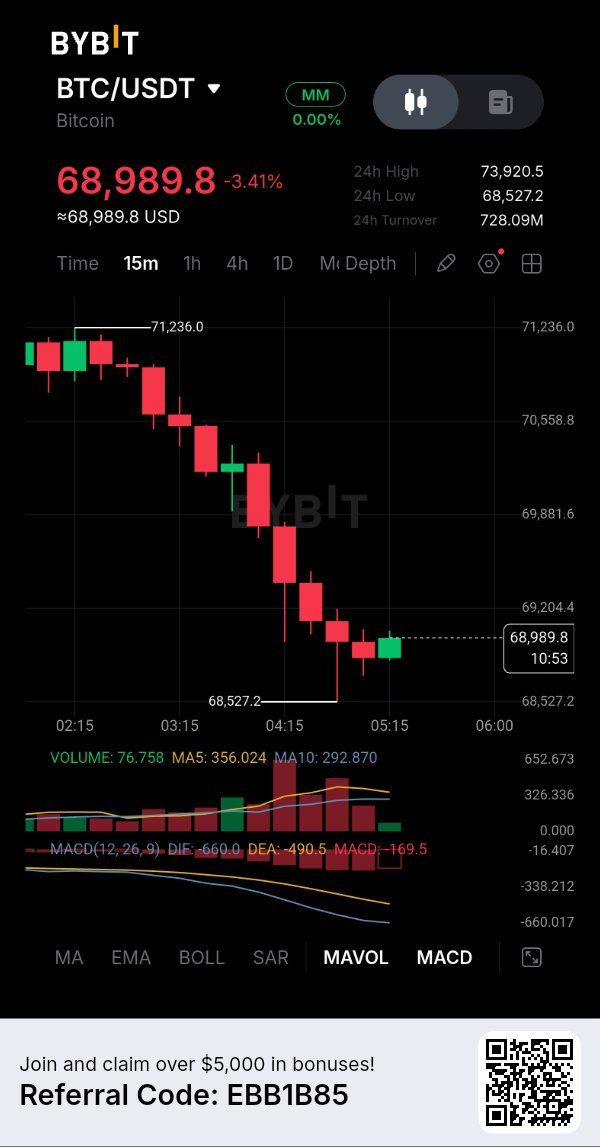
$BTCUSDT 剛在直線下跌後創下了新低。雖然我看空,但我現在不會賣出。 我正在等反彈,看看能否回到剛剛跌破的支撐位。 在清算潮之後去追單通常是最糟糕的做空時機。 自 11 月初的高點以來,日線、12 小時線和 4 小時線都在不斷走低,形成更低的高點和更低的低點。今天的跌勢直接穿透了從昨晚開始維持的 4 小時箱體。 為什麼我依然傾向看空: - 所有四種技術指標都指向同一個方向。 - RSI 隨著價格持續下跌。沒有看漲背離;4 小時圖顯示有隱藏的看跌背離。 - 宏觀經濟是推動因素,而非觸發因素:CPI 高於預期、ETF 資金流出。 我的區間疊加了剛剛跌破的箱體、今日跌幅約 38% 的回撤位以及 1 小時線的缺口。這是支撐位轉阻力位後的首次回測。 從艾略特波浪理論來看,第 3 浪下跌的長度剛剛與第 1 浪相等。第 4 浪反彈通常會從這裡開始,並在接近回撤位附近停滯,隨後迎來第 5 浪下跌。 如果價格突破了上一個 12 小時線的波段高點並重疊了第 (i) 浪的低點,那我的判斷就是錯的。這將打破「更低高點」的序列,並使此波浪計數失效。 風險:在長時間的軋多後已經嚴重超賣,因此反彈可能會非常劇烈。聯準會和指數事件可能會將此過程拉長至 3 到 10 天。 非投資建議。所有決定與責任請自負。 #IMPACTbyTrade
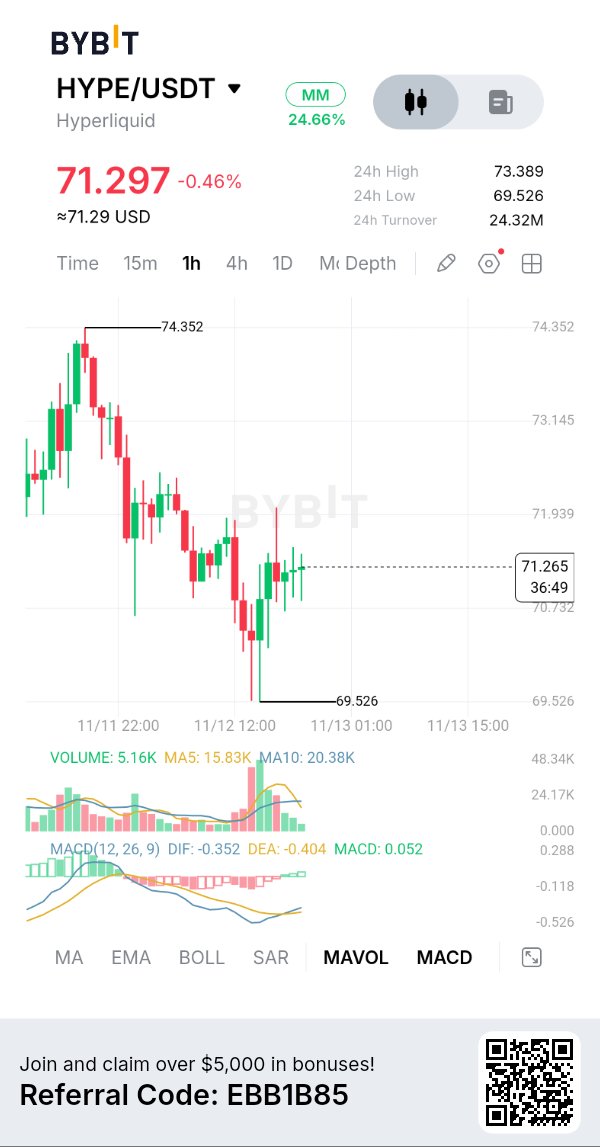
$HYPEUSDT has made lower highs and lower lows on the daily, 12h and 4h. I'm bearish, but I'm not selling here. Price sits in the discount half of the 4h range after a sharp drop. Shorting this spot gives a poor risk/reward. I'm waiting for a bounce into the zone above. Since the prior peak, each 4h bounce has stalled below the last one. No structure shift yet. Why the zone above matters: - It is the 0.618-0.79 retracement of the latest down leg - The 4h 20 EMA runs right through it - It overlaps the supply left by the last up candle before the drop - A broken support now sits there as resistance Four separate reasons stacked in one band. That is where I expect sellers to test again. ICT read: the bearish order block covers the premium half of the range. Selling a retrace into it keeps the stop above structure. The first target sits under the double bottom, where sell-side stops are resting. Where I'm wrong: a break above the last lower high on the 4h/12h. That ends the lower-high sequence, and I step aside. Risks: the recent low lines up with the daily 200 EMA. And BTC just hit a 12-week low on rate and Nvidia CEO headlines, so swings can be violent both ways. Not investment advice. All decisions and responsibility are your own. #IMPACTbyTrade
$ETHUSDT swept below its prior low today and snapped back. It looks like a bottom. I read it as fuel for a bounce I want to sell. Bias: short. I'm waiting for the bounce to reach today's broken support. The catch: the bounce could run past it. Context: daily, 12h and 4h all print lower highs and lower lows. Price sits below the 20, 50 and 200 EMAs on every timeframe. Today's inflation shock pushed it through a round-number floor before buyers stepped in. Why that zone: - Three of four technical methods (ICT, Wyckoff, Elliott) point short - Broken support, a 1h order cluster and the midpoint of the recent drop stack in one area - Macro and news are risk-off, so there's little fuel for a bigger rally When independent reads land on one zone, sellers have a reason to defend it. From an ICT lens, the sweep took out resting stops but didn't change structure. No break above the last 4h lower high yet, so rallies are retracements inside a downtrend. Where I'm wrong: a 4h close above that lower high breaks the sequence. Then I step aside. Risks: - Bullish divergence on 4h and 1h could stretch the bounce - If price drops without bouncing, the order never fills. I won't chase Not investment advice. All decisions and responsibility are your own. #IMPACTbyTrade