
taiba
7446點贊0分享74粉絲6關注
crypto lover
crypto lover
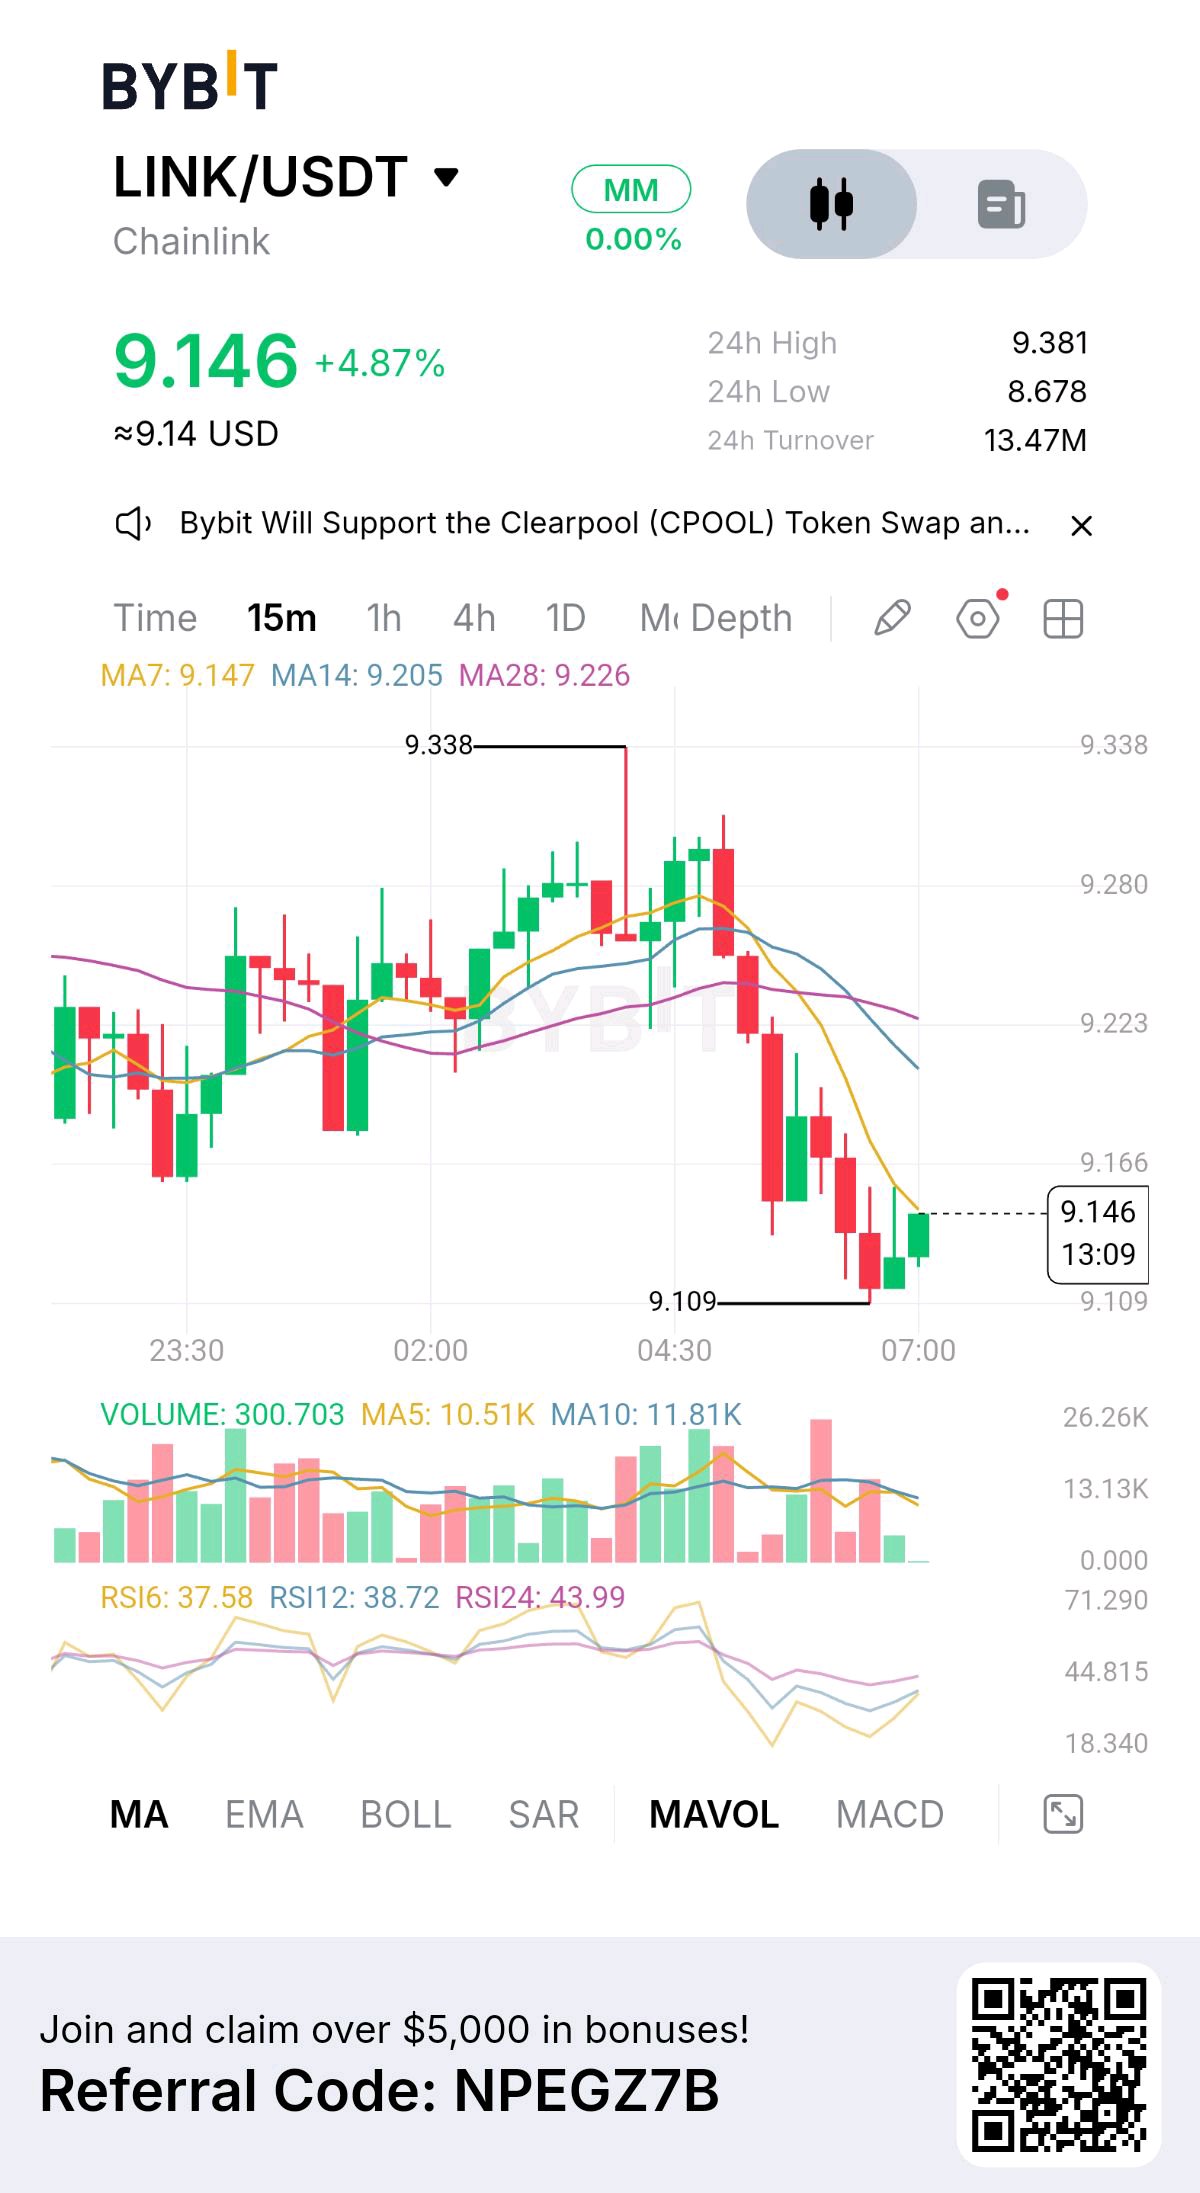
LINK is bouncing above $9.20 after briefly falling toward $8.60, but the recovery is happening while its weekly structure remains deeply negative. What makes this move interesting is that Chainlink is gaining institutional relevance at a time when its token price is still struggling. The latest development involves Moody's Ratings successfully testing Chainlink's cross-chain infrastructure for distributing credit-rating information across multiple blockchains. The question is whether institutional adoption can eventually translate into measurable demand for LINK. LINK recently traded near $9.25, up approximately 6.2% over 24 hours but down around 10.9% over seven days. Its latest 24-hour range stands at $8.616–$9.379, with market capitalization around $6.92B and trading volume near $337M. The $9.35–$9.40 zone is immediate resistance, while $9.00–$8.60 represents the important support region. A sustained move above $9.40 would strengthen the short-term recovery, but buyers still need to overcome the previous selling pressure. The fundamental catalyst is particularly important. On November 10, Chainlink and Moody's Ratings announced the successful completion of a pilot using Chainlink's Cross-Chain Interoperability Protocol (CCIP). The project demonstrated how Moody's credit-rating information could be distributed simultaneously across permissioned and permissionless blockchain networks. This matters because tokenized financial assets need reliable credit information regardless of which blockchain they operate on. However, there is one important distinction: the pilot was conducted in a testnet environment using representative data, not a live production deployment. It demonstrates technical capability, but commercial adoption still needs to follow. Another development strengthens the institutional narrative. Chainlink has introduced a revenue mechanism through which offchain and onchain enterprise revenue is converted into LINK and accumulated in the Chainlink Reserve. This creates a more direct connection between institutional adoption and token economics. The strategic opportunity is significant, but the actual impact depends on the amount of revenue generated and converted into LINK. Partnerships and integrations alone do not establish meaningful buying pressure. Tokenomics also deserve attention. Approximately 748.1M LINK are circulating against a maximum supply of 1B, meaning around 74.8% of the maximum supply is already in circulation. The remaining supply can still create distribution pressure as additional tokens enter circulation. However, the Reserve mechanism introduces a different demand-side consideration: if enterprise revenue grows and more LINK is accumulated, it could gradually strengthen the connection between network adoption and token demand. The important question is whether this demand can become large enough to offset circulating supply. Derivatives reveal another interesting development. CoinGlass reports approximately $397.26M in aggregate futures open interest, up 5.24% over 24 hours. Futures volume reached approximately $396.24M against $77.39M in spot volume, making derivatives activity roughly 5.1 times larger than spot trading. Funding is slightly positive at approximately +0.0002% per eight hours, while 24-hour liquidations reached approximately $681K, with longs accounting for around $496K. This suggests speculative participation is increasing alongside the recovery, but the relatively larger futures activity means buyers still need stronger spot confirmation. Key figures $9.25 — Current price area $9.35–$9.40 — Immediate resistance $9.00–$8.60 — Important support zone $8.616 — Recent 24H low $6.92B — Market capitalization $337M — 24H trading volume 748.1M / 1B — Circulating / maximum supply $397.26M — Aggregate futures open interest $396.24M / $77.39M — Futures / spot volume +0.0002% — Funding per eight hours $681K — 24H liquidations Bullish confirmation: Reclaim $9.40 and hold above it with stronger spot volume. That would put $9.80–$10.00 in focus, followed by the possibility of a broader recovery toward $10.50. Bearish confirmation: Lose $9.00 and fail to recover it. That would expose $8.60, with further weakness possible toward $8.20 if spot demand remains weak and leveraged positions begin unwinding. Chainlink is building a stronger institutional infrastructure story through Moody's, cross-chain interoperability and its revenue-funded Reserve mechanism. But institutional adoption and token appreciation are two different things. The decisive signal is whether real enterprise activity starts translating into sustained LINK demand while buyers reclaim $9.40—or whether derivatives-driven recovery fades under continued selling pressure. $LINKUSDT #ByXIMPACT
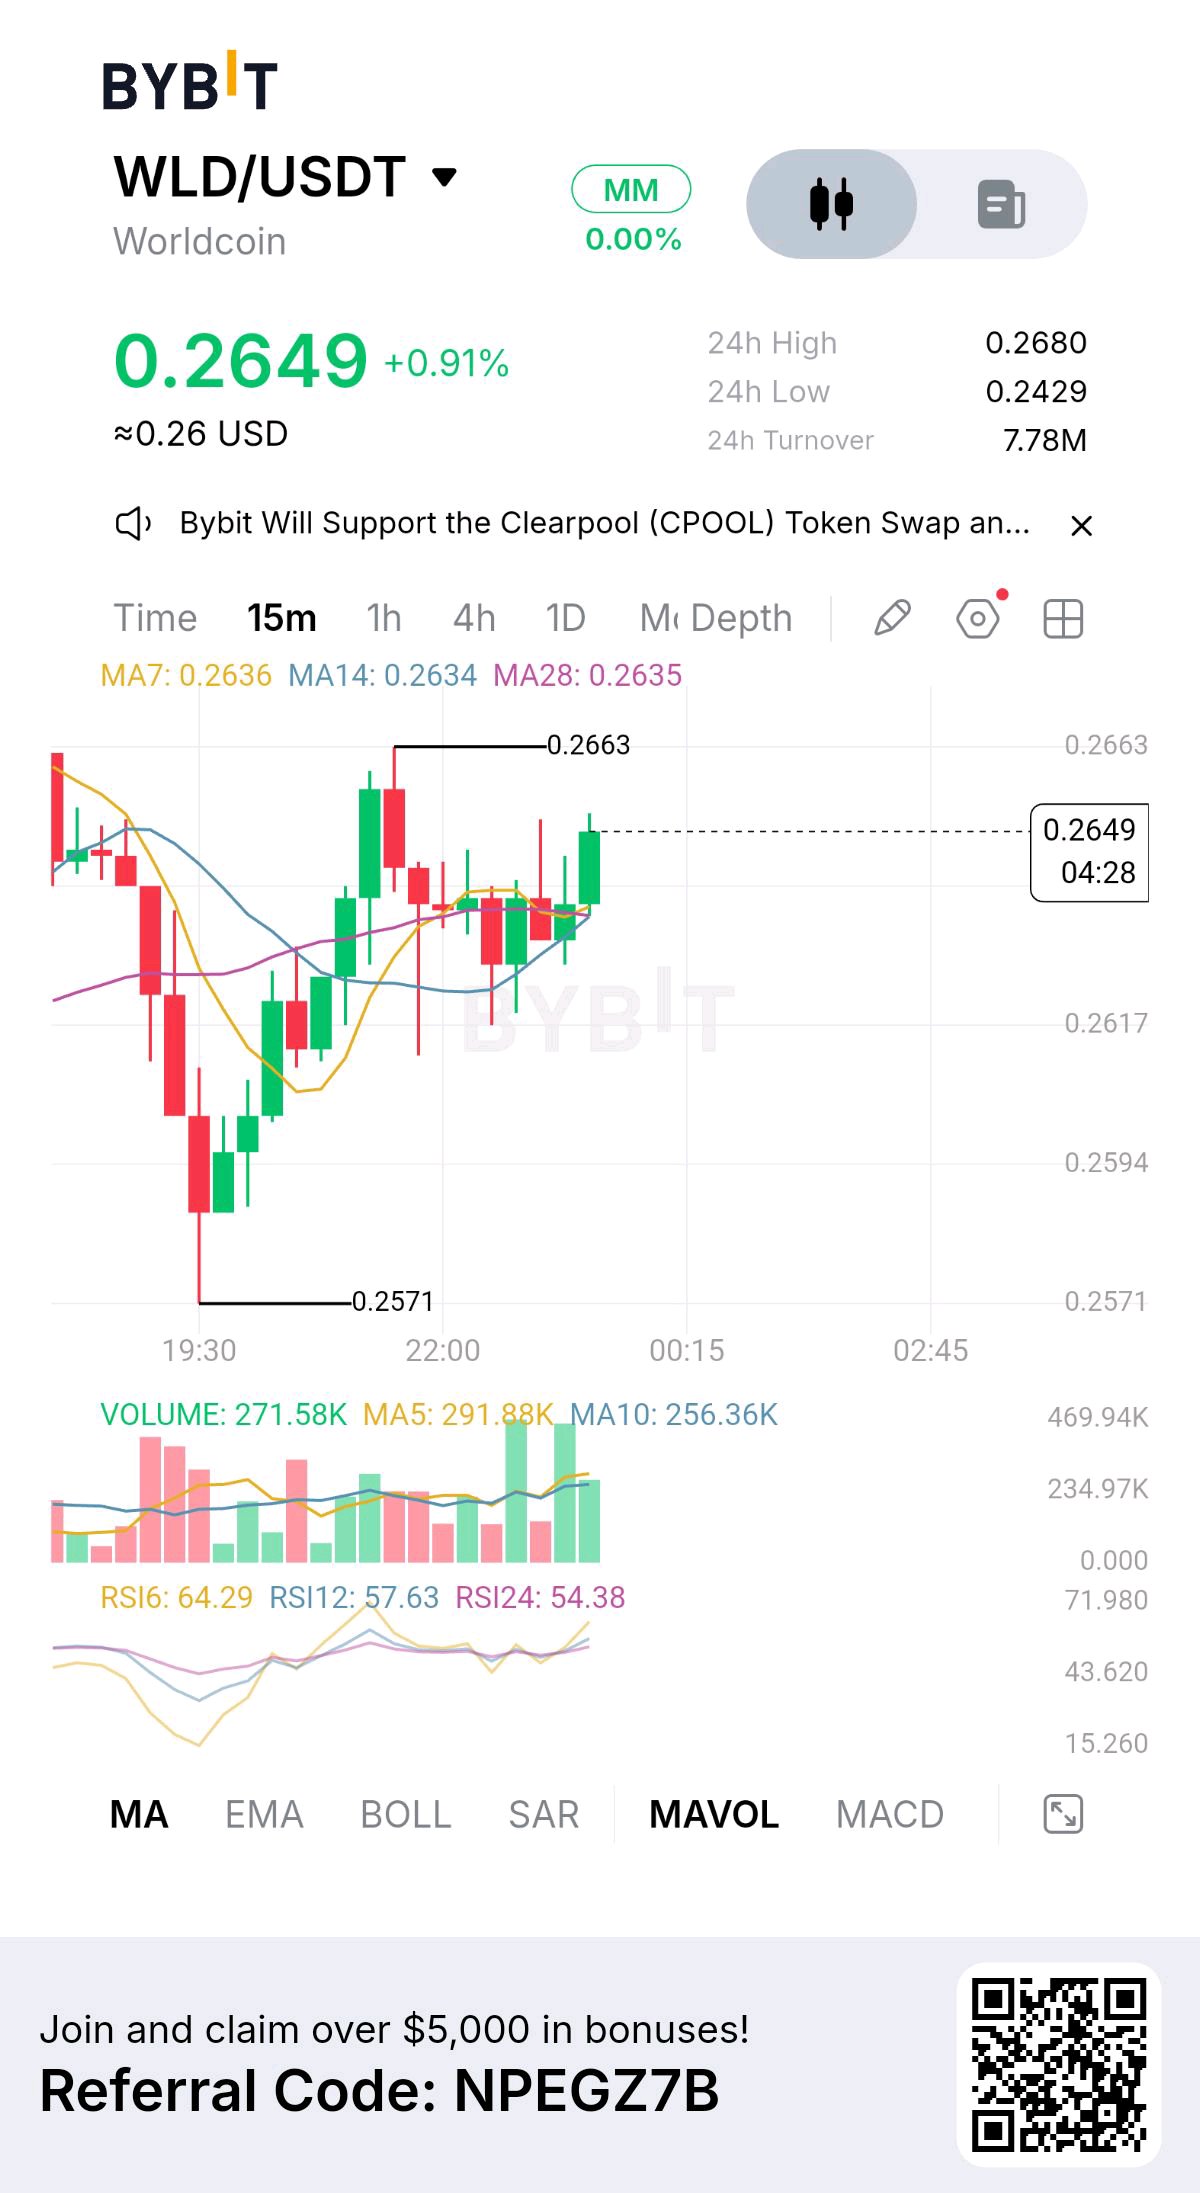
WLD is attempting to recover toward $0.27 after briefly falling near $0.243, but the weekly structure remains under pressure. What makes this setup interesting is the contrast between improving token unlock economics and continued selling pressure. World reduced its daily unlock rate by 43% in July, yet the token is still struggling to attract sustained demand. The question is whether reduced supply pressure can finally help buyers regain control. WLD recently traded near $0.262, with a market capitalization around $992M and 24-hour trading volume near $239.9M. Its latest 24-hour range stands at $0.2451–$0.2674, while the seven-day performance remains approximately 15% negative. The $0.267–$0.270 zone is immediate resistance, while $0.255–$0.245 represents the important support region. A sustained recovery above $0.270 would improve the short-term structure, but buyers still need stronger spot participation. The fundamental story revolves around World Network's expansion beyond its original identity-verification concept. World ID is designed to provide proof of human identity without revealing unnecessary personal information. The ecosystem is also expanding through World Money, which brings together stablecoin payments, financial services and global transfers. These developments could strengthen the network's long-term utility as AI-generated content and automated accounts become increasingly common. However, greater World ID adoption does not automatically create buying demand for WLD. The important question is how much actual economic activity translates into token demand. Tokenomics provide a more encouraging development. On July 24, 2026, World reduced its aggregate daily token unlock rate by approximately 43%, from 5.1M to 2.9M WLD. Community unlocks declined from 3.2M to 1.6M daily, while team and investor unlocks decreased from 1.9M to 1.3M. Approximately 3.78B WLD are currently circulating against a 10B maximum supply. This reduction removes some of the previous supply pressure, but approximately 62% of maximum supply is still outside circulation. The distinction is important: slower emissions improve the supply outlook, but continued daily unlocks can still absorb fresh market demand. Derivatives reveal another important risk. CoinGlass reports approximately $244.37M in aggregate futures open interest, down 4.60% over 24 hours. Futures volume reached approximately $483.97M against $89.91M in spot volume, making derivatives activity roughly 5.4 times larger than spot trading. Funding is negative at approximately -0.0456% per eight hours, meaning shorts are paying longs. Around $4.65M in positions were liquidated over 24 hours, with approximately 94% coming from long positions. This suggests leveraged bullish traders have faced significant pressure. Negative funding can create conditions for a short squeeze, but declining open interest and heavy long liquidations do not independently confirm accumulation. Key figures $0.262 — Current price area $0.267–$0.270 — Immediate resistance $0.255–$0.245 — Important support zone $0.2451 — Recent 24H low $992M — Market capitalization $239.9M — 24H market volume 3.78B / 10B — Circulating / maximum supply 2.9M WLD — Current approximate daily unlock rate $244.37M — Aggregate futures open interest $483.97M / $89.91M — Futures / spot volume -0.0456% — Funding per eight hours $4.65M — 24H liquidations Bullish confirmation: Reclaim $0.270 and hold above it with stronger spot volume. That would put $0.285–$0.300 in focus and strengthen the possibility of a broader recovery. Bearish confirmation: Lose $0.255 and fail to recover it. That would expose $0.245, with further downside possible toward $0.230 if selling pressure accelerates and spot demand remains weak. WLD has made meaningful progress on its token emission schedule, while World Network continues developing its identity and financial infrastructure. But reduced unlocks alone cannot reverse a weak market structure. The decisive signal is whether genuine spot demand starts absorbing the remaining daily supply—or whether leveraged trading continues dominating price action despite improving tokenomics. $WLDUSDT #ByXIMPACT
以太幣在經歷了驚人的單週跌幅後,正試圖在 1,809 美元附近穩定下來,但最新的清算數據顯示市場尚未完全重置。引起我注意的是負資金費率、未平倉合約下降以及大量多頭清算這三者的結合。這可能是賣方竭盡全力的早期跡象,但還不能確認買方已經重新掌握主導權。 ETH 最近的交易價格在 1,809 美元附近,24 小時內下跌約 2.2%,七天內下跌 14.7%。其最新的 24 小時波動區間為 1,710 至 1,858 美元,市值約為 2,207 億美元,流通供應量約為 1.2222 億枚 ETH。1,850 至 1,860 美元區間是當前的直接阻力位,而 1,750 至 1,710 美元則是重要的支撐區域。若價格能持續站穩 1,860 美元上方,將改善短期結構,但買方仍需更強勁的現貨參與。 機構面的情況提供了一個微小的積極信號,但不足以確認反轉。美國現貨以太幣 ETF 在 11 月 13 日錄得約 230 萬美元的淨流入。這表明機構需求並未完全消失,儘管相對溫和的資金流入與以太幣近期的市值跌幅相比顯得微不足道。重要的問題是,隨著價格穩定,機構買盤是否會增強,還是會弱到無法吸收持續的拋售壓力。 以太幣的供應經濟學也值得關注。目前約有 1.2222 億枚 ETH 在流通,與比特幣不同,以太幣沒有固定的最大供應量。其發行主要來自質押獎勵,而透過 EIP-1559 進行的交易費用銷毀則會從流通中移除 ETH。這創造了一個動態供應模型:當網路活動和費用銷毀增加時,銷毀的 ETH 數量可以抵消更多的發行量。然而,網路活動減少會降低銷毀壓力,這意味著以太幣的通貨緊縮潛力取決於實際使用情況,而非保證供應量減少。 衍生品揭示了當前市場結構中最有趣的部分。根據 CoinGlass 的數據,總合約未平倉量約為 218 億美元,24 小時內下降約 3.25%。期貨交易量達到約 617.9 億美元,而現貨交易量為 42.8 億美元,衍生品活動規模約為現貨交易的 14.4 倍。資金費率為負,每八小時約為 -0.0037%,意味著空頭正在支付給多頭。24 小時內約有 3.8665 億美元的 ETH 頭寸被清算,其中多頭清算約為 3.0332 億美元。這顯示槓桿看漲頭寸已經遭受了重大打擊。未平倉合約下降和負資金費率可能會創造復甦條件,但前提是有新的現貨買家進場。 關鍵數據 1,809 美元 — 當前價格區間 1,850–1,860 美元 — 直接阻力位 1,750–1,710 美元 — 重要支撐區 1,710 美元 — 近期 24 小時低點 2,206.9 億美元 — 市值 1.2222 億 ETH — 流通供應量 218 億美元 — 總合約未平倉量 617.9 億美元 / 42.8 億美元 — 期貨 / 現貨交易量 -0.0037% — 每八小時資金費率 3.8665 億美元 — 24 小時清算額 3.0332 億美元 — 多頭清算額 看漲確認:重新站上 1,860 美元並在更強勁的現貨交易量支持下保持在該位置上方。這將使 1,900 至 1,950 美元成為焦點,並增強更廣泛復甦的可能性。 看跌確認:失守 1,750 美元且無法收復。這將會測試 1,710 美元,如果槓桿拋售加速,可能會進一步下探至 1,650 美元。 以太幣正顯示出槓桿竭盡的跡象,但投機頭寸的減少並不等同於真正的積累。決定性的信號在於,當負資金費率和下降的未平倉合約趨於穩定時,現貨需求是否會回歸,亦或是支撐位的進一步崩潰引發新一波的拋售。 $ETHUSDT #ByXIMPACT
NVDAX is struggling to recover above $160 after losing more than 10% over the past seven days, but the biggest risk is no longer just NVIDIA's share-price weakness. Jensen Huang's sudden resignation as CEO has introduced an unexpected leadership uncertainty just ahead of the company's November 17 earnings report. The question is whether strong AI demand can outweigh concerns about who will lead NVIDIA through its next growth phase. NVDAX recently traded near $160.59, down approximately 1.12% over 24 hours and 10.75% over seven days. Its latest 24-hour range stands at $155.33–$162.64, with market capitalization around $93.98M. The $162.60–$165.00 zone represents the immediate recovery resistance, while $157–$155.30 is the first support area. A sustained move above $165 would improve the short-term structure, but buyers first need to establish stronger spot participation. The fundamental catalyst is NVIDIA's unexpected leadership transition. On November 12, the company officially announced that Jensen Huang had resigned as President, CEO and board member, with CFO Colette Kress appointed interim CEO while the board searches for a permanent successor. This is significant because Huang led NVIDIA for 33 years and became closely associated with its AI strategy. The board has stated that customer commitments, operations and the product roadmap will continue without interruption. However, investors still need evidence that the transition will not disrupt execution during an important period for AI infrastructure demand. The upcoming earnings report makes this situation even more important. NVIDIA is scheduled to announce its third-quarter fiscal 2027 results on November 17. Its previous quarterly report showed $96.2B in revenue, up 106% year over year, while Data Center revenue reached $89B. The company previously guided for approximately $108B in Q3 revenue. These numbers establish a high expectation, but this earnings release will also be the first under interim CEO Colette Kress. The market will be watching both financial performance and management's confidence in future demand. Strong results alone may not resolve leadership concerns if forward guidance disappoints. Derivatives show an interesting shift in positioning. CoinGlass reports approximately $3.50M in aggregate futures open interest, down 11.52% over 24 hours. Futures volume reached approximately $20.69M against $1.41M in spot volume, showing substantially greater speculative activity in derivatives. Funding is negative at approximately -0.0759%, meaning short positions are paying long positions. Spot net inflows are approximately $710.6K, while futures net inflows are around $1.2M. This suggests some buying interest is returning, but declining open interest indicates traders are still reducing exposure rather than aggressively building bullish positions. Key figures $160.59 — Current price area $162.60–$165.00 — Immediate recovery resistance $157–$155.30 — Support zone $242.89 — October 6 all-time high $93.98M — Market capitalization $49.35M — Reported 24H market volume $3.50M — Aggregate futures open interest $20.69M / $1.41M — Futures / spot volume -0.0759% — Funding rate 584.69K — Circulating NVDAX supply November 17 — NVIDIA Q3 FY2027 earnings Bullish confirmation: Reclaim $162.60 and establish acceptance above $165 with stronger spot buying. That would put $170–$175 in focus, particularly if NVIDIA delivers strong earnings and reassuring forward guidance. Bearish confirmation: Lose $155.30 and fail to recover it. That would expose the $150 area, especially if NVIDIA shares face renewed selling pressure or earnings disappoint. NVDAX is facing two competing forces: NVIDIA's extraordinary AI business and an unexpected leadership transition at a critical moment. The upcoming earnings report could determine whether investors focus on continued business growth or demand a higher risk premium for leadership uncertainty. For me, the decisive signal is whether genuine spot demand returns ahead of November 17—or whether traders continue reducing exposure despite the company's strong underlying AI business. $NVDAXUSDT #ByXIMPACT
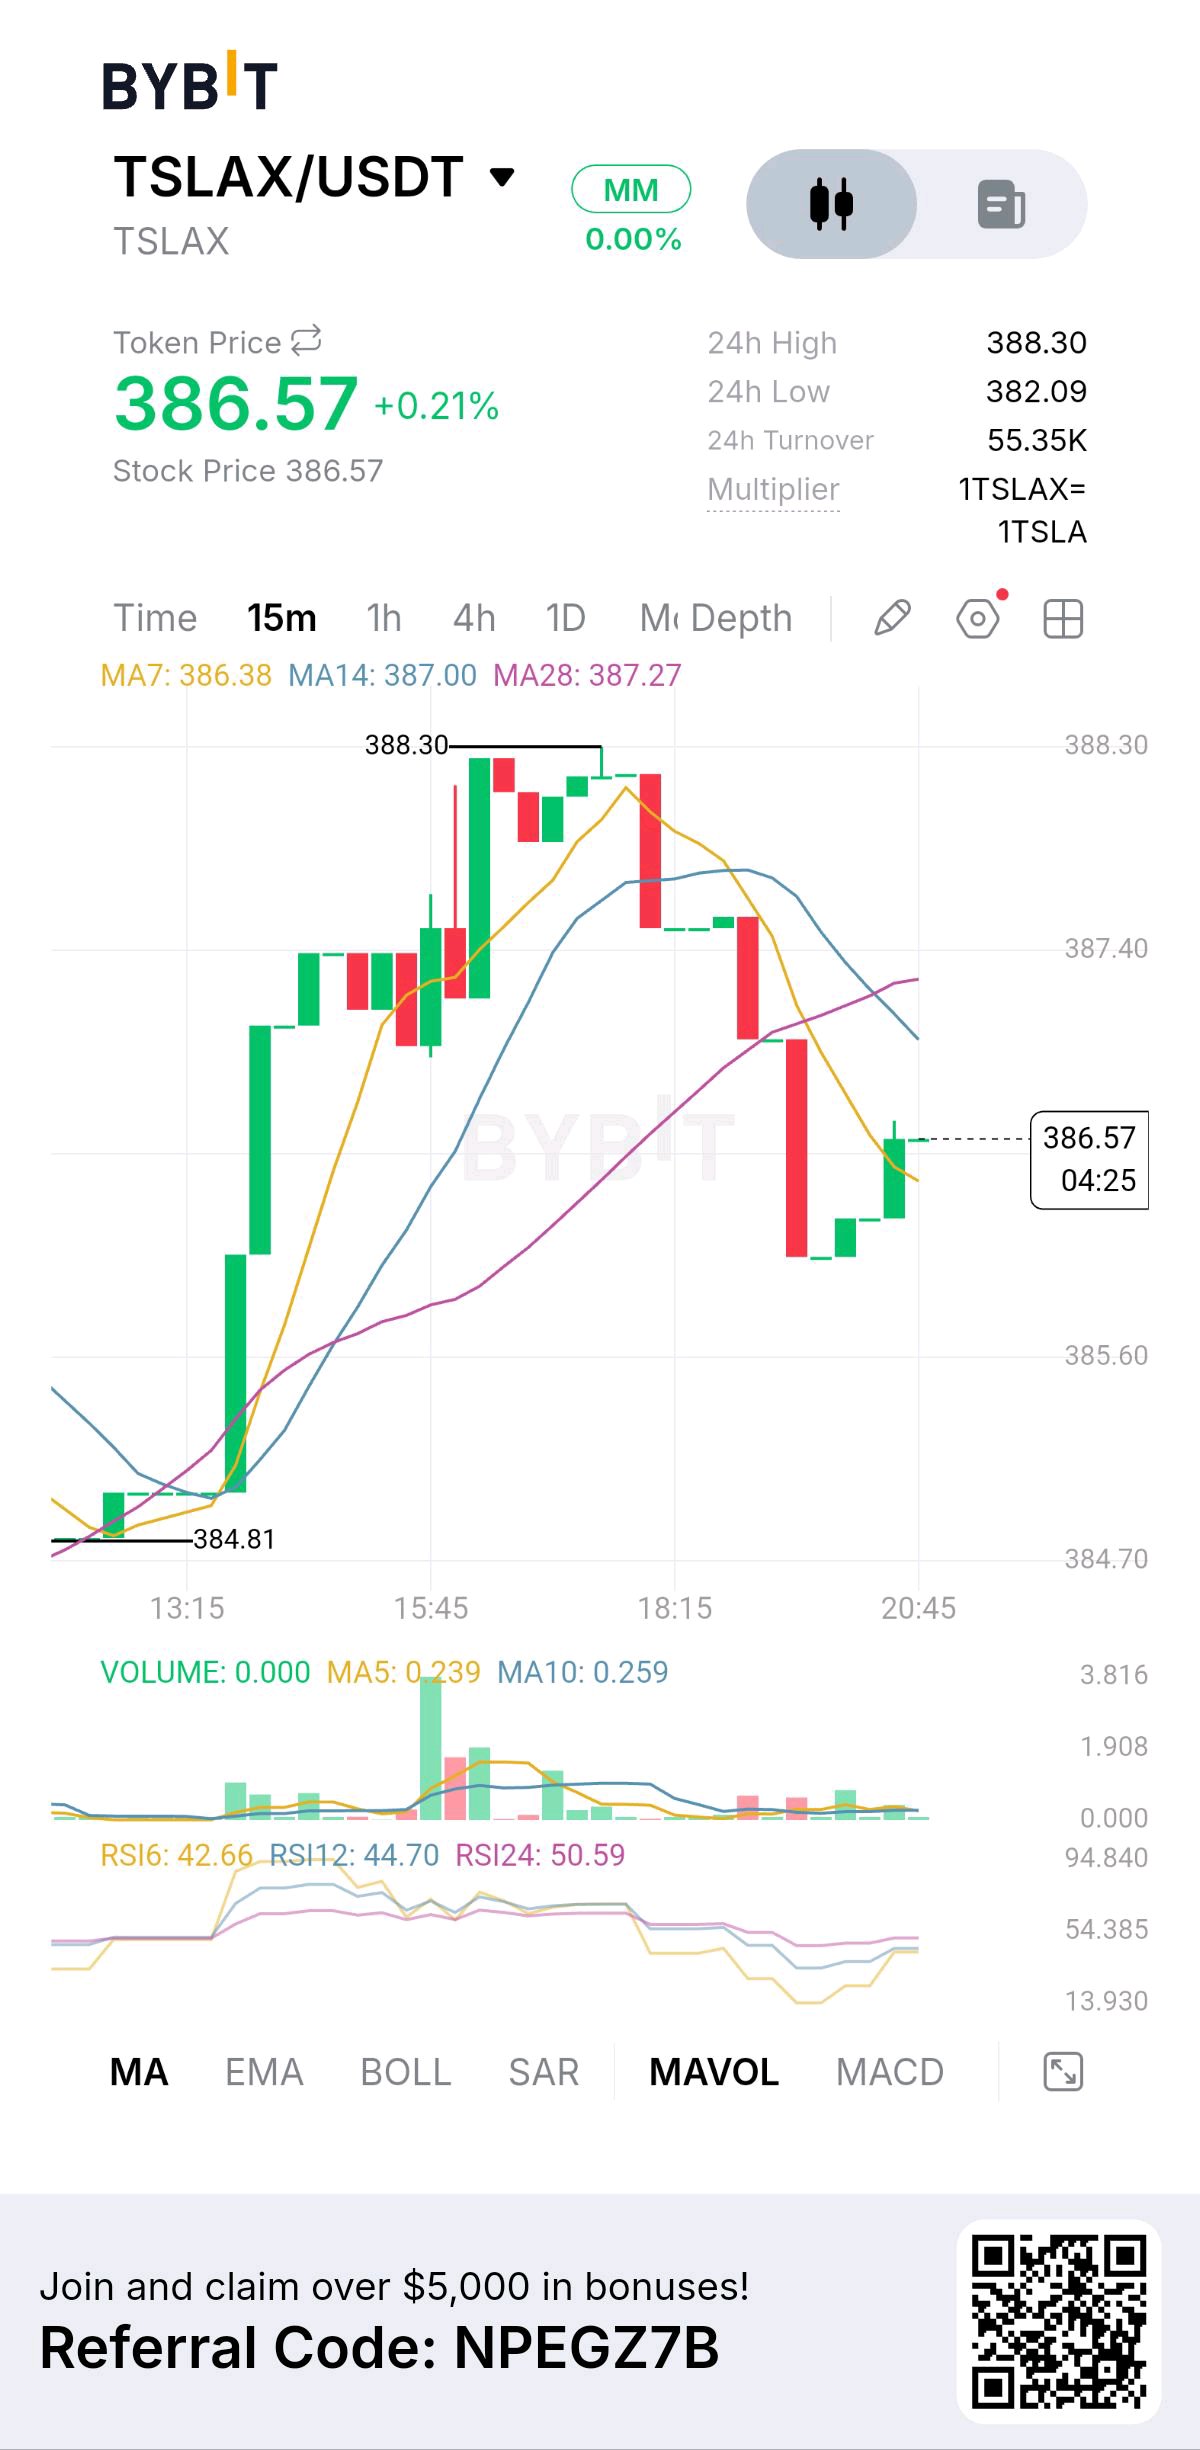
TSLAX 在從 353 美元的區域反彈後,目前維持在 386 美元附近,但最新的回升正接近一個重要的阻力區。這次走勢引人注目的原因是,特斯拉(Tesla)憑藉其 Robotaxi 和 AI 的雄心重新獲得了關注,而圍繞 Cybertruck 生產的不確定性則持續對投資故事構成挑戰。問題在於特斯拉未來的科技業務能否證明其估值合理並支撐近期的復甦。 TSLAX 最近的交易價格在 385.94 美元附近,24 小時內下跌約 0.6%,但在七天內上漲了約 7.5%。其最近 24 小時的波動區間約為 382–389 美元,市值約為 8030 萬美元,在受追蹤平台上的報告交易量約為 1550 萬美元。389–390 美元區間是即時阻力位,而 382–378 美元則代表第一個支撐區域。若能持續站穩 390 美元上方,將增強復甦結構,並將焦點轉向 403–410 美元區域。 基本面故事正在超越電動車交付的範疇。特斯拉 2026 年第三季的更新報告強調了將 Cybercab 納入其 Robotaxi 車隊、無人監督的 Robotaxi 累計里程數在季度內增長了八倍,以及客用車積壓訂單達到了四年來的最高水平。能源儲存業務也交出了有史以來最強勁的訂單率和積壓訂單。這些發展支持了特斯拉在 AI、自動駕駛和能源方面的長期雄心。然而,商業機會仍然取決於監管批准、生產能力以及將技術投資轉化為經常性收入的能力。 還有另一個投資者不應忽視的重要進展。特斯拉的 Cybertruck 生產策略面臨不確定性,管理層曾討論縮減生產,隨後又延長了生產時間表以應對未完成的需求。這凸顯了在現有車款和下一代自動駕駛車輛之間分配工廠產能的挑戰。Robotaxi 的機遇固然重大,但執行力仍然是決定性因素。 對於 TSLAX 持有者來說,還有一個重要的區別。TSLAX 是一種旨在追蹤特斯拉股票的代幣化追蹤證書(tokenized tracker certificate),而非直接擁有特斯拉股票。它不提供普通股東的投票權。此外,由於代幣化市場擁有自己的流動性和交易條件,其價格可能與標的股票有所差異。這一點在週末和美國股市休市期間尤為重要。 與主流加密資產相比,衍生品的市場深度相對有限。據 CoinGlass 報告,總期貨未平倉合約約為 77.77 萬美元,24 小時期貨交易量約為 38.04 萬美元,而現貨交易量則為 7.79 萬美元。資金費率為正,約為每八小時 +0.014%,這意味著多頭正在支付空頭費用。期貨與現貨交易量比率約為 4.9 倍。這表明投機性頭寸正在影響短期活動,而相對薄弱的現貨流動性使得持續的買盤顯得尤為重要。 關鍵數據 $385.94 — 當前價格區間 $389–$390 — 即時阻力位 $382–$378 — 第一支撐區 $403.66 — 七日高點 $353.34 — 七日低點 $80.31M — 報告市值 $15.51M — 24 小時交易量 $777.7K — 總期貨未平倉合約 $380.4K / $77.9K — 期貨 / 現貨交易量 +0.014% — 每八小時資金費率 看漲確認:收復 390 美元並在更強勁的現貨參與下守住該位。這將使 403–410 美元成為焦點,並增強復甦延續的理據。 看跌確認:跌破 378 美元且無法收復。這將使價格暴露於 353 美元水平,特別是如果特斯拉股票走弱且槓桿頭寸開始平倉時。 TSLAX 提供了對最受關注的 AI 和自動駕駛故事之一的曝險,但該代幣的價格主要仍取決於特斯拉標的股權的表現。決定性的訊號在於,Robotaxi 的進展和能源儲存的增長能否轉化為市場對特斯拉股票的持續信心,以及 TSLAX 是否能憑藉真正的現貨需求——而非投機性的期貨活動——來收復阻力位。 $TSLAXUSDT #ByXIMPACT
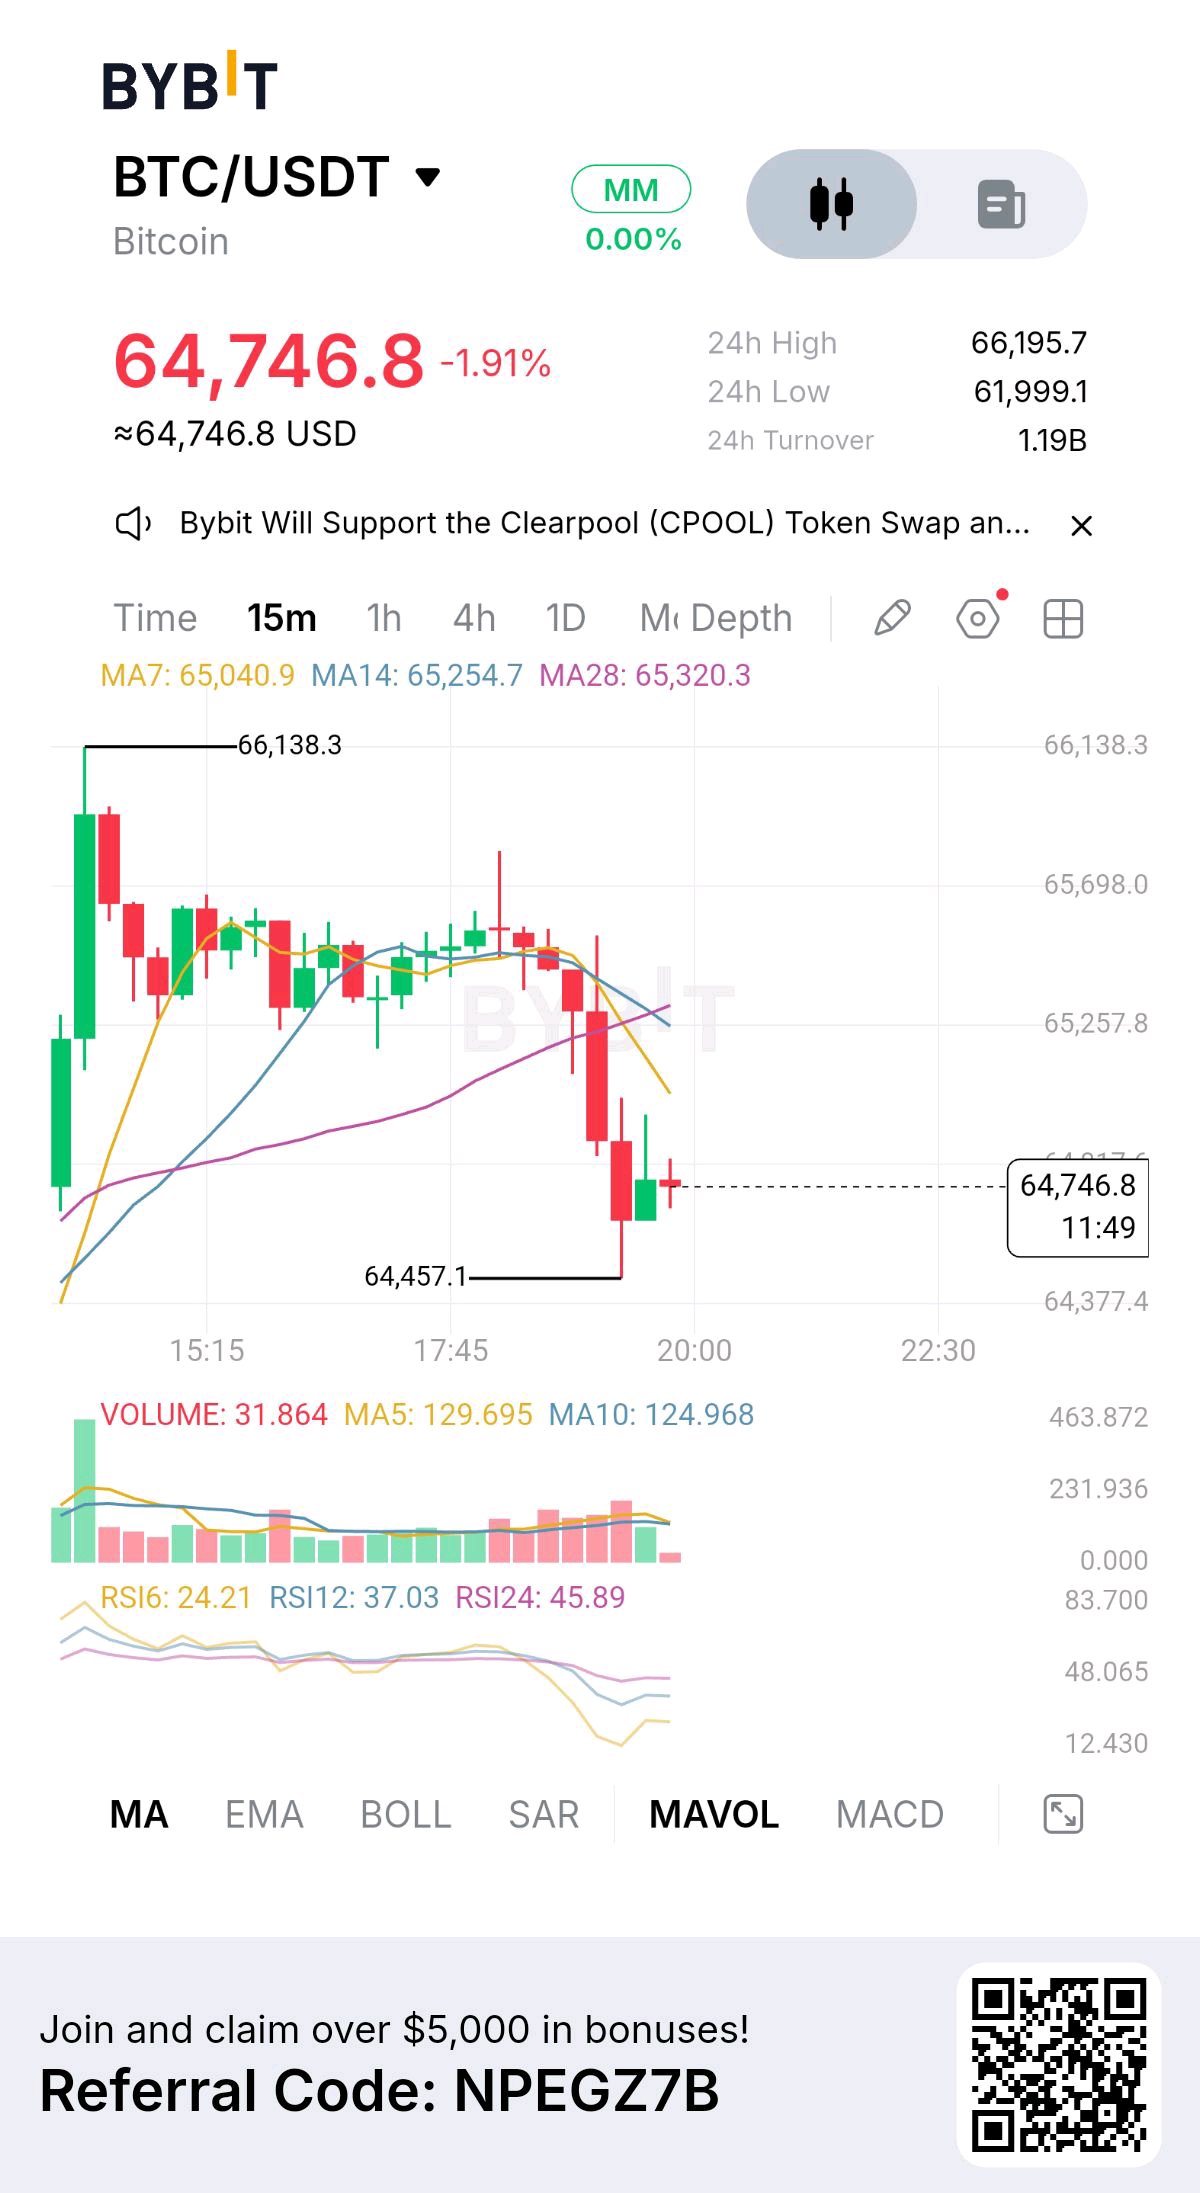
比特幣在短暫觸及 62,000 美元後已回升至 65,000 美元上方,但這波反彈正面臨嚴峻考驗。令我擔憂的是,機構需求尚未回歸,且過去 24 小時內已有超過 7.8 億美元的槓桿倉位遭到清算。這究竟是復甦的開端,還是更大規模拋售中的短暫停歇? BTC 最近交易價格在 65,133 美元附近,24 小時內下跌約 2%,七日內跌幅超過 12%。其最新的 24 小時波動區間為 61,956 至 66,609 美元,市值約為 1.31 兆美元。65,900 至 66,600 美元區域是當前的直接阻力區,而 63,000 至 62,000 美元仍是關鍵支撐區。若能穩守 66,600 美元上方將有助於改善短期結構,但買方仍需展現更強勁的現貨需求。 機構面的情況正帶來壓力。美國比特幣現貨 ETF 在 11 月 9 日至 11 月 13 日期間錄得約 10.65 億美元的淨流出,連續七個交易日出現資金撤出。僅 11 月 13 日當天,這些產品就流出了 1.854 億美元。這一點至關重要,因為機構需求一直是現貨流動性的重要來源。如果沒有新的 ETF 資金流入,即使短期交易者進場,比特幣也可能難以維持復甦。 另一個重要發展是投資人獲利能力的惡化。最新的鏈上分析顯示,比特幣目前處於獲利狀態的活躍供應量不到 45%。短期持有者的實現價格(realized price)約為 75,068 美元,遠高於目前的市場價格。這意味著許多近期買入者仍處於「套牢」狀態,一旦價格嘗試向其成本基礎回升,可能會產生額外的拋壓。不過,深度的未實現虧損若能隨著需求吸收供給,也可能創造賣壓耗盡的條件。 衍生性商品數據顯示,槓桿仍在市場中扮演重要角色。CoinGlass 報告指出,期貨總未平倉合約數約為 421 億美元,24 小時內下降 7.43%。期貨交易量約為 1,152.6 億美元,相對現貨交易量的 106 億美元,顯示投機活動仍遠大於直接的現貨交易。資金費率微幅為正,約為每八小時 +0.0012%,而 24 小時內清算金額達到約 7.816 億美元,其中多單佔了 74%。未平倉合約的減少暗示槓桿正在被清理,但要建立更健康的復甦,仍需持續的現貨買盤。 關鍵數據: 65,133 美元 — 當前價格區間 65,900–66,600 美元 — 即時阻力位 63,000–62,000 美元 — 重要支撐區 61,956 美元 — 24 小時低點 1.31 兆美元 — 市值 10.65 億美元 — 每週現貨 ETF 淨流出 421 億美元 — 期貨總未平倉合約 1,152.6 億美元 / 106 億美元 — 期貨 / 現貨交易量 7.816 億美元 — 24 小時清算額 45% — 當前處於獲利狀態的活躍供應量(約值) 看漲確認:重新站上 66,600 美元並在此位置持穩,且伴隨更強的現貨成交量與 ETF 資金流入改善。這將使目標鎖定 68,000 至 70,000 美元,並證明買方正在重新掌握控制權。 看跌確認:失守 63,000 美元且無法收復。這將暴露 61,956 美元的低點,若機構資金持續流出且槓桿拋售繼續,進一步下探 60,000 美元的可能性將會增加。 比特幣正顯現出暫時穩定的跡象,但機構資金撤出、投資人被套牢以及沉重的衍生性商品活動,仍在挑戰其復甦之路。決定性的訊號在於:真正的現貨需求是否會回歸並吸收拋壓,還是下一次支撐位的失守會引發新一波的多單清算潮。 $BTCUSDT #ByXIMPACT
HYPE 從 60 美元區間反彈,但我不會將急劇反彈誤認為是確定的趨勢反轉。現在的重要訊號是買方能否收復在拋售期間失去的價位。 價格目前在 68 美元附近交易,此前在 11 月 14 日下跌超過 10%,並短暫觸及 60 美元。七日表現仍維持在 -8.5% 左右,且 HYPE 目前仍較 9 月份接近 98 美元的歷史高點低約 31%。儘管今天的反彈顯示買方有所回應,但日線結構已顯著轉弱。 衍生品數據揭示了此次拋售變得有多激進。約 8,700 萬美元的倉位在 24 小時內被清算,其中約 97% 來自多頭。未平倉合約(Open Interest)也有所下降,顯示槓桿倉位正在被清理,而非新的市場信心湧入。這是一次由清算驅動的重置,但並不保證拋售已經結束。 從基本面來看,Hyperliquid 仍有強力的論點:其永續合約交易基礎設施正持續擴展至加密原生市場之外。近期股票連結永續合約的活動證明,該協議的機會不僅僅是 HYPE 價格的上漲。然而,網路採用率與代幣價格表現並不自動劃上等號。 關鍵數據 67.95 美元 — 當前價格快照 60.01 美元 — 24 小時低點 69.42 美元 — 24 小時高點 97.98 美元 — 歷史高點 172.1 億美元 — 市值 29.8 億美元 — 期貨未平倉合約 8,734 萬美元 — 24 小時清算額 97% — 來自多頭倉位的清算 -8.54% — 七日表現 看漲確認:守住 65–66 美元區域並收復 69.42 美元。若能持續站穩 70 美元上方,將增強復甦的論點,並為挑戰 72–75 美元的阻力區打開道路。 看跌確認:失守 65.50 美元且未能收復。這將暗示反彈動能減弱,使 60 美元支撐區再次成為焦點。若跌破 58.54 美元,更廣泛的夏季價格區間可能會重新變得相關。 風險管理:儘管發生了清算事件,資金費率仍略為正值。這意味著市場尚未完全轉向看跌部位。我會避免追漲反彈,直到價格確立更高的低點並收復阻力位。60 美元的反應令人鼓舞,但買方仍需證明他們能夠捍衛此次復甦。 HYPE 的長期敘事仍與協議活動和收入產生掛鉤。然而,目前的圖表只有一個任務:將 60 美元的清算低點轉化為確定的支撐位。 $HYPEUSDT #ByXIMPACT
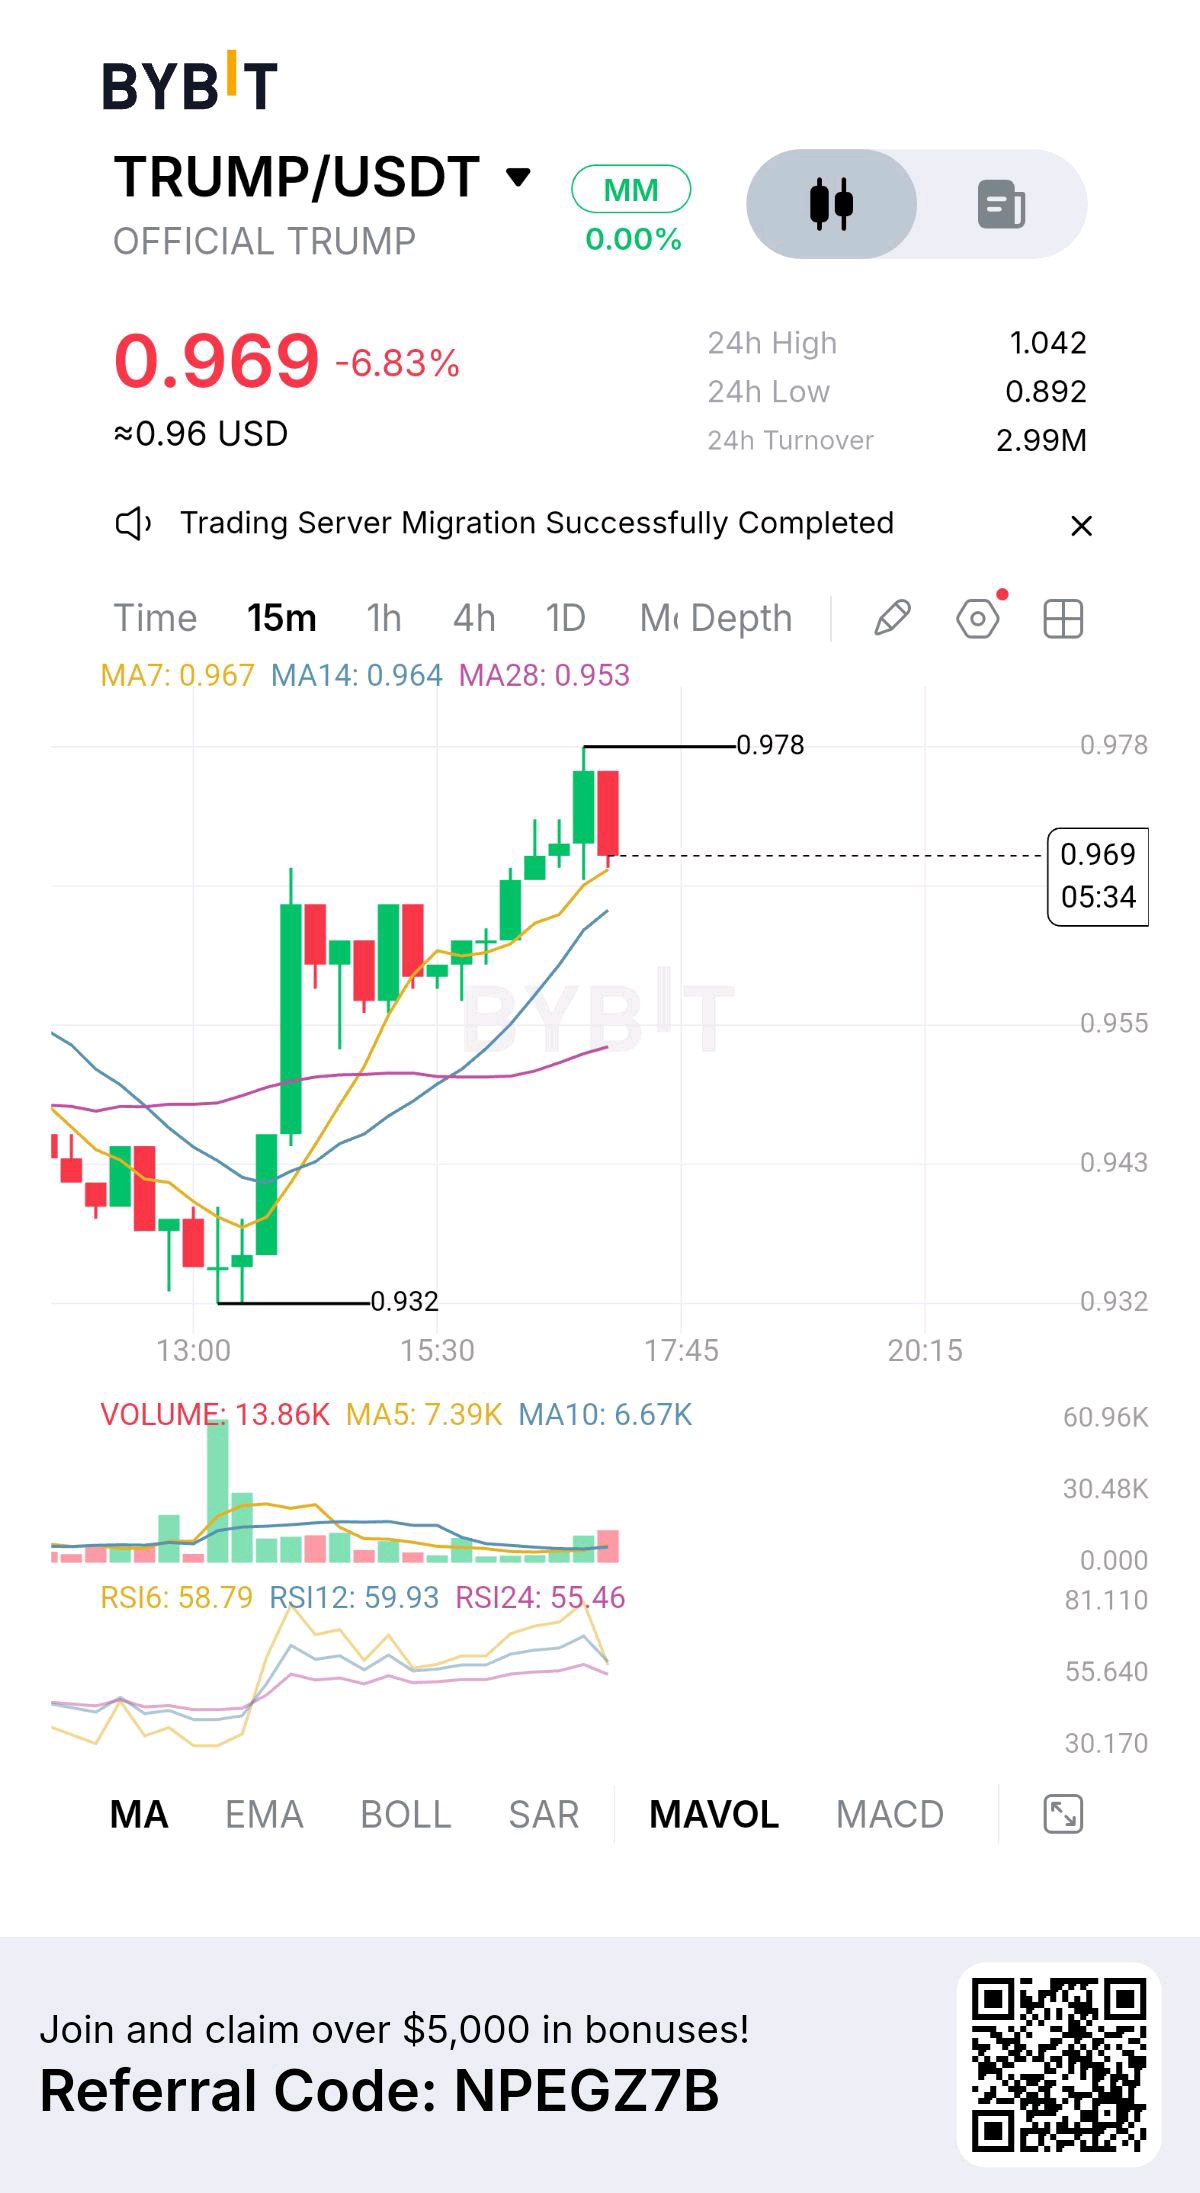
TRUMP is approaching a critical decision point. The latest sell-off has pushed price toward $0.90, but the derivatives market is showing signs of an increasingly crowded bearish trade. Price is trading around $0.95–$0.96, down roughly 12% over 24 hours and more than 16% over seven days. The recent trading range is $0.889–$1.074. Losing the $1 psychological level has weakened the structure, and buyers now need to defend the recent low before another recovery attempt becomes credible. The derivatives picture is particularly interesting. Futures open interest has fallen approximately 16% in 24 hours, while funding is deeply negative. Around $3.88M in positions were liquidated, including $3.62M in longs. This points to aggressive long-position unwinding, not fresh bullish conviction. However, heavily negative funding can also create squeeze potential if price starts reclaiming resistance. Supply remains the other major concern. Approximately 28.7 million TRUMP tokens are scheduled to unlock on November 18, representing 2.9% of total supply and around 3.7% of current market capitalization. The unlock does not guarantee immediate selling, but it adds pressure to an already weak chart. Key figures $0.95–$0.96 — Current price area $0.889 — Recent 24H low $1.00 — Psychological resistance $1.074 — Recent 24H high $265M–$270M — Market capitalization $103.6M — Futures open interest -16% — 24H open-interest change -0.0632% — Weighted funding snapshot November 18 — Next major unlock Bullish confirmation: Reclaim $1.00 and then break above $1.074 with improving spot demand. That would make a short squeeze more credible. Bearish confirmation: Lose $0.889 and fail to recover it. That would confirm continued weakness and expose the market to further downside. Risk Management: Futures volume is nearly eight times spot volume in the latest snapshot. That makes leverage-driven volatility a serious risk. I would not buy simply because funding is negative or price looks oversold. The $1 reclaim is the first confirmation I want to see. TRUMP does not need another headline to move sharply. It needs buyers to prove they can absorb selling pressure ahead of the November 18 unlock. $TRUMPUSDT #IMPACTbyTrade
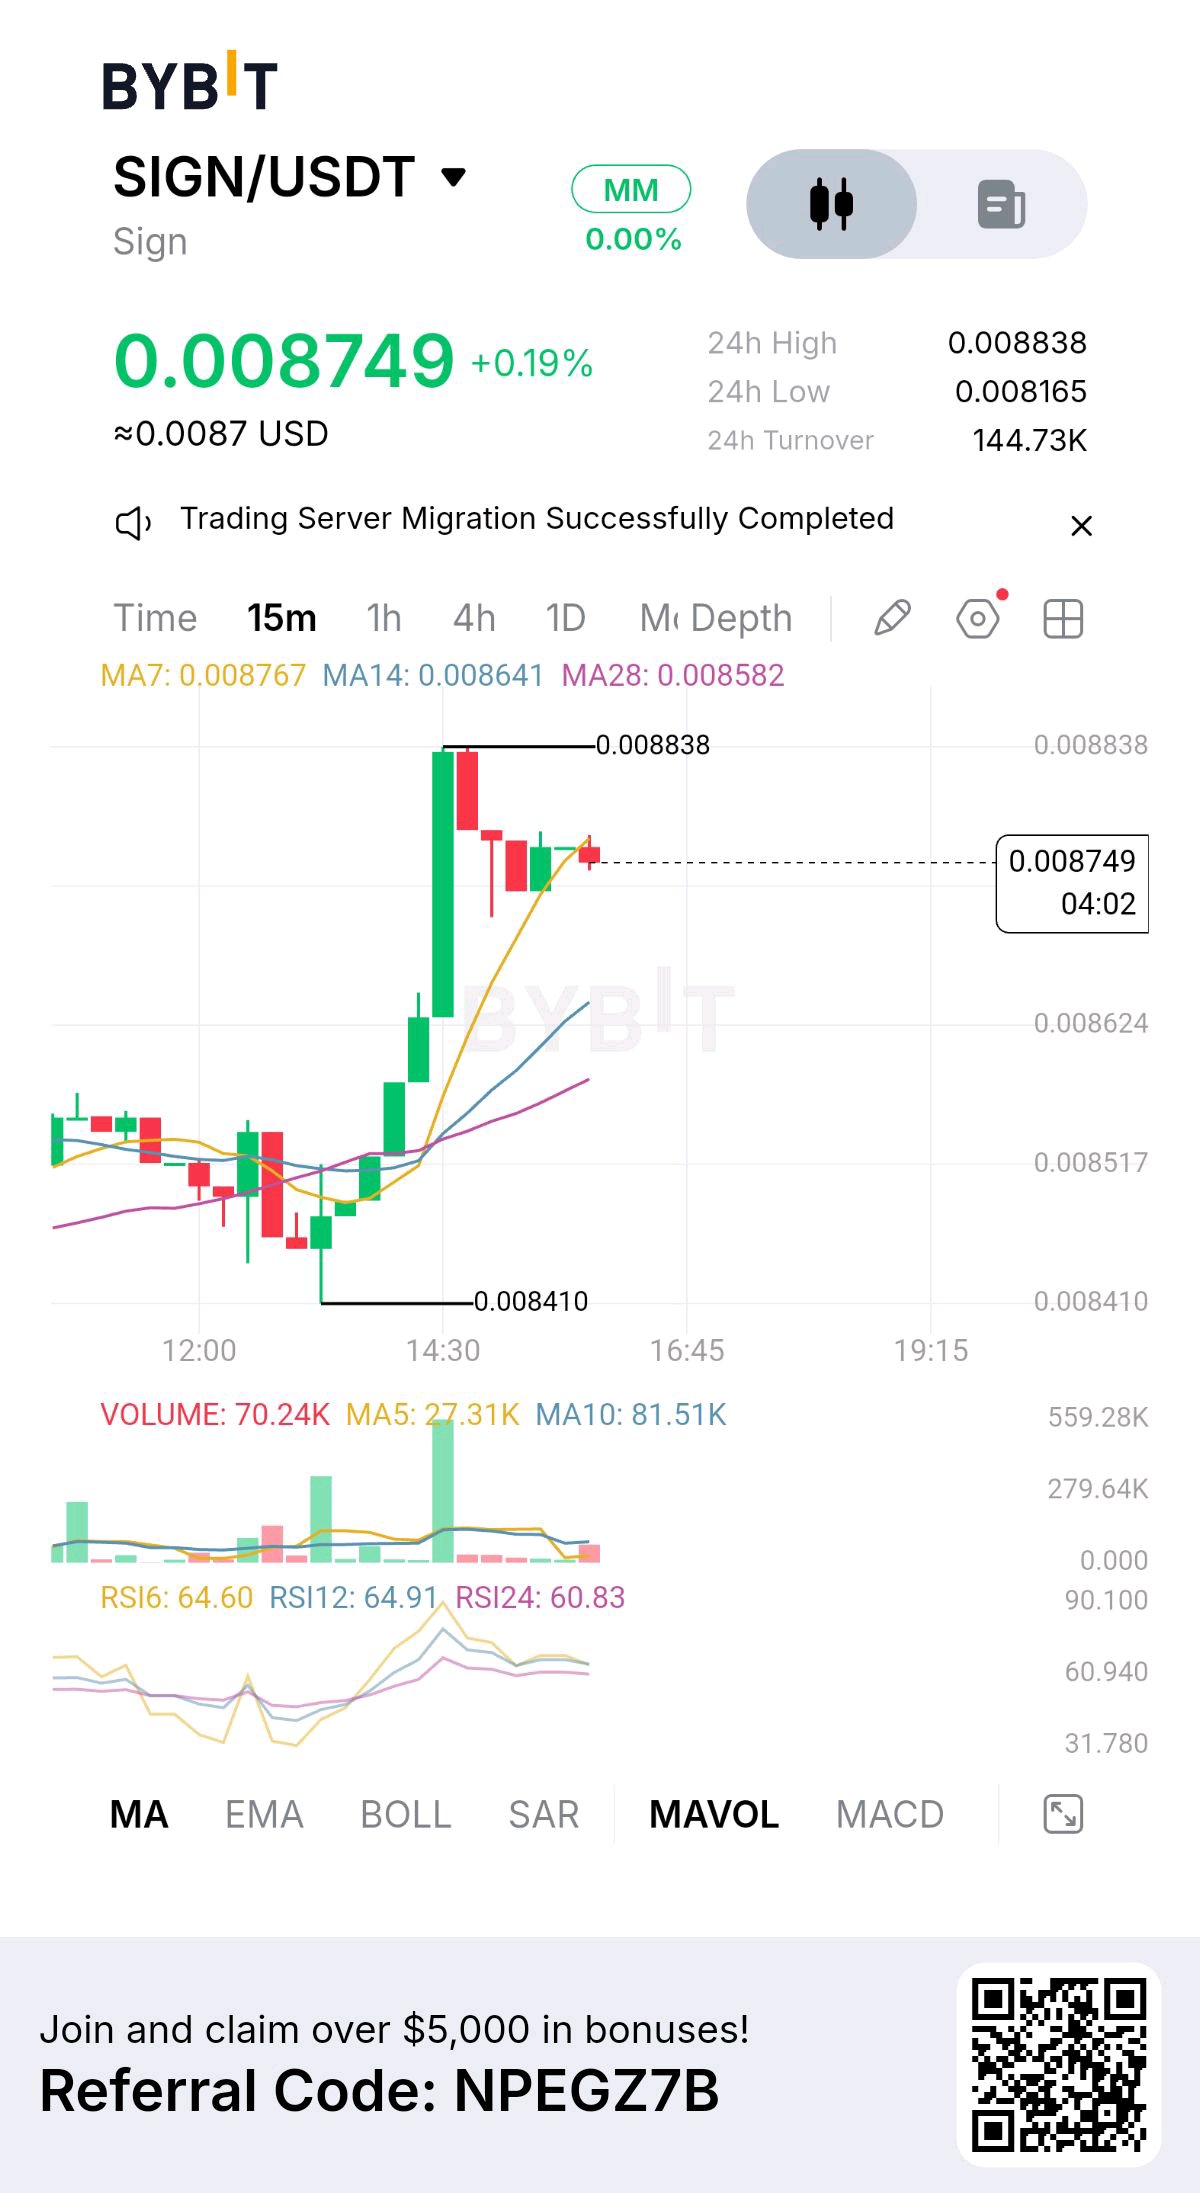
SIGN is showing early signs of short-term stabilization, but the bigger challenge is absorbing fresh supply without losing its support structure. Trading around $0.0085, SIGN remains approximately 93% below its all-time high. The 24-hour range is $0.00814–$0.00889, while the seven-day performance is still slightly negative. The daily trend remains bearish, with RSI near 34, and price trading below its major moving averages. Oversold conditions can create a bounce, but they do not confirm a reversal. The immediate technical battle is between $0.00828 support and $0.00872 resistance. A sustained reclaim of resistance would improve the short-term picture. Until then, rallies remain vulnerable to selling pressure. The supply situation deserves particular attention. Sign is building infrastructure around on-chain credential verification and token distribution through Sign Protocol and TokenTable. However, only around 28.4% of its 10 billion maximum supply is currently circulating. More importantly, a reported unlock of approximately 298 million SIGN tokens is scheduled for November 15. That represents roughly 10.5% of circulating supply. This is a substantial liquidity event, although unlocked tokens do not automatically become market sell orders. Key figures $0.0085 — Current price area $0.00828 — Immediate support $0.00872 — First resistance $0.00889 — 24H high $0.00814 — 24H low $23.86M — Market capitalization 2.843B — Circulating supply 10B — Maximum supply 298M — Reported November 15 unlock Bullish confirmation: Reclaim $0.00872 and hold above it. A stronger move toward $0.00889 would provide the first indication that buyers are regaining control. Bearish confirmation: Lose $0.00828 and fail to recover it. That would expose the recent $0.00814 low and potentially weaken the broader structure further. Risk Management: Around 61% of futures accounts are positioned short in one market snapshot, creating potential for a squeeze if resistance breaks. However, positive funding means longs are still paying shorts. I would wait for actual price confirmation rather than assume crowded shorts guarantee an upside move. SIGN has a genuine infrastructure use case, but its biggest near-term test is straightforward: can real demand absorb additional supply while the daily chart is still bearish? $SIGNUSDT #ByXIMPACT
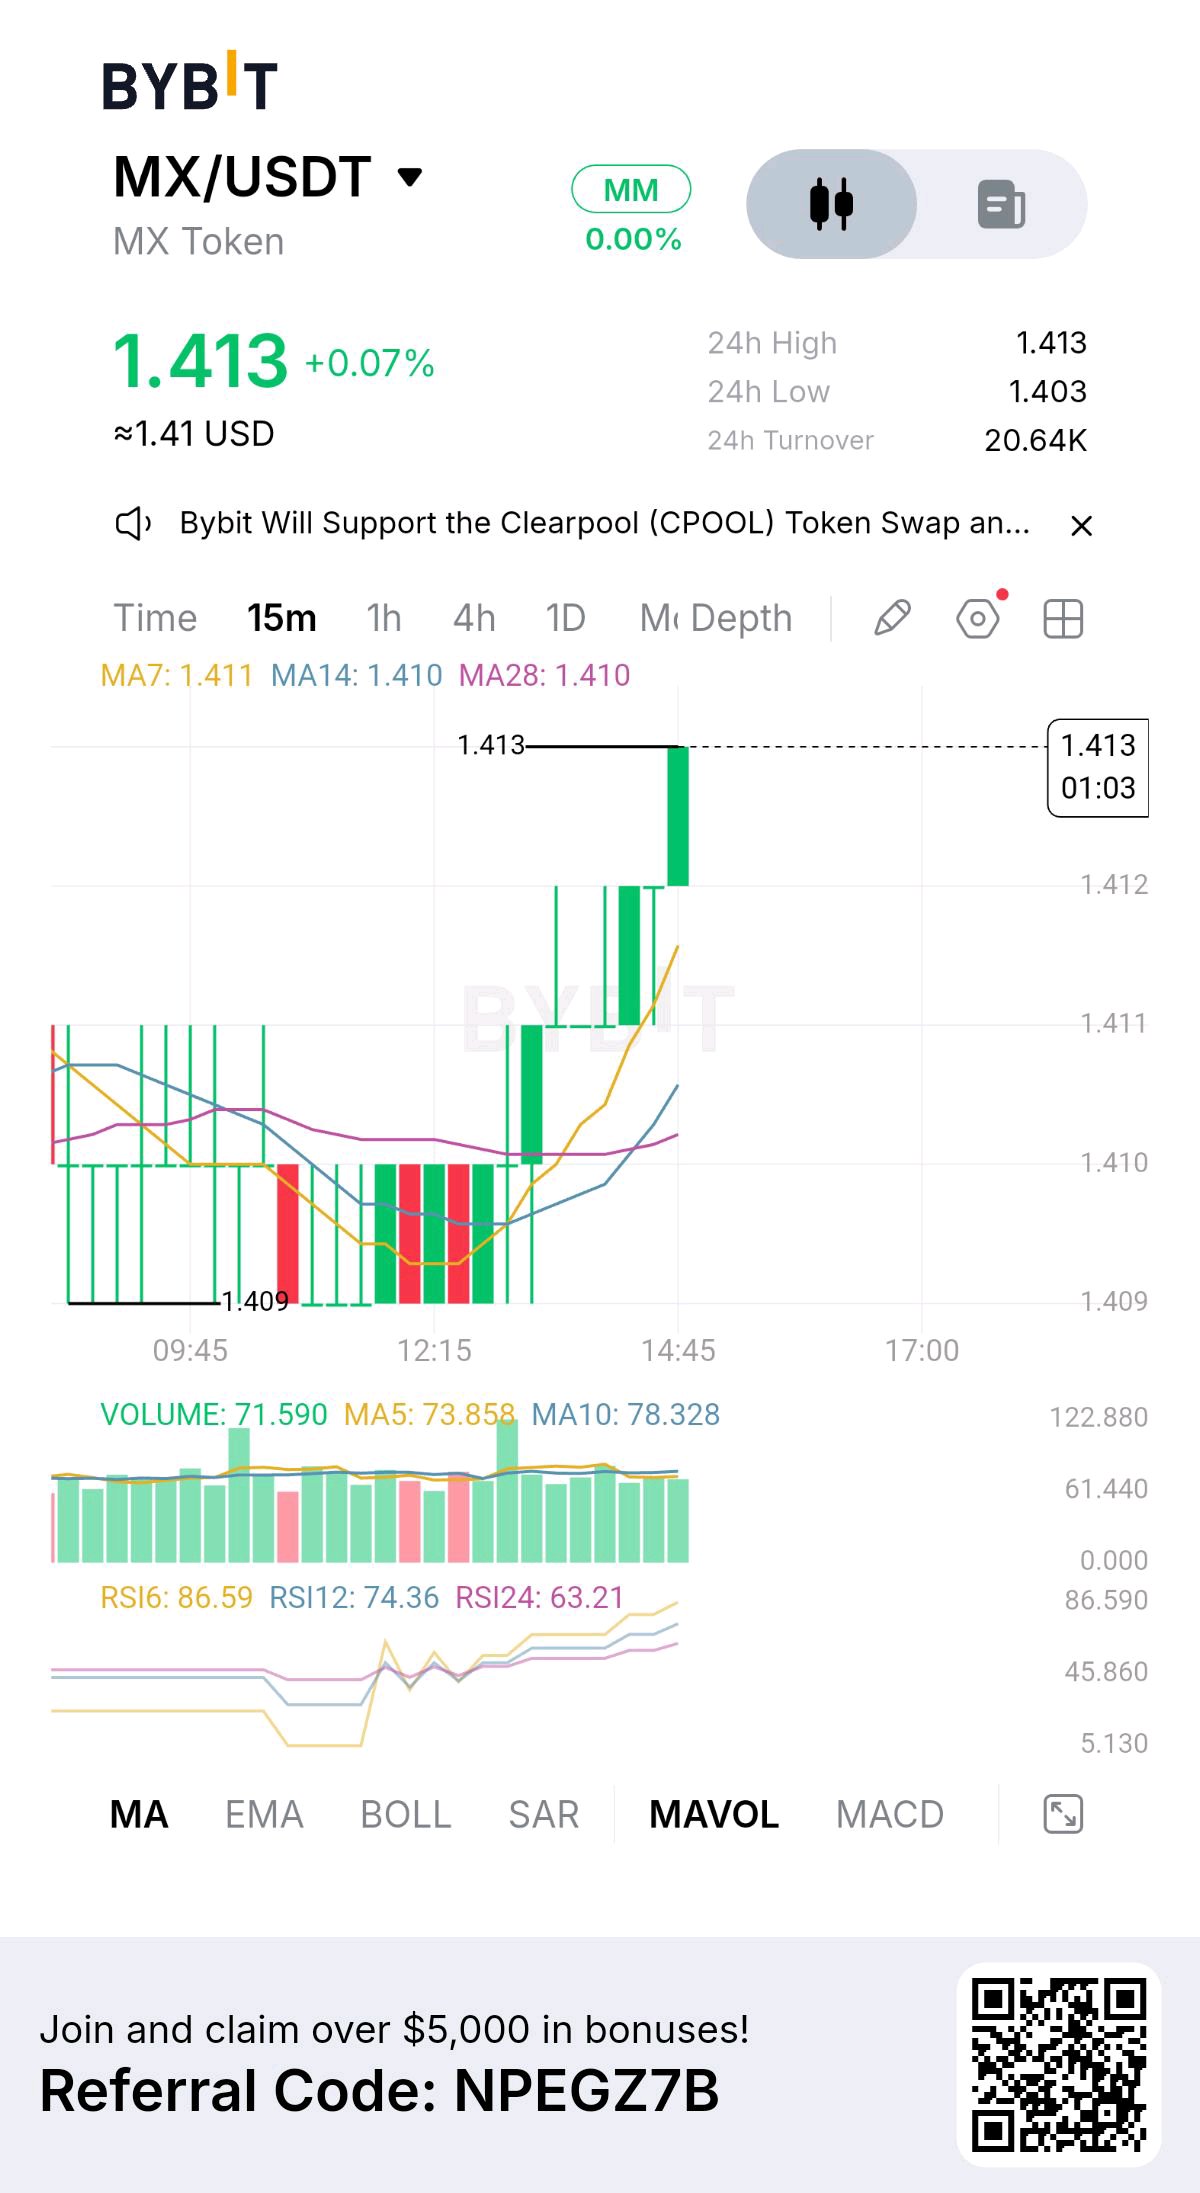
MX has remained relatively stable around $1.41, but one important detail stands out: the token is still underperforming, even without a major sell-off today. MX is trading near $1.409, down approximately 4% over seven days and 25% over 30 days. Its market capitalization is around $133.7M, with roughly 94.95M tokens circulating. The daily technical picture remains bearish, with 12 sell signals against only 2 buy signals in the latest indicator snapshot. The first battle is around $1.41. Buyers need to establish support here and reclaim the nearby $1.45–$1.50 region before a meaningful recovery becomes convincing. Until then, sideways movement should not automatically be interpreted as accumulation. The fundamental story is closely connected to the MEXC ecosystem. MX benefits from exchange-related utility, including eligible trading-fee deductions, while the MX Token 2.0 framework emphasizes buybacks and burns. MEXC previously announced that circulating supply had reached its 100M-token target. That creates a potentially supportive supply structure, but buybacks alone cannot guarantee price appreciation. There is also a regulatory overhang. Recent U.S. Treasury action involving MEXC has introduced uncertainty around the associated exchange. This is a possible sentiment risk, not a proven explanation for every MX price movement. Key figures $1.409 — Current price snapshot $1.41 — Immediate price battle $1.45–$1.50 — Recovery confirmation zone $133.67M — Market capitalization 94.95M — Circulating supply $4.92M — Reported 24H volume -4.02% — Seven-day performance -25.33% — 30-day performance Bullish confirmation: Hold above $1.41 and reclaim $1.50 with stronger volume. That would provide the first meaningful evidence that selling pressure is easing. Bearish confirmation: A sustained breakdown below $1.40 would weaken the current consolidation and increase the risk of another downward leg. Risk Management: I would avoid treating a quiet price chart as proof of a bottom. The daily technical structure remains bearish, and exchange-related uncertainty can change sentiment quickly. Wait for a confirmed reclaim rather than anticipating one. MX has a buyback-and-burn narrative, but the market ultimately needs something stronger: sustained demand that can turn reduced supply into actual price strength. $MXUSDT #ByXIMPACT
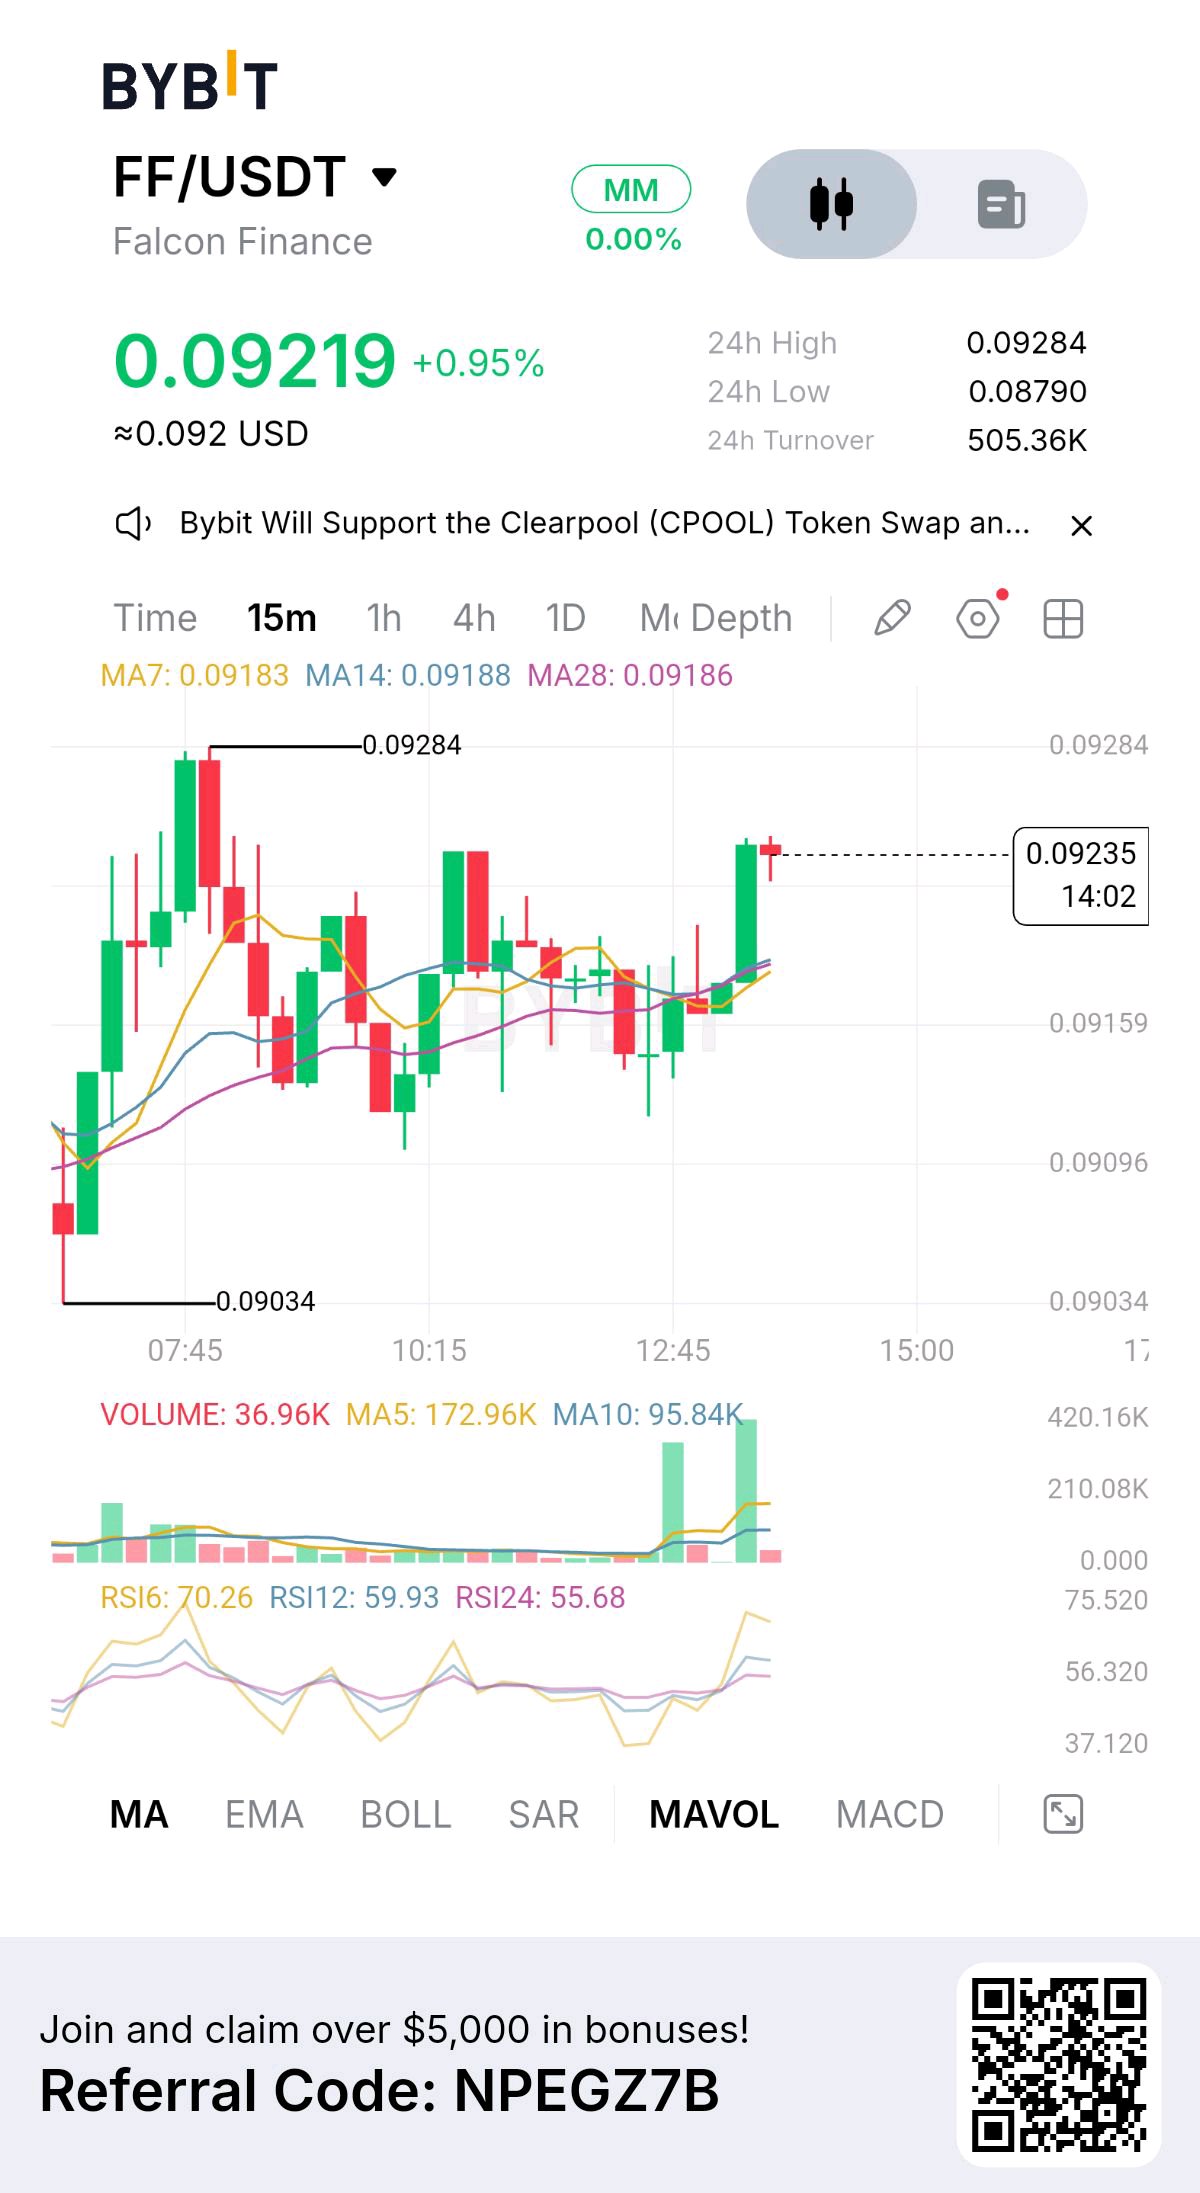
Falcon Finance 正顯示出復甦跡象,而市場大部分仍處於壓力之下。但我更感興趣的是,這一波走勢能否在下次代幣解鎖後維持,而不是它最近的綠色K線表現。 FF 目前交易價格在 0.0919 美元左右,24 小時內上漲約 2.3%,七天內上漲 7.2%。價格已從 0.084 美元區域向 0.093 美元的阻力區移動。這令人鼓舞,但 FF 仍比其歷史最高點低 86% 以上。復甦是真實的,但更廣泛的趨勢反轉尚未確立。 基本面故事比單純的價格反彈更有趣。Falcon 的 USDf 模型利用抵押品來創建超額抵押的合成美元,而 sUSDf 則提供對收益策略的曝險。更多抵押品的採用可能會加強生態系統,但代幣需求仍需要轉化為可衡量的使用率和價值捕獲。 當前的直接擔憂是供應問題。大約 7,500 萬枚 FF 代幣計劃於 11 月 28 日解鎖,隨後在 11 月 29 日還有另一筆大規模釋放。這兩次釋放合計可能使可用供應量增加超過 2 億枚代幣。解鎖並不保證會出現拋售,但這對任何正在進行的復甦來說,都是一場重大的流動性測試。 關鍵數據 0.0919 美元 — 當前價格快照 0.0878 美元 — 24 小時支撐參考 0.0929 美元 — 24 小時阻力位 0.0840 美元 — 七日低點區間 3.25 億美元 — 市值 35.5 億枚 — 流通供應量 100 億枚 — 最大供應量 11 月 28 日至 29 日 — 即將到來的解鎖窗口 看漲確認:若能乾淨俐落地突破 0.093 美元,隨後成功回測,將增強復甦的論點。持續的買盤可能會開啟通往 0.10 美元心理關卡的道路。 看跌確認:若在 0.093 美元附近受阻,隨後跌破 0.0878 美元,將削弱當前的結構。若跌破 0.084 美元,則顯示賣方正重新奪回控制權。 風險管理:期貨資金費率為正,意味著多頭正在支付空頭費用。這顯示了做多倉位的成本,但單憑這一點並不能證實存在過度槓桿。我會避免在阻力位被收復之前追逐當前的復甦,特別是在預定的供應釋放即將到來的情況下。 對 FF 而言,真正的考驗不在於它能否再拉出一根綠色K線,而在於真正的需求能否在不失去復甦結構的情況下消化新的供應。 $FFUSDT #IMPACTbyTrade
INIT 已從七月的低點回升,但最近的拋售潮正在測試這種復甦是否具備真正的支撐力。 INIT 目前價格約為 $0.1056,七天內下跌了 11.9%,相較於 $1.442 的歷史高點,仍跌去了超過 92%。最近 24 小時的波動範圍為 $0.09338–$0.1087。$0.0934 區域是目前亟需防守的支撐位,而 $0.1087 則是第一個關鍵的收復目標。在買方能突破該阻力位之前,斷言這是一次明確的反轉還言之過早。 市場保持謹慎是有基本面原因的。Initia 在 10 月 23 日遭遇了 MoveVM 安全漏洞攻擊,攻擊者盜取了價值約 270 萬美元的資產。團隊後來宣佈網絡與 Rollups 已於 11 月 2 日恢復運行,且受影響的資產支持已得到恢復。這雖是重大的進展,但恢復營運並不等於自動恢復投資者的信心。 供應量是另一個壓力點。下一次預定的 INIT 解鎖日為 11 月 24 日。目前流通供應量僅佔最大供應量的 22% 左右,因此評估行情反彈時,未來釋出的供應量仍是重要考量因素。 關鍵數據 $0.1056 — 當前價格快照 $0.09338 — 24 小時最低價 $0.1087 — 24 小時最高價 $23.47M — 市值 $29.05M — 合約未平倉量 -5.70% — 24 小時未平倉量變化 11 月 24 日 — 下一次預定解鎖日 看漲確認:收復 $0.1087 並站穩該價位。更強勁的現貨需求將使反彈嘗試更具可信度。 看跌確認:跌破 $0.0934 且無法收復。這將使市場面臨進一步下探的風險。 風險管理:期貨活動異常活躍,據報告期貨交易量約為現貨交易量的 19 倍。在最新的聚合快照中,資金費率也呈現深度負值。這可能會創造軋空(short-squeeze)的潛力,但並不能證明這就是底部。我會建議等待價格結構和現貨參與度改善後,再將反彈視為趨勢反轉。 INIT 的下一步取決於兩件事:買方能否在駭客攻擊後重建信心,以及需求能否消化即將到來的供應量。單憑一根綠棒並無法解答這兩個問題。 $INITUSDT #IMPACTbyTrade
SPCXX is trading near $134.70, but the bigger question is whether buyers can defend this recovery before the next major supply event in SpaceX shares. Price is down approximately 3.6% over 24 hours, with a reported range of $134.61–$140.24. It remains roughly 40% below its $225.31 all-time high. The immediate battle is around $140.24; reclaiming that area would be the first sign that buyers are regaining control. On the downside, $134.60 is the near-term level to protect, while the wider seven-day range extends toward $133.30 and $148.17. The fundamental distinction is important. SPCXX is designed to represent SpaceX shares on a 1:1 backed basis through the xStocks structure. It provides economic exposure, not direct shareholder ownership. Unlike a typical crypto token, its supply mechanism is linked to the deposit and redemption of underlying shares. There is also a date worth watching: a reported SpaceX shareholder lock-up release is scheduled for December 8, potentially freeing up to 798 million underlying shares. That does not mean those shares will automatically be sold, but it creates a possible supply overhang for the underlying equity and deserves attention. Key figures $134.70 — Current price snapshot $140.24 — 24H resistance $134.61 — 24H low $133.30 — Wider weekly support reference $148.17 — Seven-day high $225.31 — All-time high $1.78M — Futures open interest -10.96% — 24H change in open interest Bullish confirmation: Reclaim $140.24 and hold above it with stronger spot participation. That would bring $148.17 back into focus. Bearish confirmation: Lose $134.60 and fail to reclaim it. That would expose the $133.30 area, with a deeper move potentially extending the correction. Risk Management: I would not treat a weekend price move as full confirmation while the underlying equity market is closed. Watch whether the token's move holds when traditional price discovery resumes. Open interest is also declining, suggesting positions are being reduced rather than a clear wave of fresh conviction entering. SPCXX offers continuous access to SpaceX-linked exposure, but 24/7 trading does not mean 24/7 confirmation from the underlying asset. The next meaningful signal is whether buyers can reclaim $140.24 and sustain it. $SPCXXUSDT #IMPACTbyTrade
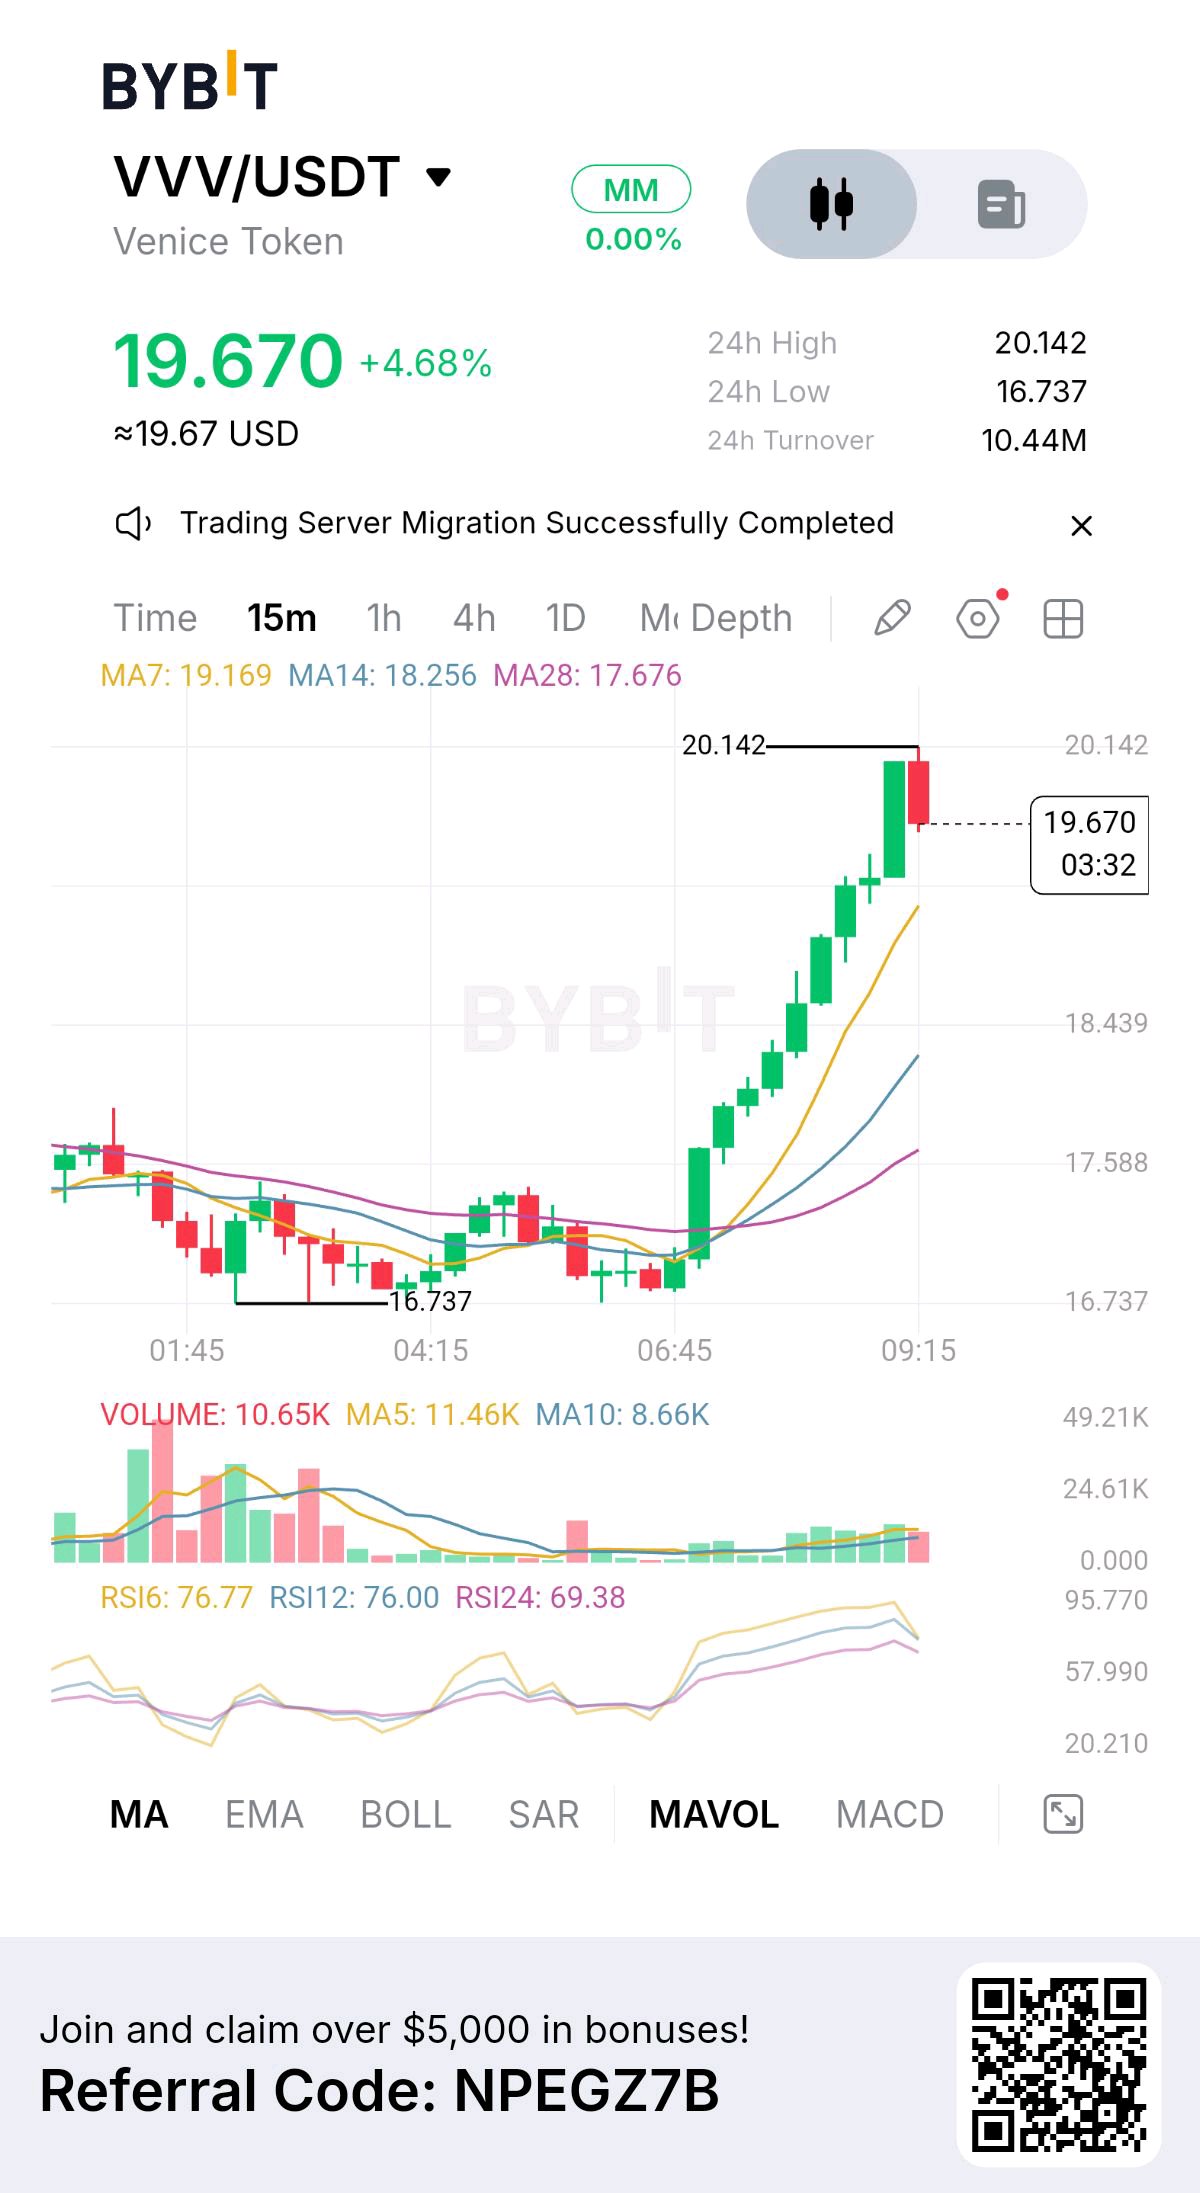
$VVVUSDT — Venice Token 從九月的高點已下跌近 50%,但在賣壓之下,情況有些微妙。空頭部位正在增加,而動能指標已接近超賣區間。我正在觀察這次回調會創造另一個機會,還是會演變成更深度的跌破。 我的日線圖顯示 VVV 目前交易價格約為 17.07 美元,24 小時內下跌約 10%,七天內下跌約 15%。價格已從九月 34.51 美元的高點回落,形成了明顯的高點降低序列。日線 RSI 約為 33.4,價格仍低於 50 日和 200 日移動平均線。整體結構看跌,但目前的賣壓值得密切關注。 15.73 美元的支撐攻防戰 這是我圖表上最重要的下行參考點。VVV 最近測試了約 15.73 美元的低點,隨後回升至 17.00 美元左右。我想看看買方能否守住該區域並建立一個更高的低點。 第一個反彈障礙是 17.44 美元。奪回該水平將是令人鼓舞的進展,但 18.20 美元才是更重要的壓力位。如果買方能在此之上展現強勢,下一個復甦目標將是 19.00 美元,隨後是 20.00 美元的心理關卡。 不過,我不會預設 RSI 超賣就代表回調已經結束。 衍生品市場正出現有趣的情況 VVV 的資金費率已轉為負值,每四小時約為 -0.0046%,這意味著空頭部位正在支付多頭費用。未平倉合約在 24 小時內也下降了約 7.39%,來到約 1,583 萬美元。 同時,空頭帳戶約佔追蹤市場部位的 56%。 這種組合值得注意。如果買方捍衛住支撐位且價格開始回升,空頭回補可能會提供額外的動能。但未平倉合約下降也可能表明交易者只是在平倉。在將其視為潛在的軋空行情之前,我需要價格走勢的確認。 Venice 的基本面背景 Venice 正在建立私密且具抗審查能力的 AI 基礎設施,讓使用者能以更高的隱私性存取生成式 AI 服務。 其 VVV 代幣透過質押和存取平台資源,在生態系統中扮演重要角色。有趣的部分在於代幣質押與平台可用推理能力之間的連結。 供應量也值得關注。目前約有 4,900 萬枚 VVV 在流通,且約 99.35% 的已追蹤配額已經解鎖。目前沒有重大的集中解鎖計畫,儘管每週仍有約 71,920 枚代幣透過團隊歸屬釋出進入流通。 風險管理 15.73 美元區域是我即時的結構檢查點。若持續跌破該價位,將嚴重削弱復甦的論點,並使 VVV 面臨進一步下探的風險。 對於看漲情境,我希望看到買方捍衛支撐位、奪回 17.44 美元,並在 18.20 美元之上建立強勢。 若沒有確認的入場點和保護性止損,提出精確的風險回報比是不負責任的。 我關注 VVV 是因為資金費率為負與動能超賣的組合,若買方最終能重新奪回控制權,可能會創造機會。 但重要的是要區分軋空與真正的趨勢反轉。 20 美元的目標將保持為次要目標,直到 Venice 能證明更重要的一點:買方願意捍衛 15.73 美元區域並挑戰當前高點降低的序列。 這才是我正在等待看到的復甦跡象。 $VVVUSDT #IMPACTbyTrade
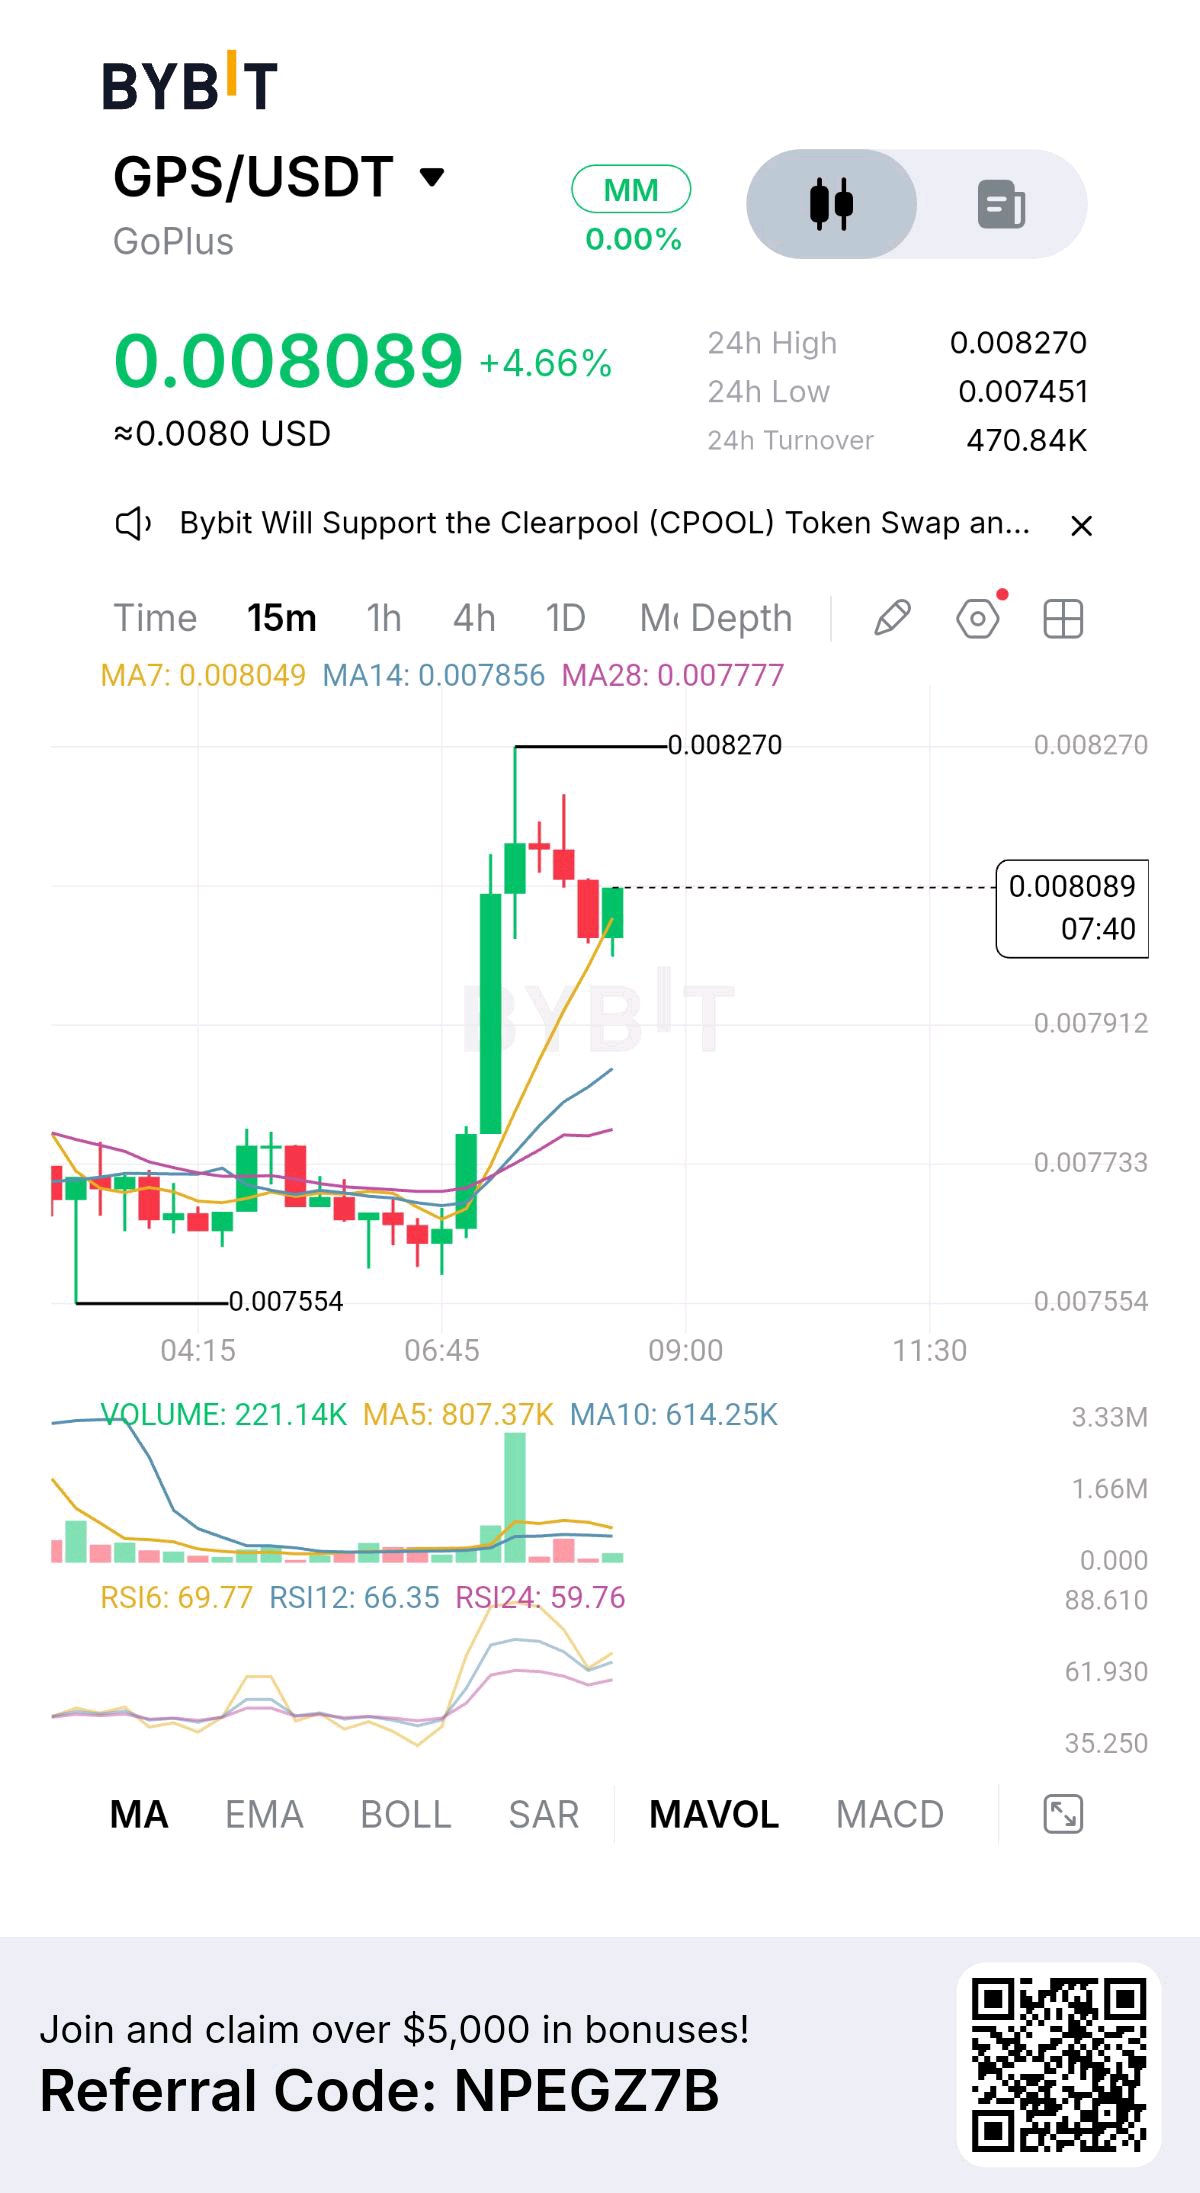
GPS 正在努力企穩,但時機卻有些尷尬:買家在面臨技術阻力的同時,又迎來了大量投資者和內部人士的代幣解鎖。 GoPlus Security 的交易價格在 0.0077 美元附近,24 小時內下跌了約 1–3.6%(具體取決於市場快照時間)。其近期日內波動區間約在 0.007585–0.008042 美元之間,0.0080 美元區域充當了直接阻力位。其整體周線表現仍然略顯負面,且 GPS 目前的價格仍較 2025 年初 0.22 美元左右的峰值下跌了超過 96%。 其基本面是建立在一個隨 Web3 不斷擴大的問題之上:交易安全。GoPlus 提供代幣風險檢測、惡意地址情報、釣魚防護和交易模擬 API。其安全工具已整合至 DexScreener 等外部平台,而其官方生態系統正透過 AgentGuard 和 DeepScan 等產品擴展至 AI 代理安全領域。 該代幣的預期用途不僅僅是一個簡單的治理敘事。GPS 專為支付安全服務、存取安全情報、SafeToken 服務以及網路貢獻者質押而設計。然而,採用率與價值捕獲之間存在重要區別。當前的協議追蹤顯示 30 天內的費用約為 16,900 美元,且沒有向代幣持有者分配直接收入的報告。安全業務的增長並不自動轉化為 GPS 的等量買盤壓力。 近期的最大風險在於供應量。在 100 億的最大供應量中,約有 58.6 億枚 GPS 在流通。據報導,11 月 16 日將有 1.764 億枚 GPS 解鎖,約佔當前流通供應量的 3%。此次分配歸屬於私募投資者和內部人士。解鎖並不保證會進行拋售,但市場必須消化這些新增的可流通供應量。 衍生品也值得關注。幣安期貨的未平倉合約金額約為 536 萬美元,每四小時的資金費率接近 +0.005%。全球多空倉位幾乎平衡,儘管頂級交易員的倉位明顯偏向做多。如果價格在阻力位遇阻回落,這將造成潛在的脆弱性。 關鍵數據 價格:~$0.0077 市值:~$45M 24 小時波動區間:$0.007585–$0.008042 流通供應量:~5.86B GPS 最大供應量:10B GPS 30 天協議費用:~$16.9K 期貨未平倉合約:~$5.36M 資金費率:+0.005% / 4 小時 下次解鎖:1.764 億 GPS,11 月 16 日 看漲確認:持續突破 0.00804 美元,隨後出現更強勁的現貨買盤,將改善復甦結構。在不發生重大價格波動的情況下消化解鎖份額,將是需求存在的額外信號。 看跌確認:跌破 0.007585 美元將削弱當前結構。如果解鎖帶來了交易所充值增加和拋售壓力,GPS 可能會再次探底更低的支撐區間。 GoPlus 正在解決一個真實的基礎設施問題,其安全產品賦予了該項目可信的用例。但接下來的幾個交易日將揭示市場需求是否足以消化新增供應。我寧願看到這種確認,而不是去預測它。 $GPSUSDT #IMPACTbyTrade
$BNBUSDT — BNB has fallen below $600, and I'm watching whether the current selloff is approaching exhaustion or preparing for another leg lower. The next support reaction could determine whether buyers finally regain control. My daily chart shows a strong bearish structure. BNB is trading around $580, down approximately 8% over 24 hours. Daily RSI is near 21, indicating deeply oversold conditions. Price is also trading below its major daily moving averages, while MACD remains negative. This is significant selling pressure, not an ordinary pullback. The $572 Support Battle This is the immediate level I want buyers to defend. BNB has approached this region following an aggressive decline, and a convincing reaction could create an opportunity for a short-term recovery. My first resistance is $600, followed by $615.60. However, $635.81 is the more important obstacle. A convincing daily close above that level would provide stronger evidence that buyers are regaining control. If the recovery develops, $646.99 and eventually $663 become the next upside references. On the downside, a sustained breakdown below $572.43 would expose $548.54, followed by the larger $523 region. The Fundamental Strength Behind BNB There's an important difference between BNB and many speculative altcoins. Its demand is connected to an established blockchain ecosystem. BNB powers transactions across BNB Smart Chain, opBNB and BNB Greenfield. It also serves as a governance asset and provides utility throughout the broader ecosystem. Another important development is the 37th quarterly BNB burn, completed on October 19. Approximately 1.646 million BNB were permanently removed, leaving around 131.51 million tokens in the remaining supply at that time. This continuing reduction in supply supports BNB's long-term scarcity mechanism. However, token burns cannot independently reverse aggressive market selling. What Derivatives Are Telling Me BNB futures open interest is approximately $338 million, down around 5.8% over 24 hours. Funding has moved close to zero, while approximately $6.2 million in positions have been liquidated, predominantly from long positions. This suggests leveraged exposure is being reduced as price falls. It could help remove excessive speculation, but it doesn't confirm that institutional or spot buyers have returned. Risk Management The $572.43 area is my immediate structural checkpoint. A sustained breakdown below it would seriously weaken the recovery argument and expose $548.54. For the bullish scenario, I want buyers to defend support, reclaim $600, and establish strength above $615.60 before considering a larger recovery toward $635.81. Without a confirmed entry and protective stop, assigning an exact risk-to-reward ratio would be misleading. I'm interested in BNB's longer-term fundamentals, particularly its established ecosystem and recurring token burns. But the current chart still belongs to sellers. The opportunity I'm watching isn't simply buying BNB because RSI is oversold. It's whether buyers can defend $572 and turn this aggressive correction into a genuine market structure recovery. Until that happens, patience matters more than chasing a bounce. $BNBUSDT #IMPACTbyTrade
$BTCUSDT — 比特幣已經失守 67,000 美元關卡,我正在觀察目前的拋售是即將進入尾聲,還是準備迎接下一波下跌。接下來幾天的日線收盤價可能會決定整個山寨幣市場的走勢。 我的日線圖顯示出明顯的看跌結構。BTC 目前交易價格約為 64,443 美元,24 小時內下跌約 5.8%,七天內下跌 15.1%。日線 RSI 指標接近 20,顯示處於嚴重的超賣狀態。價格也跌破了 200 週移動平均線,這是一個在歷史上重大修正期間通常會引起市場高度關注的重要水準。然而,單憑超賣狀態並不能確認市場底部已經形成。 62,750 美元的支撐攻防戰 這是下一個重要的下行參考點。比特幣已經失去了 66,450 至 67,000 美元的區間,在買方重新收復該區域之前,我不會對復甦抱有太大信心。 我的第一個復甦阻力位是 65,000 美元,接著是 66,450 美元。若能明確收復接近 200 週移動平均線的 67,900 美元,將能提供更強力的證據,證明買方正在回歸。 在此之上,70,200 美元將成為下一個重要障礙。如果 BTC 能在該區域上方展現強勢,那麼 73,000 至 75,000 美元的大型阻力區將成為切實可行的復甦目標。 但如果賣方將價格推低至 62,750 美元下方,整體看跌結構可能會加速向下,直逼 60,000 美元的心理關卡。 機構需求的困境 有一個我不會忽視的發展,那就是機構資本持續撤出。美國現貨比特幣 ETF 的每週資金流出額約為 10.7 億美元,這是連續第二週贖回額超過 10 億美元。 比特幣目前已經連續七個交易日出現 ETF 資金流出。這顯示機構需求在修正期間已顯著減弱。 衍生品持倉也值得注意。追蹤市場的期貨未平倉合約減少了約 7.1%,降至 62.3 億美元,而資金費率則維持在 0.003% 左右的輕微正值。 這種組合顯示槓桿曝險正在收縮,但市場尚未完全清除多頭部位。因此,若支撐位進一步失守,可能會引發額外的清算。 風險管理 62,750 美元區域是我目前的直接下行監測點。若持續跌破該價位,比特幣將面臨跌向 60,000 美元區域的風險。 至於看漲情境,我希望看到買方奪回 65,000 美元,恢復 66,450 美元,並在 67,900 美元上方建立強勢。在沒有確認進場點和止損點的情況下,給出精確的風險回報比會產生誤導。 我對比特幣的復甦潛力很感興趣,因為日線 RSI 處於深度超賣狀態,且槓桿部位已經歷了實質性的清算壓力。 但我不會將拋售疲軟與確認反轉混為一談。 最重要的問題不在於比特幣是否能從這些水準出現反彈,而在於買方能否收復失去的 67,000 美元關卡並使其重新成為支撐。 在此之前,大趨勢仍處於壓力之下,保護資本比追逐超賣反彈更為重要。 $BTCUSDT #IMPACTbyTrade
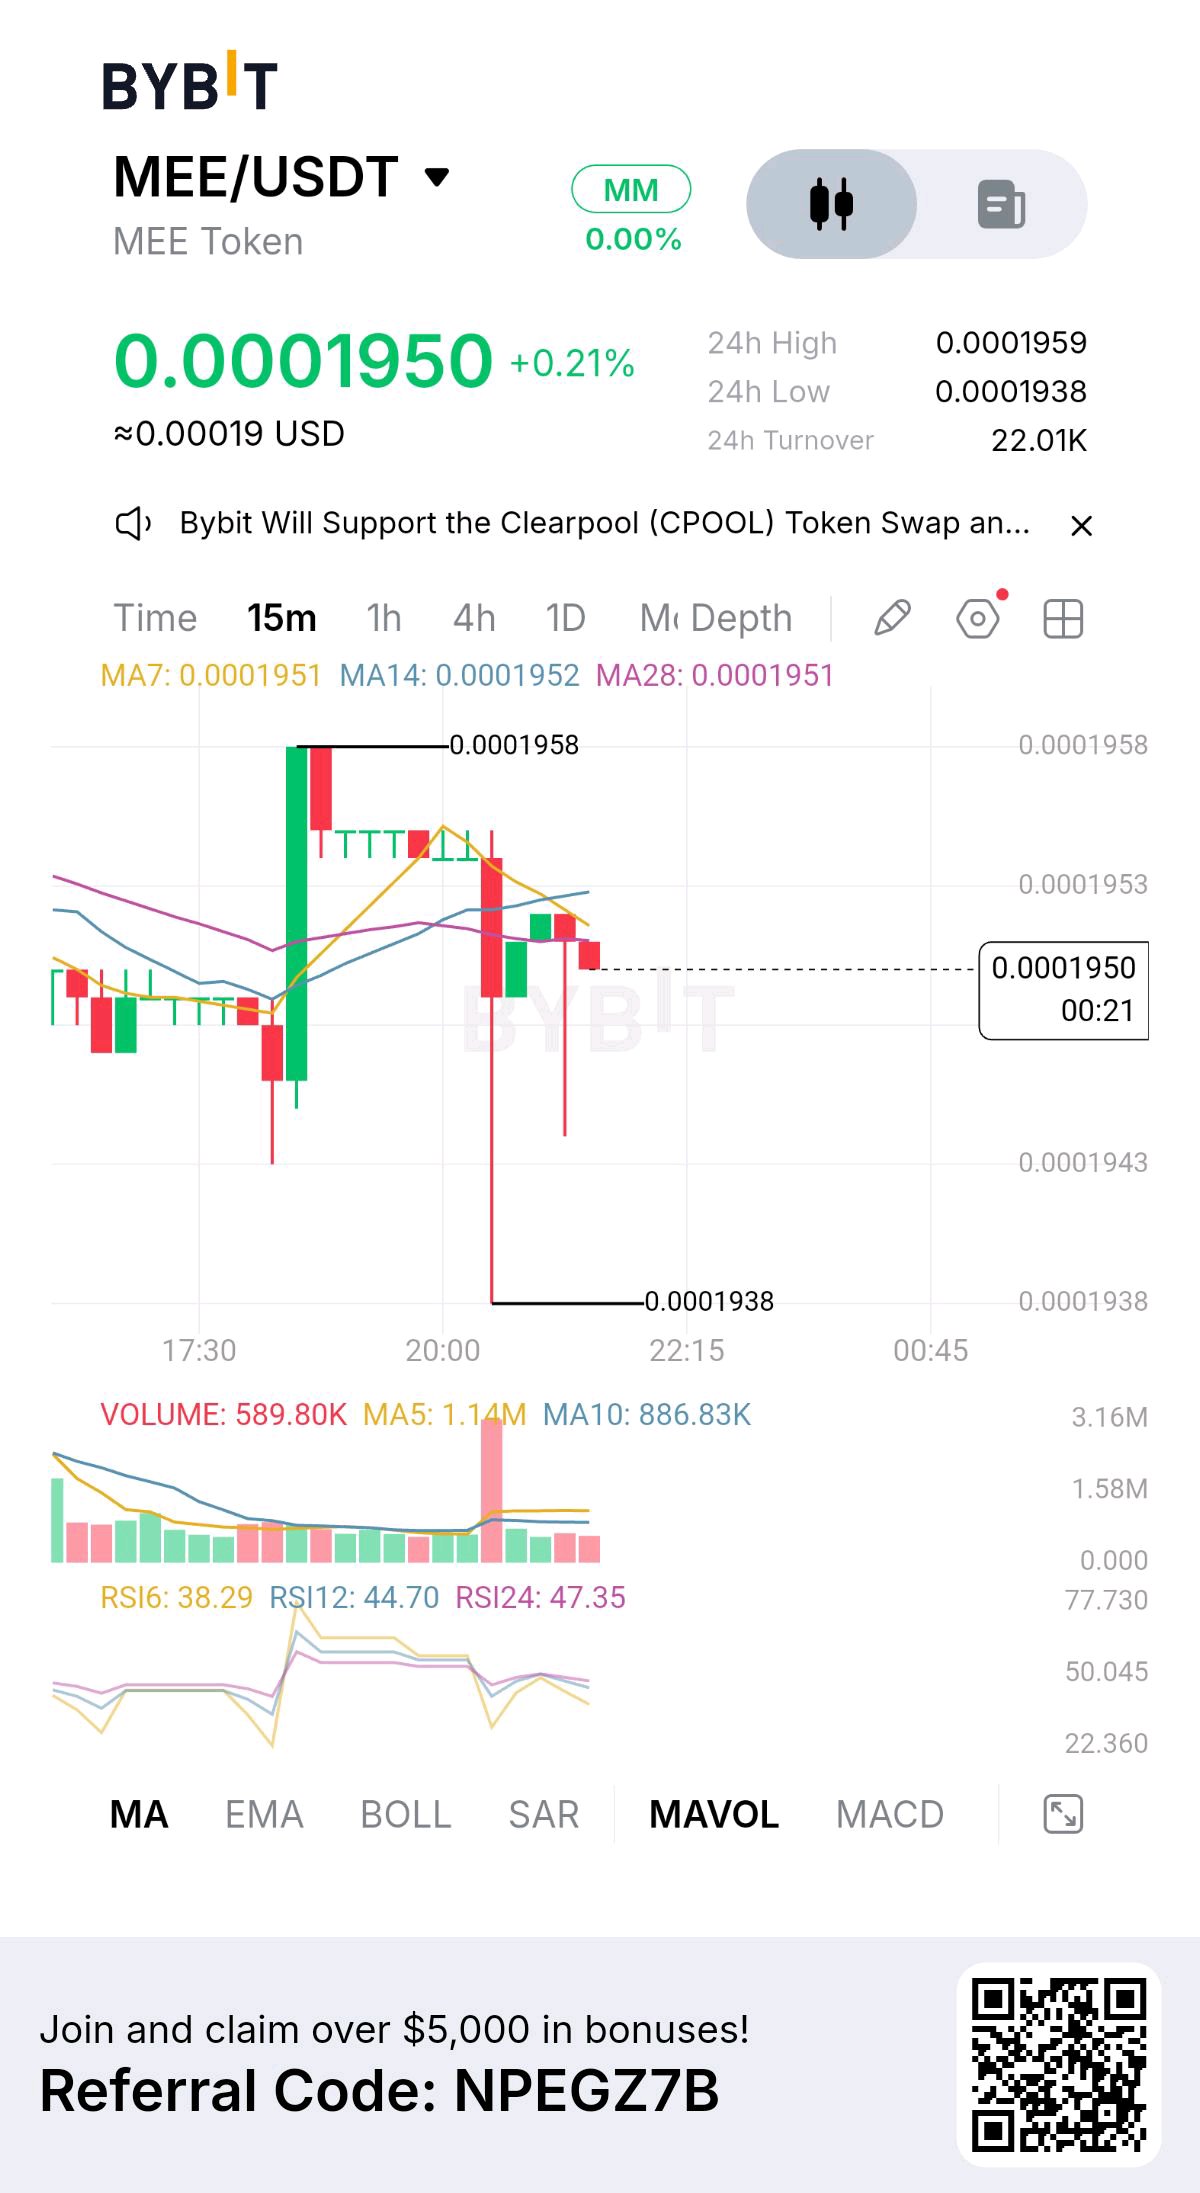
$MEEUSDT — 在經歷長時間的下跌後,MEE 正顯示出初步的穩定跡象,但我無法忽視一個問題:市場深度極淺,即使是相對較小的買賣盤也可能導致不成比例的價格波動。 根據我的日線圖分析,MEE 的交易價格約為 $0.000195,24 小時內漲幅約 0.1%,七天內反彈幅度為 6.4%。價格近期從 $0.0001769 區域回升至 $0.0002591 附近,隨後回吐了大部分漲幅。這一點很重要。買方確實展現了一些興趣,但未能突破週高顯示賣壓依然存在。 $0.000196 的阻力爭奪戰 $0.0001960–$0.0001990 區域是我關注的即時阻力區。在對下一次反彈更有信心之前,我需要看到買方克服此範圍並確立在該位置之上的價格支撐。 在此之後,$0.0002100 成為一個重要的心理參考點。更強勁的突破可能會打開通往 $0.0002300 的道路,隨後是近期 $0.0002591 的高點。 在下行方面,$0.0001910 是即時支撐位,隨後是 $0.0001830。$0.0001769 的週線低點是我希望買方守住的更關鍵水平。 Medieval Empires 的機會 MEE 通過《Medieval Empires》擁有有趣的效用敘事。這是一款基於區塊鏈的多人策略遊戲,圍繞歷史戰爭、領土擴張和數位所有權構建。 該代幣提供多種遊戲內福利,包括 VIP 身份、與土地相關的機會、質押獎勵、投票權以及特定的遊戲功能。 這在代幣所有權與實際遊戲參與之間建立了聯繫。然而,關鍵問題在於該項目能否吸引足夠的活躍玩家,以產生對 MEE 的可持續需求。 一個遊戲代幣需要的遠不止是一個吸引人的概念。玩家留存率、遊戲內經濟活動以及持續的開發進度,將決定其效用是否具有實際意義。 供應與流動性問題 MEE 的最大供應量為 30 億枚代幣,目前報告的流通量約為 5.594 億枚。這僅佔最大供應量的 18.6% 左右。 一個重要的區別是,雖然公佈的歸屬時間表顯示定期解鎖已結束,但總供應量中仍有很大一部分不在報告的流通量內。未鎖定供應量並不等同於流通供應量。 另一個擔憂是,報告的 24 小時交易量僅約 29,000 美元,市值接近 109,000 美元。訂單簿深度也極其有限。 這意味著即使是相對較小的交易也可能大幅推動價格。與其將其視為常規交易設置,我會將 MEE 視為高風險、低流動性的機會。 風險管理 $0.0001910 區域是我即時的支撐參考點。失守該位置將削弱目前的穩定嘗試,並使價格面臨 $0.0001830 區域的風險。 至於看漲情景,我希望看到買方奪回 $0.0001990,確立更高的低點,並最終突破 $0.0002100。 在沒有確認進場點和保護性止損的情況下,給出精確的風險回報比會產生誤導。在這種流動性水平下,滑點和執行風險尤為重要。 我對 MEE 的遊戲效用感興趣,但我不會將短期的週線反彈誤認為是確定的看漲反轉。 真正的機會取決於兩件事:Medieval Empires 能否產生顯著的玩家需求,以及 MEE 能否發展出足夠的市場流動性來支持可持續的復甦。 目前,$0.0001769 的低點是重要的下行參考,而 $0.0001990 是買方需要克服的第一道障礙。 $MEEUSDT #IMPACTbyTrade
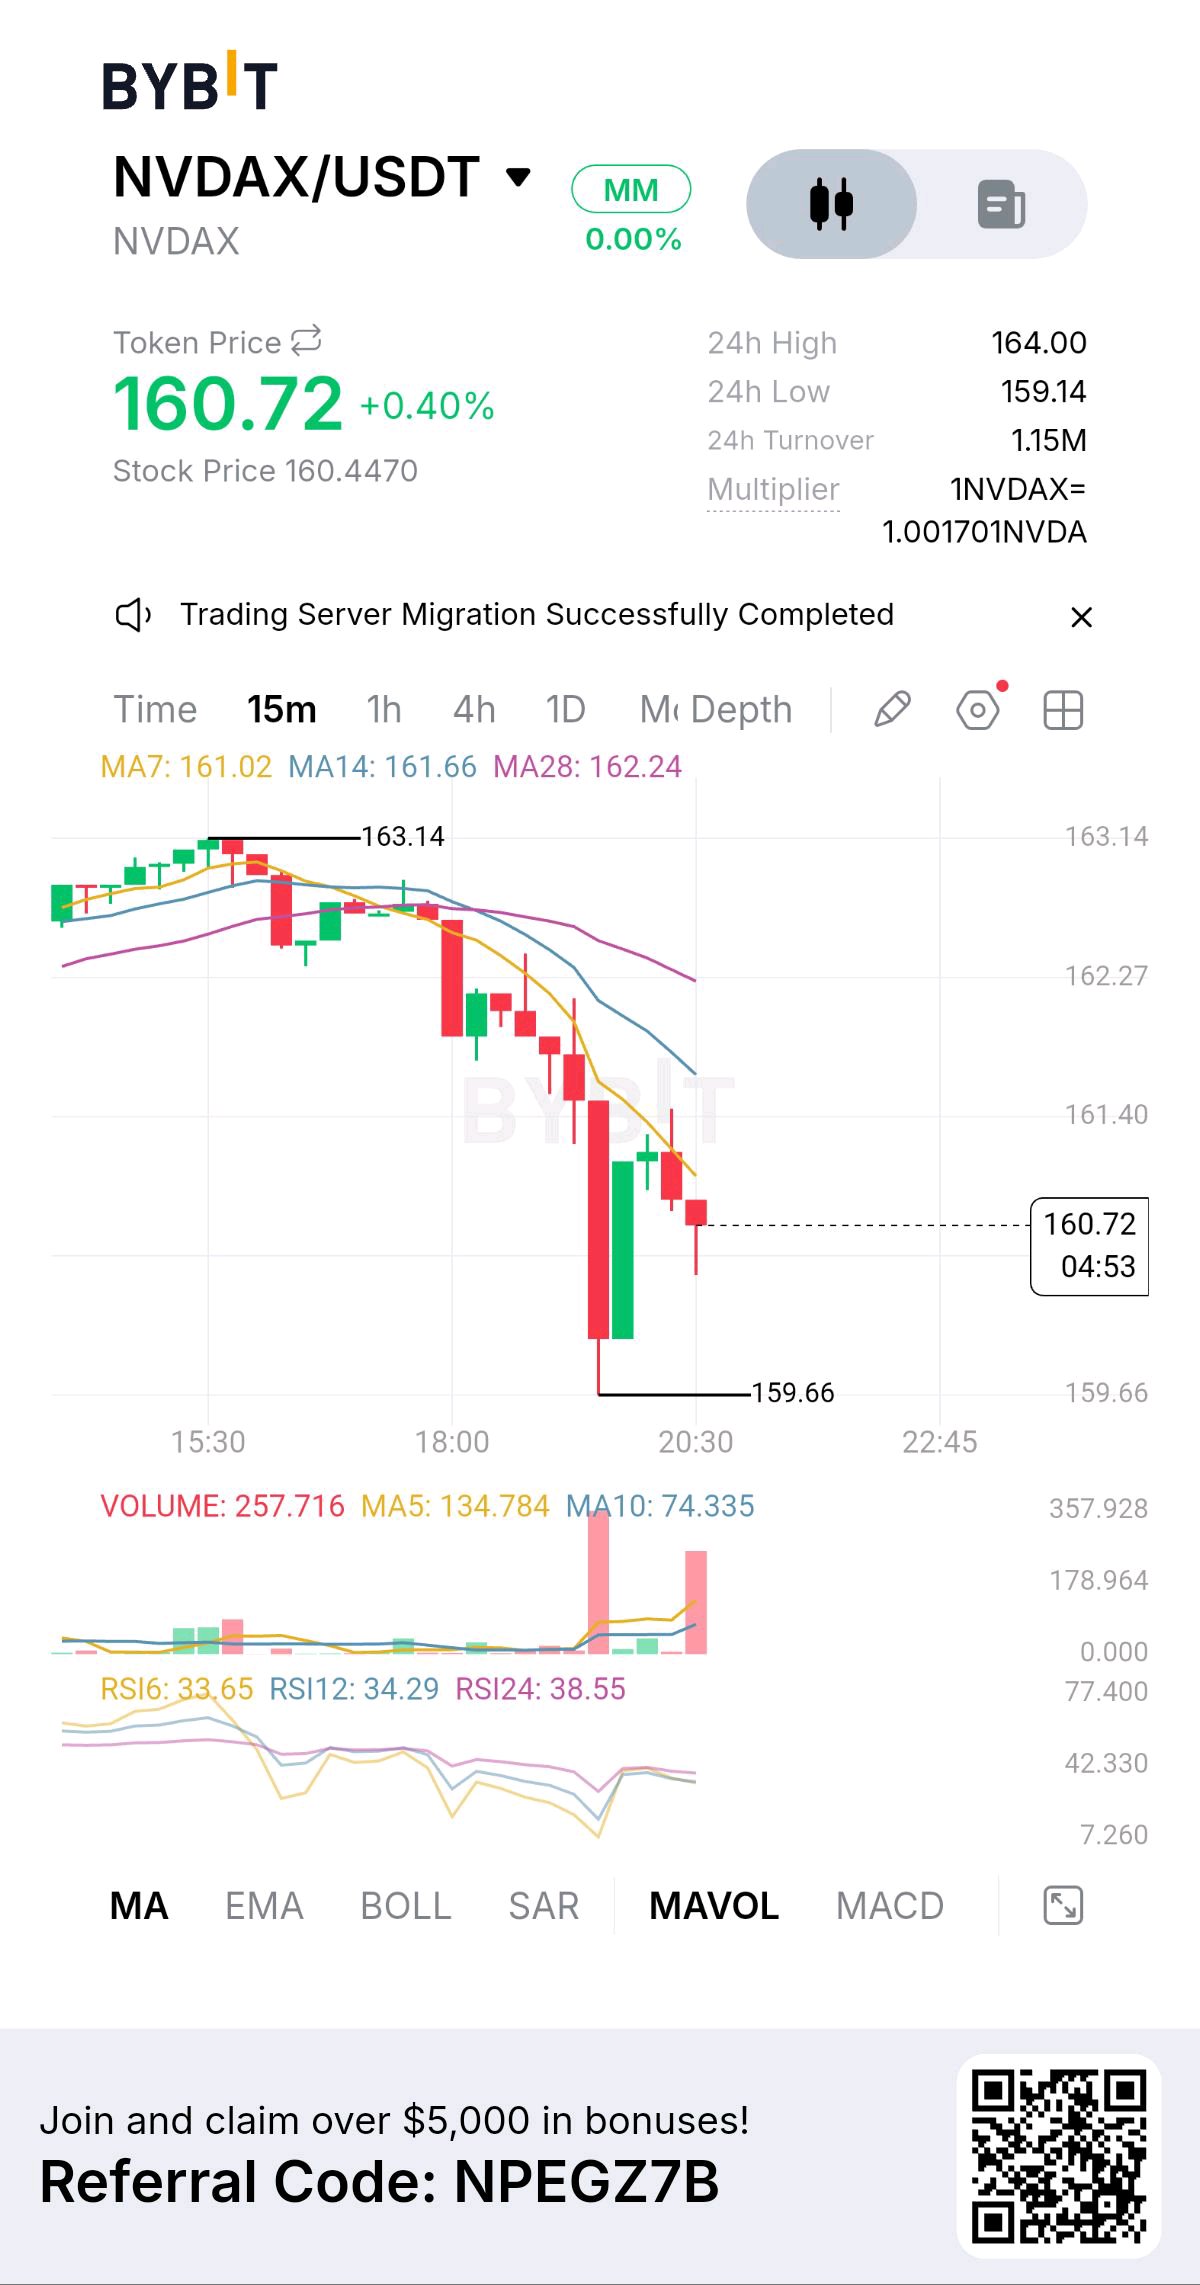
$NVDAXUSDT — NVIDIA 的代幣化股票正接近一個重要的支撐區,但我所關注的遠不止於技術性反彈:買方能否在 11 月 17 日財報發布前重拾信心。 我的日線圖顯示動能明顯減弱。NVDAX 目前交易價格約為 $162,24 小時內下跌約 3.2%,七天內下跌 13.9%。價格已從 10 月歷史高點 $242.89 回落,近期最低跌至 $158.67。當前結構仍然看跌,賣方積極防守任何反彈嘗試。這已不再僅僅是例行回調。 $158.67 的支撐保衛戰 這是目前我希望買方堅守的點位。如果在此區域出現令人信服的反應,隨後出現更高的低點(higher low),將是我考慮反彈的初步訊號。 我的第一個阻力位在 $167.64。收復該水平會令人鼓舞,但 $171.80 才是更重要的障礙。如果買方能克服該阻力並站穩其上,下一個反彈目標將是 $174.50 和 $178.33。 然而,若跌破 $158.67 將嚴重削弱反彈的論點。我下一個重要的下方參考點位是 $156.95 和 $153.11。 改變一切的基本面發展 造成此次疲軟背後有一個重要的公司特定發展。11 月 12 日,NVIDIA 正式宣布黃仁勳已辭去執行長職務,由財務長 Colette Kress 擔任臨時執行長,董事會正在尋找永久接任者。 對於這家 AI 產業中最重要的公司之一來說,這是一次重大的領導層變動。董事會表示,營運、客戶承諾和產品路線圖預計將持續進行,不會中斷。 下一個主要催化劑是 11 月 17 日,屆時 NVIDIA 將公布 2027 會計年度第三季財報。此前,該公司預測季度營收約為 1,080 億美元。我相信財報發布及管理層的評論可能成為下一波方向性走勢的重要催化劑。 衍生品市場釋放的訊號 NVDAX 期貨交易量約為 764 萬美元,現貨交易量為 309 萬美元。未平倉合約(Open interest)接近 389 萬美元,而資金費率異常偏高,約為 0.1608%。 這是我不會忽視的一點。正向資金費率意味著多頭正在向空頭支付費用,且高昂的費率增加了維持槓桿曝險的成本。 同時,未平倉合約在 24 小時內下降了約 2.48%。價格疲軟加上未平倉合約減少,顯示倉位正在縮減,而非顯示出明顯的新增建倉。 風險管理 $158.67 區域是我當前的結構性檢查點。若持續跌破該點位,將會下探至 $156.95,甚至可能觸及 $153.11。 對於看漲情境,我希望買方能守住支撐,收復 $167.64,並在 $171.80 之上站穩。若沒有確認進場點和保護性停損,給出精確的風險報酬比將具有誤導性。 我對 NVDAX 的反彈潛力感興趣,但有一個重要的區別:該代幣透過代幣化追蹤憑證提供對 NVIDIA 股票的經濟曝險。這並不代表直接持有 NVIDIA 股票或擁有股東投票權。 11 月 17 日的財報發布可能會改變市場情緒,但我不會預測結果。 對我而言,真正的機會取決於買方能否在下一次重大公司公告前守住 $158.67,並將目前的疲軟轉化為真正的反彈。 $NVDAXUSDT #IMPACTbyTrade
$XRPUSDT — XRP 數月來首次跌破 1 美元,但我正在觀察這次跌破是會成為另一波大幅下行的開始,還是會為顯著反彈創造條件。 我的日線圖顯示市場面臨相當大的拋售壓力。XRP 目前交易價格在 0.99 美元左右,七天內下跌約 11%。近期的跌勢已突破其數月下行三角形的下邊界,使 0.979–0.985 美元區間成為最重要的即時支撐位。日線 RSI 約在 20–22,顯示動能處於深度超賣狀態。然而,價格仍低於其主要移動平均線,且 MACD 仍呈看跌趨勢。賣方尚未失去控制權。 0.985 美元的支撐保衛戰 這是我不希望買方失守的關鍵位。XRP 之前在 8 月份於該區域建立了支撐,這使得當前的重新測試尤為重要。 如果買方能守住 0.979–0.985 美元並收復 1.00 美元,我第一個反彈目標將是 1.065 美元。在此之上,1.10–1.12 美元是下一個重要的阻力區間。 但我需要看到的而不僅僅是超賣反彈。如果日線能強勢收於 1.12 美元上方,將提供更有力的證據證明跌勢正在減弱。 而在下行方面,如果周線持續收於 0.979 美元下方,將嚴重削弱反彈的論點,並使 XRP 面臨 0.90–0.95 美元區域的風險。更大的下行參考位在 0.85 美元左右。 為什麼我正在觀察機構需求 近期的跌勢並非孤立發生。更廣泛的加密貨幣市場疲軟、更熱的美國通膨數據、更強的利率預期以及機構 ETF 的資金流出,都加劇了市場壓力。 美國現貨 XRP ETF 也連續出現資金撤離,包括最近兩個交易日合計約 1,800 萬美元的資金流出。 還有另一個有趣的發展。據報導,大型 XRP 持有者在跌勢期間累積了約 1,650 萬枚 XRP。這表明一些投資者正在吸收可用的供應量,但僅靠累積無法扭轉看跌的市場結構。 現在重要的是買盤興趣與市場結構實際變化之間的區別。 風險管理 0.979–0.985 美元區間是我即時的結構檢查點。若持續跌破該位,將使近期支撐論點失效,並將 0.90 美元納入考慮範圍。 對於看漲情境,我希望買方能守住該區域,收復 1.00 美元,並在挑戰 1.065 美元和 1.12 美元之前建立一個更高的低點。 在沒有確認進場點和止損位的情況下,給出確切的風險回報比會產生誤導。 我之所以關注 XRP 的反彈潛力,是因為目前的 RSI 讀數顯示了極端的拋售壓力。但我不會將超賣市場與確認底部混為一談。 真正的機會不僅僅是在 1 美元以下買入 XRP。重點在於買方能否守住 8 月份的支撐位,吸收持續的拋售,並將這次跌破轉化為真正的反轉。 這就是我在對更大的反彈建立信心之前所需要的證據。 $XRPUSDT #IMPACTbyTrade