Ayzal Noor
1533點贊0分享21粉絲2關注
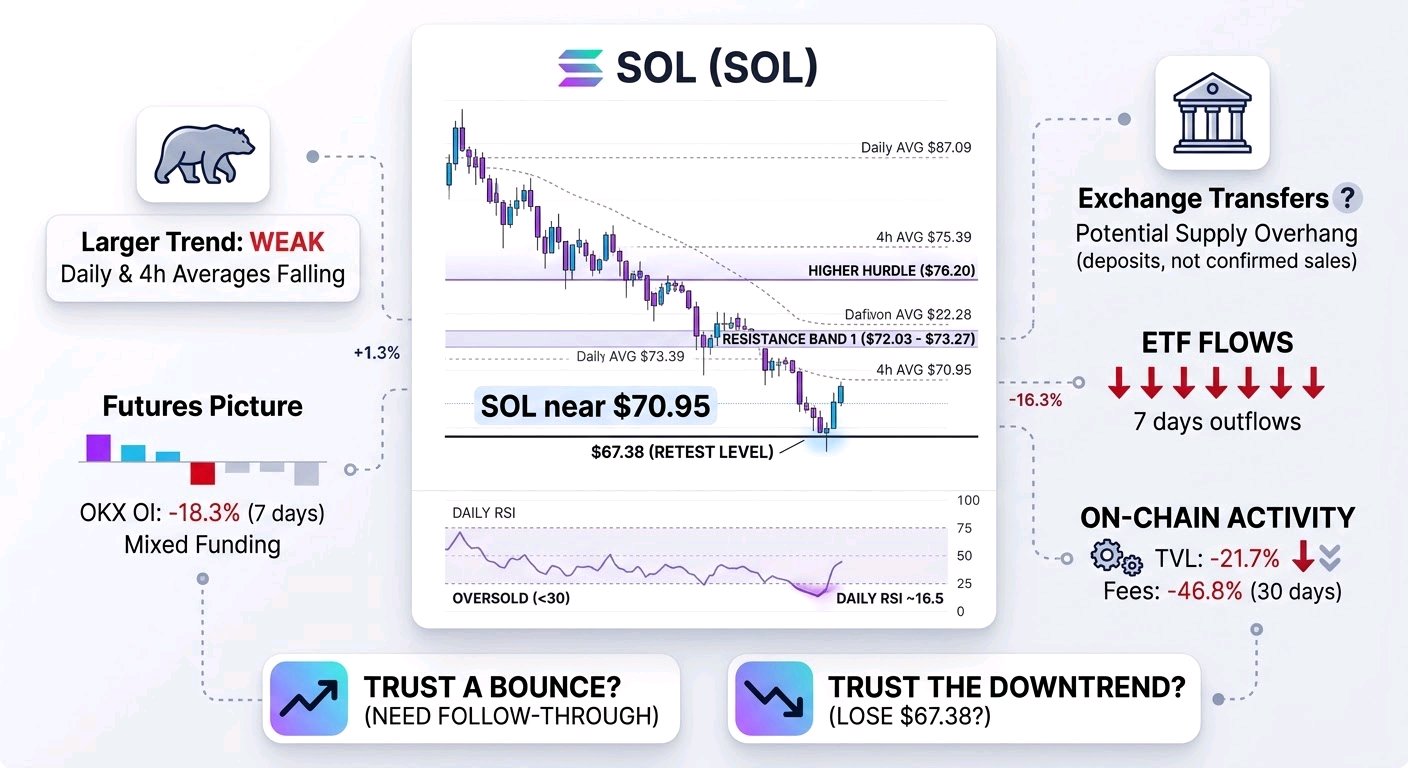
$SOLUSDT 在下跌 20.3%(7 天內)後,現價接近 $70.95。該幣價一度觸及 $67.38,創下自六月下旬以來的最低點,隨後出現反彈。這一低點是目前最關鍵的觀察點:若能守住,短期築底仍有可能;若失守,則意味著反彈未能阻止價格持續走低。目前這兩種結果尚未確認。 整體趨勢仍然明顯疲軟。SOL 處於 4 小時均線(約 $75.39 和 $80.85)及日線均線(約 $87.09 和 $95.48)下方。日線 RSI 約為 16.5,屬於極度超賣狀態。這使得技術性反彈變得合理,但並不代表拋售已經結束。在 1 小時圖上,SOL 一直難以穩守 $72.03–$73.27 的區間,這是由近期高點形成的第一個阻力帶。若能突破該區域並經受住回測考驗,將比短暫的衝高更具說服力。$76.20 是一個更高的門檻;若能收復此位,將改善短期結構,但仍無法扭轉更廣泛的下跌趨勢。 什麼樣的情況會讓我相信反彈?需要看到後續買盤跟進,而不僅僅是超賣數據。最新的 K 線顯示價格從 $67.38 反彈,但價格尚未在阻力位上方站穩。這裡提供的數據不包括可靠的 15 分鐘線圖、MACD、分時成交量、訂單簿深度或清算熱圖。因此,我們無法確認反彈背後是否有強勁的現貨買盤支撐,無法鎖定精確的清算群集,也無法斷言特定價位會引發強制買入或賣出。 期貨市場傳遞出複雜的信號。各大平台的資金費率略微偏負,意味著空方正在向多方支付費用;OKX 的持倉量在 7 天內下降了 18.3%。這表明市場已經釋放了一些槓桿,如果價格上漲,留下了空頭回補的空間。但倉位並非一面倒:OKX 帳戶偏向做多,而頂級交易員的倉位則偏向做空。持倉量下降可能反映了去槓桿化,未必是積累籌碼或即將發生軋空的跡象。現貨活動量很大——24 小時內在 63 個平台上交易額約 54.5 億美元——但單看總量無法告訴我們到底是買方吸收了供應,還是賣方主導了交易。 交易所轉帳報導值得關注,但不必過早下定論。新聞報導描述了大量的 SOL 存入,包括與 Forward Industries 相關的變動;該公司否認了其中一項報導轉帳的擁有權歸屬。鏈上動向可能是真實的,但「存入」並不等同於「拋售」。這使得它成為潛在的拋壓,而非已證實的賣盤。大盤也承受著壓力:整體加密貨幣市值在 24 小時內下跌了 5.2%,恐慌指數為 10,處於極度恐慌水平。SOL 的疲軟主要是源於自身供應與活動,還是被市場避險情緒放大?這兩種可能性都存在。 雖然存在長期利好,但它們無法左右短期走勢。DTCC 的代幣化計畫納入了 Solana,該網路也正在舉辦 Breakpoint 大會。這些進展或許長期重要,但目前尚未帶來顯著的價格反轉。同時,即時數據較為疲軟:ETF 資金連續 7 天流出,5 天內累計流出 3200 萬美元,20 天內累計流出 1.2 億美元。30 天內,鎖倉價值下降了 21.7%,穩定幣供應量下降 7.1%,手續費下降 46.8%。這些都是資金流出和活動減弱的確切跡象,但我們不能假設這些數據能預測接下來幾天的走勢。 我的解讀刻意保持條件性。在 $67.38 之上,技術性反彈依然可信,特別是如果價格在持續的參與下收復 $72.03–$73.27。一旦跌破該波段低點,看跌觀點的權重將增加。什麼因素會改變平衡?現貨需求在回測時得到支撐、持倉量隨價格上漲而回升、以及 ETF 資金流出放緩,這些將使反彈更為紮實。若再次在阻力位遇阻、資金持續流出或價格崩跌,則說明超賣狀態尚未終止下跌趨勢。目前,雙方都沒有獲得所需的確認信號。#IMPACTbyTrade
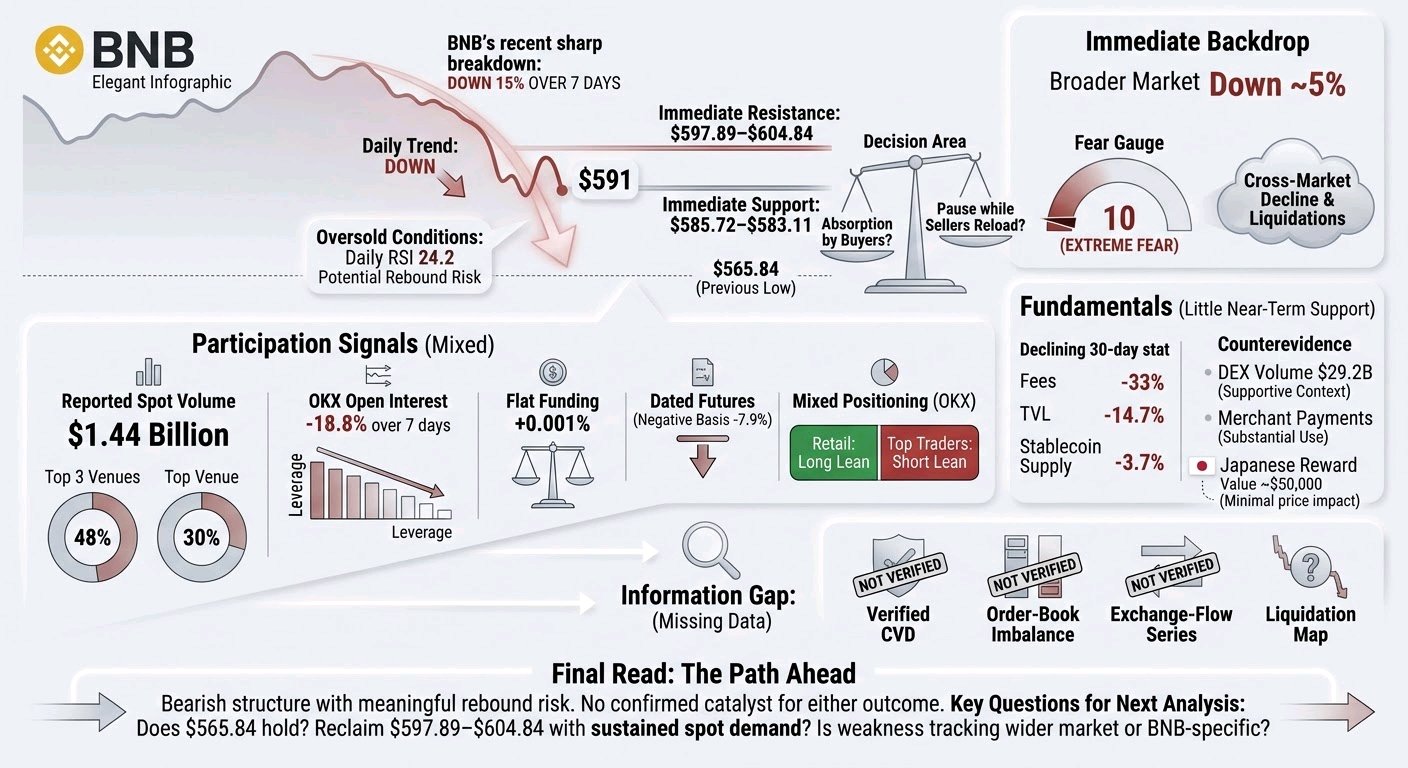
$BNBUSDT is trying to stabilize after a sharp breakdown, but I don’t yet see evidence that the market has changed character. The key distinction is whether buyers are absorbing supply—or merely taking a pause while sellers reload. Verified: BNB is near $591, down 15% over 7 days. It fell to $565.84 and rebounded as high as $599.63, but recent hourly closes failed to hold above $597.89. The 1-hour, 4-hour and daily trends remain down. Daily RSI is 24.2, which signals oversold conditions, not a confirmed bottom. Price remains below the 1-hour EMA50 at $604.84, the 4-hour EMA20 at $615.86, and the daily EMA20 at $674.78. That leaves a nearby decision area. $585.72–$583.11 is short-term support; below it, the market would be testing $565.84 again. If that low breaks and price cannot quickly reclaim it, sellers retain control. On the other hand, a sustained move above $597.89–$604.84, followed by a successful retest, would be more meaningful than a brief intraday spike. The next substantial resistance is around $620.60–$620.85. Could BNB reclaim those levels while the broader market remains weak? That would be stronger evidence of demand than oversold readings alone. Participation signals are mixed. Reported spot volume is $1.44 billion across 62 venues, but the top 3 account for 48%, with one venue representing 30%. That makes the headline volume less persuasive as proof of broad-based buying. Perpetual open interest is $563 million across 4 tracked venues; OKX open interest is down 18.8% over 7 days. That suggests leverage has been coming out there, but it does not establish the direction of aggregate market-wide positioning. Funding is nearly flat at +0.001% per 8 hours, while dated futures trade at a negative 7.9% annualized basis. On OKX, retail accounts lean long, while top traders’ positioning leans short. Those crosscurrents do not point to an obvious, crowded short that must be squeezed. The important gap is what we cannot establish from these figures: there is no verified CVD, order-book imbalance, exchange-flow series, or liquidation map here. So we cannot confidently say whether spot buyers absorbed the selloff, where forced liquidations clustered, or whether the rebound was driven mainly by short covering. A liquidation level, if identified, would be a possible volatility point—not a guaranteed turning point. The immediate backdrop also matters. The broader crypto market is down about 5% in the latest snapshot, with fear at 10, down from 28 a week ago. News on Nov. 13 described a sharp cross-market decline and forced liquidations as Bitcoin and other major assets fell. That supports the interpretation that BNB’s slide was amplified by general risk aversion, rather than being solely a BNB-specific event. But it raises a useful question: if the broader market stabilizes, does BNB recover with it—or continue to lag? Fundamentals give little near-term support for a bullish reversal. Over 30 days, BNB Chain fees fell 33%, TVL fell 14.7%, and stablecoin supply fell 3.7%; these figures reinforce a weaker activity backdrop, though they do not prove what caused this week’s price move. There is counterevidence: reported 30-day DEX volume is $29.2 billion, and a recent merchant-payments report described substantial use of BNB Chain. Those are supportive context, not evidence of new buying pressure. A Japanese company’s announced BNB shareholder reward is worth watching, but its reported value is only about $50,000 and the reference date is Dec. 31. It does not look large enough to explain this selloff or reverse it by itself. My read: bearish structure, meaningful rebound risk, and no confirmed catalyst for either outcome. The next analysis should answer three questions: does $565.84 hold on a retest; can BNB reclaim $597.89–$604.84 with sustained spot demand; and is the weakness still tracking the wider market, or becoming BNB-specific?#IMPACTbyTrade
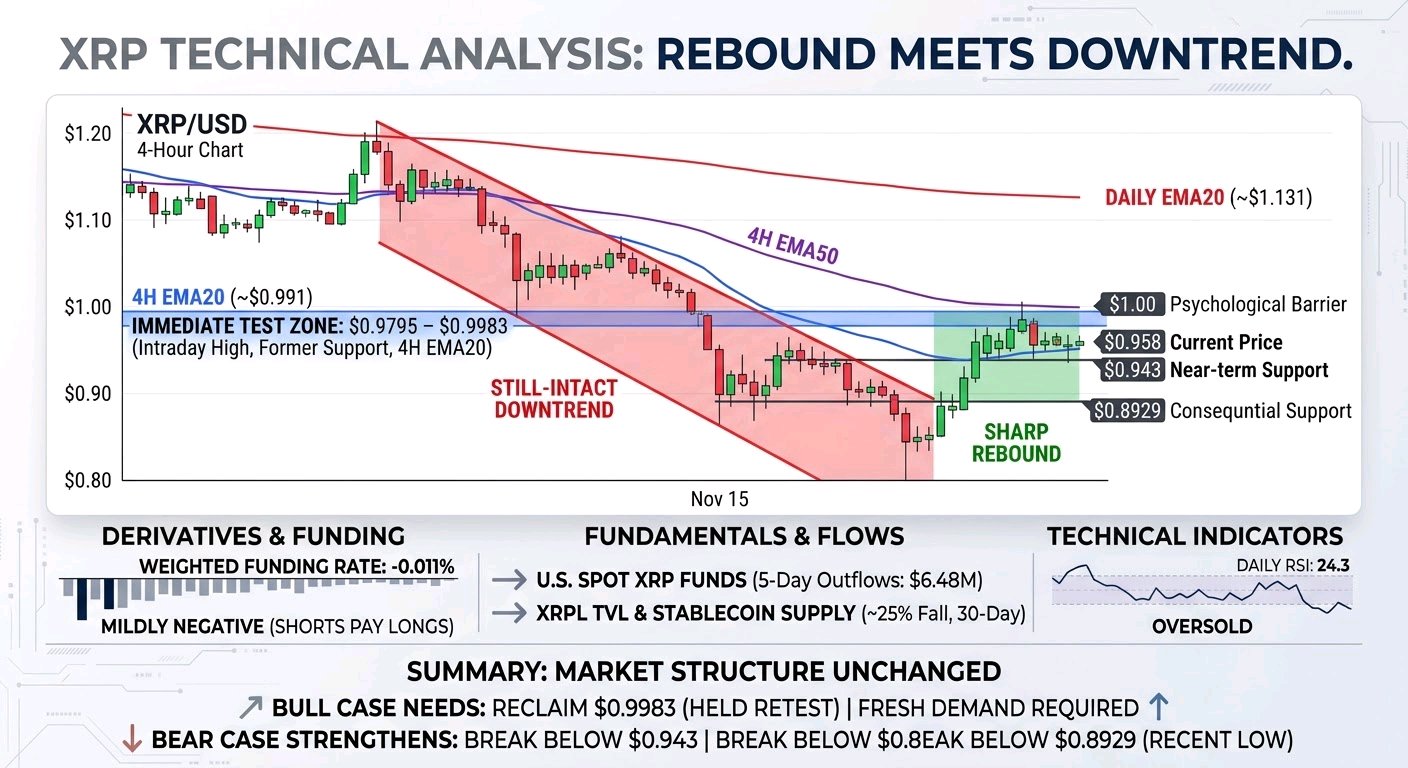
$XRPUSDT is caught between a sharp rebound from a two-year low and a still-intact downtrend. At about $0.958 on November 15, it is up 4.78% from the prior daily close, after trading as low as $0.8993. That bounce matters, but it has not yet changed the market structure: XRP remains below $1, below its 4-hour EMA20 near $0.991, and well below its daily EMA20 near $1.131. The market is asking whether buyers have found real demand—or whether they are simply responding to an oversold flush. The immediate test is $0.9795–$0.9983. That zone combines the recent intraday high, the former $1 support area, and the 4-hour EMA20. A brief move above it would not be enough by itself. I would want to see XRP hold above the zone on a retest, with meaningful spot buying and open interest rebuilding. Otherwise, a rally could be short covering or position adjustment rather than fresh demand. A break below $0.943 would weaken the near-term bounce; $0.8929, the recent low, is the more consequential support. If that level gives way, the market has not yet shown a strong nearby base. The broader technical picture is unambiguous, though not a timing signal. XRP is down 17.2% over 7 days and 28.0% over 30 days. The daily RSI is 24.3, an oversold reading, but oversold markets can remain weak. On the 1-hour chart, price is near the EMA20 and below the EMA50 around $0.976; on the 4-hour chart it remains below both the EMA20 and EMA50. These facts favor caution on the bounce, but a successful reclaim of $0.9983 would make the bearish interpretation less secure. The derivatives picture is mixed. Funding is mildly negative across the tracked venues, with the weighted rate at -0.011% per 8 hours; shorts pay longs, which can make short positions costly and leave room for a squeeze. Yet this is not evidence that a squeeze is underway. OKX open interest is down 9.4% over 7 days, but that is one venue, and dollar-denominated open interest can fall simply because the token price falls. Long/short data also conflicts: accounts are net long, while top traders’ positions lean short. Reported recent liquidations hit longs hardest, but the available figures do not establish precise liquidation clusters or prove broad market-wide deleveraging. We still need to ask: if price rises, does open interest grow with it, or do shorts merely close into thin demand? There are real fundamental headwinds, but their timing is less clear. U.S. spot XRP funds saw $6.48M in net outflows over 5 days and $1.18M over 20 days, though the latest reported session was positive. XRPL stablecoin supply and value locked each fell about 25% over 30 days. Those are signs of weaker marginal demand and network capital, not proof that they caused this week’s selloff. A reported 240M XRP transfer did not reach an exchange, and exchange-balance readings are disputed because newly tracked wallets changed the totals. Neither establishes a wave of sell-side deposits. No verified new announcement or token unlock in the retrieved recent news clearly explains the move; 36.5% of maximum supply remains outside circulation, a longer-term supply consideration, not evidence of an immediate release. My read is that broad crypto weakness, extreme fear, ETF outflows, and long liquidations explain the pressure better than any single XRP-specific event. But we lack spot CVD, order-book imbalance, and reliable whale-flow evidence, so claims of accumulation or distribution would be premature. The bull case needs a held reclaim of $0.9983, supported by spot demand; the bear case strengthens if $0.943 fails and especially if $0.8929 breaks. Which side is actually taking initiative—spot buyers or leveraged traders—and will the next move in open interest confirm it?#IMPACTbyTrade
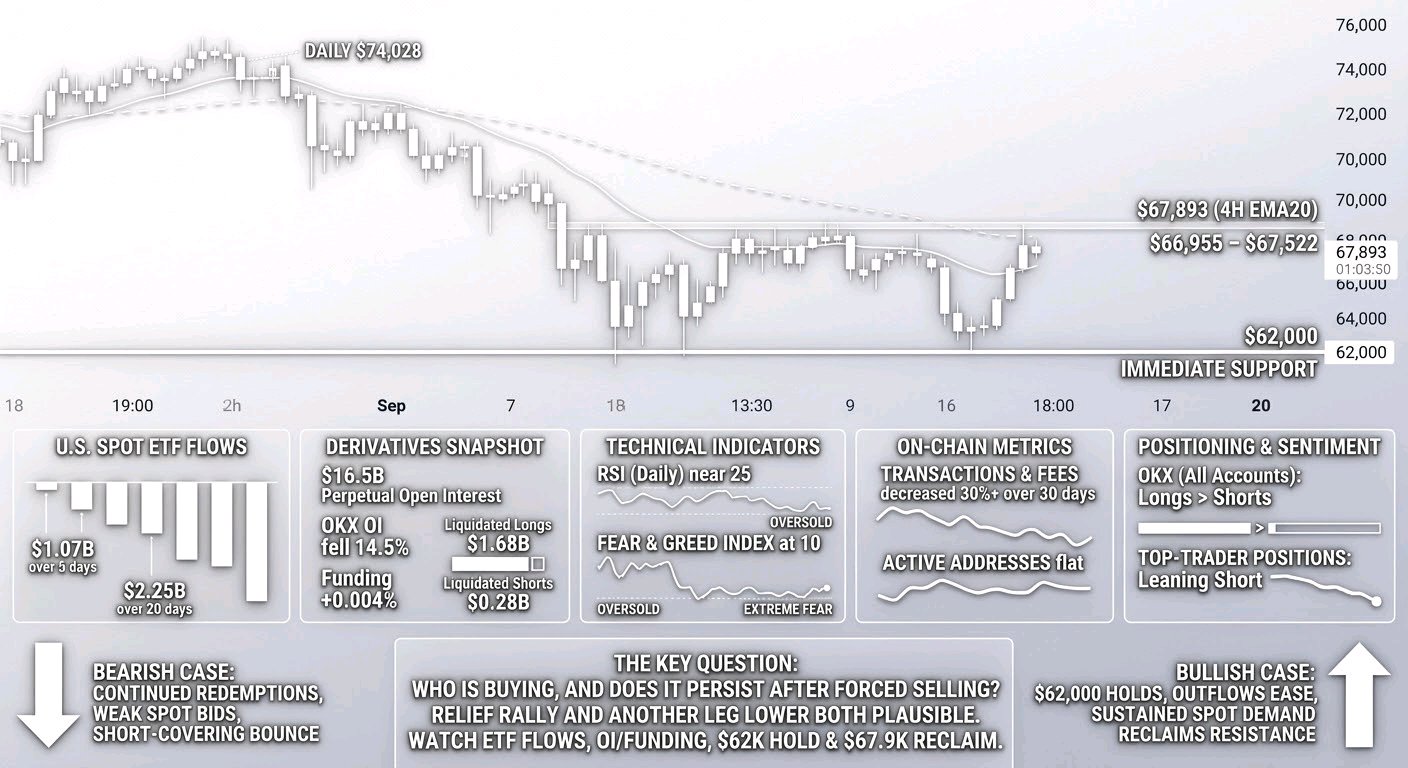
$BTCUSDT 從 62,000 美元反彈至 65,600 美元左右值得關注,但我還不會稱之為趨勢反轉。這次拋售伴隨著明顯的需求阻力:美國現貨比特幣基金連續 7 天出現資金外流,包括 5 天內流出 10.7 億美元,20 天內流出 22.5 億美元。這些都是相當可觀的資金流動,儘管它們本身並不能說明更廣泛的現貨買家是否在低位進場。 衍生品市場的情況則好壞參半。各追蹤永續合約市場的未平倉合約(Open Interest)總額為 165 億美元,OKX 的未平倉合約本週下跌了 14.5%。這顯示部位在下跌過程中有所減少,與去槓桿化趨勢一致。新聞報導稱 24 小時內加密貨幣清算金額接近 19.6 億美元,其中約 16.8 億美元來自多單。在 62,000 美元處遭到強烈拒絕隨後反彈,符合因清算導致的清洗走勢,但這並不證明強制拋售已經結束。整體資金費率仍微幅為正,每 8 小時 +0.004%,儘管各交易平台的數據有所不同。因此,即使部分部位已被清理,多頭部位可能仍然存在。 倉位數據也存在分歧:OKX 顯示多頭帳戶多於空頭,而頂級交易員的倉位則傾向於看空。這些比率僅描述了特定帳戶,而非整個市場,因此我不會將其視為可靠的預測指標。接下來重要的是未平倉合約是否會隨著現貨需求的持續而重建,或者是在資金費率為正的情況下上升,使市場容易受到另一次多頭擠壓(Long Squeeze)的影響。累計成交量差(CVD)和掛單簿失衡數據將有助於回答這個問題,但我們目前沒有這些數據。 從圖表來看,62,000 美元是關鍵的即時防線。它是近期低點,也是當前反彈的下邊緣;跌破該點位將削弱「投降與復甦」的詮釋,並讓早先 57,809 美元的波段低點重新成為焦點。價格上方,66,955 美元至 67,522 美元是第一個阻力區。若能有效突破並成功回測,將比短暫的盤中衝高更具說服力。近 67,893 美元的 4 小時 EMA20 是另一個障礙。在比特幣能夠收復該水平之前,大趨勢仍然向下:價格遠低於近 74,028 美元的日線 EMA20,且週線趨勢也向下。 市場存在看漲論點,但需要確認。日線 RSI 接近 25,處於極度低迷狀態,而 10 的極度恐慌情緒通常伴隨著強制拋售和劇烈反彈。比特幣供應上限和機構准入渠道仍然是長期的支撐因素。然而,超賣動能和稀缺性都無法創造短期底部。過去 30 天交易量和費用有所下降,而活躍地址數持平。這顯示結算活動減弱,但並不能證明持有者正在大規模退出。同樣地,ETF 的流出是邊際需求減弱的證據,而非機構永久撤退的證明。 看空的理由是贖回持續進行,現貨買盤未能吸收供應,且反彈主要是清算潮後的空頭回補。看漲的理由則是 62,000 美元守住,流出減少,且比特幣在持續的現貨參與下收復阻力位。關鍵問題不僅僅是價格能否反彈,而是誰在買入,以及在強制賣家離場後,這種需求能否持續。我會密切關注 ETF 資金流、現貨與期貨的參與度、未平倉合約和資金費率的綜合變化,以及 62,000 美元是否守住、67,900 美元是否被收復。在此之前,緩解性反彈和進一步下跌的可能性都依然存在。#IMPACTbyTrade
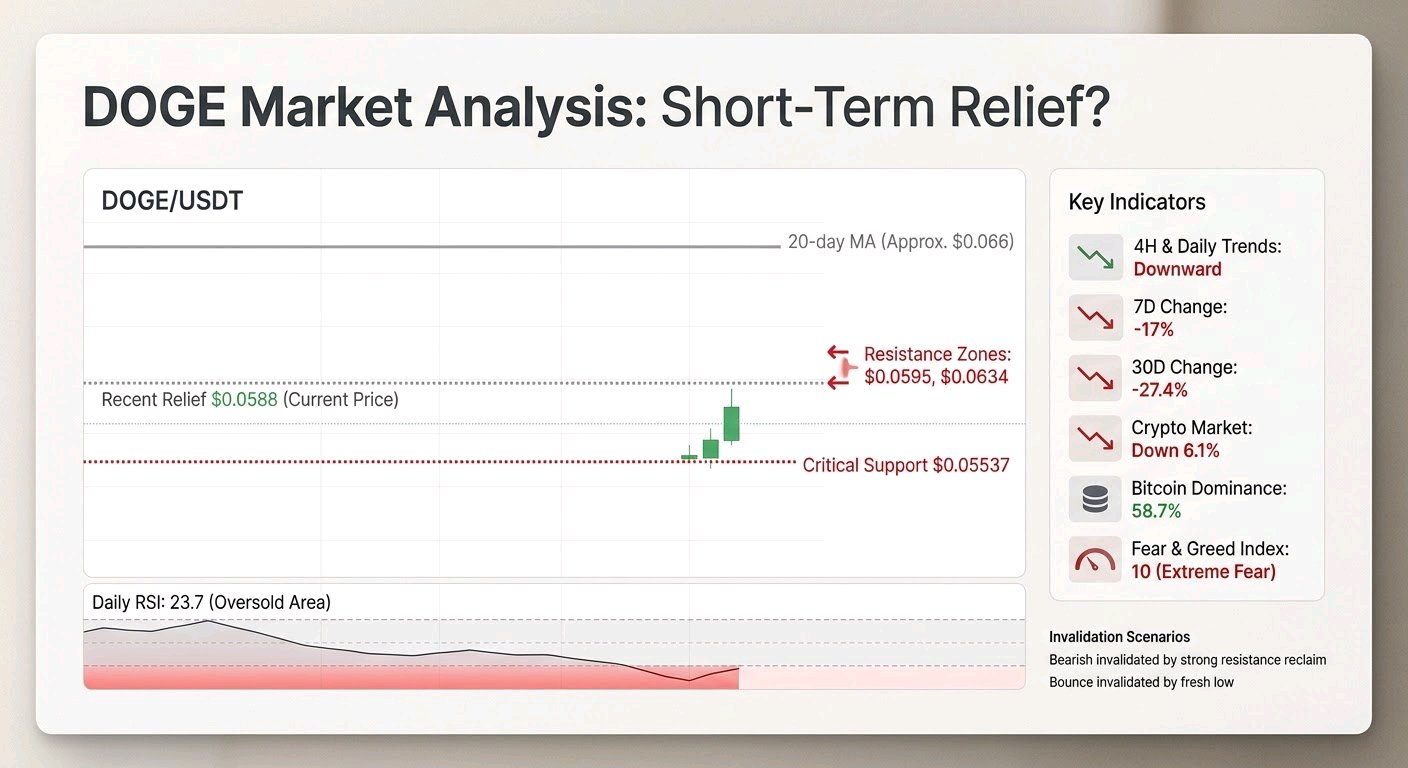
$DOGEUSDT 在經歷急跌後正試圖反彈,但目前的跡象看起來更像是短期修復,而非趨勢反轉。價格在 $0.0588,較前一日收盤價上漲 2.54%,此前曾觸及 $0.05537 的低點。這個低點很重要:它是近期最明確的支撐位,也是過去一週拋售潮的底部。在這裡站穩是顯示買家入場,還是僅僅是快速下跌後的拋售暫歇? 整體結構依然疲軟。DOGE 過去 7 天下跌 17%,30 天下跌 27.4%。4 小時和日線趨勢維持下行,價格遠低於 20 週期均線。日線 RSI 為 23.7,處於超賣區間,這可能先於反彈出現,但本身並非反轉信號。在小時圖上,價格仍位於 $0.0595 附近的 20 週期均線和 $0.0620 附近的 50 週期均線下方。目前的反彈尚未有說服力地收復這兩個位置。 我會先關注 $0.0595,然後是 $0.0634。後者是一個近期的阻力區,也是檢驗賣方是否失去控制權更具意義的考驗。短暫突破某個點位是不夠的;關鍵在於回測時價格能否守住,並伴隨更強的現貨參與度。目前沒有可用數據確認 15 分鐘級別的突破、累積成交量差值 (CVD,即主動買盤與賣盤的淨差值) 或訂單簿失衡情況。我們也沒有可靠的清算地圖。因此,不應僅從圖表推斷精確的流動性集群和清算位。 衍生品數據給出了喜憂參半、而非決定性的解讀。4 個交易平台的永續合約未平倉量為 3.24 億美元;OKX 的未平倉量 7 天內下降了 17.1%。這表明槓桿正在減少,儘管這僅是一個平台的變化,無法說明是現貨賣家還是期貨交易者發起了這波行情。整體資金費率略微為負,意味著空頭支付給多頭,但幣安 (Binance) 的資金費率為正。頂級交易員持倉與散戶偏向多頭的帳戶比例也存在差異。如果價格上漲,這是否會成為軋空的燃料?有可能,但負值的交割期貨基差 (年化 30.4%) 表明看跌情緒濃厚,並非可靠的反轉信號。軋空可以推高價格,但不會改變底層趨勢。 背景環境很重要。整個加密貨幣市場在 24 小時內下跌了 6.1%,比特幣主導率為 58.7%,恐懼與貪婪指數為 10。新聞報導稱迷因幣普遍暴跌,且 DOGE ETF 過去一個月沒有淨流入。這些事實符合疲軟的風險偏好,但頭條新聞並未說明造成 DOGE 拋售的真正原因。有傳言稱鯨魚買入了 18 億 DOGE,但該報告缺乏錢包和交易細節。未經證實,我不會將其視為吸籌的證據。同樣,這裡也沒有特定的 DOGE 鏈上或交易所資金流向數據來確認代幣是正在轉入交易所還是進入長期持有。 基本面上,DOGE 的流通供應量據報為 1570 億,等於總供應量;這並不意味著發行停止,因為 DOGE 有持續的發行機制。在審查的證據中,沒有經過驗證的近期項目催化劑。協議費用和收入相對於市值而言很小,因此價格更有可能對情緒和市場資金流做出反應,而非網絡經濟學的突然變化。 我的解讀是謹慎的,而非確定的。看漲的情況是守住 $0.05537 低點,隨後持續收復 $0.0595,然後是 $0.0634,最好伴隨著現貨需求和未平倉量的穩定或回升。看跌的情況是阻力測試失敗並決定性地跌破 $0.05537,特別是在整體市場依然疲軟的情況下。什麼會使看跌解讀失效?有可靠現貨買盤支撐下的阻力位收復。什麼會使反彈失效?跌破新低。在這些問題得到解答之前,反彈只是一種可能性,並非控制權已經改變的證據。#IMPACTbyTrade
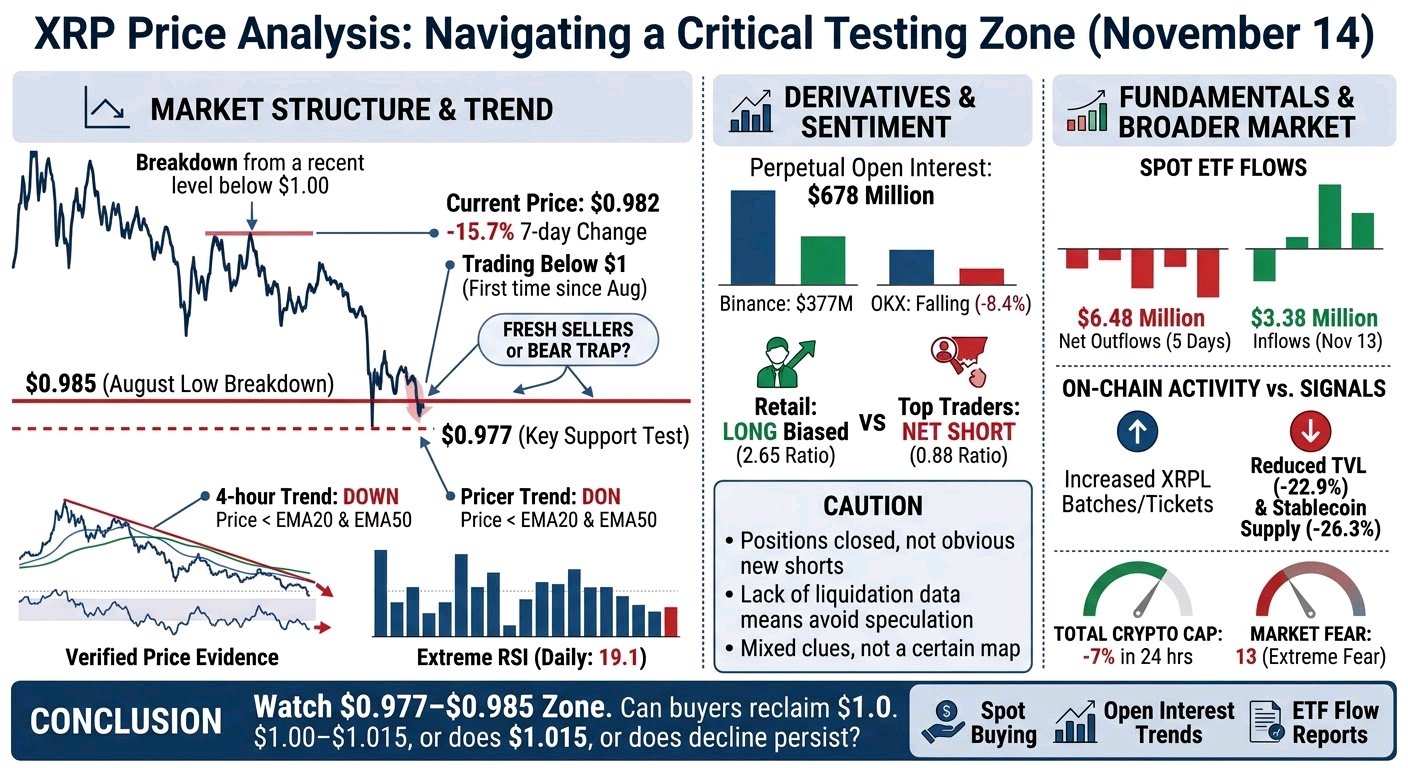
$XRPUSDT 處於明確的下跌趨勢與賣壓可能耗盡的價格區間之間。11 月 14 日,其價格為 0.982 美元,7 天內下跌了 15.7%,並自 8 月以來首次跌破 1 美元,此前已跌破市場關注的 0.985 美元附近的 8 月低點。這是一個顯著的結構性損失,但市場目前正在測試剛剛跌破的同一區間。跌破 0.977 美元是否會吸引新的賣家?還是買家會迅速收復該價位,將跌勢轉化為「熊市陷阱」?這個問題的答案比 XRP 處於超賣狀態這一事實更為重要。 已驗證的價格證據:1 小時、4 小時、日線和週線趨勢均為下跌。價格低於 0.999 美元和 1.015 美元附近的 1 小時 EMA20 和 EMA50,以及 1.026 美元和 1.083 美元附近的 4 小時均線。日線 RSI 為 19.1,處於極端數值,而 4 小時 RSI 為 30.6。近期的 4 小時 K 線顯示收盤價走低,且在賣壓恢復前,向 1.044 美元的衝擊失敗。對我來說,這說明賣方仍控制著大結構,但這並不排除出現急劇反彈的可能性。若能持續收復 1.00 美元,隨後是 1.015 美元,將是買方正在改變近期市場平衡的第一個證據。若收盤價低於 0.977 美元,隨後出現無力的回測,將使這波跌勢更具說服力。目前兩種結果均未得到確認。 衍生性商品的情況比圖表更為複雜。永續合約未平倉量(Open Interest)為 6.78 億美元,其中幣安(Binance)佔 3.77 億美元;OKX 的未平倉量在 7 天內下降了 8.4%。這種下降伴隨著價格下跌,與部位被平倉或強制清算的一致性,而非明顯出現了一波新的槓桿空頭。資金費率幾乎持平,加權費率為 -0.001%。散戶帳戶偏向做多,比例為 2.65,而頂級交易員部位則呈現淨空頭,比例為 0.88。這些只是線索,並非誰將被迫出場的預測地圖。我們沒有經過驗證的總清算額、清算價格集群、CVD(累積成交量差值)或掛單簿失衡數據。因此,聲稱某個價位「充滿」清算單,或是逼空即將發生的說法,都屬於臆測。 需求疲軟有跡象可循,但需要謹慎處理。已驗證的美國現貨 ETF 數據顯示,儘管 11 月 13 日有 338 萬美元的淨流入,但 5 天內的淨流出為 648 萬美元,20 天內為 118 萬美元。另一份報告聲稱每週流出 1,913 萬美元;這與 5 天的數據相衝突,不應被視為定論。新聞還報導稱交易所餘額在 3 個月內增加了 3.3576 億 XRP。如果屬實,這可能意味著市場上有更多的供應,但這並不代表持有者現在正在拋售。我們缺乏直接的鯨魚流動和交易所流動確認。 看漲的反面論點是 XRPL 批次(batch)和票據(ticket)活動的增加。這顯示的是活動量,未必代表 XRP 的購買行為:鏈上證據並未證明這些交易產生了規模化的代幣需求。與此同時,鎖定價值(Value Locked)在 30 天內下降了 22.9%,XRPL 上的穩定幣供應量下降了 26.3%。這些數據使得該活動標題作為近期需求信號的說服力不足。更廣泛的市場也面臨壓力:加密貨幣總市值在 24 小時內下跌了 7%,恐懼指數為 13。因此,XRP 的疲軟可能同時反映了市場廣泛的風險規避情緒以及幣種特有的供應問題。 我的看法是審慎的,而非確定的。關鍵區間在 0.977–0.985 美元;若高於此區間,1.00–1.015 美元是第一個收復測試。觀察現貨買盤是否伴隨復甦、未平倉量是上升還是持續萎縮、以及 ETF 流動報告是否能相互協調。這些答案將告訴我們這究竟是恐慌性拋售、暫時的疲軟耗盡,還僅僅是持續下跌趨勢中的又一次停頓。#IMPACTbyTrade
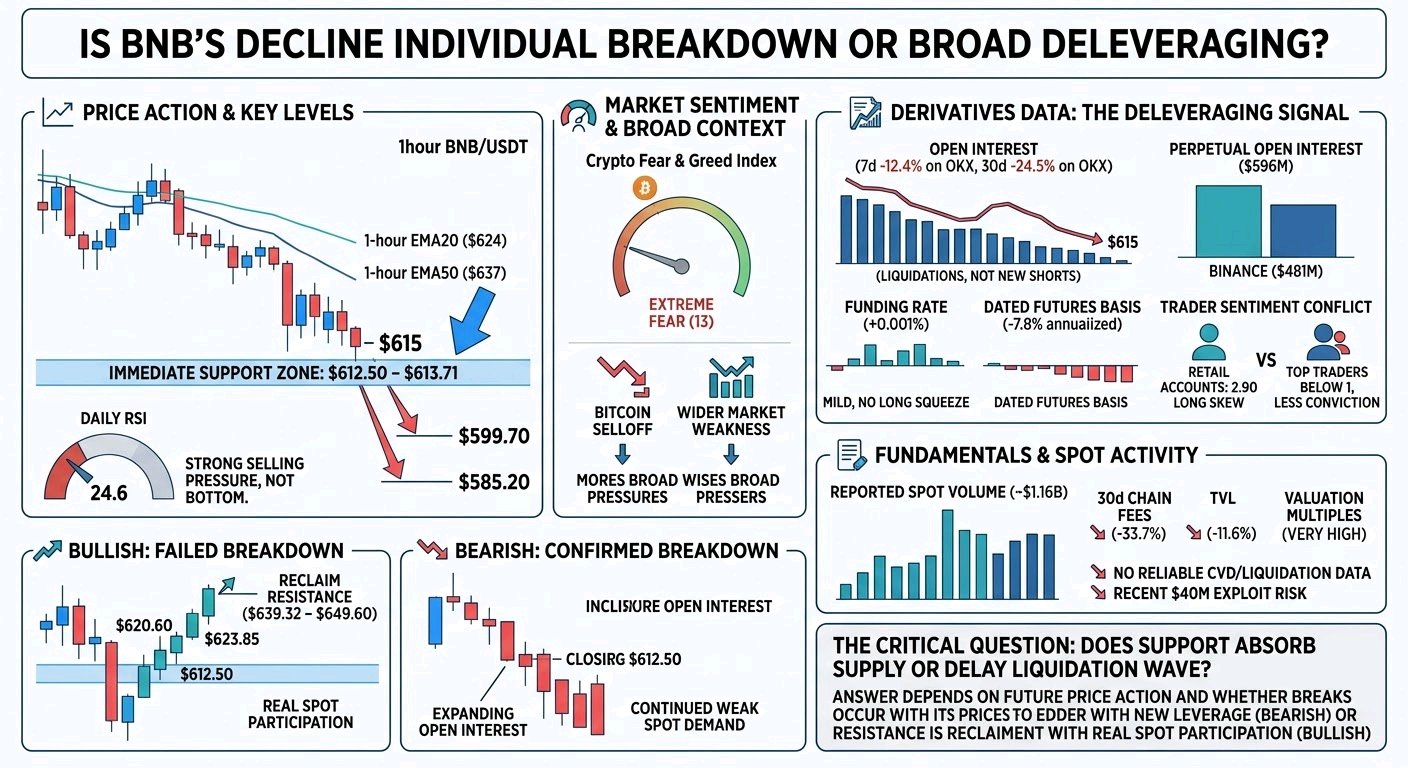
$BNBUSDT is in a fragile position. The seven-day decline has been sharp, but the important question is whether this is a BNB-specific breakdown or a broad crypto deleveraging event. The verified facts are clear. BNB is near $615 after falling about 11.5% in 7 days. Bitcoin and the wider market also sold off heavily, with extreme fear at 13. BNB is below its 1-hour EMA20 and EMA50, at roughly $624 and $637, and well below its 4-hour averages near $643 and $667. Daily RSI is 24.6. That confirms strong selling pressure, but not a bottom. The immediate battle is around $612.50–$613.71. This area has held several tests, but the rebounds have been weak. Why does that matter? A support level is more credible when buyers can produce a strong recovery after defending it. So far, the market has shown defense, not clear accumulation. A confirmed hourly close below $612.50 would be meaningful. The next visible downside areas are $599.70 and then $585.20. However, a break alone would not prove that fresh short sellers are in control. Open interest has been declining, especially on OKX, where it fell 12.4% over 7 days and 24.5% over 30 days. Price falling while open interest falls often reflects deleveraging or liquidations rather than a clean build-up of new shorts. Derivatives therefore provide a warning, but not a complete explanation. Perpetual open interest is about $596M, concentrated on Binance at $481M. Funding is barely positive at +0.001% per 8 hours, which is too mild to show an extreme long squeeze by itself. Dated futures basis is more negative, at about -7.8% annualized. Retail accounts are long-skewed at 2.90, while top-trader ratios are below 1. That conflict matters: weaker participants may be leaning long, but stronger traders are not showing the same conviction. Spot activity is substantial, with roughly $1.16B in reported volume, but it is concentrated across a few venues. We do not have reliable CVD, order-book imbalance, liquidation totals, or verified liquidation heatmaps. That limits confidence in any claim that forced selling, rather than genuine spot distribution, caused the move. Fundamentally, the backdrop is not supportive. Thirty-day chain fees fell 33.7%, TVL fell 11.6%, and annualized valuation multiples remain very high relative to protocol revenue. These figures explain why BNB may be vulnerable, but they do not prove that fundamentals caused this week’s decline. The recent $40M application exploit is a risk, yet its direct price impact remains unestablished. The bullish scenario is a failed breakdown: support holds, price reclaims $620.60, then closes above $623.85. A move through $639.32–$649.60 would be stronger evidence that sellers are losing control. The bearish scenario is a close below $612.50 followed by expanding open interest and continued weak spot demand. My main uncertainty is the character of the next move. Is support absorbing supply, or merely delaying another liquidation wave? The final answer depends on whether price breaks support with new leverage, or reclaims resistance with real spot participation.#IMPACTbyTrade
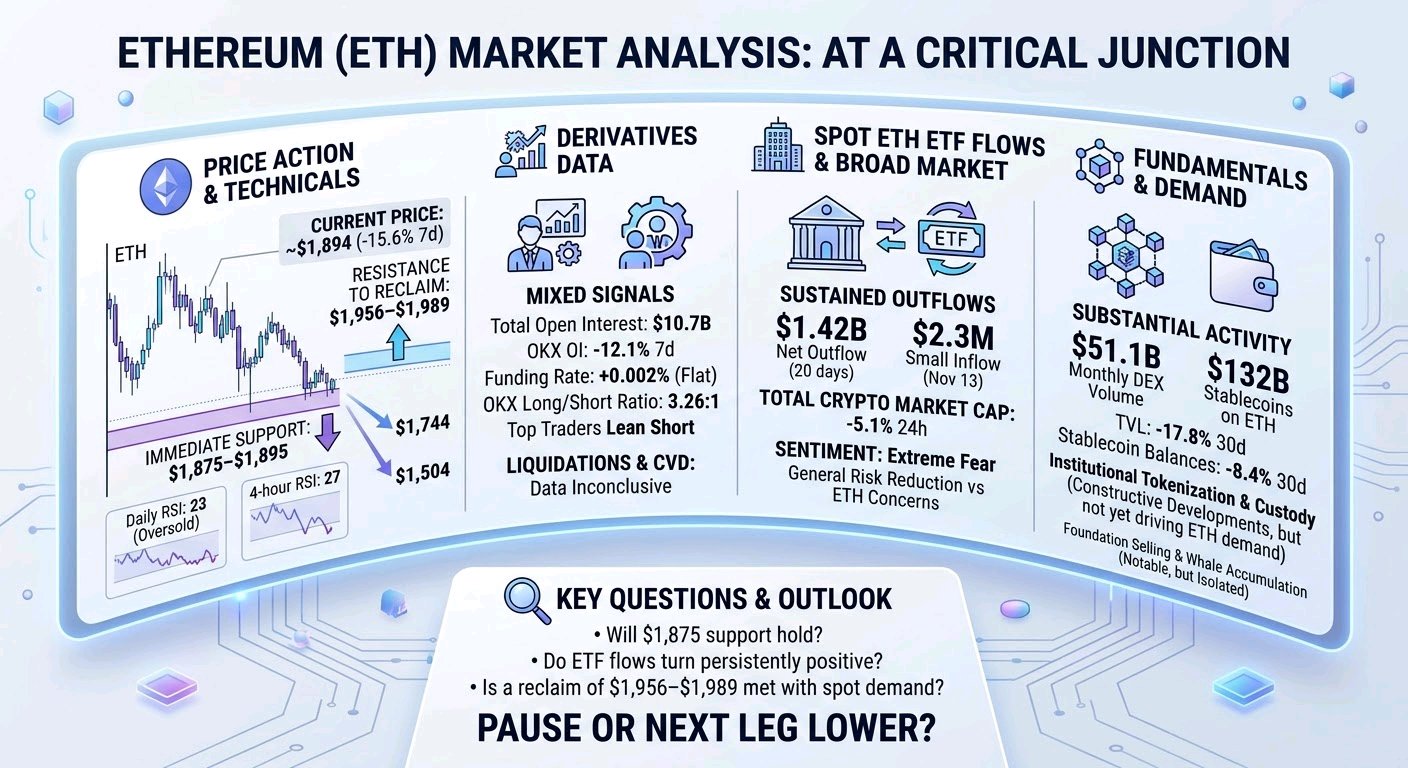
$ETHUSDC 以太幣(Ethereum)目前處於一個尷尬的境地:短期走勢圖顯示下行壓力沉重,但目前的證據尚未顯示賣方動能已經耗盡。 經核實:ETH 現價約為 1,894 美元,7 天內下跌 15.6%。它已連續 6 週收低,且持續位於其日線 EMA20(約 2,170 美元)和 EMA50(約 2,302 美元)下方。在 4 小時圖上,價格也低於這兩條趨勢均線,分別約為 1,989 美元和 2,084 美元。當前的即時考驗是 1,875–1,895 美元的區間,這是近期的低點區域。若價格決定性地收低於此,下方的每週支撐位 1,744 美元和 1,504 美元將變得更為關鍵。但關鍵點位不代表預測:重要的是價格是否跌破並守住該點位,還是會迅速收復。 看跌結構顯而易見;但賣壓的性質尚不明確。日線 RSI 接近 23,4 小時 RSI 接近 27,這些數值均顯示市場處於超賣狀態,而非可靠的反轉信號。若反彈受阻於 1,956–1,989 美元下方,短期下跌趨勢仍將持續。要看到買方重新掌控局勢的第一個訊號,最好是能收復該區間並經受住回測。即使如此,價格仍將低於 4 小時趨勢均線。什麼樣的情況能將反彈轉化為真正的結構性改變?那需要更高的低點、後續的跟進以及更強勁的現貨參與,而不僅僅是一根陽線。 衍生品數據則是喜憂參半。追蹤的永續合約交易平台未平倉量(Open Interest)為 107 億美元;OKX 的未平倉量在 7 天內下降了 12.1%。資金費率接近平水,每 8 小時加權費率為 +0.002%。這種組合更符合槓桿減倉的情形,而非出現大量新的做空交易。然而,OKX 的多頭帳戶數量與空頭之比為 3.26:1,而頂級交易員的持倉則傾向於做空。這些是衡量倉位的不同指標,並不能證明逼空(squeeze)即將發生。我們沒有確切的清算總額、熱力圖,也沒有 CVD、訂單簿失衡或可靠的期貨成交量細分數據。因此,關於精確清算區間——或誰在推動下一步走勢的說法——都只是猜測。 更廣泛的需求前景則難以忽視。經核實:美國現貨 ETH ETF 在過去 5 天內淨流出 3.99 億美元,20 天內流出 14.2 億美元,儘管 11 月 13 日出現了 230 萬美元的小額流入。單日數據無法構成轉折。近期報導也指出,與以太坊基金會相關的錢包正在出售 ETH,與此同時,幾位大買家正在下跌過程中進行吸籌。這些行為固然值得注意,但個別錢包的交易並不能證明普遍的買入需求,也無法解釋整體價格走勢。更廣泛的市場同樣疲軟:加密貨幣總市值在 24 小時內下跌了 5.1%,市場情緒處於極度恐慌。這使得 ETH 的下跌更像是反映了整體市場的風險規避,以及對以太坊特定問題的擔憂。 基本面呈現出真正的張力。以太坊仍然保持著巨大的活躍度:每月 DEX 交易量達 511 億美元,穩定幣規模達 1,320 億美元。然而,穩定幣餘額在 30 天內下降了 8.4%,總鎖倉量(TVL)下降了 17.8%。協議年收入為 4,740 萬美元,對應 2,310 億美元的市值。同時,機構代幣化和託管服務的發展是建設性的,但目前公開證據尚未顯示它們已經產生了實質性的 ETH 買盤或收入。 我的解讀是謹慎的,而非確定:趨勢有利於賣方,而超賣的價格走勢和鯨魚的選擇性買入為劇烈反彈留下了空間。關鍵問題在於 1,875 美元能否守住,ETF 資金流入是否會持續轉正,以及對 1,956–1,989 美元區間的收復是否伴隨著真正的現貨需求。如果沒有,這是否僅僅是下一波下跌前的暫停?#IMPACTbyTrade
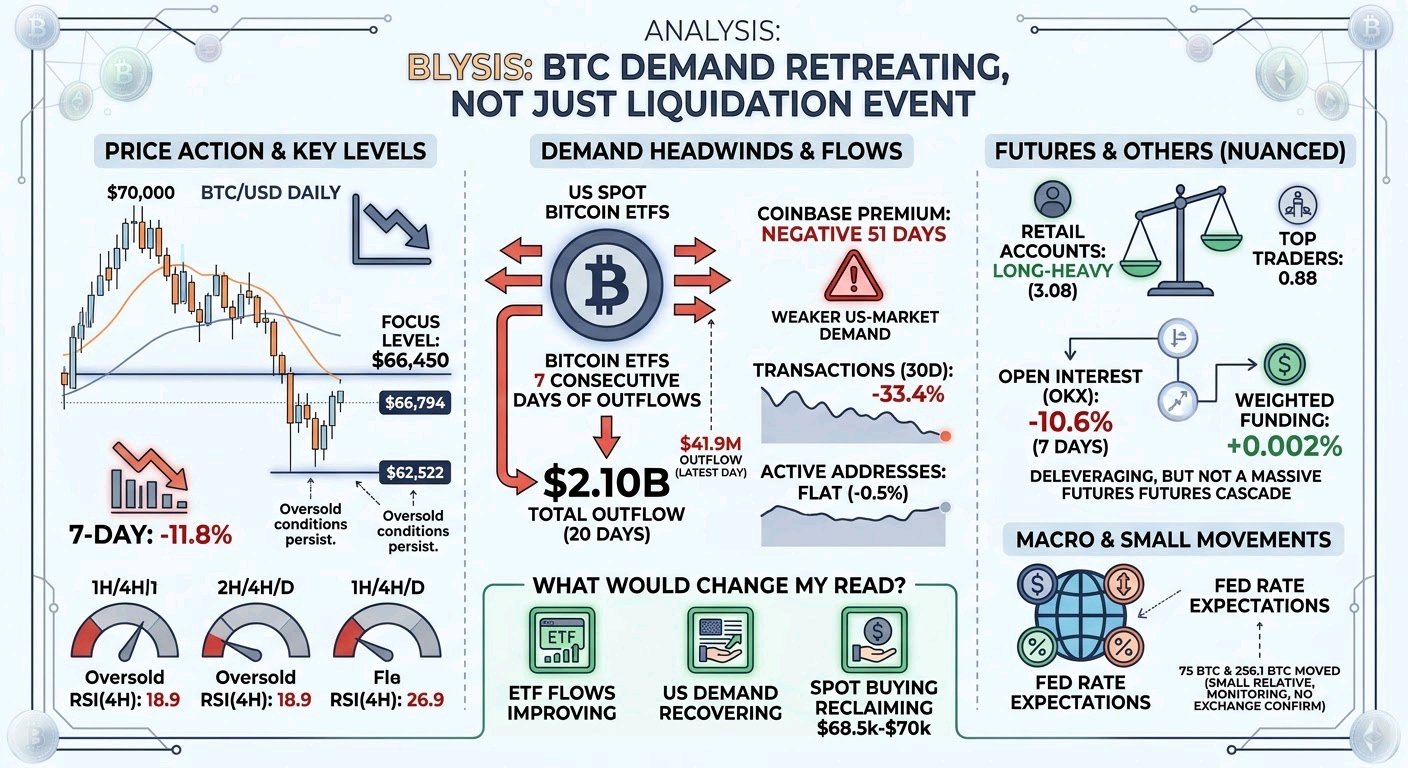
$BTCUSDT weakness looks less like a single liquidation event and more like demand retreating while traders reduce risk. That distinction matters: a market can keep sliding without a fresh wave of shorts if willing spot buyers are absent. What the evidence says: BTC is down 11.8% over 7 days, around $66,794, after breaking below $70,000. The 1-hour, 4-hour and daily trends are down; price is below the relevant short-term moving averages. RSI is deeply oversold—18.9 on the 4-hour chart and 22.5 daily—but oversold conditions can persist in a downtrend. The current test of $66,450 is important because it is the recent local low. It has been touched, but the available snapshot does not establish a confirmed hourly close below it. There are signs of real selling pressure beyond the chart. US spot Bitcoin ETFs had 7 consecutive days of outflows, totaling $2.10B over 20 days; the latest reported day was a $41.9M outflow. The Coinbase premium was reported negative for 51 days, a sign of weaker US-market demand relative to other venues. These do not prove that ETF flows caused each price leg, but together they point to a persistent demand headwind. The market has not yet shown clear evidence that buyers are absorbing it. Futures tell a more nuanced story. Perpetual open interest is $16.9B across the tracked venues; OKX open interest is down 10.6% over 7 days. That is evidence of deleveraging on OKX, not proof that leverage fell by the same amount everywhere. Weighted funding is only +0.002% per 8 hours, so longs are paying shorts, but not at an obviously extreme rate. Retail accounts remain long-heavy at 3.08, while top-trader position ratio is 0.88. That split warns against reading one positioning statistic as the whole market. No reliable CVD, order-book imbalance, or liquidation-level data is available, so claims about a particular liquidation cluster or a futures-led cascade would go beyond the evidence. The macro backdrop may matter more than isolated crypto headlines. A recent report attributed the decline to changing Fed-rate expectations rather than the Binance hack; that is an attributed explanation, not proof of causation. Meanwhile, the reported 75 BTC moved from a long-dormant wallet and Bitdeer’s sale of 256.1 BTC are small relative to BTC’s market, and the data does not show either transfer reaching an exchange or being sold. They are worth monitoring, not treating as the driver. On-chain readings are mixed. Transactions are down 33.4% over 30 days and miner revenue down 30.7%, while active addresses are nearly flat, off 0.5%. That suggests softer activity, but it does not by itself establish a sudden loss of network confidence. Supply is 95.8% issued, with no scheduled token unlock; the next difficulty adjustment is expected to be lower, which affects miner economics rather than the supply cap. For the next stage, the key question is whether $66,450 holds on a completed hourly close. A break followed by a failed retest would strengthen the downside case toward the broader daily support near $62,522. If support holds, a rebound is plausible, but reclaiming roughly $68,500–$70,025 and holding it would be more convincing than an oversold bounce alone. What would change my read most: ETF flows improving, US demand recovering, and spot buying showing up alongside any reclaim. Until then, both the downside continuation and a sharp countertrend bounce remain credible risks #IMPACTbyTrade
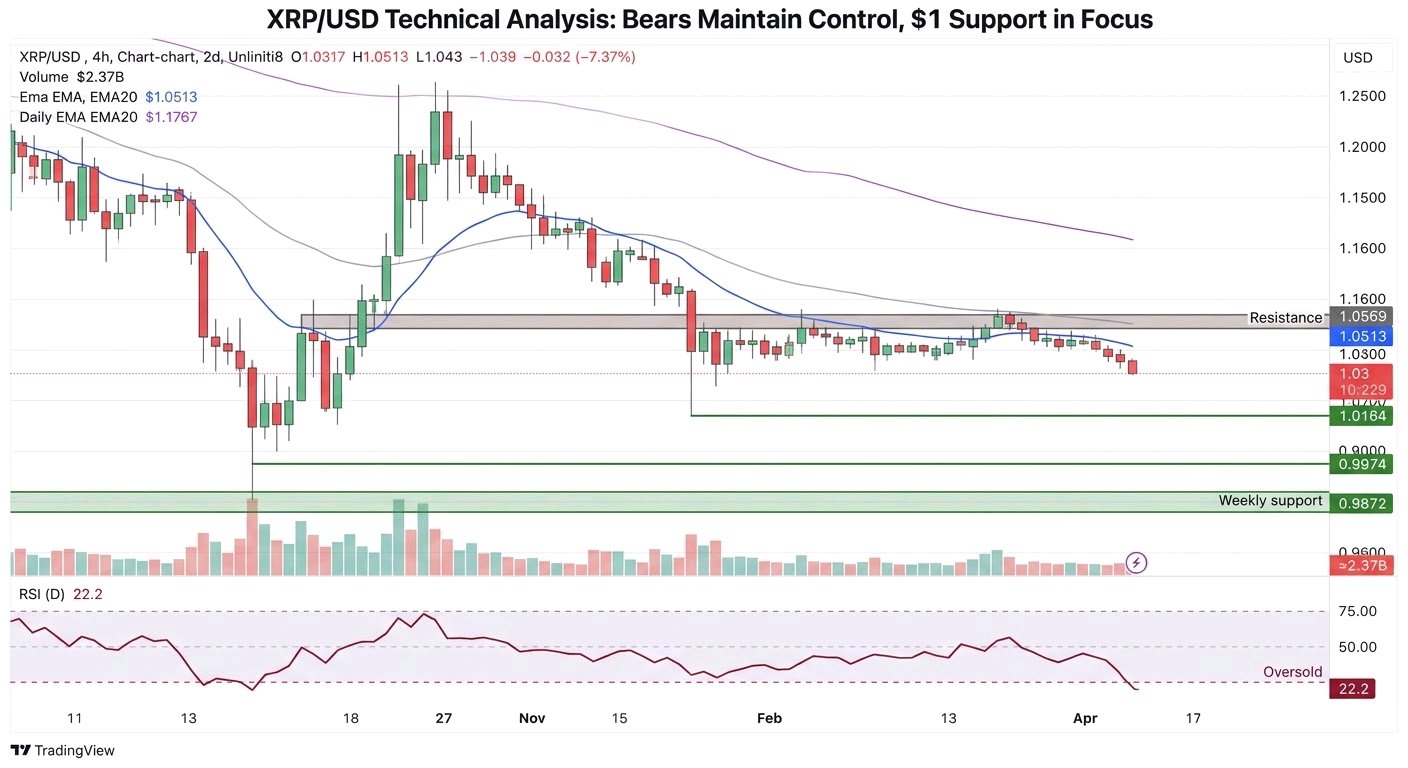
$XRPUSDT is trading near $1.03 after a sharp seven-day decline of about 13%. The important question is not simply whether it is “oversold.” It is whether buyers are absorbing supply or merely pausing the sell-off. The verified structure remains weak. Price is below the 4-hour EMA20 at $1.0513 and far below the daily EMA20 at $1.1767. The daily RSI is 22.2, which shows heavy selling pressure, but it does not prove that a durable bottom is forming. On the 4-hour chart, XRP has repeatedly struggled around $1.04–$1.0569. A sustained close above that zone, followed by a successful retest, would be the first credible sign that sellers are losing control. Without that, the recent bounce looks more like short covering or bargain hunting inside a larger downtrend. The main downside zones are $1.0164, $0.9974, and then the broader weekly support near $0.9872. The $1 area matters psychologically and technically. It has already attracted buyers, but one defense is not enough evidence of accumulation. If price breaks below $0.9974 and cannot quickly reclaim it, stops and leveraged long positions could add pressure. Conversely, a quick reclaim after a brief breakdown would suggest a liquidity sweep rather than genuine structural damage. Derivatives provide a useful warning, although not a complete liquidation map. Perpetual open interest is about $707M across the tracked venues. Funding is positive at roughly 0.009% per 8 hours, meaning longs are paying shorts. Retail accounts are long-heavy, with an OKX long/short account ratio of 2.72, while top-trader positions lean short at 0.87. This combination suggests that late longs remain vulnerable, but it does not tell us exactly where liquidation orders sit. Open interest has fallen 8.7% over seven days on OKX, so some leverage has already left the market. The recent 24-hour increase may represent new longs, new shorts, or both. Price behavior after that increase is the key clue. Spot turnover is large, around $2.37B over 24 hours, but high volume alone does not reveal net buying. The available data does not confirm CVD, order-book imbalance, whale exchange flows, or reliable liquidation clusters. That is an important limitation. Traders should not assume that a visible support level or liquidation pocket must produce a reversal. The broader backdrop is also unfriendly. ETF flows were negative by $10.6M over five days and $8.28M over 20 days. XRPL stablecoin supply fell 25.3% and TVL declined 22.5% over 30 days. These are signs of weakening marginal liquidity, although ETF outflows could partly reflect fund rotation rather than outright institutional rejection. RLUSD growth is a constructive ecosystem development, but there is no verified evidence yet that it is creating immediate XRP demand. My current interpretation remains cautious and bearish below $1.0569, but the daily RSI leaves room for a violent relief rally. The decisive questions are: can XRP reclaim $1.044 with expanding spot participation, or does rising open interest meet another failure? Does $0.9974 hold on a retest? And if it breaks, is the move forced liquidation—or the beginning of a deeper repricing? #IMPACTbyTrade
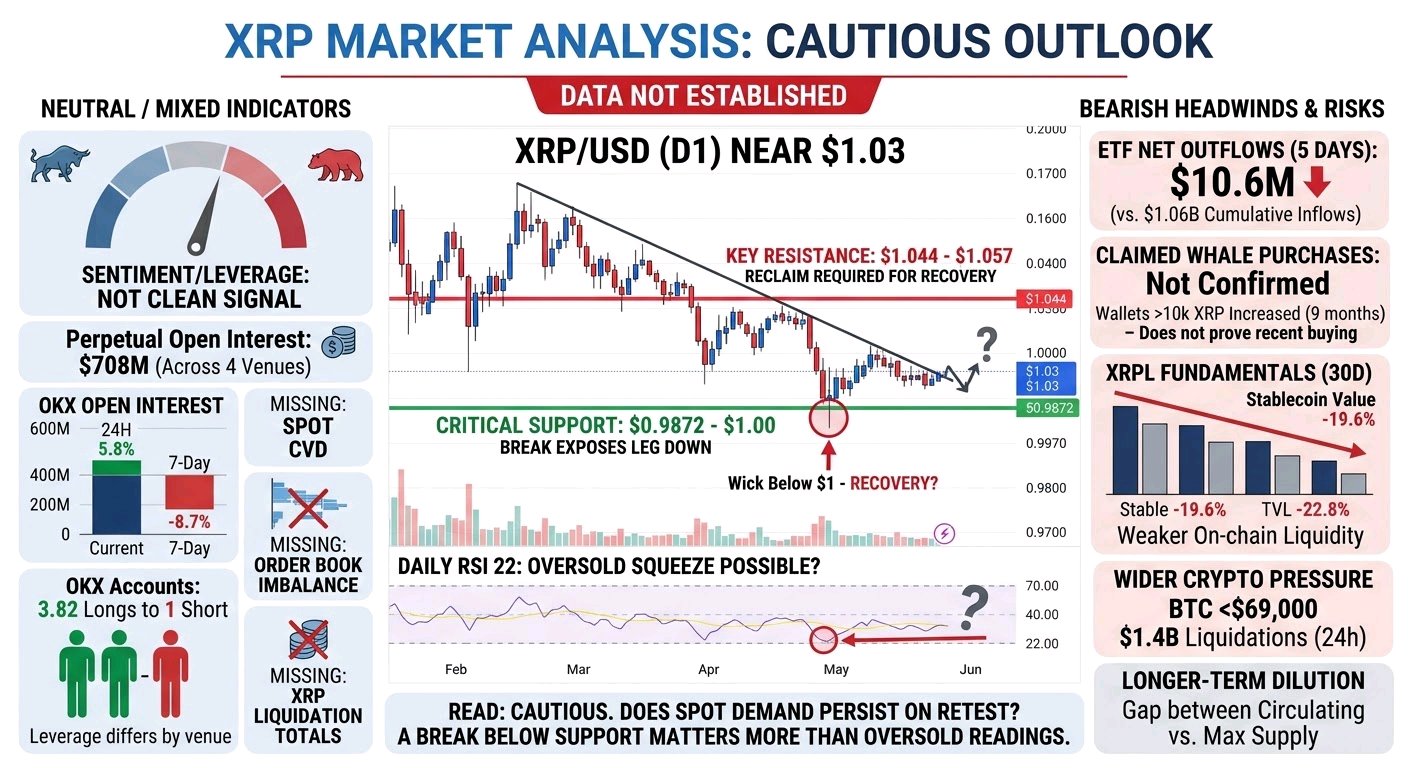
$XRPUSDT is caught between a possible oversold bounce and a market still behaving like a downtrend. It trades near $1.03, down 13.7% over 7 days. The wider crypto market is under pressure too: Bitcoin fell below $69,000, and reported liquidations reached $1.4 billion in 24 hours. XRP briefly dipped below $1 before recovering. That matters, but does the rebound show buyers stepping in—or only a pause after forced selling? The available data does not establish which. The facts are mixed. Perpetual open interest is about $708 million across 4 venues. OKX open interest is up 5.8% in 24 hours, but down 8.7% over 7 days. Funding is close to neutral overall, while OKX accounts show 3.82 longs for every short; top traders’ positions, however, are net short. That is not a clean market-wide positioning signal. It suggests leverage and sentiment differ by venue and trader group. We also lack verified XRP-specific liquidation totals, spot CVD—a running measure of aggressive buying versus selling—or order-book imbalance. High spot volume alone cannot tell us whether buyers are absorbing supply. ETF flows offer another headwind: about $10.6 million of net outflows over 5 days, despite roughly $1.06 billion in cumulative inflows since tracking began. Wallets holding at least 10,000 XRP have reportedly increased over 9 months, but that does not prove recent net buying or show whether large holders are moving coins to exchanges. The claimed whale purchases therefore remain a possibility, not confirmed evidence that they offset ETF selling. The price levels matter because they distinguish a bounce from an actual change in behavior. $0.9872–$1.00 is the key support area; a decisive break would weaken the case that buyers are defending the lows and could expose the market to another liquidation-driven leg down. Above, $1.044–$1.057 is the first meaningful resistance zone. A sustained reclaim, rather than a quick wick through it, would make an oversold recovery more credible. It could open room toward $1.11–$1.18, but that would still be a countertrend move, not proof the broader trend has reversed. The technical backdrop remains heavy: daily RSI is around 22, which raises the chance of a squeeze, while daily and weekly trends remain down. On the fundamentals side, XRPL stablecoin value fell 19.6% over 30 days and TVL fell 22.8%. Those figures suggest weaker on-chain liquidity, though they do not establish the cause of XRP’s price decline. A December 3 ledger fix is announced, but there is no evidence yet of a direct market impact. No near-term token unlock was identified; the large gap between circulating supply and maximum supply is a longer-term dilution consideration, not an immediate catalyst. My read is cautious, not decisively bearish: support has held so far, but the stronger proof would be spot demand lifting price through resistance. Does buying persist on a retest, and do ETF flows improve? If not, a break below $0.9872 would matter more than oversold readings.#IMPACTbyTrade
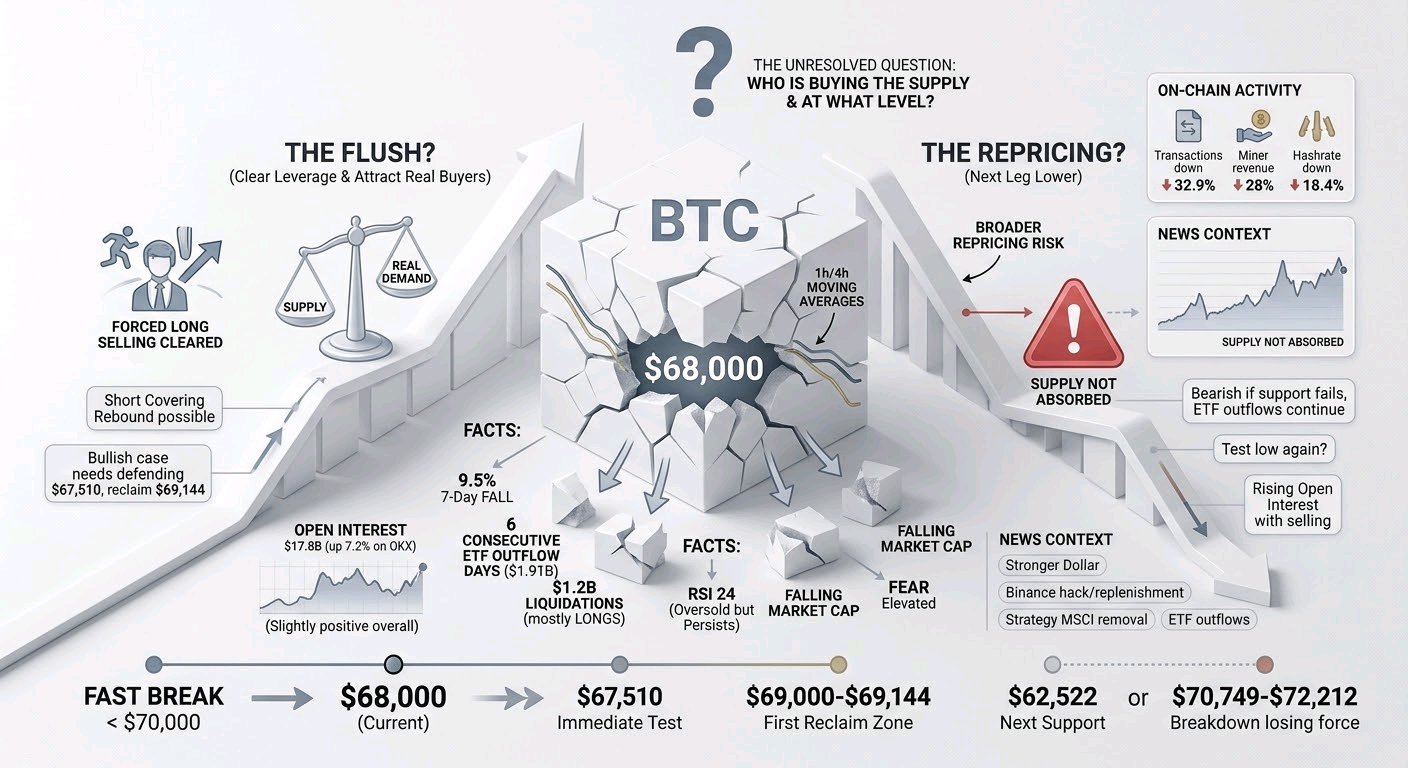
$BTCUSDT 在快速跌破 70,000 美元後,現已接近 68,000 美元。目前關鍵的問題在於,這是一次清除槓桿並吸引真正買家的洗盤,還是更大規模重新定價的下一階段?證據支持這兩種可能性,但尚未出現確認性的轉折點。 已核實的事實:BTC 在 7 天內下跌約 9.5%。近期小時線顯示從 71,000 美元區域急劇下跌,隨後出現無力的反彈,但在 69,144 美元下方受阻,並創下接近 67,510 美元的新低。價格仍遠低於下跌中的 1 小時和 4 小時移動平均線。日線 RSI 約為 24,屬於超賣狀態,但在強勁的下跌趨勢中,超賣情況可能會持續。現貨 ETF 資金流向在 5 天內淨流出 10.6 億美元,20 天內淨流出 19.1 億美元,已連續 6 天淨流出。報告顯示,24 小時清算額超過 12 億美元,主要來自槓桿多單。市場恐慌情緒升高,整體加密貨幣市值也大幅下跌。 我的解讀:強制性的多單拋售可能加速了下跌,但清算只是放大器,而非完整的解釋。持續的 ETF 資金流出是一個更有意義的需求警訊:如果該部分供應未被吸收,反彈可能會面臨困難。然而,資金流向的畫面尚不完整。整體現貨交易量巨大,但我們缺乏可靠的 CVD(累積成交量差)、交易所層級的買賣數據以及訂單簿深度。因此,關於散戶在買入而大戶在拋售的說法仍僅止於報導,並非獨立證實到底是誰在決定邊際價格。 衍生品市場並未提供明確的「清洗完畢」訊號。追蹤場域的未平倉合約(Open Interest)約為 178 億美元,OKX 的 7 天未平倉合約增加了 7.2%。整體資金費率僅略微為正,部分場域甚至接近零或略微為負。這表明市場並未一致轉向擁擠的空頭;這也可能意味著在價格疲軟的同時,槓桿正在重建。這些數字僅限於特定場域,無法揭示完整的清算圖譜。止損單的集中可能會加速行情走勢,但不能保證在該點位出現反轉。 眼下的測試點是 67,510 美元,這是近期的低點。如果價格跌破該點位且無法收回,賣方可能仍控制著盤面;62,522 美元是現有結構中下一個顯著的日線支撐位。但在如此劇烈的下跌後,空頭回補可能會產生強勁的反彈,而不會改變更大的趨勢。上行方面,69,000 至 69,144 美元是第一個收復區間。持續站上該區域將改善短期前景;若能重新站上 70,749 至 72,212 美元附近的下跌中小時均線,將是跌勢正在減弱的更有力證據。僅僅在阻力位上方出現短暫的影線是不夠的。 新聞提供了背景資訊,而非被證實的單一觸發因素。報導提到美元走強、ETF 資金流出和槓桿清算。Binance 表示在遭報導駭客攻擊後已補足客戶資產,儘管獨立驗證仍存疑;單憑該公告並不足以確立 BTC 的拋售壓力。Strategy 宣佈從 MSCI 指數中移除可能會影響其股票及相關資金流,但對 BTC 的直接影響尚不明確。鏈上活動更為疲軟:過去 30 天交易量下降了 32.9%,礦工收入下降 28%,算力下降了 18.4%。這些是活動與挖礦經濟減弱的相關跡象,但並非礦工即將拋售的證據。 我的觀點:日線和 4 小時結構依然看空,而超賣動能使得追逐跌勢變得危險。看漲觀點需要買方保衛 67,510 美元,收復 69,144 美元,並展現持續的現貨需求。若支撐位失守、ETF 持續流出,且未平倉合約上升伴隨拋售重啟,看空觀點將增強。未解決的問題是吸收能力:誰在購買這些供應,如果價格再次測試低點,他們還能繼續嗎?#IMPACTbyTrade
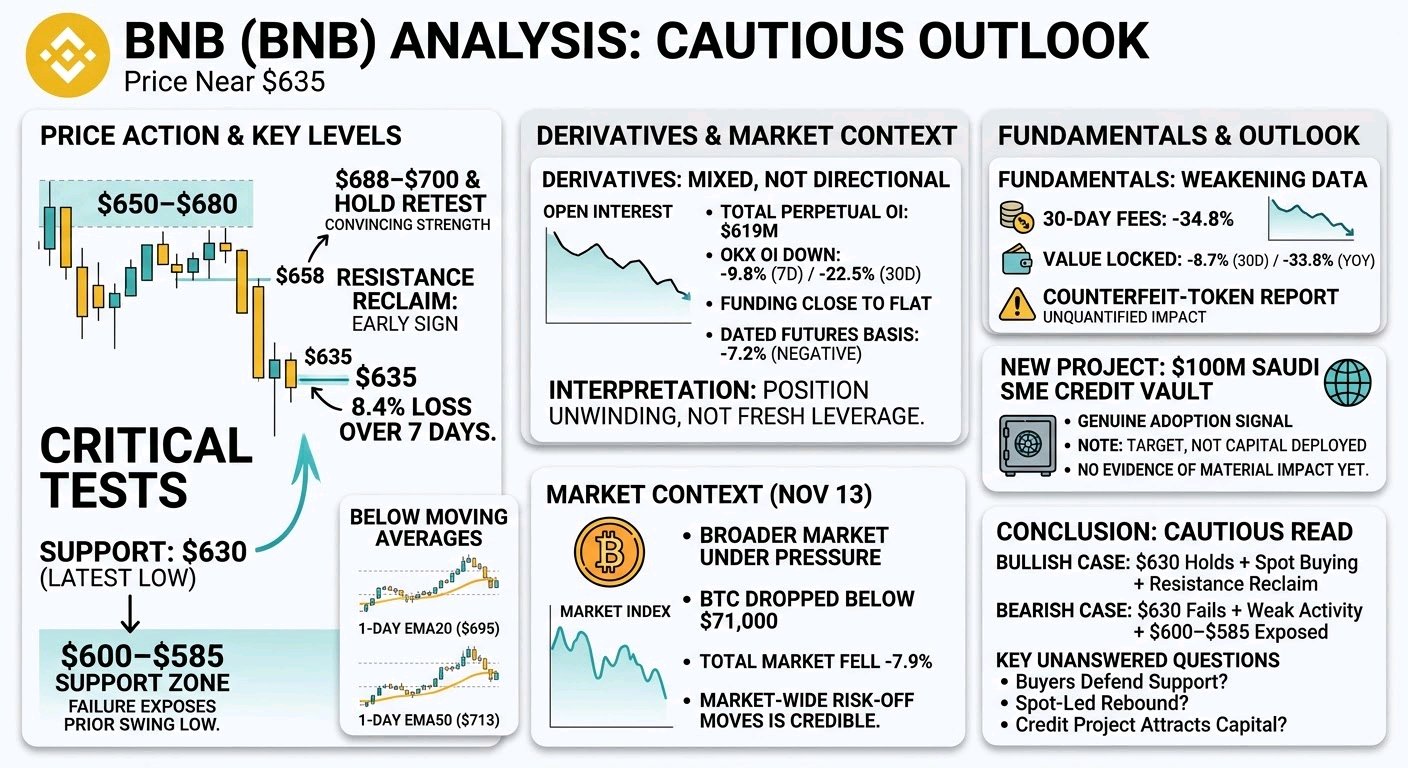
$BNBUSDT BNB 在 7 天內下跌 8.4% 後,價格接近 635 美元。重點不僅僅在於價格下跌,更在於拋售壓力已將其推低至近期 650–680 美元的區間下方,而整體市場目前也承受著壓力。11 月 13 日,整個加密市場下跌了 7.9%,比特幣也跌破 71,000 美元。這使得市場整體的風險規避行為成為此時下跌的一個合理解釋。但這並不能完全解釋 BNB 的疲軟:BNB 在 30 天內下跌了 14.8%,且現有數據無法區分市場貝塔係數(market beta)與幣種特定拋售之間的影響。 目前的直接考驗是 630 美元這一近期低點。如果失守,下一個重要的支撐區間約在 600–585 美元左右,其中包含一個之前的波段低點。守住 630 美元可能會帶來緩解性反彈,但我認為這本身並不構成結構性的轉折。價格仍遠低於其 1 日 EMA20(約 695 美元)和 EMA50(近 713 美元);週線移動平均線也在 693–694 美元附近。收復 658 美元將是市場趨穩的早期跡象。若要出現更強勁的轉變,則需要價格重新奪回 688–700 美元的區間,並在回測時企穩。什麼樣的走勢才具有說服力?需要現貨買盤和持續的交易活動——而不僅僅是微弱的反彈或短暫的軋空。 衍生品市場的情況好壞參半,沒有明顯的方向性。永續合約持倉量為 6.19 億美元;OKX 持倉量在 7 天內下降了 9.8%,30 天內下降了 22.5%。資金費率接近持平,而定期期貨基差為負,年化率為 -7.2%。價格下跌伴隨持倉量下降,這與平倉行為一致,而非槓桿驅動的下跌。然而,OKX 帳戶仍傾向於看漲,而頂級交易員的多空比低於 1。這些僅是特定平台的指標,並非整個市場的定論。由於我們缺乏可靠的清算水準、成交量累積(CVD)、訂單簿失衡,或是鯨魚和交易所的資金流向數據,因此關於「強制清算多頭」或「主力買盤介入」的說法都屬於猜測。 基本面尚未提供明確的緩衝。BNB Chain 的 30 天手續費下降了 34.8%;鎖倉量(TVL)在 30 天內下降了 8.7%,同比下降 33.8%。宣佈的沙烏地阿拉伯中小企業信貸保險庫(目標為 1 億美元)是一個真正的採用訊號,但目標並不等於已部署的資本,且目前沒有證據表明這已實質性地改變了對 BNB 的需求。關於偽造代幣的報告引發了另一種關於信任和用戶安全的擔憂;其市場影響尚未量化。 我的解讀持謹慎態度,而非斷言。看漲的情況是:630 美元守住,市場壓力緩解,且 BNB 在真實的現貨參與下收復阻力位。看跌的情況是:跌破 630 美元後未能恢復,進而下探 600–585 美元,同時交易活動依然疲軟。目前懸而未決的關鍵問題是:買家是否會捍衛支撐位、任何反彈是否由現貨主導,以及新的信貸項目是否能吸引實際資本並獲得持續使用。#IMPACTbyTrade
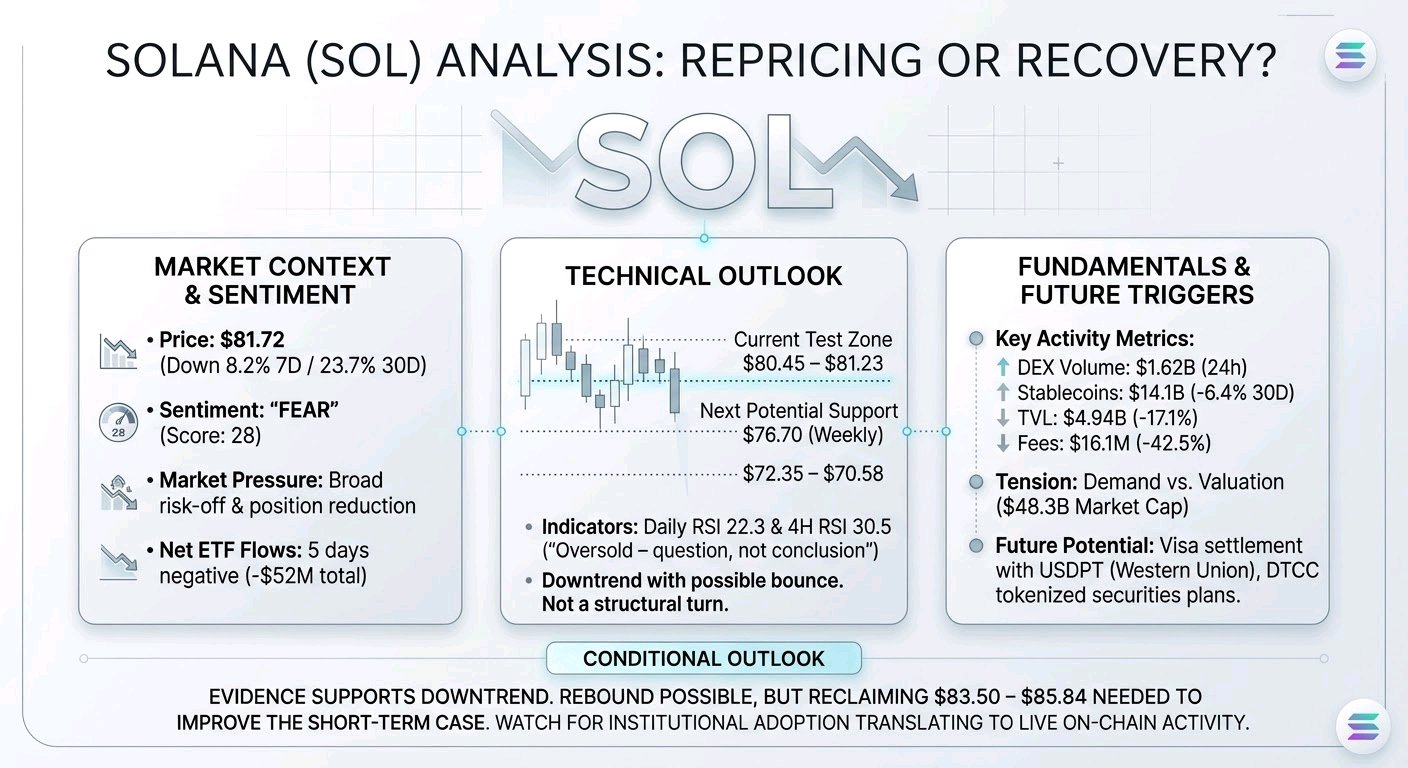
$SOLUSDT 在 81.72 美元的價格看起來並不像是市場已經站穩腳跟,反而更像是仍在試圖消化一波持續的重新定價。它在過去 7 天內下跌了 8.2%,在 30 天內下跌了 23.7%。這種疲軟並非孤立現象:整個大盤正承受壓力,恐懼指數從一週前的 50 上升至 28,且 ETF 資金流連續 5 天呈現淨流出,總額達 5,200 萬美元。問題在於,這主要是因為普遍的避險情緒與減倉行為,還是投資者也在重新評估 Solana 本身的增長與價值獲取能力。 當前的即時價格測試區間為 80.45–81.23 美元。SOL 已多次在該區域附近交易,但現有的 K 線圖尚未顯示出持續的收復跡象或確認的跌破走勢。若價格明確收盤低於 80.45 美元,週線支撐將看向 76.70 美元附近,隨後是 72.35–70.58 美元。這些僅是參考區間,而非保證會反彈的點位。另一方面,83.50–85.84 美元是第一個具關鍵意義的阻力帶;若能突破該區間並在回測時站穩,會比快速的插針反彈更具說服力。83.98 美元附近的週線阻力同樣重要。若無法突破該處,整體大趨勢依然疲軟:價格遠低於約 95.57 美元的週線 EMA20 和約 104.08 美元的 EMA50。 超賣讀數引發了一個問題,而非結論。日線 RSI 為 22.3,4 小時線 RSI 為 30.5,且價格在兩個時間週期上均低於關鍵移動平均線。這可能預示著一波強勁的超跌反彈,但單憑這一點並不足以證明賣方力竭。近期的 K 線顯示價格走低,並多次測試 80.45 美元區域,但僅有小幅回升。目前的證據支持「下跌趨勢伴隨可能的超賣反彈」這一觀點,而非確認的結構性轉折。若要改變這一解讀,我希望看到價格重新收復阻力位、在回測中站穩,並吸引持續的現貨買盤參與。 衍生品數據提供了一些複雜但有用的線索。據報道的交易所中,未平倉合約 (Open Interest) 總額為 18.6 億美元,而 OKX 的未平倉合約在過去 7 天內下降了 3.4%,30 天內下降了 5.3%。加權資金費率略微負值,為每 8 小時 -0.004%。這種組合顯示槓桿正在撤出,而非多頭倉位過度擁擠。然而,這並未告訴我們是誰推動了這波下跌。多空帳戶比率並不等同於倉位大小:帳戶傾向做多,但頂級交易員的倉位卻偏向做空。關鍵在於,我們這裡沒有經過驗證的累積成交量分佈 (CVD)、訂單簿失衡、清算數據或交易所錢包流向。因此,關於清算連鎖反應、主力出貨或決定性的現貨賣方接管等說法,都缺乏證據支持。廣泛的現貨成交量和緊湊的報價價差顯示市場正在交易,但並未揭示進攻方的方向。 基本面的緊張關係更難被忽視。Solana 確實有實際活動:24 小時 DEX 交易量達 16.2 億美元,穩定幣規模達 141 億美元。但穩定幣餘額在 30 天內下降了 6.4%,手續費收入下降了 42.5% 至 1,610 萬美元,鎖倉價值 (TVL) 下降了 17.1% 至 49.4 億美元。以約 483 億美元的市值計算,相對於當前的手續費和協議收入,目前的估值仍然過高。高交易活躍度並不自動轉化為 SOL 持有者的持久價值。這種使用率是在擴展到高黏性的支付和金融活動,還是僅僅是隨著市場胃口消退而轉瞬即逝的投機交易? 雖然有真正的採用利多,但時機至關重要。Visa 報導提到使用西聯匯款 (Western Union) 基於 Solana 的 USDPT 進行結算,以及 DTCC 計劃在 2027 年下半年處理符合條件的代幣化證券,這些或許能支持未來的應用。然而,目前這些公告尚未體現為實質的鏈上手續費、SOL 需求或資金流的即時改變。同時,ETF 的資金流出是近期可量化的不利因素。關鍵測試在於這些機構計劃能否轉化為真實的鏈上活動,以及這些活動能否轉化為更強勁的經濟效益。 我的觀點刻意保持謹慎:超賣的市場可能會反彈,但現有的證據不足以判定已經觸底。若價格能持續站穩 80.45 美元上方,隨後在成交量支持下收復 83.50–85.84 美元區間,將會改善短期前景;若明確跌破該支撐,76.70 美元以及隨後的 72.35–70.58 美元將保持相關性。什麼會改變更宏觀的格局?持續的 ETF 資金流入、手續費收入與鎖倉價值的改善,以及由現貨驅動的漲勢,而非由槓桿驅動的軋空。目前尚未回答的問題是:買方是否會捍衛支撐位?拋售主要是去槓桿化還是新一輪的派發?Solana 的機構合作管道能否在市場失去耐心之前產生可量化的價值獲取?$IMPACTbyTrade
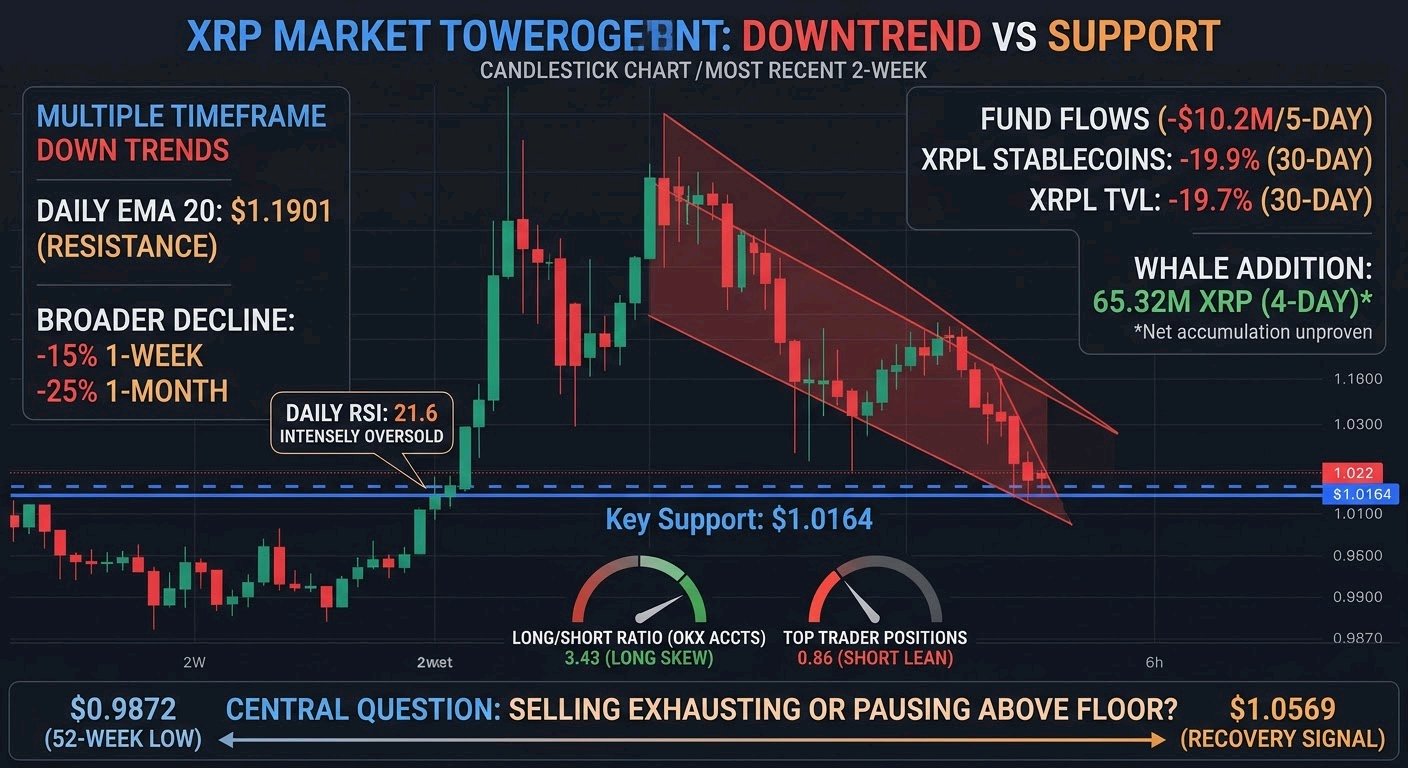
XRPUSDT XRP 正處於明確的下跌趨勢與尚未跌破的支撐位之間。這一區別至關重要:雖然廣泛的證據顯示看跌情緒更強,但跌破尚未確認。在最近的快照中,XRP 價格約為 1.02 美元,較前一日收盤價下跌 2.78%。未來幾天至兩週的關鍵在於,拋售壓力是否能將其推低至 1.0164 美元下方,或者超賣狀況與低位買盤是否會引發一波反彈。 經核實的市場事實:小時線、4 小時線、日線和週線趨勢均為下跌。XRP 低於其短期移動平均線;日線 EMA20 為 1.1901 美元,遠高於當前價格。過去 6 根收盤的小時線均收於 1.0164 美元上方。價格曾觸及該水平,隨後收於 1.0274 美元,之後滑落至 1.0245 美元。這是疲軟的價格行為,但並未確認收盤跌破支撐位。如果 1.0164 美元失守,下一個值得注意的水平是 52 週低點 0.9872 美元。 整體跌幅顯著:在市場快照中,XRP 一週內下跌約 15%,一個月內下跌 25%。日線 RSI 為 21.6;小時線 RSI 約為 29。這些讀數顯示拋售激烈,並增加了反彈的可能性。但這並不意味著跌勢已經結束。什麼情況會改變格局?持續回升突破 1.0569–1.0654 美元區間,將比單次的日內反彈更具意義。若要扭轉日線趨勢,則需要更強勁的信號。 潛在的壓力來源:據報導,美國現貨基金過去 5 天的資金流向為 -1,020 萬美元,儘管最新交易時段錄得 37 萬美元的溫和流入。XRPL 穩定幣供應量在 30 天內下降了 19.9%,鎖倉價值(Value Locked)下降了 19.7%。這些對短期需求而言是現實的阻力,但並不能證明 ETF 贖回或 XRPL 活動直接導致了每一次拋售。費用上漲了 23%,但考慮到 30 天內僅 4.23 萬美元的總額,我認為這太小,不足以抵消穩定幣和鎖倉價值的縮減。 巨鯨活動是主要且相互矛盾的說法:有新聞報導稱大型持有者在 4 天內增持了 6,532 萬枚 XRP。但該數據無法證實來自外部錢包的淨買入或交易所提現。在此期間,XRP 價格大幅下跌。這些持有者是在蓄力、在錢包間轉移代幣,還是僅僅未能消化市場上的拋售壓力?現有證據無法下定論。 期貨與流動性:據報導,4 個平台的永續合約未平倉量(Open Interest)為 7.17 億美元。各平台的歷史數據不盡相同:OKX 的未平倉量 7 天內下降 8.7%,隨後在 24 小時內上升 5.8%。整體資金費率略微為正,為每 8 小時 0.003%,意味著多頭支付空頭費用,但費率溫和,且 Bybit 的資金費率為負。OKX 的帳戶多空比為 3.43(偏多),而頂級交易員的持倉比率為 0.86(偏空)。這種分歧表明雙方都存在脆弱性,並非單一的擁擠交易。 我們缺乏可靠的 CVD(累積成交量差)、訂單簿失衡、期貨成交量總變化或清算總額等數據。因此,我們無法判斷是現貨拋售主導,未平倉量的下降是否反映了強制清算,或者軋空可能發生在何處。報導稱多個平台的現貨成交額為 17.1 億美元,但僅憑成交額無法揭示誰是激進的買家或賣家。 我的解讀是看跌但有條件,並非絕對。市場廣泛疲軟、近期資金流向負面以及 XRPL 流動性下降,不支持現在就認為底部已現。然而,支撐位在小時線收盤時依然守住,且超賣動能使得盲目追空具有風險。我會關注小時線收盤是否跌破 1.0164 美元,以及價格隨後是否會跌向 0.9872 美元。如果支撐位守住且價格重回 1.0569 美元上方,跌破的論點就會減弱。目前證據仍留下一個核心問題:拋售壓力是在減弱,還是僅僅在支撐位上方暫停?IMPACTbyTrade
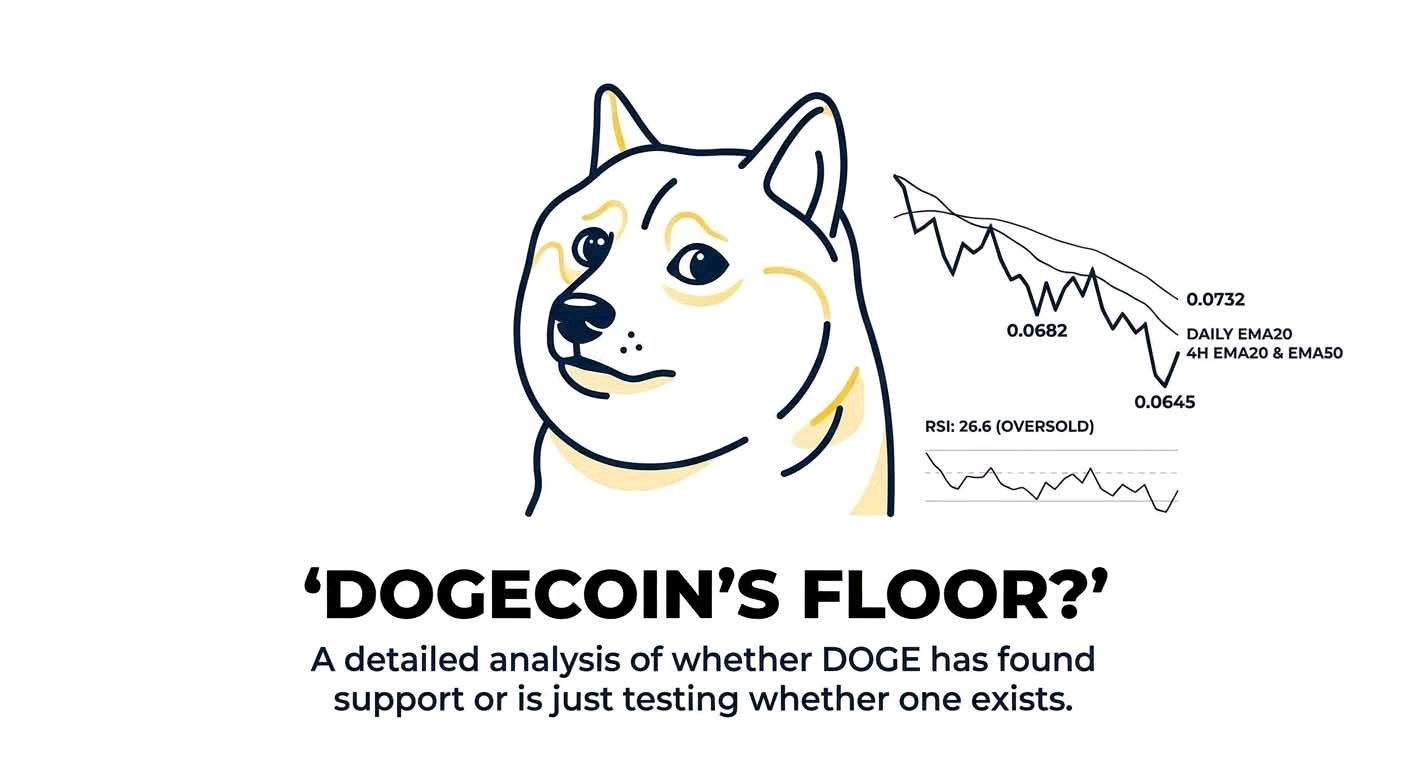
$DOGEUSDT 看起來與其說是市場找到了底部,不如說是在測試底部是否存在。這兩者有本質上的區別。價格在 7 天內下跌 12.8%,30 天內下跌 23.5%,目前徘徊在 0.0647 美元附近。這種下跌伴隨著廣泛的避險情緒——加密貨幣整體市場在 24 小時內下跌了 5.2%,恐懼與貪婪指數也從一週前的 50 降至 28。但 DOGE 的表現比大盤更疲軟,因此僅靠宏觀壓力可能無法解釋這種走勢。 已驗證的事實:最近的盤中低點約為 0.0645 美元,這也是近期 1 小時和日線區間的底部。DOGE 低於 1 小時、4 小時和日線圖上的下跌移動平均線。日線 EMA20 約在 0.0732 美元;在 4 小時圖上,EMA20 和 EMA50 分別位於 0.0682 美元和 0.0704 美元附近。RSI 指標顯示超賣(日線 26.6,1 小時線 21.2),但這僅衡量了近期動能,並不能說明買家是否回歸。最新的 K 線顯示出劇烈的下跌走勢,且僅出現了小幅反彈。目前尚未看到確認的反轉跡象或成功的支撐位回測。 這使得 0.0645 美元成為當前的即時測試點,而非已證實的支撐區。如果 DOGE 能守住該價位並開始構築更高的低點,市場可能正在消化拋壓。如果價格跌破並收於該位之下,目前的「潛在底部」解讀就會減弱;現有數據尚不足以確立可靠的下一個支撐位。價格上方,0.0675 至 0.0689 美元是第一個阻力區,隨後是約 0.0696 至 0.0717 美元的區域。收復這些水平比短暫的超賣反彈更為重要。若能持續穩定在 0.0732 美元上方,將是日線趨勢可能發生改變的更強訊號。 衍生品數據表現不一。追蹤的永續合約未平倉量在 4 個交易平台合計為 3.76 億美元,而更廣泛的平台覆蓋範圍在 83 個平台報告為 9.29 億美元;由於這是不同的覆蓋集合,因此不應將其合併計算。在 OKX 上,未平倉量在 7 天內下降了 9.2%。這符合在拋售過程中槓桿倉位減少的情況,而非市場對其產生了新的信念。資金費率略微為負,而遠期期貨基差處於 -20.9% 年化率的深度負值。這些讀數顯示期貨需求疲軟,但無法告知我們是空頭在建倉,還是多頭在離場。我們也沒有驗證過的強平價格或強平熱力圖。若僅假設空頭擁擠就認為擠倉即將發生,將是錯誤的判斷。 持倉情況增加了另一個變數:OKX 的多空帳戶比接近 5:1,但頂級交易員的持倉比為 0.74。帳戶數量顯示多頭帳戶遠多於空頭,但持倉比卻顯示大戶可能傾向於另一方。哪個訊號更重要?在缺乏實際強平數據和訂單流數據的情況下,兩者都無法給出明確答案。現貨成交額在 63 個交易平台達到了 8.67 億美元,相當可觀,但其中 30% 集中在單一平台。成交額並不等於淨買入;我們缺乏現貨 CVD(累積成交量差)、訂單簿失衡以及鯨魚吸籌或交易所資金流出的可靠證據。 存在一個可能的催化劑,但仍需等待實際交付來驗證。DogeOS 被描述為「非常、非常接近」發布,據報導有超過 100 名開發者參與,但未給出具體日期。這可能會創造新的實用價值;但目前尚未展現出持續的 DOGE 需求。報告還指出,10 月 14 日至 11 月 10 日期間,現貨 ETF 的資金流向為零。DOGE 的 1570 億總供應量已全部流通,但發行量每年仍以約 50 億枚的速度增加。長期買家仍需吸收這些供應,單憑交易量並不能證明需求是持久的。最近的新聞標題也將市場疲軟與通膨擔憂聯繫起來;這構成了可能的背景,而非導致 DOGE 下跌的特定原因。 我的解讀是謹慎的,這並非認定 DOGE 一定會下跌。看漲的情況需要 DOGE 守住 0.0645 美元,然後在現貨買盤和改善的價格結構支撐下收復阻力位。看跌的情況則是價格果斷跌破低點,特別是如果 DOGE 繼續跑輸大盤的話。關鍵問題在於買家是否真的捍衛了支撐位,期貨倉位是否能與現貨需求同步穩定,以及 DogeOS 是否能帶來實際的可測量用途,而不僅僅是市場預期。#IMPACTbyTrade
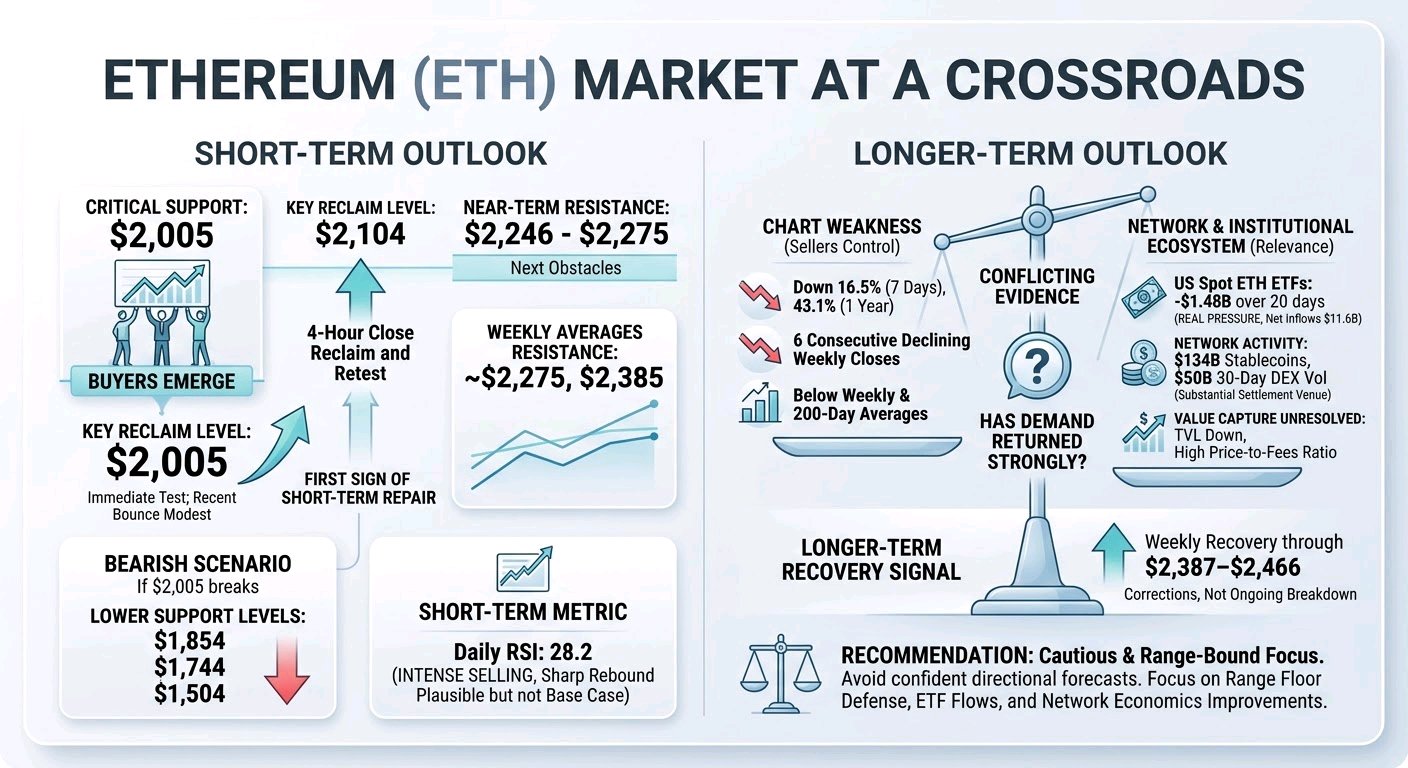
$ETHUSDT 位於 2,022 美元附近,市場正處於兩種截然不同的證據之間:圖表顯示賣方仍掌控局勢,而網路與機構生態系統則顯示以太幣 (Ethereum) 依然具備相關性。雙方都尚未定論。在未來 6 到 12 個月內,比起關注 ETH 在下跌後是否「便宜」,我會更關注需求是否強勁到足以守住區間下緣。 目前的直接考驗是 2,005 美元。ETH 觸及該區域後僅出現微幅反彈;最近的日內低點為 2,013 美元。這使得 2,005 美元不僅僅是一個整數關卡,更是近期買方目前出現的價位。如果價格能守住,並在 4 小時收盤時收復 2,104 美元,且後續出現成功的重新測試,那麼短期修復的第一個跡象就會出現。這並不能證明新的上漲趨勢已經形成。下一個阻力點約在 2,246 至 2,275 美元,接著是週線平均值,大約在 2,275 與 2,385 美元左右。 整體圖表依舊疲軟。ETH 在 7 天內下跌了 16.5%,一年內下跌了 43.1%,且週線已連續 6 根收黑。價格低於週線平均值與 200 日均線。每日 RSI 為 28.2,這告訴我們拋售壓力極大,但並不代表賣方已經竭盡全力。我的觀察是,這為強勁反彈創造了空間,但還不足以將反彈視為基本情況。 如果 2,005 美元被決定性地跌破,下一個實質支撐位在 1,854 美元附近。再往下看,週線支撐位位於 1,744 與 1,504 美元左右。在疲軟的市場中,價格走向這些價位並不令人驚訝,但現有的證據並未顯示價格必然會觸及這些點位。另一方面,如果週線能回升並突破 2,387 至 2,466 美元,這點至關重要,因為這將使 ETH 重回關鍵阻力位上方,並使近期的下跌看起來更像是修正而非持續性的崩跌。 部位分布無法給出簡單的答案。追蹤平台的永續合約未平倉量 (Open Interest) 約為 115 億美元,而 OKX 的未平倉量在 7 天內下降了 12.7%。這種下降顯示在拋售過程中,部分槓桿已被削減。資金費率仍維持在每 8 小時 0.004% 的微幅正值,這意味著多頭仍需支付費用給空頭。這是一個溫和的阻力,而非多頭過度擁擠的證據。OKX 的帳戶部位傾向做多,而頂級交易員的部位則傾向做空。這些只是部分快照,目前沒有經過驗證的清算圖或訂單流證據來顯示強制拋售可能集中在哪裡。我不會將未平倉量的下降解讀為拋售壓力已經耗盡的證明。 現貨參與度同樣難以單從成交量來判斷。報告顯示 24 小時現貨成交量約為 91 億美元,但這無法揭示買方是在吸收供應,還是僅僅在進行交易。ETF 的資金流向提供了更清晰的短期需求訊號:美國現貨 ETH 基金在 5 天內流失了 5.24 億美元,20 天內流失了 14.8 億美元,其中包括 11 月 11 日的 1.45 億美元流出。這是真實的壓力。累計淨流入仍維持在約 116 億美元,顯示機構准入管道與現有的投資者基礎已經建立;目前不確定的是,這些投資者是仍在加倉還是在減持。 以太坊的使用率具有重要意義,但價值的獲取仍是未解難題。該鏈擁有 1,340 億美元的穩定幣資產,且 30 天內去中心化交易所 (DEX) 成交量達到 500 億美元。這些數據支持了以太坊仍然是一個重要結算平台的觀點。然而,總鎖倉量 (TVL) 在 30 天內下降了 13.6%,一年內下降了 43.2%;穩定幣餘額也在 30 天內下降了 7.6%。年化費用為 1.75 億美元,相對於 2,470 億美元的市值,隱含了 1,037 倍的市盈率 (P/F ratio)。雖然費用較前 30 天上升了 8.8%,但這種小幅改善尚未扭轉整體格局。高活躍度最終會轉化為更強勁的 ETH 需求與費用銷毀,還是使用率的增長無法為代幣帶來相應的價值?目前的數據無法回答這個問題。 目前有一些建設性的機構發展:德意志銀行 (Deutsche Bank) 已為機構客戶推出託管服務,而 Sygnum 也開設了一檔以 ETH 計價的基金,目標年化回報率為 8% 至 10%。這些發展擴大了准入管道,但並未顯示將有多少新資金湧入。貝萊德 (BlackRock) 將 ETH 轉移至 Coinbase Prime 的行為,本身也不足以作為拋售的證據。短期來看,ETF 的資金流向與價格反應比頭條新聞更重要。 我的觀點是平衡但謹慎的:復甦是有可能的,但尚未得到證實。守住 2,005 美元並隨後收復 2,104 美元將改善短期前景;若能在 2,387 至 2,466 美元上方維持週線強勢,並配合 ETF 資金流向與網路經濟的改善,長期觀點才會更具說服力。若決定性地跌破 2,005 美元,將使低檔支撐位重新成為焦點。在其中任何一條路徑得到證實之前,將其視為「區間震盪」而非做出自信的趨勢預測,是詮釋 ETH 現狀最誠實的方式。#IMPACTbyTrade
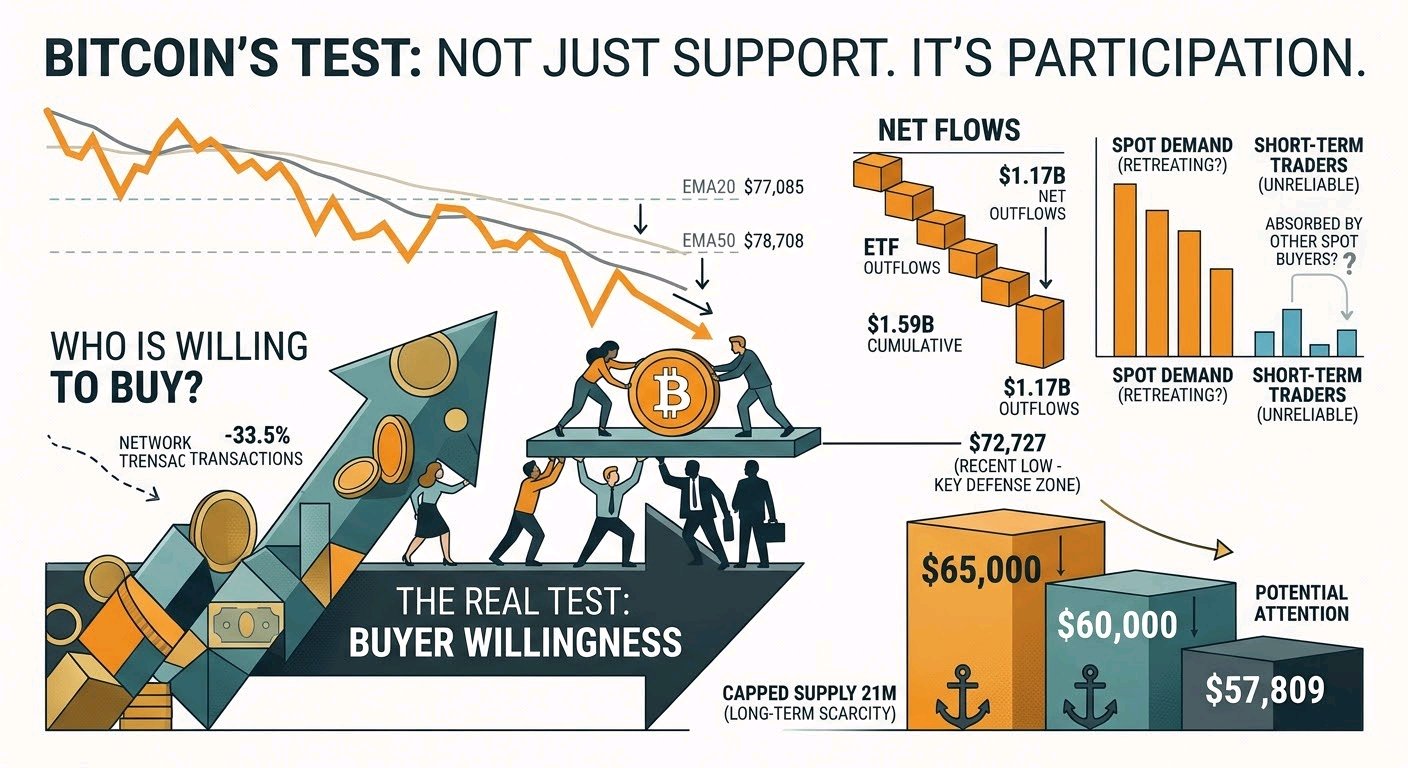
Bitcoin’s Test Is Not Just Support. It’s Who Is Willing to Buy. At about $73,800, Bitcoin is no longer asking whether it can produce a bounce. It is asking a more useful question: who is buying, and are they willing to keep buying when sellers press? That distinction matters. A price can rebound because short-term traders cover positions, yet still remain vulnerable if longer-term spot demand is retreating. The observable evidence is uncomfortable for the bulls. BTC is down 8.4% in 7 days, has closed lower for 6 consecutive weeks, and sits below its daily EMA20 near $77,085 and EMA50 near $78,708. On the weekly chart, it is below both key averages as well. Those levels do not predict the future, but they show that buyers have not yet repaired the trend. The question is not whether BTC can touch resistance; it is whether buyers can hold above it after the first wave of selling returns. The ETF figures make that test more demanding. US spot Bitcoin ETFs recorded $1.17B in net outflows over 5 days and $1.59B over 20 days, with outflows on 5 consecutive days. The cumulative $55.4B of inflows since 2024 tells us that the products once drew substantial demand. It does not tell us that investors are returning now. Are ETF redemptions being absorbed by other spot buyers? The available data do not establish that. Without clear evidence of stronger spot demand, a bounce alone cannot answer the question. That is why $72,727, the recent low, matters. It is the nearest visible test of buyers’ willingness to defend price—not a magic floor. BTC has traded near it and recovered, but that response has not carried price back above the key moving averages. A firm break below the low would shift attention to the longer-term support areas at $65,000, $60,000 and $57,809. A quick dip and recovery would tell a different story: sellers pushed through, but buyers absorbed the supply. The quality of the response matters as much as the level itself. For the recovery case, the first challenge is $76,000–$76,400, where weekly resistance and the weekly EMA20 converge. Next comes $82,842. Reclaiming either area would be more meaningful if accompanied by improving ETF flows and genuine spot buying. Why? Because rising prices without fresh spot demand can leave the market dependent on leveraged traders, who may leave quickly when momentum turns. Futures offer neither a clear alarm nor reassurance. Perpetual open interest was $18.9B across 4 venues, while OKX open interest was almost unchanged over 7 days, up 0.3%. Funding was mildly positive at +0.008% per 8 hours, so longs were paying shorts, but the rate was not extreme. Account positioning leaned long while top-trader positioning leaned short. That conflict makes it hard to call the market one-sided. And without verified liquidation totals, claims that a selloff is being driven by a cascade—or that a large liquidation wave is imminent—would go beyond the evidence. There are counterpoints to the demand weakness. A report described some whale accumulation through Nov. 9. But reported accumulation is not enough to call a broad shift: its scale, persistence and destination are unclear. Network transactions also fell 33.5% over 30 days. That signals lower activity, not proof of why BTC fell. Bitcoin’s capped supply of 21M remains a long-term feature, but scarcity does not guarantee short-term buying. So I would frame the market as a test of participation, not a contest between bullish and bearish slogans. The bearish case strengthens if BTC loses $72,727 and spot outflows continue. The recovery case gains credibility if buyers defend that low, flows improve, and price reclaims $76,000–$76,400 with follow-through. Until then, I see a market where sellers have the stronger evidence, but buyers have not yet given up the key nearby test. $BTCUSDT #IMPACTbyTrade
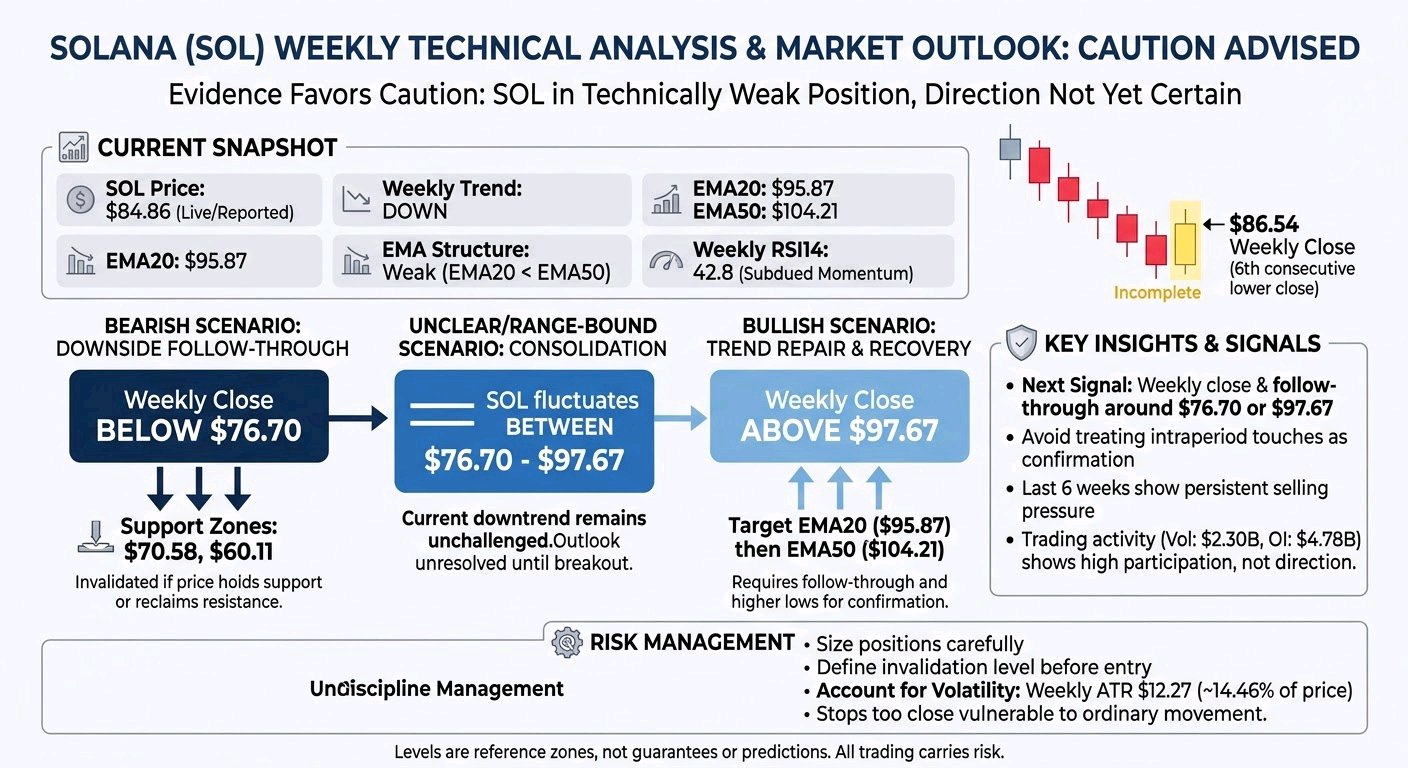
$SOLUSDT The weekly evidence still favors caution: SOL is in a technically weak position, but neither continued decline nor recovery is certain. The key distinction is between a price touching a level and closing above or below it—and then showing follow-through. A single move, especially while the weekly candle is still forming, is not enough to establish a breakout or a trend change. is around $84.86. The last 6 completed weekly candles closed progressively lower, from $121.60 to $86.54, and their highs also generally declined. The latest completed candle closed at $86.54, after reaching $98.16 and falling to $84.98. This sequence supports persistent selling pressure. It does not prove that selling will continue: a short run of candles cannot establish the next move, and the current weekly candle is incomplete. So far it has opened at $86.53, reached $88.46, and fallen as low as $81.23; its final close is not yet known. The broader weekly trend is classified as down. Price is below the weekly EMA20 ($95.87) and EMA50 ($104.21), with the shorter average below the longer one. The monthly trend classification is mixed, a reminder that weekly weakness does not settle the longer-term picture. Weekly RSI14 is 42.8, consistent with subdued momentum, but it is not by itself a reliable signal of either a reversal or further declines. The day’s reported range, $82.30–$85.42, is too short a window to change the weekly assessment. Bearish scenario: Further weakness would gain support if SOL closes a week below $76.70 and cannot reclaim that area. The next reference supports are $70.58 and $60.11. A sustained break below support would be evidence of downside follow-through, not proof that the next support must be reached. This scenario would be weakened if price holds above support and starts reclaiming resistance. A brief dip below a level followed by a close back above it would not, on its own, confirm a breakdown. Bullish scenario: The first meaningful test is a weekly close above $97.67, followed by a hold above that level. That would challenge the sequence of lower closes and place price back above the weekly EMA20, which is nearby. A subsequent reclaim of the EMA50 at $104.21 would provide stronger evidence of trend repair. This scenario would fail to gain confirmation if price is rejected near resistance or closes back below $97.67. Even a confirmed reclaim would not establish a long-term uptrend by itself; follow-through and higher weekly lows would matter. Unclear or range-bound scenario: SOL may hold between support near $76.70 and resistance near $97.67 without resolving direction. In that case, price could fluctuate while the current downtrend remains unchallenged and no new breakdown is confirmed. Repeated closes inside that range would leave the outlook unresolved. A move outside it would matter more if a weekly close and subsequent price action supported the break rather than quickly reversing it. Trading activity gives context, not direction. Reported 24-hour spot volume is $2.30B across 65 venues, while perpetual open interest is $4.78B. These figures show substantial activity and leverage exposure; without comparable historical volume or evidence of positioning shifts, they do not establish accumulation, selling pressure, or the likely direction of a move. Nor do they explain why the price has moved. The next important signal is therefore a weekly close and follow-through around $76.70 on the downside or $97.67 on the upside. Until that evidence arrives, avoid treating an intraperiod touch as confirmation. For risk management, size any position so that a stop-out is tolerable, define the invalidation level before entry, and account for volatility: weekly ATR is $12.27, about 14.46% of the current price. A stop placed too close may be vulnerable to ordinary price movement; a wider stop requires a smaller position. These levels are reference zones, not guaranteed floors, ceilings, or predictions.#IMPACTbyTrade
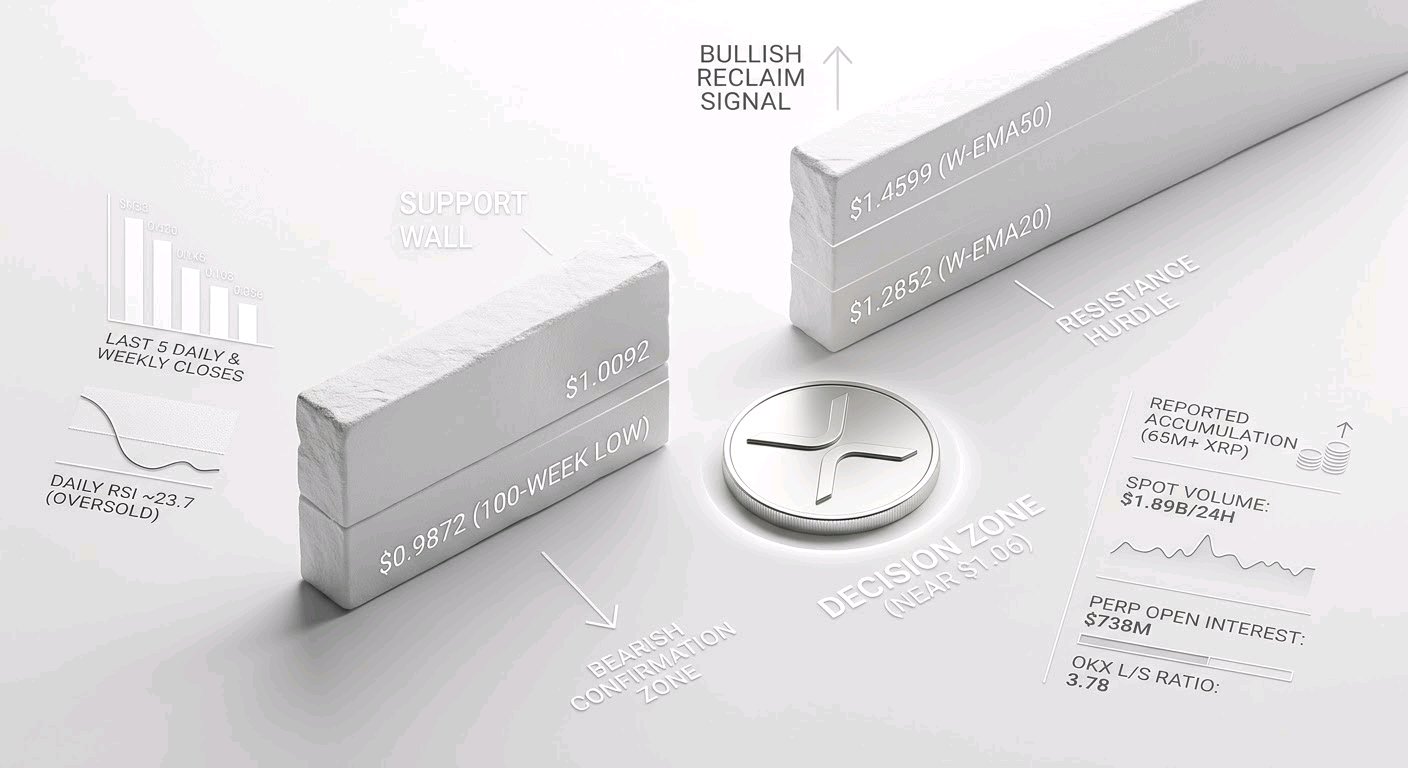
$XRPUSDT is not a clean “buy the dip” story, but neither is it a confirmed breakdown. The useful way to frame it is as a decision zone: the price is near important support, while the trend and several measures of market demand remain weak. A trader does not need to guess which side wins; the job is to define what evidence would change the view and size risk so being wrong is survivable. As of November 11, 2026, XRP is around $1.06. The last 6 completed daily candles closed progressively lower, from $1.2071 to $1.0565; the last 6 completed weekly candles also declined, from $1.5206 to $1.1132. Price sits below weekly EMA20 at $1.2852 and EMA50 at $1.4599. This is evidence of an established downtrend, not proof that it will continue indefinitely. Daily RSI is 23.7, showing weak momentum and a potentially stretched short-term move. It can accompany a bounce, but it cannot identify a bottom on its own. The immediate area to watch is weekly support at $1.0092, followed by the previous 100-week low at $0.9872. These levels are reference points, not guaranteed floors. A completed weekly close below $0.9872 would make the breakdown case more credible; a brief intraday dip would be less conclusive. On the upside, a weekly reclaim of $1.2852 would be the first meaningful challenge to the bearish structure. The next moving-average hurdle is $1.4599. Neither a single green candle nor a touch of resistance is enough to establish a trend change. The bearish case is the clearest current chart reading: lower closes, price below both weekly averages, and a market environment showing reduced risk appetite. It strengthens if XRP closes a week below $0.9872, particularly if spot selling volume rises and the price cannot quickly recover. It weakens if support holds through a retest and price begins making higher daily lows, then reclaims $1.2852. Volume matters because a price move with no evidence of increased participation is less persuasive; however, the supplied volume snapshot is only $1.89 billion across 72 venues in 24 hours. It does not give candle-by-candle buyer-versus-seller activity, so it cannot confirm either a breakdown or a reversal. The bullish case is conditional rather than imaginary. XRP is close to its recent low, the daily RSI is deeply depressed, and reports say large holders accumulated 65.32 million XRP over 4 days. Those facts leave room for a countertrend recovery. A stronger bullish signal would be support holding, improving daily structure, and a weekly close above $1.2852 with sustained spot volume. The bull case fails if $0.9872 gives way and price remains below it, or if an apparent bounce repeatedly stalls beneath the weekly EMA20. Oversold conditions and reported accumulation are not substitutes for price confirmation. The unclear case is also plausible: XRP may stay near support, swing sharply in both directions and offer no reliable trend signal. That would fit the tension between weak weekly momentum and a low RSI, as well as the mixed monthly trend. In that situation, waiting is a valid decision. A trader who must act could reduce position size, avoid adding simply because the price looks cheap, and set an invalidation point before entering. Futures positioning adds a caution, not a forecast. Perpetual open interest is $738 million across 4 venues; the supplied decline is for OKX only, where open interest fell 19.7% over 7 days. Funding is positive at a weighted 0.009% per 8 hours, meaning longs pay shorts. That suggests long exposure remains present and could be vulnerable if price falls, but it does not prove a squeeze is coming. OKX’s long/short account ratio is 3.78, while top traders’ position ratio is 0.86—a reminder that account counts and larger positions can tell different stories. Reliable liquidation levels and market-wide weekly open-interest change are not available, so claims about forced selling would go beyond the evidence. Fundamentals offer both catalysts and unresolved questions. XRP’s reported market capitalization is $66.9 billion, against $284,000 in annual fees and protocol revenue; the data therefore does not demonstrate that network activity currently captures meaningful value for token holders. Circulating supply is 63.5 billion of 100 billion, leaving 36.5 billion unissued. The available figures do not show how much new supply will enter circulation during the next year, so the supply risk is real but its near-term effect cannot be quantified. The latest news is mixed. XRPL lending and single-asset-vault amendments were reported as approaching the validator voting threshold, but approval, launch and real usage are not confirmed. Payments volume reportedly rose 207.4% to 1.16 billion XRP on November 9; one day of activity does not establish lasting demand for XRP. ETF flows reached about $1.06 billion cumulatively, but#IMPACTbyTrade