Samii
3901點贊0分享66粉絲9關注
I'm Crypto Content Creator | Trader 📊 Sharing charts, market insights & my trading journey. Real observations. Simple analysis. DYOR.
I'm Crypto Content Creator | Trader 📊 Sharing charts, market insights & my trading journey. Real observations. Simple analysis. DYOR.
Hello Bybit Team, I am one of the top BYX creators, and honestly, I feel really disappointed and heartbroken today. Almost everyone received a reward or a special gift, but unfortunately, I received nothing. I have put in countless hours of hard work, dedication, and effort, day and night, to contribute to this platform. Despite all my efforts, I feel completely overlooked and unappreciated. I ranked 13th overall, and even among the newcomers, I secured 1st place. I genuinely believe my hard work deserved some recognition. I'm not asking for anything unfair. I just want my efforts to be acknowledged and treated fairly. It's really discouraging when you give your best and still feel forgotten. I sincerely hope you will review my performance and consider my contribution. ❤️ #ByXIMPACT @BybitX @WeseR009 @MASAB

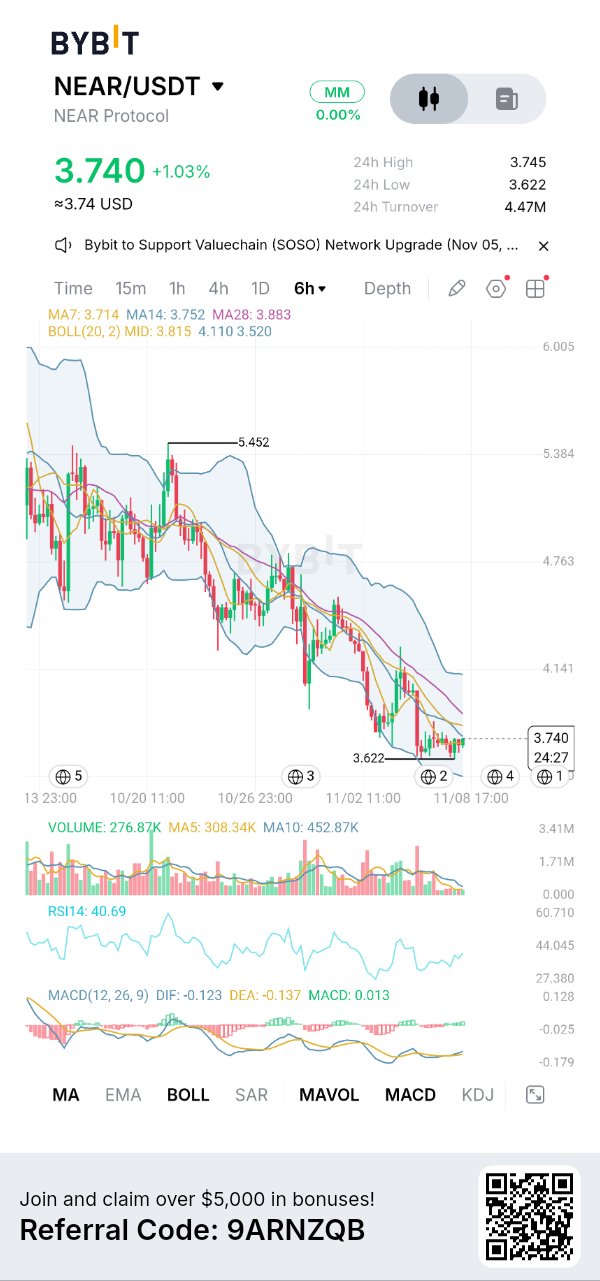
$NEARUSDT is still trading inside a broader declining structure, and the interesting part is that its latest bounce has brought price back above the 7-period moving average without reclaiming the more important resistance cluster. I wouldn't call this a trend reversal yet. Buyers are showing some short-term activity near $3.62, but the chart still needs stronger confirmation before the market structure can change. WHAT I'M SEEING ON THE CHART : The uploaded Bybit chart is on the 6-hour timeframe. NEAR/USDT is trading at $3.740, up 1.03%. The visible 24-hour high is $3.745, the low is $3.622, and turnover is $4.47M. The marked chart high is $5.452. MA7 is $3.714, MA14 is $3.752 and MA28 is $3.883. Bollinger Bands show a middle line at $3.815, upper band at $4.110 and lower band at $3.520. RSI is 40.69. MACD shows DIF -0.123, DEA -0.137 and histogram +0.013. Volume is 276.87K, below both displayed volume averages. CURRENT MARKET DATA: At the time of checking on November 8, external market trackers place NEAR around $3.70–$3.71, slightly below the screenshot's $3.740. CoinGecko reports a market cap near $4.87B, approximately $255M in 24-hour volume and 1.311B circulating tokens. Its seven-day performance is around -15.7%, showing that selling pressure extends beyond the latest six-hour candles. FUNDAMENTALS: NEAR is a Layer-1 proof-of-stake blockchain designed for scalable applications, with sharding helping it handle network activity. Its broader direction now includes NEAR Intents, cross-chain transactions, Chain Signatures and private AI applications. An interesting recent development is the October upgrade allowing Chain Signatures operations to run inside trusted execution environments. This strengthens its cross-chain infrastructure, although product progress does not automatically translate into token price appreciation. TOKENOMICS: NEAR has approximately 1.311B tokens circulating, with essentially all reported supply unlocked. Its February 2026 tokenomics update introduced halved inflation, a live Intents fee mechanism and revenue-directed buybacks. This creates a potential connection between ecosystem usage and token demand, but actual revenue, buyback activity and ongoing issuance still matter. MACRO + MARKET: Bitcoin is around $75,850 and Ethereum around $2,237 in the available November 8 market snapshot. Both have weakened over the past week. That broader weakness matters because NEAR is an altcoin and may struggle to sustain a bounce while overall market sentiment remains cautious. NearStats +1 CHART + INDICATORS: The six-hour structure remains bearish, with lower highs and lower lows from the marked $5.452 high. Price is slightly above MA7 but remains below MA14, MA28 and the Bollinger middle line. RSI at 40.69 shows weak momentum, not an oversold condition. MACD's positive histogram of 0.013 suggests improving short-term momentum, but both main lines remain negative. Volume is also below its averages, so the bounce lacks convincing participation. TRADING SCENARIOS: For a bullish setup, I would wait for a six-hour close above $3.815 and a successful retest. Potential entry: $3.80–$3.85, SL: $3.70, TP1: $3.883, TP2: $4.110. Losing $3.70 would weaken this setup. For a bearish setup, a confirmed break below $3.622 followed by a failed retest could offer an entry around $3.60–$3.62. SL: $3.75, TP1: $3.520, TP2: $3.40. A reclaim of $3.75 would invalidate this short idea. These are conditional plans, not confirmed signals. MY TRADING PLAN: I wouldn't chase the current bounce. My first priority is watching whether $3.622 holds and whether buyers can reclaim $3.815 with stronger volume. Without either confirmation, staying out is a reasonable decision. What makes this setup interesting is the difference between NEAR's developing ecosystem and its weak price structure. The project is making progress, but the chart has not reflected that strength yet. I want to see buyers prove themselves before taking a position. $NEARUSDT #ByXIMPACT

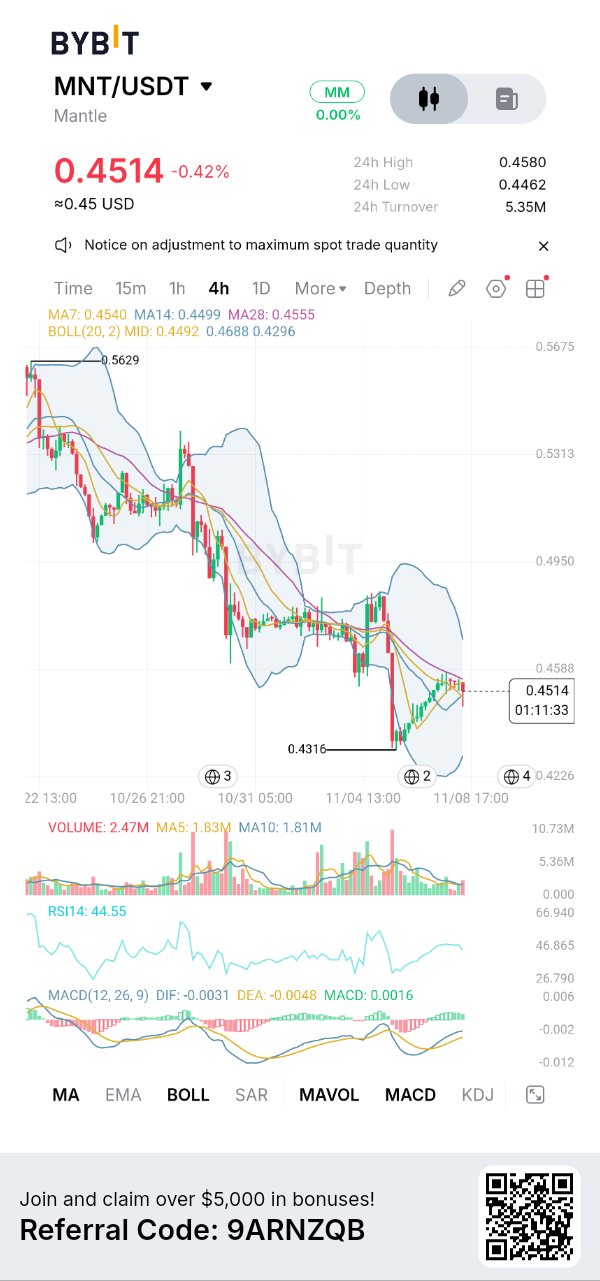
$MNTUSDT Mantle: Momentum Is Improving, but the Downtrend Still Needs to Be Challenged. What catches my attention on MNT is the difference between its short-term momentum and its broader price structure. Buyers have stepped in after the drop towards $0.4316, and momentum indicators are starting to improve. However, price has not yet established a convincing reversal. There is a bounce taking shape, but I don't see enough evidence to call it a trend change. WHAT I'M SEEING ON THE CHART The uploaded Bybit 4H chart shows MNT trading at $0.4514, down 0.42%. The visible 24-hour high is $0.4580 and the low is $0.4462. The chart also marks $0.4316 as the recent swing low. MA7 is $0.4540, MA14 is $0.4499 and MA28 is $0.4555. The Bollinger middle line is $0.4492, with upper and lower bands at $0.4688 and $0.4296. Current Market Data The latest available aggregated figures from the previous market check place MNT around $0.4518, with approximately $1.49B market capitalisation, $12.2M in 24-hour volume and 3.302B circulating tokens. These figures are separate from the exchange snapshot and may change with market conditions. Fundamentals Mantle is an Ethereum Layer-2 ecosystem focused on improving transaction scalability and supporting decentralised applications. Its ecosystem includes DeFi infrastructure, liquidity products and mETH-related services. What matters to me is whether this development produces consistent network activity, growing liquidity and genuine demand for MNT rather than attention alone. Tokenomics MNT has a maximum supply of approximately 6.219B tokens, with around 3.302B circulating. The remaining supply and treasury allocations deserve attention because future distributions can influence market supply. Ecosystem funding can support development, but I also want to see measurable adoption alongside token distribution. Network growth and token price appreciation are not automatically the same thing. Macro + Market Context Bitcoin and Ethereum remain important drivers of altcoin sentiment. The latest available readings placed BTC around $75,800 and ETH around $2,230. With broader market conditions still uncertain, I would be careful about treating an individual altcoin bounce as an independent bullish signal. Liquidity and overall risk appetite matter here. Chart & Indicator Analysis The 4H structure is still weak, with lower highs and lower lows dominating the broader visible move. RSI sits at 44.55, showing that momentum has improved but remains below the neutral 50 level. MACD histogram is positive at 0.0016, while DIF and DEA remain negative. This suggests an early momentum improvement rather than established bullish control. The $0.4555–$0.4588 area is the immediate resistance zone. A sustained move above it would improve the short-term picture. Below price, $0.4462 is the first important level, followed by $0.4316. Bullish Scenario I would consider a long only after a convincing 4H close above $0.4588 and a successful retest. The potential entry zone would be $0.4555–$0.4588, with a stop around $0.4490. My initial targets would be $0.4688 and then $0.4950. Failure to hold the reclaimed area would invalidate this idea. Bearish Scenario If MNT gets rejected around $0.4555–$0.4588 and subsequently loses $0.4462, sellers could regain control. A confirmed breakdown and failed retest could offer an entry around $0.4440–$0.4460, with a stop near $0.4590. The downside reference levels would be $0.4316 and $0.4296. My Personal Interpretation Why This Setup Matters I'm watching whether buyers can turn this bounce into a meaningful structural change. I don't want to enter simply because MACD has improved or because price has moved away from its recent low. I need confirmation through price, volume and a successful resistance reclaim. What makes this setup interesting is the disagreement between momentum and trend. If buyers manage to reclaim resistance, the short-term structure could improve. If they fail, this bounce may turn out to be temporary. For now, I prefer waiting for confirmation rather than taking a position in the middle of uncertainty. $MNTUSDT #ByXIMPACT

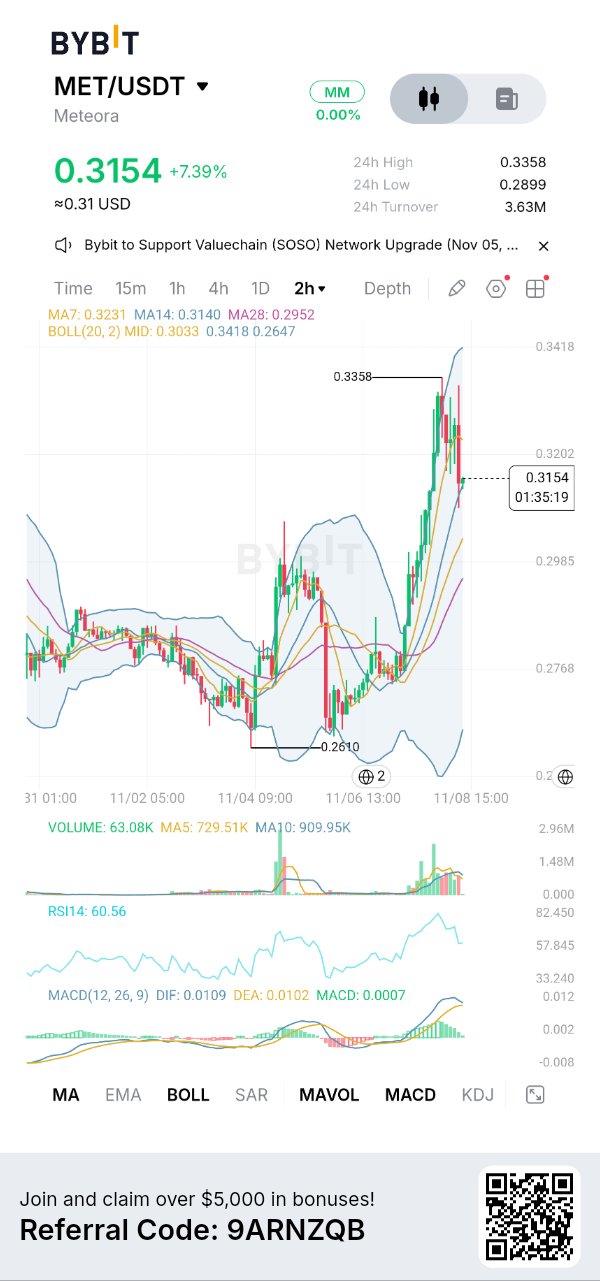
有趣的是,MET 曾大幅走高至 $0.3358,但最近的 K 線已從該高點回調。儘管短期的整體結構仍然正面,但即時動能已經冷卻。這就是我會區分正常回調與深度修正的地方。 上傳的 Bybit 圖表顯示 METUSDT 為 $0.3154,上漲了 7.39%。24 小時最高價為 $0.3358,最低價為 $0.2899。在 2 小時時間框架上,MA7 為 $0.3231,MA14 為 $0.3140,MA28 為 $0.2952。布林通道水平為上軌 $0.3418,中軌 $0.3033,下軌 $0.2647。RSI(14) 數值為 60.56。MACD 顯示 DIF 為 0.0109,DEA 為 0.0102,柱狀圖為 0.0007。成交量為 63.08K,低於 MA5 的 729.51K 和 MA10 的 909.95K。 當前市場數據:11 月 8 日的最新市場快照顯示 MET 約為 $0.3292,市值約為 1.8356 億美元,24 小時交易量為 6803 萬美元,流通代幣為 5.5758 億枚。根據 CoinGecko 報告,七天漲幅為 14.9%。由於即時市場價格與截圖中的 $0.3154 不同,因此這些並非同時刻的讀數。 基本面:Meteora 是一個基於 Solana 的流動性基礎設施協議。其 DLMM 池允許流動性提供者將資本集中在選定的價格範圍內,而 DAMM 池和動態聯合曲線(Dynamic Bonding Curve)產品則支援不同的交易和流動性需求。該項目背後有可觀的活動。DefiLlama 報告顯示其 TVL 約為 2.4896 億美元,30 天去中心化交易所(DEX)交易量為 37 億美元,30 天協議收入為 269 萬美元。然而,TVL 在過去一個月下降了約 18%。儘管交易活動旺盛,但這一跌幅值得關注。 代幣經濟學:MET 的最大供應量為 10 億枚代幣。約 56.5% 處於流通狀態,意味著未來仍有相當數量的供應釋出。下一次預定解鎖日期為 11 月 23 日,涉及約 722 萬枚 MET。分配份額包括生態系儲備和團隊代幣。這並不自動構成拋售訊號,但確實創造了一個值得監控的供應因素。Meteora 也報告稱,透過質押相關獎勵和由協議收入資助的代幣回購,將收益回饋給 MET 持有者。實際的分配及其一致性比單純擁有這些機制更重要。 宏觀與市場背景:比特幣目前約為 $75,800,七天內下跌約 2.9%,而以太幣(ETH)則在 $2,235 附近,週跌幅約 1.5%。比特幣市佔率接近 59%,顯示山寨幣並未獲得廣泛的市場領導地位。MET 的強勢值得注意,但它必須證明買盤能夠獨立維持這種態勢。 圖表觀察:2 小時圖顯示價格從明顯的 $0.2610 低點反彈,隨後強勢走向 $0.3358。在漲勢中出現了更高的低點,改善了短期結構。然而,最新的 K 線顯示在區間上緣附近遭到拒絕。以截圖中的 $0.3154 價格來看,目前處於 MA7 ($0.3231) 下方,但仍略高於 MA14 ($0.3140)。MA28 在 $0.2952 處,位置較低,保持了較寬鬆的短期建設性結構。眼前的問題是 $0.3140 能否守住。若跌破該水平,$0.3033 是重要的布林通道中軌參考點,其次是 $0.2952。在上行方面,$0.3231 是第一個收復水平,$0.3358 則是前高。 技術指標:RSI 為 60.56,雖然正面但已從近期高點冷卻。MACD 仍維持在零軸上方,DIF 0.0109 高於 DEA 0.0102。然而,較小的正值柱狀圖顯示動能正在減弱。布林通道擴張反映了波動性增加。我不會將這些數據解讀為確認立即出現另一次突破的訊號。 看漲情境:觸發條件:2 小時線確認收於 $0.3231 之上。入場:在成功回測後於 $0.3200–$0.3230 入場。止損(SL):$0.3130。第一目標(TP1):$0.3358。第二目標(TP2):$0.3418。持續收復該水平將顯示買方已重新奪回短期平均線並正在挑戰之前的拒絕區域。收盤低於 $0.3130 則會削弱此設定。 看跌情境:觸發條件:2 小時線收於 $0.3140 以下,隨後在回測時遭到拒絕。入場:$0.3110–$0.3140。止損(SL):$0.3235。第一目標(TP1):$0.3033。第二目標(TP2):$0.2952。這些目標對應布林通道中軌和 MA28。若能持續回升至 $0.3231 以上,將使此看跌觀點失效。 個人解讀:對我而言,Meteora 的協議活動與其代幣供應狀況之間的差異最為顯眼。該項目有可觀的交易量和收入,但 TVL 的下降和即將到來的解鎖可能會限制持續的需求。我不會追逐最初的漲勢。我的偏好是等待價格強勢突破 $0.3231 並伴隨足夠的成交量,或是觀察 $0.3140 是否失守,導致價格向下方支撐移動。關鍵問題在於,當整體市場仍然疲軟時,MET 是否能維持其相對強勢。 $METUSDT #ByXIMPACT

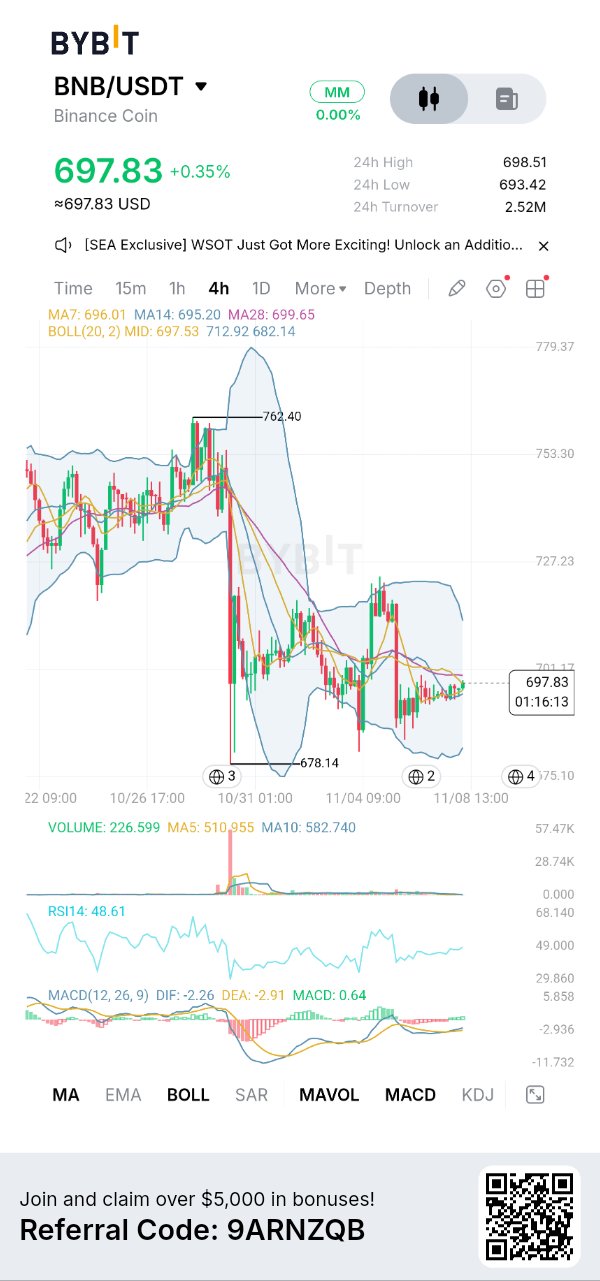
The interesting contradiction in $BNBUSDT 4H chart is that momentum is starting to improve while the overall price structure remains weak. RSI is near neutral at 48.61 and MACD histogram has turned positive, yet BNB is still struggling around $698–701 after failing to hold its bounce towards $720. Buyers are showing some interest, but they haven't proved they can take control. The next 4H move around $701 could reveal whether this is genuine buying strength or just another temporary pause in the downtrend. FACT The Bybit chart shows BNB at $697.83, up 0.35%, on the 4-hour timeframe. The visible 24-hour high is $698.51 and low is $693.42. The chart also shows a previous sharp sell-off from the $750 area, followed by a wick down to approximately $678.14. Since then, BNB has traded unevenly, with a bounce towards $720 that failed to hold. Price is now moving sideways around $697–698. This is consolidation after a major decline, not yet a confirmed trend reversal. CURRENT MARKET DATA As of November 8, current market feeds place BNB around $694–696, with a market capitalisation near $91.4 billion and circulating supply around 131.51 million BNB. Reported 24-hour volume varies between roughly $579 million and $1.19 billion across providers, so the source matters. Recent performance is mixed, with approximately 1% weekly weakness on CoinGecko. The current quote is slightly below the screenshot price. FUNDAMENTALS BNB is more than an exchange-related token. It powers BNB Smart Chain transactions, supports opBNB and Greenfield, and is used for network fees and governance. Ecosystem development remains relevant: BNB Chain's October updates included AI-agent infrastructure and payment integrations, while its November 3 node release schedules the Jenner upgrade for December 8. These developments matter if they translate into actual network usage, not simply announcements. TOKENOMICS BNB began with a 200 million supply and uses quarterly Auto-Burns alongside real-time gas-fee burns. Circulating supply is now around 131.51 million, with the long-term burn target of 100 million. This creates a gradual supply-reduction mechanism, although burns alone cannot guarantee price appreciation. Network demand remains important. MACRO + MARKET CONTEXT Bitcoin is around $75,730 and Ethereum near $2,236 in current market reporting, while overall sentiment remains fearful. The Fed maintained rates at 3.75–4% on October 28 and noted that inflation remains elevated. This is not an especially supportive backdrop for aggressive altcoin positions. CHART OBSERVATION 4H The important detail is the failed attempt near $720. Buyers managed to lift price, but sellers rejected that move and pushed BNB back into the $690–700 area. The visible $701.17 region is the first important overhead level. MA7 at $696.01 and MA14 at $695.20 are close to price, while MA28 at $698.65 remains slightly above it. This is a compressed structure, not a strong bullish trend. INDICATORS RSI14 is 48.61, showing neutral momentum. MACD DIF is -2.26, DEA -2.91 and histogram +0.64. The positive histogram suggests improving short-term momentum, but MACD remains below zero. Volume is 226.599K against MA5 of 510.955K and MA10 of 582.740K. Participation is relatively weak. Bollinger midline is $697.53, upper band $712.92 and lower band $682.14. KDJ is not visible. BULLISH SCENARIO Trigger: 4H close above $701.17. Entry: $699–702 after a successful retest. SL: $693. TP1: $712.92, TP2: $720. Invalidation: failure to hold the reclaimed $701 area. The retest matters because it would show buyers defending former resistance. BEARISH SCENARIO Trigger: 4H close below $693.42. Entry: $690–693 on a failed reclaim. SL: $701.50. TP1: $682.14, TP2: $678.14. Invalidation: price regaining $701.17 and holding above it. These downside levels matter because they represent the lower Bollinger region and the previous selling wick. PERSONAL INTERPRETATION My read is that BNB is trying to stabilise after a substantial decline, but the chart has not earned a bullish reversal label yet. I wouldn't chase the current price. I'm watching $701 first and $693 below. A convincing reclaim with stronger volume would make me consider a long; a breakdown would make me avoid buying too early. The interesting part is whether this tight range develops into genuine demand or simply becomes another pause before selling resumes. WHY THIS SETUP MATTERS BNB is at a decision point where a confirmed reclaim of $701 could improve short-term structure, while losing $693 may expose the previous lows. The next 4H candles and volume will matter more than a small price bounce. Educational analysis only not financial advice. $BNBUSDT #ByXIMPACT

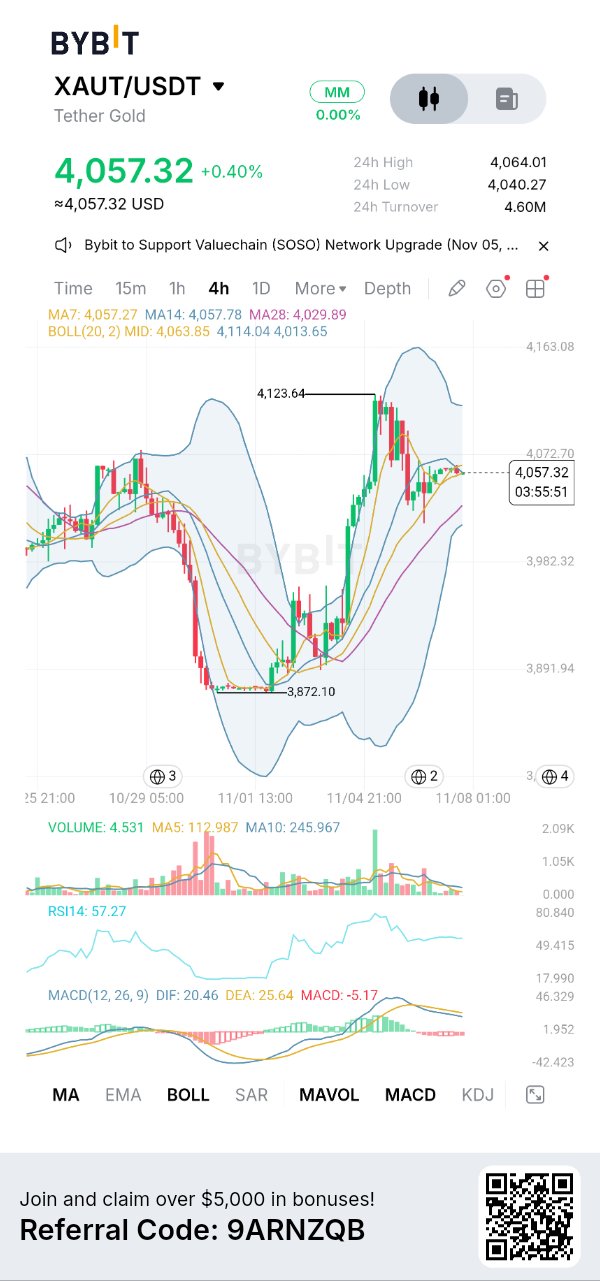
$XAUTUSDT 4小時分析:強勢反彈,在4,123美元處遭遇阻力,市場尚未選擇下一個方向。對我來說,價格結構與動能之間的矛盾非常突出。XAUT從3,872美元的低點大幅上漲,但在接近4,123美元時遭遇阻力,這使得短期動能冷卻。價格目前雖然保持在較長週期的移動平均線之上,但尚未令人信服地收復布林通道中軌。這並非確認的全新突破,我不認為近期的反彈足以證明下一波漲勢已經開始。 事實:上傳的Bybit截圖顯示,XAUT/USDT在4小時時間週期內價格為4,057.32美元。可見的24小時最高價為4,064.01美元,最低價為4,040.27美元,成交額為460萬美元。圖表標記了3,872.10美元的波段低點和4,123.64美元的後續高點。MA7為4,057.27美元,MA14為4,057.78美元,MA28為4,029.89美元。布林通道中軌、上軌和下軌分別為4,063.85美元、4,114.04美元和4,013.65美元。RSI(14)數值為57.27。MACD顯示DIF為20.46,DEA為25.64,柱狀圖為-5.17。 當前市場數據:研究時,CoinGecko報價顯示XAUT價格約為4,058.52美元,市值約為32.8億美元,24小時交易量為1.356億美元。其報告的七天表現為+4.7%。流通供應量約為80.9萬,總供應量約為82.74萬。各數據提供商的供應數據存在差異,因此不應將其視為相同的會計定義。截圖中的價格4,057.32美元略低於當前報價。CoinGecko +2 基本面與代幣經濟學:XAUT不同於傳統的加密貨幣項目。每個代幣代表對存放在瑞士金庫中的一金衡盎司實物黃金的所有權。其目的是透過區塊鏈基礎設施使黃金可轉讓且可交易。Tether 11月4日的報告指出,儲備金已達到827,417.63盎司,約25.7噸,並有1:1的背書。這標誌著代幣化黃金的採用取得了有意義的增長。沒有傳統的質押收益或挖礦發行;供應量隨黃金發行和需求而擴張。購買、贖回和交付條件也很重要。 宏觀+圖表觀察:這裡的主要驅動力是黃金,而不是普通的山寨幣輪動。最新的市場簡報顯示,黃金價格接近4,075美元,BTC約為75,954美元,ETH約為2,242美元。在評估XAUT時,黃金走勢、實際收益率和美元強弱比山寨幣情緒更值得關注。 在4小時圖上,從3,872.10美元到4,123.64美元的走勢強勁,但在高點處的阻力改變了眼前的形勢。價格目前在4,057美元附近盤整。MA7和MA14在當前價格附近幾乎持平,而4,029.89美元的MA28仍處於下方。4,063.85美元的布林通道中軌是直接阻力。4,013.65美元的下軌是一個重要的下行參考點。 指標:RSI在57.27,高於中性區域,但MACD柱狀圖為-5.17,且DIF低於DEA,顯示動能正在冷卻。與之前的擴張相比,成交量也相對平靜。這顯示的是盤整,而非確認的突破。 看漲情境:觸發點:4小時收盤高於4,064美元。進場:在成功回測後於4,064美元–4,080美元進場。止損(SL):4,028美元。目標1(TP1):4,114美元。目標2(TP2):4,123.64美元。失效:若持續跌破4,064美元則失效。 看跌情境:觸發點:4小時收盤低於4,029美元。進場:在回測失敗後於4,015美元–4,029美元進場。止損(SL):4,065美元。目標1(TP1):3,982美元。目標2(TP2):3,892美元–3,872美元。失效:若重新收復4,064美元則失效。 個人解讀:我對在這個區間中段追漲XAUT不感興趣。我想看看買方是否能收復4,064美元並建立向4,114美元邁進的動能,或者賣方是否會將價格推低至4,029美元以下。有趣的部分在於強勁的潛在黃金需求與疲軟的短期圖表動能之間的差異。這就是為什麼這個水位值得關注。比起僅僅因為之前的反彈看起來令人印象深刻而進場,我寧願等待確認信號。 $XAUTUSDT #ByXIMPACT

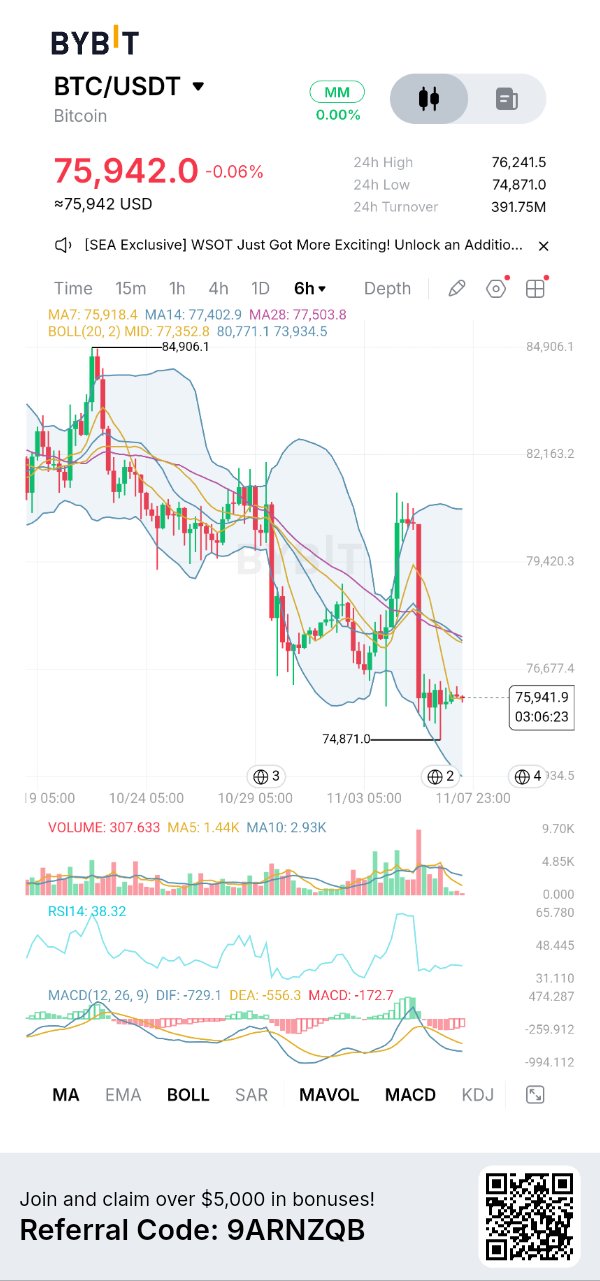
$BTCUSDT 突破失敗後的 7.5 萬美元支撐測試。比特幣的 6 小時圖顯示,價格在 8 萬美元區域遭遇強烈拒絕,隨後跌向 7.5 萬美元。價格已在低點附近企穩,但整體結構仍有利於賣方。重要的問題是 74,871 美元能否在下一次測試中守住。 圖表觀察:Bybit 顯示 BTC 價格為 75,942 美元,日內高點為 76,241 美元,低點為 74,871 美元。6 小時圖顯示高點不斷降低,8 萬美元附近的向上嘗試失敗,價格低於 MA7 (75,918 美元)、MA14 (77,403 美元) 和 MA28 (77,504 美元),儘管在截圖時刻僅略高於 MA7。RSI 處於 38.32,MACD 仍為負值,DIF 為 -729.1,DEA 為 -556.3。最近的 K 線實體較小,顯示出猶豫不決,而非確認買盤強勁。 當前市場數據:CoinGecko 最新報價約為 75,939 美元,與截圖接近。市值約為 1.527 兆美元,24 小時交易量約 218.2 億美元,流通供應量約 2010.9 萬枚 BTC。比特幣七日內下跌約 1.8%。這些數據為即時市場快照,可能會發生變化。 基本面與代幣經濟學:比特幣仍然是一個透過工作量證明 (Proof-of-Work) 挖礦保障安全的去中心化結算網絡。其投資邏輯的核心在於供應有限、抗審查的轉帳以及不斷增加的機構獲取渠道。供應上限為 2100 萬枚 BTC,目前每個區塊的新增發行量約為 3.125 BTC。沒有預定的投資者代幣解鎖或隨意的財政庫排放。挖礦獎勵和持有者拋售仍然是相關的市場供應來源。 宏觀與市場背景:ETF 資金流向和利率預期仍然很重要。CoinGecko 強調了最近的 ETF 資金流出以及科技行業情緒疲軟。聯準會 9 月的目標區間為 3.75–4.00%,儘管這並非其 11 月最新立場的確認。CoinGecko +1 更高的殖利率和更緊縮的流動性可能會使 BTC 持續承受壓力。 圖表與指標:77,350–77,500 美元區域是第一個有意義的收復區,布林通道中軌和較長週期移動平均線在此匯合。上軌接近 80,771 美元,下軌接近 73,934 美元。RSI 低於 50 且 MACD 動能為負,顯示賣方仍掌握控制權。近期拋售量的激增也使得小幅橫盤的 K 線不足以作為反轉的有力證據。 看漲情境:我會關注 6 小時線是否確認收於 76,700 美元上方,隨後進行成功的回測。若成交量改善,則可考慮在 76,700–76,900 美元附近進場,止損設於 75,800 美元下方,目標一 (TP1) 為 77,350 美元,目標二 (TP2) 接近 79,400 美元。進場後若跌破 75,800 美元,該設置將失效。 看跌情境:若 6 小時線收於 74,871 美元下方,隨後在 74,850–75,000 美元附近回測失敗,則看跌趨勢將延續。止損設於 75,600 美元上方,目標一 (TP1) 接近 73,934 美元,目標二 (TP2) 接近 72,800 美元。若價格持續收復並站穩 75,600 美元上方,該看跌觀點將失效。 個人解讀:我的看法是,BTC 在強烈拒絕後正於支撐位附近壓縮,並未建立確認的反轉走勢。我不會去追逐第一根陽線。我正在觀察買方是否能收復均線集群,或者另一次支撐測試是否會產生更強的賣壓。有趣的是,目前相對穩定的定價與依然疲軟的 6 小時結構之間存在對比。確認走勢比預測下一步更重要。 $BTCUSDT #ByXIMPACT
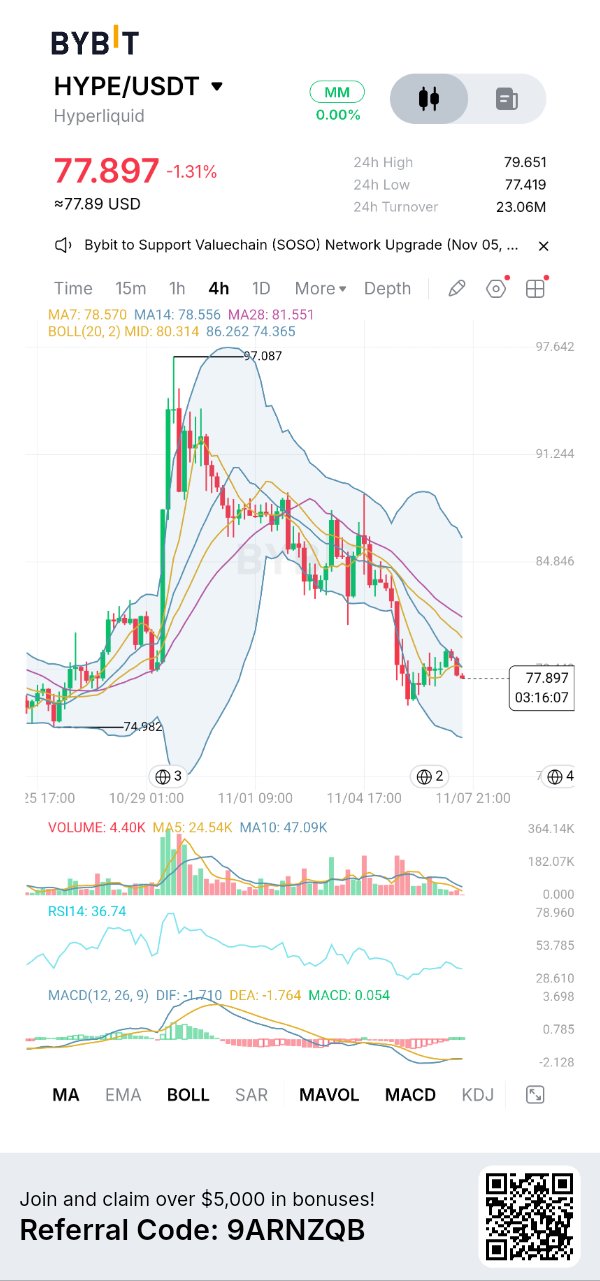
這張圖表最重要的一點是,$HYPEUSDT 在經歷了一波急跌後正試圖進行小幅反彈,但 4 小時線的整體結構仍然看跌。價格雖然已遠離近期低點,但仍低於圖上顯示的所有三條移動平均線。我不會將此次反彈視為趨勢反轉的確認訊號。 圖表觀察:Bybit 圖表顯示 $HYPEUSDT 在 4 小時線級別報價 $77.897,下跌 1.31%。可見的 24 小時高點為 $79.651,低點為 $77.419。圖表標示的前高約在 $97.087,前低約在 $74.982。圖表移動平均線分別為 MA7 $78.570、MA14 $78.556 和 MA28 $81.551。價格低於這三條均線。布林通道顯示中軌為 $80.314,上軌為 $86.262,下軌為 $74.365。RSI(14) 讀數為 36.74,顯示動能疲軟。MACD 顯示 DIF 為 -1.710,DEA 為 -1.764,柱狀圖為 0.054。顯示成交量為 4.40K,低於 MA5 的 24.54K 和 MA10 的 47.09K。 當前市場數據:截至 11 月 7 日,市場消息來源顯示 HYPE 價格在 $78–79 之間,市值接近 $190 億美元,24 小時交易量約為 $8 億美元。流通供應量約為 2.394 億,最大供應量為 10 億。報告的七天表現約為 -10.5%。這些即時數據與截圖中的 $77.897 價格有所出入。 基本面:Hyperliquid 是一個鏈上交易平台,提供永續合約、現貨市場及其自身的 Layer-1 基礎設施。其 HIP-3 框架允許獨立開發者推出包括大宗商品和股票相關合約在內的市場。據報導,HIP-3 活動已達到平台交易量的約 30%,顯示該生態系統正在擴展到加密原生市場之外。 代幣經濟學:HYPE 的最大供應量為 10 億。協議交易費用流向社群機制,包括自動購買並銷毀 HYPE 的「援助基金」(Assistance Fund)。質押也提供了驗證者參與資格和交易費用優惠。然而,預定的代幣釋放仍是供應面的一大考量,11 月 29 日還有另一次解鎖。 宏觀與圖表:比特幣近期跌破 $75,000 後反彈,但 BTC 和 ETH 的週線表現仍為負值。這種環境使得山寨幣難以維持強勁走勢。在 4 小時線圖上,關鍵問題在於 $97.087 附近受阻後的一系列更低高點。價格在急跌至 $75 後出現溫和反彈,但價格仍維持在 MA7、MA14 和 MA28 之下。$80.314 的布林通道中軌是另一個阻力參考點。RSI 處於 36.74,顯示動能較弱。MACD 柱狀圖轉為微弱正值,但僅憑此點不足以確認反轉。成交量仍低於兩條顯示的均線,因此買盤參與度仍需改善。 看漲情境:觸發條件:4 小時收盤價高於 $78.56。進場點:成功回測後在 $78.60–79.20 進場。止損 (SL):$76.80。目標價 1 (TP1):$80.31。目標價 2 (TP2):$81.55。收復移動平均線將是結構改善的第一個跡象。若價格回落至 $76.80 以下,此設定失效。 看跌情境:觸發條件:在 $78.55–80.31 區間受阻,隨後跌破 $77.41。進場點:回測失敗後在 $77.20–77.60 進場。止損 (SL):$80.50。目標價 1 (TP1):$75.00。目標價 2 (TP2):$74.36。失守近期低點將使價格下探至布林通道下軌區域。若能持續站穩 $80.31 以上,此情境將被削弱。 個人解讀:我對追逐這種反彈沒興趣。有趣的是,HYPE 是否能將其強大的生態活動轉化為持續的市場需求,同時克服疲軟的技術動能和未來的供應釋放壓力。與其僅因為 RSI 接近超賣區域而進場,我寧願等待價格明確收復 $80.31。如果跌破 $77.41,我會重新評估策略,而不是死守看漲觀點。 此設定為何重要:HYPE 正處於關鍵決策區,買方需要收復 $78.55–$80.31 才能改善 4 小時結構。否則,持續的拋壓可能會導致對 $77.41 和 $75 的再次測試。下一步走勢取決於買方能否克服這一阻力,或是賣方是否維持主導權。 $HYPEUSDT #ByXIMPACT

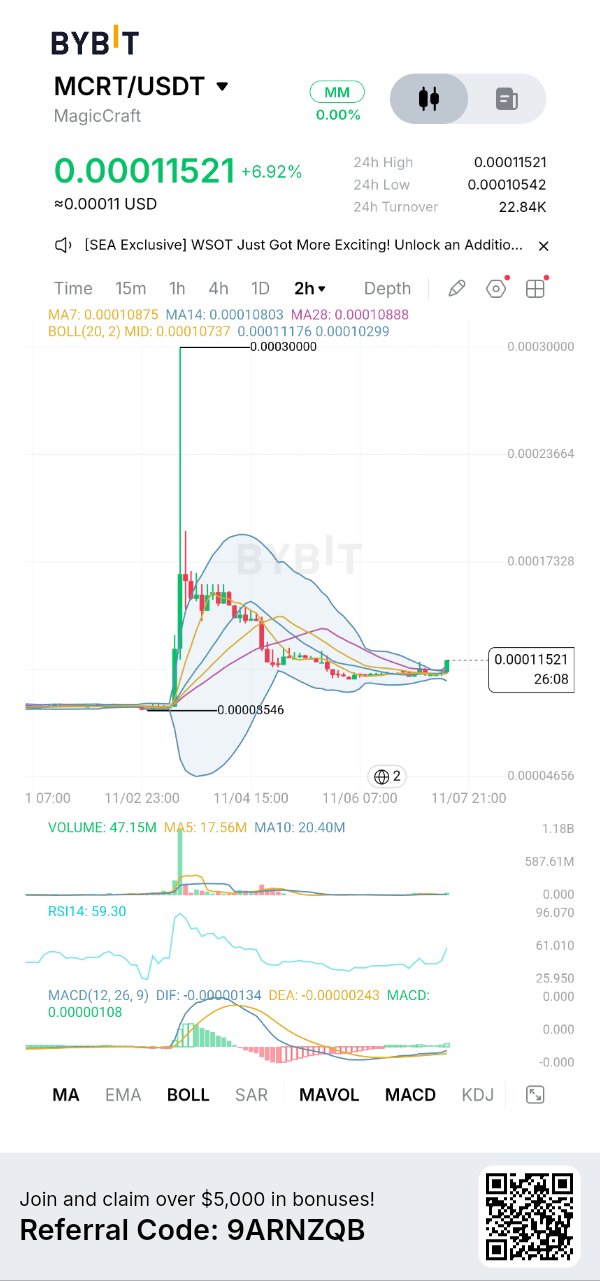
$MCRTUSDT A Sharp Move After Prolonged Weak Price Action. What makes this chart interesting is that MCRT spent several sessions trading in a narrow range after its initial listing spike, and now a fresh green candle has pushed price above the recent consolidation area. However, one strong 2-hour candle is not enough to establish a sustained uptrend. The important question is whether buyers can hold this move or whether price will fall back into its previous range. WHAT I'M SEEING ON THE CHART The uploaded Bybit chart shows $MCRTUSDT at $0.00011521, up 6.92%, on the 2-hour timeframe. The displayed 24-hour high is $0.00011521, the low is $0.00010542, and turnover is 22.84K. The chart shows an initial sharp spike toward $0.00030000, followed by a prolonged decline and consolidation. The marked chart low is $0.00008546. The latest candle is green and has moved above the recent tight trading range. Visible moving averages are MA7 at $0.00010875, MA14 at $0.00010803 and MA28 at $0.00010888. Bollinger middle is $0.00010737, upper band $0.00011176 and lower band $0.00010299. RSI(14) reads 59.30. MACD shows DIF -0.00000134, DEA -0.00000243 and a positive histogram of 0.00000108. Volume is 47.15M, above MA5 of 17.56M and MA10 of 20.40M. CURRENT MARKET DATA Current market listings show MCRT around $0.0001065, with approximately $536,940 market capitalization and $116,480 in 24-hour volume. CoinMarketCap reports 5.03B circulating tokens, 7.19B total supply and 10B maximum supply. These figures differ from the screenshot price of $0.00011521. There is also a supply-reporting discrepancy MagicCraft own website estimated 8.4B circulating on October 2. I would not treat these supply figures as interchangeable. FUNDAMENTALS MagicCraft is a blockchain gaming project focused on multiplayer MOBA gameplay. Its product includes competitive PvP battles and a PvE adventure system introduced in May 2026, with quests, bosses and cooperative gameplay. The relevant question is whether these products can attract and retain actual players. Gaming activity, player retention and token utility matter more than announcements alone. TOKENOMICS MCRT has a stated maximum supply of 10B, with allocations for gaming ecosystem growth, team, staking rewards, private investors and reserves. Official documentation states there is no token-burning mechanism. A third-party unlock tracker reports another 20M MCRT scheduled for November 21, followed by a final scheduled release in December. These releases are relatively small individually, but circulating-supply discrepancies make independent verification important. MACRO + MARKET CONTEXT Bitcoin has been trading around $75,000–$76,000, while Ethereum is around $2,240. Recent weekly performance has been weak across both assets. That matters because small gaming tokens can struggle to maintain breakouts when broader crypto liquidity is defensive. CHART & INDICATORS: On the 2H chart, MCRT has moved above its prolonged consolidation range with a fresh green candle. Price at $0.00011521 is above MA7 ($0.00010875), MA14 ($0.00010803) and MA28 ($0.00010888). RSI at 59.30 shows improving momentum, while MACD histogram has turned positive. Volume at 47.15M is also above its MA5 and MA10. However, the earlier spike toward $0.00030000 and subsequent decline show that this is still a fragile structure, not a confirmed long-term reversal. TRADING SCENARIOS Bullish setup: Trigger: A confirmed 2H close above $0.00011521, followed by a successful retest. Entry: $0.00011176–$0.00011521. SL: $0.00010542. TP1: $0.000130–$0.000140. TP2: $0.000160–$0.000173. The targets are approximate resistance zones inferred from the visible chart structure, not confirmed orders. A failed retest invalidates the setup. Bearish setup: Trigger: A 2H close below $0.00010542. Entry: $0.000105–$0.000108 on a failed reclaim. SL: $0.00011550. TP1: $0.00010299. TP2: $0.00008546. Losing the recent range would suggest the latest buying attempt has failed. PERSONAL INTERPRETATION I wouldn't chase this green candle. RSI at 59.30 and the positive MACD histogram show improving short-term momentum, while volume is notably higher than its averages. That is worth watching, but the token's earlier price spike also shows how quickly this market can move in both directions. I'm watching whether $0.00011176 becomes support and whether buyers can defend $0.00010542. If price holds above these levels, I would consider a confirmed breakout entry. If it falls back into consolidation, I would rather stay out. The part I find interesting is the difference between a genuine increase in gaming adoption and a short-lived exchange-driven price move. MCRT needs both sustained product activity and stronger market participation. Until the chart confirms that demand, I see this as a developing short-term setup, not an established trend. Educational analysis only not financial advice. $MCRTUSDT #ByXIMPACT

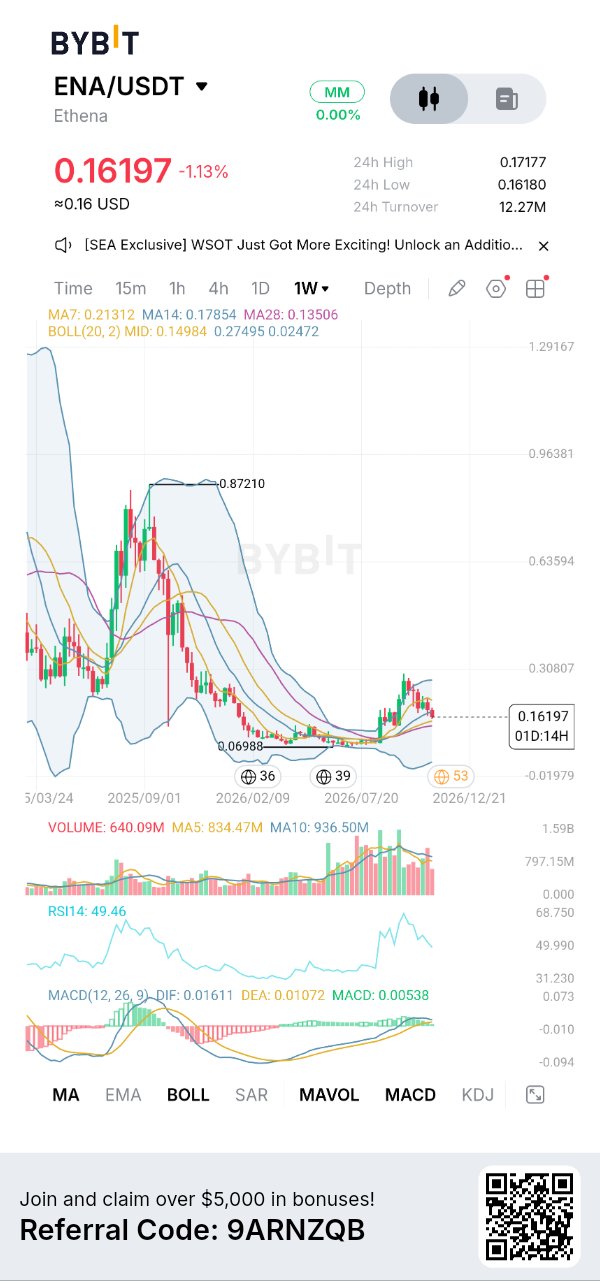
一個有趣的矛盾是,ENA 的價格已經高於其長期底部,但週線圖尚未顯示出確認的看漲趨勢。價格目前在 28 週移動平均線上方交易,但仍低於 7 週和 14 週移動平均線。這使得市場處於混合結構,而非確認的反轉走勢。 上傳的 Bybit 圖表顯示 $ENAUSDT 在 1W 時間週期下價格為 $0.16197,下跌 1.13%。可見的 24 小時高點為 $0.17177,低點為 $0.16180。週線圖顯示了從標記的 $0.87210 高點到 $0.06988 低點的重大歷史跌幅,隨後經歷了漫長的築底和近期的上漲。可見指標顯示 MA7 為 $0.21312,MA14 為 $0.17854,MA28 為 $0.13056。RSI(14) 為 49.46。MACD 顯示 DIF 為 0.01611,DEA 為 0.01072,直方圖為 0.00538。布林通道顯示中線為 $0.14984,上軌為 $0.27495,下軌為 $0.02472。可見成交量為 6.4009 億,低於其 MA5 的 8.3447 億和 MA10 的 9.3650 億。 目前市場數據:今天 ENA 價格約為 $0.1644,市值約為 22.2 億美元,24 小時成交量為 2.8852 億美元,流通量為 135 億,總供應量為 150 億。近期表現依然疲軟:有市場消息稱七日跌幅為 14.69%,月跌幅為 27.19%。即時報價與截圖中的 $0.16197 略有不同。CoinMarketCap +1 基本面:Ethena 是一個圍繞 USDe 構建的 DeFi 協議,這是一種旨在通過加密抵押品和抵銷衍生品頭寸來維持掛鉤的合成美元。其生態系統還包括 sUSDe 以及與借貸平台的整合。近期的發展包括 Ethena Pay、Aave V4 整合以及更廣泛的 USDe 分發。這些發展很重要,因為實際的穩定幣使用率和協議收入比單純的關注度更有意義。 代幣經濟學:ENA 的最大供應量為 150 億。據報導約 90% 為流通量,因此稀釋問題仍然相關。重要的發展是已批准的費用轉換提案,該提案可在達到特定 USDe 供應里程碑後,將高達 95% 的協議淨收入用於 ENA 回購。這創造了一種潛在的價值獲取機制,但不應將其與保證的買入壓力混為一談。CoinMarketCap +1 宏觀 + 市場背景:更廣泛的市場並未提供強勁的推動力。比特幣近期跌破 76,000 美元,以太坊也面臨拋售壓力。現貨加密貨幣 ETF 的資金流出和更廣泛的風險降低影響了市場情緒。聯準會於 10 月 28 日將目標利率維持在 3.75–4.00%。這種環境使得較小的 DeFi 代幣在沒有獨立需求的情況下更難維持漲勢。 圖表 + 指標:我對週線結構的解讀是,ENA 仍處於從長期下跌中恢復的階段,但尚未建立確認的高時間週期上升趨勢。近期向 $0.27 區域的反彈遭遇了阻力,價格已回調至 $0.16 附近。$0.1498 的布林中線是一個重要的近期參考。跌破該位置後,$0.1306 的 MA28 變得重要。在上行方面,$0.1785 的 MA14 和 $0.2131 的 MA7 是首要的主要障礙。RSI 為 49.46,處於中性,並非強勁的看漲動能。MACD 保持正值,DIF 高於 DEA,但直方圖相對較小。成交量也低於顯示的兩條成交量平均線。這表明買盤動能需要確認。 看漲情境:觸發條件:週線收於 $0.1785 以上。入場:成功回測後在 $0.178–0.185。停損:$0.159。目標價 1:$0.213。目標價 2:$0.275。收復移動平均線將提供買方重新獲得控制權的證據。在入場區下方被拒絕則該設置失效。 看跌情境:觸發條件:週線收於 $0.1498 以下。入場:在無法收復的情況下於 $0.145–0.150。停損:$0.163。目標價 1:$0.1305。目標價 2:$0.10。跌破將暴露更低的交易區間。持續收復 $0.163 以上則削弱此看跌設置。 個人解讀:對我而言,Ethena 不斷擴大的產品生態系統與 ENA 尚未穩定的圖表結構之間的差異非常突出。我發現這一點很有趣,因為協議採納率與代幣需求並不自動等同。我不會在當前水平追漲 ENA。我正在觀察 $0.1498 是否能守住,以及買方能否以更強的成交量收復 $0.1785。在此之前,耐心比假設近期反彈將持續更合理。下一個有意義的走勢應該來自於確認,而不是預期。 $ENAUSDT #ByXIMPACT

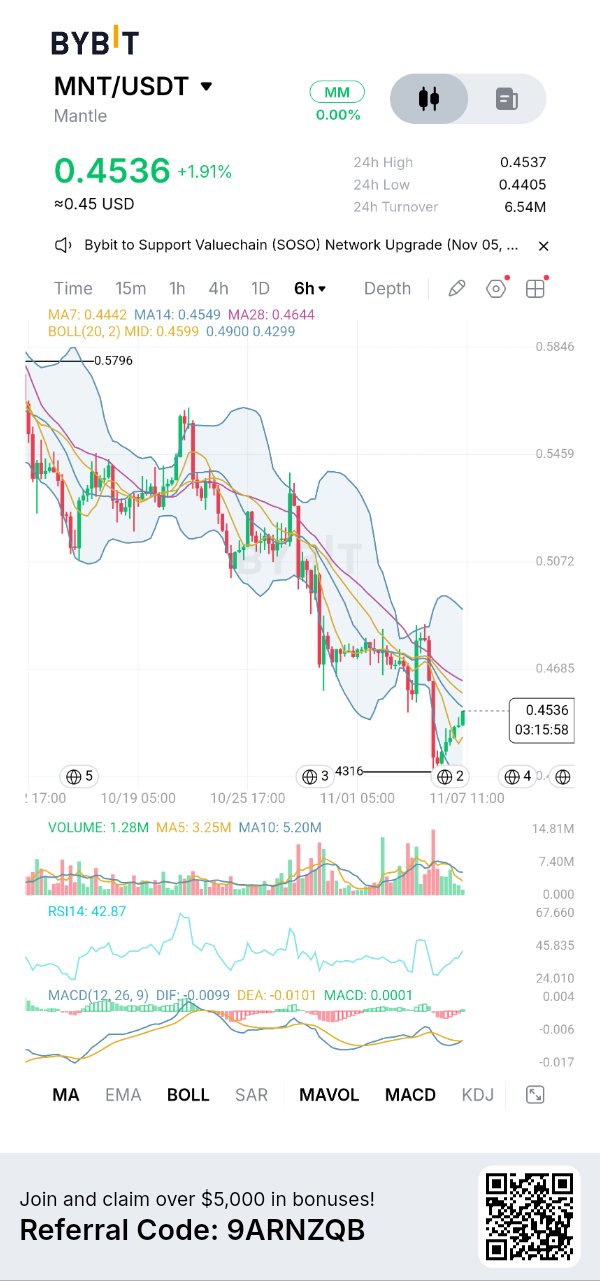
$MNTUSDT 重要測試在於買方能否重回失守的價格區間。MNT 在 6 小時線圖上的交易價格為 0.4536 美元。值得注意的是,價格已跌破此前的交易區間,目前正艱難地試圖重回多條移動平均線所在的區域。圖表顯示價格從 0.5796 美元處下跌,隨後出現了朝 0.4316 美元方向的劇烈拋售。最新的 K 線正在向上移動,但整體結構仍顯示為高點在降低。 圖表記錄顯示 MA7 為 0.4442 美元,MA14 為 0.4549 美元,MA28 為 0.4644 美元。布林通道中軌為 0.4599 美元,上軌和下軌分別為 0.4900 美元和 0.4299 美元。RSI 為 42.87。MACD 直方圖為 0.0001,DIF 為 -0.0099,DEA 為 -0.0101。成交量為 128 萬,低於 325 萬的 MA5 和 520 萬的 MA10。 當前市場數據:截至 11 月 7 日,MNT 交易價格約為 0.4483 美元,市值近 14.8 億美元,24 小時成交量約為 1870 萬至 2050 萬美元,流通供應量為 33 億,最大供應量為 62.2 億。實時報價略低於截圖時的價格。 基本面:Mantle 正超越傳統的以太坊 Layer-2 網絡進行發展。其目前重心包括代幣化股票、機構投資產品、穩定幣和 DeFi。其第三季度報告記錄了約 67,500 筆日交易量,並擴展了 Mantle Vault、OpenStock 和 USDG 的整合。nansen.ai +1 代幣經濟學:MNT 提供網絡 Gas 費、治理和生態系統效用。約 53% 的最大供應量處於流通中。剩餘的份額分配使得國庫管理和未來分配成為重要的供應因素。目前沒有列出即將到來的懸崖式解鎖,儘管國庫的動向仍值得關注。 宏觀背景:10 月份美國就業報告顯示新增 165,000 個就業崗位,高於預期,同時國債收益率上升。這可能使投機性資產對流動性狀況更加敏感。 圖表觀察:直接的測試區間在 0.455 至 0.465 美元之間,MA14、MA28 和布林通道中軌在此處構成阻力。若突破該區間,0.4685 美元將成為下一個重要區域。下行方面,0.4405 美元是附近的支撐位,其次是 0.4316 美元。在價格收復移動平均線簇之前,更廣泛的結構依然疲軟。 指標:RSI 處於 42.87,仍低於 50。MACD 直方圖幾乎為正,但兩條主要線仍為負值。低於平均水平的成交量也限制了對近期上漲趨勢的信心。 交易情境: 看漲:觸發條件:6 小時線收盤於 0.4644 美元上方,且伴隨更強的成交量。入場:回測後在 0.460 至 0.464 美元區間。止損:0.453 美元。目標價 1:0.4685 美元。目標價 2:0.4900 美元。第一個目標測試之前的價格阻力位,而第二個目標接近布林通道上軌。失效條件:未能維持在 0.453 美元上方。 看跌:觸發條件:在 0.460 至 0.464 美元附近遭到拒絕,隨後跌破 0.4405 美元。入場:回測失敗後在 0.440 至 0.444 美元區間。止損:0.455 美元。目標價 1:0.4316 美元。目標價 2:0.4299 美元。失效條件:持續重回 0.4644 美元上方。 個人解讀:我並不打算僅僅因為價格從近期低點回升就買入。我的注意力集中在 0.4644 美元水平。如果 MNT 能伴隨顯著成交量收復該位置,我會考慮在確認後建立多頭倉位。如果它繼續在此區域下方受阻,我寧願保留資本,而不是預測反轉。 為什麼此設置很重要:Mantle 向代幣化金融產品的擴展為其提供了不同的增長機會,但生態系統的發展最終必須轉化為實際的網絡使用率和對 MNT 的需求。目前的圖表正在測試買方是否能守住近期的拋售區域並重新獲得控制權。這種區別比當前的百分比漲幅更為重要。 $MNTUSDT #ByXIMPACT

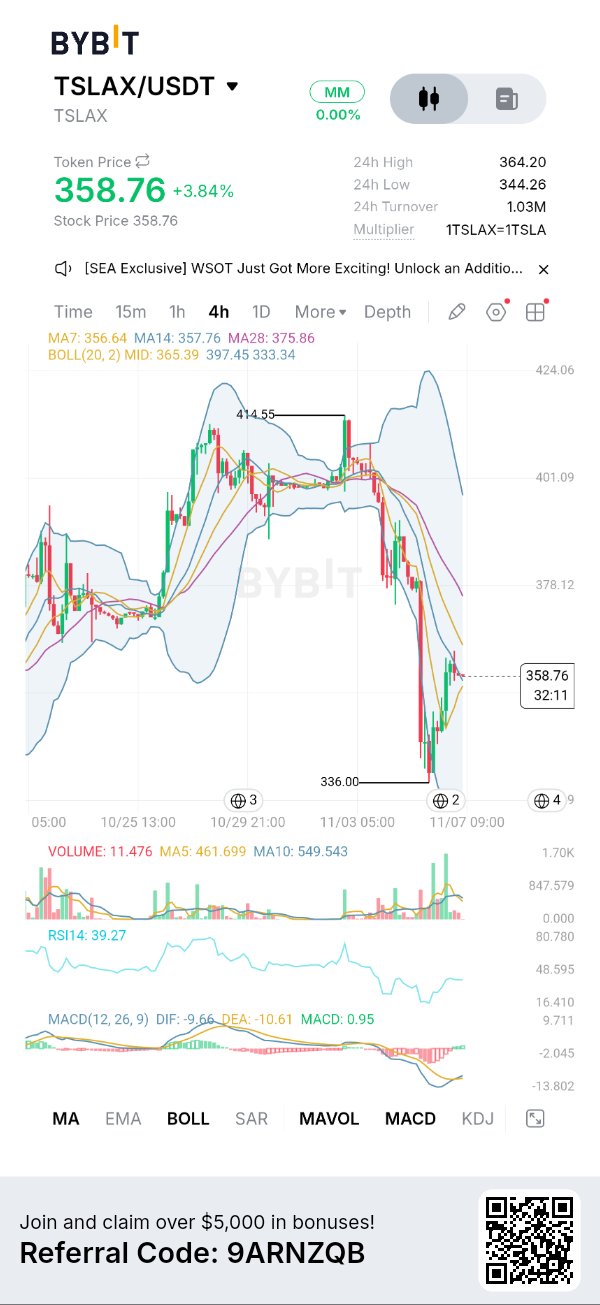
$TSLAxUSDT 出現急劇拋售,隨後的反彈仍需確認。值得注意的是,最新反彈與 4 小時結構已遭到的破壞之間存在缺口。TSLAx 目前交易價格為 358.76 (+3.84%),此前從標記的 414.55 高點跌至 336.00。買方已在低點附近介入,但價格尚未收復關鍵的移動平均線和布林通道阻力區。目前這只是下跌結構內部的反彈,而非已確認的趨勢反轉。 圖表顯示 24 小時高點為 364.20,低點為 344.26,成交量為 103 萬。MA7 為 356.64,MA14 為 357.76,MA28 為 375.86。布林通道水平為 365.39(中軌)、397.45(上軌)和 333.34(下軌)。RSI 為 39.27。MACD 顯示 DIF -9.66,DEA -10.61,柱狀圖 +0.95。 當前市場數據:截至 11 月 7 日,Bybit 報告 TSLAX 約為 359.03 美元,而截圖中為 358.76 美元。市值約為 6,629 萬美元,24 小時成交量為 1,147 萬美元,流通供應量為 18.464 萬代幣。報告總供應量為 58.433 萬,未列出固定最大供應量。特斯拉基礎股票於 11 月 6 日收於 358.22 美元。由於代幣化股票可以在常規股市交易時間之外進行交易,因此預期會出現微小差異。 基本面:TSLAx 不是傳統的加密貨幣項目。它是特斯拉股票的代幣化代表,由 Backed Assets (JE) Limited 發行。每個代幣旨在與標的股票 1:1 掛鉤,讓合規持有人能夠通過區塊鏈網絡獲得特斯拉的價格敞口。特斯拉 2026 年第三季度交付量達到 486,532 輛,能源存儲部署量達到 13.7 GWh。然而,季度營收為 280 億美元,營業收入同比下降 56%。 代幣經濟學:這裡沒有傳統的挖礦、質押獎勵或原生代幣銷毀機制。供應量通過標的股票的發行和贖回進行調整。發行人描述了 1:1 的抵押和獨立託管。持有人獲得的是經濟敞口,而非特斯拉股東投票權。發行和贖回費用最高可達 0.50%,並可能引入每年最高 0.25% 的管理費。 宏觀背景:美國最新的就業報告顯示新增就業人數 16.5 萬,增強了對聯準會政策收緊的預期。美元走強,國債收益率上升。對於 TSLAx 而言,美股情緒和特斯拉自身的表現比 BTC 或 ETH 的走勢更具直接影響。 圖表觀察 (4H):圖表顯示從 414.55 美元急劇下跌至 336 美元,隨後反彈。價格仍低於 375.86 美元的 MA28 和 365.39 美元的布林通道中軌。直接阻力區為 364–366 美元,其次是 378.12 美元。支撐位在 344.26 美元左右,然後是 336 美元。 指標:RSI 處於 39.27,仍低於中性水平 50。MACD 柱狀圖已轉為正值 0.95,儘管 DIF (-9.66) 和 DEA (-10.61) 仍為負值。這表明拋售動能正在減弱,但缺乏看漲確認。價格也低於 397.45 美元的布林通道上軌阻力。 交易情境 看漲情境:我希望看到的第一個條件是 4 小時蠟燭圖令人信服地收於 365–366 美元上方,最好有更強的買入量支撐。在 364–366 美元左右的入場只有在成功回測後才合理,而不是在第一次上漲時追高。初始止損 (SL) 將設為 356 美元,即短期移動平均線區域下方。目標價 1 (TP1) 為 375.86 美元,MA28 在此處會構成重要的阻力測試。如果買方收復該水平並保持動能,TP2 則為 397.45 美元,接近布林通道上軌。失效點來自於收復失敗後持續跌破 356 美元。我不會將短暫衝上 366 美元視為充分的確認。 看跌情境:如果價格在 364–366 美元附近受阻,隨後失守 356 美元,拋售壓力可能會回歸。在 354–356 美元附近的回測失敗將提供一個可能的入場區,止損 (SL) 設在 366 美元左右。TP1 為 344.26 美元(即 24 小時可見低點),而 TP2 為 336 美元(即前一個波段低點)。這些水平很重要,因為破位將表明買方未能捍衛近期的反彈。失效點將是放量持續收復 366 美元上方。如果價格保持在 356 到 366 美元之間,我寧願等待也不會強行操作任何方向。 個人解讀:我不會追逐這次反彈。我想觀察買方是否能收復 365 美元並最終挑戰 375.86 美元。若無此表現,更廣泛的拋售結構依然有效。 為什麼此設置很重要:這很有趣,因為該代幣將特斯拉的傳統股票表現與基於區塊鏈的交易接入結合在了一起。接下來的走勢將表明買方是否願意吸收之前的拋售壓力,或者這次反彈僅僅是暫時的緩解。我對確認信號的興趣大於試圖捕捉精確的底部。 $TSLAXUSDT #ByXIMPACT

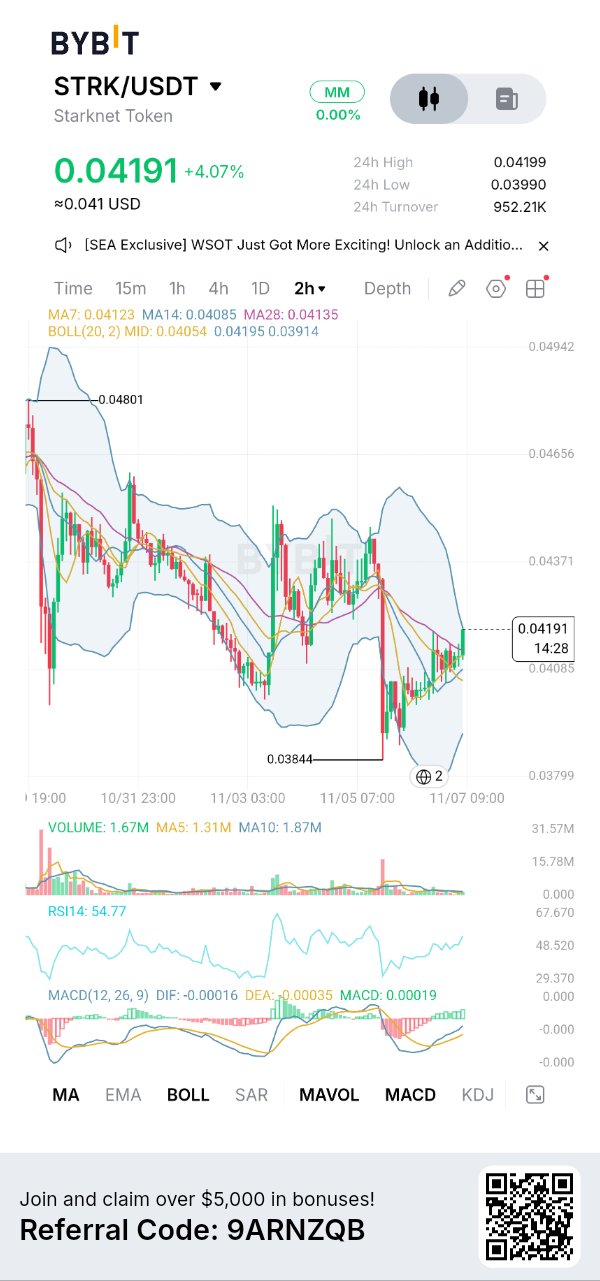
$STRKUSDT Buyers Are Regaining Short-Term Momentum, But the Bigger Trend Has Not Fully Turned. The interesting part of this chart is that STRK is showing improving short-term momentum after a sharp drop, but it is still trading inside a broader declining structure. On the 2-hour timeframe, price is $0.04191, up 4.07%, after reaching the marked low of $0.03844. The bounce is real, but it has not yet established a higher-timeframe trend reversal. WHAT I'M SEEING ON THE CHART The visible moving averages are MA7 at $0.04123, MA14 at $0.04085 and MA28 at $0.04135. Price is currently above all three, which supports the short-term buying case. Bollinger middle band is $0.04054, with the upper band at $0.04195 and lower band at $0.03914. RSI is 54.77, showing moderate positive momentum. MACD histogram is positive at 0.00019, while DIF remains below zero. Volume is 1.67M, above MA5 of 1.31M but below MA10 of 1.87M. This is improving momentum, not yet overwhelming buying pressure. CURRENT MARKET DATA The latest November 7 market snapshot puts STRK near $0.0412, with approximately $316M market cap and $27.2M 24-hour volume. Circulating supply is around 7.66B, against reported total supply of 10.18B. Price is up roughly 1.9% over 24 hours but down 7.3% over seven days and 16.7% over 30 days. The latest quote is below the screenshot's $0.04191. FUNDAMENTALS Starknet is an Ethereum Layer-2 scaling network using STARK-based zero-knowledge proofs. Its newer developments include STRK20 privacy features, private USDC transfers and strkBTC, bringing Bitcoin into Starknet DeFi. However, adoption still needs to translate into sustained economic activity. Current TVL is around $35.7M, stablecoins $35.1M and daily network fees approximately $1,783. TOKENOMICS AND MACRO: STRK supports network fees, governance and staking. Validators need 20,000 STRK, while delegators have no minimum. Staking rewards involve newly minted tokens, so supply expansion matters. There is also an upcoming unlock, but providers disagree: CoinGecko lists November 15 at 127M STRK, while another tracker lists November 20 at 175.4M. I would verify the official schedule before trading around it. Macro conditions remain difficult for altcoins. Bitcoin has traded near $75,800 amid ETF outflows, while stronger US employment data pushed Treasury yields higher. That creates a less supportive environment for speculative positions. CHART OBSERVATION (2H) STRK is showing a short-term bounce from $0.03844, but the broader structure still carries lower highs and previous selling pressure. Price at $0.04191 is above MA7 ($0.04123), MA14 ($0.04085) and MA28 ($0.04135), indicating improving short-term structure. However, $0.0420 is immediate resistance. A rejection could bring price back towards $0.04054, while a stronger breakout could open the way towards $0.0437. The next major resistance is around $0.0465. INDICATORS RSI at 54.77 shows moderate bullish momentum, not an overbought condition. MACD histogram is positive at 0.00019, suggesting improving momentum, although DIF remains slightly negative. Volume is 1.67M, above MA5 (1.31M) but below MA10 (1.87M), meaning buying activity is improving but confirmation is still limited. Bollinger Bands place price close to the upper band at $0.04195, making resistance important here. TRADING SCENARIOS: Bullish: Trigger: 2H close above $0.0420 with stronger volume. Entry: $0.0418–$0.0421 after retest. SL: $0.0405. TP1: $0.0437. TP2: $0.0465. Invalidation: failure to hold the breakout. Bearish: Trigger: rejection near $0.0420 followed by a break below $0.0405. Entry: $0.0404–$0.0406 on failed retest. SL: $0.0420. TP1: $0.03914. TP2: $0.03844. Invalidation: sustained reclaim above $0.0420. PERSONAL INTERPRETATION I'm interested in whether buyers can turn this short-term improvement into a sustained move. I wouldn't chase directly into $0.0420 because that is already a nearby resistance area. I want confirmation through a strong candle close and a successful retest. WHY THIS SETUP MATTERS The bigger question is whether STRK can build demand while its ecosystem develops and additional tokens enter circulation. A breakout would suggest buyers are absorbing supply despite the broader market pressure. A rejection would show that short-term momentum alone is not enough to change market structure. That's the distinction I'm watching before committing to a trade. $STRKUSDT #ByXIMPACT

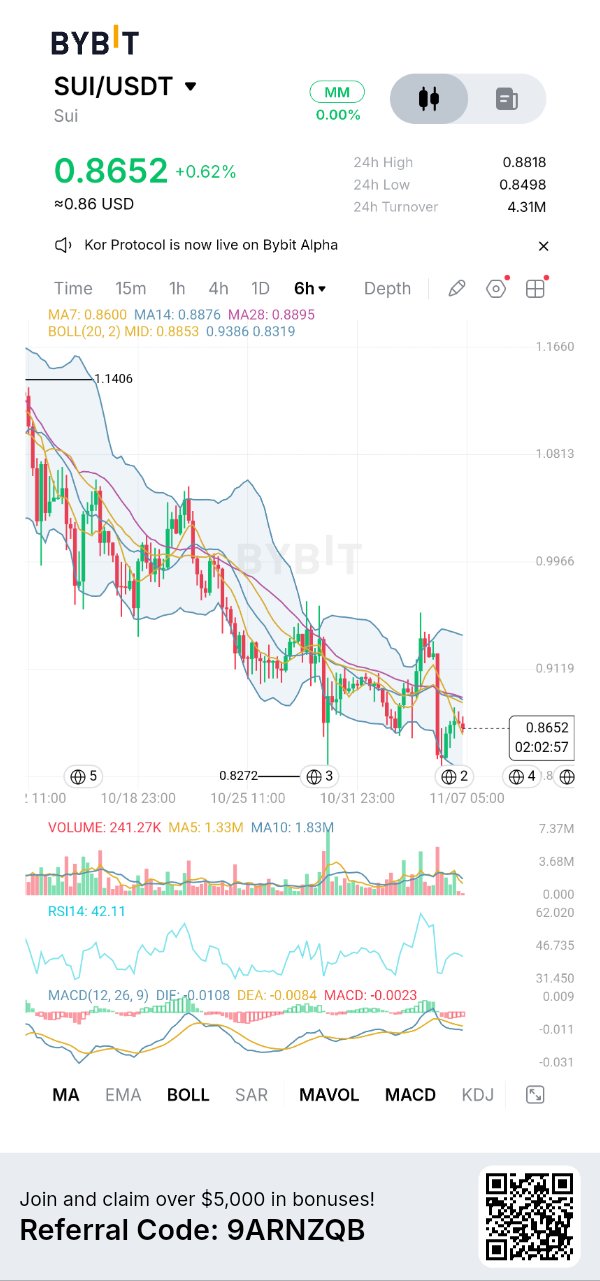
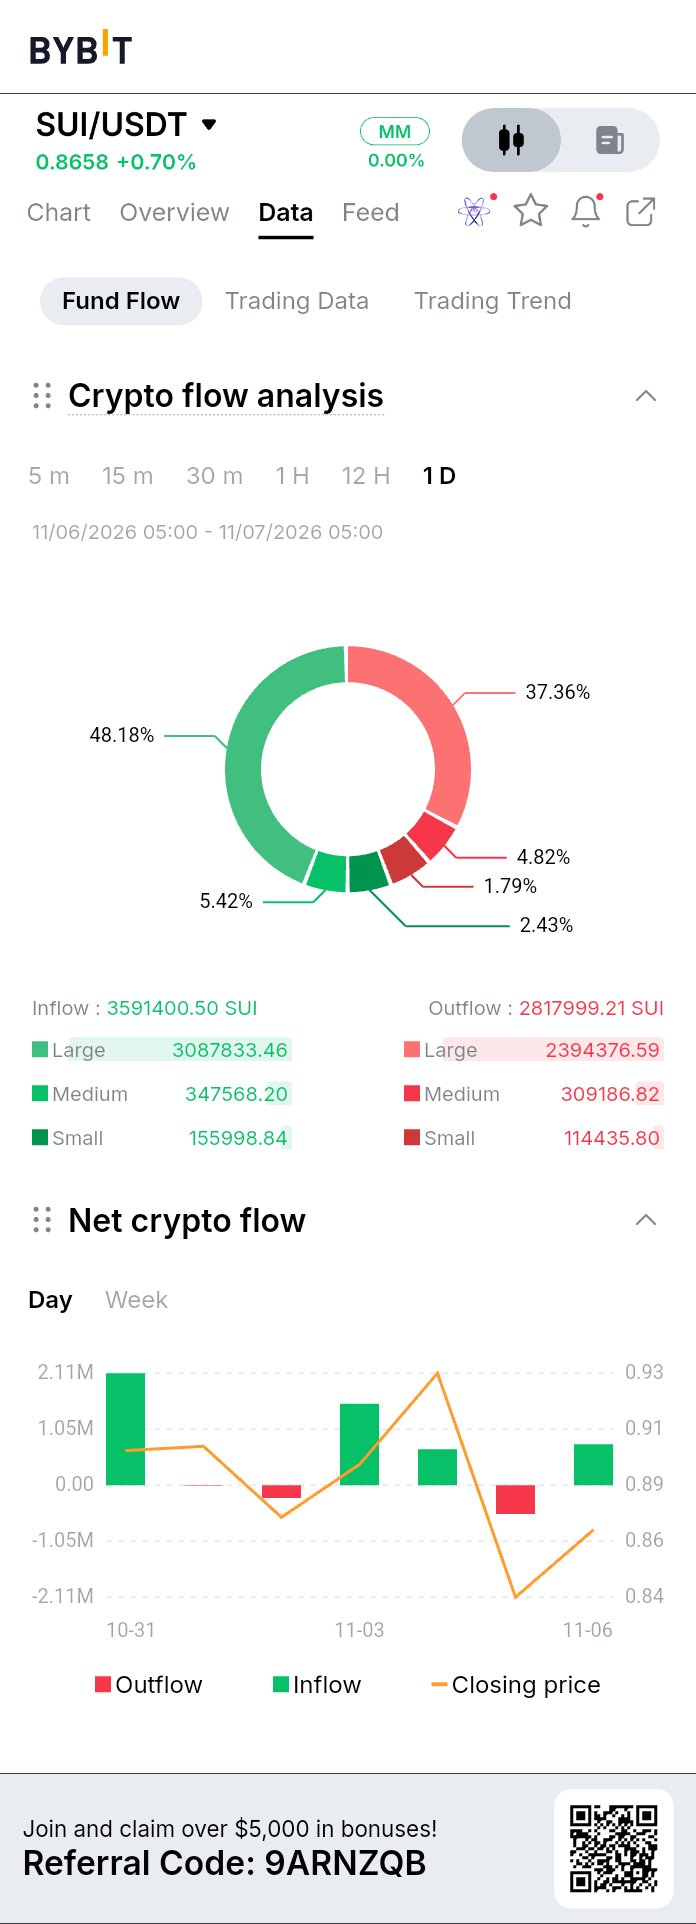
$SUIUSDT 儘管出現反彈,下跌趨勢依然完好。我首先注意到的是 SUI 最近的反彈與其 6 小時大格局之間的矛盾。價格目前在 $0.8652 徘徊,但圖表顯示在從約 $1.14 下跌後,仍呈現出一系列更低的高點和更低的低點。標記出的低點為 $0.8272。最近向 $0.93 區域的波動遭到拒絕,價格已回落。這並非趨勢反轉的確認;賣方仍佔優勢。 **圖表觀察** 圖表顯示 MA7 位於 $0.8600,MA14 位於 $0.8876,MA28 位於 $0.8895。布林通道中軌為 $0.8853,上軌為 $0.9386,下軌為 $0.8319。RSI 為 42.11,而 MACD 略呈負值。顯示的交易量為 241.27K。這些讀數表明動能疲軟,而非看漲趨勢的確認。 **當前市場數據** 截至 11 月 7 日,SUI 交易價格約為 $0.87(截圖中為 $0.8652)。市值約為 36 億美元,24 小時交易量約為 2.8 億至 2.95 億美元,流通供應量約為 41.4 億(總量 100 億)。日線表現略微正向,但周線趨勢仍為負向,約為 3.5-4%。截圖與即時報價之間的差異屬於正常的市場波動,並非圖表歷史讀數的變化。 **基本面** Sui 是圍繞 Move 編程語言和基於對象的數據模型構建的 Layer-1 區塊鏈,專為高效交易和並行執行而設計。其相關性源於支付、DeFi、遊戲和代幣化資產。最近的發展包括 Samsung Wallet 的 USDC 整合(目標市場為 8200 萬台美國 Galaxy 設備),以及機構和現實世界資產基礎設施的擴展。這些是有意義的採用機會,儘管僅靠合作夥伴關係並不能保證對 SUI 的需求。 **代幣經濟學與宏觀環境** SUI 的最大供應量固定為 100 億。它用於 Gas 費、質押、流動性和治理。目前流通量僅約 41.4%,因此未來預定的釋放仍是重要的供應考量。質押可以減少可自由流通的供應,但不能消除解鎖帶來的稀釋。更廣泛的市場也不太支持。比特幣最近面臨 ETF 資金流出和槓桿清算。強勁的美國就業數據推高了國債收益率和美元,增加了市場對聯準會更緊縮政策的預期。這種環境可能會限制山寨幣的投機性買盤。目前的網絡數據顯示,DeFi TVL 約為 4.41 億美元,穩定幣為 5.07 億美元,穩定幣價值在過去七天內上漲了約 18%。這對生態系統活動而言是令人鼓舞的,儘管 TVL 仍遠低於其先前的高點。 **圖表與指標** 重要的阻力位在 $0.885–$0.890,均線和布林通道中軌在此匯合。價格仍低於該區域。RSI 為 42.11,低於中性水平 50,且負值的 MACD 直方圖證實動能尚未轉為明確看漲。成交量 241.27K 也低於顯示的成交量平均值。支撐位位於 $0.8498 附近,隨後是 $0.832 和標記的波段低點 $0.8272。 **交易計劃** 看漲情境:觸發條件:6 小時 K 線收於 $0.890 上方且成交量增加。入場:成功回測後在 $0.885–$0.890 入場。止損 (SL):$0.865。止盈 1 (TP1):$0.912。止盈 2 (TP2):$0.938。失效條件:價格跌破已收復區域並收於 $0.865 下方。 看跌情境:觸發條件:在 $0.885 附近受阻或 6 小時線跌破 $0.8498。入場:回測失敗後在 $0.849–$0.858 入場。止損 (SL):$0.890。止盈 1 (TP1):$0.832。止盈 2 (TP2):$0.8272。失效條件:持續重回 $0.890 上方。 **個人解讀** 我的解讀是,SUI 有一個有趣的生態系統故事,但其圖表尚未跟上該潛力。我正在觀察買方能否收復 $0.89,而不是試圖預測底部。我不會追逐當前的反彈。如果出現成交量確認的收復,我會考慮建立多頭倉位;若失守 $0.8498,我會離場並重新評估。 **為何此設置值得關注** 這個 SUI 設置之所以有趣,是因為其發展中的生態系統與仍然疲軟的價格結構之間存在差距。網絡活動和穩定幣的增長為繼續關注該項目提供了基本面理由,但代幣價格尚未顯示出令人信服的買盤力量。同時,價格正接近 $0.849 到 $0.890 之間的重要決策區域。成功收復該區域可能表明買方終於開始吸收拋壓,而跌破則可能再次暴露 $0.832–$0.827 的支撐區域。這不僅僅是 SUI 是否能反彈的問題,而是真實需求是否能開始改變現有市場結構的問題。這種確認(或未能實現)才是使該設置值得監控的原因。 $SUIUSDT #ByXIMPACT

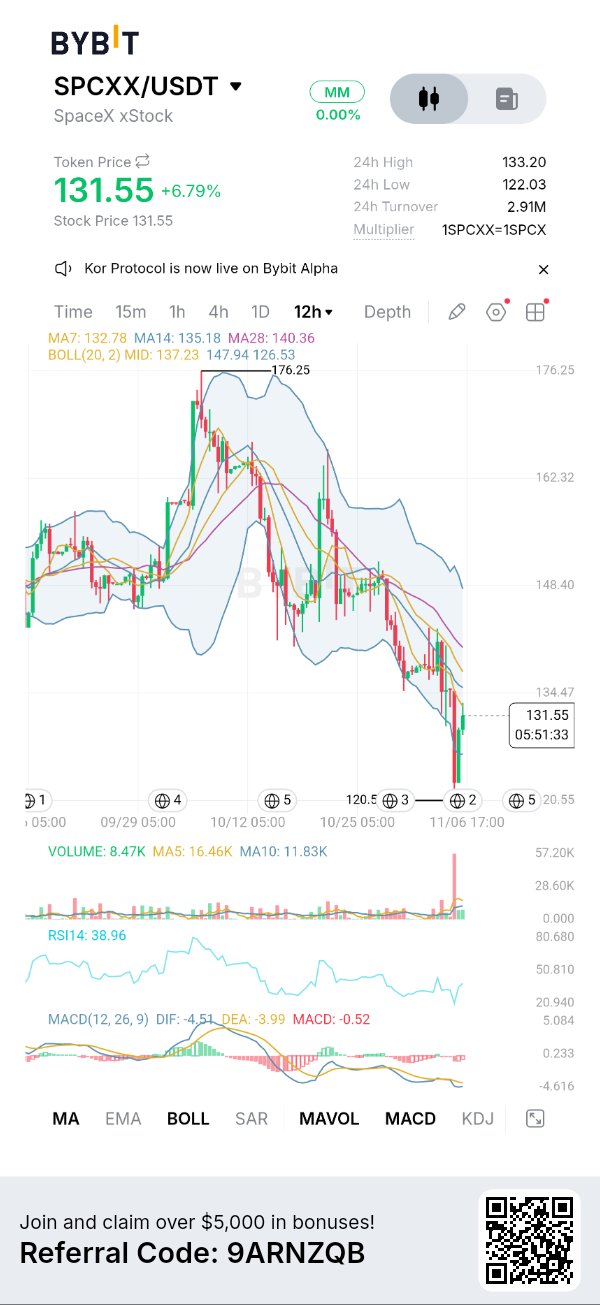
$SPCXXUSDT is showing a decent recovery after falling towards 120.50, but the price is still struggling to get back above its short-term moving averages. That makes the current move worth watching rather than treating it as a confirmed trend reversal. There is a difference between a temporary bounce and buyers actually taking control of the market. WHAT I'M SEEING ON THE CHART The uploaded Bybit Chart shows $SPCXXUSDT at 131.55, up 6.79%, with a 24-hour high of 133.20, low of 122.03 and turnover of 2.91M. The selected timeframe is 12 hours. The visible indicators show MA7 at 132.78, MA14 at 135.18 and MA28 at 140.36. Bollinger Bands show a middle line of 137.23, upper band of 147.94 and lower band of 126.53. RSI(14) is 38.96, while MACD reads DIF -4.51, DEA -3.99 and histogram -0.52. CURRENT MARKET DATA The latest available Bybit snapshot on November 6 shows SPCXX around $128.63, with a market capitalization of $77.72M and 24-hour volume of $15.98M. Circulating supply is approximately 604,180 tokens, while total supply is reported around 1.63M. The seven-day performance is approximately -6.4%. The live price is lower than the screenshot's 131.55 reading. Bybit +2 FUNDAMENTALS SpaceX is not simply a rocket company anymore. Its business includes reusable launch technology, Starlink satellite internet and expanding computing infrastructure. Its Q3 2026 results reported $14.6B revenue, up 161% year over year. This growth gives the underlying company an important business foundation beyond market speculation. TOKENOMICS SPCXX is issued by Backed Assets as a tokenized tracker certificate designed to provide 1:1 exposure to SpaceX shares. It is not direct share ownership and does not provide ordinary shareholder voting rights. There is no conventional staking reward or burn mechanism. Issuance and redemption can affect circulating supply, while fees can reach 0.50%. MACRO + MARKET CONTEXT Bitcoin recently traded around $75,960 and Ethereum around $2,238. Risk sentiment remains sensitive to technology-stock weakness and interest-rate expectations. The US 10-year yield was reported near 4.84%. This matters because SPCXX can be affected by both SpaceX's valuation and wider market liquidity. CHART AND INDICATORS On the 12-hour chart, the sequence of lower highs and lower lows remains a concern. MA7, MA14 and MA28 are all above price, showing that sellers still have the technical advantage. RSI at 38.96 reflects weak momentum, while negative MACD confirms that recovery strength is not yet established. The important resistance area is 133–137, followed by 140–140.5. Support is around 126.5, then 122–120.5. The large volume candle near the latest low deserves attention, but one spike alone cannot confirm accumulation. TRADING SCENARIOS Bullish setup: Trigger: 12H close above 137. Entry: 135–137 on retest. SL: 129. TP1: 140.5. TP2: 147–148. Invalidation: loss of 126.5. Bearish setup: Trigger: rejection around 133–137. Entry: 132–135 after confirmation. SL: 140.5. TP1: 126.5. TP2: 122–120.5. Invalidation: sustained acceptance above 140.5. MY TRADING PLAN I'm waiting for a 12H reclaim of 137 before considering a long position, ideally with a successful retest and stronger volume. My upside targets are 140.5 and 147–148, with invalidation below 126.5. If price gets rejected around 133–137, I'll avoid buying and watch 126.5 and 122 as downside levels. No confirmed breakout, no rushed entry. PERSONAL INTERPRETATION I'm keeping SPCXX on my watchlist, but I wouldn't rush into a position here. I want buyers to recover 137 and show that they can hold it. Without that confirmation, another move towards 126 or 122 remains possible. The reason I'm following this asset is the combination of SpaceX's expanding business and the difference between its underlying performance and the token's market behaviour. For now, patience makes more sense than forcing an entry. I'd rather miss the first part of a recovery than enter before the market gives a clearer signal. Educational analysis only not financial advice. $SPCXXUSDT #ByXIMPACT

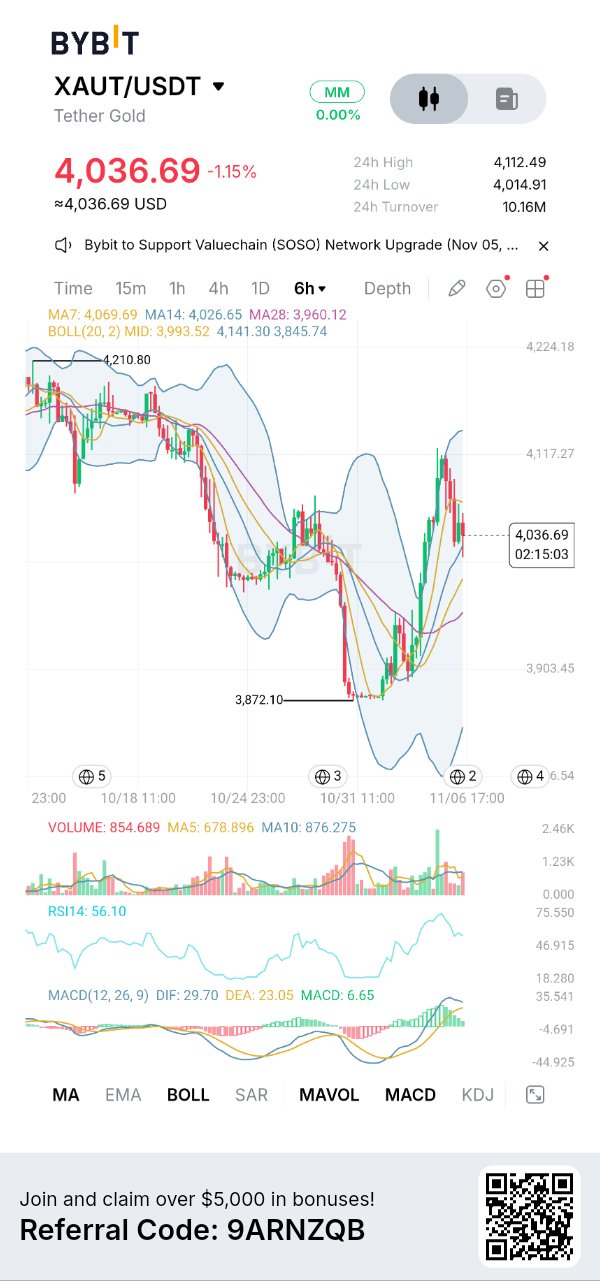
$XAUTUSDT 有趣的地方在於,市場已經從 3,872.10 美元強勁反彈,但最新的 K 線顯示賣方在 4,117 美元附近進行反擊。這造成了一個重要的矛盾:反彈結構正在改善,但買方尚未證明他們能守住高價位。 在已上傳的 Bybit 6 小時線圖上,$XAUTUSDT 的交易價格為 4,036.69 美元,下跌 1.15%。可見的 24 小時高點為 4,112.49 美元,低點為 4,014.91 美元,成交額為 1,016 萬。圖表標記了約 4,210.80 美元的前高和 3,872.10 美元的主要波段低點。顯示的移動平均線值分別為 MA7 4,069.69 美元、MA14 4,026.65 美元和 MA28 3,960.12 美元。布林通道值為中軌 3,993.52 美元,上軌 4,141.30 美元,下軌 3,845.74 美元。RSI14 為 56.10。MACD 顯示 DIF 為 29.70,DEA 為 23.05,柱狀圖為 6.65。可見成交量為 854.689,高於 MA5 的 678.896,但低於 MA10 的 876.275。 最新的市場快照與 Bybit 截圖有所不同:CoinGecko 報告價格約為 4,031.91 美元,市值為 32.6 億美元,24 小時交易量約為 3.319 億美元,流通量為 808,994 枚 XAUT,總供應量為 827,417 枚。這些是聚合數據,並非 Bybit 特定的成交額。CoinGecko +1 小幅價格差異反映了不同的交易所數據來源和時間戳。 XAUT 是 Tether Gold,而不是傳統的投機性實用代幣。每個代幣代表對存放在瑞士金庫中的一金衡盎司實物黃金的所有權。其吸引力在於結合了黃金曝險與區塊鏈轉帳、可分割性及交易所流動性。因此,需求與黃金所有權及代幣化現實世界資產的關聯度,高於一般的 DeFi 投機行為。 其經濟模式不同尋常:沒有固定的最大供應量或傳統的減半時程。代幣在存入額外黃金時鑄造,並在贖回黃金時銷毀。流通供應量與總供應量的差異很重要,因為金庫持有的代幣不一定是活躍的市場供應量。CoinGecko 目前報告流通量為 808,994 枚,總供應量為 827,417 枚。 宏觀形勢好壞參半。11 月 6 日,強勁的美國就業數據推高了美元,並增加了聯準會採取更緊縮政策的預期,這給無收益的黃金帶來了壓力。路透社報導稱,當天現貨黃金價格在 4,047.10 美元附近,下跌約 1%,儘管週內出現了強勁反彈。路透社 +1 對於 XAUT 而言,這比以比特幣為首的加密貨幣情緒更為重要。 從技術上講,從 3,872.10 美元的反彈已經將短期結構向上轉移。價格收復了布林通道中軌和 MA28,但目前仍低於 MA7。4,026 美元至 3,993 美元區域是第一個重要的支撐群。在此之下,3,960 美元和 3,903 美元成為重要支撐,隨後是 3,872 美元。在上行方面,4,070 美元、4,112 美元至 4,117 美元以及 4,141 美元是需要關注的阻力區。突破這些位置可能會開啟向 4,210 美元邁進的走勢。 RSI 為 56.10,顯示動能為正但未過熱。MACD 保持看漲,DIF 高於 DEA,儘管柱狀圖顯示動能需要監測。成交量 854.689 高於其 5 期平均值,但低於 10 期平均值。布林通道顯示雙向都有空間。由於沒有可見的 KDJ 值,因此我不予指定。 我的看漲情境是 6 小時線收在 4,070 美元上方,隨後成功進行回測:入場點為 4,055 美元至 4,075 美元,止損設在 4,020 美元,目標價 1 (TP1) 為 4,117 美元,目標價 2 (TP2) 為 4,141 美元。無效化條件為收復失敗後果斷跌破 4,020 美元。看跌情境:6 小時線收在 3,993 美元下方且回測失敗;入場點為 3,985 美元至 3,995 美元,止損設在 4,035 美元,TP1 為 3,960 美元,TP2 為 3,903 美元。這些是有條件的設置,而非主動交易信號。 我的計劃是等待確認,而不是追逐近期的反彈。對於任何設置,我承擔的交易資金風險不超過 0.5% 至 1%,根據止損距離調整倉位大小,並在第一個目標位獲利了結部分倉位。Tether 2026 年 3 月的儲備報告證實了實物黃金的支撐結構,同時贖回風險、發行方風險和託管風險仍然很重要。 這個設置有趣之處在於黃金的宏觀驅動波動性與 XAUT 改善的 6 小時結構之間的聯繫。我正在觀察買方是否會保衛 3,993 美元並收復 4,070 美元。如果他們做到了,反彈就有發展空間;如果支撐失敗,近期的反彈可能會成為另一個更低的高點。這就是決定我下一步行動的確認信號。 $XAUTUSDT #ByXIMPACT

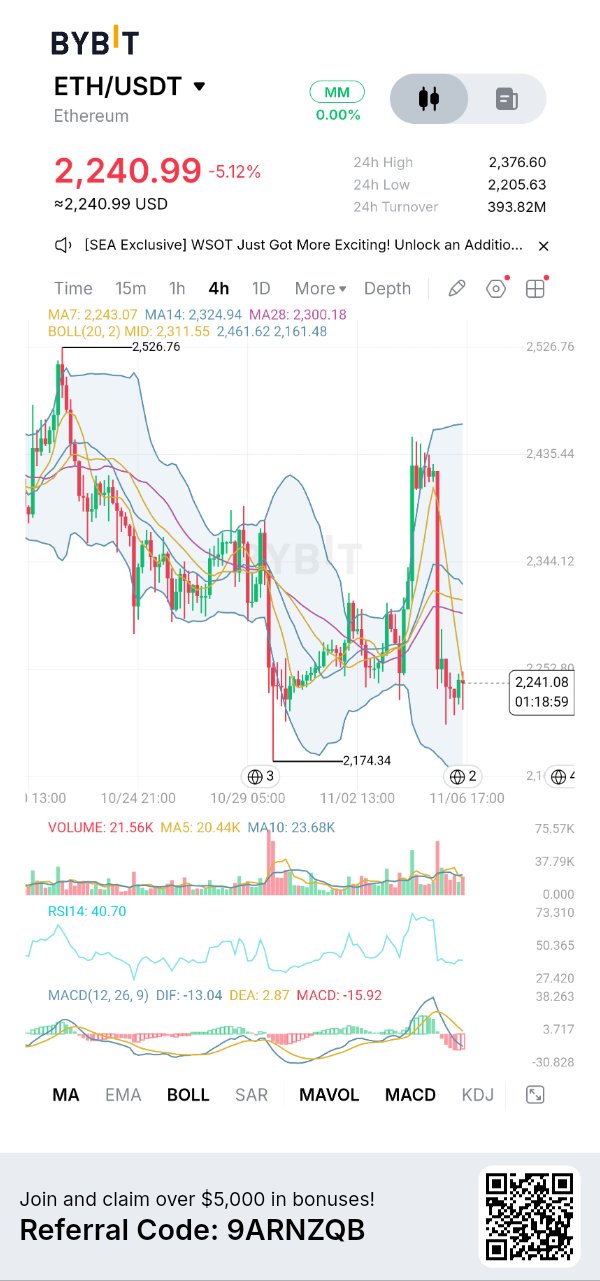
$ETHUSDT 2,174 美元的支撐位正成為最值得關注的關鍵價位。以太幣(Ethereum)在低價位的買盤興趣與實際的市場復甦之間表現出明顯的差異。從 2,174.34 美元的反彈確實吸引了買家,但 ETH 仍低於短期均線和布林通道中軌。真正的復甦需要更高的低點、更強的動能以及對壓力位的收復。 Bybit 的 4 小時線圖顯示 $ETHUSDT 為 2,240.99 美元,下跌 5.12%。24 小時最高價為 2,376.60 美元,最低價為 2,205.63 美元,成交額為 3.9382 億美元。MA7 位於 2,243.07 美元,MA14 為 2,324.94 美元,MA28 為 2,300.18 美元。布林通道顯示中軌為 2,311.55 美元,上軌為 2,461.62 美元,下軌為 2,161.48 美元。波段低點為 2,174.34 美元。RSI14 為 40.70,MACD 指標中 DIF 為 -13.04,DEA 為 2.87,柱狀圖為 -15.92。這些是截圖讀數,非即時數據。 11 月 6 日的市場數據顯示,ETH 價格在 2,221–2,227 美元左右,市值約 2,710–2,720 億美元,24 小時成交量為 175–192 億美元,流通供應量接近 1.2219 億枚 ETH。單日跌幅約為 8%。 以太幣驅動了 DeFi、穩定幣、智能合約、代幣化以及數以千計的應用程式。即將到來的 Glamsterdam 升級旨在透過平行處理、區塊級存取列表以及內建提議者-構建者分離(ePBS)來提高第一層網路(Layer-1)的效率。然而,Hoodi 測試網的啟動在 10 月 22 日被推遲,因此其時程值得密切關注。 ETH 沒有預設的最大供應量。新代幣透過質押獎勵進入流通,而 EIP-1559 則會銷毀部分交易手續費。網路活動影響此平衡:使用量增加可能會增加銷毀量,而較平靜的時期則可能使發行量高於銷毀量。質押鎖定了大量 ETH,但隨時可以提領。以太坊也沒有傳統的企業庫存或預定的創投類代幣解鎖時間表。 更廣泛的市場壓力增加了風險。繼科技股拋售後,比特幣回落至 75,200 美元附近,超過 10 億美元的加密貨幣槓桿部位遭到清算,主要是多頭部位。美國就業數據顯示新增 16.5 萬個工作崗位,失業率為 4.1%。市場對聯準會 12 月升息的預期升高,使得投機性資產對流動性和市場情緒更加敏感。 在 4 小時線圖上,ETH 在 2,435 美元附近受阻後,難以建立更高的高點。2,205–2,174 美元區域是直接支撐位。若跌破此區,將考驗布林通道下軌 2,161 美元附近的支撐。上檔壓力始於 2,253 美元,其次是 2,300–2,325 美元。若能收復整個區域,將提供更強的復甦跡象。 RSI 為 40.70,仍低於中性水準,而 MACD 的 -15.92 柱狀圖確認了看跌動能。成交量為 2.156 萬,低於其 MA10 的 2.368 萬。價格也維持在布林通道中軌下方。KDJ 未選取,因此不預設數值。 交易策略 看漲策略:確認 4 小時線收盤價高於 2,325 美元可能創造復甦機會。考慮在成功回測後於 2,300–2,325 美元附近進場。停損(SL):2,252 美元 | 停利 1(TP1):2,376 美元 | 停利 2(TP2):2,435 美元。 看跌策略:確認跌破 2,205 美元,隨後在 2,205–2,220 美元附近回測失敗,可能提供做空機會。停損(SL):2,253 美元 | 停利 1(TP1):2,174 美元 | 停利 2(TP2):2,161 美元。若明確收復 2,253 美元,則該直接看跌策略失效。 我的交易計畫:資金保護優先。我每筆交易僅冒 0.5–1% 的風險,根據實際的停損距離計算部位大小,並等待確認的 4 小時線突破或跌破。在 TP1 部分停利可降低曝險,剩餘部位可續抱至 TP2。如果報酬無法支撐風險,就沒有理由強行進場。 個人解讀:接下來的幾根 4 小時 K 線至關重要。我希望看到買盤守住 2,200 美元,並逐步收復 2,300 美元。成交量若能配合 RSI 和 MACD 的改善,將使復甦更具說服力。在沒有確認訊號前,保持觀望是合理的。 以太坊生態系持續發展,但其價格在更廣泛的金融壓力下掙扎。這凸顯了長期網路實力與短期投機需求之間的差異。收復壓力位可能會改善技術面,但失守 2,174 美元將暴露進一步的疲態。 $ETHUSDT #ByXIMPACT

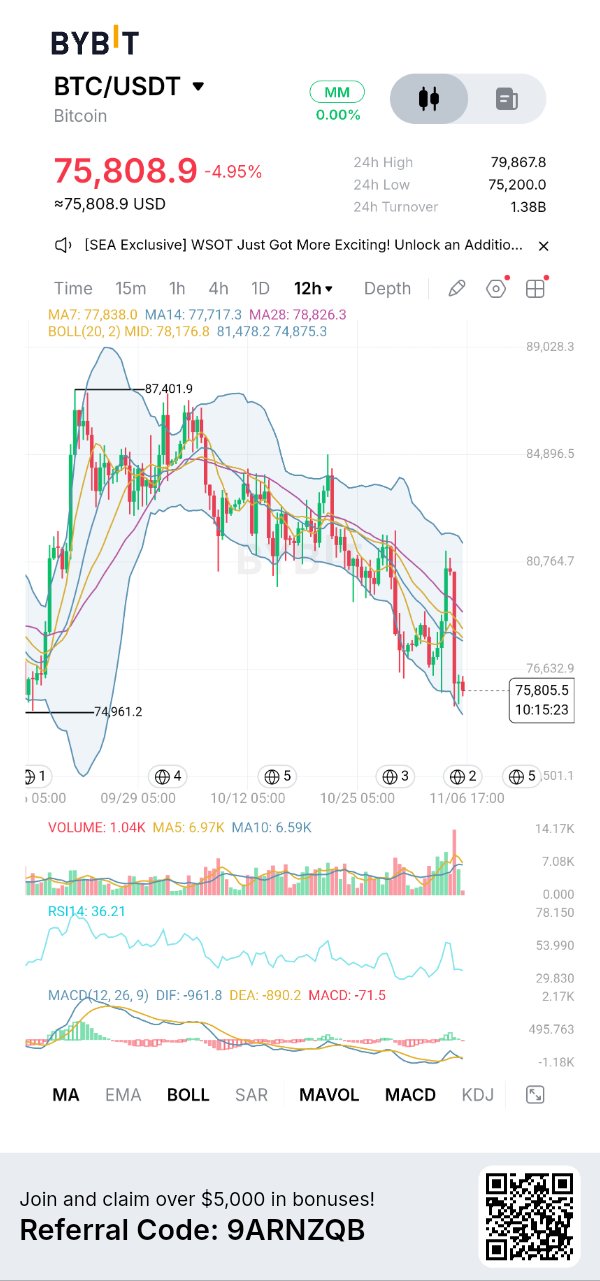
比特幣 ( $BTCUSDT ) 7.5 萬美元是復甦區,還是下一個崩盤點? 對我來說,最引人注目的是比特幣正接近一個重要的支撐區域,但動能依然疲軟。有趣的是,價格雖然接近布林通道下軌,但仍未出現明確的逆轉訊號。這時候,耐心比預測更重要。 圖表觀察:上傳的 Bybit 截圖顯示 $BTCUSDT 價格為 75,808.9 美元,在 12 小時時間框架下下跌 4.95%。可見的 24 小時高點為 79,867.8 美元,低點為 75,200 美元,成交量為 13.8 億 USDT。MA7 為 77,838,MA14 為 77,417.3,MA28 為 78,826.3。布林通道數值為 78,176.8(中軌)、81,472.8(上軌)和 74,875.3(下軌)。RSI14 為 36.21,MACD 為負值。 當前市場數據:11 月 6 日的最新市場資訊顯示,BTC 大約在 75,500–76,000 美元之間,市值約為 1.52 兆美元,24 小時交易量為 420-490 億美元,流通供應量為 2010.5 萬枚 BTC。由於市場價格持續更新,即時價格與截圖略有不同。BTC 仍顯著低於其 2025 年 10 月的歷史最高點。 基本面:比特幣是一個透過工作量證明(Proof-of-Work)保護的去中心化點對點貨幣網絡。其重要性在於具備抗審查的結算能力、有限的發行量以及日益增長的機構參與度。然而,強大的長期基本面並不能自動防止短期的修正。 代幣經濟學:比特幣的最大供應量為 2,100 萬枚。約 95.7% 已經發行。繼 2024 年 4 月減半後,目前的挖礦獎勵為每個區塊 3.125 BTC。下一次預計減半時間在 2028 年左右。比特幣沒有傳統的代幣解鎖時間表或中心化金庫。 宏觀與市場背景:目前的疲軟與更廣泛的避險情緒有關。美國科技股大幅拋售,而比特幣現貨 ETF 錄得 4.302 億美元的淨流出。超過 10 億美元的加密貨幣槓桿倉位被清算。聯準會最新的目標利率範圍為 3.75–4.00%,這使得流動性預期變得尤為重要。 圖表觀察:12 小時結構依然看跌,呈現低點更低和高點更低的態勢。價格低於所有三條移動平均線,顯示賣方仍掌控趨勢。74,960–74,875 美元區域是目前的直接支撐位。在結構開始改善之前,需要看到價格回升至 77,400–78,200 美元。80,765 美元區域是下一個主要阻力位。 指標分析:RSI 位於 36.21,顯示動能疲弱,但尚未出現確認的超賣反轉訊號。MACD 顯示 DIF 為 -961.8,DEA 為 -890.2,柱狀圖為 -71.5,反映出看跌動能。價格接近布林通道下軌,雖然可能會吸引買盤,但僅觸碰通道本身並非買入信號。 交易情境: 看漲:觸發條件:12 小時線收盤價站穩 77,400–78,200 美元之上。進場:確認後在 77,400–78,000 美元區間進場。止損 (SL):75,800 美元。目標價 1 (TP1):80,765 美元。目標價 2 (TP2):84,900 美元。失效:反彈被拒並跌破支撐位。 看跌:觸發條件:12 小時線收盤價低於 74,875 美元。進場:在 74,900–75,200 美元區域測試失敗後。止損 (SL):76,650 美元。目標價 1 (TP1):72,000 美元。目標價 2 (TP2):70,500 美元。失效:強勢收復 77,400 美元。 我的交易計畫:我會避免在當前水平盲目進場。我會等待確認的支撐反彈或測試失敗後,再考慮建立倉位。在此波動期間,倉位大小應保持較小,並預設好風險管理和分批止盈。 個人解讀:我的解讀是,比特幣正處於一個有趣的決策點,而不是明顯的買入機會。我正在觀察買方是否能守住 7.5 萬美元並收復移動平均線群。如果沒有確認訊號,我不會追漲反彈。 為什麼此設置很重要:這是在測試比特幣在更廣泛的避險走勢後是否能建立底部。成功收復可能會創造一個有意義的復甦機會,而確認跌破則可能延長修正走勢。接下來的 12 小時收盤價比盲目猜測底部更重要。 $BTCUSDT #ByXIMPACT

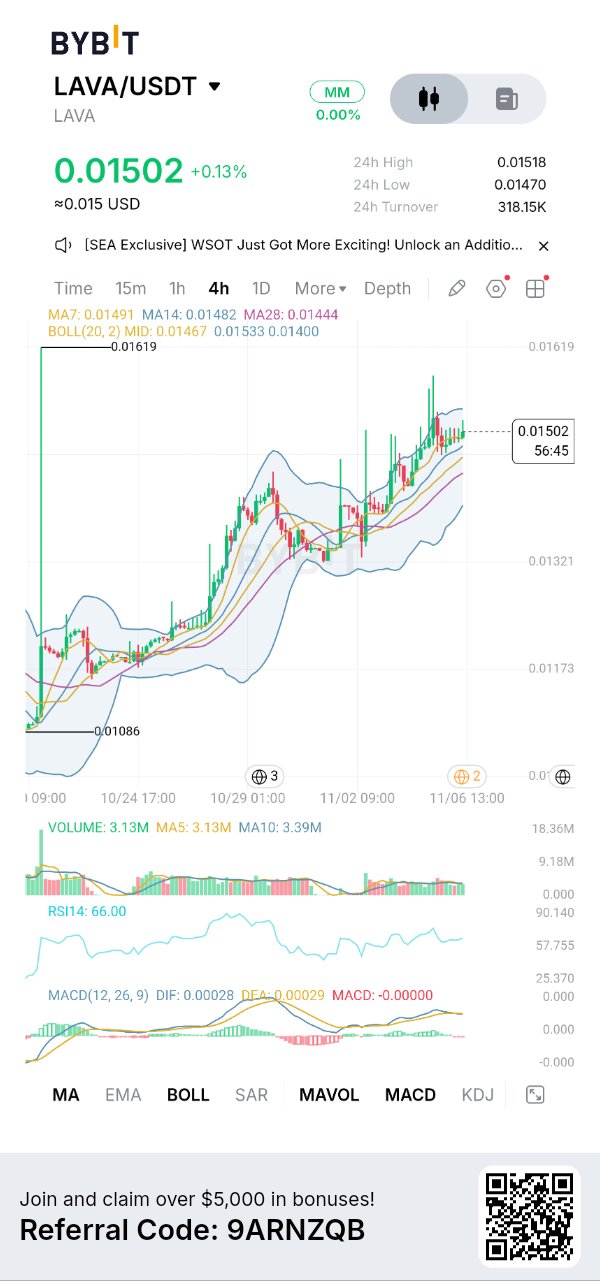
What makes $LAVAUSDT interesting right now is the difference between its strong recovery structure and the momentum beginning to slow near the recent highs. Price has climbed considerably from its October low, but the latest candles are consolidating around $0.015 rather than pushing decisively higher. I find this more interesting than the small 0.13% gain because the next move could show whether buyers are still accumulating or early buyers are starting to take profits. WHAT I'M SEEING ON THE CHART The Bybit 4H chart shows LAVA at $0.01502, up 0.13%, with a 24-hour high of $0.01518 and low of $0.01470. Bollinger Bands are 0.01533 (upper), 0.01467 (middle) and 0.01400 (lower). RSI is 66, MACD DIF is 0.00028 and DEA is 0.00029, with a nearly flat, slightly negative histogram. Volume is 3.13M. The previous major low is around $0.01086. CURRENT MARKET DATA: The screenshot is a point-in-time snapshot. Retrieved market feeds place LAVA around $0.01494–$0.01500. DefiLlama reports approximately $9.36M market cap, $14.14M FDV, 632.96M circulating tokens and $437K 24-hour volume. CoinGecko shows +6.8% over seven days and +16.9% over 30 days. Supply figures vary between providers. FUNDAMENTALS: Lava Network focuses on blockchain data access through a decentralized RPC network connecting applications, wallets and developers with node providers. It aims to improve response speed, reliability and availability. Providers stake LAVA and earn rewards for delivering services. Real network usage and paid demand will be important for long-term growth. TOKENOMICS: LAVA has a maximum supply of 1 billion tokens. Allocation includes 31% for R&D and ecosystem growth, 27% for core contributors, 17% for early backers, 15% for future initiatives, 6.6% for provider drops and 3.4% for validator rewards. One tracker lists approximately 21.4M LAVA unlocking on November 30, around 2.1% of maximum supply. I would monitor circulating supply and exchange deposits. MACRO + MARKET CONTEXT: BTC and ETH weakness, inflation concerns and borrowing costs can affect altcoin liquidity. Even a strong small-cap recovery may struggle when broader market sentiment weakens. CHART OBSERVATION: The 4H structure remains bullish, with higher highs and higher lows since $0.01086. MA7 at $0.01491 and MA14 at $0.01482 remain above MA28 at $0.01444. However, resistance around $0.01518–$0.01533 needs to be reclaimed. INDICATORS: RSI at 66 shows positive momentum. MACD is nearly flat, with DIF slightly below DEA. Price is approaching the upper Bollinger Band, while volume at 3.13M has not confirmed a strong breakout. This suggests consolidation rather than clear acceleration. TRADING SCENARIOS: For a bullish setup, I want a 4H close above $0.01533 followed by a successful retest. Entry: $0.01520–$0.01535. SL: $0.01465. TP1: $0.01580. TP2: $0.01619. For a bearish setup, a 4H close below $0.01467 would weaken the recovery. Entry: $0.01450–$0.01465 after a failed retest. SL: $0.01520. TP1: $0.01400. TP2: $0.01321. These remain conditional scenarios, not confirmed signals. PERSONAL INTERPRETATION My plan is to wait rather than chase LAVA around $0.015. I want to see buyers defend $0.01467 and reclaim $0.01533 with stronger volume. If momentum continues fading, I would rather stay out and wait for the next support reaction. What makes this setup interesting is that the recovery is technically healthy, but MACD momentum, overhead resistance and upcoming supply releases create reasons to remain selective. I want confirmation from both price and volume before committing capital. WHY THIS SETUP MATTERS: This is an important test of whether LAVA's recovery has enough buying strength to continue beyond its current resistance. The reaction around $0.01467 and $0.01533 could help establish whether the next move is a continuation or a deeper pullback. $LAVAUSDT #ByXIMPACT

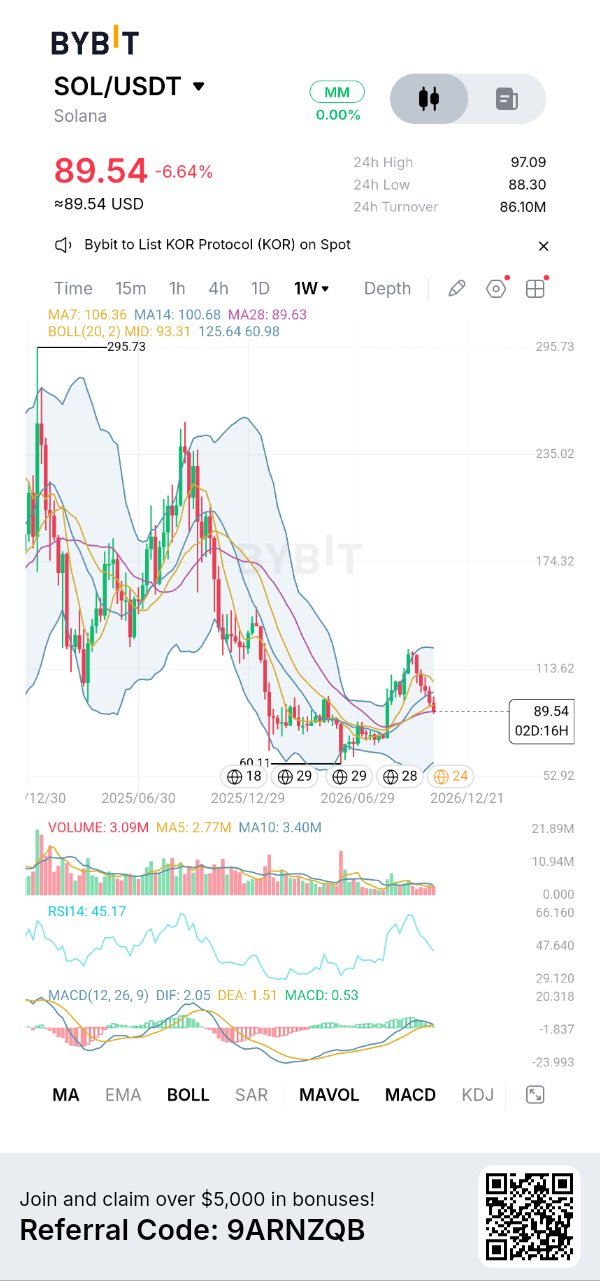
SOL 的週線結構出現了有趣的變化。在從 60.11 美元的低點反彈並攀升至 113 美元附近後,價格開始回調至 89.54 美元。先前的反彈曾使 SOL 站上其長期移動平均線,但最新的K線再次考驗了這一力道。RSI 已回落至 45.17,而 MACD 則維持微幅正值。對我而言,這是一次關鍵的測試,將決定反彈力道能否守住,還是賣方將會接管盤勢。 走勢背後的數據:Bybit 圖表顯示 $SOLUSDT 價格為 89.54 美元,下跌 6.64%,24 小時高點為 97.09 美元,低點為 88.30 美元,成交量為 86.10M。選定的時間週期為 1W(週線)。圖表標示的前高為 295.73 美元,前低為 60.11 美元。MA7 為 106.36 美元,MA14 為 100.68 美元,MA28 為 89.63 美元。布林通道中軌、上軌和下軌分別為 93.31 美元、125.64 美元和 60.98 美元。 當前市場數據:截至 11 月 6 日,SOL 價格約在 89.5 美元至 90 美元之間,市值接近 529 億美元,24 小時交易量約 46 億美元,流通供應量約為 5.9028 億枚 SOL。總供應量約為 6.3707 億枚,無固定最大供應量上限。SOL 七天內下跌約 7.9%,近一個月下跌 26%。這些數據與 Bybit 截圖有所不同。 基本面:Solana 是一條為快速交易和低手續費而設計的高性能區塊鏈。它支援 DeFi、NFT、遊戲、支付以及代幣化實體資產 (RWA)。2026 年第二季,Solana 記錄的 RWA 價值達 36 億美元,穩定幣供應量為 163 億美元,而代幣化股票交易量達到 88 億美元。這顯示了生態系統的活躍度,儘管活躍度本身並不能保證 SOL 的價格上漲。 代幣經濟學:SOL 採用基於通貨膨脹的供應模型。其初始年通膨率為 8%,每年下降 15%,直至達到 1.5% 的長期通膨率。質押有助於保護網路安全並獎勵參與者。此外,50% 的基礎交易費用會被銷毀,而優先費用則支付給驗證者。持續的代幣發行仍需納入考量。 宏觀與市場:比特幣已跌至 75,000 美元至 76,000 美元區間,以太幣則在 2,200 美元至 2,250 美元左右。美國科技股的疲軟也影響了加密貨幣市場的情緒。聯準會最新的政策利率目標維持在 3.75%–4.00%,而美國 10 年期公債殖利率約為 4.90%。在缺乏更廣泛的市場支持下,這種環境使山寨幣更難實現反彈。 圖表與指標:在週線圖上,SOL 已從 295.73 美元的高點大幅回落。在 60.11 美元附近找到支撐後,買方將價格拉升至 113 美元,但最新的K線顯示了再次回調。價格目前低於 MA7(106.36 美元)和 MA14(100.68 美元),而 MA28(89.63 美元)幾乎與當前價格持平。布林通道中軌 93.31 美元是一個重要的反彈關卡。RSI14 為 45.17,顯示動能減弱,但尚未進入超賣狀態。MACD 維持微幅正值,DIF 為 2.05,DEA 為 1.51,柱狀圖為 0.53。週成交量為 3.09M,高於 MA5(2.77M),但低於 MA10(3.40M)。反彈力道已經減弱,儘管動能尚未完全轉負。 看漲情境:我希望 SOL 能守住 88 美元至 90 美元區間,並在更強成交量的配合下收復 93.31 美元。觸發條件:週線反彈站上 93.31 美元。進場點:確認後在 93 美元至 96 美元進場。止損 (SL):87 美元。止盈 1 (TP1):100.68 美元。止盈 2 (TP2):106.36 美元。重新站上移動平均線將顯示買方回歸。 看跌情境:如果 SOL 跌破 88 美元且未能反彈,可能會進一步走弱。觸發條件:確認跌破 88 美元。進場點:回測失敗後在 86 美元至 88 美元進場。止損 (SL):93.50 美元。止盈 1 (TP1):80 美元。止盈 2 (TP2):70 美元。這些是預估目標位,而非已確認的支撐位。若能持續反彈並站穩 93.31 美元上方,此設定將失效。 我的交易計畫:我正在關注 88 美元至 90 美元區間,因為它接近週線 MA28。我不會僅僅因為 SOL 下跌就進場。我希望看到買方守住這一區域,且價格反彈至 93.31 美元上方。如果支撐失敗,我會等待回測,而不是急於建倉。 我的解讀:我覺得有趣的一點是,儘管 MACD 仍為正值,但 RSI 已跌破 50,且價格在短期移動平均線下方運行。這顯示先前的反彈已失去動能,但週線指標尚未完全確認看跌反轉。 為什麼這個設定很重要:對我來說,88 美元至 90 美元是值得關注的區域。守住它可能會給 SOL 機會重塑其週線結構,而若失守則會使先前的反彈看起來更加疲軟。比起試圖預測下一次大行情,我更感興趣的是觀察買方在此水平附近的反應。 $SOLUSDT #ByXIMPACT