Ali Explorer..
567點贊0分享9粉絲3關注
just Beginning of learning 🔺
just Beginning of learning 🔺
價格從我的水平位反轉,太嗨了!
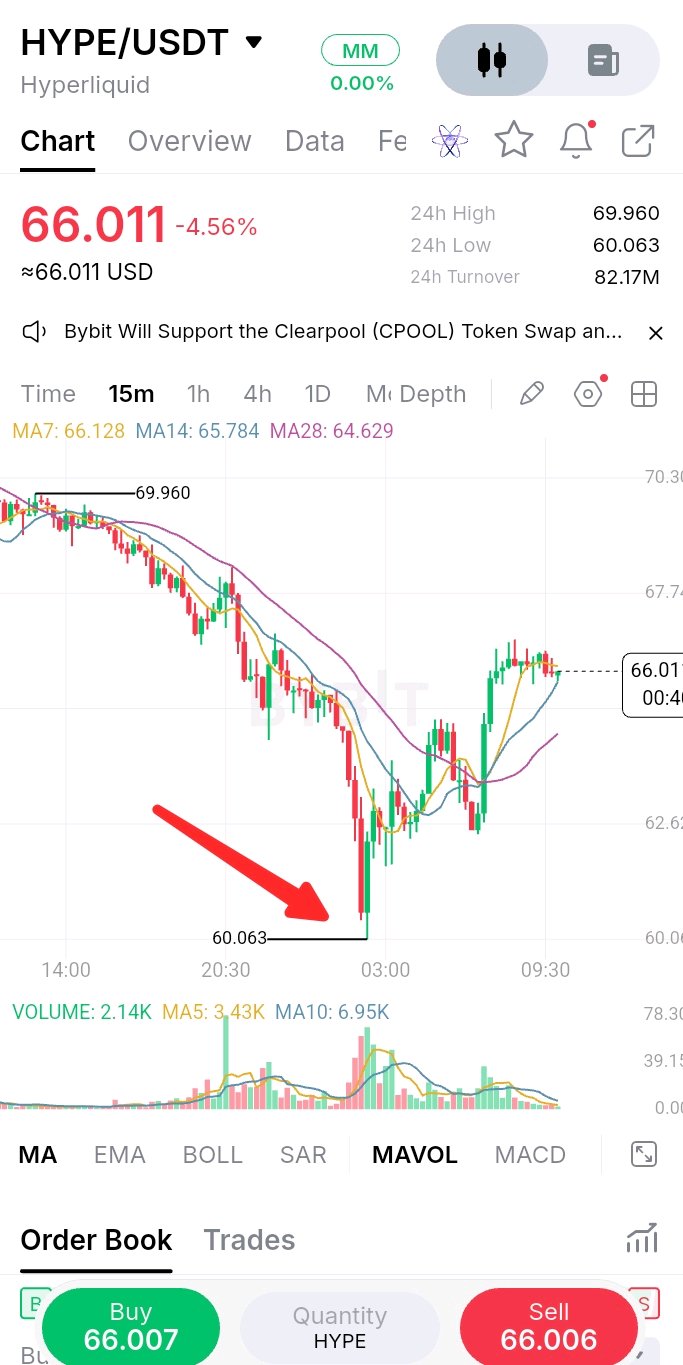
🚀 $HYPEUSDT 我們一直在關注的反彈! 正如我在之前的分析中所討論的,HYPE 失守了 $70–$71 的支撐位,並向下移動至流動性區間。價格在 $60.06 附近掃蕩了流動性,隨後強勢反彈至 $66。 在 15 分鐘圖表上,買方展現了動能,價格在短期移動平均線附近交易。然而,整體下跌趨勢尚未確認結束。 關鍵觀察點 👀:$68–$70 為阻力位;$64–$65 為即時支撐位。若能持續突破阻力位,可能會開啟通往 $70–$73 的道路。 目前來看,這像是試探性的回升,而非確認趨勢反轉。請關注成交量以及接下來的 4 小時收盤價,再決定是否進場。 HYPE 終於找到底部了,還是這只是一次喘息... #IMPACTbyTrade
BTC bottom
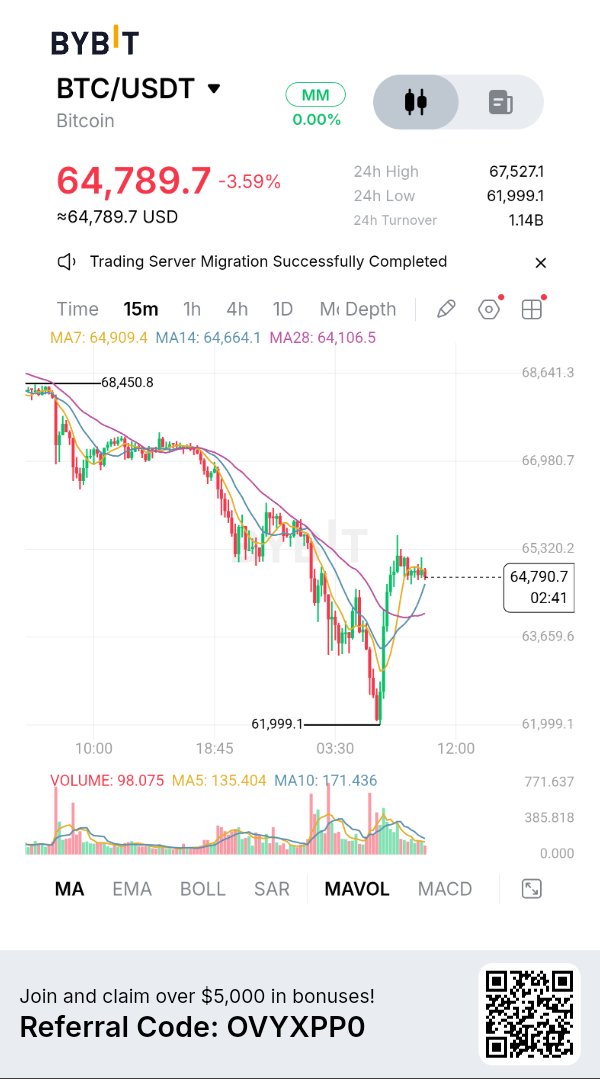
I think $BTCUSDT Bottom is near 📉 #BitcoinHitsTwoMonthLowAfterUSMidterms
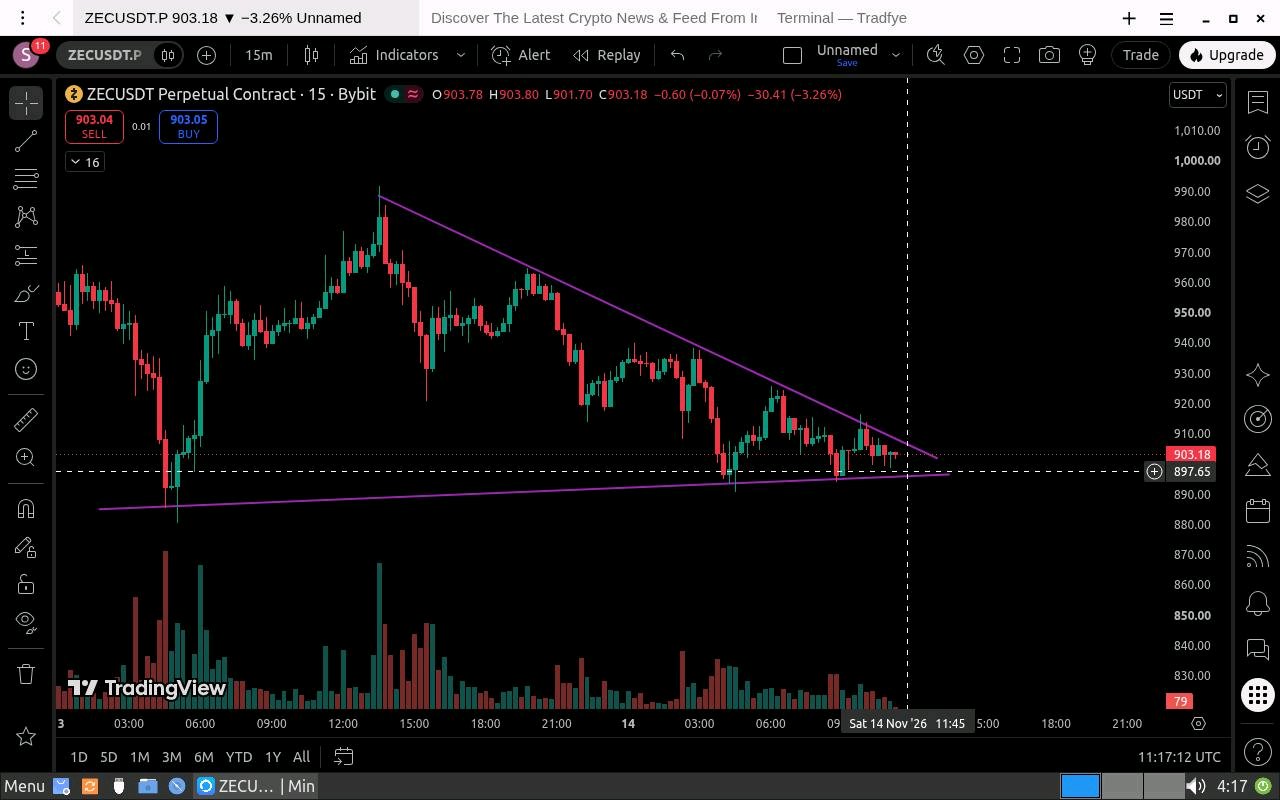
ZEC A BIG MOVE COULD BE COMING! 📊🔥
ZEC is trading around $903, squeezing inside a descending resistance structure on the 15-minute chart. Price is holding a critical support zone between $890 – $900. A breakout or breakdown could trigger the next major move. 📊 KEY LEVELS TO WATCH 👀 LONG 🎯 Target 1: $916 🎯 Target 2: $927 🚀 Final Target: $934 🛑 Stop loss: Below around $890. At $927, consider securing partial profits and moving SL to breakeven. If ZEC loses the $890–$900 support zone with a confirmed breakdown: 📉 Potential downside target: $860 🔥 THE BIG QUESTION Will ZEC break upward toward $934 or collapse toward $860? The market is approaching a critical decision zone. Don't chase the move wait for confirmation. 💡 Remember: Trade the confirmation, not the prediction. Manage your risk! What's your bias? 🐂 BULLISH or 🐻 BEARISH? #IMPACTbyTrade
Trying to Understand What Is Happening With BTC
I have been closely observing Bitcoin on the 1H timeframe, and the current market structure is showing signs of weakness. $BTCUSDT continues to form lower highs and lower lows, suggesting that sellers are still dominating the short term trend. Looking at the chart, I have mapped a possible A B C D E corrective structure. Price has recently bounced from the D wave area, but I am not considering this a confirmed bullish reversal yet. Key Technical Levels☑️ • Resistance: $69,120 • Immediate Support: $66,400–$66,500 • Next Potential Support Zone: $61,000–$63,000 if selling pressure continues. A sustained move above $69,120 could improve the short-term structure, while a breakdown below $66,400 may expose the lower support zone. Understanding the Market with Bybit AI I also used Bybit AI to understand the possible reasons behind BTC's recent decline. The analysis helped me look at the broader market picture, including: • Weakening demand and changing market sentiment. • Reduced institutional buying interest. • Derivatives positioning and the possibility of leveraged long liquidations. • Overall market uncertainty and selling pressure. According to the analysis, the current decline appears to be more related to market-wide pressure and weakening demand, potentially amplified by leverage, rather than a confirmed problem with Bitcoin itself. My Overall Market View At the moment, I am keeping an eye on the $66,400 support area and whether BTC can recover above the $69,120 resistance. If support fails, the $61,000–$63,000 zone becomes important to watch. I don't consider every bounce a reversal. I prefer to observe price confirmation, market structure and risk before making any decision. The main thing I learned from this analysis is that looking at technical structure alongside broader market conditions gives a more complete picture of what is happening. #WSOTShowYourAITradeToEarn10USDT
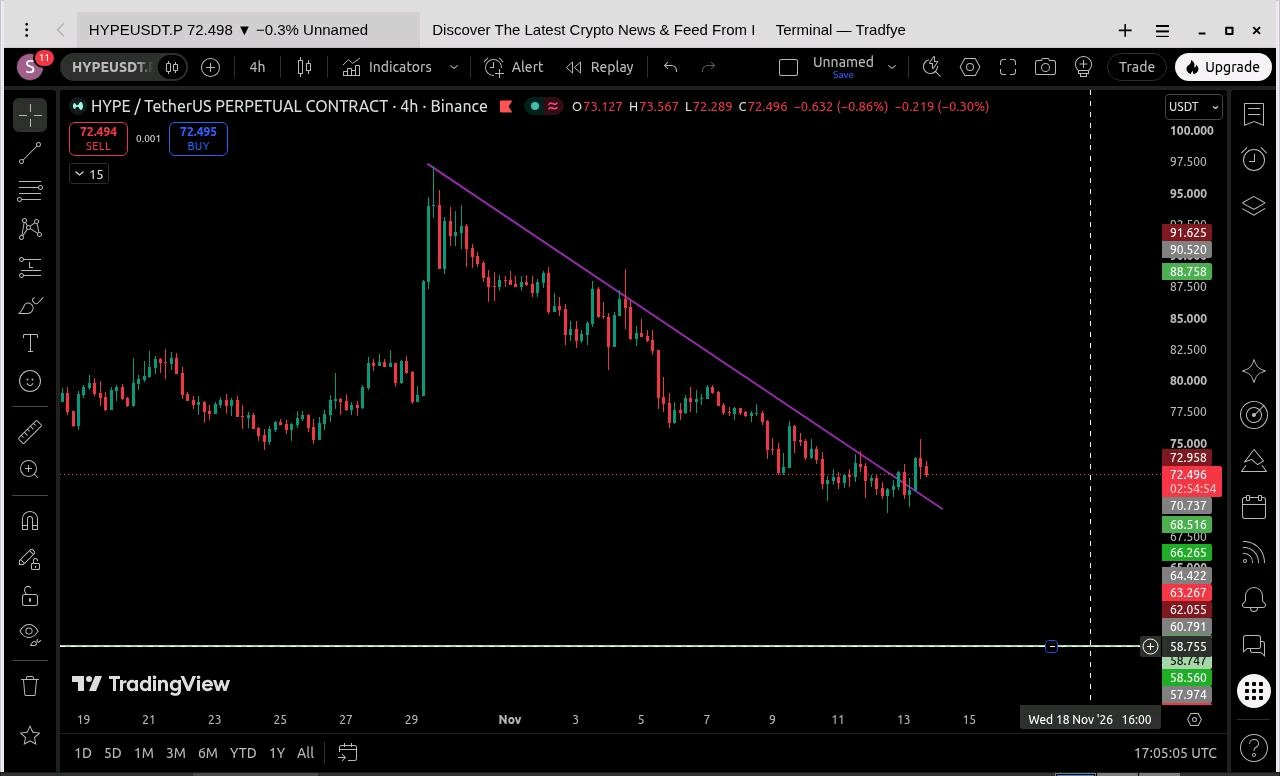
HYPE TREND LINE BREAK 😱
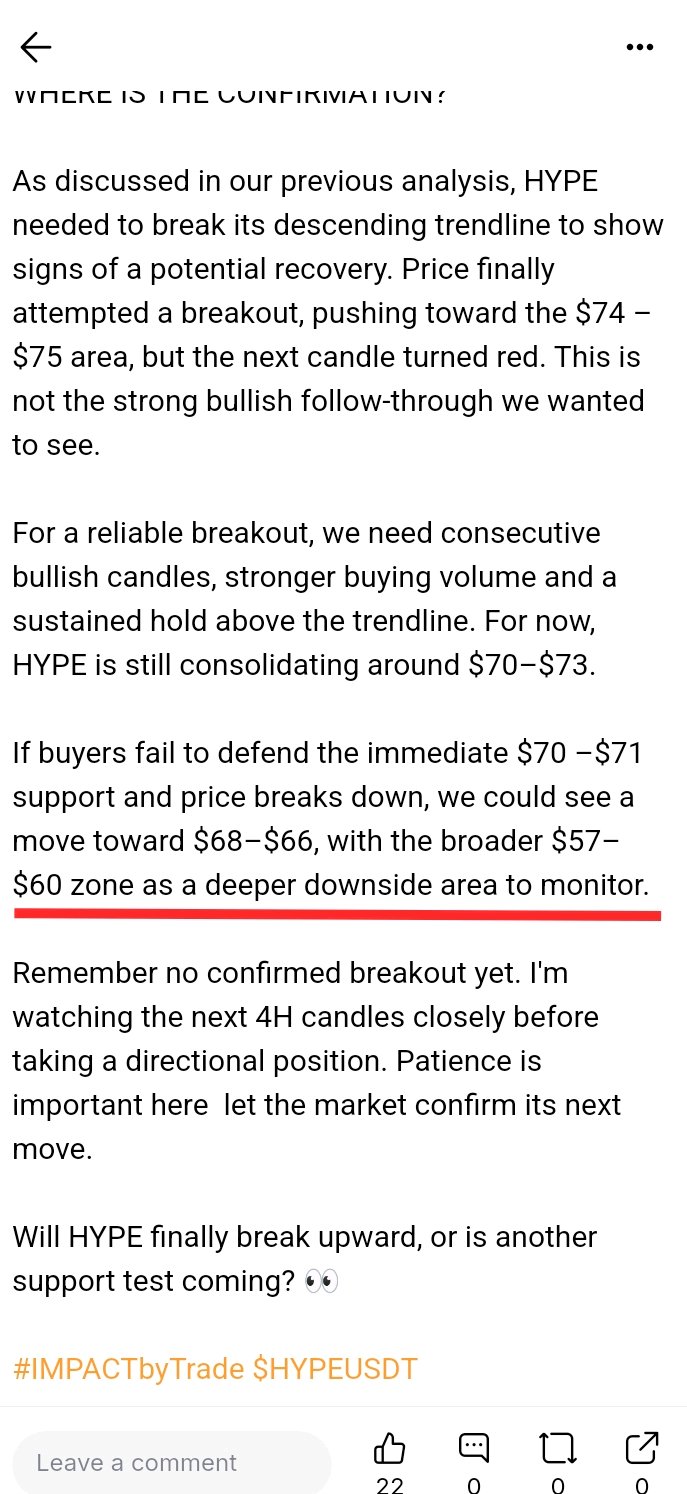
⚡ HYPE UPDATE TRENDLINE BREAKOUT BUT WHERE IS THE CONFIRMATION? As discussed in our previous analysis, HYPE needed to break its descending trendline to show signs of a potential recovery. Price finally attempted a breakout, pushing toward the $74 – $75 area, but the next candle turned red. This is not the strong bullish follow-through we wanted to see. For a reliable breakout, we need consecutive bullish candles, stronger buying volume and a sustained hold above the trendline. For now, HYPE is still consolidating around $70–$73. If buyers fail to defend the immediate $70 –$71 support and price breaks down, we could see a move toward $68–$66, with the broader $57– $60 zone as a deeper downside area to monitor. Remember no confirmed breakout yet. I'm watching the next 4H candles closely before taking a directional position. Patience is important here let the market confirm its next move. Will HYPE finally break upward, or is another support test coming? 👀 #IMPACTbyTrade $HYPEUSDT
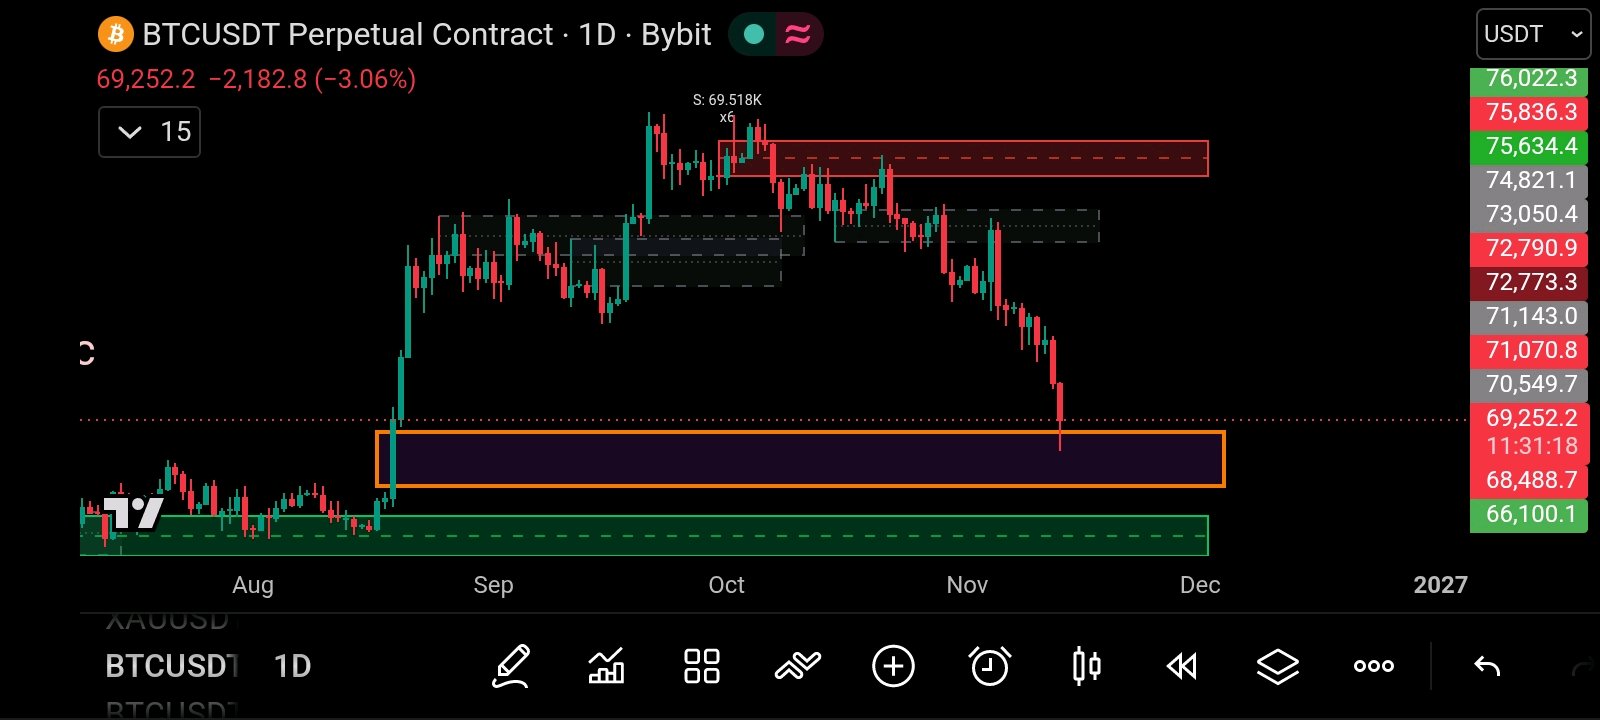
BITCOIN TESTED DAILY FVG
Bitcoin has officially pulled back and tested the major Daily Fair Value Gap FVG demand zone around $65K – $69K 🌐. Following the intense flash crash that liquidated over $750M in longs, price action is now printing early signs of buyer absorption at these lower levels 📉. With BTC currently stabilizing around $69,174, this zone is acting as the ultimate inflection point. Here is how we are playing the setup 🧠. The Setup: Planning a conditional LONG position off the FVG defense 🟢. Upside Target: $72,000+ Where significant overhead liquidity and previous structure converg) 🎯 Strict Stop Loss: Placed cleanly below the recent flash crash low, around $67,000 🛡️ ⚡ Execution Rule: Never trade blind hope. We need to see a strong, verified bullish reaction and a clean 1h/4h confirmation structure before pulling the trigger. If this demand zone fails to hold, we respect our risk boundaries immediately and step aside 📉. Risk management always comes first. Let’s watch the order flow closely and see if BTC can use this Daily FVG as a launchpad for recovery! 🚀 What’s your Analysis says!? Is is go to $72K , or are we testing lower? Drop your view below! 👇 $BTCUSDT #WSOTShowYourAITradeToEarn10USDT
比特幣跌破 68,000 了,這是要完蛋了嗎!
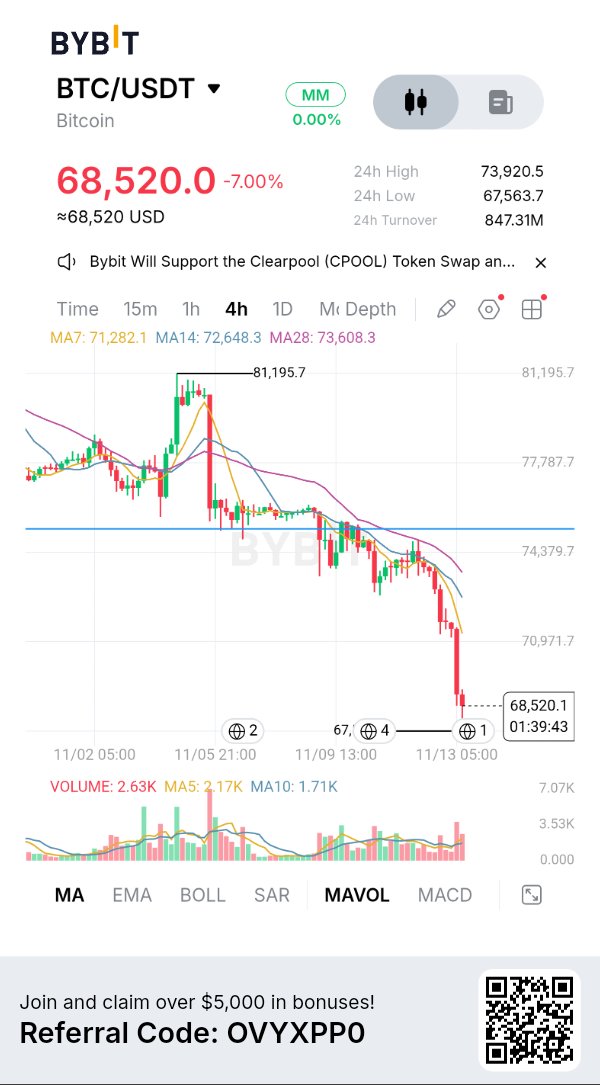
比特幣自近兩個月來首次跌破 69,000 美元,引發了近幾週來規模較大的一次槓桿重置。 繼上週在 81,000 美元附近交易後,BTCUSDT 在 11 月 13 日滑落至 69,000 美元水準之下。此次下跌迫使加密貨幣衍生性商品市場出現約 14 億美元的清算,其中多頭部位佔了絕大多數的損失。超過 17 萬名交易者在此波連鎖反應中遭到清算。 僅比特幣相關的清算總額就達到了約 7.4 億美元,而以太幣則有約 2.5 億美元被蒸發。整體加密貨幣市場隨之下跌,總市值下降約 5-6%,至約 2.3 兆美元。 分析師主要將此次拋售定調為去槓桿化事件,而非基本面崩潰。在 70,000 美元下方聚集了密集的槓桿多頭部位。一旦該關鍵點位失守,自動清算機制加速了跌勢。總體經濟因素也加劇了壓力:近期現貨比特幣 ETF 資金外流、美元走強、科技股疲軟,以及高於預期的通膨數據,這些都提高了市場對金融環境緊縮的預期。 山寨幣也同步走跌。以太幣 ETHUSDT 跌向 1,900 至 1,925 美元區間,XRP 在 1 美元附近徘徊,而 SOL 和 DOGE 等幣種則出現 5-9% 的跌幅。 接下來需要觀察的關鍵訊號包括槓桿指標(未平倉量和資金費率)、現貨 ETF 的資金流向,以及比特幣能否在 6 萬 9 千美元高位區間企穩。如果強迫拋售放緩且資金外流平息,市場可能會轉向更為有序的交易狀態。 然而,若槓桿再次激增,將使市場容易受到進一步波動的影響。 總結來說,這是一次針對避險情緒背景下的劇烈槓桿清洗,對於過度擴張的多頭來說非常痛苦,但尚未對比特幣的整體大趨勢構成明顯的結構性破壞。 ByXIMPACT

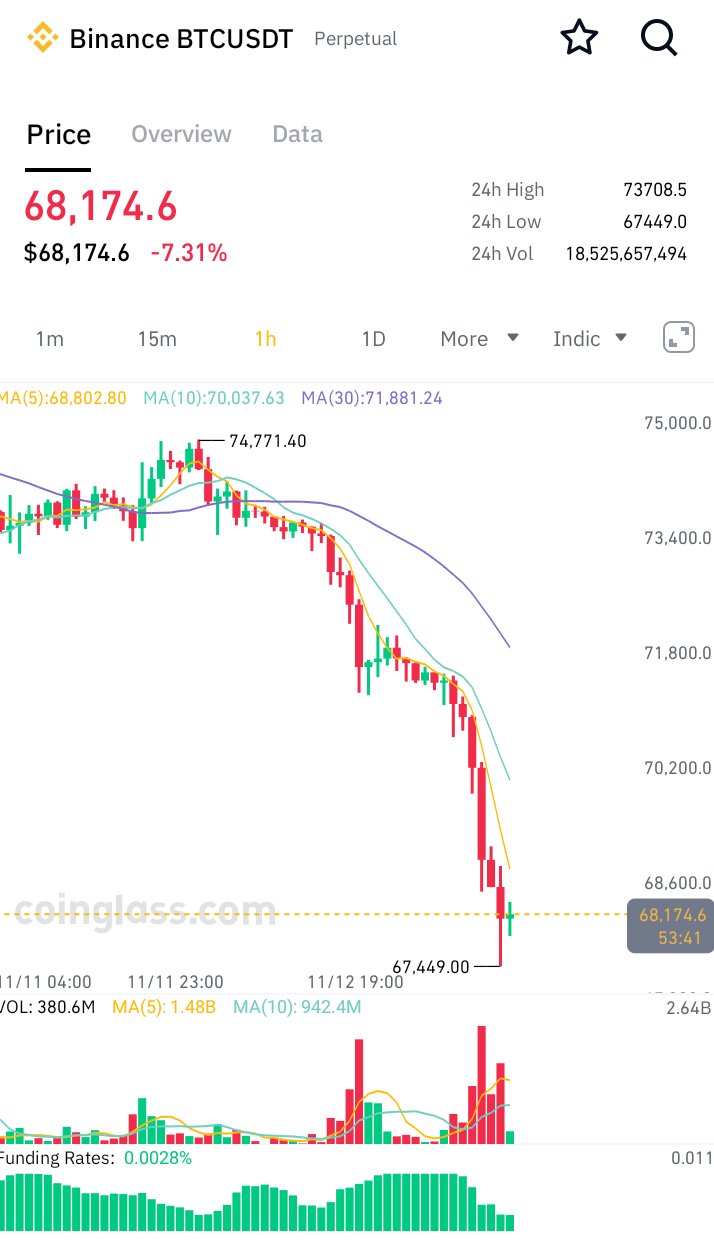
比特幣剛剛跌破 69,000 美元關卡
$BTCUSDT 自上週從約 81,000 美元的高位下跌以來,近兩個月內首次跌破 69,000 美元。 這一走勢引發了約 14 億美元的清算,絕大多數來自多頭倉位。超過 17 萬名交易者在這波跌勢中慘遭爆倉。 這看起來更像是槓桿去化,而非基本面崩潰。70,000 美元下方的擁擠多頭受到重創,同時 ETF 資金流出、美元走強以及科技股更廣泛的避險情緒加劇了壓力。 山寨幣也隨之下跌,$ETHUSDT 滑向 1,900 – 1,925 美元,XRP 徘徊在 1 美元附近。 現在需密切關注的重點: - 槓桿是否會持續出清 - 現貨 ETF 資金流向 - BTC 能否守住 60,000 美元後段的價位 這是在避險情緒背景下的典型槓桿重置。 #WSOT2026 #比特幣在美國中期選舉後跌至兩個月低點 #美國通膨升溫,升息押注升高

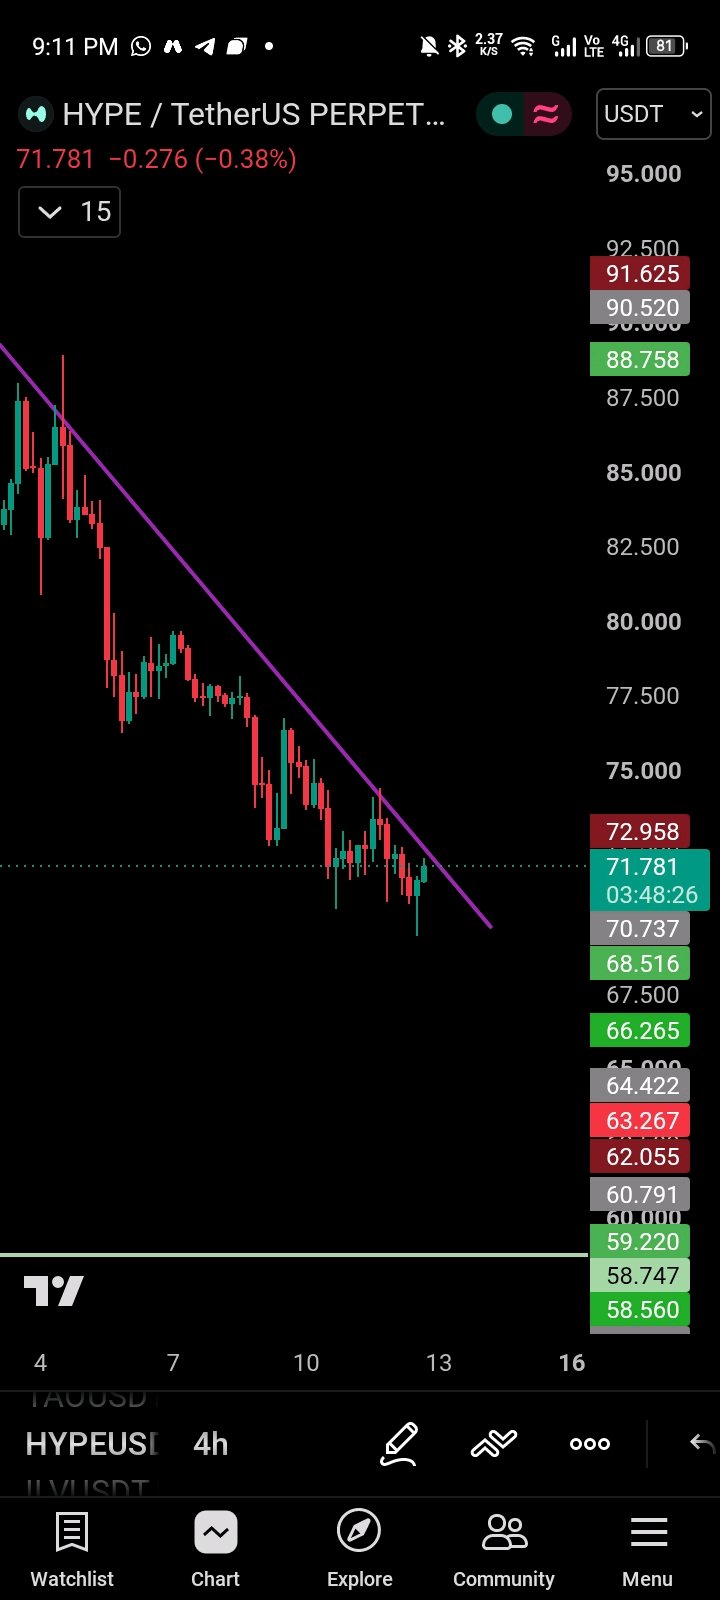
$HYPEUSDT 買方進場了! 正如我們之前的分析所預期,HYPE 已經掃蕩了 70 美元支撐區下方的流動性,該區域現在正顯現出需求區的跡象。買方正試圖推高價格,但整體趨勢仍然看跌,賣方仍掌握主導權。關鍵在於關注下降趨勢線,若能伴隨強勁成交量確認突破,可能會觸發復甦;反之,若再次受阻,可能會帶來進一步的下行壓力。現在是關鍵時刻,每個微小的波動都至關重要。讓我們拭目以待:會是突破還是跌破?👀 #HYPEUSDT #IMPACTbyTrade
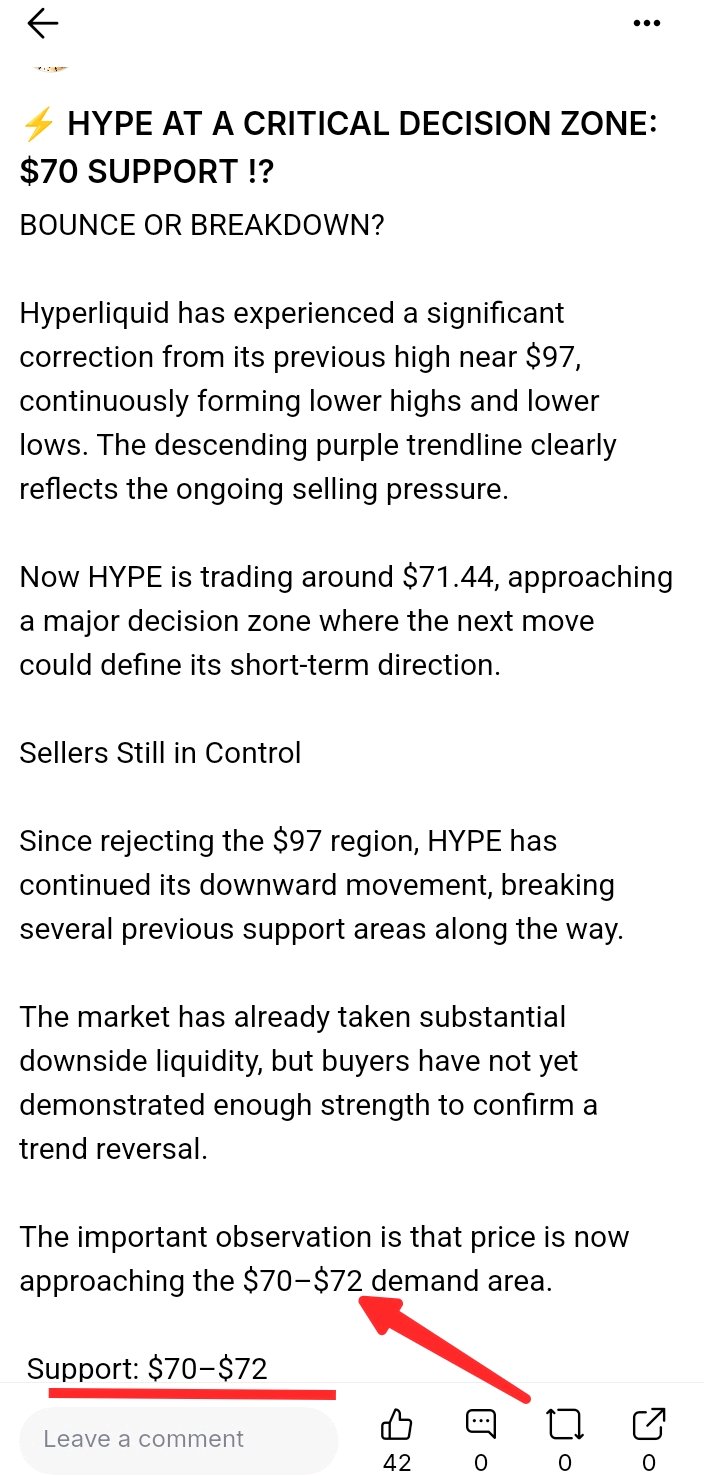
⚡ 關鍵決策區引發熱議:70 美元支撐位守得住嗎!?
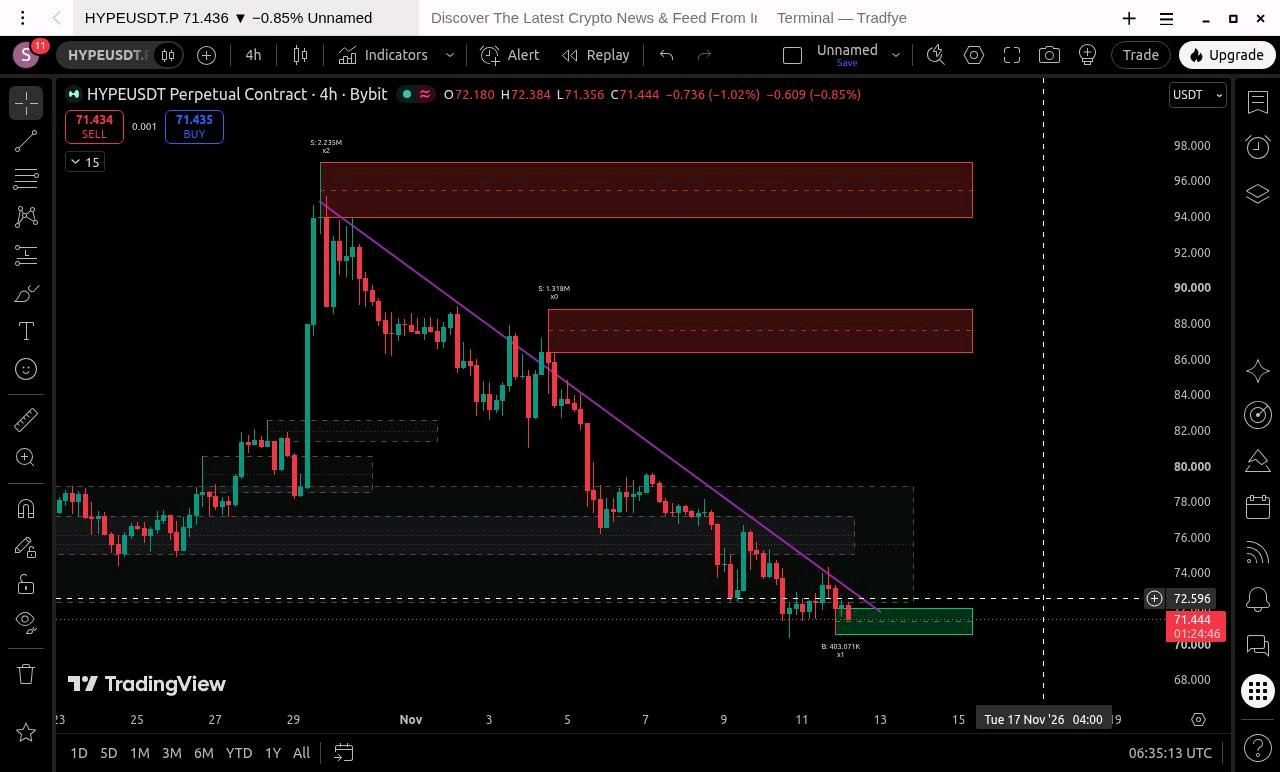
反彈還是跌破? Hyperliquid 已經從之前接近 97 美元的高點經歷了顯著修正,持續形成更低的高點和更低的低點。下降的紫色趨勢線清楚地反映了持續的拋售壓力。 現在 HYPE 的交易價格約為 71.44 美元,正接近一個關鍵決策區,接下來的走勢可能會決定其短期方向。 賣方仍佔主導地位 自從在 97 美元區域受阻以來,HYPE 持續下跌,一路上跌破了多個之前的支撐區域。 市場已經獲取了大量的下方流動性,但買方尚未展現足夠的強度來確認趨勢反轉。 值得注意的是,價格目前正接近 70–72 美元的需求區。 支撐位:70–72 美元 這是我正在密切關注的即時區間。 價格正在該支撐位附近盤整,同時下降趨勢線也正接近同一區域。 有兩種可能的情況: 看漲情境:如果買方守住 70–72 美元,且價格伴隨強勁成交量突破下降趨勢線,我們可能會看到回升至 75–76 美元,隨後可能進一步邁向 78 美元。 看跌情境:但如果賣方持續掌控局面,且 HYPE 決定性地跌破 70 美元,下一個潛在的下行區域可能在 66 美元左右,那裡有一個值得觀察的日線級別 FVG(公允價值缺口)。 目前,即時的確認位包括: - 70–72 美元:主要支撐和需求區。 - 72.60 美元:即時收復位。 - 75–76 美元:首個回升阻力位。 - 78–79 美元:下一個上方流動性/阻力區。 - 86–89 美元:更高阻力區。 - 94–97 美元:主要上方供應區。 4 小時線收盤價若能站上下降趨勢線,並得到買盤成交量放大的支持,將增強回升的可能性。 另一方面,如果多次測試趨勢線受阻,隨後跌破 70 美元,則傾向於進一步下跌。 基本面觀點❓ 在基本面方面也有一個有趣的發展:Upbit 宣布於 11 月 10 日上線 HYPE 對韓元 (KRW)、比特幣 (BTC) 和泰達幣 (USDT) 的交易對,擴大了其在韓國的市場准入。 這對可及性和潛在流動性來說是一個利多發展,但尚未逆轉看跌的價格結構。單純的上架並不能保證買盤壓力。 HYPE 已從 97 美元高點大幅回落,目前正接近 70–72 美元左右的重要支撐區。 在我看來,這是市場下一個重要的決策點。如果買方最終以強勁成交量突破下降趨勢線,回升至 78 美元便有可能實現。 但如果 70 美元的支撐位失守,我們可能會看到進一步向 66 美元日線 FVG 區域的下行延伸。 目前,我正在密切關注兩件事👀:70 美元的支撐位以及下降趨勢線的突破情況。 讓我們看看哪一方會佔據主導地位。 #ByXIMPACT $HYPEUSDT
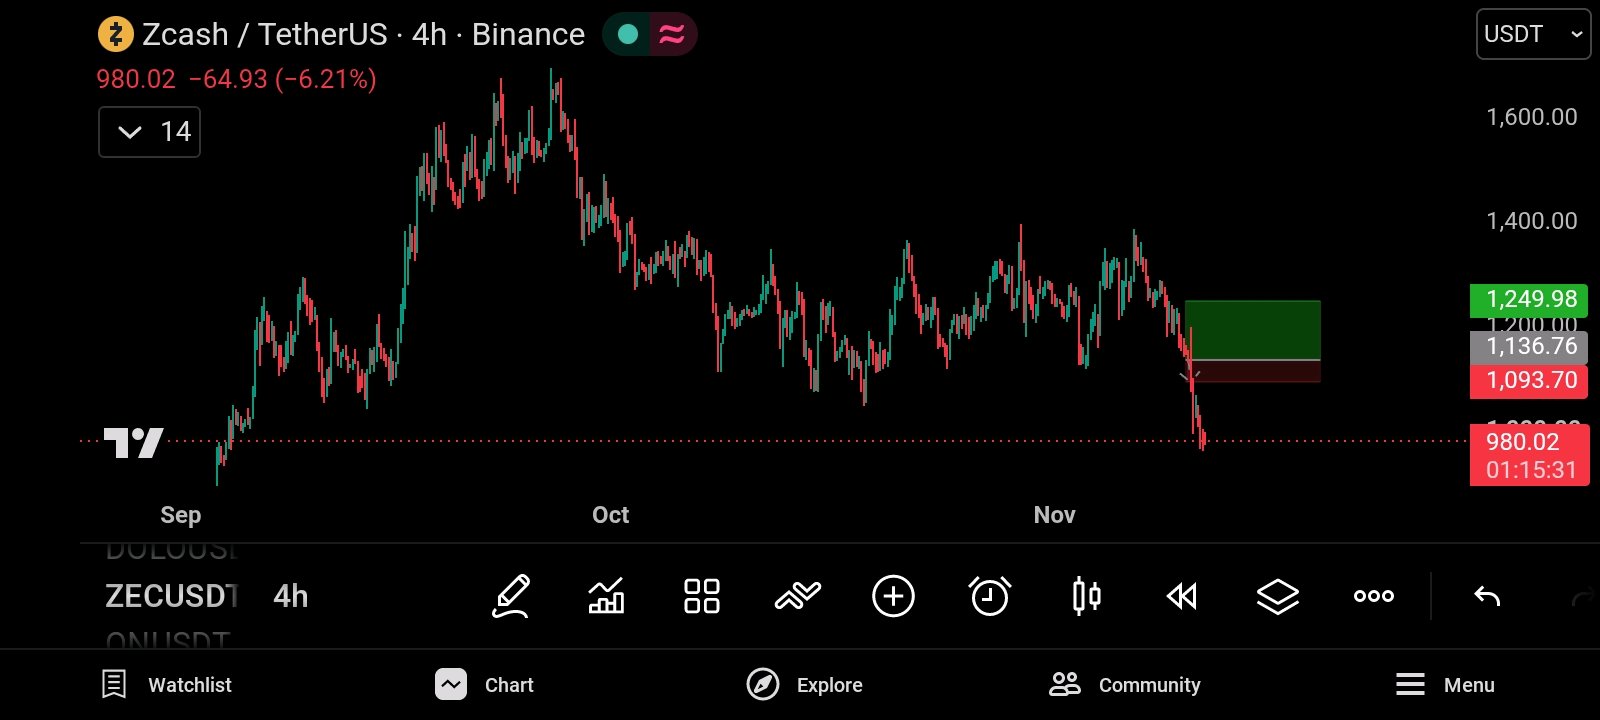
ZEC 支撐位跌破確認 👌 空頭掌握控制權
還記得我之前的分析嗎?我曾強調 ZEC 在經過多次測試後,可能會跌破重要的支撐位。如今這個情境已經發生了。 ZEC 曾短暫從 1,136 美元區域反彈至 1,198 美元左右,但買方未能保持動能。賣方強勢回歸,打破了支撐結構,並將價格推向 980 美元。 那麼,發生了什麼變化? 之前的支撐區未能守住,復甦嘗試也遭到拒絕。 這顯示買方正在失去控制,市場可能正進入另一個看跌階段。 我目前的下行展望如下: - 980 美元:目前的圖表參考區域。 - 910 美元:第一個做空目標。 - 800 美元:需關注的更廣泛下行區域。 如果價格能持續回升至跌破的支撐區域之上,將會削弱這種看跌情境。 Zcash 真的是弱勢嗎? 有趣的是,Zcash 的基本面發展並不完全是看跌的。 NU7 網路升級:Zcash 於 11 月 6 日啟動了主要的 NU7 升級,將目標出塊間隔從 75 秒縮短至 25 秒。它還引入了網路可持續性機制,將 60% 的交易手續費撥入儲備金。這些都是有意義的長期基礎設施改進。 隱私生態系統成長:CoinDesk Research 報告稱,Zcash 的 Ironwood 隱私池在 10 月增加了約 122,000 ZEC,而總隱私供應量增加了約 27,000 ZEC,達到約 497 萬 ZEC。 機構興趣:據報導,Grayscale 的 Zcash ETF 份額從 8 月上市到 10 月 30 日期間增長了 54.2%,顯示機構曝險正在增加。 然而,也有一些隱憂。在 NU7 啟動後,約有 12,224 ZEC 留在了已退役的 Sprout 池中,且 10 月的隱私交易活動平均每天約為 4,450 筆,較 9 月下降了約 36%。 有趣的是,Zcash 雖然有實質的長期發展進展,但其價格結構卻大幅走弱 📉。 這顯示正面的基本面目前尚未提供足夠的立即買盤壓力來克服賣壓。 除非價格能重回跌破的支撐區,否則我的短期展望維持謹慎偏空。 我的交易計畫 🔸 做空目標:910 美元 更廣泛的下行區域:800 美元 停損:1,120 美元 我將密切觀察賣方是否能維持控制,以及價格是否持續形成更低的高點。 風險管理至關重要。如果在 980 美元左右進場,1,120 美元的停損意味著約 140 美元的風險,而目標則是到 910 美元的 70 美元獲利。 這意味著回報風險比僅約 0.5:1,因此進場點、目標位或倉位大小都需要仔細重新評估。 ByXIMPACT
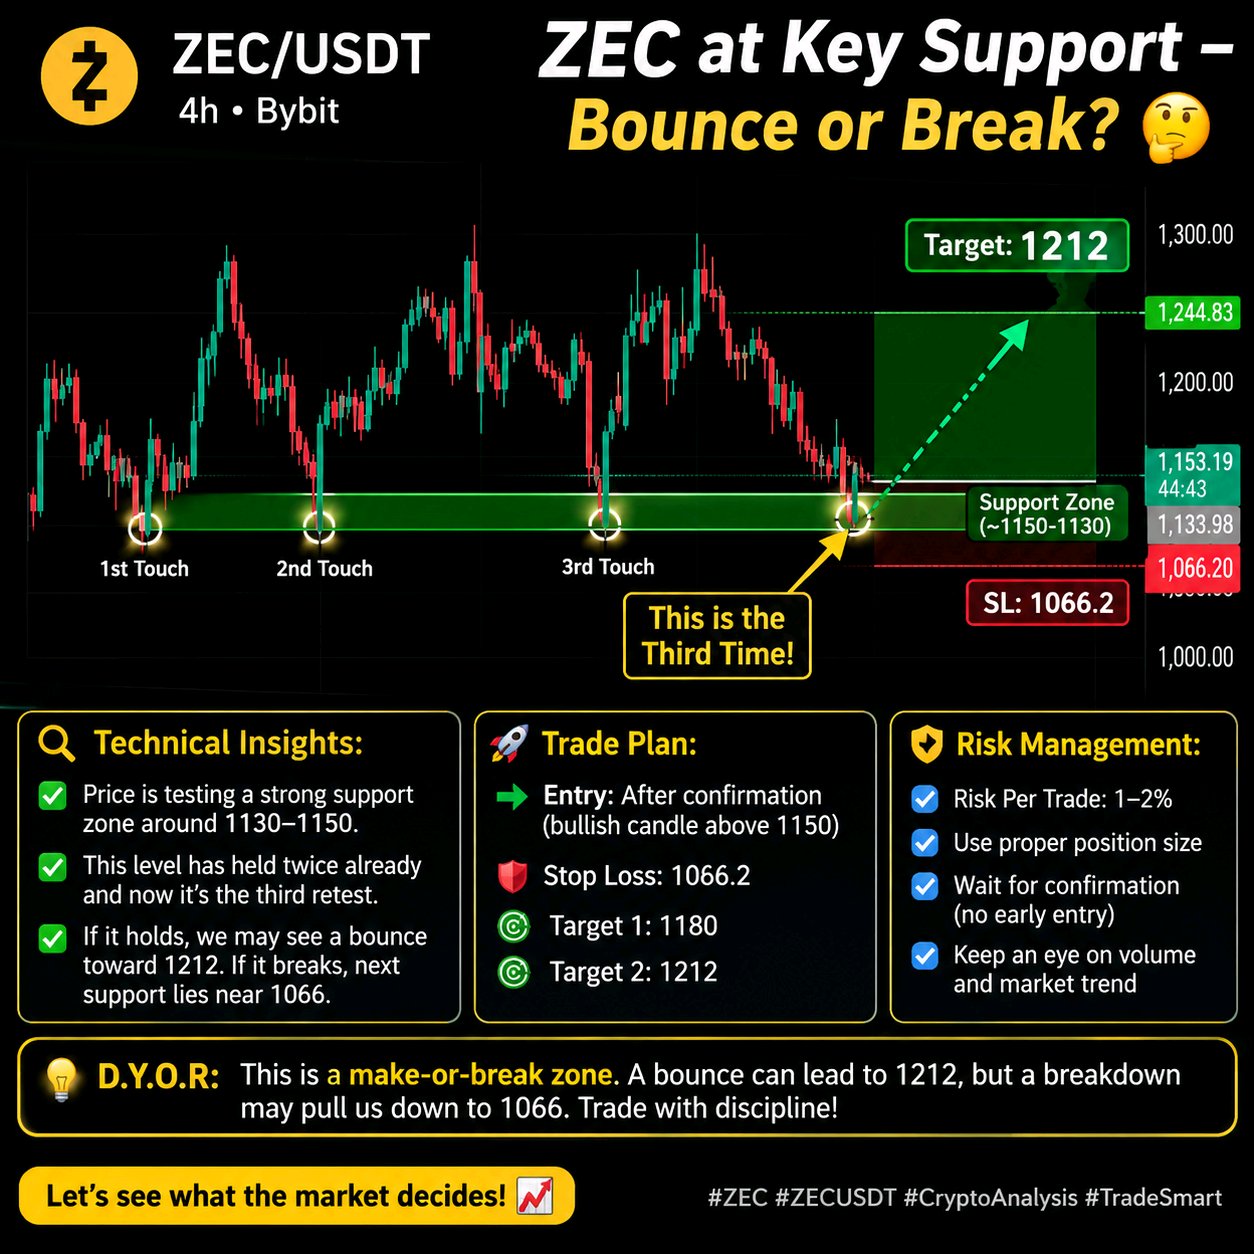
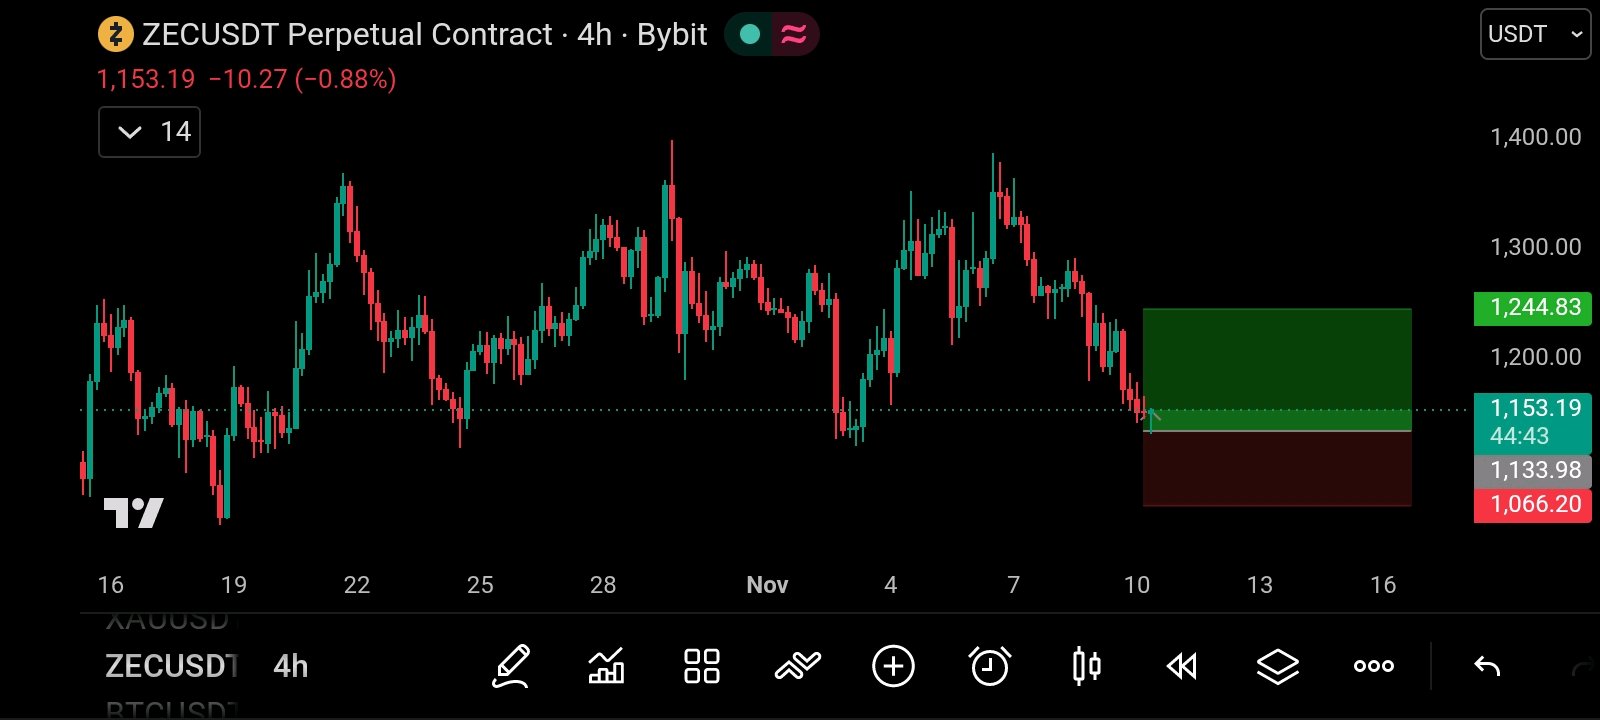
⚡ ZEC THIRD TEST OF SUPPORT BOUNCE OR BREAK?
ZEC is currently trading around $1,153, testing the important $1,134 – $1,153 support zone for the third time on the 4H chart. If buyers defend this area and we get a strong bullish confirmation, I'm interested in a potential LONG, targeting $1,212. My planned stop loss is $1,066.20. However, if support breaks decisively, the bullish setup is invalidated and further downside is possible. I'll wait for confirmation before entering no blind trades. Position sizing and risk management are essential, especially at a third support retest. Will ZEC bounce from here or finally break support? Let's see what the market decides! 👀 DYOR. Manage your risk and never trade blindly. #ByXIMPACT
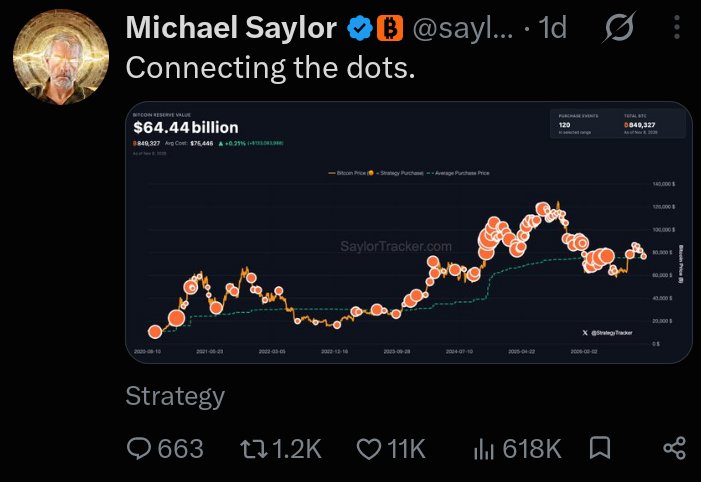
Michael Saylor dropped another Bitcoin tease!
"Connecting the dots" The Strategy chairman's latest X post has sparked speculation about another potential $BTCUSDT purchase. But there's a bigger story behind it. 🧵👇 🟠 Strategy reportedly holds 849,327 BTC, worth approximately $62.98 billion. 📉 Bitcoin falling below Strategy's average purchase price of $75,451 has pushed its holdings into roughly $1 billion in unrealized losses. Just a month ago, Strategy was reportedly sitting on nearly $10 billion in unrealized profits. A dramatic market reversal! 🐻 Bitcoin's Q4 2026 weakness is drawing comparisons with previous bearish cycles in 2014, 2018 and 2022. 📊 Analysts are also warning about weakening momentum, with BTC approaching its fifth consecutive weekly red candle. 💰 Despite the pressure, Strategy reportedly maintains $4.9 billion in USD reserves and recently acquired $208 million worth of STRC. 👀 Now everyone's watching Michael Saylor. Does "Connecting the dots" hint at another Bitcoin purchase? Or is it simply another message about his long term BTC conviction? One thing is clear that Strategy's Bitcoin strategy is facing another major market test. #IMPACTbyTrade #MidtermsMarketWatch
Bybit 藉由 Web Summit 擴大歐洲版圖
Bybit 透過與里斯本 Web Summit 2026 的合作,進一步鞏固其在歐洲數位金融領域的地位,此前該公司已在奧地利取得關鍵監管批准。 🗝️ Web Summit 2026 將於 11 月 9 日至 12 日舉行,這將為 Bybit 提供一個展示其歐洲策略、金融科技創新以及日益重視人工智慧的機會。 該公司擴張的一個重要里程碑是其歐洲業務所取得的監管進展。2025 年 5 月,Bybit EU GmbH 根據歐盟的 MiCA 框架獲得了加密資產服務提供商 (CASP) 的授權。最近,在 2026 年 8 月,Bybit Payments GmbH 獲得了奧地利金融市場管理局頒發的電子貨幣機構 (EMI) 牌照。 這些批准為 Bybit 在歐洲經濟區擴展其受監管的加密貨幣、電子貨幣和支付服務奠定了基礎。 在 Web Summit 期間,Bybit 高管將參與關於加密貨幣監管、人工智慧驅動的金融基礎設施以及數位金融未來的討論。該公司還將舉辦一場專注於自主交易代理的專家研討會。 除了加密貨幣交易外,Bybit 也在探索支付、美國股票、ETF 和投資服務方面的機會。 憑藉全球超過 8000 萬用戶,Bybit 正將自身定位為一個更廣泛的數位金融平台,結合了加密貨幣服務、傳統金融產品和新興的人工智慧技術。 Bybit 的歐洲擴張突顯了加密貨幣BTCUSDT、傳統金融與人工智慧之間日益融合的趨勢,各交易所正競相成為綜合性金融服務提供商。 #BybitAIEvolving
BNB Chain Dominates Daily Activity
🔥$BNBUSDT Chain just hit 4.86 million active addresses in the last 24 hours ranking #1 among all public blockchains. For comparison: • Solana → ~1.97M • Ethereum → ~535K • Base → ~312K That’s roughly 2.5x Solana and 9x Ethereum in daily active addresses.$SOLUSDT Strong on chain activity continues even as BNB price sits near $684. #NovUSCPIWatch #BybitAIEvolving #WSOT2026

BTC next year !?
Guys what is your analysis about $BTCUSDT for next year 🙃 ? Are we heading towards another massive bull run, or should we expect a major correction? 🤔📈 Would love to hear your thoughts and predictions! 🚀
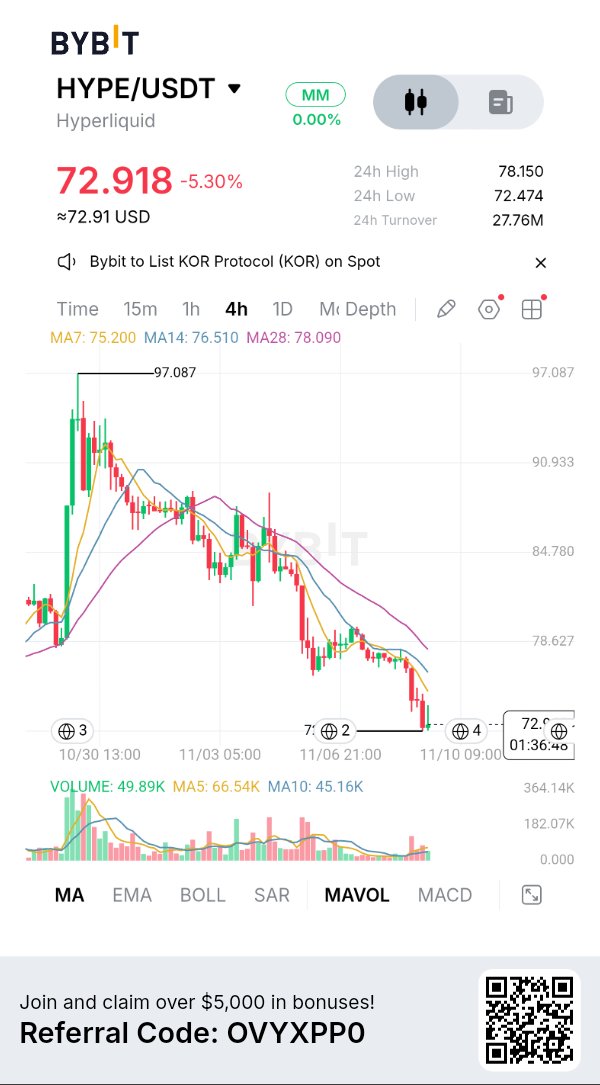
HYPE 從 97 美元的高點大幅回落,目前正試圖在 72.00 – 75.00 美元的區間築底 🌐⚡。 儘管像 Elysium L2 啟動這樣的生態系基本面依然強勁,但價格走勢需要耐心 📊。關鍵觀察點位在 75.20 美元——重新站上該價位是復甦的第一個真正訊號 💎📈。 保持倉位規模的紀律,讓市場來確認反轉吧! 你的看法是什麼?你會在 72 美元的支撐位買入,還是等待 75.20 美元收復後再進場?歡迎在下方留言分享!👇$HYPEUSDT #IMPACTbyTrade
🚀 SOLANA: RECOVERY INCOMING?
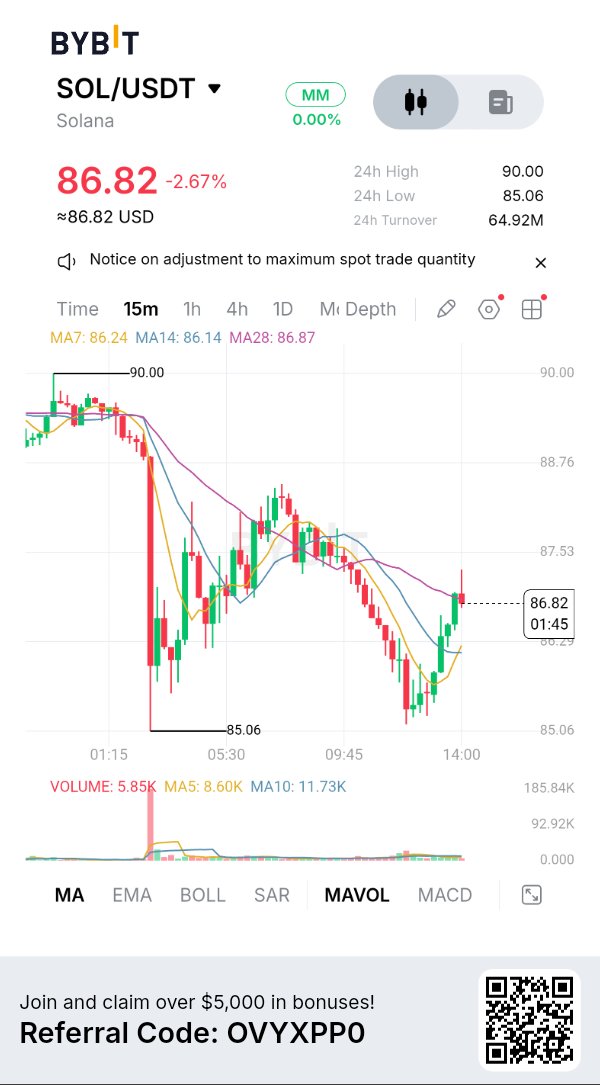
$SOLUSDT dropped sharply from the $96 resistance zone toward $85, but buyers are now showing some strength on the 15-minute chart. If SOL reclaims $88.25 with confirmation, we could see a recovery toward $90 and potentially $92. A long setup may develop, but the 4H trend remains bearish, so patience and proper risk management are essential. Can SOL make a comeback? 👀📈 #SOLUSDT #NovUSCPIWatch #WSOT2026
🚨 3.44 億美元的比特幣發生異動
一筆巨額比特幣轉帳使川普媒體(Trump Media)成為市場焦點。據報導,標記為「2028 可轉換票據抵押品」的錢包分兩筆交易將 4,259 枚比特幣(價值約 3.44 億美元)轉移至一個 Crypto.com 地址。 這幾乎佔了川普媒體所持比特幣總量的 30%。 然而,轉帳並不等同於拋售。據報導,五月和八月曾發生過類似的資金移動,但並未引發市場清算,這暗示此次行動背後可能只是託管重組或抵押品管理。$BTCUSDT 更令人關注的是 11 月 30 日這個時間點。 根據相關證券備案文件,票據持有人可能有權要求最高 10 億美元的現金贖回。鑑於此前報告的現金儲備約為 4.25 億美元,投資者正密切關注是否有資產拋售或進一步抵押安排的跡象。 關鍵問題在於:這僅僅是機構資產負債表的管理,還是比特幣可能成為應對未來企業債務的流動性來源? 目前,鏈上數據已證實了該筆轉帳,但尚未有跡象顯示比特幣已被實際售出。請勿將錢包活動與市場拋售壓力混為一談。📊 #WSOT2026 #NovUSCPIWatch #美國就業數據與利率決策主導本週宏觀市場

Bitcoin on Decision point
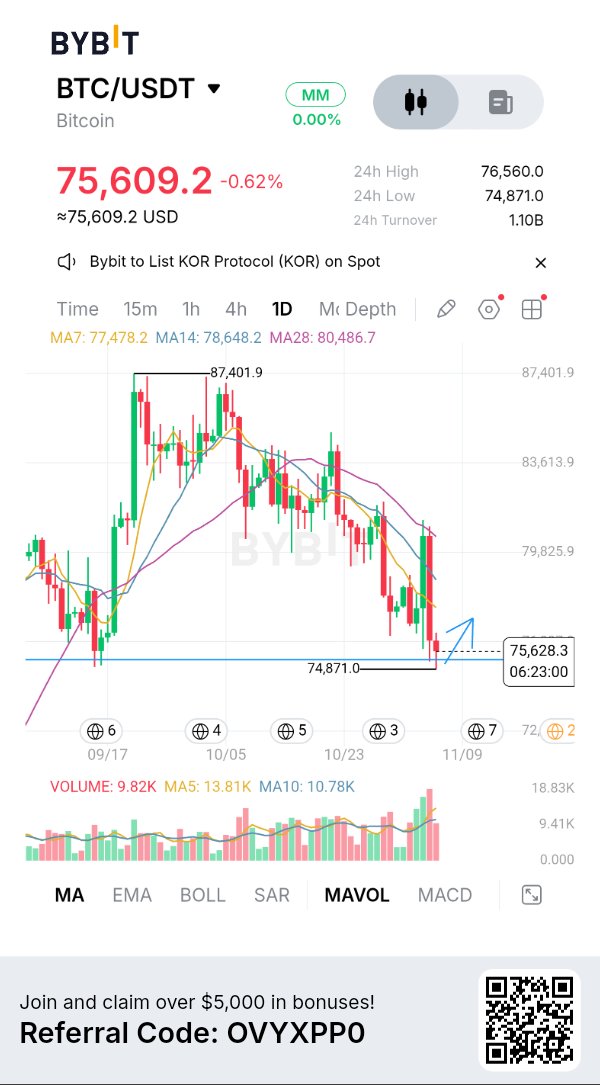
$75K SUPPORT — WILL BULLS DEFEND THE FLOOR? 🚀 Bitcoin is currently pressing into the critical $75,000 support region after a continuous pullback from local highs near $87,400 🌐. The Daily chart highlights a liquidity sweep down to $74,871, putting the market at a pivotal make or break juncture 📈. This is a major key level where buyers need to step in to prevent a deeper macro correction. Can $BTCUSDT stabilize here and launch a recovery toward $78,000–$80,000, or do we need further downside liquidity before a true bounce? Let’s break it down 🧠. 1. The $75K Support Test: Key Observations 🔍 Price action on the 1D timeframe shows clear selling pressure dragging BTC below its moving averages (MA7: $77,478, MA14: $78,648, MA28: $80,486) 📉. Liquidity Sweep: BTC swept lower to $74,871 before absorbing immediate selling pressure, leaving a small wick on the daily candle 🟢. Volume Profile: Daily volume shows persistent selling, but volume is beginning to contract near the support floor, indicating potential seller exhaustion 🛡️. 2. The Recovery Targets: What Bulls Need to Claim 🧱 If buyers defend this daily support floor, the primary objective will be reclaiming the overhead moving averages 📊. Immediate Resistance: $77,400 – $78,600 (Confluence of MA7 and MA14) 🛑 Major Breakout Target: $80,400 MA28 defense line 🚀 Extended Upside Target: $83,600 – $87,400 Macro swing high reclamation 🎯 The Bullish Scenario: A strong daily candle close back above $76,500 confirms aggressive buying interest, opening the doors for a rapid relief rally toward $78,000–$80,000 ⚡. The Cautionary Scenario: If BTC fails to hold the $74,800 low and loses daily support, the market risks extending its pullback toward lower demand zones before establishing a permanent bottom 📉. 🎯 Key Levels to Watch 👀 Current Resistance: $77,478 MA7 line 🛑 Major Breakout Zone: $78,600 – $80,486 (MA14 & MA28 confluence) 🟢 Critical Support Floor is $74,871 – $75,000 Local low & daily demand 🛡️ Macro Upside Target: $78,000 – $80,000 (Relief rally targets)$XRPUSDT 🎯 for now Bitcoin is putting buyers to the test at the $75,000 support zone 🌐⚡. While a bounce toward $78,000–$80,000 remains a solid high-probability scenario, we still need actual buying volume and a strong daily closing reaction to confirm the reversal 💎📈. Don't rush into unconfirmed trades wait for structural confirmation, respect your stop losses, and trade disciplined. What’s your plan,Are we holding $75K for a reversal to $80K, or breaking lower first? Drop your thoughts below! 👇 #IMPACTbyTrade #WSOT2026 #NovUSCPIWatch