Keffeel
93357點贊140分享774粉絲1關注
"We don't predict the future, we master the art of reading its data. Where the noise ends, my strategy begins to transform volatility into stable numbers."
"We don't predict the future, we master the art of reading its data. Where the noise ends, my strategy begins to transform volatility into stable numbers."
⚠️ $ETH:機構資金正在撤出 ETF,但交易所儲備也在下降——究竟發生了什麼? 以太坊目前面臨嚴峻的市場環境,但情況並非僅僅是價格下跌那麼簡單。 截至 11 月 15 日,在經歷了顯著的拋售壓力後,ETH 的交易價格在 1,800 美元附近徘徊。 最耐人尋味的是機構基金流出與交易所儲備下降之間的對比。 讓我們跳脫 K 線,審視更大的格局。 🔴 1. 市場正承受壓力 以太坊正與比特幣及整個加密貨幣市場一同走低。 多種因素導致了這種疲軟: - 對利率上升的預期。 - 市場範圍內的拋售壓力。 - 衍生品市場的強制清算。 - 現貨 ETH ETF 的機構需求疲軟。 這表明目前的下跌未必是由以太坊本身的新基本面問題所引起的。 📉 2. 機構流向:一個警示訊號 一個重要的發展是,在 11 月 9 日至 11 月 13 日期間,美國現貨以太坊 ETF 錄得約 3.989 億美元的淨流出。 這顯示機構投資產品在那段期間承受了顯著的拋售壓力。 然而,ETF 的資金流出不應被自動解讀為對以太坊的長期信心已蕩然無存的證據。 它們只是更宏大市場圖景的一部分。 📊 3. 交易所儲備悖論 這是另一個值得關注的動態。 據報導,幣安(Binance)上的以太坊儲備已降至約 290 萬枚 ETH,達到近五年來的最低水平。 這造成了一種有趣的對比: - ETF 的流出顯示機構投資需求承受壓力。 - 交易所儲備的下降顯示交易所標籤錢包中持有的 ETH 變少了。 這是否反映了更長期的提幣行為以及交易所即時可用供應量的減少? 有可能。 但交易所提幣並不自動證明是積累或新買盤。 這正是為什麼鏈上數據需要謹慎解讀的原因。 ⚡ 4. 關鍵的技術點位 根據 11 月 15 日的市場分析,我正在監控以下關鍵區域: 支撐區間:1,790–1,814 美元 守住這一區域可能會讓 ETH 嘗試反彈。 首個反彈阻力:1,838–1,868 美元 若能持續收復此區間,短期技術前景將有所改善。 關鍵下行參考點:1,712 美元 若跌破此支撐結構,可能會讓 ETH 面臨另一次重大考驗。 這些是監控點位,而非保證達到的目標。 🧠 5. 什麼會改變我的市場觀點? 如果出現以下情況,我會變得更樂觀: - ETH 維持在 1,790–1,814 美元的支撐位。 - 價格收復 1,838–1,868 美元。 - 現貨買入活動改善。 - ETF 的流出開始趨於穩定。 - 衍生品倉位變得更健康。 另一方面,若持續跌破支撐位,且伴隨著拋售壓力的增加,將使短期復甦的情境失效。 🎯 6. 自律的方法 與其因為 ETH 下跌就盲目買入,我會將潛在的曝險分為幾個階段來觀察: 1. 觀察支撐是否守住,以及拋售壓力是否減弱。 2. 尋求價格回升與參與度增強的確認訊號。 3. 僅在阻力位被收復後,才評估增加曝險。 總曝險額應由預設的風險限額決定。 如果支撐失效,正確的反應是重新評估論點,而不是自動增加曝險。 🔥 我的大局觀 以太坊目前面臨兩股相互抗衡的力量。 一方面,機構 ETF 的流出和全市場的清算正在造成壓力。 另一方面,交易所儲備的下降引發了關於 ETH 供應移動與可用性的有趣問題。 這兩項發展都不足以單獨決定下一個市場方向。 真正的確認必須來自價格行為、流動性、機構資金流向以及持續的需求。 我相信接下來的幾個交易時段對於判斷以太坊能否企穩,或是賣方是否還有進一步打壓的空間至關重要。 你對現在的 ETH 有什麼解讀? 我們目睹的是暫時由流動性驅動的修正,還是市場正在進入更深度的看跌階段? 讓我們討論數據,而不僅僅是預測。 $ETHUSDT $ETHUSDC #ByXIMPACT

加密貨幣新聞摘要 | 日期:2026 年 11 月 | 資產:$XRP 標題:價格之外:XRP Ledger 目前正在發生的真實故事 📰⚡ 價格走勢是一回事,但 XRP Ledger 上的基本面發展卻講述著一個完全不同的故事。當市場在應對短期波動時,網路本身正在經歷現實世界實用性的巨大飆升。以下是我對推動該生態系統的最新新聞的即時觀點。 📊 實際交易背景(基本面數據): · 網路活動爆發:根據 XRPScan 的數據,XRP Ledger 剛剛創下 11 月新高。11 月 3 日批量交易達到 196.2 萬筆,11 月 7 日 Ticket 使用量達到 155.3 萬筆。更令人印象深刻的是,活躍帳戶增加了 128%,支付量在單個 24 小時窗口內飆升了 137%。 · 機構信任重申:SBI Holdings 董事長北尾吉孝 (Yoshitaka Kitao) 於 11 月 12 日公開重申了他對 XRP 的信心,以簡單的「YES」回應了社區的擔憂。自 2021 年以來,SBI 一直使用 XRP 進行跨境支付,並於 2024 年 5 月啟動了 XRPL 驗證節點。 · 技術升級即將到來:XRP Ledger 計劃於 12 月 3 日部署 3.5.0 版本,其中包括對 10 月份出現的偶發性帳本關閉緩慢問題的永久修復。此外,Ripple 與 Privy(Stripe 旗下)合作,為 XRPL 引入嵌入式可程式錢包,同時支援 XRP 和 RLUSD。 💼 我的現貨觀點(長期視角): 我不是來追逐 5% 的蠟燭圖漲幅的。這些新聞證實了基礎設施正在成長,無論價格如何。批量交易的激增是機構採用(託管轉帳、跨境結算)的直接訊號。 · 我的行動:我正在密切關注 1.00 美元心理關卡附近的價格(最近跌至 0.89 美元),作為我現貨投資組合的潛在累積區。 · 我在觀察什麼:鯨魚錢包。數據顯示,持有 100 萬枚以上 XRP 的錢包最近達到 2,147 個的年度高點,這表明大戶正在這次回調中進行累積。 價格只是雜訊,但網路正在成長。你關注的是基本面,還是僅僅是蠟燭圖?👇 $XRPUSDT $XRPUSDC #ByXIMPACT

🩸 $BTC 跌至 6.2 萬美元:導致流動性真空的 5 大宏觀因素。(以及為什麼 CZ 在買入)。 市場瀰漫著恐慌。**$BTC** 剛剛插針至慘烈的 62,006 美元,散戶交易者全面遭到清算。但當大眾恐慌時,幣安創始人 CZ 剛在 X 上給大家上了一堂市場心理學大師課。 他明確表示:「我沒有賣出。我只買入;我進行了定期的每日買入。」他甚至開玩笑說,他的穩定幣定投(DCA)可能是導致價格下跌的原因。 作為一名專業的現貨交易者,我不會對紅 K 線做出反應;我分析行情走勢背後的機制。以下是 CZ 強調的 5 個因素的分析,以及我如何應對這次流動性真空。 🔍 CZ 對此次下跌的 5 點分析: 1. Anthropic IPO 的流動性抽離:投資者正在拋售風險資產,以便為大規模的 Anthropic IPO(643.5 億美元發行規模,11 月 18 日定價,11 月 19 日交易)騰出資金。資本正在輪動。 2. 大規模 ETF 流出:比特幣現貨 ETF 連續 7 天出現流出,總額達 **19.1 億美元**(其中 14.2 億美元流出貝萊德的 IBIT)。以太坊現貨 ETF 另流出了 5.92 億美元。 3. 安全與基礎設施方面的 FUD:近期幣安遭遇攻擊、iPhone 關聯錢包被清空、Chrome 漏洞以及微軟當機事件,動搖了散戶的信心。 4. 聯準會與宏觀壓力:美國高通膨重燃了市場對再次升息的恐懼。債券殖利率上升和強勢美元正在積極從風險資產中抽走流動性。 5. 政治不確定性:市場擔心美國期中選舉後加密貨幣政策可能收緊。 🧠 「聰明錢」的心理: 注意這種反差。當散戶因上述 5 個因素而恐慌性拋售時,CZ 正在用穩定幣進行定投。他明確表示,加密貨幣產業在中長期內將持續成長。這就是憑情緒交易與基於結構性現實交易之間的區別。 🎯 我的現貨執行計畫(應對回調): 我不會盲目地去接這把掉落的飛刀。我採取了 CZ 的心態,但使用了嚴格的技術確認。我嚴格進行現貨交易,這意味著在市場尋底的過程中,我沒有清算風險。 · 觀望策略:我不會在目前價格買入。ETF 的流出和即將到來的 Anthropic IPO 將至少在 11 月 19 日前給市場帶來壓力。 · 我的累積區:我已在宏觀支撐位(60,000 美元 - 61,500 美元區間)掛好了分批限價買單。如果 IPO 的流動性抽離導致價格觸及低點,我要確保能接到這些籌碼。 · 我的第一個指盈目標 (TP1):65,000 美元(收復心理關口與局部阻力)。我將在此分批出場一部分。 · 我的硬性失效點:如果比特幣日線收盤低於 58,000 美元,宏觀結構將嚴重破壞,我們很可能進入更深的熊市週期。我將持有我的 USDT 並繼續觀望。 💡 讓我們建立一個真正的社群(ByX IMPACT): 流動性真空令人恐懼,但它為現貨交易者創造了難得的進場點。CZ 正在逢低買入;問題是,你會恐慌性拋售,還是會管理好風險並分批進場? 你是在購買這次 6.2 萬美元的 BTC 回調,還是等待 Anthropic IPO 結束後再進場?讓我們在下方討論真實的現貨策略。👇 $BTCUSDT $BTCUSDC #ByXIMPACT

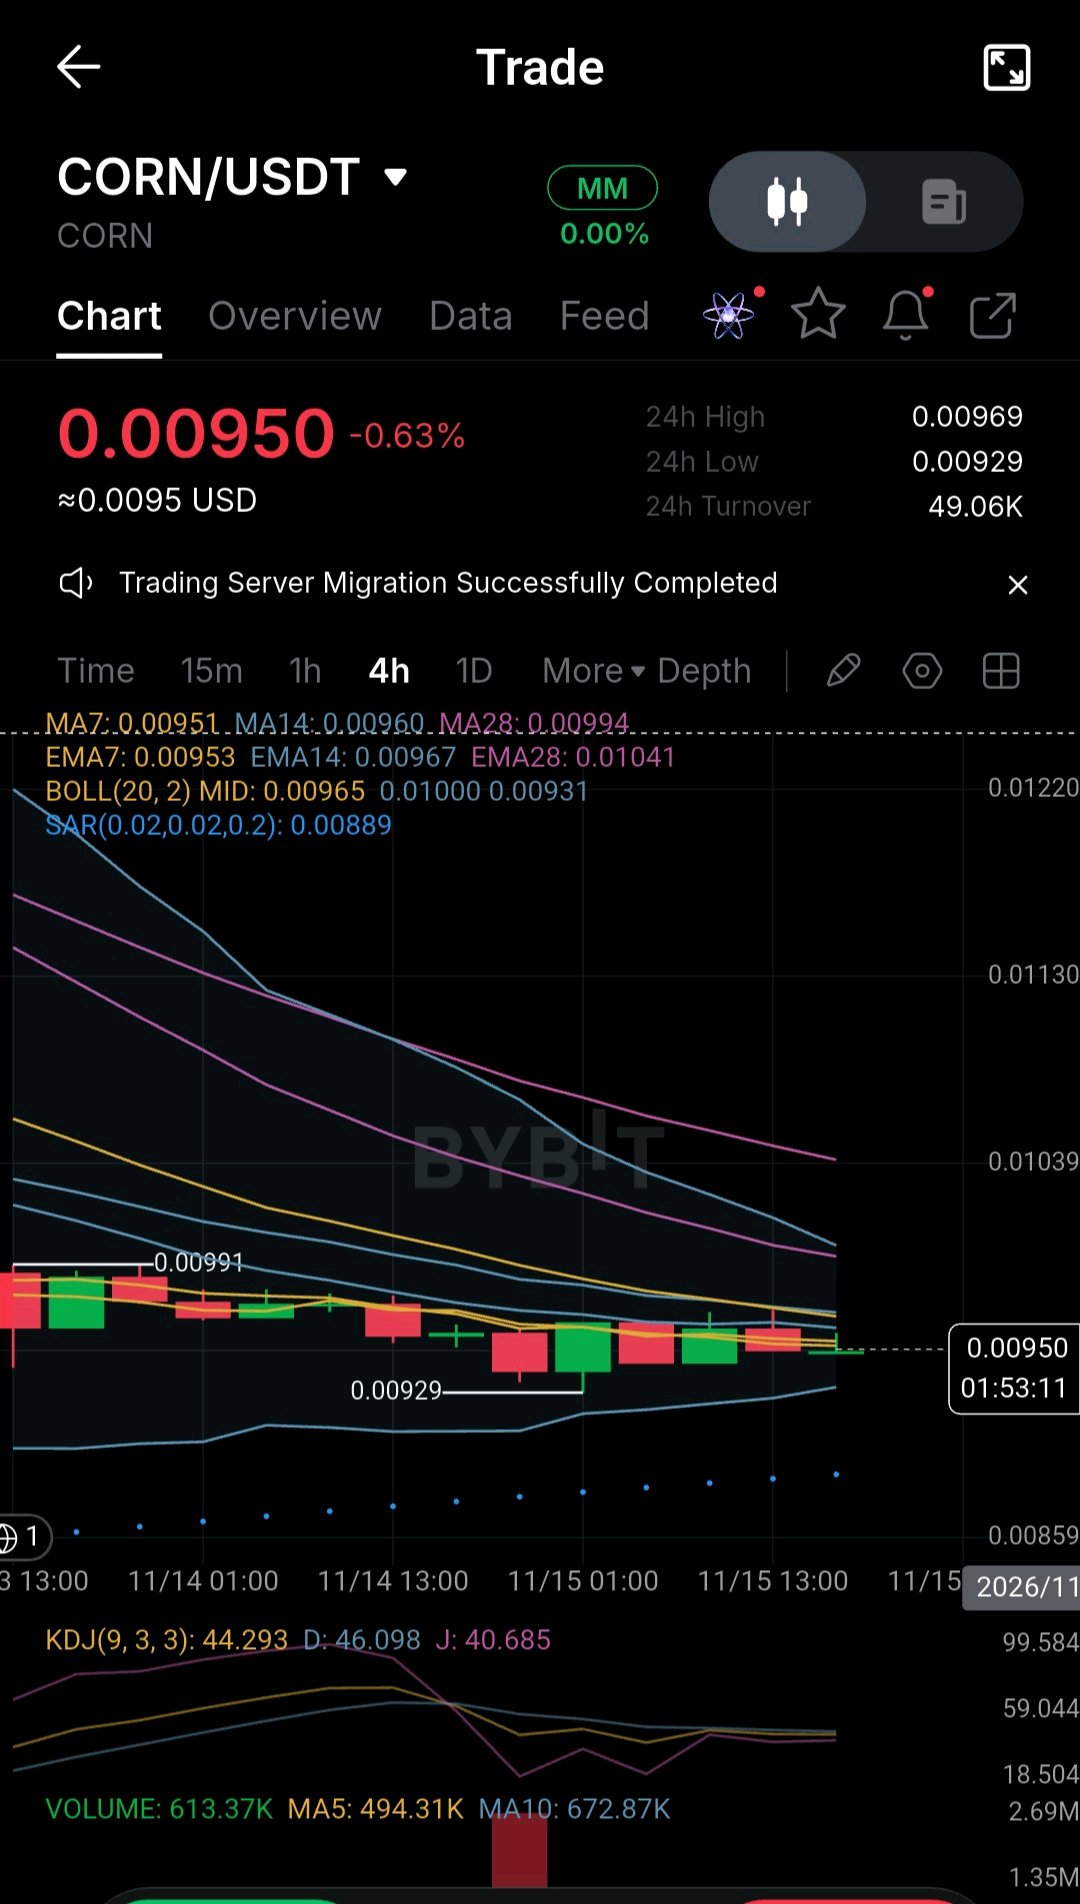
⚠️ $CORN: THE MARKET IS LOSING MOMENTUM — IS THIS A BASE FORMATION OR THE CALM BEFORE ANOTHER DROP? Sometimes the most important market signals appear when price stops moving aggressively. That is the situation I am watching on CORN/USDT. After a period of downward pressure, price is now moving within a relatively narrow range around $0.00950. But there is an important distinction between a market stabilizing and a market actually reversing. Let's examine the evidence on the 4H chart. 📉 1. THE BEARISH STRUCTURE HAS NOT DISAPPEARED CORN is currently trading around $0.00950, down approximately 0.63% according to the displayed market data. The moving averages remain above the current price: - MA7: $0.00951 - MA14: $0.00960 - MA28: $0.00994 The exponential averages tell a similar story: - EMA7: $0.00953 - EMA14: $0.00967 - EMA28: $0.01041 This arrangement shows that the broader short-term structure remains under pressure. The recent sideways movement is interesting, but it is not enough to declare a bullish reversal. 🔬 2. THE BOLLINGER BANDS REVEAL AN IMPORTANT BATTLE ZONE Current readings: - Upper Band: $0.01000 - Middle Band: $0.00965 - Lower Band: $0.00931 Price is trading below the middle band and relatively close to the lower boundary. For me, the $0.00960–$0.00965 region is the first important recovery test. A sustained reclaim of this area would suggest that buyers are beginning to regain some control. A move toward $0.00994–$0.01000 would provide a stronger test of the recovery. ⚡ 3. MOMENTUM IS STILL NEUTRAL TO WEAK The KDJ indicator currently shows: - K: 44.293 - D: 46.098 - J: 40.685 K remains slightly below D. This means there is no confirmed bullish crossover in the displayed readings. I would rather wait for a clearer improvement in momentum than interpret every small green candle as a reversal signal. 📊 4. VOLUME: A MIXED PICTURE The displayed volume readings are: - Current Volume: 613.37K - MA5: 494.31K - MA10: 672.87K Volume is above its five-period average but remains below its ten-period average. This suggests some recent trading activity, but not yet a convincing expansion in participation. A sustained recovery should ideally be accompanied by stronger buying volume. 🎯 5. MY TWO SCENARIOS FOR CORN Bullish scenario: Price reclaims $0.00960–$0.00965, maintains that area, and subsequently challenges $0.00994–$0.01000 with stronger volume. That would improve the stabilization thesis. Bearish scenario: Price fails to reclaim the middle Bollinger Band, then breaks below $0.00931–$0.00929. Such a move would weaken the current range structure and suggest that sellers remain in control. The SAR reading at $0.00889 is another technical reference to monitor, not a guaranteed downside target. 🧠 6. A DISCIPLINED SPOT APPROACH I would not treat the current price as an automatic buying opportunity. A conditional approach would involve: - First stage: Wait for evidence that selling pressure is easing and support is holding. - Second stage: Consider confirmation only after price reclaims $0.00965 with improving volume. - Third stage: Evaluate further exposure only if the $0.00994–$0.01000 resistance zone is convincingly recovered. The total exposure should be determined in advance according to individual risk limits. If price breaks below $0.00929, the stabilization thesis needs to be reassessed rather than averaging down automatically. 🔥 MY FINAL TAKE CORN is currently showing a market that has slowed down after downward pressure, but slowing momentum is not the same as a confirmed recovery. The most important evidence will come from the reaction around $0.00965 and whether buyers can eventually challenge $0.01000. I am watching the structure, not chasing the candles. What do you think comes next for CORN: a genuine stabilization phase or another breakdown below support? Let's discuss the levels and the evidence. $ZAMAUSDT $TRXUSDT #ByXIMPACT

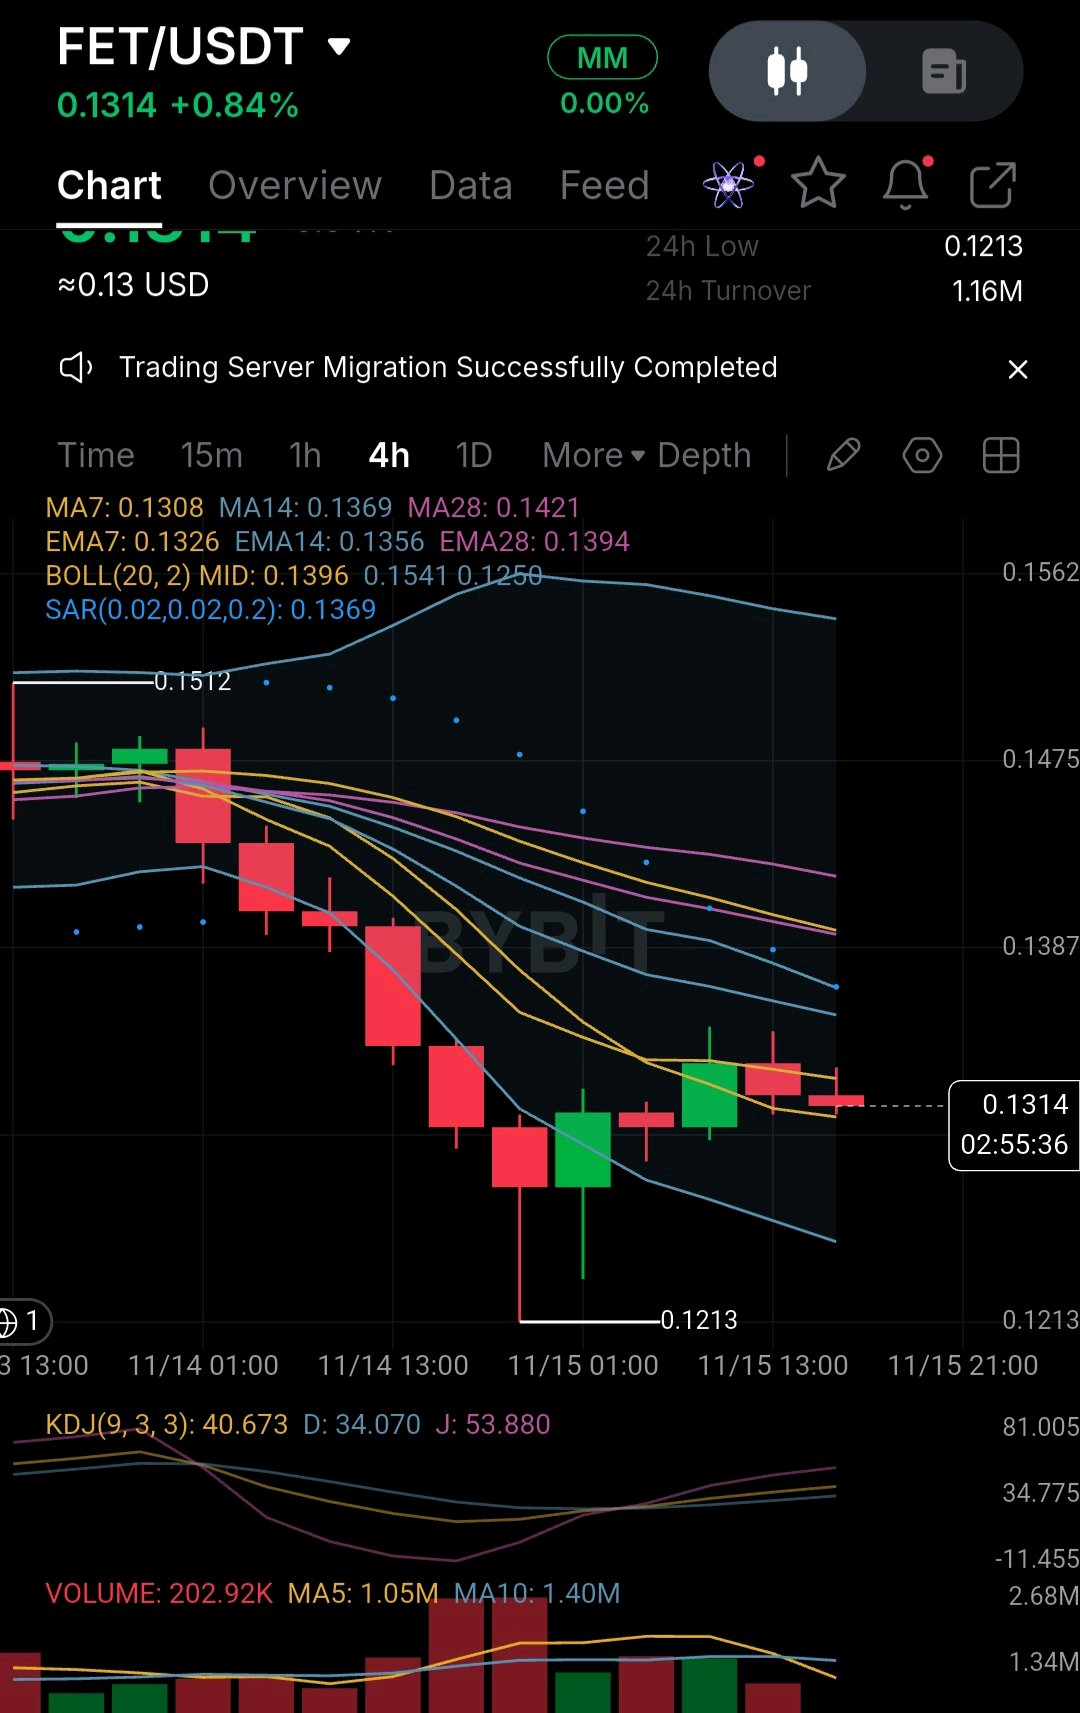
⚠️ $FET: THE SELL-OFF HAS SLOWED, BUT IS THE RECOVERY STRONG ENOUGH TO CHANGE THE TREND? Not every green candle signals a bullish reversal. And that is exactly why the current FET/USDT structure deserves a closer look. After a significant decline toward $0.1213, FET has started showing signs of a short-term recovery. Buyers are attempting to regain control, but the bigger technical picture still presents several challenges. Let's examine what the 4H chart is actually revealing. 🔎 THE FIRST CLUE: A RECOVERY INSIDE A WEAK STRUCTURE FET is currently trading around $0.1314. The price has moved slightly above its MA7 at $0.1308, which is an encouraging short-term development. However, the broader moving averages remain above the current price: - MA14: $0.1369 - MA28: $0.1421 - EMA14: $0.1356 - EMA28: $0.1394 This tells us something important: short-term buyers are becoming more active, but the medium-term structure has not yet recovered. 📊 THE REAL TEST: CAN BUYERS RECLAIM RESISTANCE? There are several technical areas worth monitoring: - $0.1356–$0.1369: The first important resistance zone. - $0.1396: The Bollinger middle band and a key recovery level. - $0.1421: The MA28 resistance. A sustained move above these areas would gradually improve the technical outlook. Until then, the recovery should be treated with caution. ⚡ MOMENTUM IS IMPROVING, BUT CONFIRMATION IS MISSING The KDJ indicator currently shows: K: 40.673 D: 34.070 J: 53.880 With K above D, short-term momentum is showing signs of improvement. This could support further recovery, but momentum indicators can turn quickly when buying pressure is weak. 📉 THE VOLUME PROBLEM One of the most interesting details is trading volume. Current volume: 202.92K MA5 Volume: 1.05M MA10 Volume: 1.40M Participation remains relatively weak compared with the displayed volume averages. This makes the current recovery less convincing. A stronger move accompanied by expanding volume would provide better evidence that buyers are genuinely returning. 🛡️ WHAT IF THE RECOVERY FAILS? The downside levels deserve equal attention. The $0.1250 area is an important technical reference based on the lower Bollinger Band. Below that, $0.1213 represents the recent visible low. A breakdown below these areas would weaken the recovery scenario and suggest that sellers may still have the upper hand. 🎯 MY MARKET PERSPECTIVE I am not treating this move as a confirmed trend reversal. What I see is an asset attempting to recover after a significant sell-off, while important resistance levels remain overhead. The next phase will depend on three things: 1. Whether FET can reclaim $0.1369. 2. Whether buying volume starts expanding. 3. Whether price can eventually recover the $0.1396–$0.1421 zone. The most important question is not how much FET has bounced. It is whether buyers can sustain that bounce. What is your interpretation of FET right now: an early recovery opportunity, or simply a temporary pause in the broader downtrend? Let's focus on price action, volume, and confirmation rather than assumptions. $FETUSDT $FIGHTUSDT #ByXIMPACT

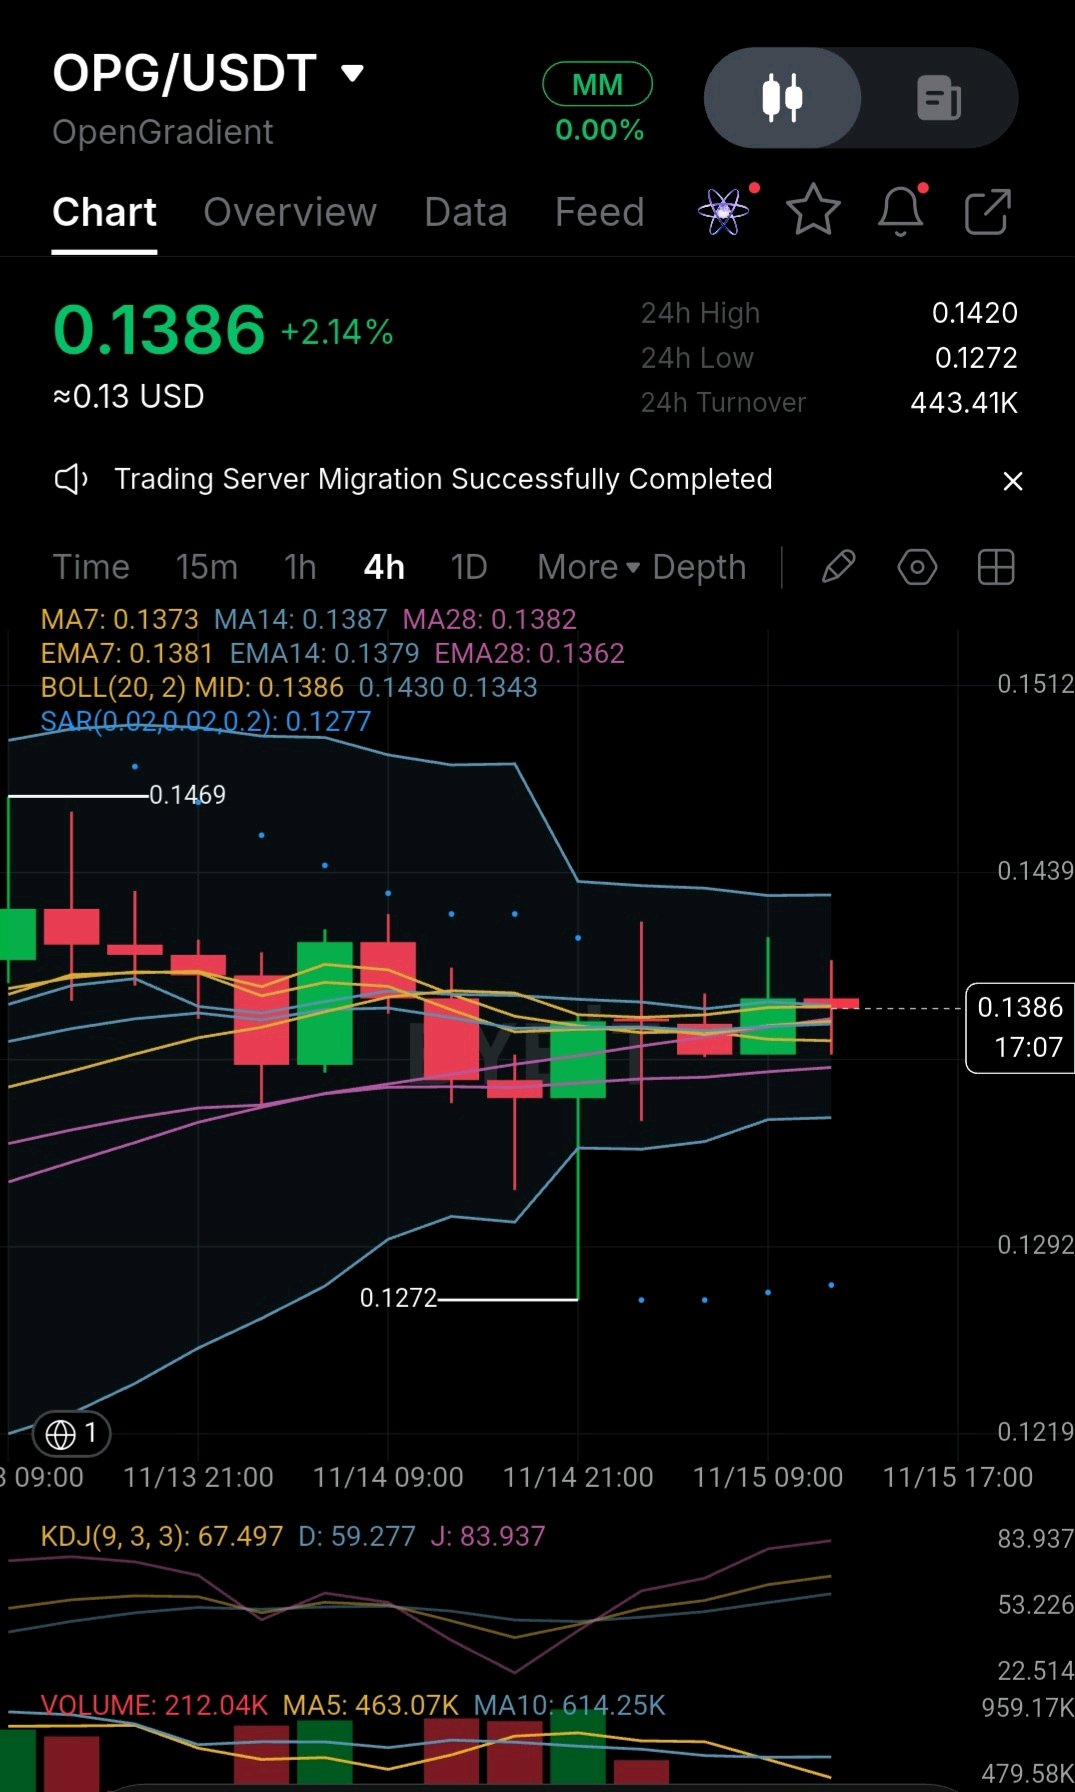
🚀 $OPG:下一波行情前的蓄勢?4 小時線圖到底透露了什麼訊號! OpenGradient ($OPG) 的走勢圖呈現出一個值得關注的有趣局面。 我不打算直接假定短期的價格上漲就代表看漲反轉,我想檢視技術指標到底呈現了什麼,以及接下來需要發生什麼變化。 📊 1. 當前市場結構 在 4 小時線圖上,$OPG 目前交易價格約為 $0.1386,顯示 24 小時漲幅為 2.14%。 移動平均線密集交錯: - MA7:$0.1373 - MA14:$0.1387 - MA28:$0.1382 指數移動平均線也相當接近: - EMA7:$0.1381 - EMA14:$0.1379 - EMA28:$0.1362 這種密集交錯暗示著短期盤整期,市場正在嘗試確立下一個方向。 然而,盤整本身並不代表就是蓄勢,也不保證會向上突破。 📈 2. 布林通道 (Bollinger Bands):關鍵價格區間 布林通道目前的數據顯示: - 上軌:$0.1430 - 中軌:$0.1386 - 下軌:$0.1343 價格目前在中軌附近交易。 若能確認突破 $0.1420,隨後維持在 $0.1430 之上,可能會加強看漲情境。 另一方面,若跌破 $0.1343 區域,將會削弱當前的穩定論點,並增加再次向下修正的可能性。 ⚡ 3. KDJ 指標:短期動能改善中 目前的 KDJ 數值為: - K:67.497 - D:59.277 - J:83.937 K 值高於 D 值,顯示短期動能正在改善。 不過,偏高的 J 值也意味著交易者應對可能的動能放緩保持警惕。 這是一個鼓舞人心的訊號,但並非看漲反轉的獨立確認。 📉 4. 成交量:仍需確認的關鍵 目前的成交量約為 212.04K。 與此同時: - MA5 成交量:463.07K - MA10 成交量:614.25K 目前的成交量低於上述兩條平均線。 這一點很重要,因為若缺乏強勁的市場參與,突破行情可能難以維持。 因此,在將任何突破視為有效的看漲突破之前,我更傾向於看到伴隨成交量放大而產生的突破走勢。 🎯 5. 我所關注的點位 看漲確認: 持續站穩 $0.1420 之上,隨後在成交量配合下強勢突破 $0.1430。 初步下跌警訊: 跌破 $0.1343,這將削弱當前的盤整結構。 主要參考支撐位: $0.1272,這是圖表上近期可見的低點。 這些是監測點位,而非保證的價格目標。 🧠 6. 什麼情況會讓看漲論點失效? 若出現以下情況,看漲穩定情境將會減弱: - 價格跌破 $0.1343 且無法收復。 - 賣壓隨成交量放大而增加。 - 短期移動平均線再次轉為向下。 - 價格多次嘗試收復 $0.1386–$0.1387 區域失敗。 跌破 $0.1272 將代表圖表顯示的結構出現更顯著的惡化。 🔥 我的總結 我認為 $OPG 正接近一個重要的決策區。 KDJ 指標的改善以及移動平均線的靠攏,暗示短期內有可能出現穩定走勢。 但由於缺乏強勁的成交量驗證,我還不會將其稱為確認的看漲突破。 下一波行情本身並不重要,重要的是背後的市場證據。 在得出更強的結論之前,我會持續觀察阻力位、成交量的變化,以及支撐位是否持續有效。 你認為 $OPG 是在為看漲突破做準備,還是這僅僅是另一波修正前的暫時盤整? 讓我們討論證據,而不僅僅是預測。 $OPGUSDT $BBSOLUSDT #ByXIMPACT

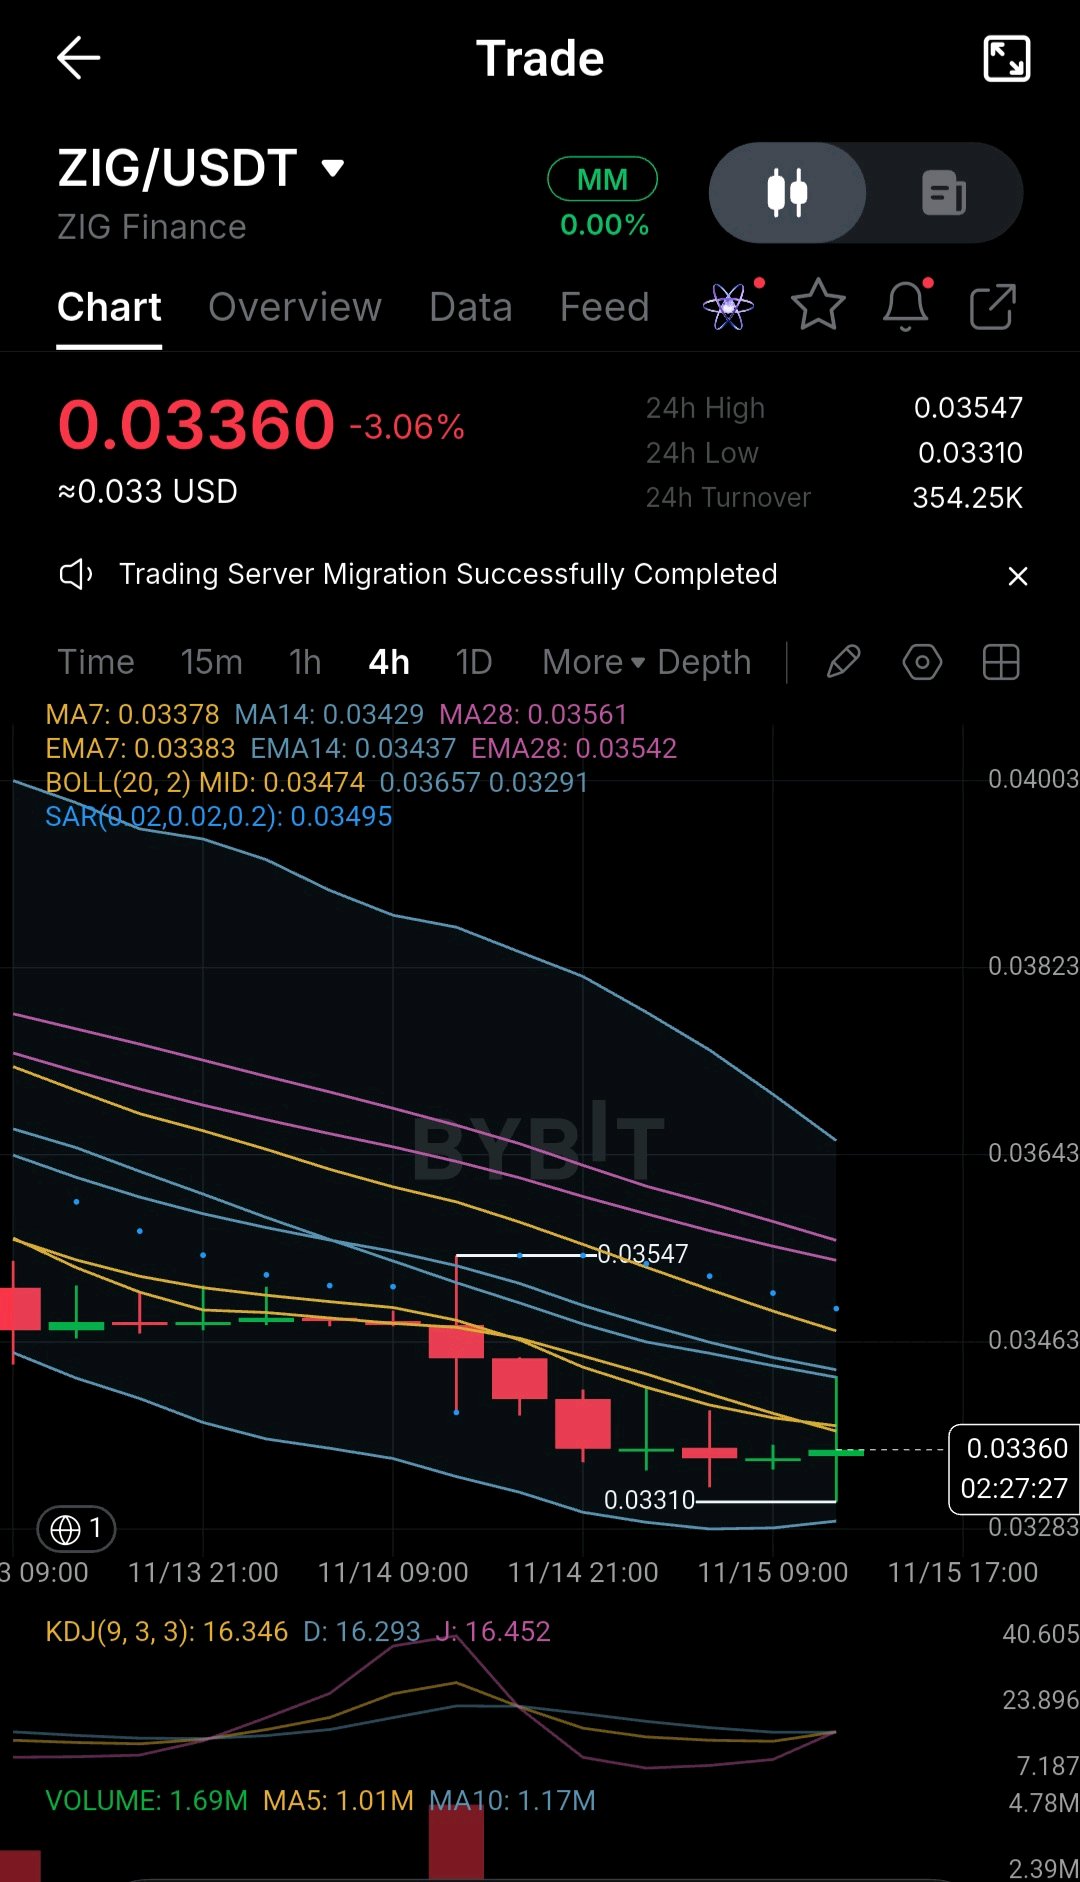
資產: $ZIG/USDT (ZIG Finance) 標題: $ZIG 4H 分析:波動率歸零——一個可驗證的現貨積累論點 💤🎯 📊 真實交易背景(證據): 觀察 4 小時線圖,$ZIG 目前處於 0.03360 的極端價格壓縮狀態。該資產正經歷嚴重的市場冷淡。 · 趨勢:結構保持看跌,價格交易在 MA7 (0.03378) 和 MA14 (0.03429) 下方。 · 動能:KDJ 指標在底部完全走平(J 線處於 16.45),表明賣方已徹底枯竭。 · 支撐:近期 0.03310 的結構性低點仍有支撐,但買盤成交量幾乎不存在。 💼 我的現貨交易論點(觸發條件與失效): 與其在死氣沉沉的市場中盲目抄底,我正在設置一個具備嚴格、可驗證條件的佈局。 · 觸發點 1(深度價值陷阱 - 50% 配置):我在近期絕對底部 0.03310 設置了限價買單。如果造市商製造流動性插針跌至此水平,我將以折扣價建倉現貨。 · 觸發點 2(喚醒確認 - 50% 配置):我只會在 4 小時 K 線確實收在短期阻力位 MA7 (0.03378) 之上,確認買方終於回歸後,才會部署剩餘資金。 🛑 論點失效: 如果價格出現 4 小時 K 線收於 0.03290(布林帶下軌)下方,此積累論點將徹底失效。若發生此情況,說明支撐已崩塌,我將取消所有訂單並等待全新的市場結構形成。 ⏳ 「什麼都不做」的情境: 如果價格繼續在 0.03310 和 0.03378 之間的死區橫盤震盪,且未觸發上述任一條件,我將絕對什麼都不做。在平淡的市場中持有穩定幣是最有利可圖的策略。 當波動率消失時,就是聰明錢準備進場之時。你是在等待 $ZIG 的喚醒確認,還是已經掛好限價單準備接針了? 👇 $ZIGUSDT $ASTERUSDT #ByXIMPACT

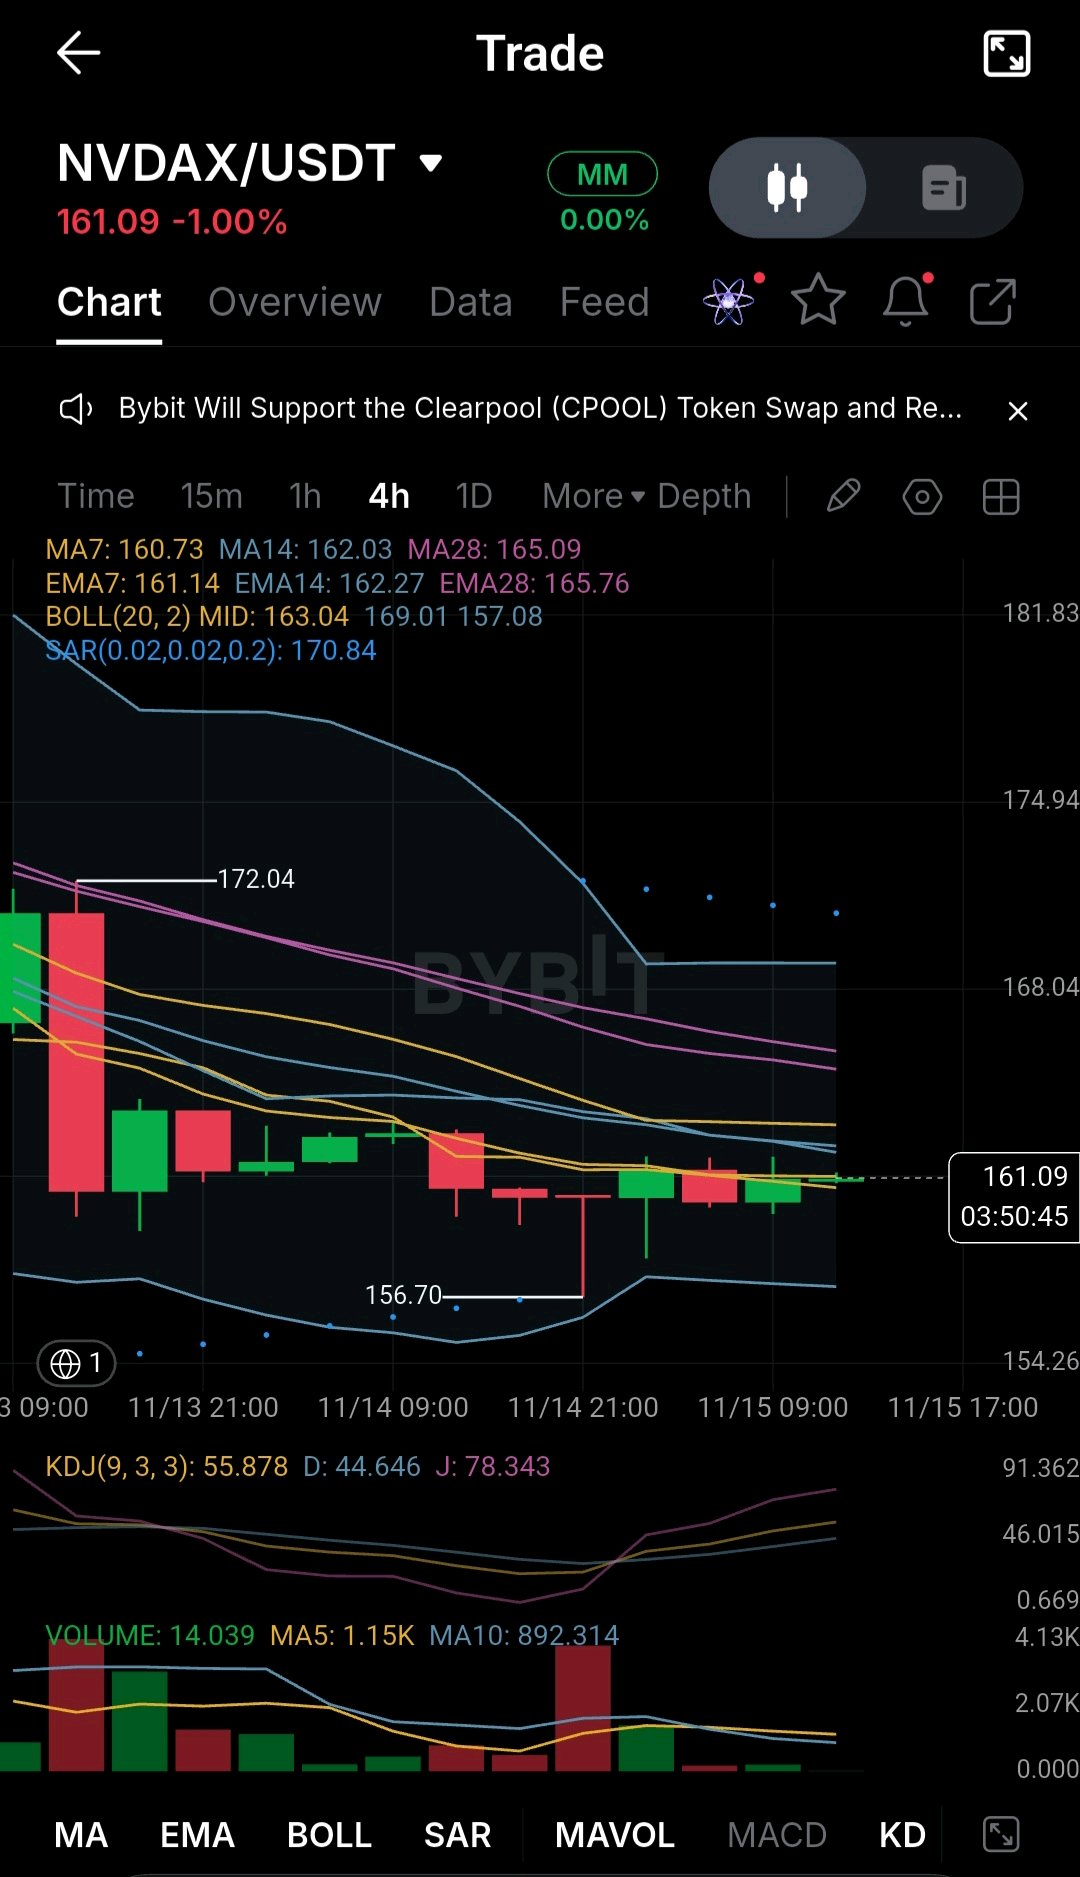
$NVDAX 4H:技術面盤整!我針對代幣化輝達 (Nvidia) 的分批現貨進場策略 🧠📊 大多數的山寨幣純粹是投機,但 $NVDAX 不一樣——它能讓你透過代幣化資產,接觸到全球領先的 AI 公司。觀察 4 小時線圖,價格目前在 161.09 處壓縮。我們正處於典型的「盤整」階段。以下是我目前的即時市場分析,以及我如何運用分批現貨進場策略。 📊 實際交易背景(壓力區): · 技術攻防:價格被壓制在密集的均線天花板之下(MA14 在 162.03,MA28 在 165.09)。拋物線指標 (Parabolic SAR) 顯示 170.84,確認了短期的整體趨勢仍偏空。 · 堅實支撐:儘管均線看跌,但請看結構。近期的低點 156.70 支撐得相當完美。價格拒絕再創新低,意味著賣方動能已經衰竭。 · 動能背離:觀察 KDJ 指標,J 線已急劇向上勾至 78.3,並穿過 D 線。這顯示儘管價格低迷,但短期買盤動能正悄悄累積。 💼 我的現貨策略(非對稱分批進場): 我這裡純粹進行現貨交易。因為這是一檔代幣化科技股,我正採取分層佈局的長期策略。 · 第一層(起始部位 - 現在):我正在 161.00 - 161.50 的區間部署 25% 的預定現貨資金。風險回報比很不錯,因為我的停損參考點設得很近(156.70 以下)。 · 第二層(確認加碼):只有在 4 小時線收盤站上 MA14 (162.03) 時,我才會再加碼 50% 的部位。那將確認反轉走勢。 · 第三層(深度價值加碼):如果市場下跌並回測 156.70 - 157.00 區間,我將投入剩餘的 25% 資金。 · 目標:我的第一個現貨獲利了結區間是布林通道中軌 163.04,其次是 MA28 的 165.09。 我正在利用加密貨幣以折價買入真實的科技價值。你打算怎麼操作這波 $NVDAX 的盤整走勢?👇 $NVDAXUSDT $AAPLXUSDT #ByXIMPACT

🤖 THE AI AGENT ECONOMY: WHY THE FUTURE OF CRYPTO COULD BE BUILT AROUND AUTONOMOUS MACHINES! I believe we are approaching a major transformation at the intersection of Artificial Intelligence and blockchain technology. Until now, AI has primarily been used to answer questions, analyze information, and automate everyday tasks. But the next stage could be much bigger: AI agents capable of operating independently, purchasing services, managing resources, and executing digital payments. Imagine millions of autonomous agents communicating with one another, buying computing power, accessing data, and paying for services without requiring human approval for every individual transaction. This is where cryptocurrency could become an essential part of the digital economy. Why does crypto matter? Traditional payment systems were designed mainly for human transactions. AI agents, however, may need to execute thousands of tiny payments in real time. Blockchain networks and stablecoins could provide programmable payments, faster settlement, and global access to digital services. One of the developments worth watching is Coinbase's x402 protocol, which explores automated payments for accessing APIs, data, computing resources, and other digital services. It represents an important step toward machine-to-machine commerce. Stablecoins could also play a major role because autonomous systems need predictable payment units rather than assets exposed to significant price volatility. Several crypto infrastructure projects deserve attention in this emerging sector: - NEAR Protocol (NEAR): Blockchain infrastructure and AI-oriented applications. - Artificial Superintelligence Alliance (FET): Decentralized AI and autonomous agent ecosystems. - Virtuals Protocol (VIRTUAL): AI agent creation and digital economic coordination. - World (WLD): Digital identity and human verification. - Chainlink (LINK): Reliable data and interoperability infrastructure. - Render (RENDER): Decentralized computing resources that could support growing AI workloads. However, I believe we must look beyond token prices and market hype. The real question is which projects can attract genuine users, generate sustainable demand, and become essential infrastructure. There are also important challenges involving cybersecurity, digital identity, unauthorized spending, regulation, and accountability. Autonomous agents will need secure wallets, spending limits, verified permissions, and reliable payment systems before widespread adoption becomes realistic. MY CONCLUSION I believe the convergence of AI and crypto could introduce an entirely new category of blockchain users: autonomous software agents. The next phase of digital adoption may not be driven exclusively by people using wallets. It could also involve machines exchanging value, purchasing resources, and participating in a global digital economy. The biggest opportunity may therefore lie not simply in AI-related tokens, but in the infrastructure that enables autonomous machines to transact securely. 🔥 WHAT'S YOUR VIEW? Will AI agents become major users of blockchain networks? Could stablecoins become their preferred payment method? And which project is best positioned to benefit from this transformation: NEAR, FET, VIRTUAL, LINK, or a new player? $FETUSDT $LINKUSDT #ByXIMPACT #AITechSelloffErases2Point5TrillionFromNasdaq100

🏛️ 機構級 RWA 超級週期正式走向主權化:深入解析捷克國家銀行的 DLT 債券發行。 當散戶交易員還盯著 15 分鐘 K 線並被市場反覆收割時,宏觀格局已在悄然改變。 捷克國家銀行 (CNB) 剛剛透過布拉格中央證券存管處 (CSD Prague,首家獲得歐盟 DLT 試點政權執照的實體) 發行了首批克朗計價的區塊鏈債券。他們測試了從轉帳、計息到回購的完整生命週期,並實現了近乎即時的結算。 這對我們有什麼意義?因為這驗證了「代幣化超級週期」(Tokenization Supercycle)。當央行和主權實體開始使用 DLT 軌道時,這就不再只是加密貨幣的敘事了;這是一場全球金融結構性的轉變。 🔍 真實世界資產 (RWA) 的潛在受益者: 當主權財富鏈上化時,它們不會使用迷因幣,而是會使用機構級基礎設施。這就是我如何配置我的現貨資金以捕捉這一趨勢: · $ONDO (Ondo Finance):代幣化真實世界資產 (如美國國庫券) 的絕對領頭羊。隨著央行將主權債務代幣化,Ondo 的基礎設施是機構採用的首選。 · $LINK (Chainlink):終極互操作性層。為了讓這些 DLT 債券能與傳統銀行系統及其他區塊鏈 (例如 CNB 測試的歐元計價債券) 進行互動,機構級預言機與 CCIP (跨鏈互操作性協定) 是不可或缺的。 · $XRP & $XLM (跨境結算):CNB 特別提到專注於央行貨幣,並使資產更具流動性。這直接連結到機構跨境結算層的長期論點。 🎯 我的現貨執行計畫 (宏觀佈局): 我不會在週二下午用 100 倍槓桿來交易主權採用,而是採取建立部位的策略。 · 累積論點:我將 $ONDO 和 $LINK 的任何宏觀回調視為機構的「訂單區 (order block)」。這些資產擁有深厚的流動性和真實的機構背書。 · 進場策略:我在主要的日線支撐位 (例如布林通道中軌或 50 日均線) 設定了分批掛單。我希望在市場恐慌而非 FOMO 的時候累積部位。 · 獲利了結:我在尋找結構性轉變。我會在當地的心理阻力位分批賣出 30% 的現貨,但會保留核心部位以應對長期的 RWA 敘事。 · 風險無效化:如果整體加密市場進入深度的流動性寒冬,這些代幣也會隨之暴跌。我會在成本基礎下方設定硬性的心理停損,並維持充足的 USDT 儲備以在更低點買入。 💡 讓我們建立一個真正的社群 (ByX IMPACT): CNB 行長明確表示,結算應依賴央行貨幣,而非私人工具。這是一個巨大的訊號。基礎設施現在正在建設中。 你是否正在為 RWA 代幣化敘事配置你的現貨投資組合?你認為這些代幣中哪一個能捕捉到最多的機構價值?讓我們在下方討論嚴肅的宏觀策略。👇 $LINKUSDT $XRPUSDT #ByXIMPACT


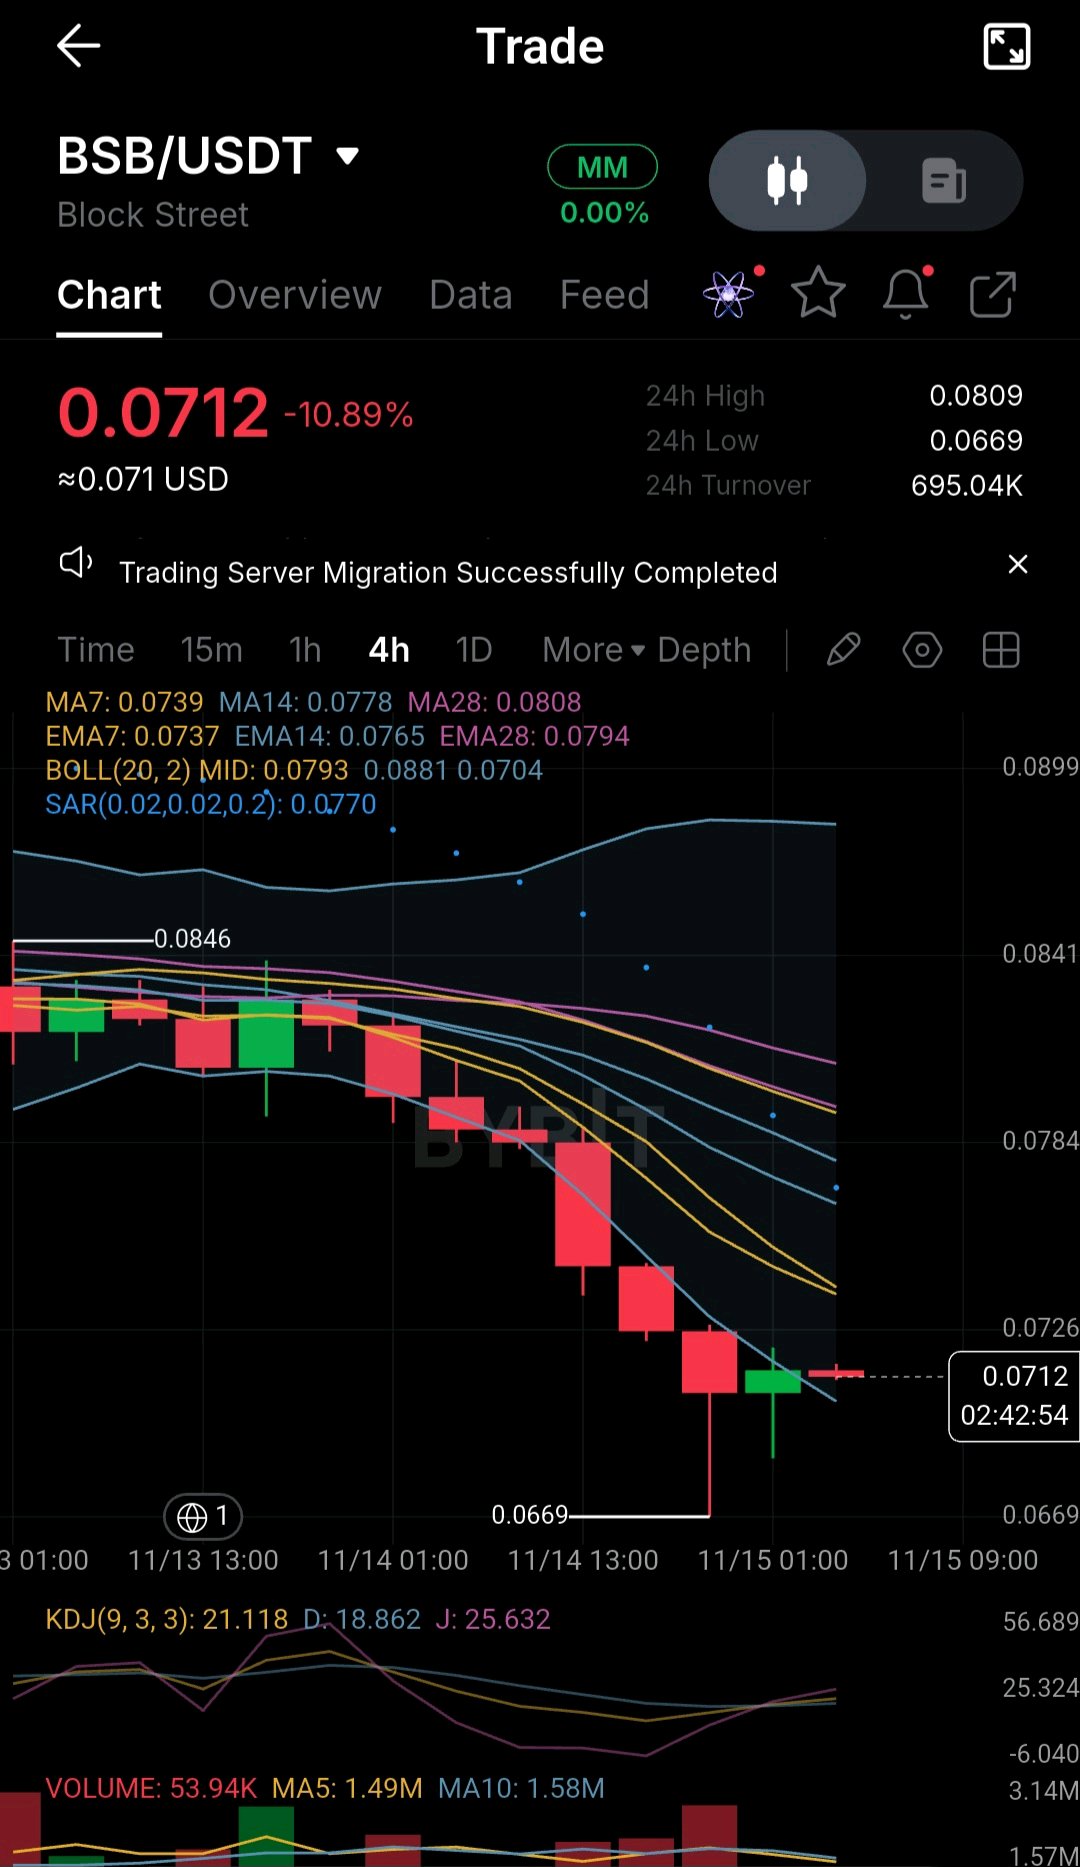
$BSB 4H Analysis: A Brutal Dump! Why I Refuse to Catch This Falling Knife 🩸🛑 Look at this chart. $BSB just experienced a violent freefall, dropping from 0.0846 straight down to a low of 0.0669, currently hovering at 0.0712 (-10.89%). It’s a bloodbath. But while retail traders panic or try to blindly catch the bottom, my spot capital is sitting safely on the sidelines. Here is my real-time context and why I am strictly waiting. 📊 Real Trading Context (The Anatomy of the Dump): · The Trend is Broken: The price is miles away from all major moving averages. The MA7 (0.0739), MA14 (0.0778), and MA28 (0.0808) are fanning out downwards. This is a severe bearish structure. · The Volume Capitulation: This is the most critical data point. Look at the volume bars at the bottom. We had massive red bars pushing the price down. But the recent green candle has virtually zero volume (53K compared to the 1.49M average). This means the selling has exhausted itself, but there is absolutely no buying pressure to push it back up. · Oversold: The KDJ indicator is at rock bottom (J-line at 25.6). However, in a freefall, oversold conditions can remain oversold for a long time. 💼 My Spot Strategy (The No-Buy Zone): I am strictly a Spot trader. I don't use leverage, but that doesn't mean I gamble my stablecoins on falling charts. · My Action: I am NOT buying at 0.0712. This is a "No-Buy Zone." Buying a chart with this much downward momentum and no volume support is a high-risk gamble. · My Trigger to Buy: I will only consider deploying my spot capital if I see one of two things: 1. A 4H candle closing firmly back above the MA7 (0.0739) with a massive spike in green volume. 2. A clear "Double Bottom" or consolidation base forming above the 0.0669 support level over the next few days. · My Philosophy: In spot trading, cash is a position. I don't need to catch the absolute bottom. I just need to buy when the risk is mathematically favorable. $BSBUSDT Let the knife hit the floor and stop bouncing before you pick it up. Are you waiting for $BSB to stabilize, or did you catch the falling knife? 👇 #ByXIMPACT

到底發生了什麼事……比特幣價格一週內下跌 14% 至 65,000 美元,週末拋售潮跌破週五低點 根據《比特幣雜誌》(Bitcoin Magazine Pro)數據,比特幣價格在過去一週下跌約 14%,週六上午一度滑落至 65,000 美元左右,隨後在 65,200 美元附近徘徊。這一走勢跌破了週五約 67,555 美元的低點,創下自 8 月中旬以來的最低水平。由於美元走強以及市場已完全反映聯準會 12 月升息預期,週末交易延續了此前的拋售潮。 一週前的 11 月 7 日,比特幣價格還在 75,750 美元附近。隨著輝達(Nvidia)執行長黃仁勳於週四辭職,跌勢加劇,這場人事動盪導致人工智慧(AI)相關股票遭到拋售,這可能是將比特幣推向 72,000 美元以下的原因。週四晚間,比特幣跌向 71,000 美元,隨後在週五東部時間午夜左右崩跌至約 67,555 美元,創下自 8 月以來的最低點,之後在上午回升至 69,800 美元附近。 在生產者物價指數(PPI)報告發布後,比特幣價格短暫衝上 70,000 美元大關,但隨即消退,週五下午大半時間都維持在 70,000 美元下方,在 68,900 美元附近震盪。 拋售潮於週五晚間恢復,並延續至 66,000 美元中段。週六上午 8 點(美東時間)過後,比特幣在 67,000 美元附近短暫盤整,隨後再度遭拋售,於上午 10 點時段觸及 65,500 美元的低點,跌破週五的谷底。 美元走強與殖利率上升持續打壓比特幣價格 勞工部週五公布,10 月最終需求生產者物價指數(PPI)上漲 0.3%,低於經濟學家預期的 0.4%。未經調整的指數較去年同期上漲 6.5%,創下自 2022 年 11 月以來的最大 12 個月漲幅。數據顯示月度漲幅略微放緩,這僅讓比特幣短暫升至 70,000 美元以上,隨後即回跌。 債券交易員並不買帳。10 年期公債殖利率週五攀升至 5.17%,創四週新高,收盤報 5.15%。美元指數維持在 19 個月高點,創下自 2025 年 4 月以來的最強水平。波士頓聯準銀行總裁柯林斯(Susan Collins)週五表示,「不久後,聯準會採取進一步緊縮貨幣政策可能是適當的」,舊金山聯準銀行總裁戴莉(Mary Daly)則表示,決策者「極有可能會升息」。利率上升會增加持有無息資產(如比特幣)的成本,而美元走強在 11 月的大部分時間裡都對比特幣價格造成了壓力。根據 CME FedWatch 數據顯示,交易員已完全反映聯準會將於 12 月 8 日至 9 日的會議上升息一碼(0.25%)的預期。 晶片股也未能提供支撐。iShares 半導體 ETF 週五下跌超過 3%,超微半導體(AMD)跌幅超過 8%。那斯達克 100 指數收跌 1.22%。美國股債市週六休市,但這些水平仍為週末交易定下了基調。輝達預定於週二發布第三季財報,這將是黃仁勳卸任後,由代理執行長柯蕾絲(Colette Kress)發布的首份財報。 $BTCUSDT #ByXIMPACT
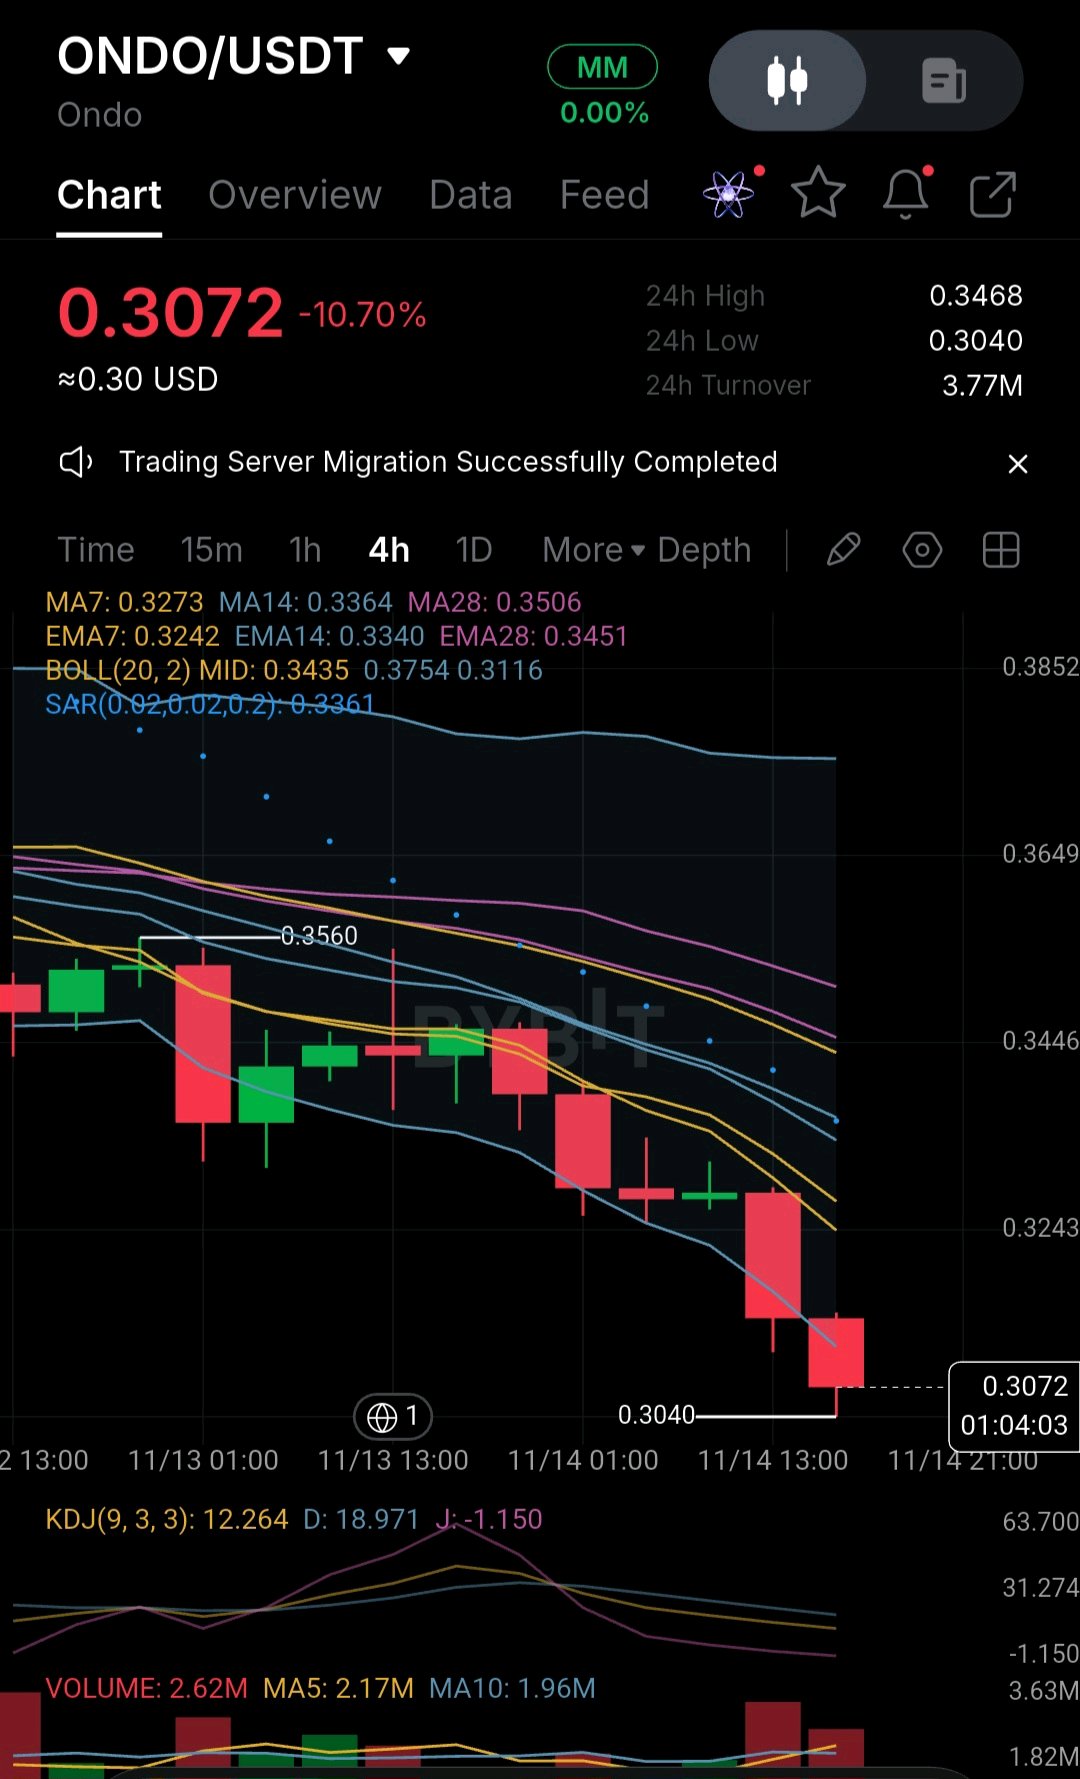
🚨 ONDO ($ONDO) 面臨劇烈回調——這是買入機會還是警告訊號? ONDO 市場正面臨沉重的賣壓,4 小時圖價格下跌 10.70%,來到 $0.3072。 但圖表顯示出一些交易者不容忽視的跡象。👀 📉 市場訊號: - 價格跌破所有主要移動平均線。 - EMA 排列確認了強勁的看跌動能。 - 布林通道顯示下行壓力正在擴大。 - KDJ 指標進入深度超賣區,暗示賣壓可能已達極限。 - 最新一波跌勢中交易量有所增加。 🎯 需密切觀察的價格區間: 🔹 即時支撐位:$0.3040 🔹 首個反彈目標:$0.3243 🔹 關鍵壓力位:$0.3435 🔹 主要壓力位:$0.3560 ⚡ 未來兩種劇本: 🟢 看漲:若能守住 $0.3040 並重回 $0.3243 之上,可能引發技術性反彈。 🔴 看跌:若跌破 $0.3040,可能會導致 ONDO 進一步下探。 🔥 超賣狀況雖然可能帶來機會,但並不保證反轉。確認訊號才是關鍵! 說說你的預測:ONDO 能守住 $0.30 並反彈,還是我們即將迎來另一波大跌? $ONDOUSDT $XRPUSDT #ByXIMPACT #WSOT2026

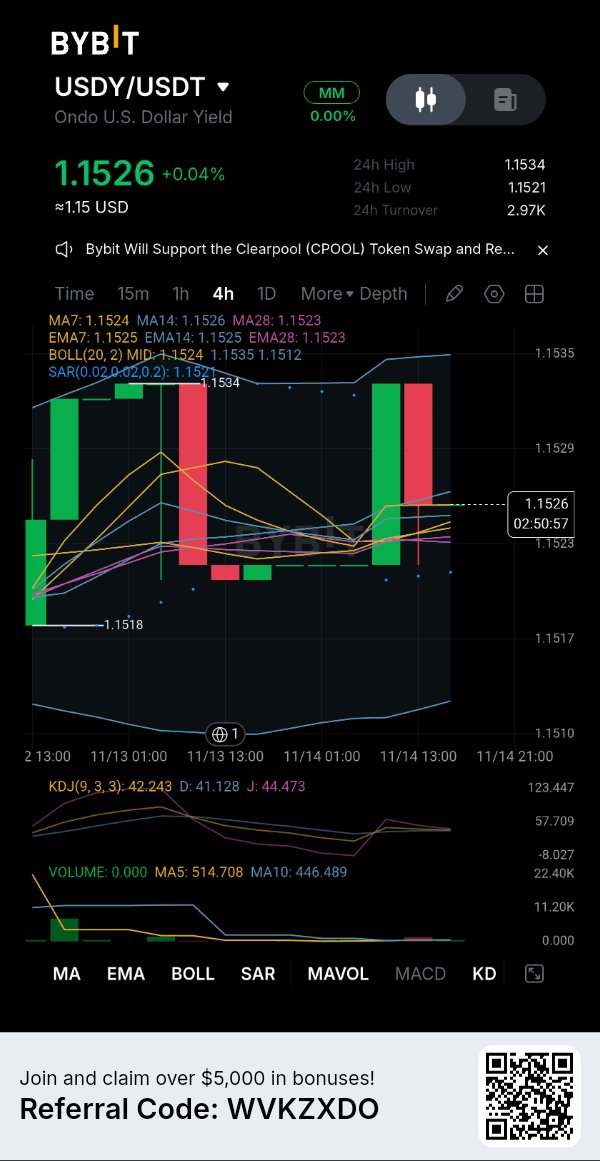
💵 USDY: A Different Kind of Crypto Opportunity — Stability or Hidden Potential? While most crypto assets are driven by sharp market swings, Ondo U.S. Dollar Yield (USDY) is attracting attention for a different reason. 📊 Market Snapshot: - Current Price: $1.1526 - 24H Change: +0.04% - 24H High: $1.1534 - 24H Low: $1.1521 - 24H Turnover: $2.97K 🔍 What Does the 4H Chart Reveal? - Price is holding within a very narrow trading range. - Moving averages are tightly clustered around the current price. - Bollinger Bands indicate relatively limited volatility. - KDJ shows balanced momentum without a strong directional signal. 🎯 Important Levels to Watch: - Support: $1.1521 - Immediate Resistance: $1.1534 - A breakout beyond this range could provide a clearer short-term direction. 💡 The Bigger Picture: USDY is not behaving like a typical high-volatility altcoin. Its price stability and yield-oriented nature make understanding the underlying asset especially important. ⚠️ Always research the token's structure, redemption conditions, and associated risks before making a decision. What interests you most about USDY: its yield potential or its stability in a volatile crypto market? 👇 $USDYUSDT #ByXIMPACT
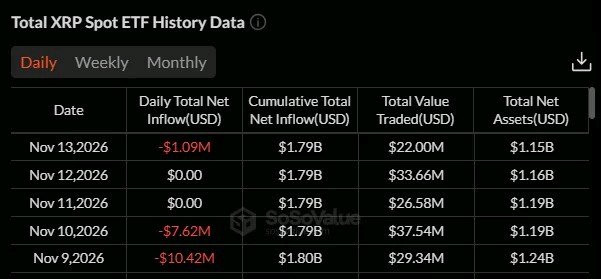
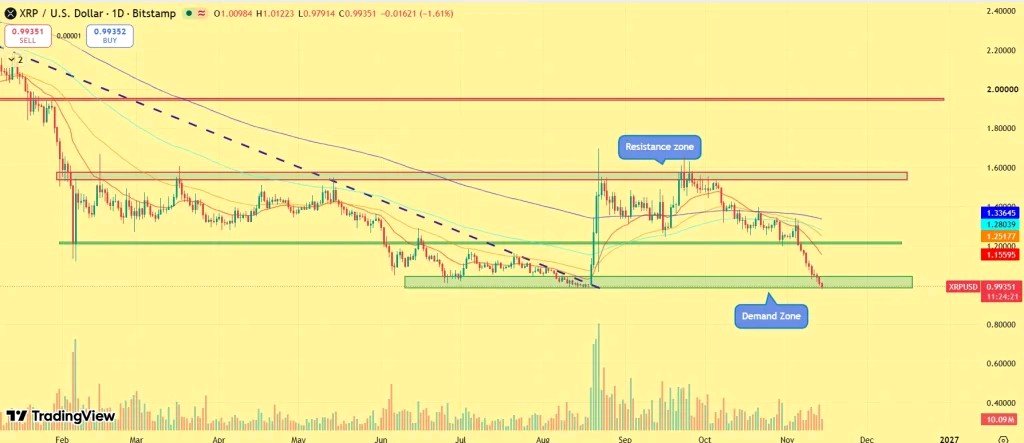
📉 $XRP 跌破 1 美元:散戶恐慌與鯨魚吸籌的悖論 🐋📊 真實交易。真實洞察。 心理防線已被擊穿。$XRP 已跌破 1.00 美元來到 0.99 美元,引發了一波恐慌。數據顯示 ETF 資金流出 1913 萬美元,衍生品清算額達 1690 萬美元。散戶正在拋售投降。 但聰明錢正依據這一洞察進行交易:儘管市場血流成河,鏈上數據證實大型持有者(鯨魚)正在悄悄吸籌。這是一個典型的市場悖論。當散戶被清算時,鯨魚正建立倉位。我們該如何交易? 🔍 技術洞察:極度超賣狀態: 日線 RSI 已暴跌至驚人的 21.5。作為參考,任何低於 30 的讀數皆為超賣,但 21.5 在歷史上屬於罕見的極端投降區,通常預示著劇烈的反彈即將到來。關鍵需求區目前穩固在 **0.95 美元**,而如果這個底線失守,0.80 美元區域仍是最終的宏觀看跌目標。 💼 現貨交易執行(階梯式限價策略): 因為我們是在看跌結構中博取極端超賣後的反彈,所以我不會使用市價單。我使用的是階梯式現貨限價單。 • 入場區間:我在 0.95 美元至 0.98 美元之間掛限價單。我是在抓插針,而不是去追綠 K。 • 止盈 1 (TP1):1.05 美元(即時的心理修復)。 • **止盈 2 (TP2):** 1.20 美元(崩盤開始處的沈重結構阻力位)。 • 失效點:日線收盤價若跌破 **0.94 美元**。如果 0.95 美元的需求區失守,下一站就是 0.80 美元。我會立即砍倉,並持有穩定幣等待機會。 ⚖️ 風險管理(現貨優勢): 這是 100% 的現貨交易,零槓桿。雖然期貨交易者被清算了數百萬美元,但我的現貨持倉沒有清算價格。我將投資組合的 3% 分配給這個特定的策略。我在買入恐懼,但我控制了倉位大小,即使跌到 0.80 美元,對我的帳戶影響也微乎其微。 👇 你認為鯨魚在這裡吸籌是正確的,還是 $XRP 會跌破 0.95 美元的支撐位並走向 0.80 美元?在下方留下你的看法!👇 $XRPUSDT $ETHUSDT #ByXIMPACT


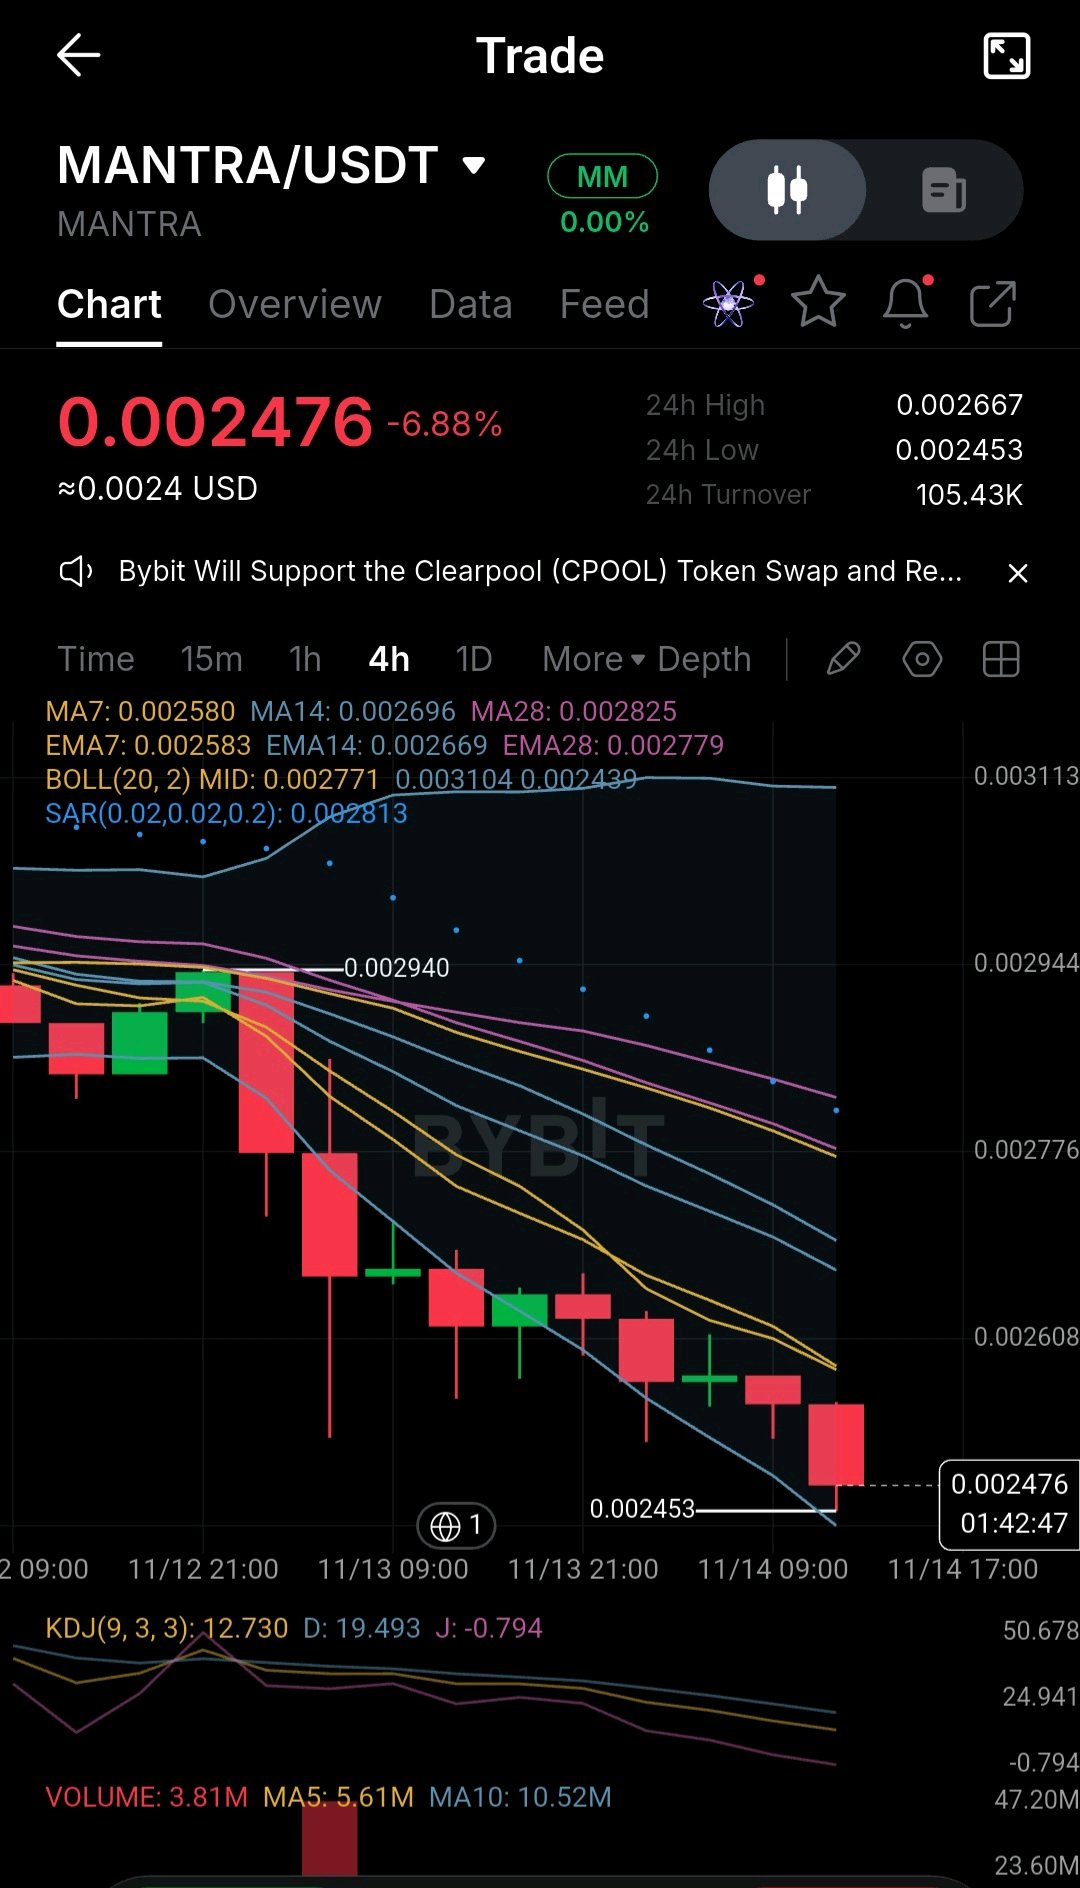
🩸 $MANTRA / USDT (4小時線):KDJ 負值異常。為什麼我不去接這把掉落的刀。 看看 $MANTRA 的這張 4 小時線圖,畫面相當慘烈。我們又跌了 -6.88%,目前來到 0.002476,圖表呈現猛烈的崩跌走勢。 但看看螢幕的最下方,KDJ 指標的 J 線處於 -0.794 的數學極端值。 散戶看到震盪指標出現負值,就立刻市價買入,以為反彈勢在必行。身為一名現貨交易者,我想告訴各位為什麼現在進場是一個巨大的陷阱,以及我是如何保護我的資本的。 🧠 「超賣」的幻覺: 指標顯示超賣並不代表價格不會繼續走低。看看近期陰線的成交量——非常巨大,這是投降式拋售。鯨魚在拋售,散戶在恐慌。如果我現在以 0.002476 買入,我簡直是在空手接住一把掉落的電鋸。 🔍 結構性現實: · 頭頂的牆:每一條移動平均線(MA7、MA28、EMA28)都呈扇形排列並直指下方,形成沉重的壓力。最近的阻力位是 MA7,位於 0.002580。 · SAR 錨點:拋物線 SAR 指標懸在 0.002813 的高位。空頭完全掌控局勢。 · 真正的地板:目前 24 小時最低價為 0.002453。我們正處於這個位置之上,如果跌破,下方將毫無支撐。 🎯 我的專業現貨執行計畫(等待的藝術): 我不靠希望交易,我靠確認過的結構交易。這就是我的嚴格計畫: · 條件 1(安全做多):我只會在看到 4 小時 K 線果斷收盤站回 MA7 (0.002580) 上方時,才會開始累積現貨。這證明了直接的賣壓已經被吸收。 · 條件 2(深度價值掛單):如果市場想要再次掃蕩低點,我在 0.002400 處設有被動限價單。我要買的是極端恐慌下的下影線,而不是現在這種緩慢的陰跌。 · 我的第一個目標位 (TP1):0.002667(24 小時高點及布林帶中軌)。我會在這裡分批賣出 30% 的倉位。 · 我的硬性止損:如果 4 小時線收盤低於 0.002400,支撐位就沒了。我會取消所有掛單,等待市場建立全新的底部。 💡 讓我們建立一個真正的社群 (ByX IMPACT): 業餘玩家只會抄底然後祈禱,專業玩家則會等待趨勢反轉。KDJ 負值告訴我賣壓已竭盡,但買量的缺乏告訴我鯨魚還沒準備好。我會讓市場來找我。 你也在嘗試接 $MANTRA 這把掉落的刀,還是在像我一樣等待確認的反轉 K 線呢?我們在下面討論真正的現貨策略吧。👇 $MANTRAUSDT $PIEVERSEUSDT #ByXIMPACT

ByXIMPACT市場目前正經歷劇烈震盪,比特幣跌破 67,000 美元大關,全市場出現數十億美元的清算。當散戶交易者恐慌並盯著短期圖表時,機構資金正悄悄轉向一個完全不同的敘事。新趨勢不再是關於炒作或投機性的路線圖,而是關於實際營收與代幣回購。 這是我們目前所見最重大的結構性轉變。根據最新數據,加密協議今年已產生超過 110 億美元的營收。數據揭示了一個驚人的現實:在頂尖的營收生成協議中,那些具有主動回購機制的協議年初至今平均漲幅達 62%。與此同時,沒有回購機制的協議則平均虧損 31%。這種高達 93% 的表現差距證明市場已經成熟,現在它要求的是真正的商業模式與可持續的現金流。 我正將這一精確的洞察應用於我的現貨交易策略中。我正專注於像 Jupiter (JUP) 和 World Liberty Financial (WLFI) 這類資產。Jupiter 已經實施了高達 7000 萬美元的回購計畫,而 WLFI 則是將穩定幣經濟直接與代幣價值掛鉤。這些才是真正捕獲價值的協議。 我不去追逐綠色K線,也不會在市場回調時盲目買入,而是在關鍵的結構性支撐位(例如 200 日移動平均線)掛現貨限價單。我買的是企業,而不僅僅是代碼。 我的風險管理依然嚴格。這是一項 100% 的現貨操作,零槓桿。我將投資組合的 5% 配置到這一特定論點上。我的獲利策略包括隨著這些有營收支持的協議在下一次反彈中繼續跑贏大盤時,逐步分批出場。這筆交易的止損點是協議營收出現明顯的結構性崩盤,或是回購執行中斷。如果核心基本面發生變化,這個論點也就失效了。 你還在根據社交媒體的炒作進行交易嗎?還是已經轉向了由營收支持的資產?你認為目前哪個協議擁有最強大的回購模型?請在評論區告訴我。 $BTCUSDT $BTCUSDC

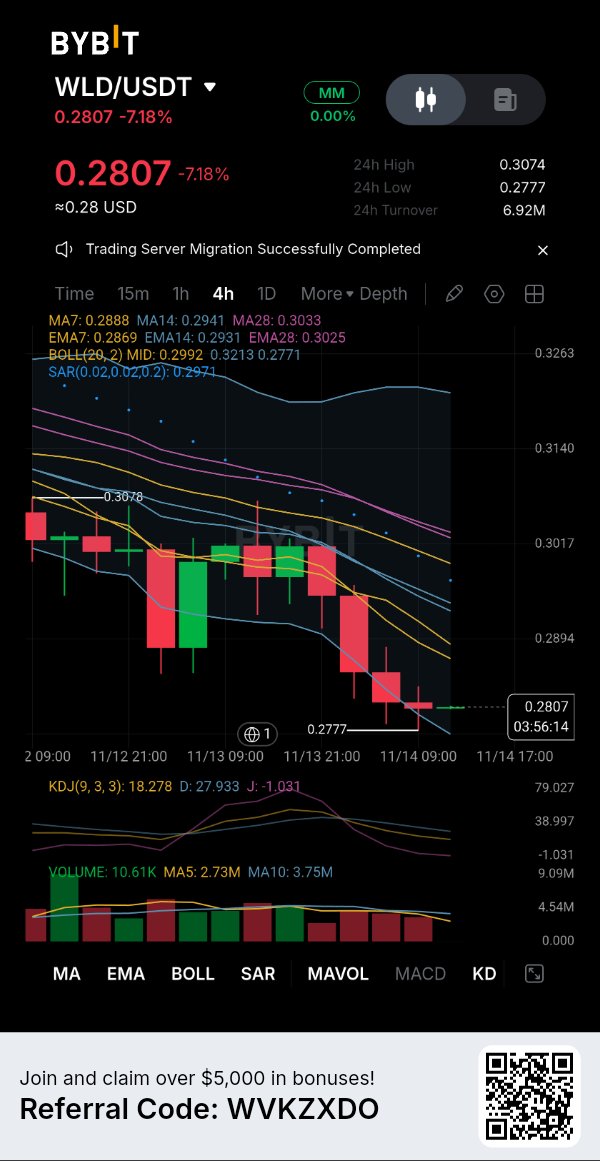
⚠️ WORLDCOIN ($WLD) 面臨沉重拋售壓力 — 反轉即將來臨嗎? Worldcoin 正面臨充滿挑戰的市場交易時段,WLD 在 4 小時線圖上下跌 7.18%,報價為 $0.2807。 📉 技術面分析: - 看跌勢頭依然強勁,價格處於主要移動平均線下方。 - EMA 和 MA 指標持續指向下方。 - KDJ 指標深陷超賣區,顯示拋售壓力可能已趨於極限。 - 價格徘徊在近期低點 $0.2777 附近,這使其成為關鍵的支撐區間。 🎯 關鍵價格水平: 🔹 即時支撐位:$0.2777 🔹 第一阻力位:$0.2894 🔹 主要阻力位:$0.2992 🔹 強力阻力位:$0.3074 🚀 看漲可能性:若能守住 $0.2777 並重新站上 $0.2894,則有望出現反彈行情。 🔻 看跌風險:若確認跌破 $0.2777,WLD 可能面臨進一步下跌風險。 👀 核心問題:WLD 是否正在醞釀復甦,還是賣方會將其推向新低? 在下方分享您的看法吧!👇 $WLDUSDT $MNTUSDT #ByXIMPACT

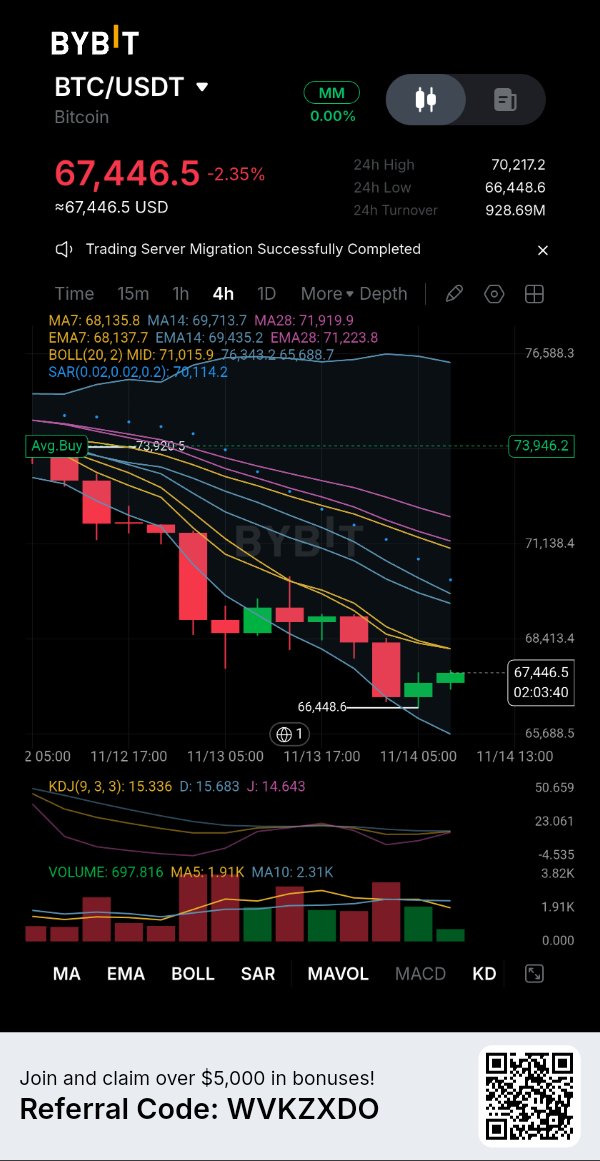
₿ BITCOIN AT A CRITICAL TURNING POINT! Is a Rebound Coming or Is More Downside Ahead? 🔥 Bitcoin is facing strong selling pressure, currently trading at $67,446, down 2.35% on the 4-hour timeframe. 📊 What Does the Chart Tell Us? - The overall trend remains bearish. - Moving averages continue to reflect selling pressure. - KDJ is approaching oversold territory, potentially opening the door for a technical rebound. - Price is attempting to stabilize after reaching a low of $66,448. 🎯 Key Levels to Watch: - Major Support: $66,448 - First Resistance: $68,413 - Next Resistance Zone: $69,700 – $70,200 🚀 Bullish Scenario: A strong recovery above $68,400 could improve the chances of a short-term rebound. ⚠️ Bearish Scenario: A breakdown below $66,448 could trigger another wave of selling. 💡 Don't let market volatility control your decisions. Patience, discipline, and risk management matter most! Your Opinion: Is this Bitcoin dip a buying opportunity, or are we heading toward a deeper correction? 👇 $BTCUSDT $ETHUSDT #ByXIMPACT

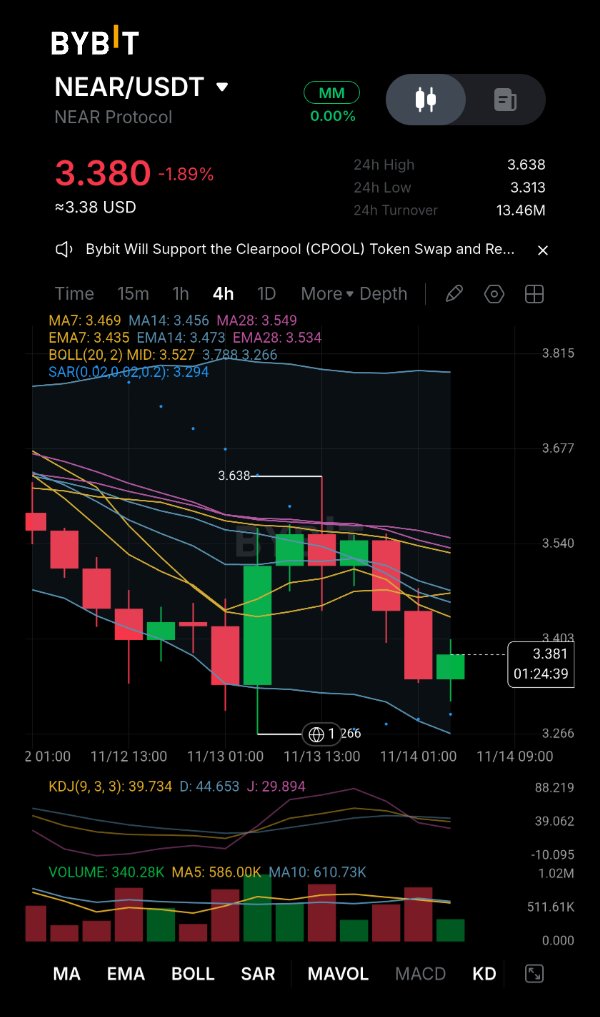
$NEAR 4H Analysis: The Weight of Overhead Supply! My Strict Patience Protocol ⏳🛡️ Look at the NEAR 4-hour chart. We have a market that is trying to breathe, but it's being suffocated by the ceiling above it. The price bounced from the 3.266 lows and is currently hovering at 3.380. While some see a recovery, I see a heavy wall of overhead supply. Here is my real-time context and why my stablecoins remain untouched for now. 📊 Real Trading Context (The Technical Reality): · The MA Ceiling: The price is trapped far below a dense cluster of moving averages. The MA7 (3.469), MA14 (3.456), and MA28 (3.549) are all sloping downwards. This is a classic bearish alignment. Until the price reclaims at least the MA7, the trend is firmly down. · Volume Dry-Up: This is a critical observation. Look at the bottom volume bars. The current volume (340K) is drastically lower than the moving average (586K). A bounce with declining volume means buyers lack conviction. It’s a low-energy environment. · Momentum Still Weak: The KDJ indicator is hovering at low levels (J-line at 29.8) but hasn't printed a strong bullish crossover yet. The Parabolic SAR (3.294) is acting as a very minor short-term floor, but it's fragile. 💼 My Spot Strategy (Strict No-Buy Zone): I am strictly a Spot trader. My capital is a weapon, and I don't fire it blindly. · My Action: I am not buying at 3.380. The risk-to-reward ratio of buying right under a heavy resistance cluster is mathematically poor. · My Trigger to Buy: My thesis will only change if I see a 4H candle close decisively above the MA14 at 3.456 with a spike in volume. That would be the first real sign of a structural shift. · My Value Zone: If the market shakes out the remaining weak hands and drops, I have my Limit Buy orders waiting near the recent absolute bottom at 3.260 - 3.280. · My Targets (If triggered): I would aim for the mid-Bollinger Band at 3.527 as a first spot profit-taking zone. Don't confuse a low-volume bounce with a trend reversal. Are you trying to catch this $NEAR knife, or waiting for structural confirmation? 👇$NEARUSDT #ByXIMPACT