
Ansarweb3
15606點贊0分享701粉絲603關注
Web3 / Crypto Trader | Graphic Designer | Open to work: CM / Mod / Ambassador | Bybit Creator
Web3 / Crypto Trader | Graphic Designer | Open to work: CM / Mod / Ambassador | Bybit Creator
CAP/USDT:在 30% 飆升後進行回調交易
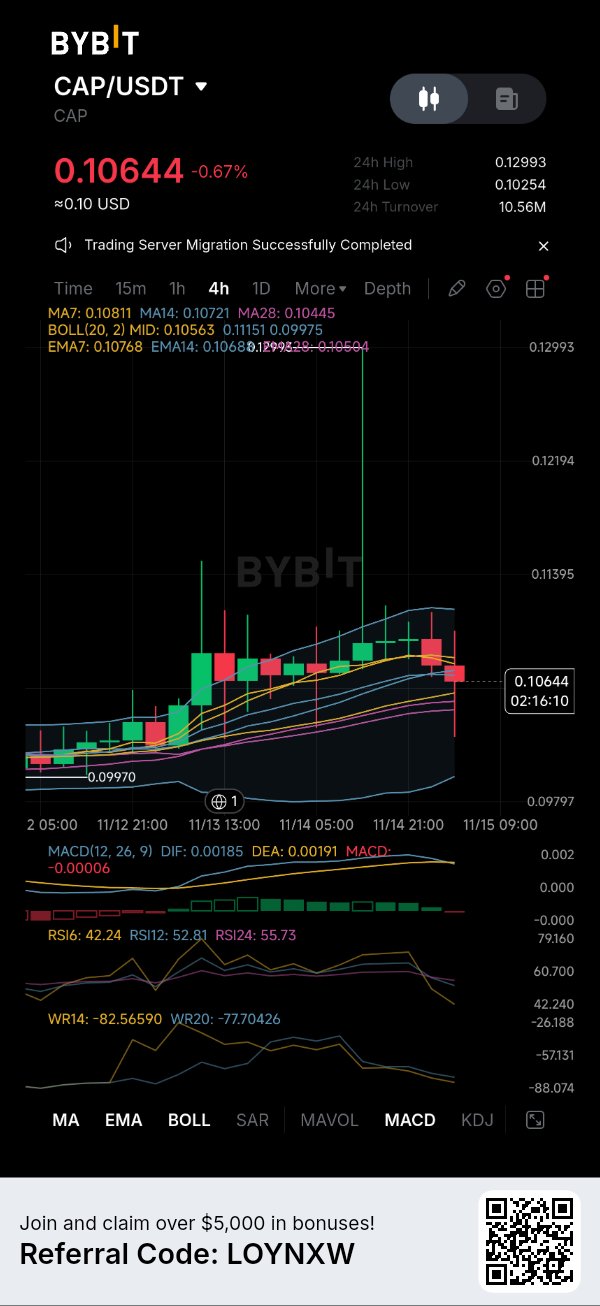
CAPUSDT 在從 $0.09970 回升並短暫觸及 $0.12993 後引起了我的注意。 然而,4 小時線圖現在顯示出動能冷卻的跡象。與其追逐之前的漲勢,我更專注於尋找一個可控的入場點。 我的技術分析 目前價格在 $0.10644 左右。 MA7 ($0.10811) 和 MA14 ($0.10721) 在當前價格上方,而 MA28 ($0.10445) 仍在其下方。 MACD 顯示出初步走弱跡象,DIF 為 0.00185,略低於 DEA 的 0.00191。 RSI6 已跌至 42.24,而 RSI12 和 RSI24 仍保持在 50 以上。 這表明存在短期拋售壓力,但尚未完全破壞更廣泛的復甦結構。 我的交易策略 我正在關注兩個可能的機會: 1. 回調至 $0.1045–$0.1056 區間,隨後等待看漲確認。 2. 4 小時線收盤重回 $0.1081,隨後進行成功的重測。 我的上方目標價為 $0.1115 和 $0.1140。 $0.1025 區域是我重要的下方失效點(止損位)。 如果支撐失效,我寧願放棄看漲佈局,也不會強行交易。 風險管理第一。 我會避免追漲,在入場前明確止損位,並根據我準備承受的損失金額來考慮倉位大小。 教訓很簡單:強勁的漲勢並不意味著每一次回調都是機會。確認信號很重要。 非財務建議。請自行研究 (DYOR)。 #WSOT曬出你的AI交易即可贏取10USDT
ZEC 跌破 1,000 美元:959 美元會是最後的支撐位嗎?
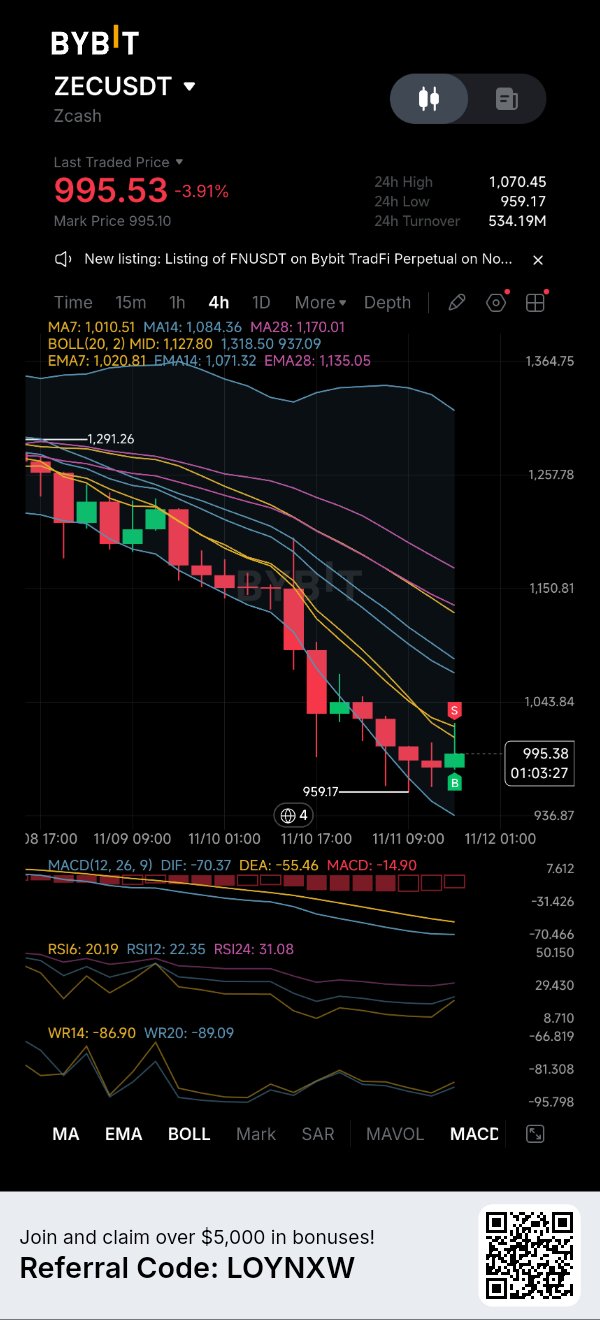
Zcash ($ZEC) 在經歷一波強勢拋售後正努力尋求穩定,價格已從 1,290 美元上方跌至 959 美元區域。 目前 ZEC 交易價格約為 995.53 美元,仍承受巨大壓力,4 小時線圖顯示出明顯的看跌結構。 指標揭示的情況: • 價格低於 MA7(1,010.51 美元)、MA14(1,084.36 美元)及 MA28(1,170.01 美元)。 • MACD 維持看跌狀態,DIF 為 -70.37,低於 DEA 的 -55.46。 • MACD 直方圖為負值 -14.90,證實了持續的拋售動能。 • RSI6 為 20.19,RSI12 為 22.35,RSI24 為 31.08,顯示處於深度超賣狀態。 值得關注的關鍵價位: - 即時支撐位:959.17 美元 - 下一支撐區間:937–936 美元,位於布林通道下軌附近 - 第一阻力位:1,010–1,021 美元 - 第二阻力位:1,043–1,071 美元 - 主要阻力位:1,084–1,135 美元 若能成功守住 959.17 美元,或可為反彈至 1,010 美元騰出空間。然而,若跌破該支撐位,則可能下探 937 美元區域。 對於多頭而言,重回 1,021 美元將是初步的復甦訊號。若要出現更強勁的反轉,則需克服上方移動平均線的阻力區間。 關鍵觀察:ZEC 處於深度超賣狀態,但在強勁的下跌趨勢中,超賣狀況可能會持續。在看跌結構發生改變之前,買盤壓力必須先顯現。 請留意 959 美元的支撐位,避免追逐投機性的反彈,並在考慮交易前先設定好您的止損點。 ZEC 能否守住 959 美元?還是空頭正準備發動下一波跌勢? #ZEC #Zcash #Bybit 本文不構成財務建議。請自行研究 (DYOR)。 #WSOT2026 #美國通膨升溫,升息押注升高 #比特幣在美國中期選舉後跌至兩個月低點 #AI科技股拋售使納斯達克100指數蒸發2.5兆美元 #德意志銀行推出數位資產託管服務 $BTCUSDT $ETHUSDT
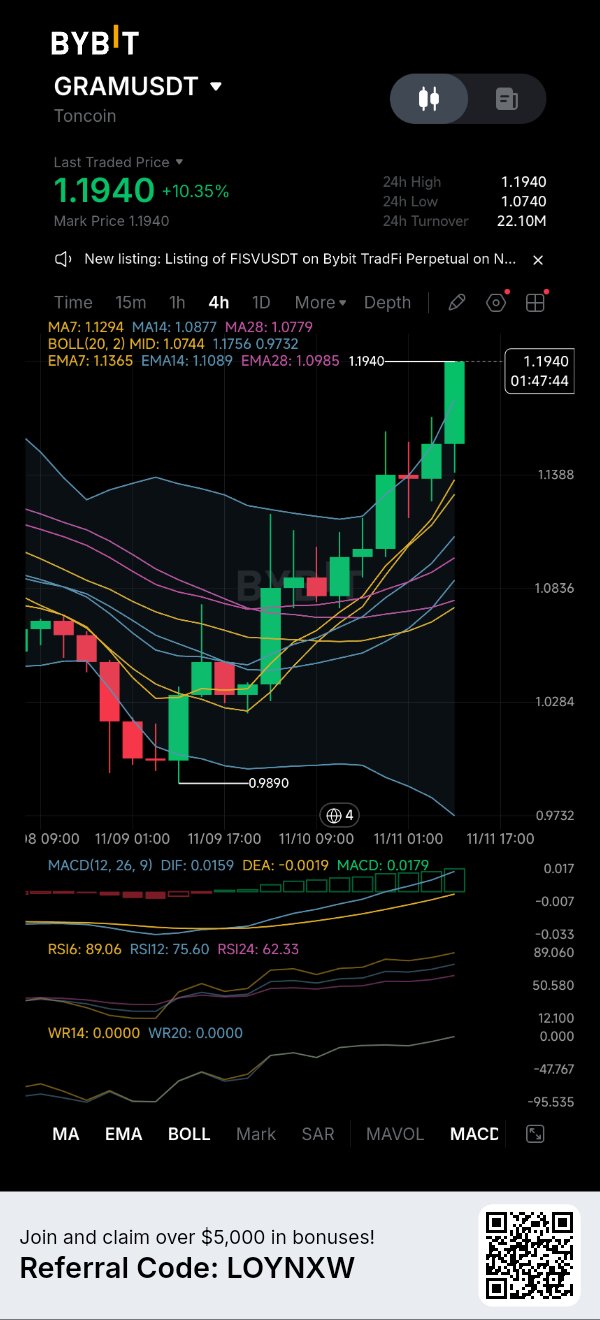
GRAM Gains 10%: Can Bulls Break $1.20?
$GRAMUSDT is showing impressive momentum after recovering from its recent $0.9890 low. Price is now trading around $1.1940, up 10.35%, with consecutive bullish candles pushing toward the $1.20 psychological resistance. The 4H structure has turned decisively bullish: • Price is above MA7 ($1.1294), MA14 ($1.0877) and MA28 ($1.0779). • MACD is bullish, with DIF at 0.0159 above DEA at -0.0019. • The MACD histogram has expanded to 0.0179, confirming strengthening momentum. • RSI6 stands at 89.06, while RSI12 is at 75.60, indicating an extremely overbought market. There is strong buying pressure, but the distance between price and the moving averages suggests that the rally may need a cooling-off period. Key levels to watch: - Immediate resistance: $1.1940 - Psychological resistance: $1.2000 - First support: $1.1756 - Secondary support: $1.1365–$1.1294 - Stronger support: $1.1089–$1.0985 A sustained breakout above $1.1940 could bring $1.20 into focus. However, rejection near this level could trigger profit-taking, with $1.1756 becoming the first important support to monitor. The bullish momentum is clear, but an RSI above 89 is a warning against chasing the current candle. Trading focus: Watch for consolidation, a controlled pullback or a confirmed breakout retest. Check liquidity, define invalidation and assess risk-to-reward before considering a position. Can GRAM sustain its momentum above $1.20, or will buyers take a breather first? Not financial advice. DYOR. #WSOT2026 #NovUSCPIWatch #WSOTPicktoEarn10U #USPayrollsAndRateDecisionsDriveMacroWeek #OilVolatilityTracksIranPeaceTalks $GRAMUSDC

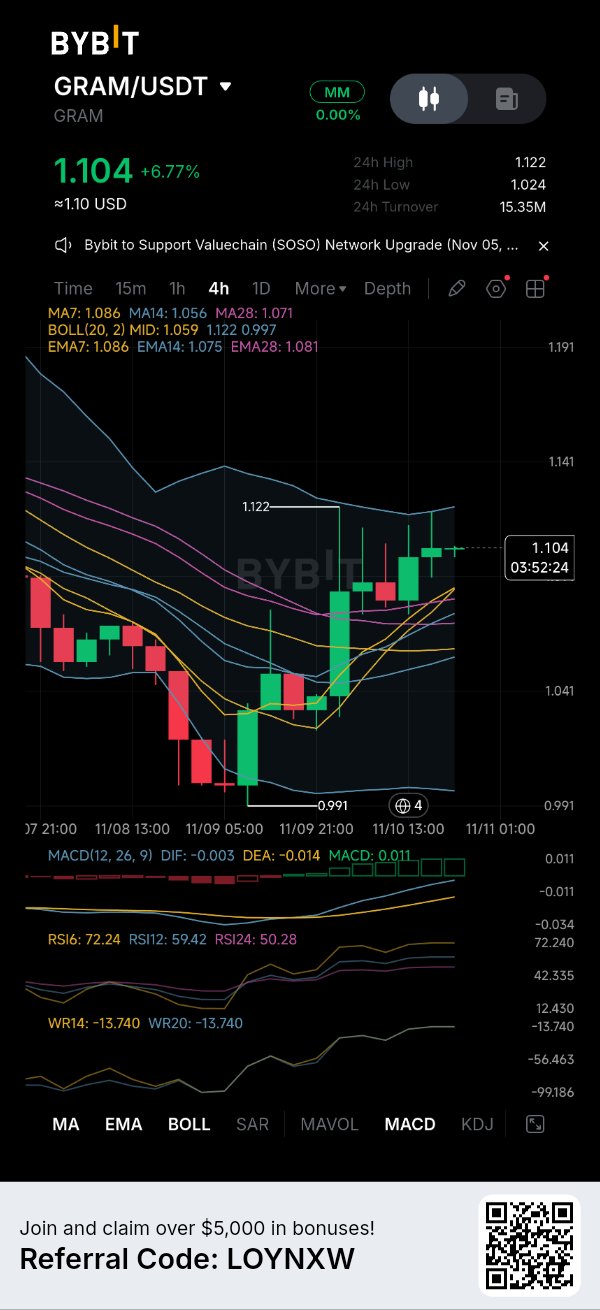
GRAM 觸及布林通道上軌,價格為 1.122
$GRAMUSDT 目前價格為 1.104。24 小時高點 1.122,低點 1.024,該交易對成交量 15.35M。視窗標記的高點為 1.122,標記的低點為 0.991。 價格高於均線。MA7 為 1.086,MA14 為 1.056,MA28 為 1.071。EMA 數值相近:1.086、1.075、1.081。布林通道中軌為 1.059,上下軌分別為 1.122 / 0.997。現貨價格穿過密集區並位於 1.122 的上軌下方,這同時也是日內高點。0.991 的低點是下方的支撐基礎。這只是對上軌的一次衝擊,並未在上方收盤。 MACD 為綠色柱狀圖:DIF -0.003,DEA -0.014,MACD 0.011。DIF 高於 DEA。RSI6 為 72.24,RSI12 為 59.42,RSI24 為 50.28。快線指標處於高位,慢線指標尚未突破。 $GRAM 是 The Open Network (TON,前身為 Toncoin) 的原生代幣。它用於支付交易手續費以及在網路上進行質押。流通供應量約為 28.5 億枚。總供應量更高,且各大追蹤平台未列出硬頂。這就是目前的結構。它並沒有改寫 4 小時圖表上的關鍵價位。 $GRAM 的關鍵點位: - 1.122 — 上軌與日內高點 - 1.086 — MA7 與 EMA7 - 1.059 — 中軌 - 0.997 / 0.991 — 下軌與標記低點 看漲情境:1.086 得到支撐,且 $GRAM 收盤價高於 1.122。 看跌情境:4 小時線在 1.122 下方遇阻,且 RSI6 處於 72 的高位,價格將回落穿過 1.086 並向中軌邁進。 你會將 1.122 的布林通道視為必須突破的界線,還是會等待價格收回 1.086 以下才判定這波衝擊結束? 非財務建議。請自行研究 (DYOR)。 #WSOT2026 #NovUSCPIWatch #WSOTPicktoEarn10U #美國就業數據與利率決策主導本週宏觀市場 #石油波動追蹤伊朗和平談判 $BTCUSDT

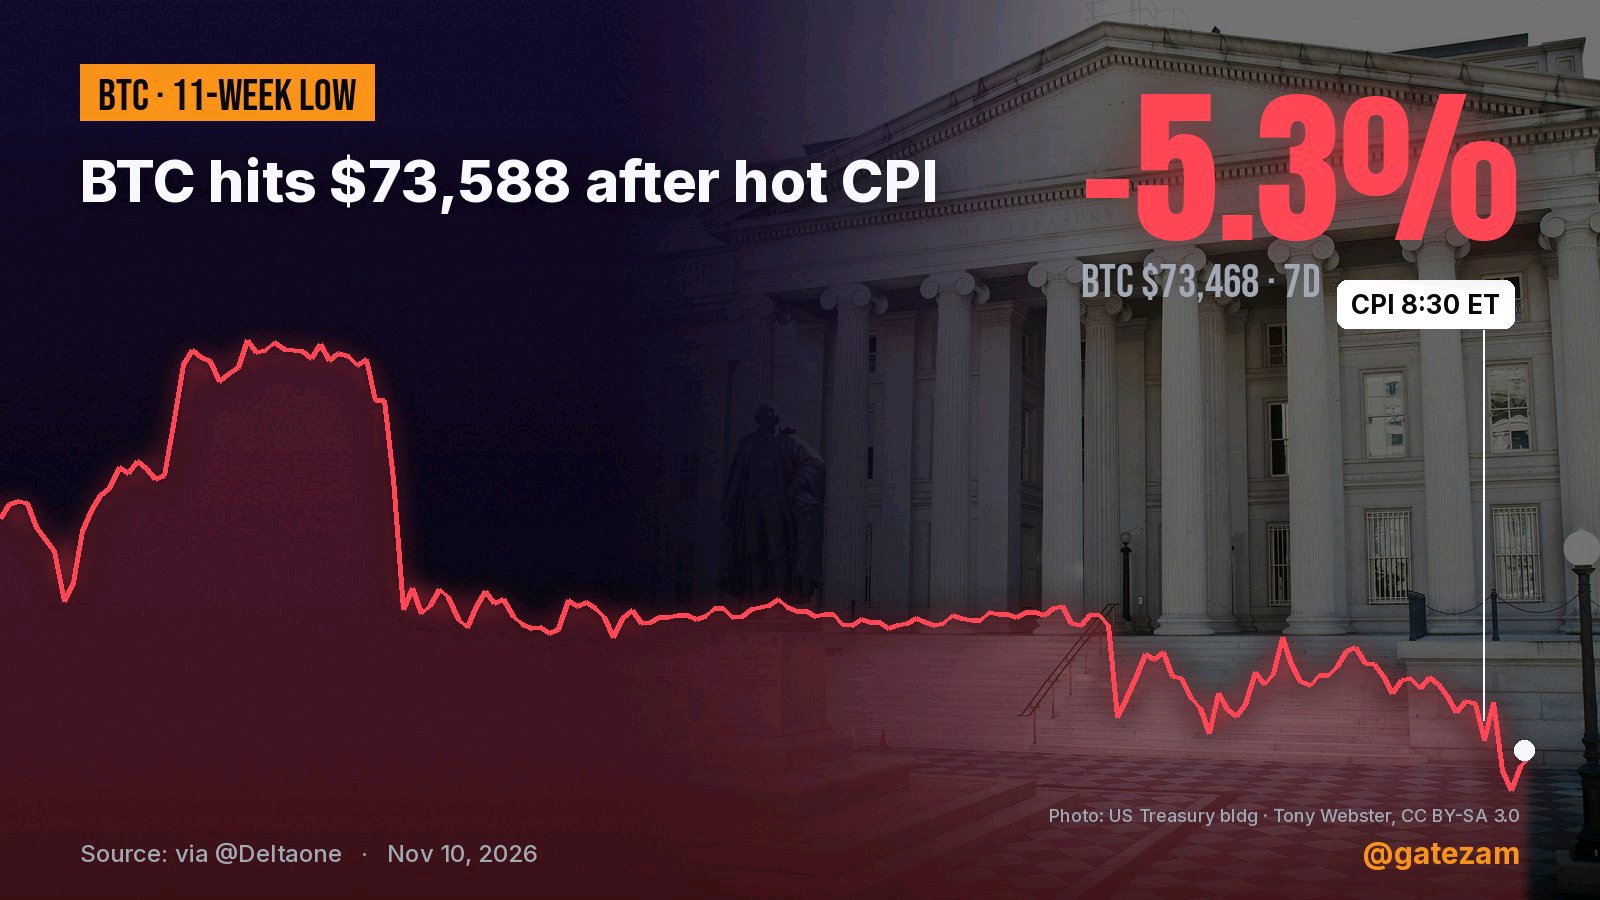
BTC 守住 73.4K 美元:火熱的 CPI 數據觸發區間防衛
比特幣在美國 CPI 數據高於預期(月率達 0.4%,預估為 0.3%)後,正測試布林帶下軌支撐。儘管盤中波動率一度飆升,價格區間達 1,250 美元,但現貨價格在下軌邊界附近獲得了即時的買盤吸收,24 小時交易量達 54.3 億美元,成功守住了 7.26 萬美元的近期底部。 在 Bybit 上,$BTC 交易價格在 73,456.10 美元附近(-1.59%),在 54.3 億美元的成交額下,於 75,408.00 美元的高點遇阻後,目前持穩於 72,686.60 美元的日內低點上方。 Bybit 4 小時線圖揭示: * 下軌延伸:價格觸及布林帶下軌(73,321.66 美元),測試了 72,686.60 美元的支撐引線後企穩。 * 均線壓力:上方的動態阻力位疊加在 MA7(74,359.52 美元)、MA14(74,698.89 美元)和 MA28(75,285.03 美元),並由 20 週期中軌(75,046.29 美元)作為錨定。 * 動能收斂:日線 RSI(6) 跌入 32.61 的超賣區(RSI12 為 35.06),WR14 為 -77.94。MACD 直方圖處於 -94.59,DIF (-733.40) 低於 DEA (-638.81),顯示短期動能減速。 宏觀通膨與流動性催化劑: 通膨數據高於預期(月率 +0.4%,核心月率 +0.3%),主要由能源 (+0.7%) 和娛樂 (+0.8%) 推動,這強化了聯準會對利率政策的審慎態度。然而,流動性吸收依然強勁,隨著 Bybit 宣布更新 UTA 帳戶的自動還款功能,各大交易台的衍生品成交量維持在高位。 關注兩個執行策略: * 支撐防守:守住 73,321 美元的下軌底部並收復 MA7(74,359 美元),將開啟目標為 75,046 美元中軌的均值回歸走勢。 * 跌破延續:若 4 小時線確認收於 72,686 美元下方,短期支撐將失效,走勢可能進一步下探至 70,500 美元的宏觀需求區。 在進場佈局前,請查看下方 Bybit 卡片上的即時訂單簿深度、清算集群和資金費率。 #ByXIMPACT 非財務建議。請自行研究 (DYOR)。 #WSOT2026 #NovUSCPIWatch #WSOTPicktoEarn10U #美國就業數據與利率決策主導本週宏觀市場 #石油波動追蹤伊朗和平談判 $BTCUSDT $BTCUSDC

CAP Holds Above the Mid Band Under 0.106
$CAPUSDT is 0.10281. 24h high 0.12862, low 0.09854, turnover 11.01M on this pair. The marked high on the window is 0.12862. The marked low is 0.09236. Price is above the averages. MA7 is 0.10070, MA14 0.10098, MA28 0.10122. EMAs sit nearby: 0.10132, 0.10091. Bollinger mid is 0.10086, edges 0.10608 / 0.09563. Spot is through the cluster and under the upper band at 0.10608, well below the 0.12862 high. The 0.09236 low is the base below. That is a hold above the mid-band, not a break of the lid. MACD is still soft: DIF 0.00155, DEA 0.00195. DIF is under DEA and the histogram is red. RSI6 is 64.22, RSI12 57.31, RSI24 56.89. Fast clock is rising but not extreme. $CAP is the governance and utility token of Cap, an Ethereum-based covered credit protocol. The protocol issues cUSD (a dollar stablecoin) and stcUSD (its yield-bearing version). Depositors supply stablecoins; underwriters post collateral to cover loans to institutional borrowers. Total supply is fixed at 10 billion. A large portion remains in a timelock. That is the structure. It does not rewrite the 4h levels on the chart. Levels on $CAP: - 0.10608 — upper band - 0.10132 / 0.10070 — EMA7 and MA7 - 0.10086 — mid-band - 0.09563 / 0.09236 — lower band and marked low - 0.12862 — session high Bullish case: 0.1007 holds and $CAP closes above 0.106. Bearish case: a 4h reject under 0.106, with MACD still red, sends it back through 0.1007 toward the lower band. Would you treat the 0.106 upper band as the line that has to clear, or wait for a close back under 0.1007 before calling the hold done? Not financial advice. DYOR. #WSOT2026 #NovUSCPIWatch #WSOTPicktoEarn10U #USPayrollsAndRateDecisionsDriveMacroWeek #OilVolatilityTracksIranPeaceTalks
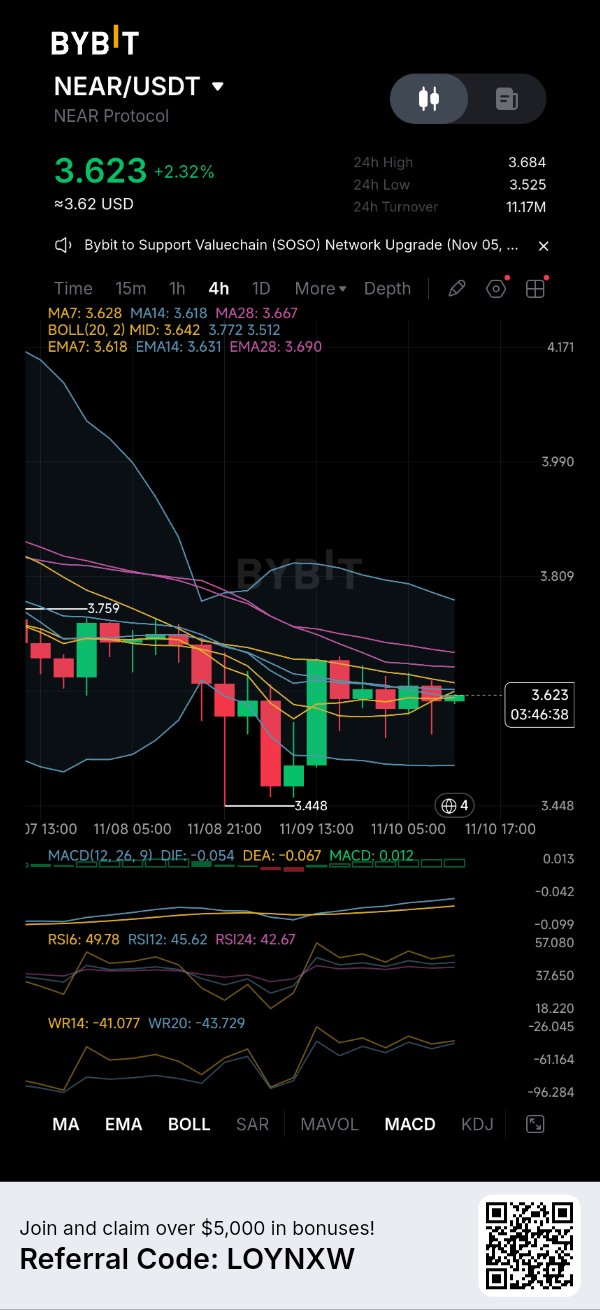
NEAR 削減了發行量,但幣價根本不在乎。
$NEARUSDT 剛剛通過了將其最大發行量在 24 個月內從 2.5% 下調至 1.6% 的提案。價格並沒有什麼反應。原因如下。 這次減發是確定的,但尚未生效。它還需要安全理事會的審查、大約 90 天的寬限期以及驗證者的採納。同時,這也將預期質押收益率從約 5.3% 降至 3.4%,所以這是一種權衡,而不是免費的紅利。 與此同時,需求疲軟:期貨未平倉合約從 10 月 22 日的 3.18 億 NEAR 下降至 2.3 億 NEAR,且 NEAR 自 10 月高點以來已下跌約 39%。 4 小時圖觀點:3.623 處於 MA7/MA14(3.628 / 3.618)的壓制下,上方還有 3.667-3.690 區間的 MA28 和 EMA28。布林帶正在收窄,MACD 在零軸附近走平。這是一個壓縮形態。 看漲:4 小時線收於 3.690 上方,隨後看 3.759(上一個波段高點)。 看跌:4 小時線收於 3.448 下方(波段低點,接近分析師標出的 3.40 支撐位)。 供應端消息影響的是長期趨勢,而價格由短期走勢決定。 你會因為一個尚未生效的代幣經濟學變更而購買 NEAR 嗎? 非財務建議。請自行研究 (DYOR)。 #WSOT2026 #NovUSCPIWatch #WSOTPicktoEarn10U #美國就業數據與利率決策主導本週宏觀市場 $NEARUSDC

SOL leverage is cleared. The buyers aren't back
$SOLUSDT is down about 30% from its late-September high near $124, and the leverage looks cleared. Futures open interest fell to $5.10B, the lowest since Aug 19. So why isn't it bouncing? Because the spot bid is missing. SOL ETFs have had five straight weeks of outflows (nearly $170M), with about $8.8M more provisionally out on Monday. 4H view: price 85.15 sits under MA7/14/28 (86.33 / 87.30 / 88.61), just above the lower band (84.52). RSI6 is 31 and WR is -95, so it's oversold. But the MAs all slope down and rebounds keep stalling under them. I don't see a base yet. Bull: 4H close above 88.61 (MA28/EMA28), then the broken trendline near 90-92 is the real test. Bear: 4H close under 84.89 puts 82 in play, then the 77.60 demand zone. Leverage gone, buyers missing. Do you wait for ETF flows to turn, or buy the oversold? Not financial advice. DYOR. #IMPACTbyTrade #WSOT2026 #NovUSCPIWatch #WSOTPicktoEarn10U #USPayrollsAndRateDecisionsDriveMacroWeek #OilVolatilityTracksIranPeaceTalks $BTCUSDT
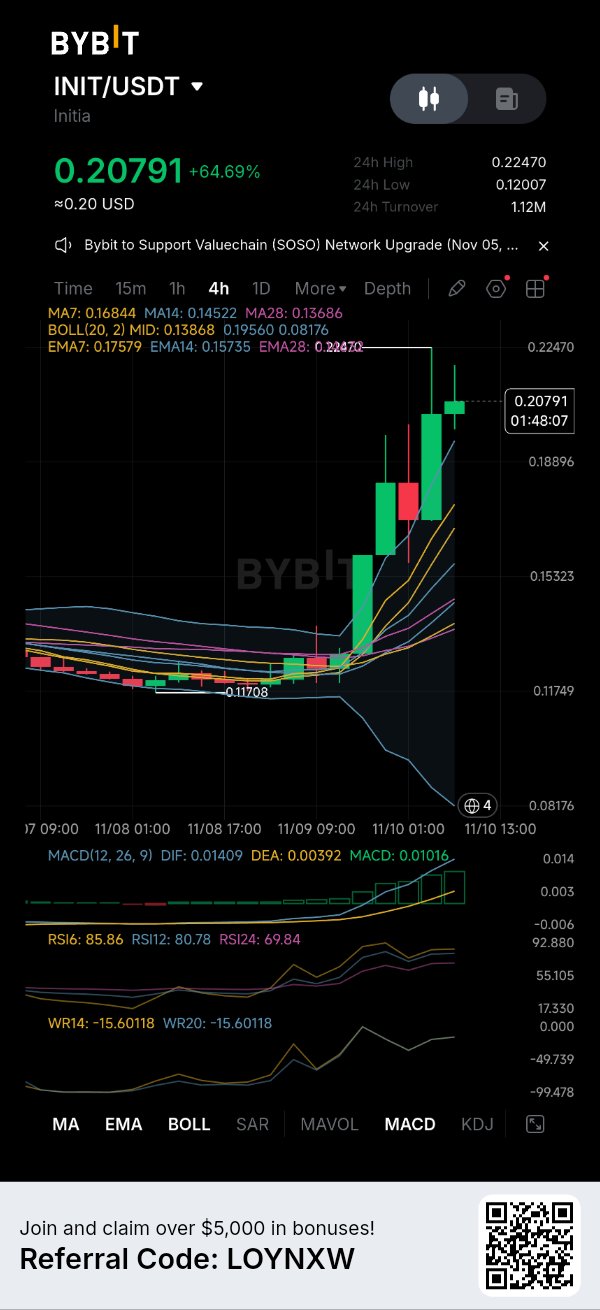
INIT +65% on a halted chain. Not a thesis.
$INITUSDT is up 65% while its own chain is paused after an exploit. Read that again before you chase. Reported facts: attackers used compromised rollup keys to forge IBC transfers and drain about $605K in USDC, and the L1 paused block production. That follows an Oct 23 exploit of about $2.7M. Yet price ripped, with spot volume around $33M against futures volume near $883M, and funding deeply negative (about -1.8%). Negative funding means shorts were paying longs. That reads like a squeeze, not adoption. 4H view: 0.20791 is above the upper band (0.1956), RSI6 is 85.9, and price sits 23% above the MA7 (0.1684). The 0.2247 spike got rejected. Bull: 4H close above 0.2247, squeeze continues. Bear: a close under 0.1756 (EMA7) opens the fade zone down toward 0.1387 (mid band), near where the move started. Paused chain, thin liquidity, possible exchange restrictions. Size like it can gap both ways. Is this a squeeze you'd trade, or a trap you'd skip? Not financial advice. DYOR. #IMPACTbyTrade #WSOT2026 #NovUSCPIWatch #WSOTPicktoEarn10U #USPayrollsAndRateDecisionsDriveMacroWeek #OilVolatilityTracksIranPeaceTalks $BTCUSDT
ETF 正在拋售 ETH,而 BitMine 正在買入。
$ETHUSDT 現貨 ETF 已經連續六週賣超:上週流出 3.65 億美元,週一又流出 1.85 億美元。與此同時,BitMine 又買入了 9,587 枚 ETH,據傳巨鯨們正在吸籌。總有一方是錯的。 4小時線視角:ETH 目前價格為 2,099.80,低於所有移動平均線(MA7 2,122、MA14 2,155、MA28 2,197),RSI6 為 28,WR 為 -83。確實是超賣了。但在下跌趨勢中的超賣只意味著走勢過度延伸,並不代表行情結束。2,070.26 的低點是多頭必須守住的防線。 2,100 是大家都在關注的關鍵點位。如果日線收盤跌破這裡,市場預期的下一個目標位就是 2,000,再來是 1,850。 多頭:4小時收盤高於 2,155 (MA14),這是此波反彈有望延續的第一個證明。 空頭:4小時收盤低於 2,070.26,2,000 就會成為下一個觸及點。 美國 CPI 數據將於奈及利亞時間下午 2:30 公布。數據發布前,建議各位先輕倉操作。 ETF 的賣方還是逢低買入的買方,誰才是對的?選邊站,並說出你認為自己判斷錯誤的點位。 非投資建議。請自行研究 (DYOR)。 #IMPACTbyTrade #WSOT2026 #NovUSCPIWatch #WSOTPicktoEarn10U #美國就業數據與利率決策主導本週宏觀市場 #石油波動追蹤伊朗和平談判 $ETHUSDC


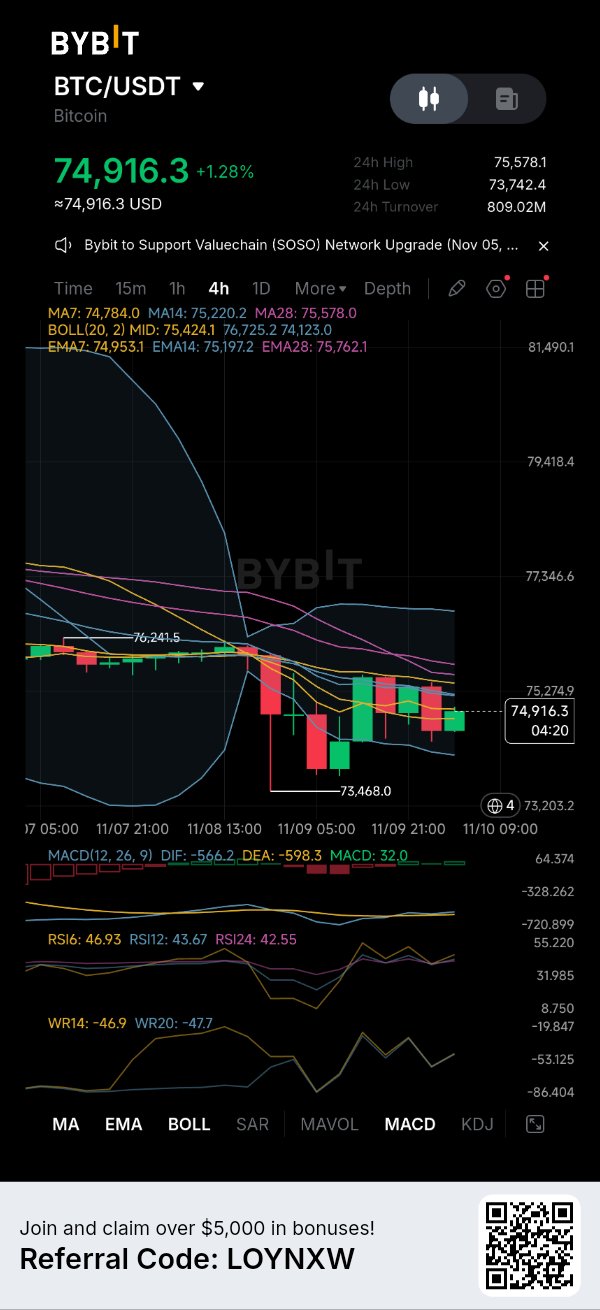
股市狂飆,但比特幣卻沒有。這就是訊號。
美股昨天迎來了自四月以來表現最好的一天(標普 +2.3%)。$BTCUSDT 呢?幾乎沒動,還是在 75K 左右徘徊。當比特幣在市場風險偏好情緒高漲的日子裡卻無法跟漲時,我就會提高警覺。 部分原因是資金流向。現貨比特幣 ETF 在十一月迄今已流出約 14.8 億美元,最新數據顯示又流出了 2.01 億美元。邊際買家並未進場。 4 小時線觀察:比特幣目前在 74,916,受困於 73,742 的低點和 75,578 的高點之間。上方堆積著阻力(MA14、EMA14、中軌、MA28、EMA28 位於 75,197-75,762 區間),且 MACD 仍在零軸下方。布林帶正在收窄,意味著波動即將來臨。 看漲:4 小時線收盤站上 75,762,下一個目標位是 76,241。 看跌:4 小時線收盤跌破 73,468,週末低點即告失守。 美國 CPI 數據將於尼日利亞時間下午 2:30 公布,也就是在聯準會九月升息之後。數據公布前,別死守某個點位,各位。 比特幣落後於美股是個警訊,還是正在蓄勢待發? 以上非財務建議,請自行做好研究 (DYOR)。 #WSOT2026 #NovUSCPIWatch #WSOTPicktoEarn10U #美國就業數據與利率決策主導本週宏觀市場 #石油波動追蹤伊朗和平談判 $BTCUSDC

$HYPEUSDT 從 $72.47 反彈:多頭能收復 $77 嗎? Hyperliquid ($HYPE) 在經歷大幅下跌至 $72.474 後正試圖企穩。 目前價格在 $75.17 附近波動,HYPE 雖已從近期低點回升,但 4 小時線圖顯示賣方仍佔據整體優勢。 指標揭示的訊號: • 價格高於 MA7 ($74.536),但仍低於 MA14 ($75.965) 和 MA28 ($77.245)。 • MACD 直方圖轉正至 0.082,顯示看跌動能可能正在減弱。 • DIF 為 -1.675,已升至 DEA (-1.758) 之上,儘管兩者皆仍在零軸下方。 • RSI6 為 45.89,而 RSI12 和 RSI24 則在 40 附近。 關鍵觀察點位: - 即時支撐:$74.536 - 主要支撐:$73.010–$72.474 - 第一阻力:$75.965–$76.736 - 主要阻力:$77.245–$77.582 - 更高阻力:$80.461 若能持續維持在 $76.736 之上,將有助於增強反彈企圖,屆時 $77.245–$77.582 將成為下一個主要障礙。 然而,若在 $76 附近遭遇拒絕,可能會將 HYPE 重新推回 $74.536。若失去該支撐,近期 $72.474 的低點將再次成為焦點。 MACD 的改善值得關注,但零軸下方的看漲交叉並不自動確認趨勢反轉。 交易焦點:觀察 HYPE 在 $76.7 附近的反應。確認收復該點位可能改善看漲情勢,而若再次遭到拒絕,則應保持謹慎。在考慮進場前,請先設定失效點並評估盈虧比。 HYPE 能否收復 $77,還是賣方將防守住反彈區? #HYPE #Hyperliquid #Bybit 非財務建議。請自行研究 (DYOR)。 #WSOT2026 #NovUSCPIWatch #WSOTPicktoEarn10U #美國就業數據與利率決策主導本週宏觀市場 #石油波動追蹤伊朗和平談判
BNB at 686: Pricing the Platform Risk
$BNBUSDT is sitting at 686.67, and the market is doing something more important than watching a support line. It is repricing platform risk in real time. The chart shows the damage clearly. On the 1D timeframe, every moving average is above price: MA7 at 695.81, MA14 at 706.59, MA28 at 720.34. Price is pinned below the lower Bollinger Band at 719.97. MACD is negative (DIF -13.91, DEA -11.40, histogram -2.50). RSI6 is 35.83, RSI12 is 38.25. WR14 is -84.90. The structure is bearish, but the oscillators are stretched to the downside. The catalyst is not a normal correction. On October 29, Binance suffered a $6.3 billion security breach. The FBI linked the attack to North Korea's TraderTraitor group, and CZ confirmed US law enforcement helped freeze a significant portion of the stolen assets. Binance reported $3.64 billion in net outflows during the crisis window before resuming withdrawals. That is the event the chart is digesting. But here is what matters for the next move. Tonight, November 9 at 20:00, Binance co-CEO Richard Teng, Yi He, and CSO Jimmy Su are holding a public dialogue. This is not a routine update. After an incident of this size, the market is waiting to hear how the platform prices the risk, how users are compensated, and what the security failure actually was. The executives' answers will be the next input for the chart. The tokenomics side is quieter but still relevant. BNB completed its 37th quarterly burn on October 19, removing 1,646,196 BNB from circulation. Total supply is now 131,512,085, still working toward the 100 million floor. There are no scheduled unlocks. But the burn did not move price, which tells you the market is focused on the hack, not supply. Levels: · 673.21 (24h low): the immediate floor. Price is fighting here now. · 670–640: the demand zone buyers are trying to hold. Losing this opens the door toward 617–600. · 695.81 (MA7) and 706.59 (MA14): the reclaim zone. A close above this would suggest the panic is exhausting. · 719.97 (BB lower) and 720.34 (MA28): the level that would change the short-term trend. Bullish case: The oversold readings, the frozen stolen funds, and a clear public explanation tonight could stabilize the platform-risk premium. Reclaiming 695 and then 706 would be the first sign that buyers are looking past the hack. Bearish case: A daily close below 673 keeps the bearish stack intact. If the executives fail to provide clear answers on compensation or security, the 640 demand zone becomes the real test. Not financial advice. DYOR. Would you treat tonight's executive dialogue as a buying catalyst if the answers are clear, or does the chart need to reclaim 706 first before you trust it? #WSOT2026 #NovUSCPIWatch #WSOTPicktoEarn10U #USPayrollsAndRateDecisionsDriveMacroWeek #OilVolatilityTracksIranPeaceTalks $BNBUSDC


PEPE Reclaims $0.0000052: Upper Band Test Active
$PEPEUSDT has staged a strong multi-day recovery off its $0.00000421 baseline, pressing into upper Bollinger Band resistance as 24-hour volume holds firm at $18.44M. But bidding market orders directly into a structural supply cap without waiting for a daily close confirmation is how aggressive buyers risk catching pullbacks. On Bybit, $PEPE trades near $0.000005201 (+2.99%), consolidating near its 24h high of $0.000005392 after defending the $0.000004777 floor on 18.44M daily turnover. What the 1D Bybit chart reveals: * Upper band penetration: Spot price pierced above the $0.000005251 upper Bollinger Band to print a local wick high of $0.000005392 before pulling slightly back. * Moving average stack: The fast dynamic trend stack turned bullish, with price holding cleanly above MA7 ($0.000004947), MA14 ($0.000004881), and MA28 ($0.000004571), anchored by the 20-day mid-band ($0.000004751). * Momentum expansion: Daily RSI(6) expanded to 68.25 (RSI12 at 62.81) with WR14 sitting at -33.80. The MACD histogram printed green at +0.00000016 as DIF (0.000000202) holds above DEA (0.000000185). Market catalysts & ecosystem updates: PEPE’s breakout momentum follows a technical exit from its long-term descending channel, with daily trading volume expanding across major exchanges. In parallel, overall platform connectivity remains steady as Bybit confirmed active support for ecosystem network upgrades, including the Valuechain (SOSO) infrastructure maintenance. Two execution setups on watch: * Trend continuation: A confirmed daily close clearing $0.00000539 opens an expansion runway targeting the $0.00000568–$0.00000600 overhead liquidity shelf. * Support retest: Rejection at $0.00000539 opens an orderly pullback toward the $0.00000494 (MA7) or $0.00000475 mid-band floor to reset 6-period RSI conditions. Check live order book depth, meme coin liquidity, and funding rates on the Bybit card below before entering positioning. Not financial advice. DYOR. #WSOT2026 #NovUSCPIWatch #WSOTPicktoEarn10U #USPayrollsAndRateDecisionsDriveMacroWeek #OilVolatilityTracksIranPeaceTalks $PEPEUSDC


PIEVERSE Surges Hard, Catch The Trend Early 📈
$PIEVERSEUSDT is delivering an aggressive rally, climbing 40.19% to $2.0930 after breaking out of a prolonged consolidation around $1.35–$1.50. The 4H chart shows a clear shift in momentum: • Price is trading above MA7 ($1.6945), MA14 ($1.5592) and MA28 ($1.4497). • MACD is strongly bullish, with DIF at 0.1575 above DEA at 0.0981. • The MACD histogram has expanded to 0.0593. • RSI6 stands at 93.99, while RSI12 is 88.76, indicating extreme overbought conditions. • Price is trading significantly above the upper Bollinger Band at $1.9150. The breakout is impressive, but the distance from the moving averages suggests that chasing the rally at current levels carries substantial pullback risk. Key levels to watch: - Immediate resistance: $2.1821 - Psychological resistance: $2.20 - First support: $1.9150 - Secondary support: $1.7770 - Stronger support: $1.6945–$1.6294 A sustained breakout above $2.1821 could extend the bullish momentum. However, rejection near $2.18 could trigger profit-taking, with $1.9150 becoming an important level to monitor. The bigger question is whether this breakout can develop into sustained price discovery or whether buyers will need a cooling-off period first. Trading focus: Avoid chasing an extended candle. Watch for consolidation, a controlled pullback or a confirmed breakout retest. Check liquidity and define invalidation before considering any position. Is $PIEVERSE preparing for another leg higher, or is a cooldown approaching? Not financial advice. DYOR. #IMPACTbyTrade #WSOT2026 #NovUSCPIWatch #WSOTPicktoEarn10U #USPayrollsAndRateDecisionsDriveMacroWeek


SOL Rebounds From $85: Reclaiming $90 📈
$SOLUSDT is attempting to recover after a sharp sell-off pushed price down to $85.06. SOL is currently trading around $87.75, but the recovery still needs confirmation before a bullish reversal can be considered. What the 4H indicators reveal: • Price has reclaimed MA7 at $87.53 but remains below MA14 at $88.57 and MA28 at $89.98. • MACD remains negative, with DIF at -1.43 below DEA at -1.29. • RSI6 has recovered to 47.69, while RSI12 and RSI24 remain around 41. • The Bollinger midline sits at $89.09, making it an important recovery hurdle. Key levels to watch: - Immediate support: $87.46–$86.11 - Major support: $85.06 - First resistance: $88.33–$88.57 - Next resistance: $89.09–$90.00 - Higher resistance: $91.39 A sustained move above $88.57 could strengthen the recovery attempt, with $89.09–$90 becoming the next major test. However, rejection around $88.33–$89.09 could send SOL back toward $86.11. A breakdown below $85.06 would invalidate the immediate recovery scenario. The interesting development is that RSI is recovering while MACD remains bearish. Buyers are showing up, but they haven't established full control yet. Trading focus: Watch the $88.57 reclaim and the $86.11 support. Wait for confirmation, define invalidation and assess risk-to-reward before considering a position. Can SOL reclaim $90, or will sellers force another support test? Not financial advice. DYOR. #WSOT2026 #NovUSCPIWatch #WSOTPicktoEarn10U #USPayrollsAndRateDecisionsDriveMacroWeek #OilVolatilityTracksIranPeaceTalks $SOLUSDC


ARB Breakout And Approaching $0.188 Resistance
Arbitrum ($ARBUSDT ) is showing strong buying pressure after recovering from $0.15963. Price has climbed to $0.18405, approaching the recent high of $0.18792. The 4H technical structure has turned constructive. • Price is above MA7 ($0.17254), MA14 ($0.17050) and MA28 ($0.16705). • MACD is bullish, with DIF at 0.00344 above DEA at 0.00224. • The MACD histogram is positive at 0.00120, confirming improving momentum. • RSI6 is at 83.34, RSI12 at 74.20 and RSI24 at 64.33. However, there's a warning traders shouldn't ignore: ARB is trading above the upper Bollinger Band at $0.17820. This reflects aggressive buying but also increases the possibility of a short-term cooldown. Key levels to watch: - Immediate support: $0.17820 - Secondary support: $0.17254–$0.17050 - Stronger support: $0.16930 - First resistance: $0.18792 - Next psychological resistance: $0.19000 A sustained breakout above $0.18792 could extend the bullish move toward $0.19000. However, rejection around the recent high could trigger profit-taking and a retest of $0.17820. The momentum is impressive, but buying strength and chasing an extended candle are two different things. Trading focus: Watch for a confirmed breakout or a controlled pullback toward support. Define invalidation and assess risk-to-reward before considering a position. Can ARB clear $0.188, or is a cooldown coming first? Not financial advice. DYOR. #WSOT2026 #NovUSCPIWatch #WSOTPicktoEarn10U #USPayrollsAndRateDecisionsDriveMacroWeek #OilVolatilityTracksIranPeaceTalks $ARBUSDC


SUI 守住 0.80 美元:多頭能否收復 0.85 美元關卡?
$SUIUSDT 在經歷了一波劇烈的拋售將價格推低至 $0.8011 後,正試圖企穩。 目前 SUI 的交易價格在 $0.8294 左右,已從近期低點反彈,但更廣泛的 4 小時結構仍面臨壓力。 技術面呈現混合訊號: • 價格仍低於 MA7 ($0.8313)、MA14 ($0.8439) 和 MA28 ($0.8606)。 • MACD 仍為負值,DIF 為 -0.0154,低於 DEA 的 -0.0131。 • RSI6 已回升至 42.49,而 RSI12 和 RSI24 仍低於 42。 • 布林通道中軌位於 $0.8518,這對買方而言是另一個阻力障礙。 需要關注的關鍵水平: - 即時支撐:$0.8154 - 主要支撐:$0.8011 - 第一阻力:$0.8313–$0.8439 - 下一阻力:$0.8518–$0.8606 - 更高阻力:$0.8881 若能持續站穩在 $0.844 上方,有望改善復甦前景,隨後 $0.852–$0.861 將成為下一個測試點。 然而,若在移動平均線附近遭到拒絕,SUI 可能會回調至 $0.8154。一旦跌破 $0.8011,即時支撐與復甦的情境將失效。 區分暫時性反彈與市場結構的真正改變非常重要。 交易焦點:觀察買方能否收復 $0.844,或是賣方是否會迫使價格再次測試支撐位。請設置提醒、定義失效點,並在考慮建倉前評估風險報酬比。 $SUIUSDC 能否收復 $0.85,還是賣方仍掌控局勢? 以上內容不構成財務建議。請自行研究 (DYOR)。 #WSOT2026 #NovUSCPIWatch #WSOTPicktoEarn10U #美國就業數據與利率決策主導本週宏觀市場 #石油波動追蹤伊朗和平談判


ETH 再次測試 2,103 美元:支撐壓縮正在發生
$ETHUSDT 正重新測試 2,103 美元的關鍵需求底線,賣壓正壓縮日內時間框架內的下軌波動率。在未等待結構性防禦確認的情況下,直接對著動態上方移動平均線阻力掛單買入,可能會有追高而被二級流動性掃單的風險。 在 Bybit 上,$ETH 交易價格接近 2,103.44 美元,在從局部阻力位回調後,正在測試其日內基準低點。 圖表結構顯示: * 需求底線測試:現貨價格正在力守 2,100–2,105 美元區間,這是防止進一步下跌擴張的主要防線。 * 動態移動平均線阻力:上方的趨勢阻力仍錨定在短期移動平均線上,持續對布林通道下軌邊界施加壓力。 * 動能重置:短週期 RSI 和 MACD 指標正進入超賣區,預示著從當前的價格壓縮中,即將出現擴張或均值回歸走勢。 基本面與機構背景: 以太坊網路流動性在交易所生態系統發展後持續調整,包括 Bybit 對 Aerodrome (AERO) 等活躍 L2 代幣遷移的驗證支持,以及在 Base 和主網 DeFi 基礎設施上持續進行的 Layer-2 結算活動。 值得關注的兩個執行策略: * 支撐防守:守住 2,100 美元支撐底線並收復 4 小時動態 MA 阻力,將開啟目標為上軌上限的均值回歸行情。 * 跌破延續:確認收盤價低於 2,100 美元,將為流動性掃單至下方關鍵宏觀需求區間掃除障礙。 在建立部位之前,請查看下方 Bybit 卡片中的即時訂單簿深度和資金費率。 非財務建議。DYOR (請自行研究)。 #WSOT2026 #NovUSCPIWatch #WSOTPicktoEarn10U #美國就業數據與利率決策主導本週宏觀市場 #石油波動追蹤伊朗和平談判 $ETHUSDC


$BTCUSDT 區塊達成 11.2K 筆交易:歷史性里程碑 比特幣基礎層剛剛寫下了一個罕見的里程碑。AntPool 成功挖出了第 974961 個區塊,單一區塊內塞入了驚人的 11,255 筆交易,這是有史以來比特幣交易量第二高的區塊。 該區塊距離打破 2015 年 8 月 1 日創下的 12,239 筆交易的歷史網路紀錄僅差 984 筆。該區塊以約 1.1 MB 的高效大小運行(佔用了 99.85% 的區塊權重限制),突顯了一個異常高密度的吞吐量環境。 這個鏈上里程碑揭示了什麼: * 持續的基礎層需求:此事件凸顯了 2026 年的一個宏觀趨勢,即每日交易量持續走高,且記憶體池(mempool)活動密度極高。 * 費用效率:儘管負載了 11,255 筆轉帳,但總區塊費用仍保持在約 0.0024 BTC 的極低水準,反映出經過優化的交易打包技術。 * 網路韌性:礦工持續在不干擾確認節奏或安全參數的情況下,將區塊空間效率推向極致。 值得關注的兩個執行觀點: * 吞吐量擴展:持續的高密度區塊指標顯示出二層網路和打包協議的結構性擴容採用。 * 費用市場敏感度:持續的高交易量讓市場在波動劇烈時,更加關注記憶體池的擁堵追蹤。 在管理您的現貨或衍生品部位之前,請透過下方的 Bybit 卡片查看即時訂單簿深度、網路算力及資金費率。 非財務建議。DYOR (請自行研究)。 #WSOT2026 #NovUSCPIWatch #WSOTPicktoEarn10U #美國就業數據與利率決策主導本週宏觀市場 #石油波動追蹤伊朗和平談判 $BTCUSDC

