CoinGru
4863點贊0分享153粉絲424關注
Crypto Trader | Technical Analyst 📊 Reading Charts, Not Hype. Discipline • Strategy • Risk Management
Crypto Trader | Technical Analyst 📊 Reading Charts, Not Hype. Discipline • Strategy • Risk Management
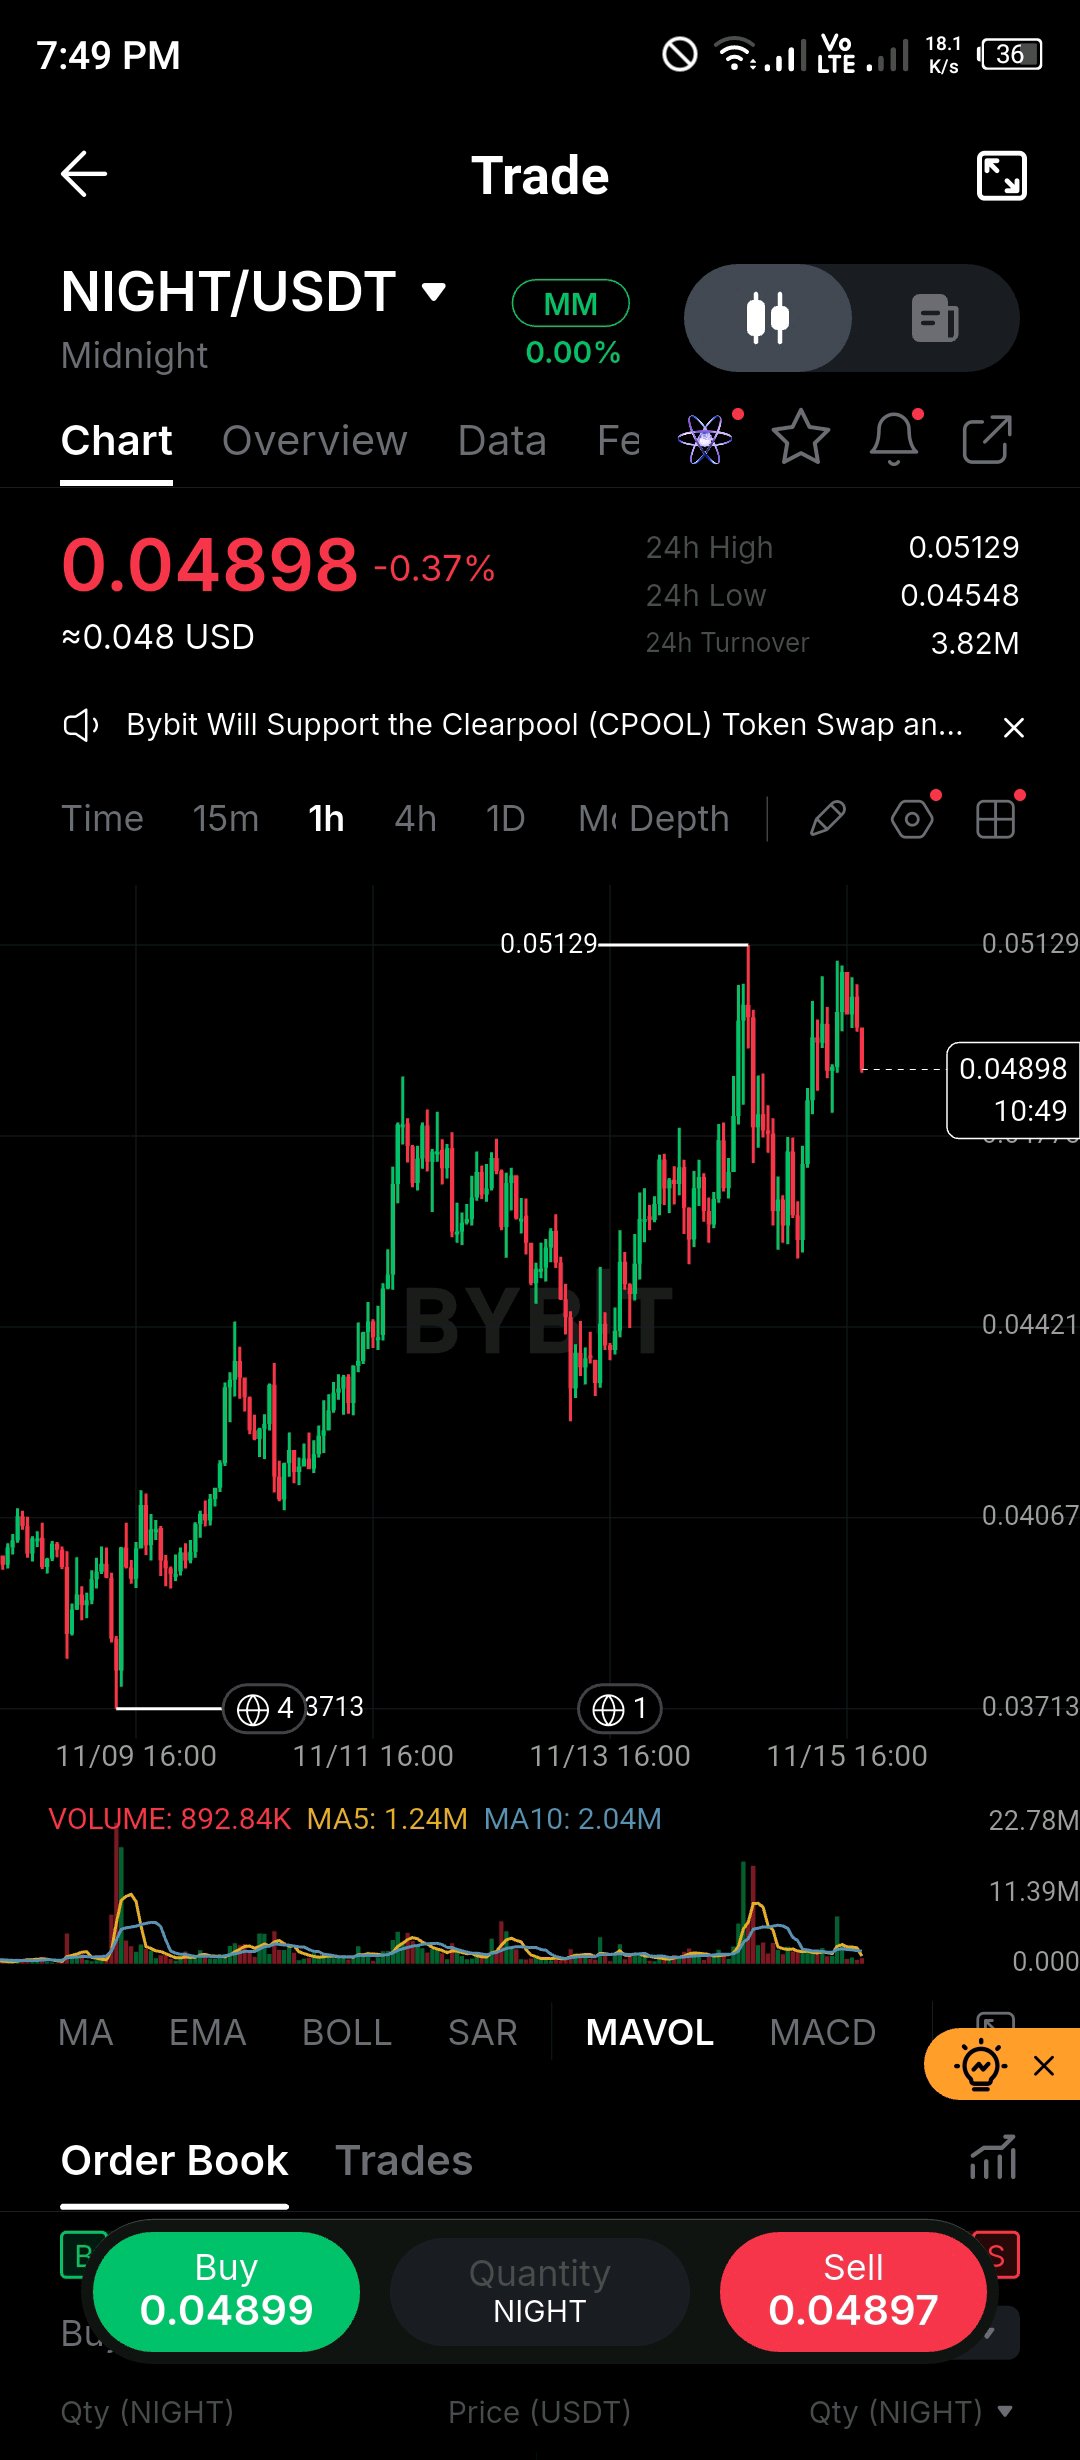
$NIGHT is approaching a critical decision point, and I’m paying close attention to how price reacts around the $0.05000 psychological barrier. What initially caught my attention is the strong recovery from the $0.03713 region, followed by a series of higher price swings. Buyers have clearly improved the market structure, but the latest candles suggest that upside momentum is encountering resistance near the recent $0.05129 high. Currently trading around $0.04898, NIGHT is showing a relatively small decline of 0.37%. Looking at the 1-hour chart, the broader structure remains bullish, with price recovering from previous pullbacks and pushing toward higher levels. However, the rejection around $0.05129 deserves attention. Sellers have responded near this area, creating short-term uncertainty about whether buyers have enough strength to extend the rally. The $0.05000 level is the first psychological resistance I’m watching. A convincing 1-hour close above it could bring another attempt toward $0.05129. If buyers break that high with expanding volume, the next potential upside areas could develop around $0.05300 and $0.05500. These are conditional projection levels, not confirmed resistance zones. Volume is another important detail. Current volume is approximately 892.84K, while the displayed MA5 and MA10 volume averages are 1.24M and 2.04M respectively. This suggests that recent participation is relatively weak compared with those averages. I would prefer to see stronger buying activity before trusting another breakout attempt. On the downside, I’m monitoring the $0.04800–$0.04700 area as an approximate near-term support zone. Losing this region could expose $0.04548, followed by the more significant structural support around $0.04421. A deeper breakdown could bring $0.04067 into focus. My strategy here is to avoid chasing price directly beneath resistance. I want to see either a confirmed breakout above $0.05129 followed by a successful retest, or a controlled pullback that shows buyers defending support. A sustained move below $0.04421 would significantly weaken my bullish outlook. One limitation is that EMA, RSI and MACD values are not displayed in this screenshot, so I won't pretend to have confirmation from indicators that aren't available. My overall view remains cautiously bullish while NIGHT holds its recent higher-low structure, but the next move depends on how convincingly buyers handle $0.05000–$0.05129. I would rather wait for confirmation than mistake another resistance rejection for the beginning of a fresh rally. $BTCUSDT$NIGHTUSDT #ByXIMPACT
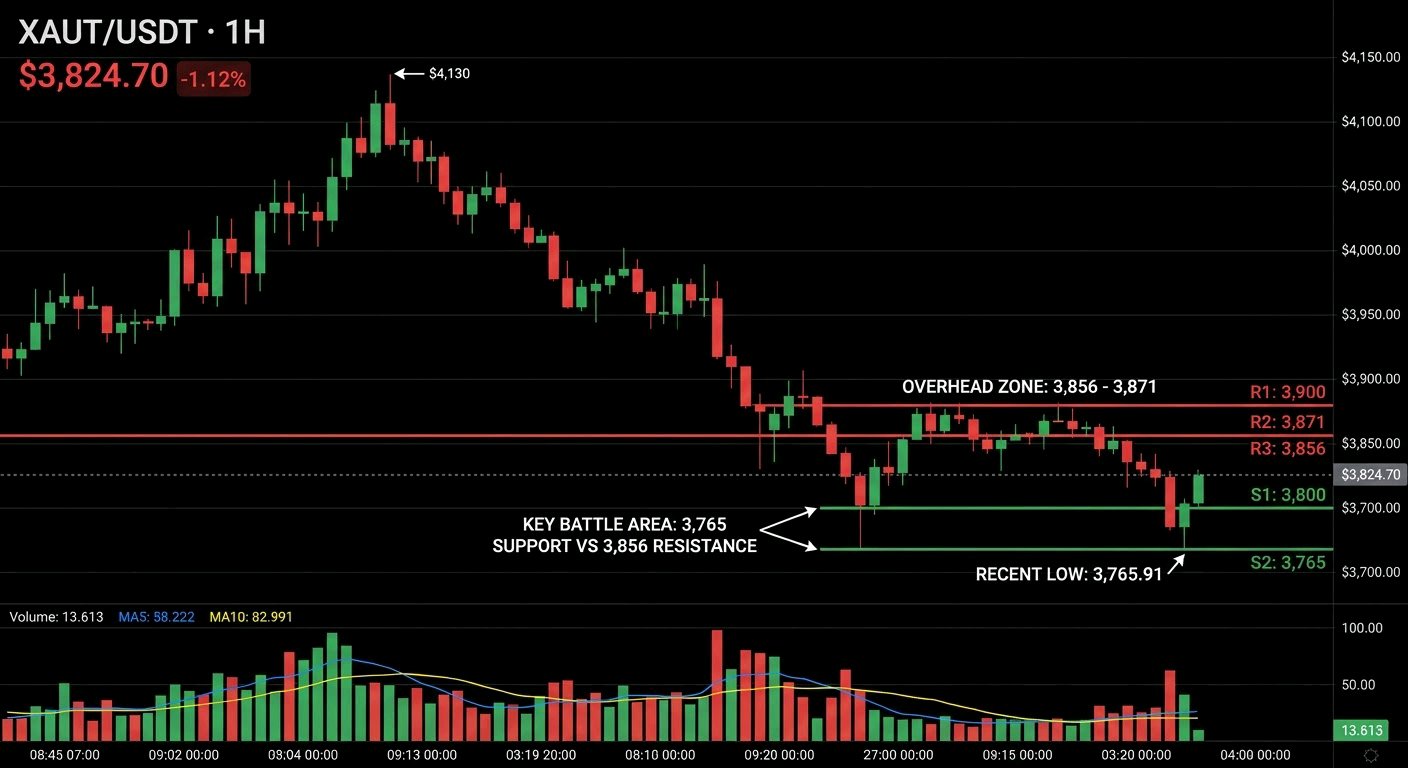
XAUT/USDT 市場的上漲動能已大幅減弱,比起這波小幅反彈,我更關注賣方在近期低點附近的表現。 黃金在 1 小時圖上持續承壓,價格從 4,130 美元附近跌至 3,765 美元。最新的反彈值得觀察,但我目前不會將其視為確認的反轉訊號。 XAUT 目前交易價格約為 3,824.70 美元,下跌約 1.12%。最引人注目的是它呈現出一連串的高點降低與低點降低的走勢。每一次的反彈嘗試都難以收復先前失去的陣地,這顯示賣方在整個下跌過程中始終掌控著局面。3,856 美元至 3,871 美元的區間現在是一個重要的壓力區,而近期低點 3,765.91 美元則代表了當前的下檔邊界。 從目前的價格走勢來看,3,856 美元是我希望看到買方收復的第一個阻力位。在此之上,3,900 美元將成為另一個重要的心理與結構性關卡。如果能持續突破 3,900 美元,將改善復甦前景,並可能開啟通往 3,948 美元甚至 4,039 美元的道路。 在下檔方面,我持續關注 3,800 美元與 3,765 美元。如果賣方帶量跌破 3,765 美元,可能會引發新一波跌勢,將 3,720 美元暴露為下一個潛在關注區域。然而,如果買方能守住該低點並築出更高的低點,目前的反彈才可能獲得支撐。 成交量也值得關注。目前顯示的成交量平均值 MA5 為 58.222,MA10 為 82.991,皆高於最新報告的 13.613 成交量。這顯示當前的反彈需要更強的買盤參與,我才會認為它是有效的。由於 EMA 配置、RSI、MACD 和斐波那契數值目前不可見,我不會憑空編造指標訊號。 我傾向採取耐心等待的策略。我會尋求在確認收復 3,856 美元後再考慮做多機會,並在確認後的更高低點下方設置保護性停損。或者,若在阻力位附近遇阻並跌破 3,800 美元,則可能提供一個以 3,765 美元為目標的做空機會。任何進場都應基於市場確認訊號及合理的風險回報比。 XAUT 目前的關鍵戰場在於 3,765 美元的支撐與 3,856 美元的阻力之間。在買方收復該阻力位之前,對於是否將此視為趨勢反轉,我持謹慎態度。接下來幾個決定性的小時 K 線走勢,將能揭示這究竟是有意義的復甦起點,還是僅為大跌趨勢中的暫停。 $XAUTUSDT $BTCUSDT ll#ByXIMPACT
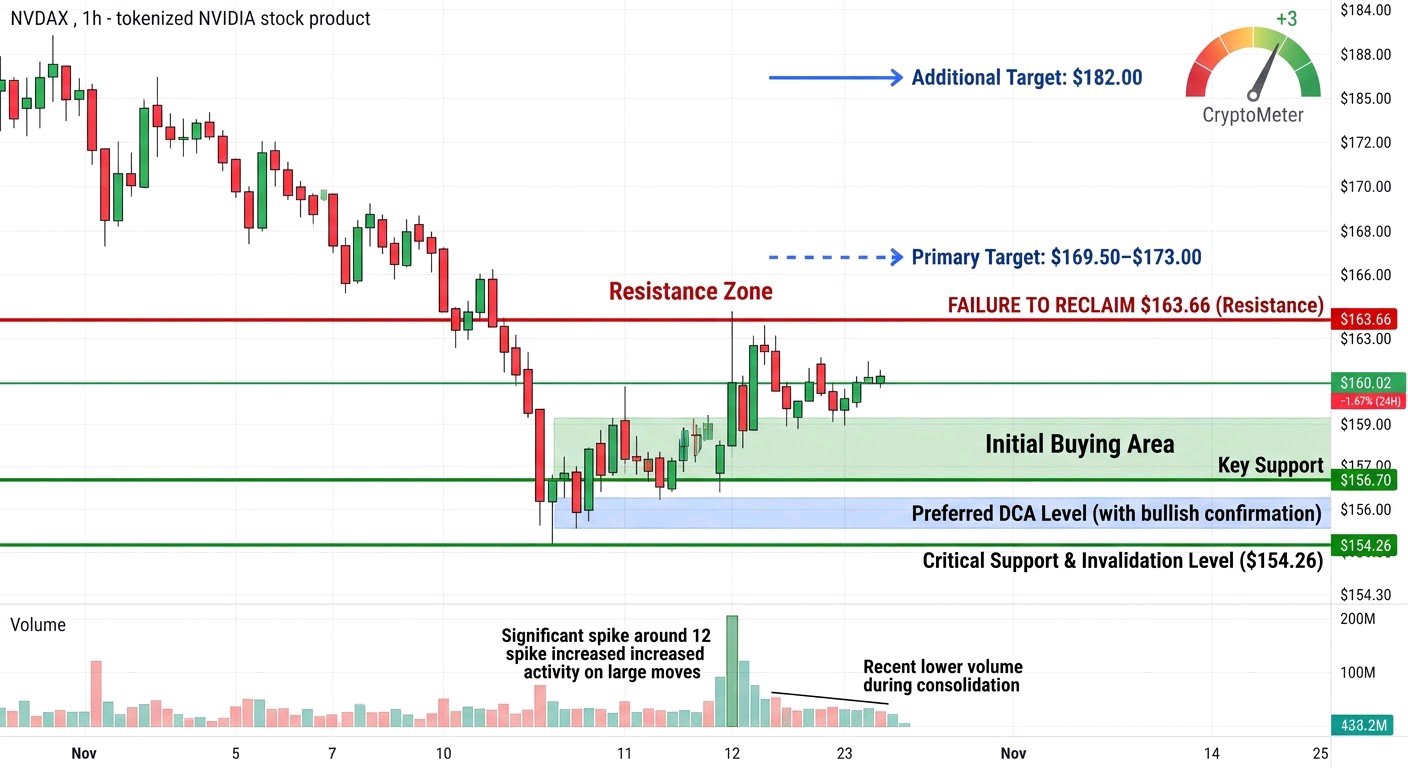
NVDAX 正努力收復 163 美元關卡——買方能否守住 156 美元的支撐區? 市場背景 我正密切關注 NVDAX,因為圖表顯示動能出現了明顯的轉變。在 Bybit 截圖時,NVDAX 的交易價格約為 **160.02 美元**,24 小時內下跌 1.67%。 24 小時交易區間介於 156.70 美元至 163.14 美元之間,成交額約為 116 萬美元。在經歷了從 188-192 美元區間的大幅下跌後,大盤整體仍面臨壓力。 NVDAX 是代表 NVIDIA 的代幣化股票產品,因此其價格走勢也需要結合基礎股票市場進行考量。 # 價格走勢 1 小時圖顯示出看跌的市場結構。賣方多次創下更低的高點,而幾次試圖反彈的嘗試都未能產生持續的看漲突破。 一個重要的細節是近期在 154.26 美元附近的反應。買方從該區域積極介入,觸發了向 170 美元區間的回升。然而,反彈動能減弱,價格回落至 160 美元附近。 目前,NVDAX 正於 163.66 美元的阻力區下方盤整。這表明買方尚未重新獲得實質性的控制權。 # 成交量分析 在一些主要的下跌和反彈蠟燭圖中,交易活動有所增加,特別是在 11 月 12 日附近的劇烈變動期間。 然而,最新的盤整尚未顯示出令人信服的買盤壓力。在將其視為真正的反轉之前,我想看到成交量隨阻力位的突破而放大。 ### 我的交易計劃 - **初始買入區:** 157.00–159.00 美元 - **偏好的 DCA(平均成本法)水平:** 154.30–156.00 美元,僅在出現看漲確認後操作。 - **第一阻力位:** 163.66 美元 - **主要目標:** 169.50–173.00 美元 - **額外目標:** 182.00 美元 - **關鍵支撐位:** 156.70 美元,其次是 154.26 美元。 - **失效水平:** 1 小時線持續收於 154.26 美元下方。 這些是技術規劃區域,並非保證執行的價格。 ### 延續情境 為了實現更強勁的復甦,NVDAX 需要以令人信服的 1 小時蠟燭圖收盤價並配合成交量放大,收復 163.66 美元。 如果買方成功做到這一點,我將關注的下一個區域是 169.50 美元、173.00 美元,以及潛在的 182.00 美元。 若能持續站穩 173 美元上方,將提供更強烈的訊號,顯示看跌結構開始減弱。 ### 可能會出現什麼問題? 最大的隱憂是在 163.66 美元附近再次遭到拒絕。如果賣方將價格推低至 156.70 美元下方,注意力將轉向 154.26 美元。 若跌破 154.26 美元,可能會暴露更多的下方流動性,並削弱復甦預期。 我會避免盲目向下攤平,因為價格更低並不自動意味著更好的入場點。 我的觀點 NVDAX 正接近一個重要的決策區。從 154.26 美元的回升顯示買方仍願意捍衛較低的價格,但他們尚未表現出足夠的力量來扭轉大趨勢。 我的焦點在於兩個水平:163.66 美元(看漲確認)和 154.26 美元(下行失效點)。 我對此次反彈感興趣,但我不會將暫時的彈升誤認為是確認的趨勢反轉。讓價格證明其方向後再投入資金。 CryptoMeter +3 #ByXIMPACT $NVDAXUSDT $METAXUSDT
🚨🇨🇿 **重大突發:一家中央銀行剛剛在區塊鏈時代邁出了重要一步! 捷克國家銀行 (CNB) 已正式發行其首批基於區塊鏈的分散式帳本技術 (DLT) 代幣化債券。這一進展的影響力比表面看起來要大得多。 以下是此舉特別引人注目的原因: 🔥 1. 史上首次區塊鏈債券發行 2026 年 11 月 10 日,捷克國家銀行宣布成功測試了其首批以克朗計價的代幣化債券,這對該機構而言是一個歷史性的里程碑。 🔥 **2. 真實的金融交易,而非紙上談兵** 中央銀行測試了: - 債券發行與轉移。 - 現金對付的買賣交易。 - 利息支付。 - 以債券作為抵押品的附買回交易 (Repo)。 交易幾乎即時結算,展示了顯著加快金融市場運作的潛力。 🔥 3. 主要機構參與其中 此次操作使用了由捷克中央證券託管機構營運的 DLT 基礎設施,並由捷克儲蓄銀行 (Česká spořitelna) 作為商業銀行對手方參與。 每張測試債券的面值為 10,000 克朗,交易量為數萬克朗。 🔥 4. 比特幣已是實驗的一部分 這是許多人可能會忽略的細節。 大約一年前,捷克國家銀行啟動了一個數位資產測試組合,探索比特幣、美元穩定幣和代幣化存款。 現在,它已將實驗擴展到代幣化證券和基於區塊鏈的金融基礎設施。 🔥 **5. 更宏大的願景:24/7 全天候金融市場** 捷克國家銀行認為 DLT 可以實現全天候的證券交易,降低行政成本,加速結算並自動化金融營運。 行長 Aleš Michl 也強調,央行貨幣應始終處於結算的核心,而不是依賴穩定幣等私人貨幣。 **我的看法:** 這是一個值得關注的發展。 中央銀行不再只是在討論區塊鏈。它正在測試該技術如何在真實的金融營運中發揮作用。 比特幣開啟了通往新金融架構的大門。代幣化可能是下一個重大篇章。 想像一下,傳統債券、證券和機構金融交易在數位基礎設施上 24/7 全天候運作。 我們正在見證傳統金融正一步步向區塊鏈技術靠攏。 **核心問題:如果有更多中央銀行跟進,代幣化金融市場將會變得多大? 國家銀行 +2** $BTCUSDT #ByXIMPACT

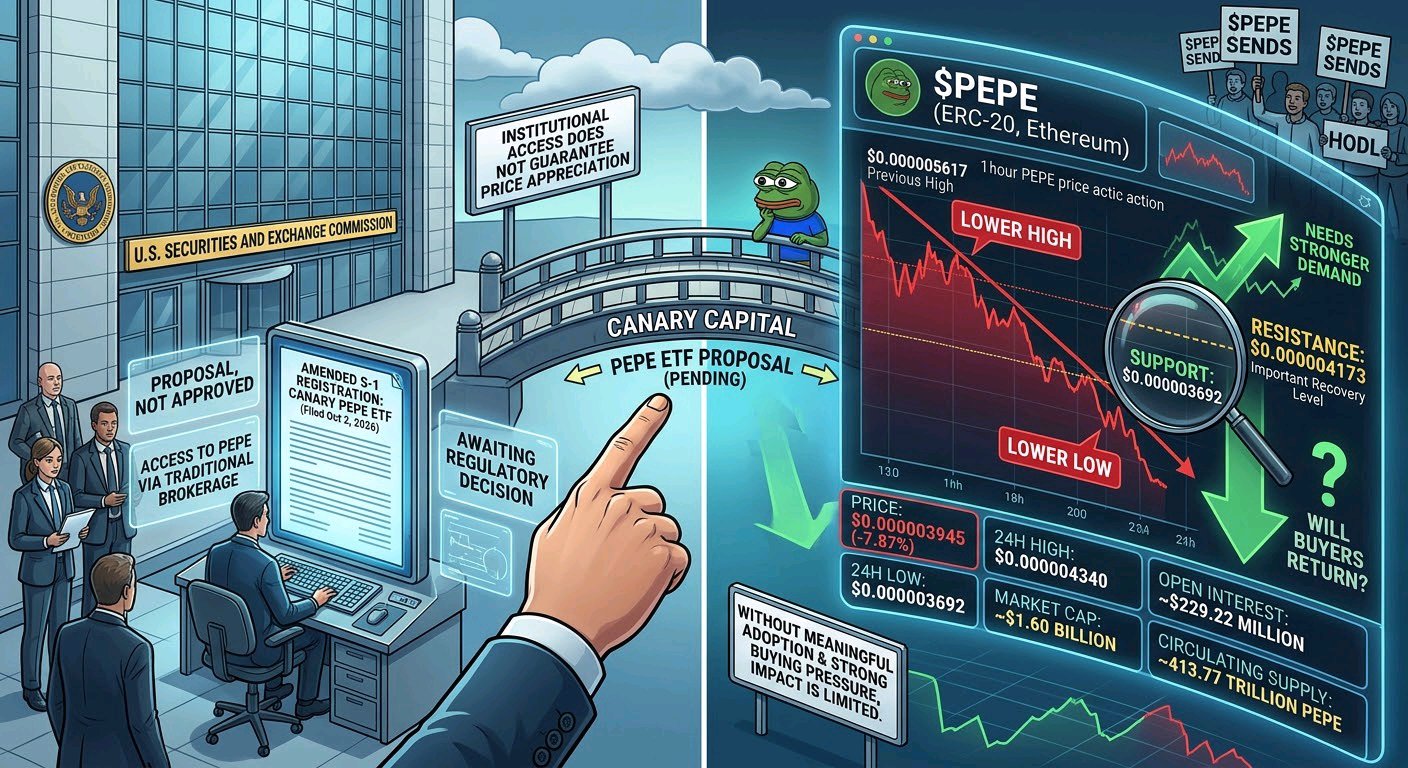
當迷因幣(meme coin)開始吸引傳統金融市場的目光,但其價格卻在關鍵支撐位處掙扎,這種情況會如何發展?這正是我目前觀察 $PEPE 的情況。 最有趣的發展之一是 Canary Capital 提出的 PEPE ETF。該公司於 2026 年 10 月 2 日向美國證券交易委員會(SEC)提交了修訂後的 S-1 註冊聲明,概述了一項旨在讓投資者透過傳統經紀帳戶獲得 PEPE 曝險的基金。該提案旨在直接持有 PEPE,可能為機構和傳統市場參與者創造另一條途徑。 然而,這裡有一個重要的區別:這仍然只是一項提案,並非已經獲批或正在交易的 ETF。 這裡最大的重點在於將 PEPE 的可訪問性擴展到加密原生交易所之外的可能性。如果獲得批准並推出,該產品可能會引入額外的需求管道,儘管實際的資金流入情況將決定其市場影響力。 以下是該市場背後的數據: • 圖表價格:$0.000003945 • 24 小時跌幅:-7.87% • 24 小時高點:$0.000004340 • 24 小時低點:$0.000003692 • 市值:約 16 億美元 • 現貨交易量:約 1.4373 億美元 • 期貨交易量:約 4.698 億美元 • 未平倉合約:約 2.2922 億美元 • 流通供應量:約 413.77 兆枚 PEPE。 現在來看看這個發展帶來了什麼。 PEPE 作為以太坊上的 ERC-20 代幣運行,受益於以太坊既有的基礎設施和交易所兼容性。然而,必須認識到 PEPE 目前並未提供實質的原生效用或傳統的應用驅動型生態系統。其價值仍深受社群參與度、市場情緒、流動性和投機需求的影響。 展望未來,擬議中的 ETF 的 SEC 註冊程序是一個重要的潛在催化劑。目前尚無確定的批准或推出日期。 從交易角度來看,1 小時圖表講述了另一個故事。自達到約 $0.000005617 後,PEPE 出現了低點不斷降低的情況。$0.000003692 區域是當前的立即支撐位,而 $0.000004173 是附近的一個重要復甦位。如果能持續突破該阻力位,可能會改善短期動能。 當然,機構的可訪問性並不保證價格會上漲。如果沒有實質的採用、持續的需求和更強的買盤壓力,即使是利好消息,影響也可能有限。 我的觀點是:PEPE 有機會透過更廣泛的市場可訪問性來鞏固其地位,但圖表仍需要證明買家正在回歸。 你認為擬議中的 ETF 會成為 PEPE 的重要催化劑嗎?還是說這個市場在迎來下一波復甦前,需要更強勁的需求? $PEPEUSDT #WSOT2026 #ByXIMPACT
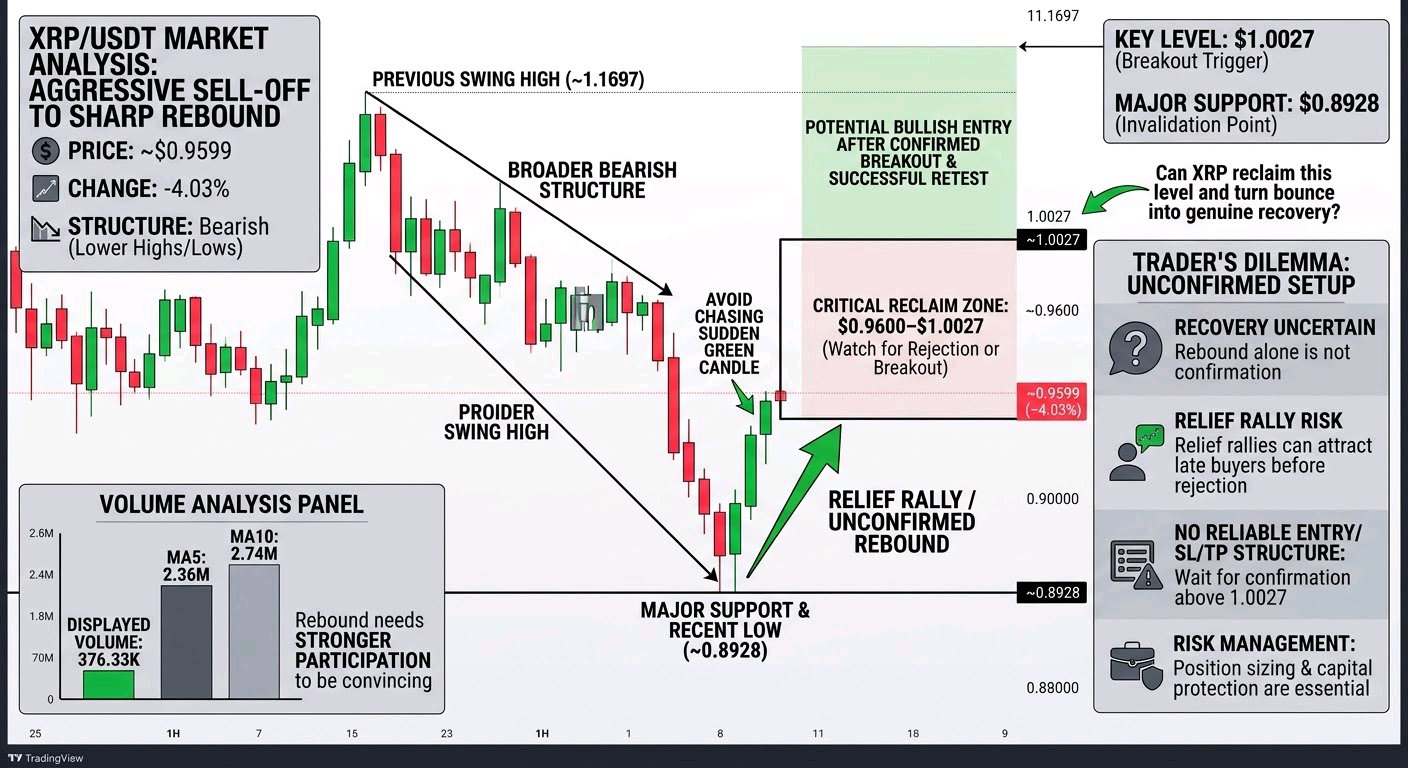
我正在密切關注 XRP,因為最近的 1 小時走勢在經歷了一波猛烈的拋售後,出現了有趣的反應。價格已從 $0.8928 區域急劇反彈,但我還不相信這種復甦足以標誌著全面的趨勢反轉。 XRP/USDT 目前交易價格在 $0.9599 左右,跌幅約為 4.03%。整體市場結構仍然看跌,自先前在 $1.1697 附近的波段高點以來,價格持續出現更低的高點和更低的低點。賣方在整個下跌過程中保持著控制權,最近跌向 $0.8928 的走勢凸顯了下行壓力會有多快加劇。綠色的反彈令人鼓舞,但買方仍需證明他們能夠維持這種勢頭。 有一個值得監控的細節是成交量。目前顯示的成交量為 376.33K,而 MA5 為 2.36M,MA10 為 2.74M。這表明在考慮這是否為令人信服的復甦之前,反彈需要更強的市場參與度。$0.9600–$1.0027 區域是一個值得關注的重要區間,而最近 $0.8928 的低點則作為近期主要支撐。 我會避免追逐這根突然出現的綠色蠟燭。在經歷如此急劇的下跌後,技術性反彈可能會在下一次回落發生前吸引遲來的買家。 目前,我沒有看到足夠的資訊來建立一個具有準確風險回報比的可靠進場、停損或止盈結構。我的偏好是等待確認突破並成功回測 $1.0027 以上,再考慮做多機會。若無法守住反彈,隨後重新賣壓湧現並跌向 $0.8928,這將使看跌情境持續存在。 風險管理依然至關重要。單憑一根復甦蠟燭並非確認訊號,保護資本比抓住每一次波動更重要。 大哉問:XRP 能否重回 $1.0027 並將這次反彈轉化為真正的復甦,還是賣方正在準備下一波下跌? $XRPUSDT $SOLUSDT #ByXIMPACT
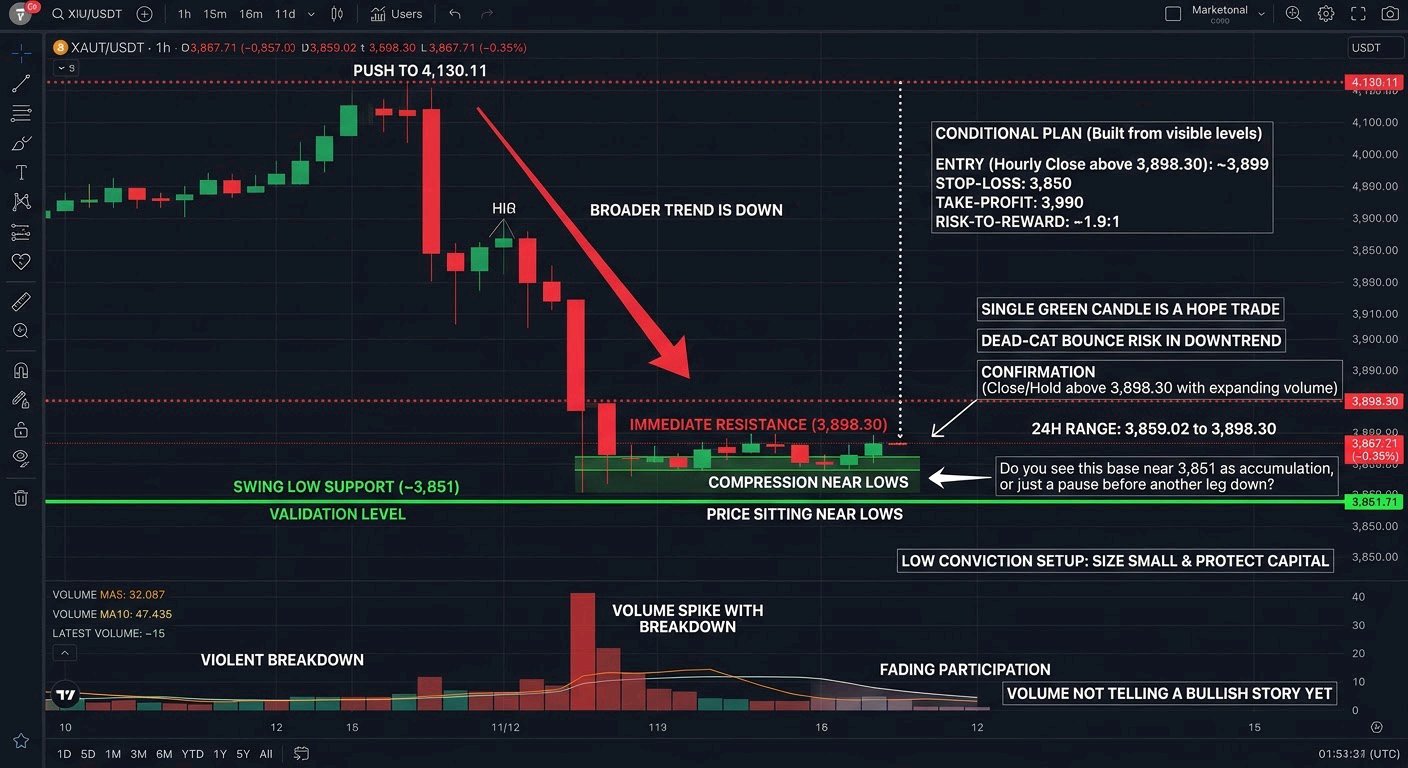
XAUT/USDT 1小時圖最吸引我目光的,是結構崩塌得如此劇烈,而如今價格卻靜悄悄地在低點附近盤整。在推升至 4,130.11 後,賣方接手,價格在幾個交易時段內下跌了約 250 點。 大趨勢仍然向下。11/12 附近的彈升只產生了一個較低的高點,隨後又再次走弱。價格目前報 3,867.71,日內下跌 0.35%,24 小時區間為 3,859.02 至 3,898.30。波動低點位於 3,851 附近,就在今日區間下方。這些緊貼該區域的小 K 線看起來像是壓縮盤整,而非確認反轉。 成交量尚未傳遞出看漲訊號。下跌時伴隨著成交量激增,而近期的柱狀圖卻很稀疏,成交量 MA5 (32.087) 低於 MA10 (47.435)。這顯示市場參與度正在減弱,而非有新的買盤進場。我不會將其視為任何方向的訊號,這只是一個需要耐心的理由。 低點出現單根綠色小時 K 線,正是那種會讓人過早進場的誘餌。若沒有收在阻力位之上,那只是「希望交易」,在下跌趨勢中,很容易就會陷入死貓反彈的陷阱。 我的條件式交易計畫,純粹基於可見的點位: 進場:僅在小時線收於 3,898.30 之上後,例如大約 3,899。 停損:波動低點下方,約 3,850 附近。 停利:首要目標 3,990。 這大約是用 49 點的風險博取 91 點的報酬,風險報酬比約為 1.9:1。 確認訊號會是小時線收盤並站穩於 3,898.30 之上,且成交量放大。若跌破 3,851,此設定失效,這會讓低點再次面臨風險。 這是在下跌趨勢中信念感較低的設定,因此請縮小倉位,並以保護資本為優先。 你認為 3,851 附近的底部是籌碼累積,還是僅僅是下一波跌勢前的中場休息? $XAUTUSDT $BTCUSDT #WSOT2026 #ByXIMPACT
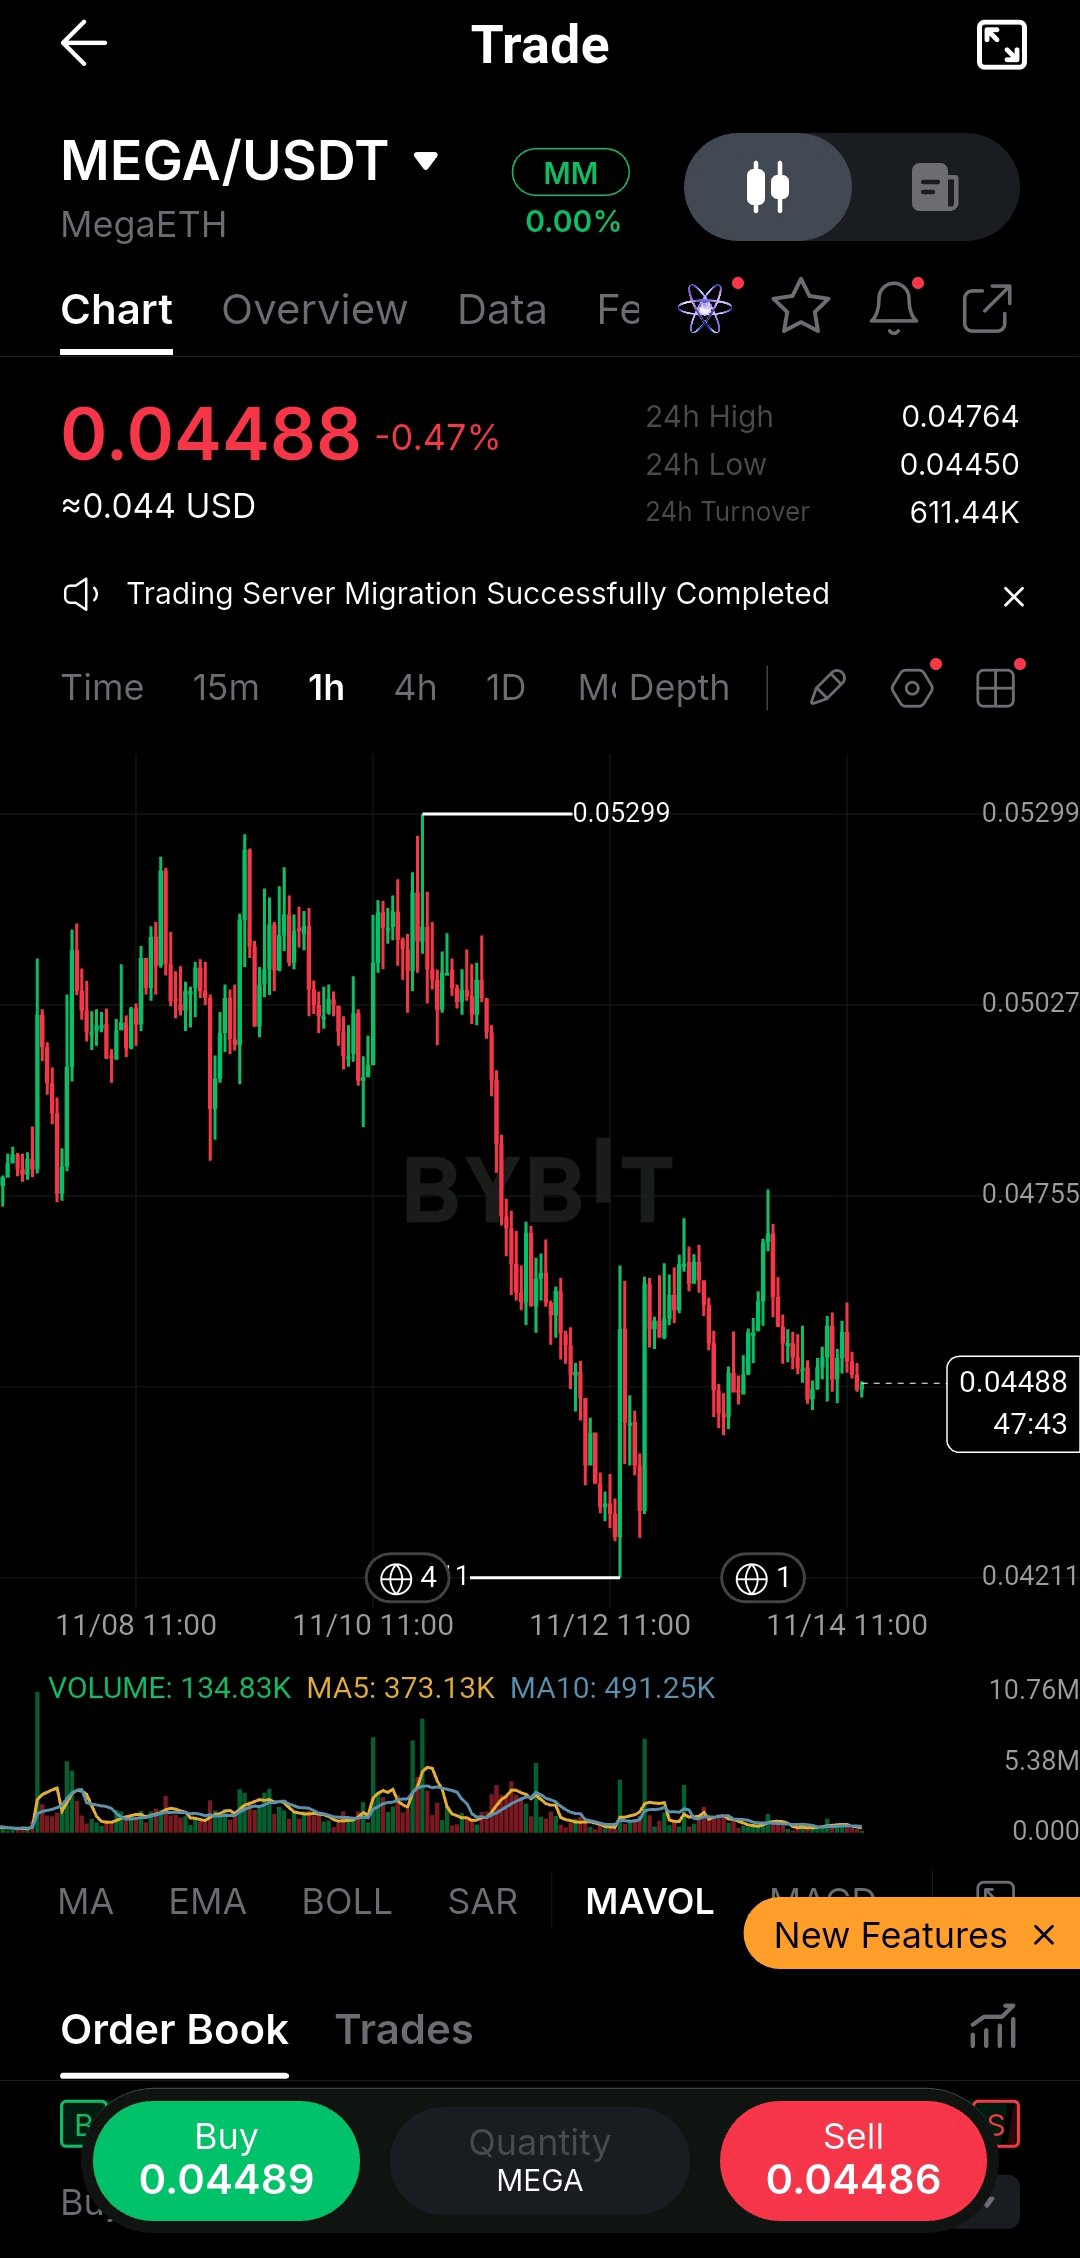
我不斷回看這張 MEGA/USDT 1 小時圖,因為在經歷了如此劇烈的波動後,市場變得異常平靜。價格目前位於 0.04488,日內下跌約 0.47%,K 線波動已明顯收窄。 大局來看,從 0.05299 高點開始的下跌趨勢非常明確。賣方在 11/12 左右將價格強勢打壓至 0.04211 低點,而此後的反彈僅達到 0.0476 區域附近,這與 24 小時高點 0.04764 一致。這是一個更低的高點(lower high),意味著復甦尚未改變整體結構。24 小時低點 0.04450 是價格目前徘徊的支撐位。 指標方面,當前成交量 134.83K 遠低於其 MA5 (373.13K) 和 MA10 (491.25K)。最後一根 K 線仍在形成中,但反彈顯然是在參與度減弱的情況下發生的。這解讀為壓縮狀態。它可能會向任一方向突破,僅憑低成交量無法確認任何趨勢。 我不會在這裡追逐任何突然出現的綠色陽線。單一小時線在成交量稀薄和上方供應壓力下的突漲可能會迅速反轉,而沒有確認信號就進場只會讓策略變成猜測。 如果我要交易,我的想法是進行條件性做多。進場區間為 0.04450 至 0.04490,且僅在確認守住支撐後才進場。我的止損設在 0.04400,即 24 小時低點下方。目標位分別為 0.04755 和 0.05027,這兩個都是圖表上的可見水準。從區間頂部 0.04490 計算,風險為 0.00090,到第一個目標位的盈虧比約為 2.9:1,到第二個目標位約為 6:1。 確認信號將是小時線強勢收在 0.04490 上方,且成交量向平均水準回升。若小時線明確收於 0.04450 下方,特別是收在 0.04400 下方,則該策略失效。 目前市場充滿不確定性,趨勢仍然向下,保護資本重於任何目標。請控制倉位大小,確保止損在可接受的小額虧損範圍內。 你認為這是在 0.04450 上方形成築底,還是僅僅在再次測試 0.04211 低點前的暫停? $MEGAUSDT $BTCUSDT #ByXIMPACT
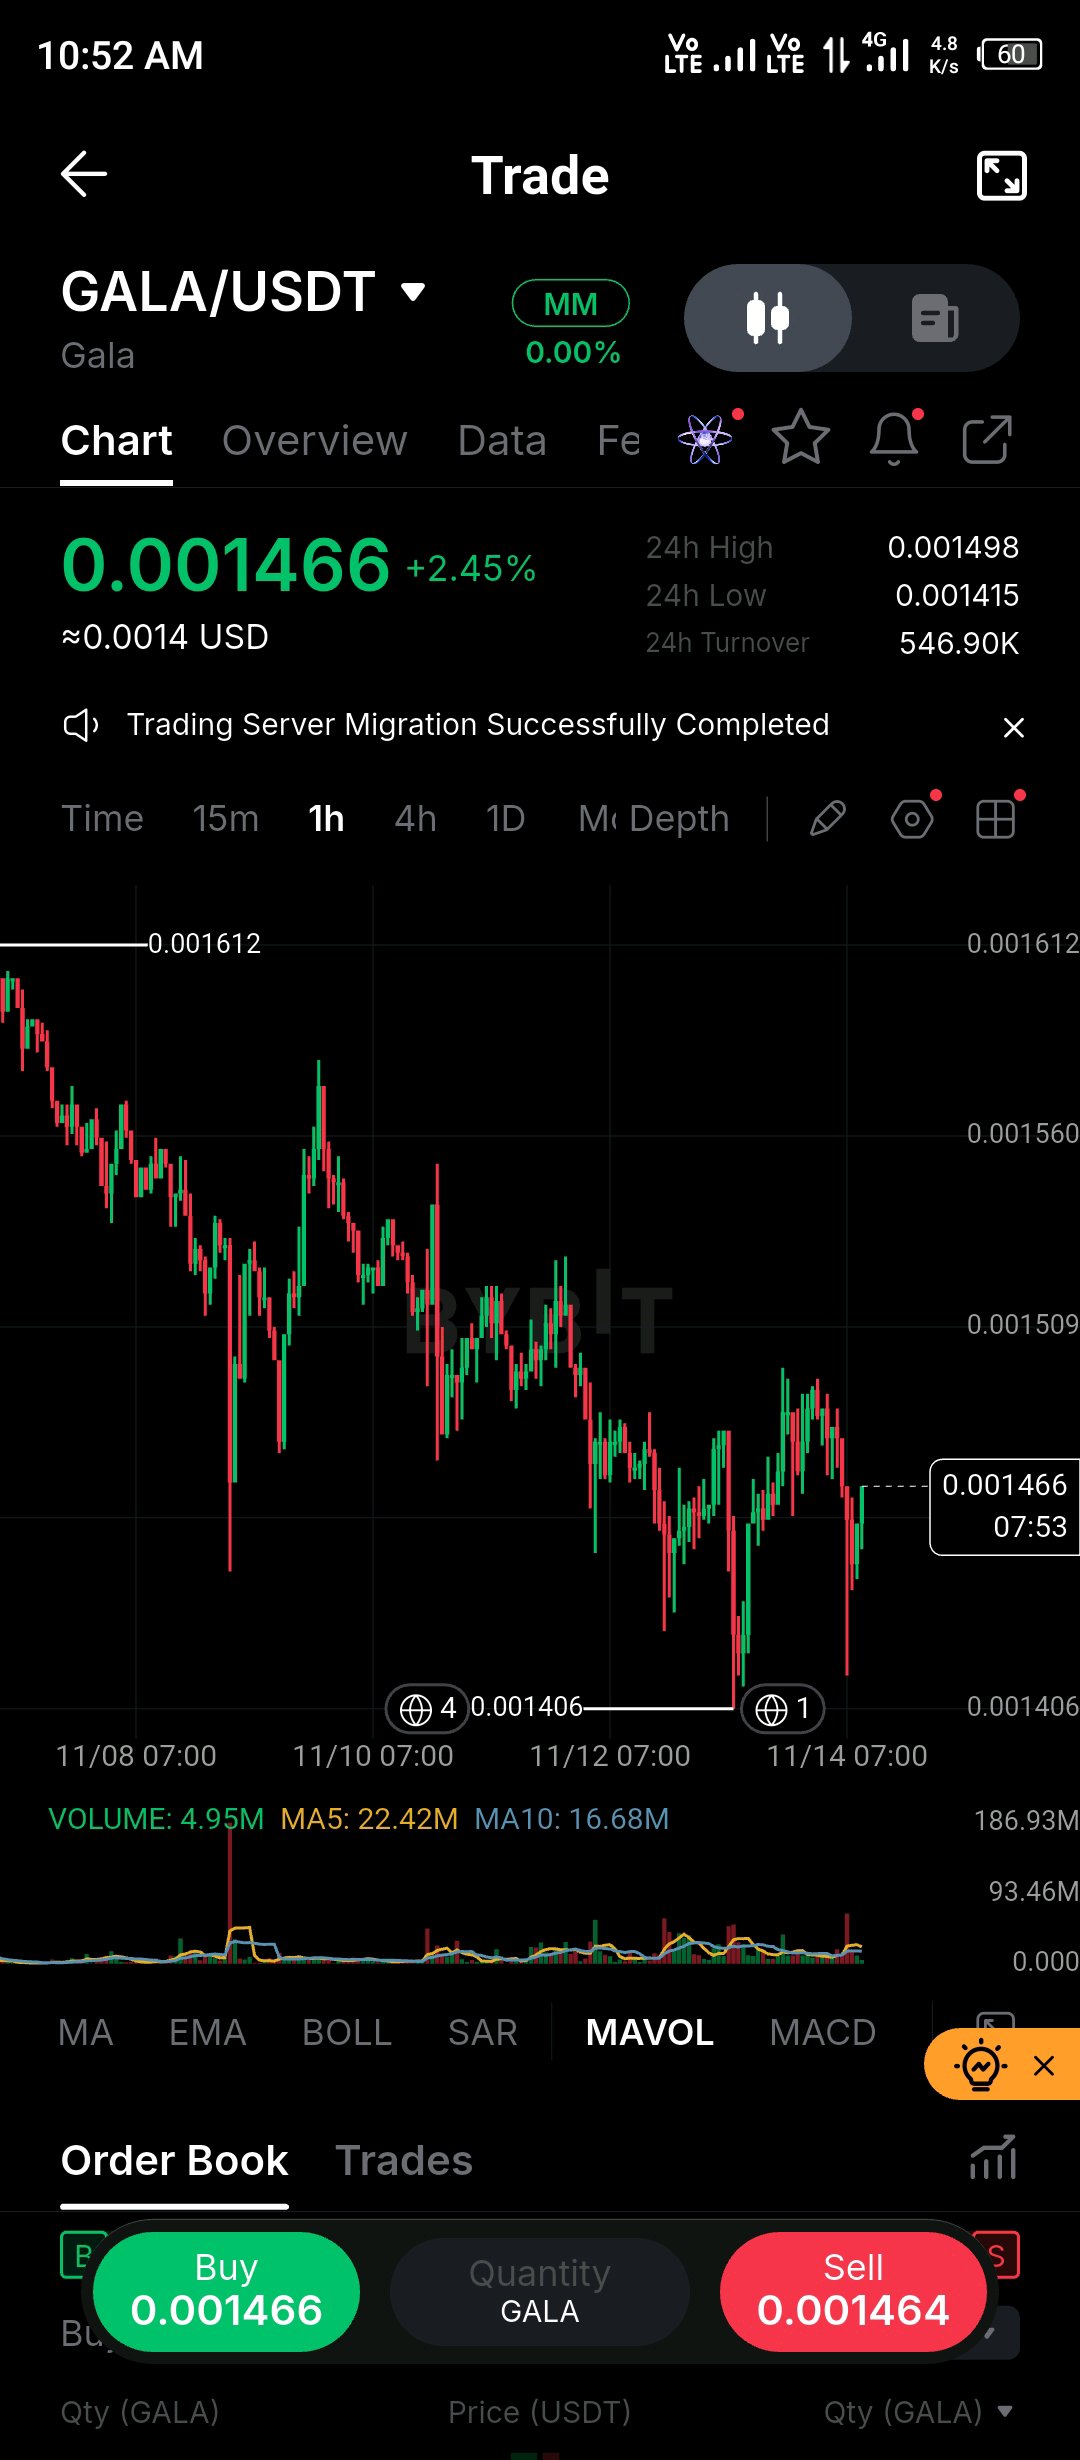
I’m watching GALA/USDT closely because the 1-hour chart is showing an interesting battle between sellers and buyers. The price has started recovering from recent lows, but I’m not convinced that the broader bearish structure has changed just yet. GALA is currently trading around $0.001466, up approximately 2.45%. The 24-hour high stands at $0.001498, while the low is $0.001415. Looking at the broader chart, price has been making lower highs since the $0.001612 region. The recent dip toward $0.001406 attracted buyers, suggesting that demand is still present around these lower levels. From a technical perspective, the market is attempting to stabilize after sustained selling pressure. However, the current volume reading of 4.95M remains below both the MA5 volume of 22.42M and MA10 volume of 16.68M. That makes me cautious about treating this recovery as a confirmed bullish reversal. My immediate focus is the $0.001450–$0.001466 area for potential bullish reactions, while $0.001415 and $0.001406 remain important downside support zones. On the upside, $0.001498 is the first resistance to watch, followed by the $0.001509 region. A stronger recovery could eventually bring $0.001560 into focus. I would avoid chasing green candles here. A convincing 1-hour close above $0.001498, supported by stronger volume and a successful retest, would improve the bullish case. Failure to hold $0.001415 could expose the recent $0.001406 low again. There is no confirmed entry, stop-loss, or reliable risk-to-reward setup from the available chart alone, so I would rather wait than manufacture trading levels. What do you think: is GALA preparing for a genuine recovery, or is this simply another temporary bounce within its downtrend? $GALAUSDT #ByXIMPACT
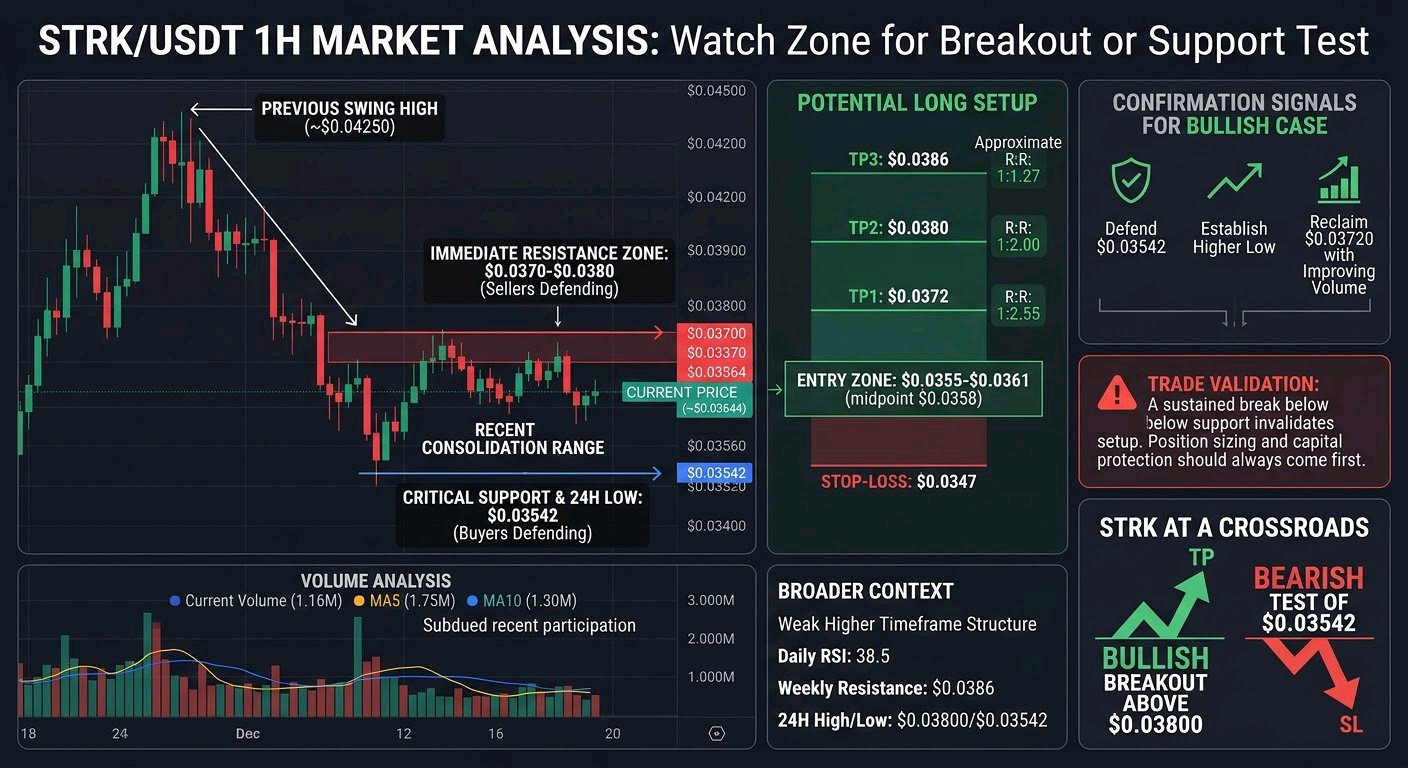
I’m watching STRK closely because, despite the latest bounce, the chart still hasn’t given a convincing signal that buyers have regained control. What caught my attention is how price continues to struggle around the $0.0370–$0.0380 region after repeatedly defending the lower support area. On the 1-hour timeframe, STRK/USDT is trading around $0.03644, while the visible 24-hour high and low stand at $0.03800 and $0.03542. The broader structure remains under pressure, with price declining from the previous swing high near $0.04250. Recent candles suggest consolidation, but a genuine trend reversal is not confirmed yet. Volume currently shows 1.16M, compared with the MA5 volume of 1.75M and MA10 volume of 1.30M. This indicates that recent participation is relatively subdued. External market data also shows a weak higher-timeframe structure, with daily RSI around 38.5 and resistance near $0.0386. Support around $0.0354 remains important. I wouldn't chase a sudden green candle here. STRK needs stronger buying volume and a confirmed breakout before a more aggressive bullish position makes sense. Potential Long Setup: Entry Zone: $0.0355–$0.0361 Stop-Loss: $0.0347 TP1: $0.0372 TP2: $0.0380 TP3: $0.0386 Using the $0.0358 entry midpoint, the approximate risk-to-reward ratios are 1:1.27, 1:2.00 and 1:2.55 respectively. For confirmation, I want to see STRK defend $0.03542, establish a higher low and reclaim $0.03720 with improving volume. A sustained break below support would invalidate this bullish setup, while acceptance above $0.03800 could strengthen recovery prospects. This remains a conditional trade idea, not a guaranteed outcome. Position sizing and capital protection should always come first. My question: Will STRK finally break above $0.03800, or are sellers preparing another test of $0.03542? $STRKUSDT $SOLUSDT #ByXIMPACT
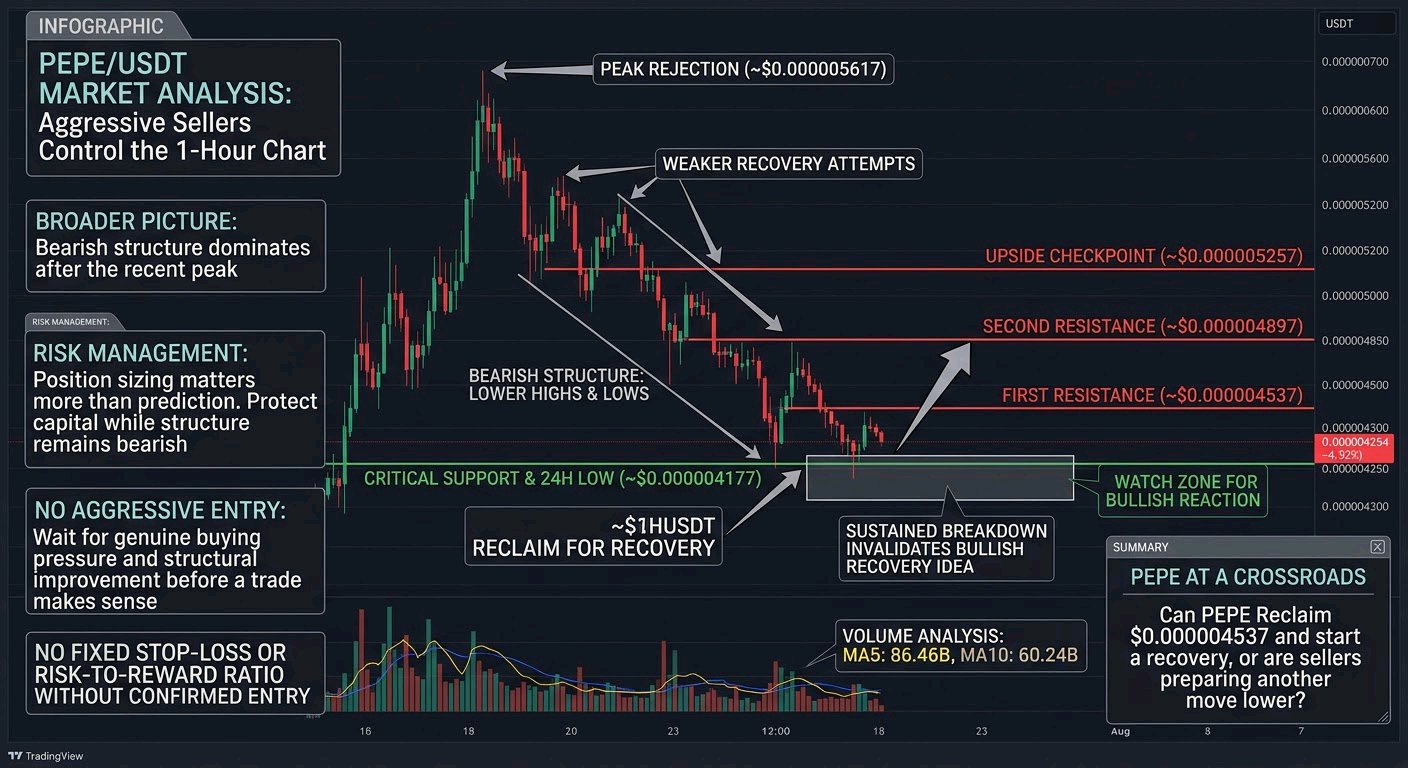
目前我對 PEPE 最擔心的是,在 $0.000005617 附近受阻後,賣方在 1 小時線圖上的強勢控制力。復甦的嘗試越來越無力,每一次的反彈似乎都會引來新一波的賣壓。我正在密切觀察目前的支撐區域,因為接下來的反應將決定買方是否真的準備好要守住這波跌勢。 PEPE/USDT 目前交易價格約在 $0.000004254 左右,在顯示的時段內下跌了約 4.92%。圖表顯示出明確的看跌結構,近期高點過後出現了更低的高點和更低的低點。當前的 24 小時低點落在 $0.000004177,而近期高點為 $0.000004647。買方雖然嘗試了幾次反彈,但還沒有出現任何令人信服的反轉跡象。 技術面上,$0.000004537 是第一個關鍵阻力位,其次是 $0.000004897。若能有更強勁的反彈,焦點可能會轉向 $0.000005257。下檔方面,$0.000004177 是必須監控的關鍵支撐。成交量面板顯示 MA5 為 86.46B,MA10 為 60.24B,不過這些是成交量均線,而非價格均線。 我不會在這個位置追高突然出現的綠 K 棒。PEPE 需要真正的買盤力道和結構性的改善,才適合進場操作。 我偏好的策略是觀察 $0.000004177–$0.000004254 附近的看漲反應,隨後觀察能否收復 $0.000004537。潛在的上行觀察點為 $0.000004897 和 $0.000005257。如果跌破 $0.000004177,看漲復甦的觀點就失效了。在沒有確認進場點之前,不適合設定固定的停損或風險回報比。 目前來說,耐心比預測更重要。在整體結構仍偏向看跌的情況下,保護本金是首要任務。 你認為 PEPE 有機會收復 $0.000004537 並開啟復甦行情,還是賣方正準備再下一城? $PEPEUSDT $ARBUSDT #ByXIMPACT
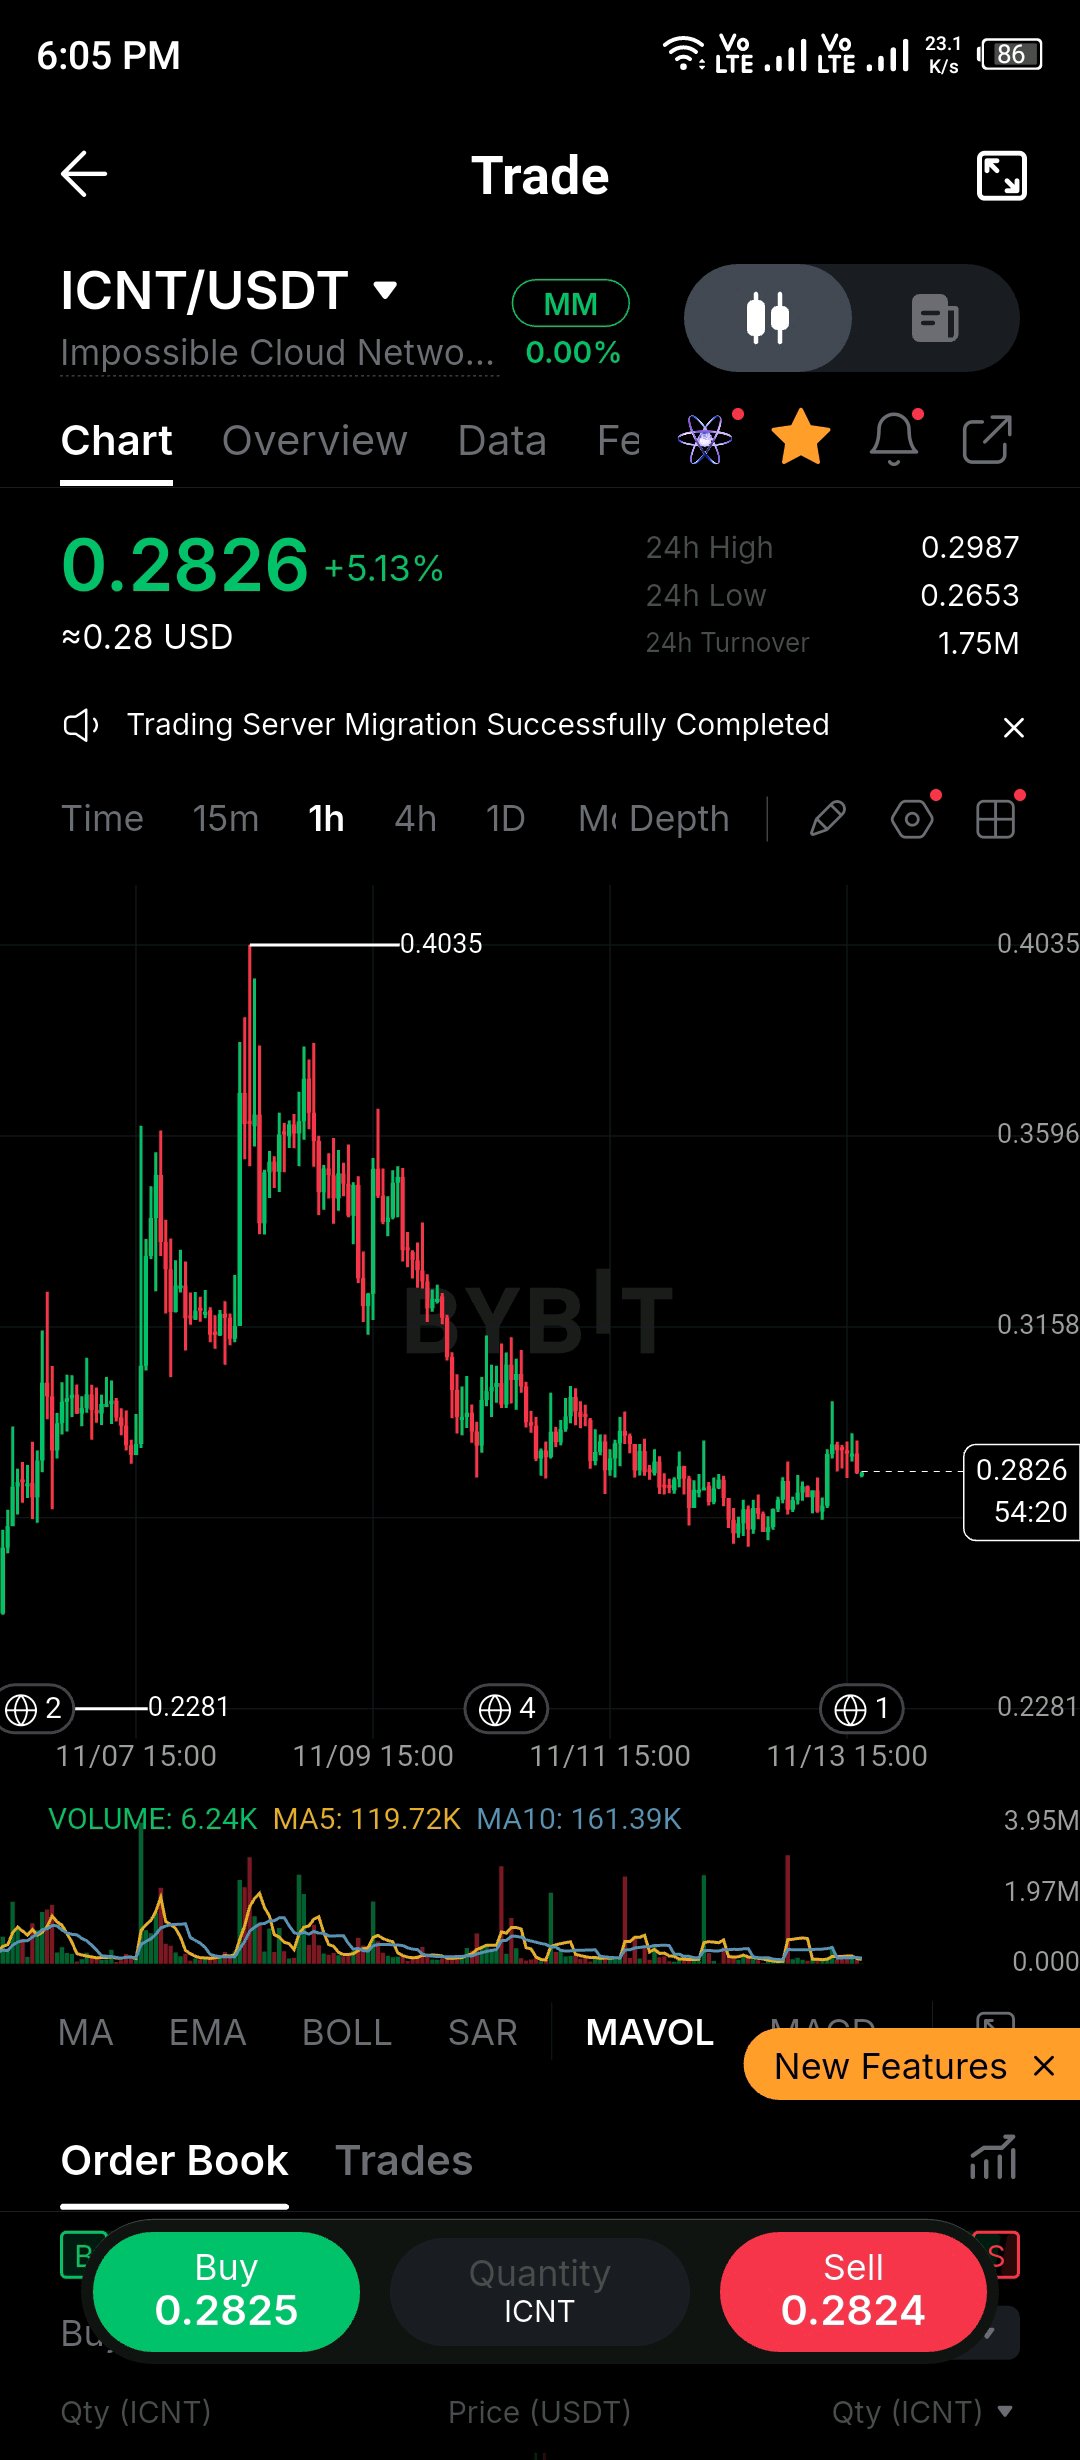
ICNT/USDT 在 1 小時線引起了我的注意,因為相較於之前的跌幅,這次的反彈看起來相當平淡。 價格目前位於 0.2826,今日上漲 5.13%,此前從 0.4035 的高點一路下滑。在此視圖中,最低點為 0.2281。自高點以來,市場結構呈現低點不斷降低,且K線震盪重疊。過去 24 小時價格在 0.2653 至 0.2987 之間波動,顯示市場正在一個相當狹窄的區間內壓縮。這看起來像是盤整,而非確認反轉。 成交量反映出謹慎的態度。目前的成交量讀數為 6.24K,對比 5 日均線 (MA5) 的 119.72K 和 10 日均線 (MA10) 的 161.39K。雖然最新的K線還在形成中,但明顯可以看出,在拋售和之前的反彈之後,市場參與度已經減弱。缺乏成交量支撐的行情很容易回調。目前可見的阻力位分別在 0.2987、0.3158 和 0.3596。 這就是我會避免 FOMO 的地方。區間內的陽線並不等於突破,在區間頂部附近買入會迫使你設置一個較寬或較隨意的止損。 截圖中沒有顯示進場點或目標價,所以這些點位是我自己從圖表上抓取的。 進場區間:約 0.2990,在 1 小時線收盤站上 0.2987 並回測後。 止損點:0.2650,略低於 24 小時低點。 目標價:0.3596。 風險約為 0.0340,回報約為 0.0606,風險回報比 (R) 大約是 1.8。0.3158 的水平更近一些,但回報率只有約 0.5R,所以我會將其視為減倉點,而非最終目標。 確認信號為 1 小時線收盤高於 0.2987,且成交量向均線水平放大。失效信號為收盤低於 0.2653,這將使再次回測 0.2281 的可能性重回檯面。 這些都不是絕對的。保護資本比抓住每一次行情更重要,所以倉位請控制小一點。 你認為這是在 0.2653 上方形成的底部,還僅僅是下一波下跌前的暫停? $ICNTUSDT $SOLUSDT #ByXIMPACT
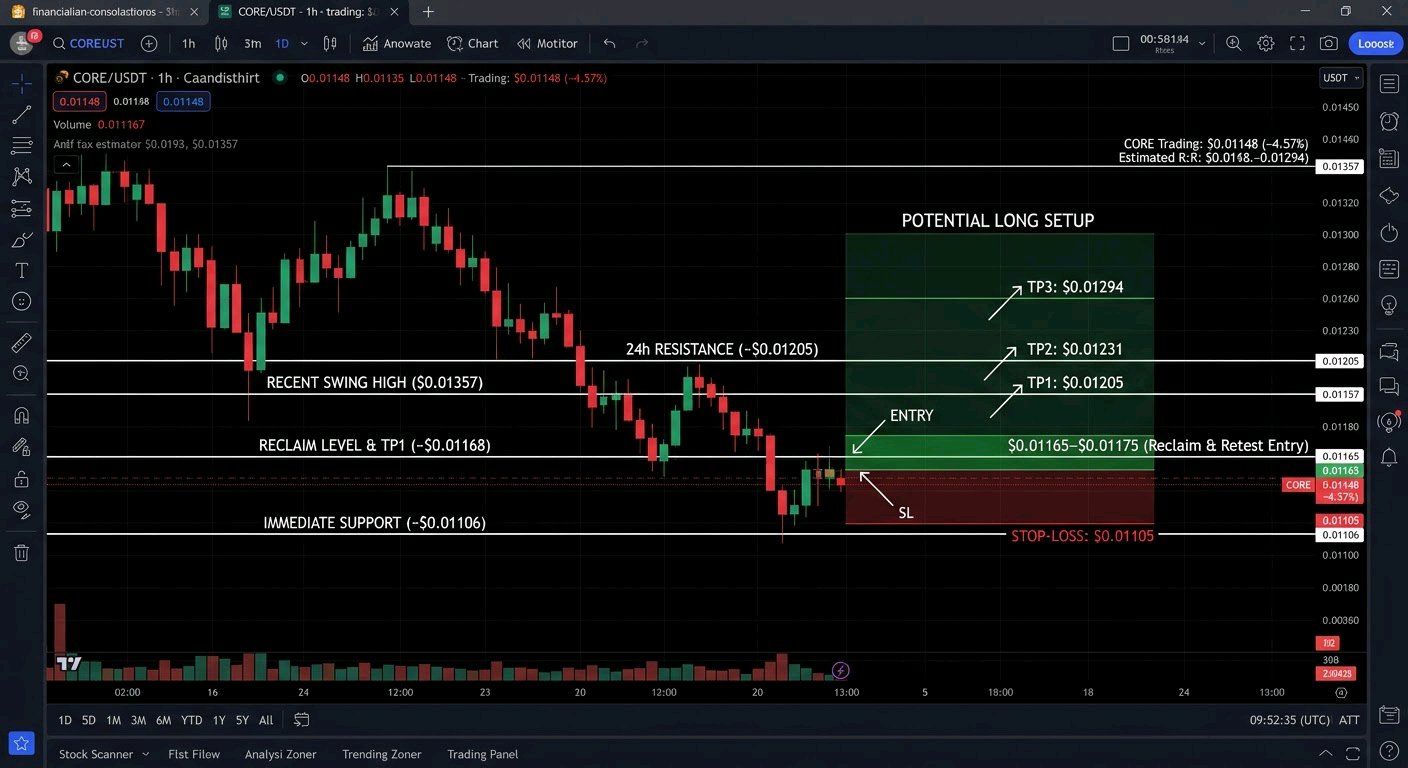
我正在密切關注 CORE/USDT,因為 1 小時線圖顯示了一個重要的訊號:儘管近期低點有小幅反彈,但買方尚未展現足夠的力道來改變整體結構。 CORE 目前交易價格在 $0.01148 左右,下跌約 4.57%。圖表顯示出明顯的高點降低與低點降低趨勢,近期波段高點在 $0.01357 附近,即時支撐位則在 $0.01106 左右。24 小時壓力位位於 $0.01205 附近。目前賣方仍佔優勢,儘管最新的回升顯示買方正試圖守住底部。 有一個細節值得留意,那就是代幣經濟學。根據 CoinMarketCap 的數據,CORE 的最大供應量為 21 億枚,目前流通量約為 15 億枚。其官方釋放模型長達 81 年,區塊獎勵每年遞減 3.61%。該協議還納入了由 DAO 管理的交易手續費銷毀機制。CORE 作為該網路的 Gas、治理與質押功能型代幣。這些基本面提供了長期的供應敘事,但它們無法單獨扭轉看跌的價格走勢。 在技術面方面,$0.01106 是我不容忽視的水平。跌破該價位可能導致 CORE 進一步下跌,而若能收復 $0.01168 將是動能改善的初步跡象。目前的顯示成交量約為 107K,我更希望看到任何回升背後有更強的參與力道。 我對追逐隨機出現的陽線不感興趣。我偏好的作法是等待確認訊號。 潛在多頭佈局: - 進場:收復並回測 $0.01165–$0.01175 後 - 停損:$0.01105 - 獲利目標 1:$0.01205 - 獲利目標 2:$0.01231 - 獲利目標 3:$0.01294 - 預估盈虧比:以 $0.01170 進場計算,最高約為 1:1.9。 維持在 $0.01168 之上並伴隨成交量增加將能強化此佈局。跌破 $0.01106 則會使多頭觀點失效。 在市場疲軟時,部位管理至關重要。保護資本比抓住每一次波動更為重要。 你認為 CORE 能收復 $0.01205,還是賣方正準備進一步推向新低? $COREUSDT #WSOT2026 #ByXIMPACT
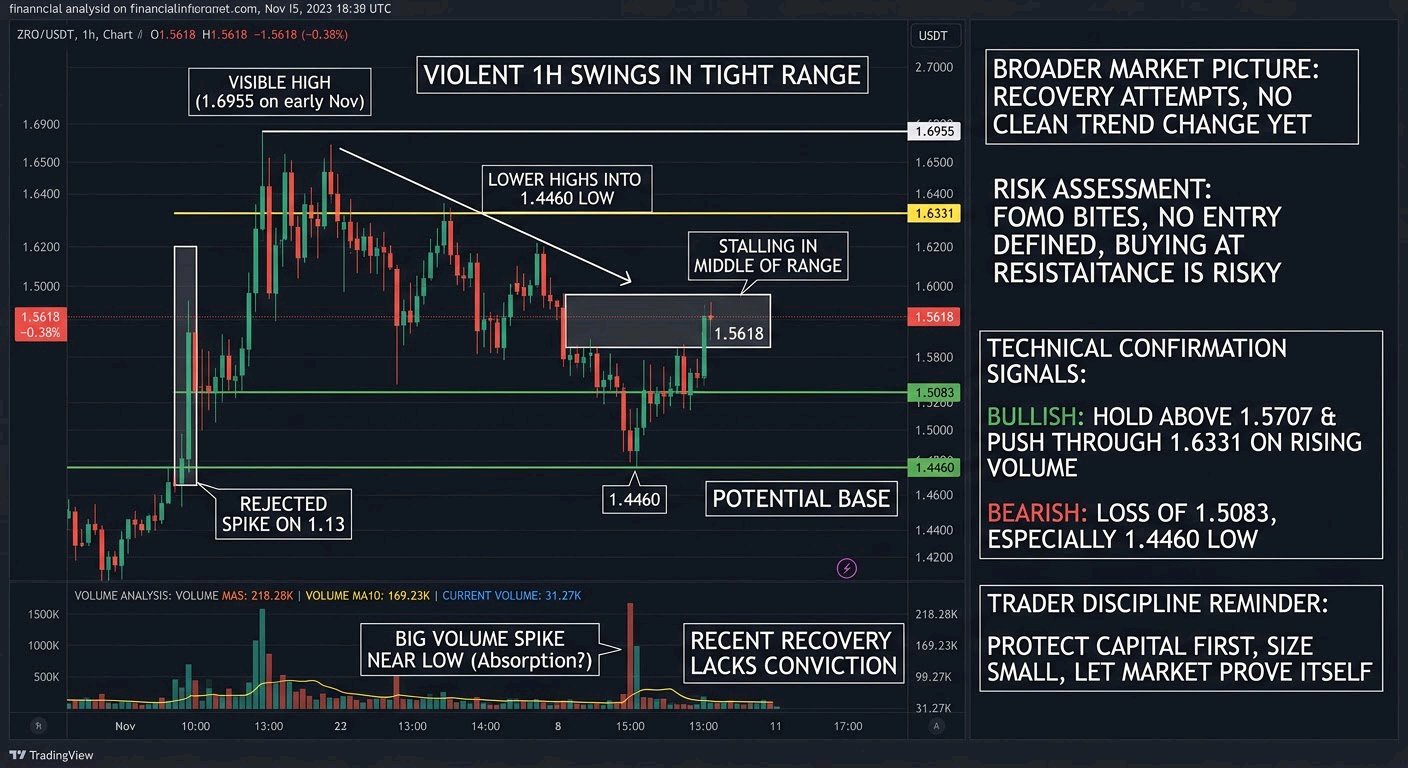
The first thing that caught my eye on ZRO/USDT is how violently the 1h chart has swung inside a fairly tight range. Price is sitting at 1.5618, down 0.38% on the day, after rejecting a spike on the 13th. Zooming out, the structure still looks heavy. The visible high is 1.6955 from early November, and the sequence since then has been lower highs into a low at 1.4460. The bounce off that low has been decent, but price is now stalling in the middle of the range. The 24h range of 1.4852 to 1.6193 shows the same thing. That is recovery attempts without a clean trend change yet. On the technicals, I'm not leaning on price MAs here since none are shown, but the volume tells a story. The big volume spike came around the low, which looks like capitulation or heavy absorption. Since then, current volume at 31.27K sits well below the volume MA5 (218.28K) and MA10 (169.23K), so the recent move up lacks conviction. Resistance sits near 1.6331 and then 1.6955. Support is 1.5083 first, then the 1.4460 low. This doesn't guarantee anything, but it does suggest buyers aren't fully in control. This is exactly where FOMO bites. A single green hourly candle into thin volume can easily turn into another rejection wick, as we saw on the 13th. Chasing without confirmation usually means buying right at resistance. I haven't defined an entry, stop, or targets here, so I won't quote a risk-to-reward ratio. I'd only build one after confirmation. A hold above 1.5707 and a push through 1.6331 on rising volume would strengthen the case for a recovery. A loss of 1.5083, and especially 1.4460, would invalidate it and shift the bias back down. This is an uncertain setup. Protect your capital first, size small, and let the market prove itself. Do you see the 1.4460 low as a real base, or just a pause before another leg down?$ZROUSDT $BTCUSDT #ByXIMPACT
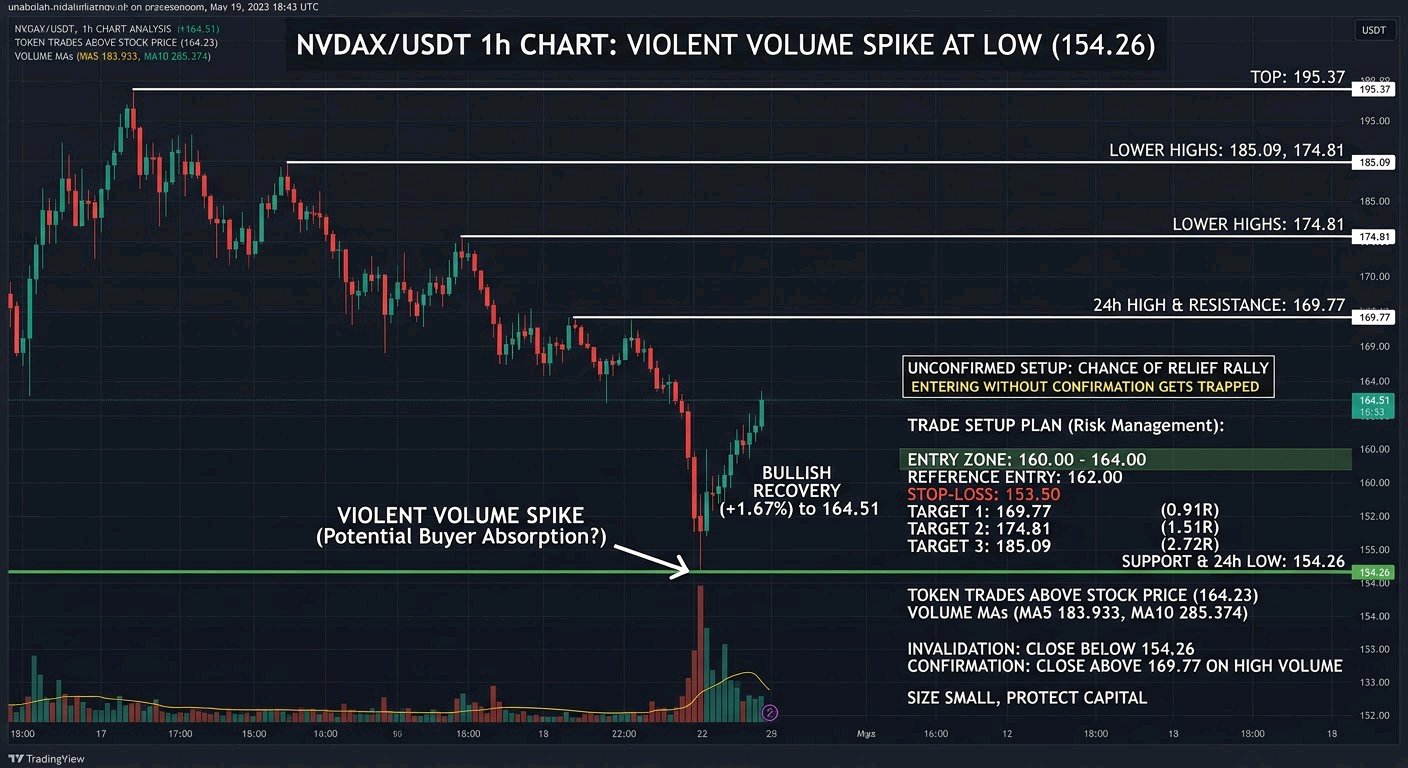
各位,我在 NVDAX/USDT 1 小時圖上注意到的一點是,成交量在 154.26 低點處出現了劇烈激增。經過長時間的滑落後,這種活動通常告訴我情況發生了變化,即使它並不代表確認反轉。 大盤走勢依然看跌。價格本週早些時候在 195.37 附近見頂,隨後出現了一系列的高點下移。反彈至 185 附近時遭到拋售,隨後的下一波下跌將價格拖累至 154.26。現在它位於 164.51(+1.67%),出現了小幅回升,24 小時高點為 169.77。該代幣的交易價格略高於標的股票價格 164.23,因此沒有太大的溢價需要擔心。 從技術上講,目前的狀況比較混亂。我圖表上的成交量移動平均線(MA5 183.933,MA10 285.374)僅描述成交量而非價格,所以我不會把它們作為趨勢信號。重要的是結構:154.26 是支撐位,169.77 是第一個阻力位。在此之上,174.81 和 185.09 是先前賣方出現過的區域。價格目前在 165 下方窄幅整理,這說明市場還沒有決定方向。 我不會追漲這次反彈。在劇烈拋售後出現一根陽線,很容易只是會消失在第一個阻力位的緩解性反彈。在沒有確認信號的情況下進場,就是交易者在局部高點被套牢的原因。 這是我正在觀察的設置,僅使用圖表上可見的水平: 進場區間:160 至 164,參考進場價 162 止損位:153.50,位於 154.26 低點下方 目標位:169.77, 174.81, 185.09 從 162 進場的盈虧比:約 0.91R, 1.51R 和 2.72R 我希望看到價格保持在 160 上方,然後在一小時 K 線收盤時突破 169.77,並伴隨健康的成交量。如果收盤價低於 154.26,這個思路就完全失效了。 這是不確定的,趨勢依然向下,保護資本是第一位的。控制倉位。 你們認為低點的那波成交量激增是真正的買方吸收,還是僅僅是下一波下跌前的清算拋售? $NVDAXUSDT $BTCUSDT #ByXIMPACT
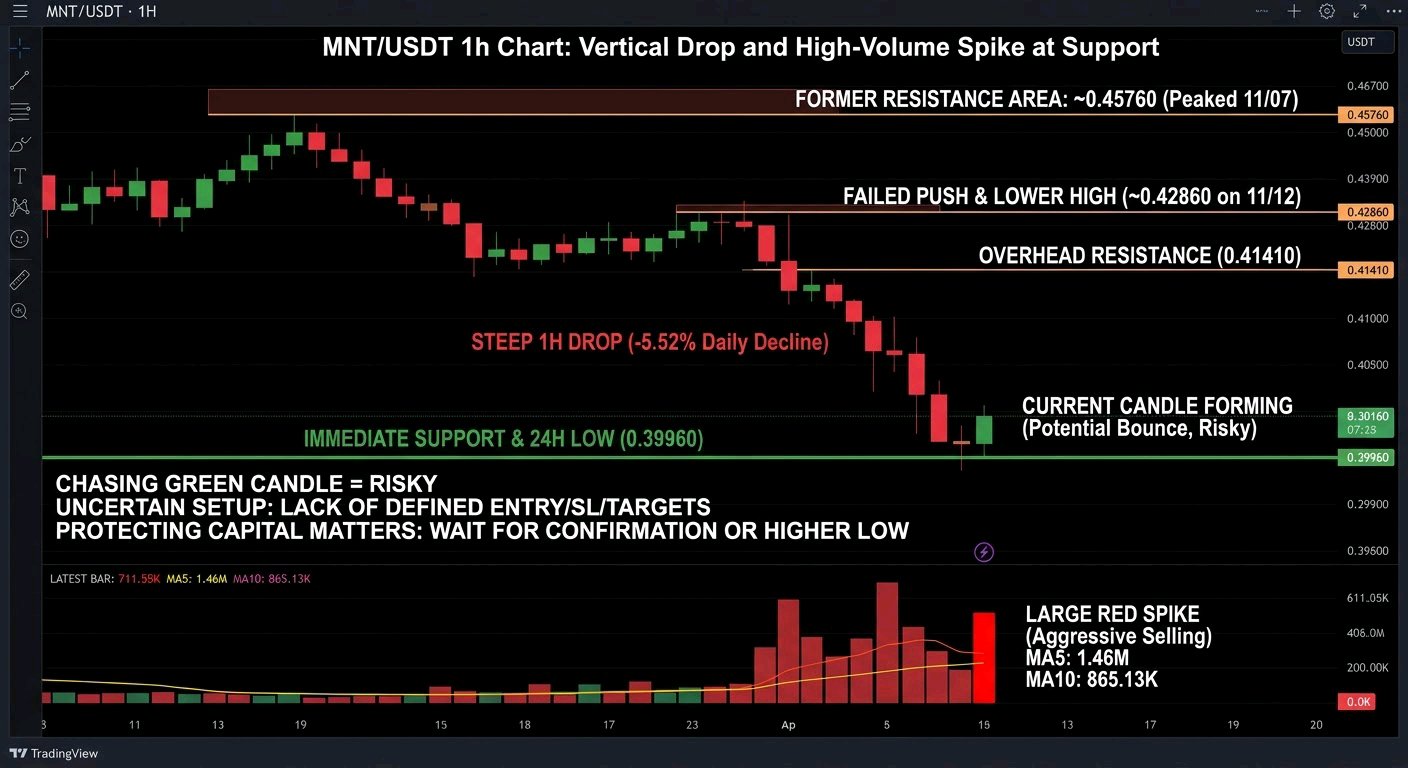
I noticed how MNT/USDT just fell off a cliff on the 1h chart. After a choppy bounce, price dropped almost in a straight line to 0.40200, and the final candle printed on a huge volume spike. The broader picture is a rally that peaked at 0.45760 on 11/07 and has been fading since. A second push into the same area failed, and price then made a lower high around 0.4286 on 11/12 before breaking down. The 24h range is 0.43390 to 0.39960, so price is sitting right on the low after a 5.52% daily decline. That is weakness, not recovery. On volume, the latest bar reads 711.55K against a MA5 of 1.46M and a MA10 of 865.13K. The large red spike at the bottom is clearly visible, which looks like aggressive selling, though the current bar is still forming, so I wouldn't lean on that reading too hard. No price moving averages were displayed, so I'm only working with horizontal levels. The 0.39960 low is the immediate support, with 0.41410 and 0.42860 as the nearest overhead resistance. Chasing a green candle here is risky. After a vertical drop, the first bounce often just relieves oversold conditions before sellers return, and entering without confirmation means buying into a falling market with no defined invalidation. I'm not posting a specific entry, stop-loss, or targets. Nothing on the chart gives me those numbers, and I won't invent them or quote a risk-to-reward ratio without them. What would strengthen a bounce idea is a hold above 0.39960, a higher low, and a reclaim of 0.41410 on rising buy volume. A clean break and close below 0.39960 would invalidate any recovery thesis. This setup is uncertain, and protecting capital matters more than catching the bottom. Keep size small and let price confirm. Do you see 0.39960 as a real floor, or is this just a pause before a deeper leg lower?$MNTUSDT #ByXIMPACT
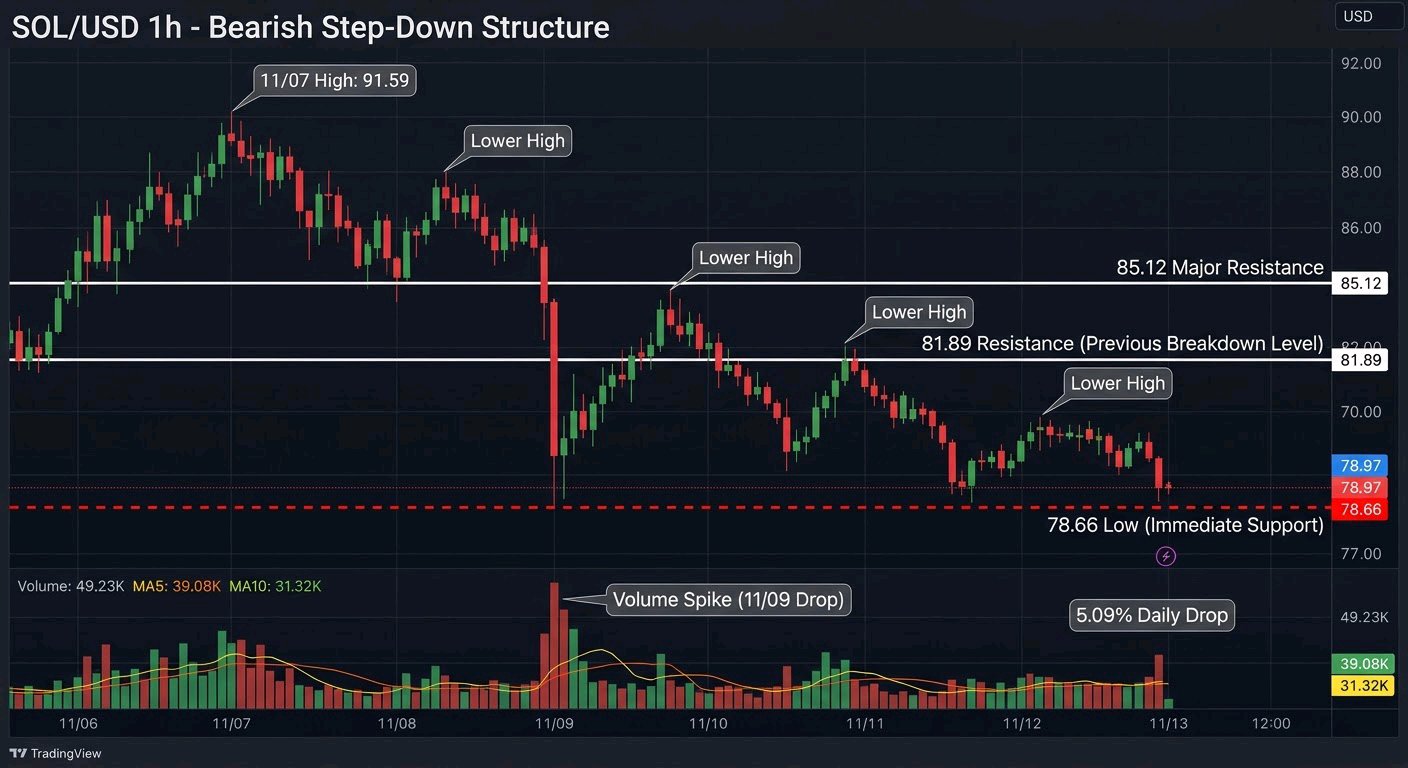
SOL 的 1 小時圖引起了我的注意,因為它的下跌走勢非常乾淨利落。價格已從 11/07 的 91.59 高點一路跌至目前的 78.97,而且沿途出現的反彈都被賣盤淹沒了。 目前的結構明顯偏空。每一次反彈都出現了更低的高點,而最後一波跌勢在幾乎沒有回調的情況下就跌破了 11/11 的低點。24 小時價格區間為 83.49 至 78.66,在經歷了 5.09% 的單日跌幅後,價格正處於低點上方。我目前還沒看到任何反彈結構,只看到市場持續向下測試支撐。 在指標方面,成交量為 49.23K,對比 5 日移動平均線 (MA5) 的 39.08K 和 10 日移動平均線 (MA10) 的 31.32K。這意味著目前的賣盤成交量高於近期平均水準,顯示這波走勢有實質參與度,而非僅是無序下跌。11/09 早前下跌期間的成交量激增也顯示了相同的模式。由於沒有提供價格移動平均線,我不會解讀成交量以外的指標。78.66 的低點是即時支撐,而 81.89 和 85.12 的水平位則是最近的上檔阻力。 這就是 FOMO(錯失恐懼症)變得危險的地方。在經歷這樣的跌勢後,一根綠色 K 線看起來可能像是反轉訊號,但在沒有出現更高低點或成交量變化的情況下,反彈至 81.89 僅僅只是反彈而已。過早買入等於是在為希望買單。 我不會在這裡提供具體的進場點、止損點或目標價,因為那樣只是在猜測,而且在沒有實際數據的情況下,我不會隨意給出盈虧比。我會觀察的是價格能否守住 78.66,隨後在買盤成交量改善的情況下收復 81.89。若明確跌破 78.66,則會使任何反彈的想法失效。 現在局勢不明朗,保護本金比抓到絕對底部更重要。控制倉位,讓價格自行證明走勢。 你認為 78.66 能守住作為底部嗎?還是這只是下一波跌勢前的暫停? $SOLUSDT $BTCUSDT #ByXIMPACT
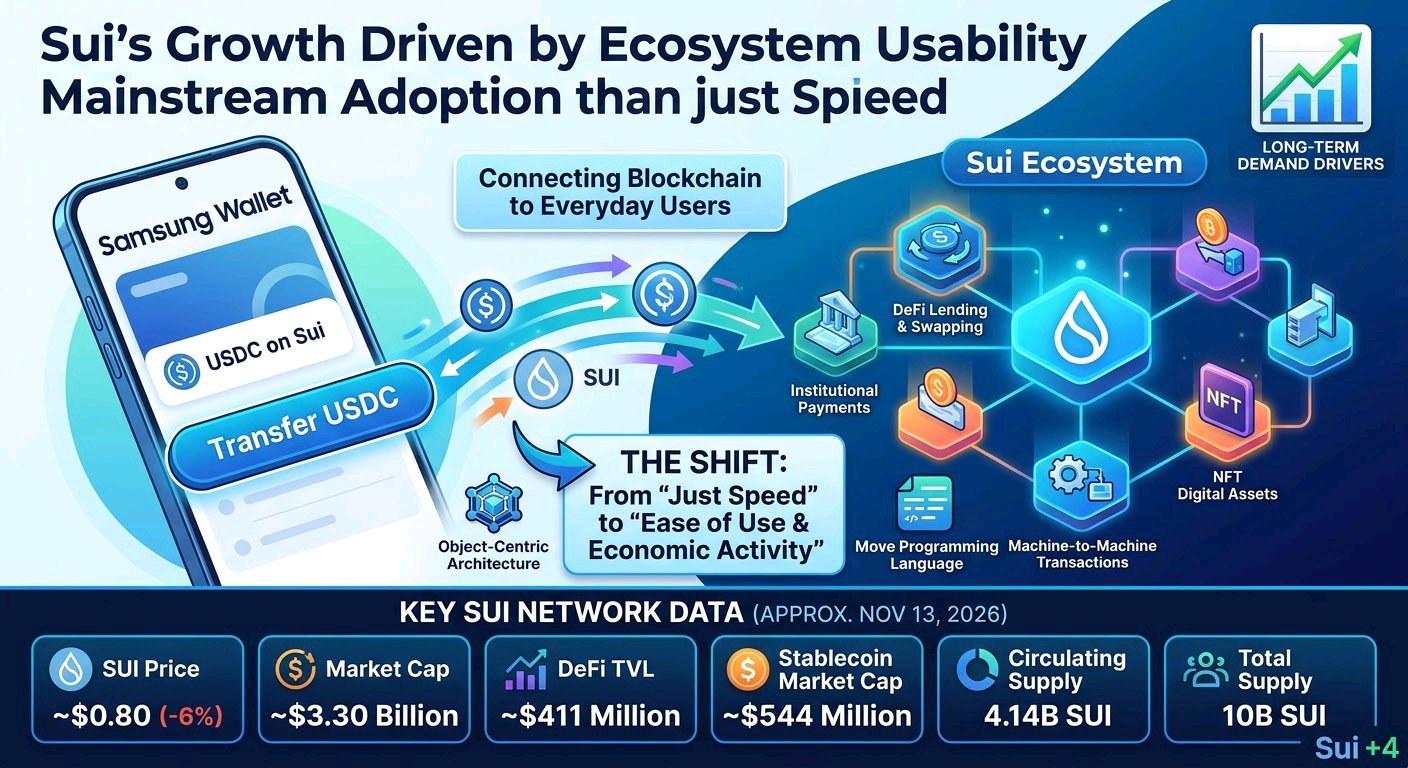
What if Sui’s next growth phase is driven less by blockchain speed and more by how easily millions of people can actually use its ecosystem? That is the opportunity I’m watching with $SUI. One of Sui’s most important developments is its collaboration with Samsung to bring USDC on Sui into Samsung Wallet. Announced on October 8, 2026, the integration is designed to make stablecoin access and transfers easier for eligible users across Samsung’s U.S. Galaxy device ecosystem, potentially reaching around 82 million devices. The important detail here is distribution. Sui is not simply trying to attract more developers or compete on transaction speed. It is working to connect blockchain infrastructure with products that everyday users already understand. If this integration generates recurring stablecoin transfers, it could create meaningful demand for Sui's network infrastructure. Here are the numbers behind this development: • SUI price: approximately $0.80 • 24-hour performance: approximately -6% • Market capitalization: approximately $3.30 billion • 24-hour spot volume: approximately $74 million • 24-hour futures volume: approximately $463 million • Open interest: approximately $486 million • Circulating supply: approximately 4.14 billion SUI • Maximum supply: 10 billion SUI • DeFi TVL: approximately $411 million • Stablecoin market capitalization: approximately $544 million Market figures are approximate and reflect November 13, 2026 data snapshots. Now look at what this development brings: Sui's ecosystem has several important advantages: 1. **Object-centric architecture:** Its unique data model allows independent transactions to be processed efficiently, supporting applications that need high throughput. 2. **Move programming language:** Designed with resource safety in mind, Move provides developers with tools for building financial applications and digital asset infrastructure. 3. **Stablecoin infrastructure:** USDC integration creates another route for payments, transfers, and onchain financial activity. 4. **DeFi expansion:** Sui already supports decentralized exchanges, lending protocols, derivatives, and other financial applications. 5. **SUI token utility:** SUI is used for network gas fees, staking, and participation in the network's economic and governance mechanisms. The next major catalyst is whether these integrations translate into actual usage. Samsung Wallet's USDC rollout, alongside the expansion of Hashi's Bitcoin-backed financial infrastructure and institutional partnerships, could strengthen Sui's position in payments and onchain finance. Another development worth watching is Sui's October 7 throughput demonstration. Sui Tunnels processed 40,614,180 transactions per second in a live test, with the results independently verified by CertiK. This demonstrates the potential of its offchain payment-channel technology, although it should not be confused with ordinary mainnet transaction throughput. My perspective is that Sui is gradually building a broader identity. It wants to become infrastructure for payments, digital assets, DeFi, and potentially machine-to-machine transactions. That gives the ecosystem several possible demand drivers beyond speculative trading. Of course, ecosystem expansion does not automatically translate into a higher SUI price. Samsung integration usage, sustainable DeFi growth, network fees, token demand, and the remaining supply schedule will all matter. With approximately 41.4% of the maximum supply currently circulating, future token unlocks also deserve attention. I believe the bigger question is no longer just how fast Sui can process transactions. It is whether the network can turn that technical capacity into consistent economic activity. If millions of users eventually interact with Sui through familiar payment applications, could $SUI become one of the more important infrastructure assets in the next generation of onchain finance? Research sources: Sui +4 $SUIUSDT $ETHUSDT #ByXIMPACT
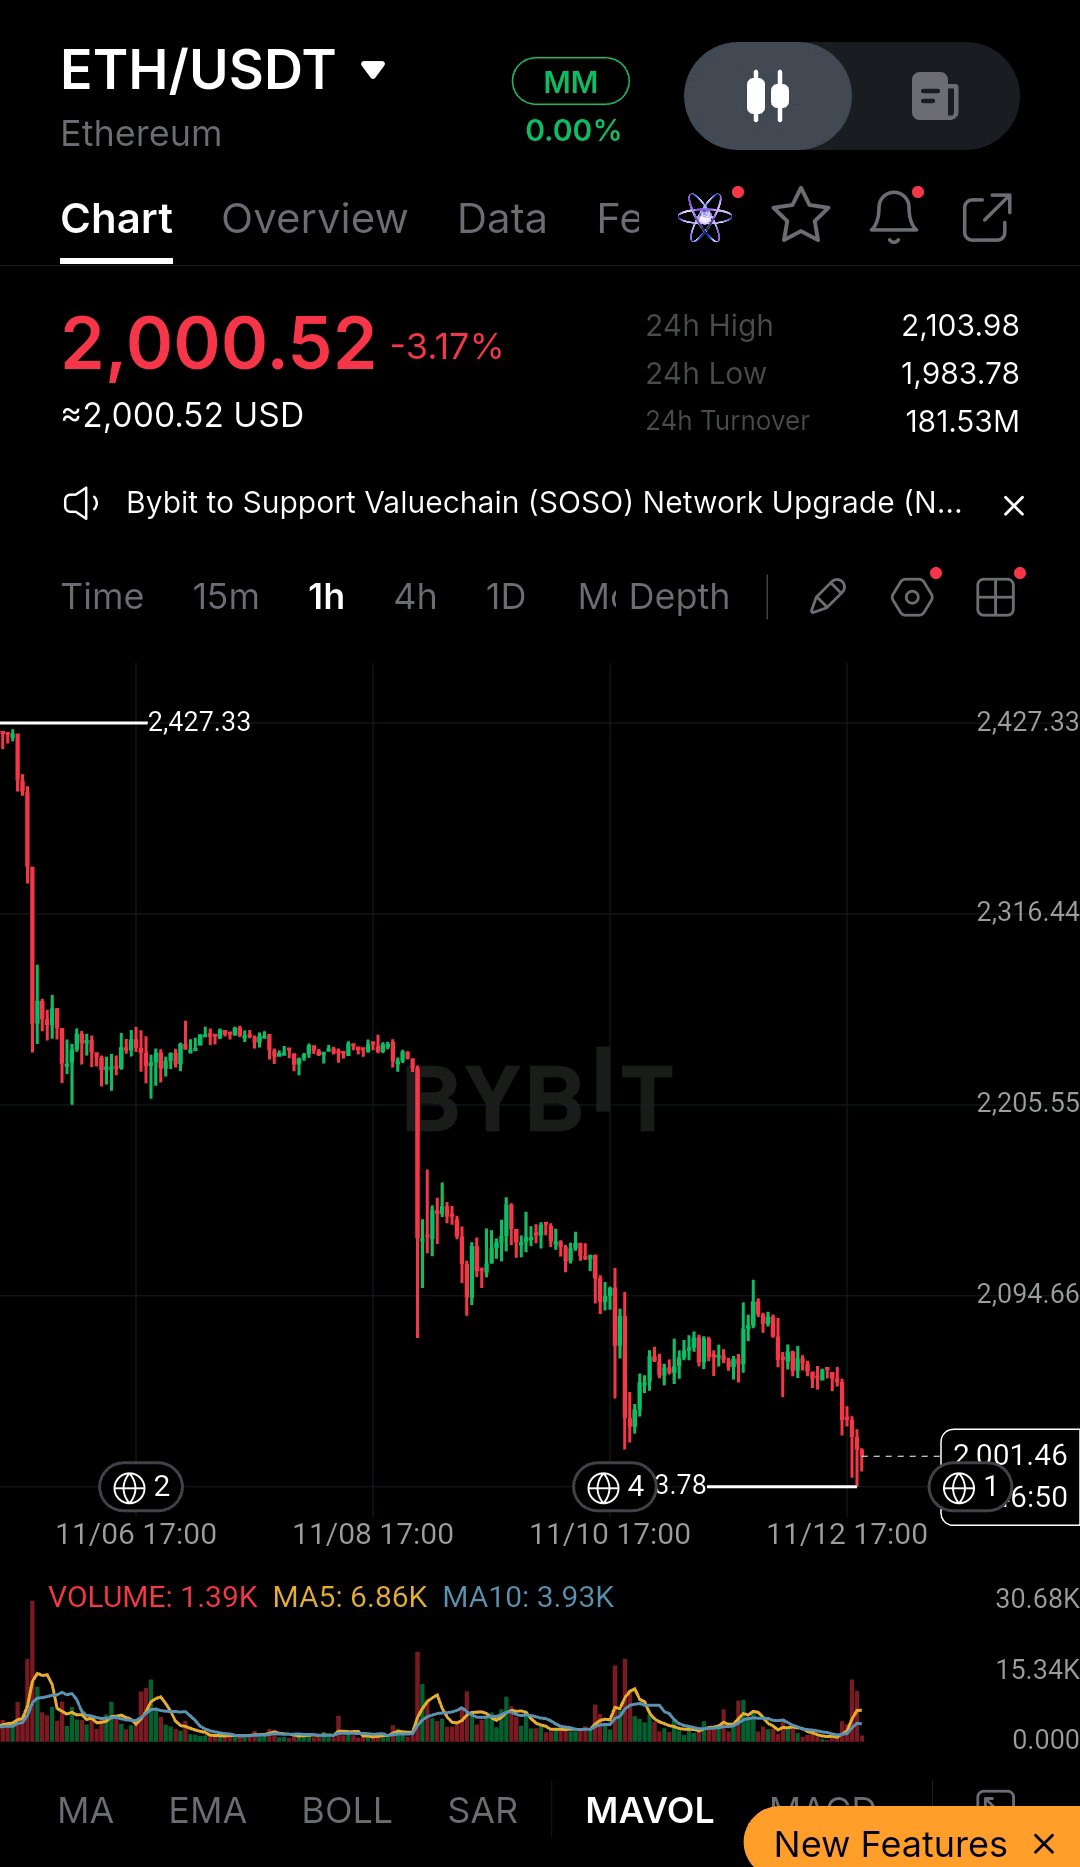
ETH/USDT — 賣方正施壓 2,000 美元,但目前有一個關鍵點位至關重要 以太坊(Ethereum)正接近一個關鍵區域,我不認為這是做出情緒化交易決策的時候。ETH 的交易價格約為 **2,000.52 美元**,下跌約 **3.17%**,而最新的 1 小時結構持續偏向賣方。 我最擔心的是高點不斷降低、低點也不斷降低的走勢。在失守 2,205 美元區域後,ETH 曾試圖企穩,但向 2,094 美元的反彈未能產生有效的反轉。賣方隨後進場,將價格推向近期 **1,983.78 美元的低點**。 我的技術觀點: 1,983–2,000 美元區間是我目前密切關注的區域。若 1 小時收盤價果斷跌破 1,983.78 美元,可能會開啟新一輪的下跌趨勢。另一方面,買方需要收復 2,094.66 美元,並克服附近的 2,103.98 美元阻力位,我才會開始認真看待反彈行情。 可見成交量讀數為 1.39K,相較於 MA5 的 6.86K 和 MA10 的 3.93K。從此快照來看,市場參與度相對低迷。MACD、RSI、SAR 和 EMA 的數據未顯示,因此我不打算臆測它們的訊號。 我的執行策略: 在看跌結構仍然完好的情況下,我會避免激進地抄底。若要考慮做多,我更傾向於看到 ETH 收復 2,094–2,104 美元,隨後成功進行回測。如果價格跌破並站穩 1,983.78 美元下方,任何看漲反彈的假設都將失效。 對於現有的空頭倉位,我會專注於保護利潤,而不是直接追進支撐位。 上行目標:2,094 美元 → 2,104 美元 → 2,205 美元(前提是買方能重新掌控局面)。 ETH 正處於一個重要的決策點。你認為買方會守住 2,000 美元,還是我們正走向新一輪的下跌? #ETH #以太坊 #加密貨幣交易 #技術分析 $ETHUSDT $BTCUSDT #ByXIMPACT
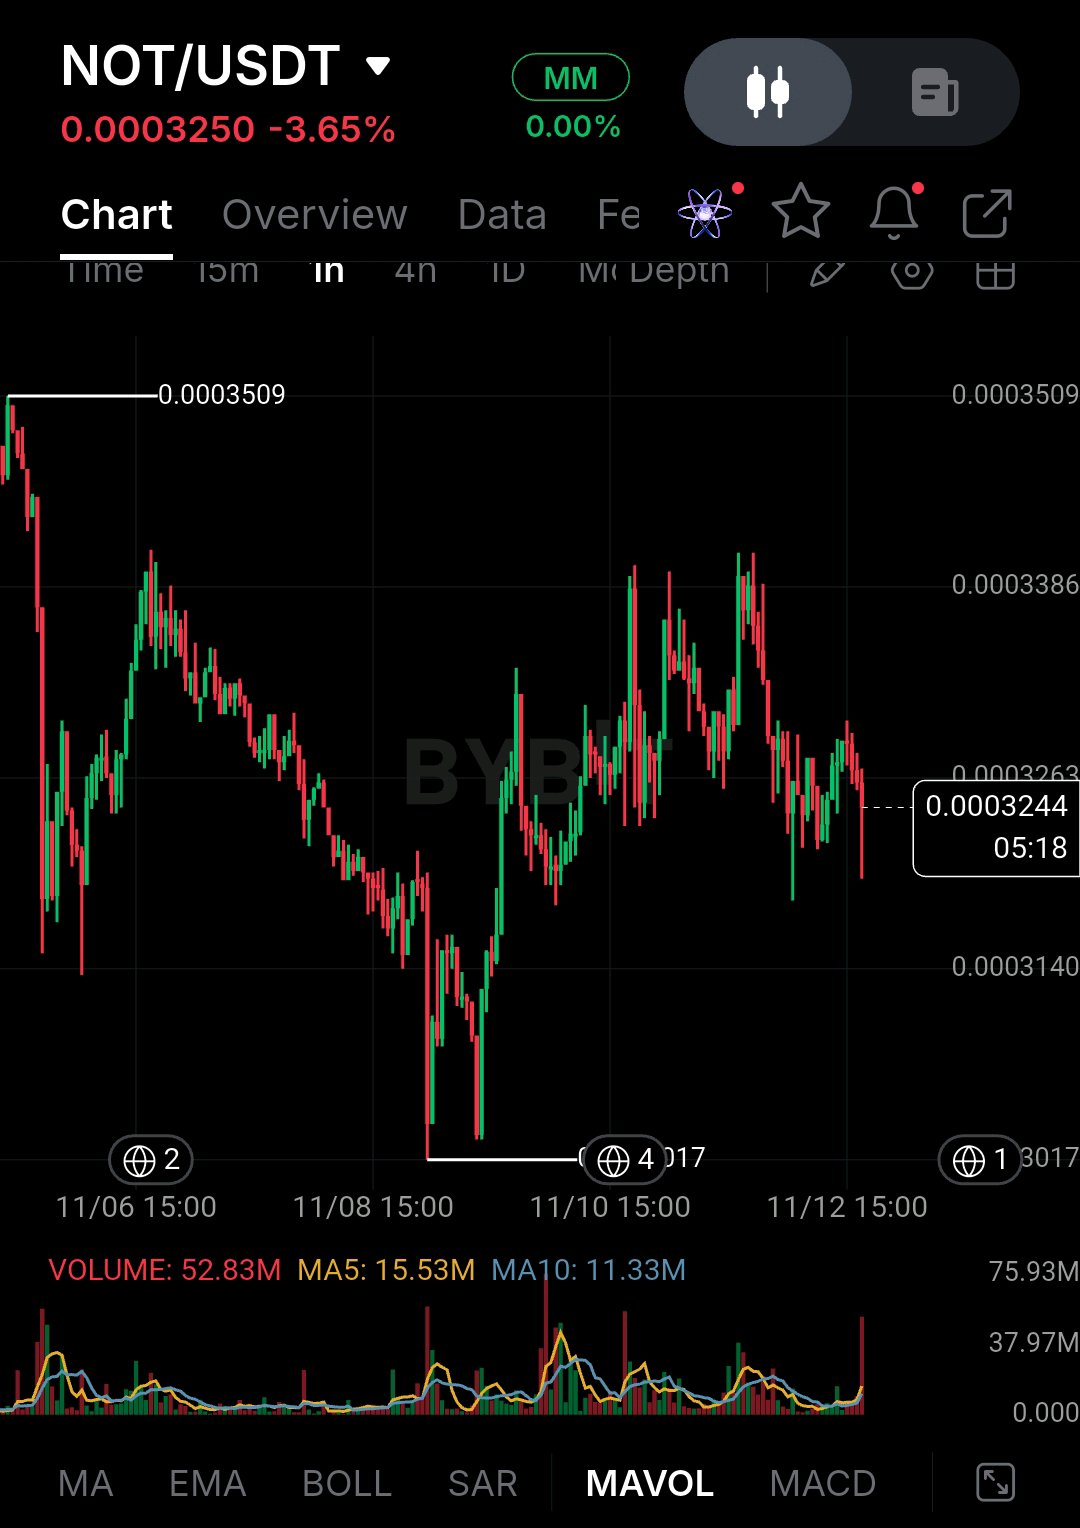
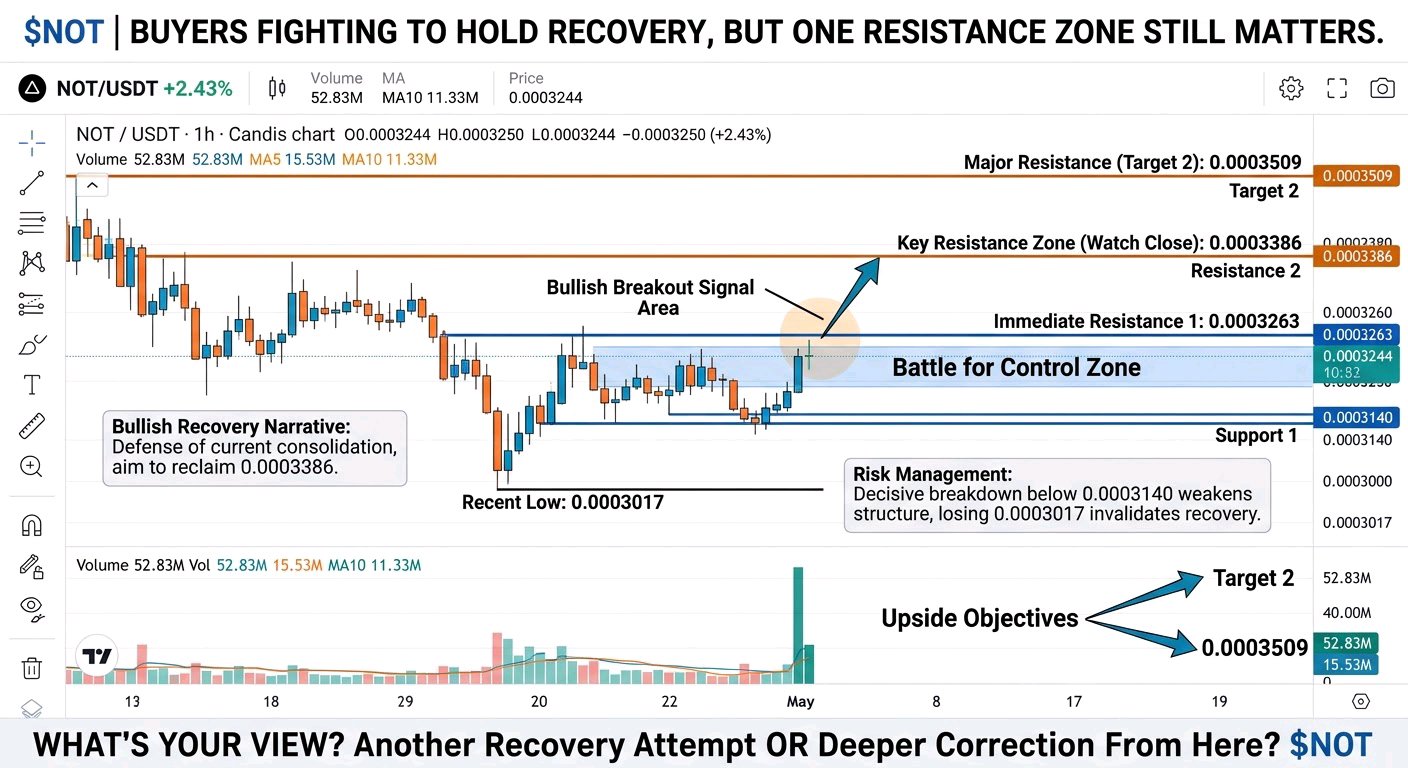
$NOT | Buyers Are Fighting to Hold the Recovery, But One Resistance Zone Still Matters. I’m watching NOT/USDT closely because the chart is showing an interesting battle between buyers and sellers. After dropping from the 0.0003509 region toward the 0.0003017 low, NOT managed to recover, but the latest candles suggest that bullish momentum is not fully established yet. Market Structure: On the 1H chart, price is trading around 0.0003244–0.0003250. The recovery from the recent low was encouraging, but sellers stepped in again near the 0.0003386 resistance area. Since then, price has struggled to establish a sustained upward move. Buyers are attempting to defend the current consolidation, while sellers are still applying pressure around the short-term resistance. Technical Reality Check: One detail I wouldn't ignore is the latest volume spike, with reported volume reaching 52.83M, compared with MA5 volume of 15.53M and MA10 volume of 11.33M. This suggests increased trading activity during the latest move, although volume alone does not confirm direction. RSI, MACD, SAR and EMA readings are not visible in this screenshot, so I won't assume their signals. My Execution Strategy: I'm keeping 0.0003140 on my watchlist as an important nearby support. If buyers defend this region and push price back above 0.0003263, I would look for a stronger recovery toward 0.0003386. However, I don't want to chase a green candle without confirmation. A sustained breakout above resistance would make the bullish setup more convincing. Important Levels: - Support 1: 0.0003140 - Support 2: 0.0003017 - Resistance 1: 0.0003263 - Resistance 2: 0.0003386 - Major Resistance: 0.0003509 Risk Management: A decisive breakdown below 0.0003140 would weaken the recovery structure. Losing 0.0003017 would invalidate the current bullish recovery thesis. I'd rather protect capital than hold onto a setup after its structure has failed. Upside Objective: My first upside objective is 0.0003386. If NOT clears that level with convincing volume, the next area I'm watching is 0.0003509. For now, patience matters more than prediction. What's your view on $NOT? Are you expecting another recovery attempt or a deeper correction from here? $NOTUSDT $BTCUSDT #ByXIMPACT