BITPIA
3484點贊0分享48粉絲77關注
Full Time Trader
Full Time Trader
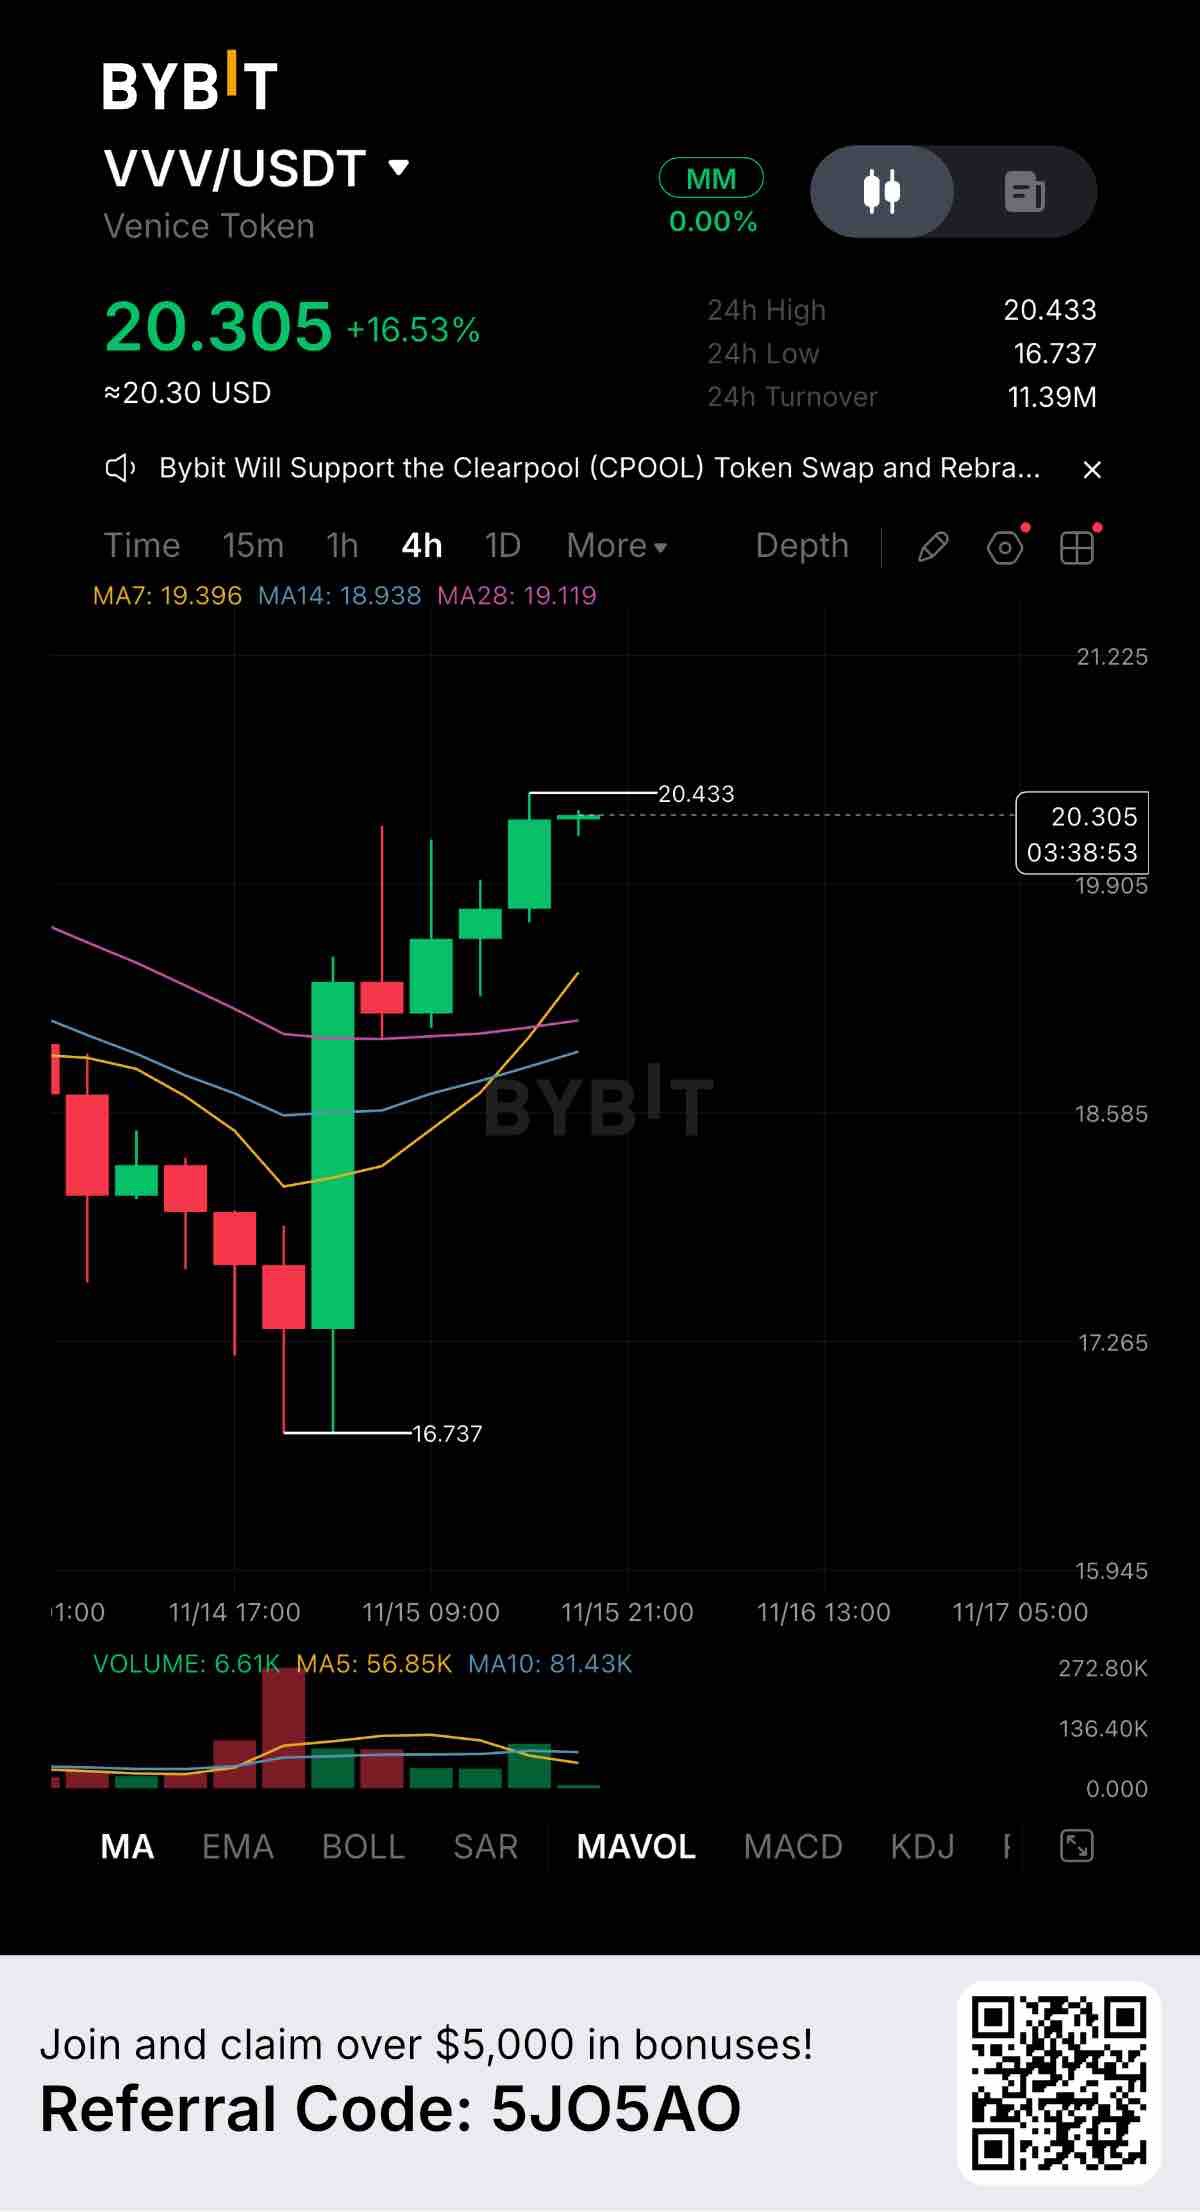
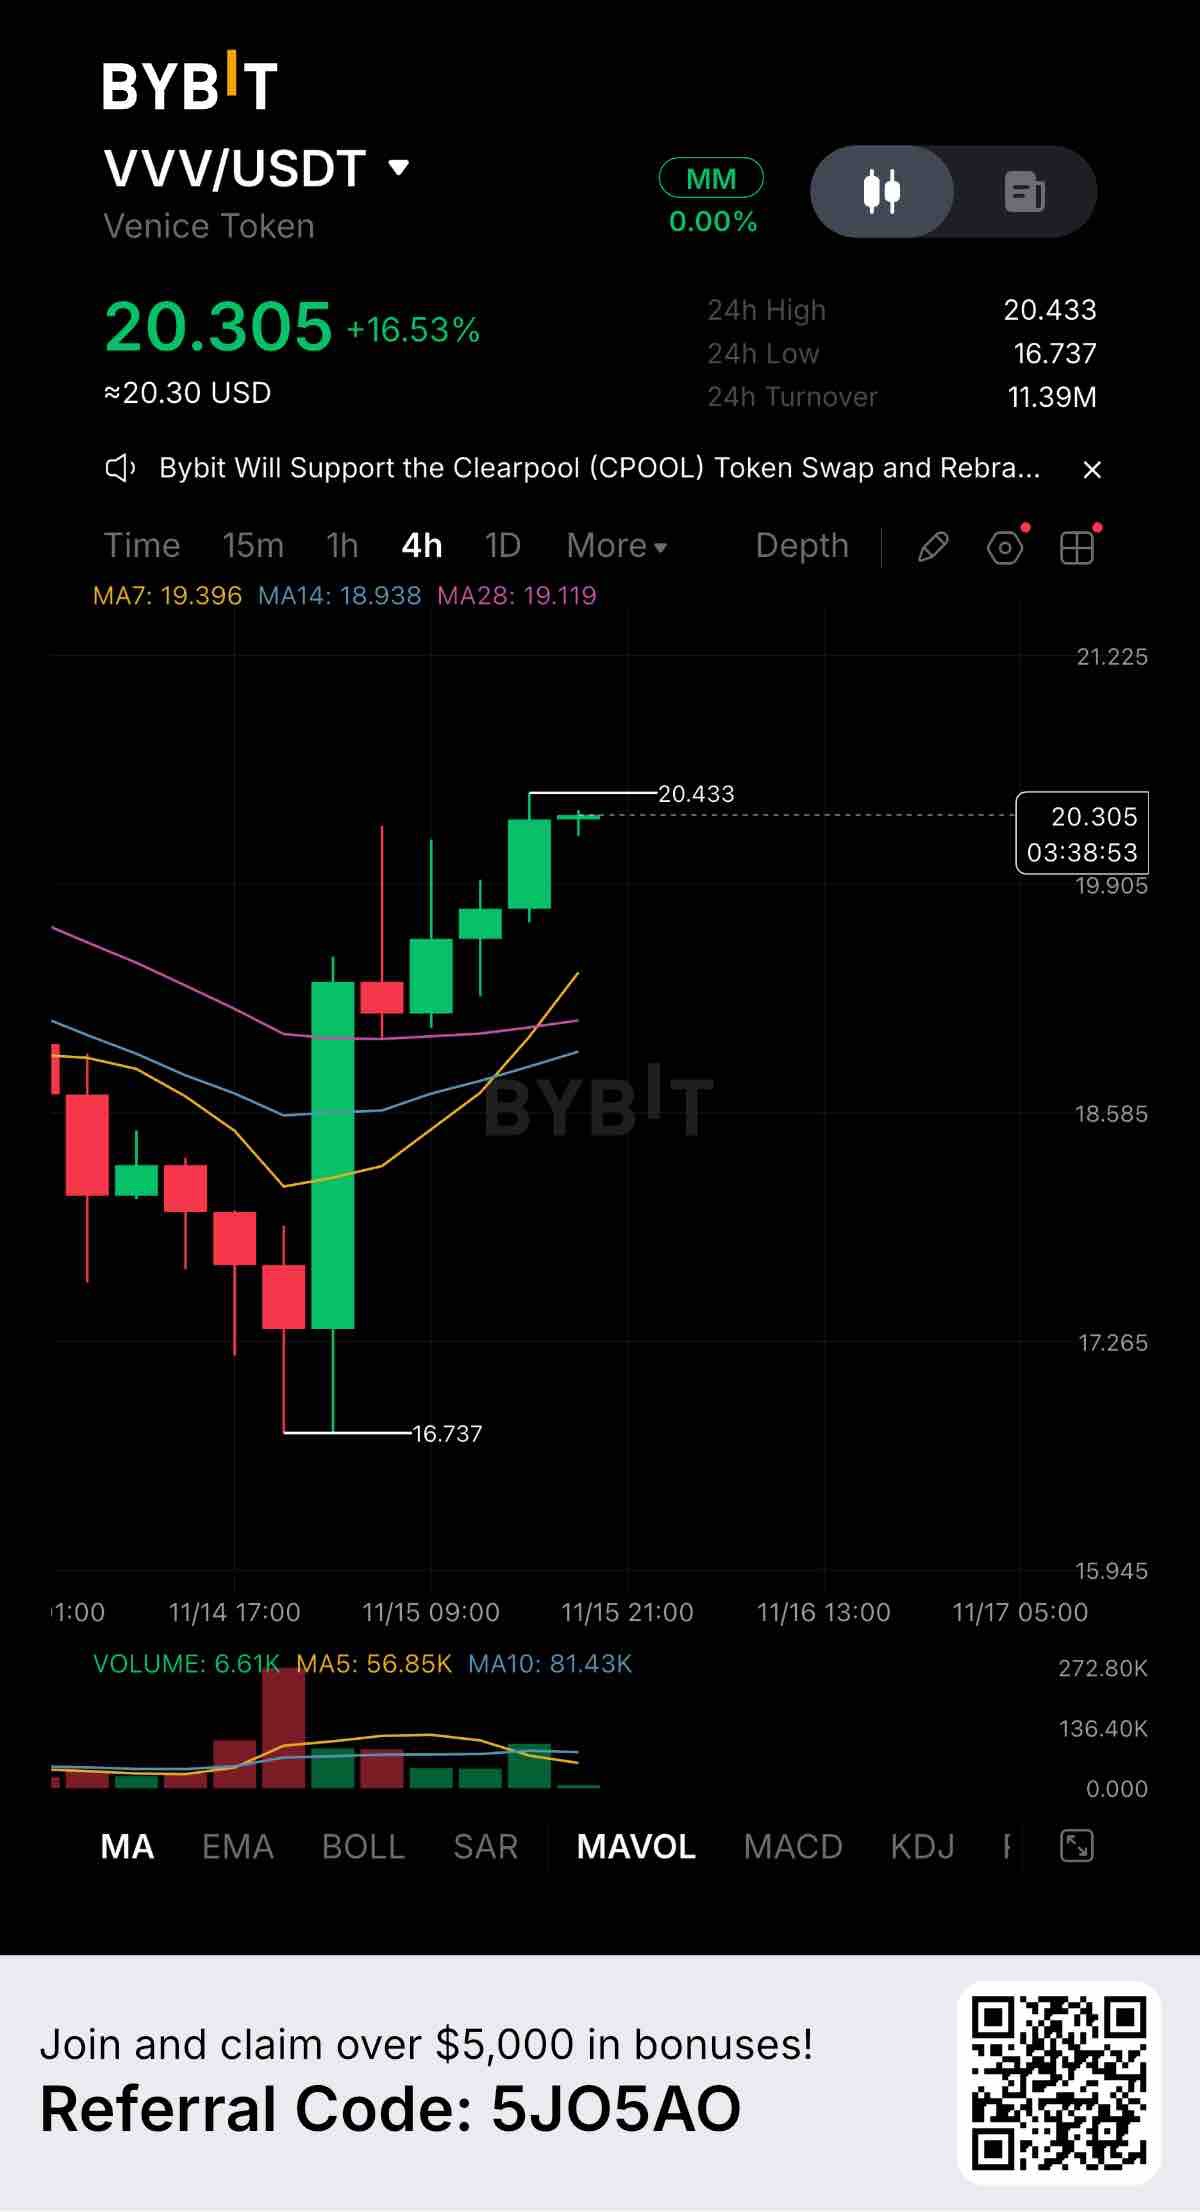
$VVVUSDT 在 4 小時線圖上展現了強勁的反彈力道,目前報價 20.305,漲幅高達 +16.53%。在急劇下跌至 16.737 後,買盤大舉湧入,拉出一根巨大的綠色 K 棒,徹底扭轉了趨勢,將價格推向了強勁且穩定的上升通道。 值得關注的關鍵價位: 阻力位:20.433(當前 24 小時高點,作為短期天花板) 支撐位 1:19.396(7 日均線,第一個動態支撐區) 支撐位 2:16.737(24 小時低點,主要的結構性底部) 移動平均線完全有利於多頭。價格目前穩定運行於 MA7、MA14 和 MA28 之上。圖表顯示了教科書級別的高點過高、低點墊高的走勢,買盤充滿信心,支撐著每一次小幅回調。 成交量是此處的一大關鍵。24 小時成交額高達 1,139 萬 USDT。雖然初期反彈伴隨著爆發性的成交量,但隨後的穩定攀升顯示了持續的買盤壓力,而不僅僅是短暫的軋空。 基本面上,Venice Token (VVV) 目前需求顯著。這種 V 型反轉通常預示著買方有強烈的信心,渴望在回調時積累籌碼。 如果買方能夠突破並站穩 20.433 上方,我們可能會看到價格進入新一輪的發現階段。然而,由於價格漲幅過大,等待回調至 19.396 支撐位附近或許能提供更安全的入場點。 你是選擇跟隨這波 VVV 的動能,還是靜待回測?歡迎在評論區分享你的策略。 #ByXIMPACT #WSOT2026
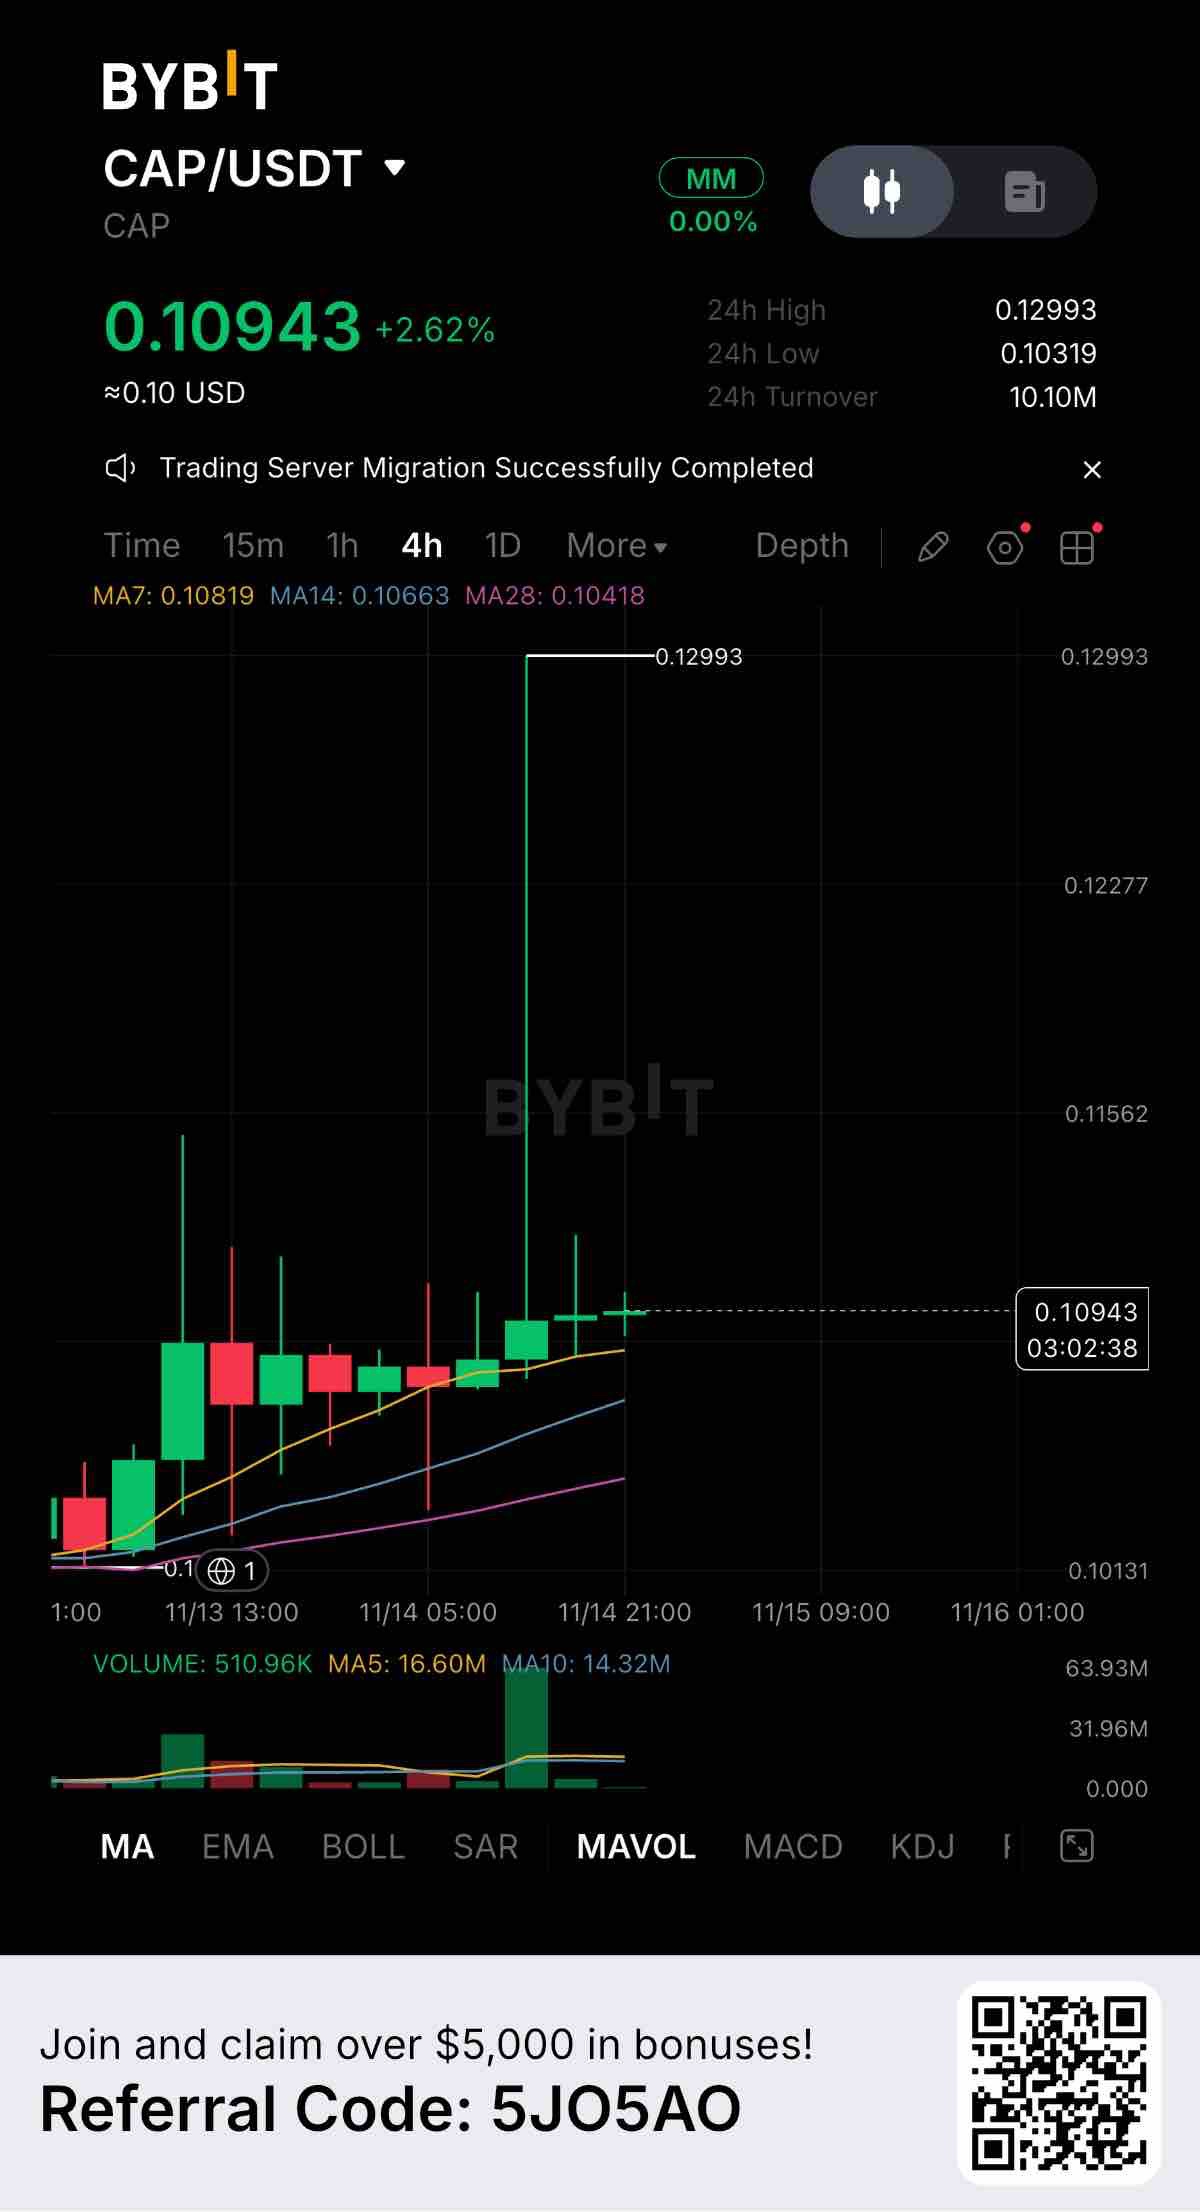
$CAPUSDT 在 4 小時圖上顯示出極大的波動性,目前交易價格為 0.10943,漲幅為 +2.62%。雖然日漲幅看起來平平,但圖表本身卻展現了瘋狂的行情。我們剛剛目睹了一波巨大的流動性激增,一根巨大的綠色成交量柱將價格推升至 0.12993,隨後卻立即遭到拒絕,並一路被打壓回來。 值得關注的關鍵價位: 阻力位:0.12993(24 小時最高點,也是拒絕長影線的頂部) 支撐位 1:0.10819(7 日移動平均線,目前作為即時底線) 支撐位 2:0.10319(24 小時最低點,結構性底部) 觀察移動平均線,整體趨勢仍然向上。價格保持在 MA7、MA14 和 MA28 之上。然而,那根巨大的上影線是一個明顯的警告訊號,顯示賣方正在強力捍衛高價位。價格目前正在盤整,並試圖在 7 日移動平均線之上企穩。 成交量是此處最關鍵的因素。24 小時成交額高達 1,010 萬 USDT。成交量的激增證實了大戶正在市場中活躍,但價格被拒絕意味著多頭在那場特定的戰鬥中失利了。 如果買方能守住 0.10819 這個支撐位並建立底部,就有可能重新測試高點。但如果該支撐位失守,我們可能會看到價格急劇下跌,回測 0.10319 的低點。 你是如何解讀這個 CAP 設定的?你在等待確認突破,還是認為那根拒絕長影線是一個該遠離的警告訊號?歡迎在下方討論。 #ByXIMPACT #WSOT2026
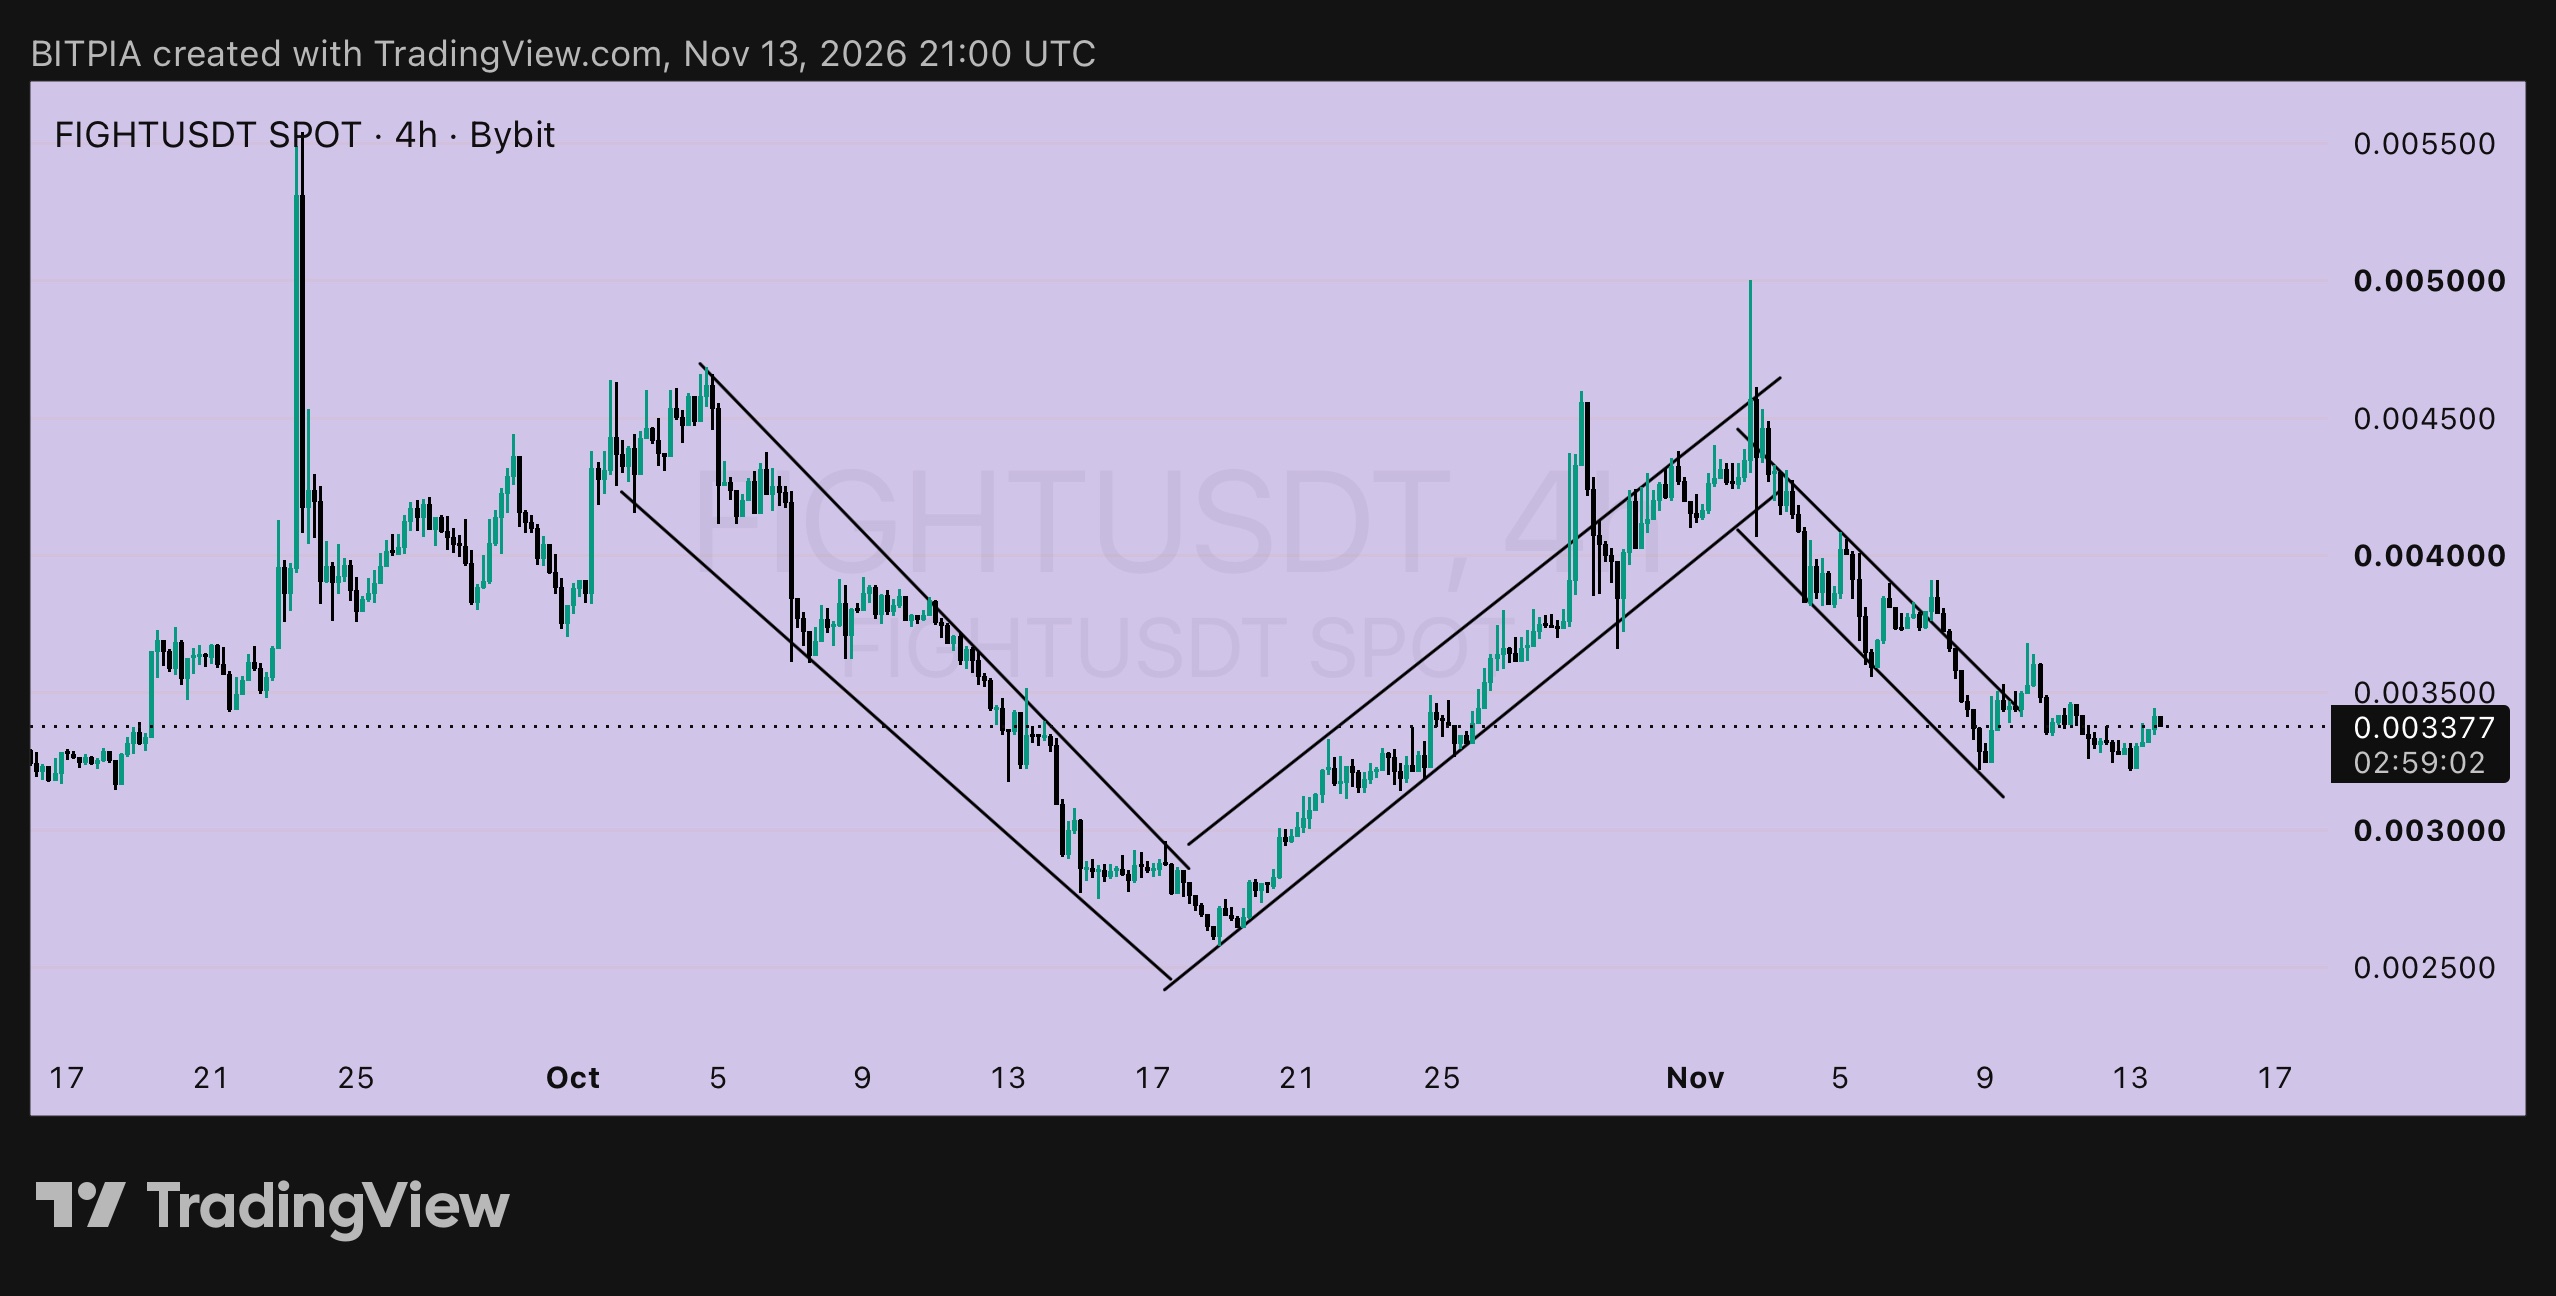
$FIGHTUSDT 4h:0.00322 處出現雙底?🔍 我在 11 月 10 日發布了 $FIGHT 的分析,當時價格為 0.003553,在它突破下跌通道後,我制定了兩個計劃:收盤價高於 0.00358(進場點 0.00360,止損 0.00330)或者在 0.00345 附近回測(止損 0.00322)。以下是後續走勢以及我目前的看法。 ➤ 發生了什麼 ▸ 價格在 11 月 11 日達到約 0.00367,但未能長時間守在 0.00358 上方,因此該高點為一個較低的高點(lower high)。 ▸ 隨後價格回落,昨日觸及 0.00322 附近的低點,本質上與 11 月 9 日的低點相同。 ▸ 如果你是在 0.00345 附近進場回測並設置 0.00322 為止損,你可能已經或者非常接近被止損,大約是 -1R。如果你等待 4 小時收盤,你的倉位可能還在。無論如何,我不避諱承認這波上漲行情失敗了。 ➤ 我現在的看法 ▸ 在 0.00322 左右形成了相隔四天的雙底。 ▸ 價格目前在 0.003377,雖然有反彈,但仍在 4 小時圖的下跌通道內。 ▸ 十月份早期的鋸齒形走勢(zigzag pattern)並未重演。市場反而給出了一個較低的高點。 雙底可能是構築底部的開始,也可能只是下一波下跌前的暫停。我要的是證據,而不是希望。 ➤ 計劃 A:底部支撐 ▸ 進場點:0.00330 左右,前提是 0.00322 水平能第三次守住 ▸ 止損:低於 0.00310 ▸ 每單位風險:0.00020 ▸ 目標 1:0.00360,+0.00030,約 1.5R ▸ 目標 2:0.00385,+0.00055,約 2.75R ▸ 目標 3:0.00420,+0.00090,約 4.5R ➤ 計劃 B:等待突破 ▸ 觸發條件:4 小時收盤價高於 0.00350 ▸ 進場點:0.00355 左右 ▸ 止損:低於 0.00330 ▸ 每單位風險:0.00025 ▸ 目標:0.00385(約 1.2R)和 0.00420(+0.00065,約 2.6R) ➤ 什麼情況會否定上述觀點 如果 4 小時收盤價低於 0.00310,意味著雙底形態失敗。屆時下一個需要關注的水平是 0.0030 和十月份的 0.0026 區域,我會選擇觀望。 倉位要小,如果做合約(perps)請低槓桿。 非財務建議。請做好自己的研究(DYOR),且僅承擔你能承受損失的資金範圍內進行投資。 #ByXIMPACT #WSOT2026
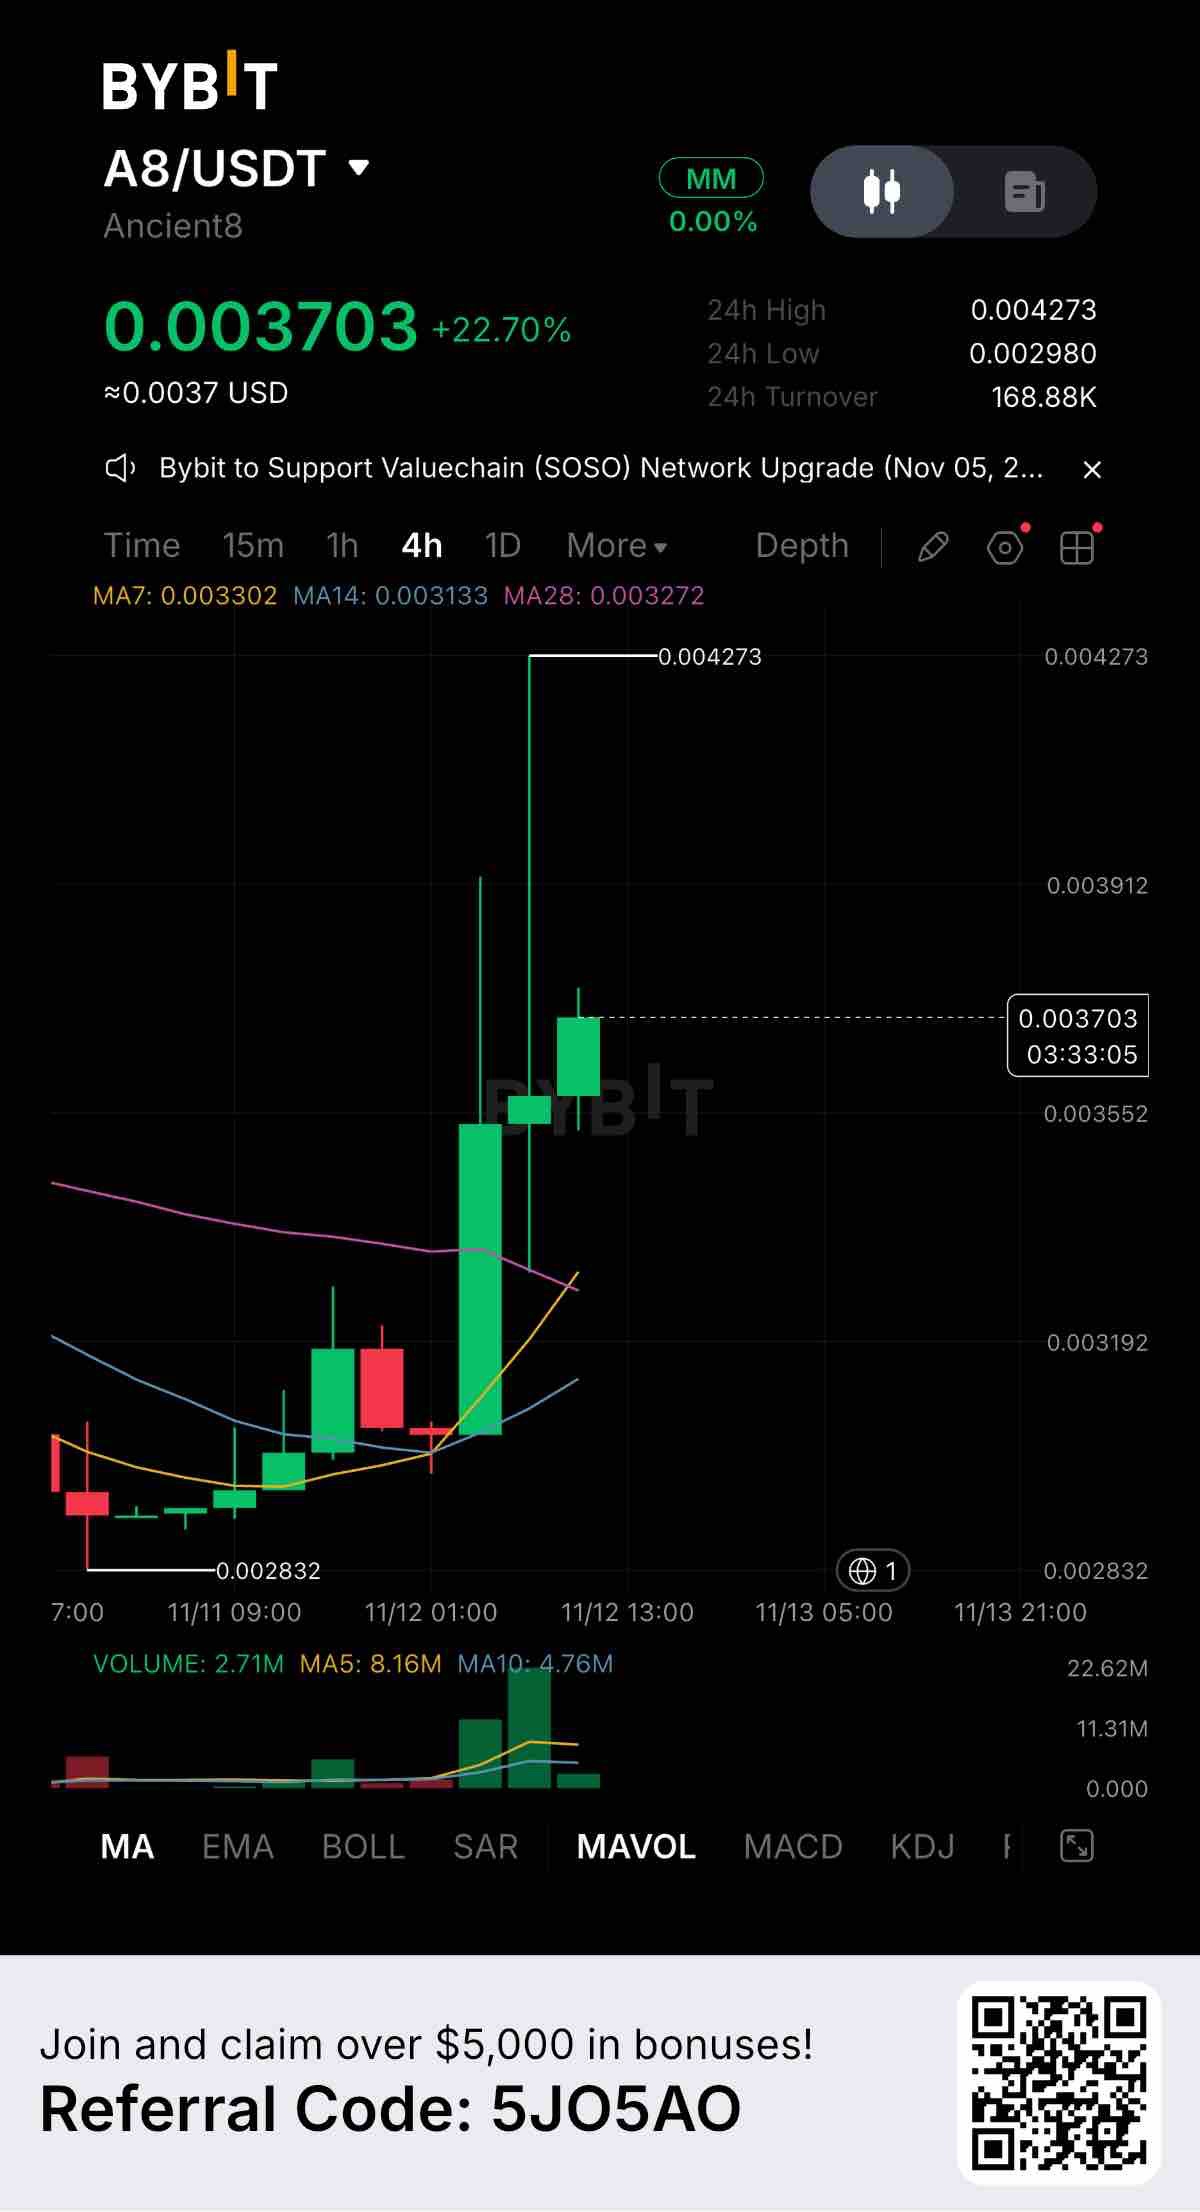
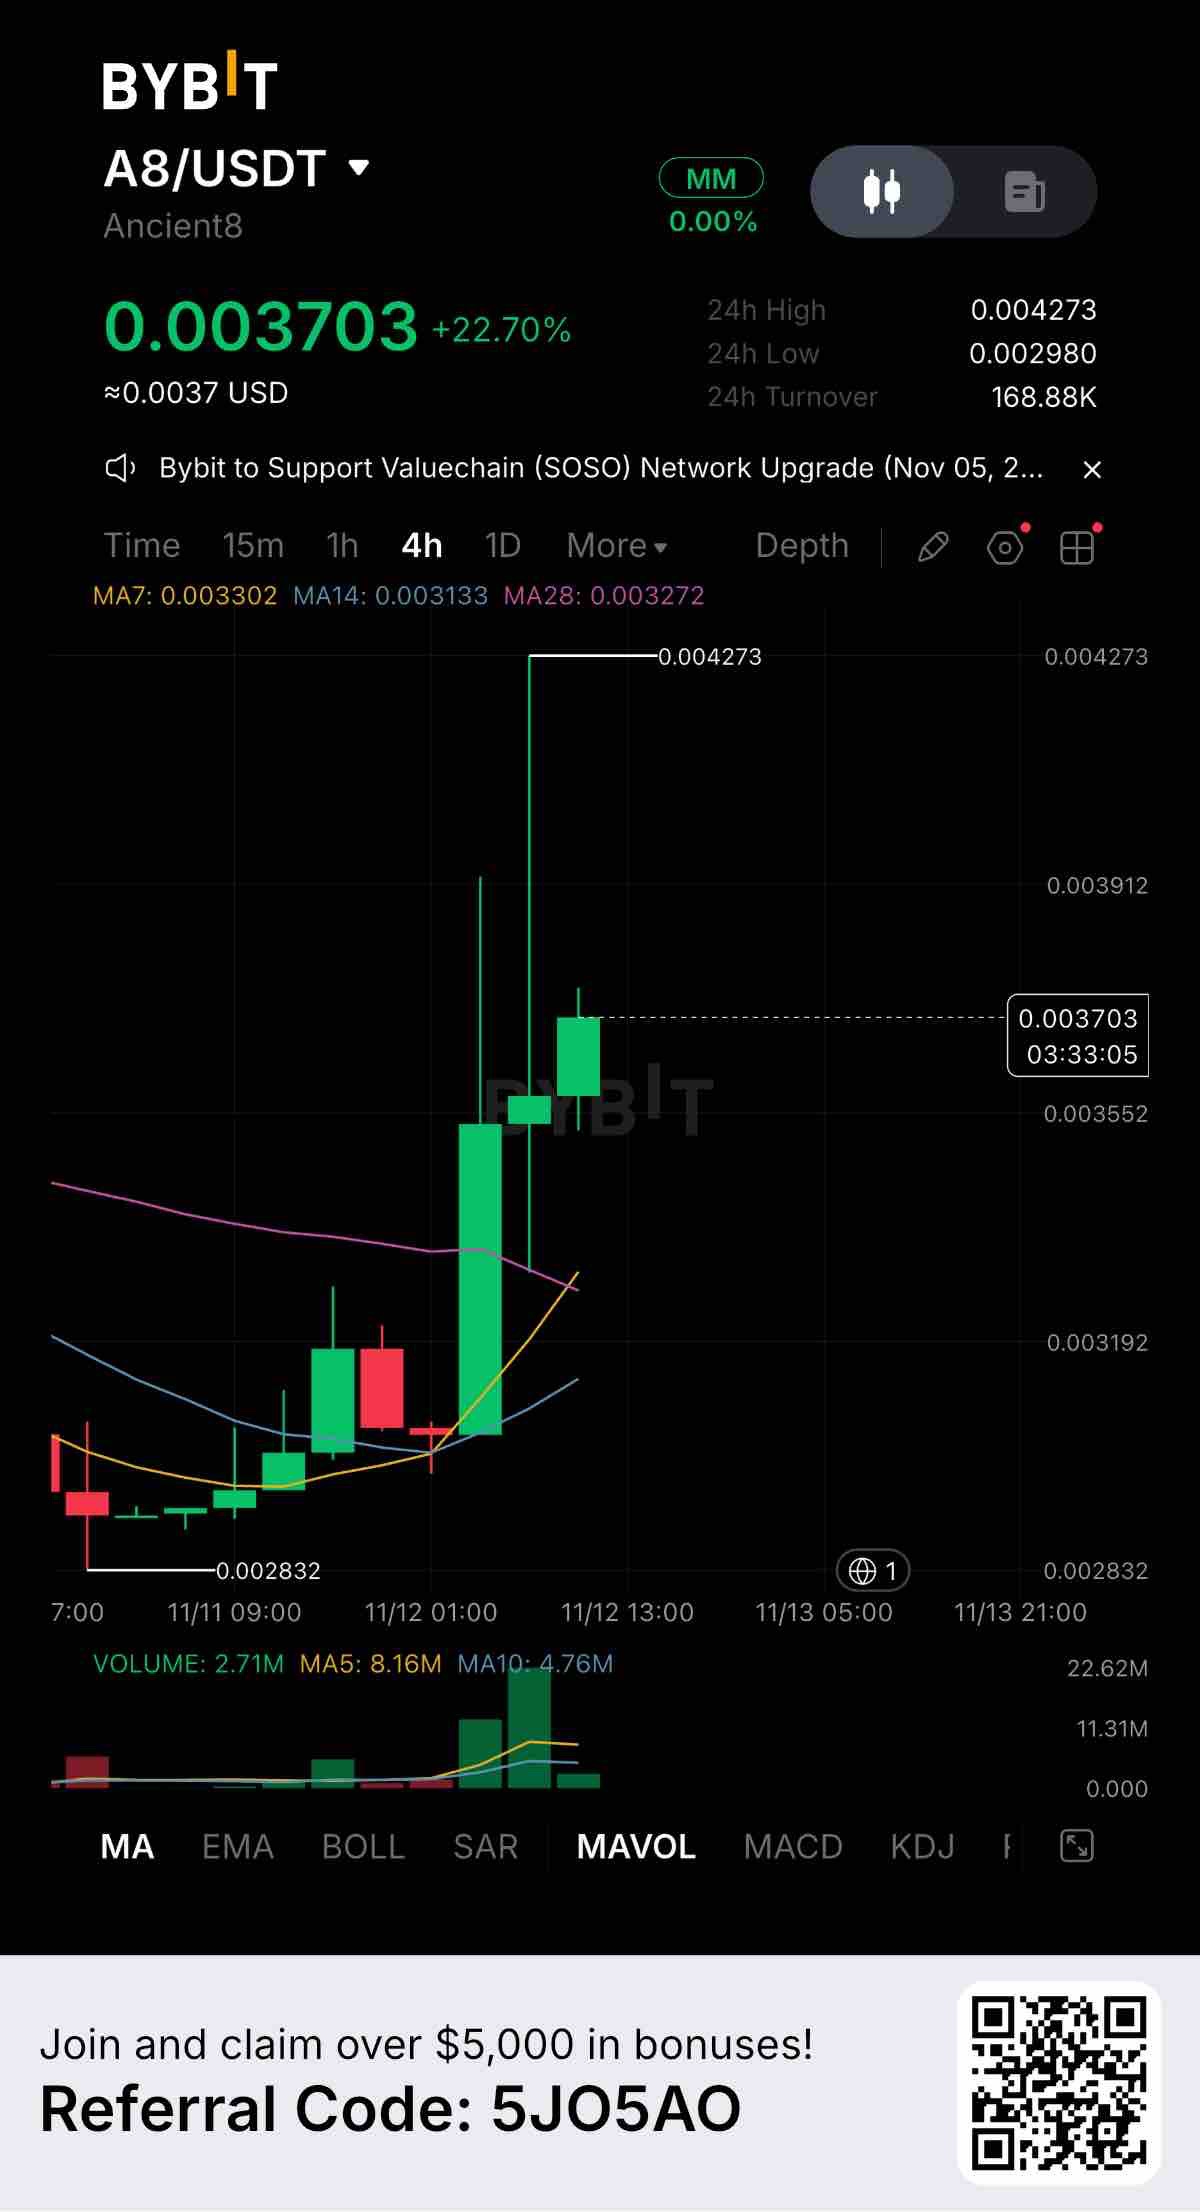
$A8USDT is putting on a wild show on the 4-hour chart, currently trading at 0.003703 with a massive +22.70% gain. This chart is a textbook example of extreme volatility. We saw an aggressive pump that left a massive upper wick stretching all the way to 0.004273 before sellers forcefully pushed the price back down. Key Levels to Watch: Resistance: 0.004273 (The top of the massive wick and the clear 24-hour high) Support 1: 0.003302 (7-day MA, the immediate dynamic support holding the current price) Support 2: 0.002980 (24-hour low, the structural floor) The moving averages are starting to cross over bullishly, and price is currently holding above MA7, MA14, and MA28. After that violent rejection at the highs, the price is now trying to stabilize. We are seeing a smaller green candle forming, indicating that buyers are attempting to build a base and defend the current levels. Volume is the main story here. The volume spike during the initial pump was massive, but 24-hour turnover has settled at 168.88K USDT. The key now is whether we see a surge of buying volume to push back up, or if the momentum is fading after that huge rejection. Fundamentally, Ancient8 (A8) is experiencing a sudden surge in market interest. Spikes like this often come from ecosystem news, but the heavy wick proves that sellers are very active at the top. If buyers can hold the 0.003302 support and build momentum, a retest of the highs is possible. But be careful: if support breaks, we could easily slide back down to the 0.002980 base. How are you playing this A8 volatility? Are you buying the dip or waiting for the dust to settle? Let me know below. #ByXIMPACT #WSOT2026
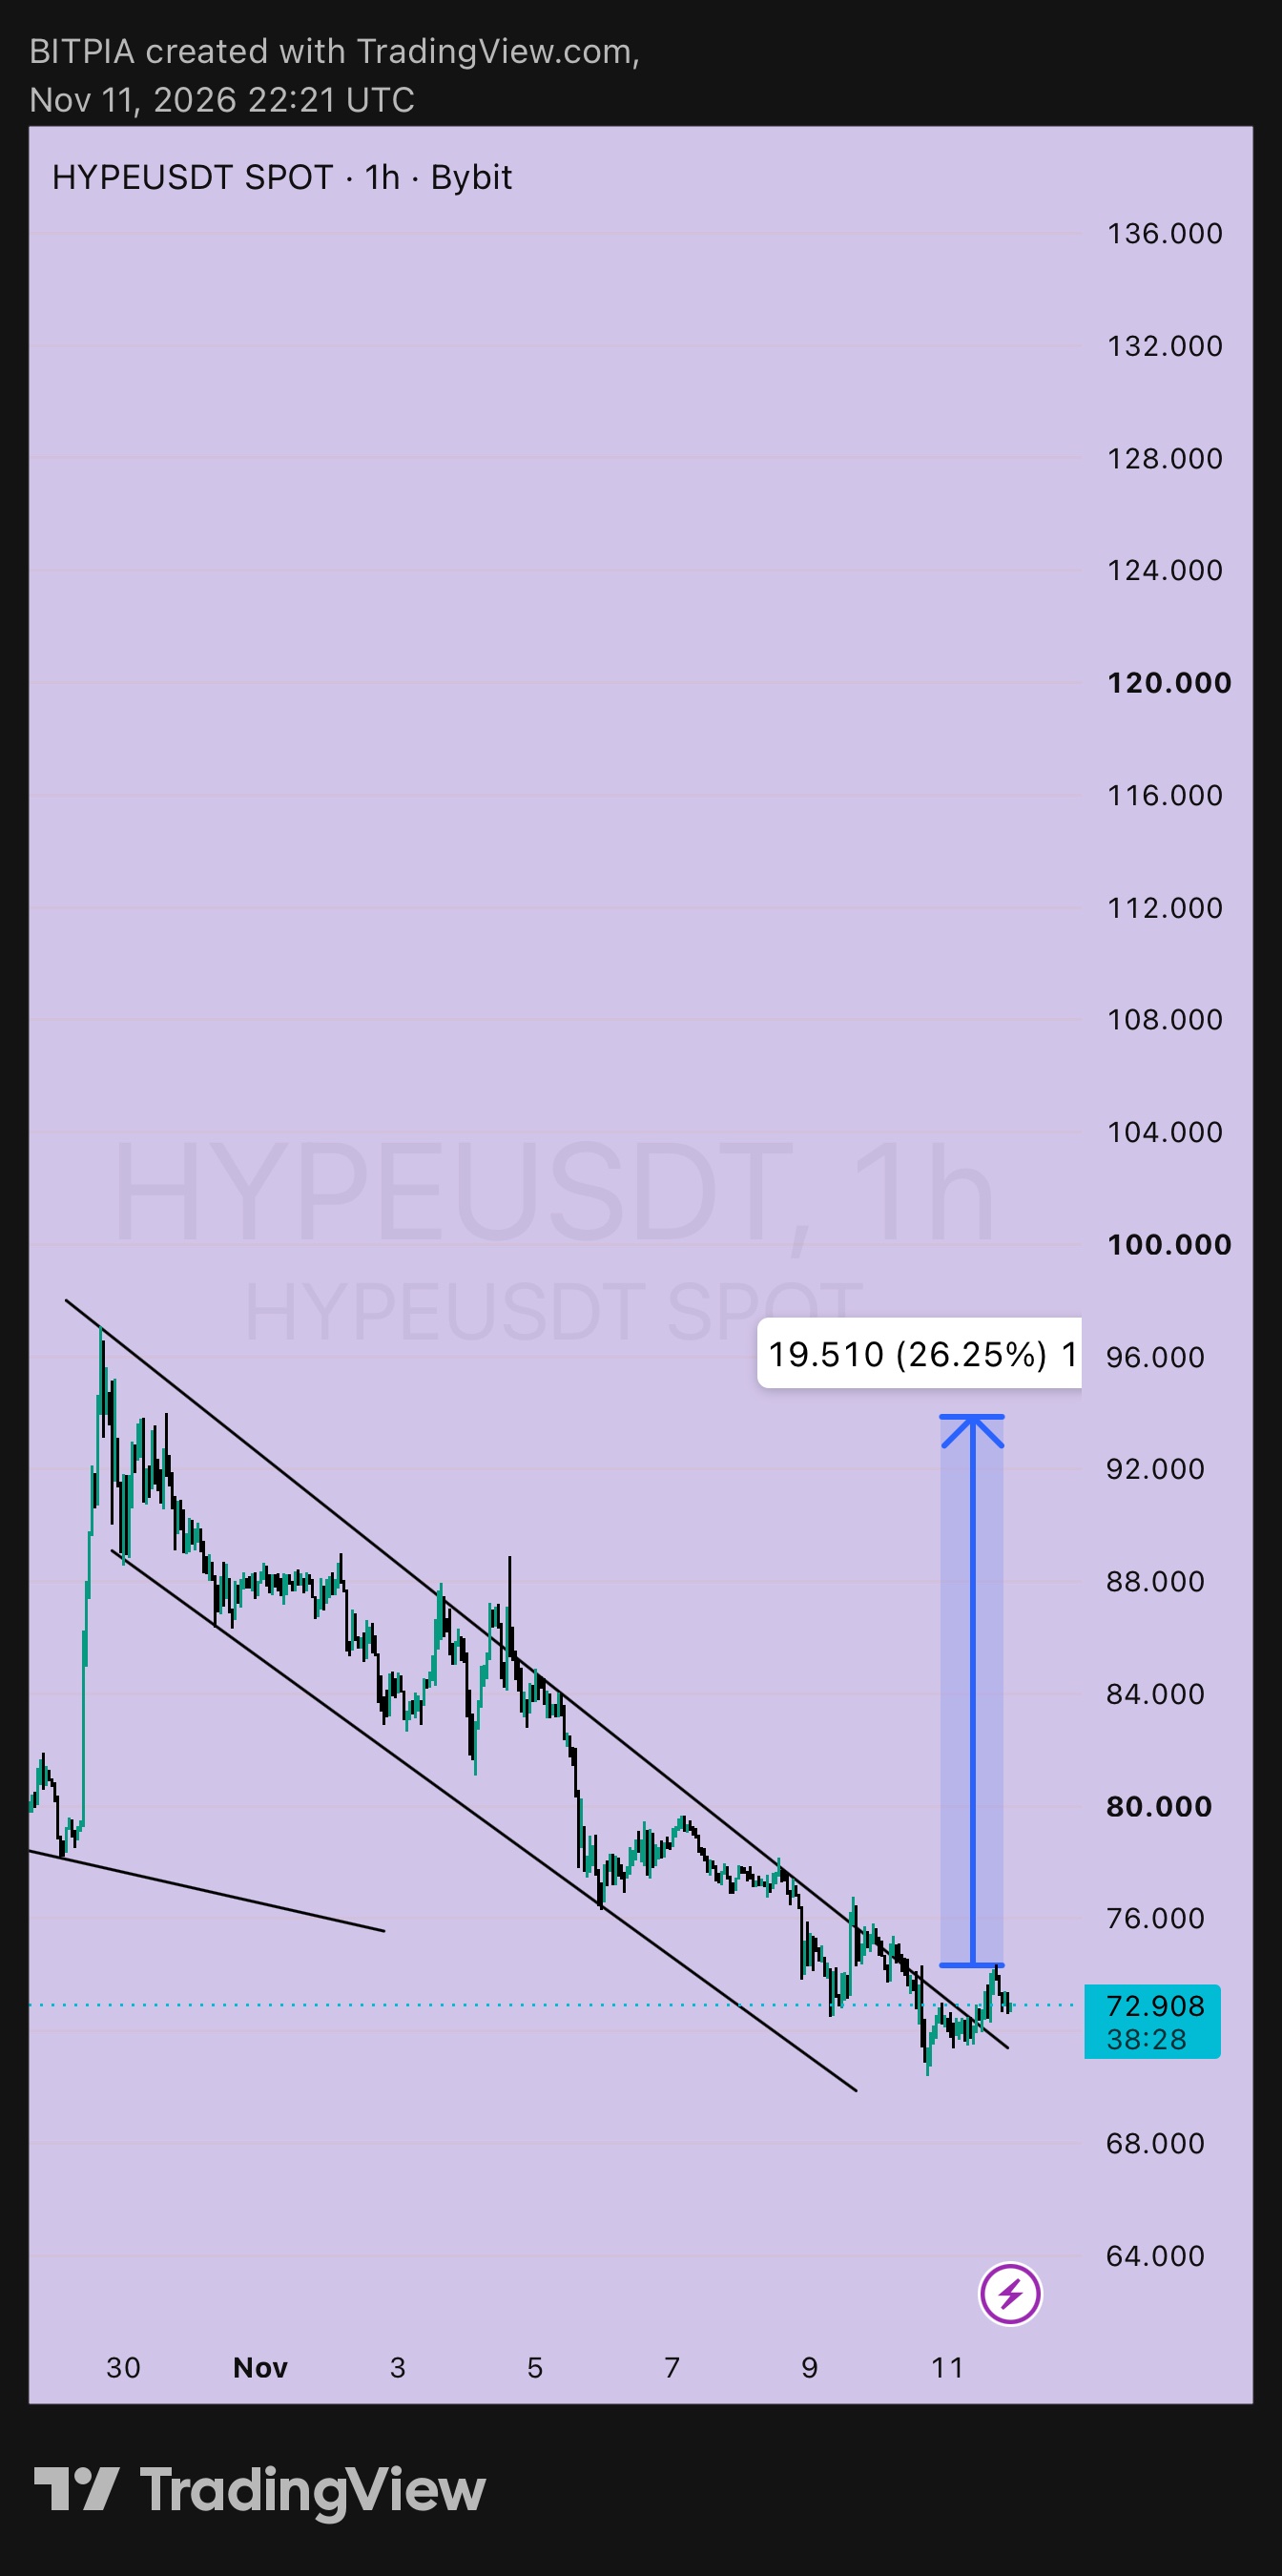
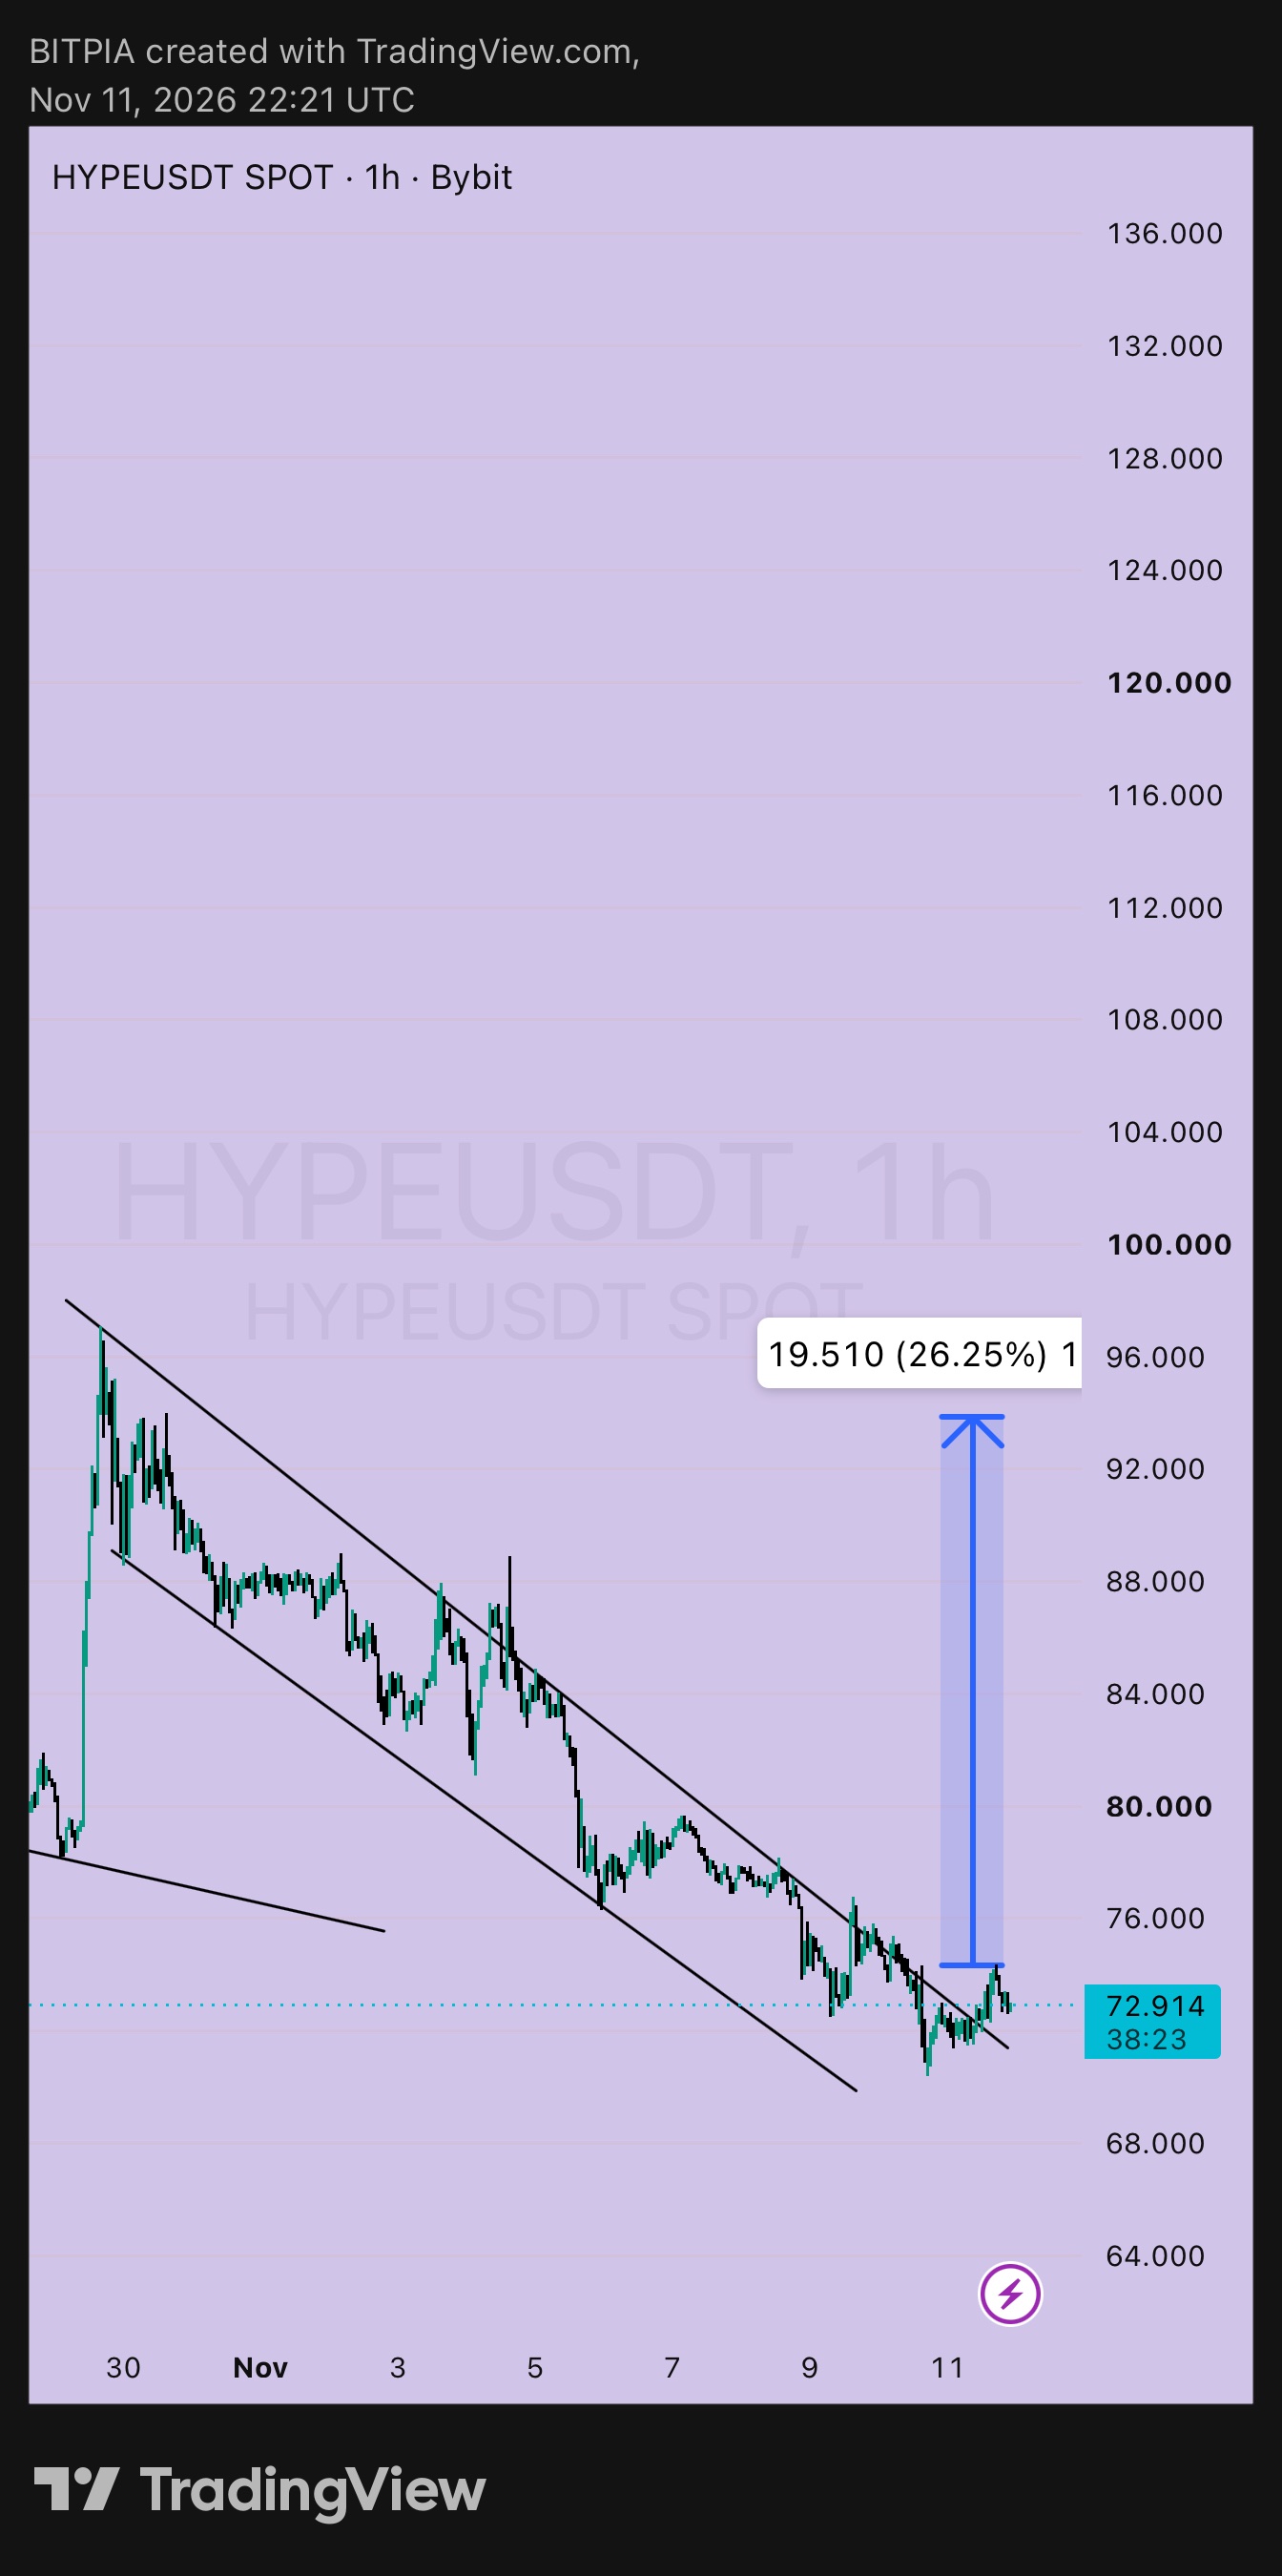
$HYPEUSDT 1小時線:備忘錄 ➤ 筆記 1:目前部位 11月9日我在下跌通道內以 73.802 發佈了 HYPE 的看法,當時的 A 計劃是在 72.0 附近買入,停損設在 69.5 以下。價格曾回調至約 70.3 後反彈,所以該進場點應該已經成交。目前價格為 72.914,每單位獲利約 +0.9,獲利幅度大約 0.4R。 ➤ 筆記 2:有什麼變化 ▸ 價格已突破並站上 72 至 73 附近的通道上緣,目前正在回測該位置 ▸ 70.3 附近的低點守住了,未觸及我的 69.5 停損點,因此計劃維持不變 ▸ 圖表上的預測目標價位仍指向 94 左右,約為通道下緣的 26% 漲幅 ➤ 筆記 3:未平倉交易的處理方式 ▸ 在 1 小時線收盤站上 76 之前,維持 69.5 的停損不變 ▸ 之後,將停損上移至 72 附近的保本點 ▸ 目標價:77 (+5,約 2R)、82.5 (+10.5,約 4.2R)、94 (+22,約 8.8R,機率較低,所以只會留少量部位) ➤ 筆記 4:如果還沒進場該怎麼做 ▸ 進場點:72.5 左右,在跌破的通道線回測確認支撐後進場 ▸ 停損點:69.8 以下 ▸ 每單位風險:2.7 ▸ 目標價:77 (+4.5,約 1.7R) 及 82.5 (+10,約 3.7R) ▸ 若以 72.9 買入且使用相同停損,風險為 3.1,到 77 的距離約 1.3R。這是可行的,但回測進場的數據更好 ➤ 筆記 5:B 計劃仍在待命中 ▸ 觸發條件:1 小時線收盤高於 77.5 ▸ 進場點:78 左右,停損設在 74 以下,風險 4 ▸ 目標價:82.5 (約 1.1R)、90 (約 3R)、94 (約 4R) ➤ 筆記 6:失效條件 若 1 小時線收盤跌破 69.5,代表突破失敗,我會離場觀望。 部位要小,如果用合約的話槓桿要低。現在去睡覺吧。🌙 非財務建議。請自行研究,且只承擔你虧損得起的風險。 #ByXIMPACT #WSOT2026
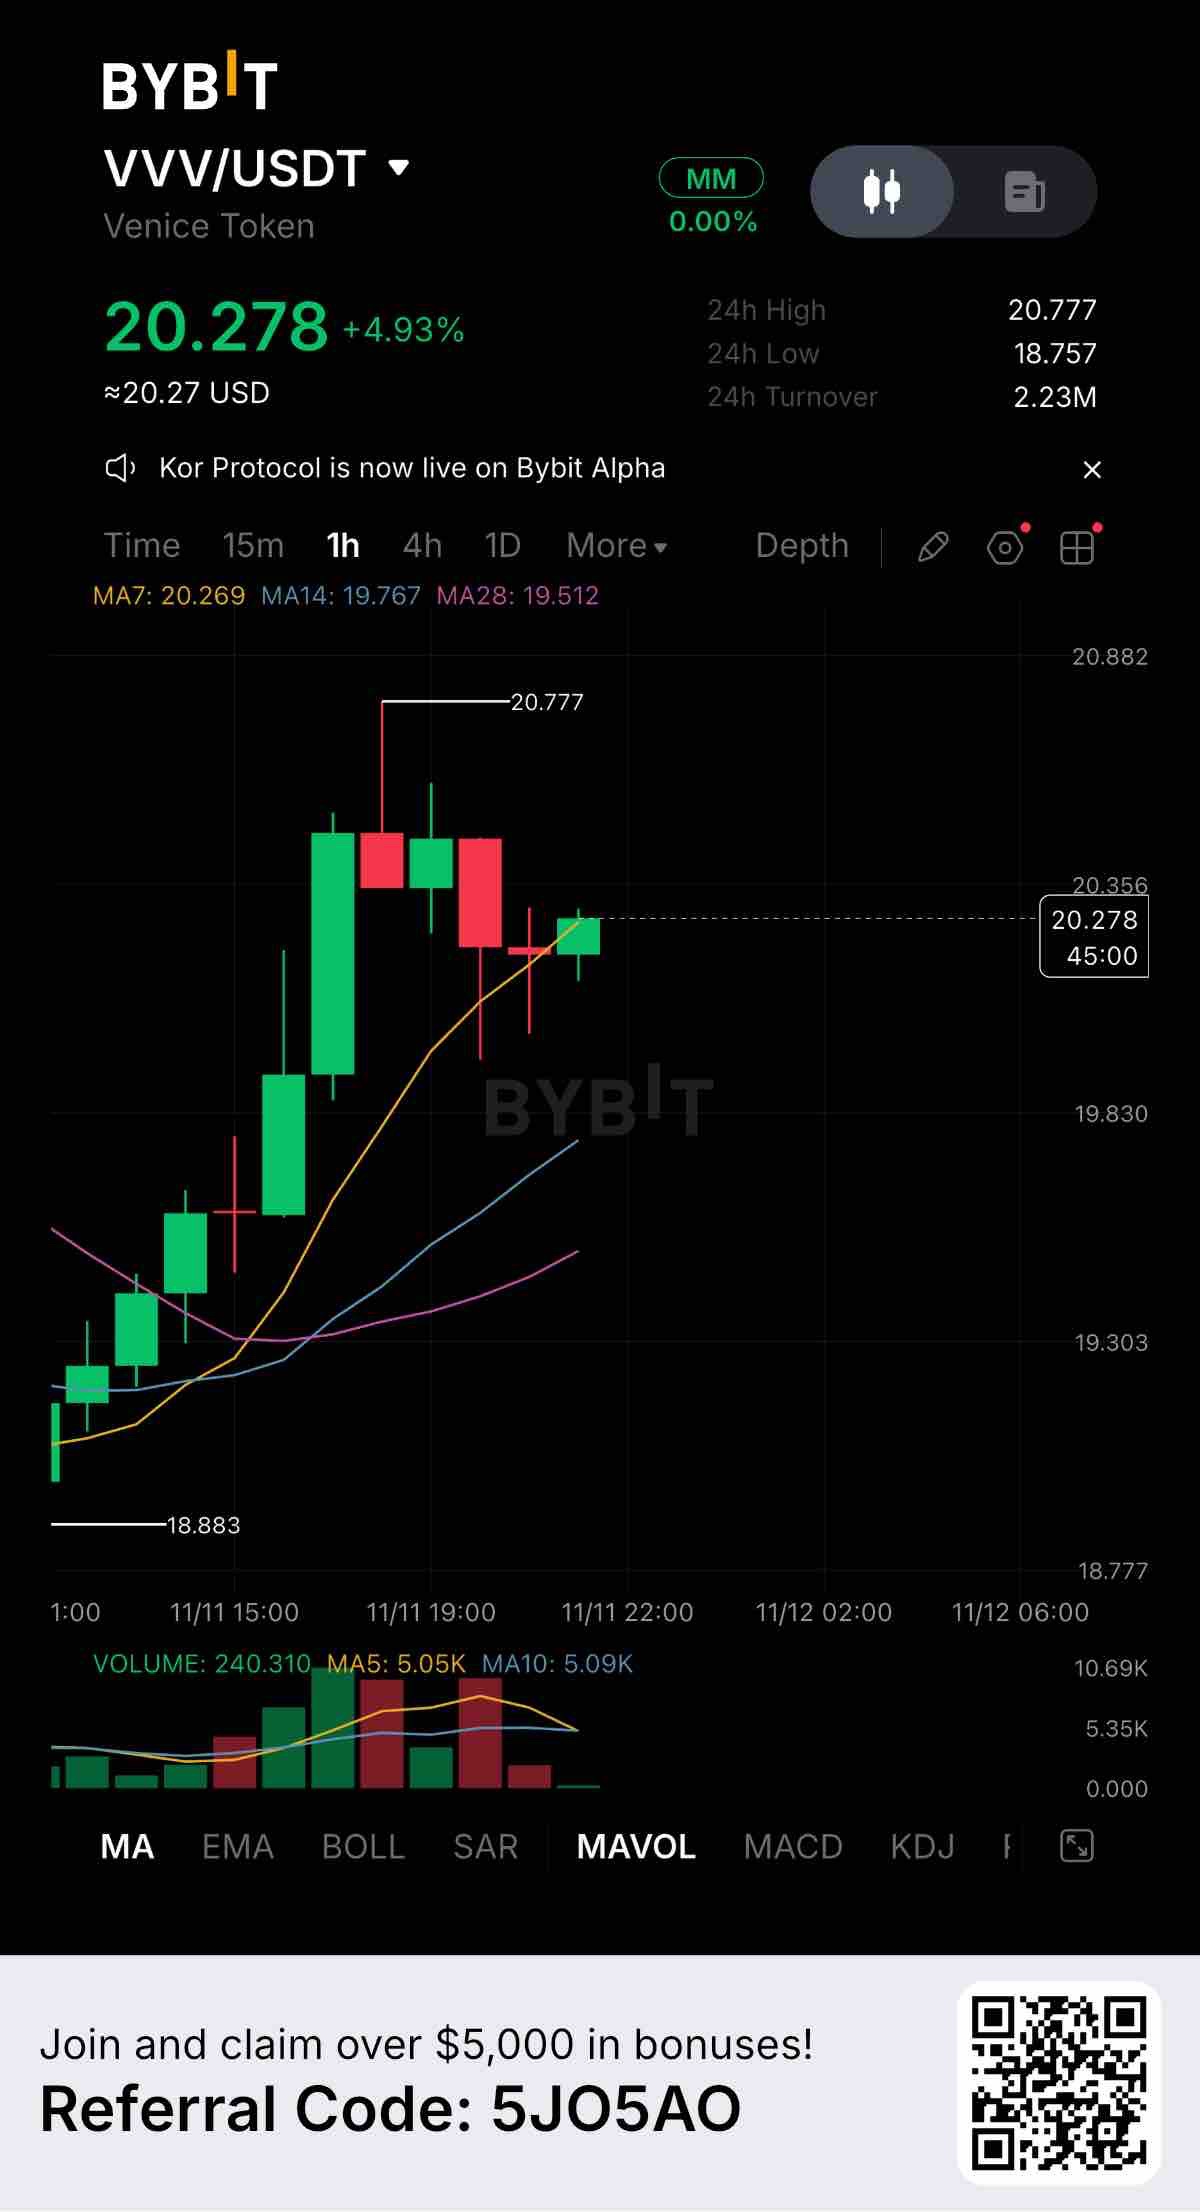
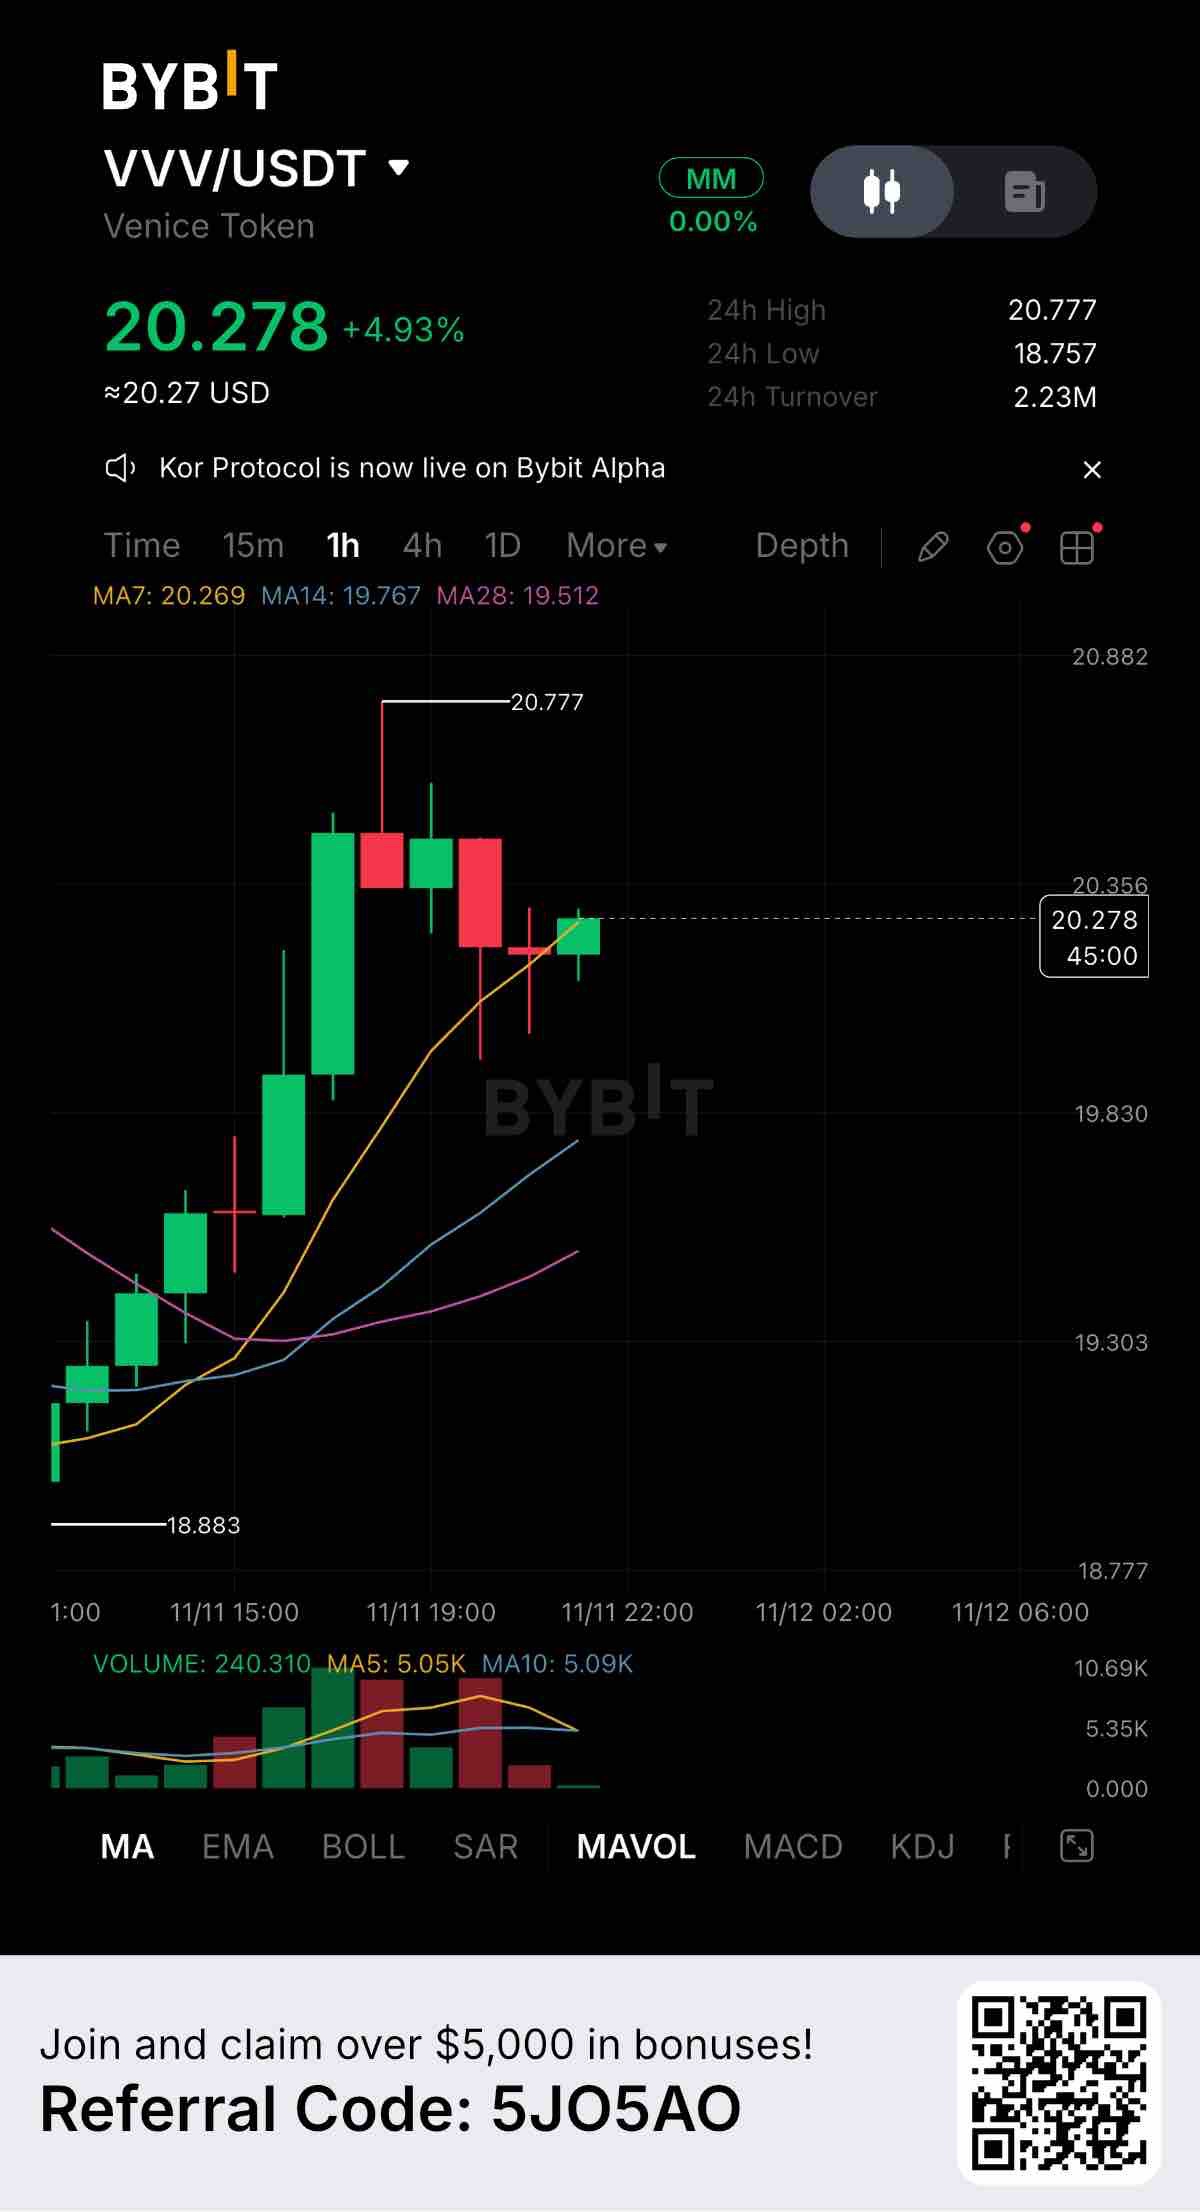
$VVVUSDT is showing classic market behavior on the 1-hour chart, currently trading at 20.278 with a +4.93% gain. After a sharp rally that pushed the price to a 24-hour high of 20.777, we are now seeing a healthy pullback as early buyers take some profits. Key Levels to Watch: Resistance: 20.777 (The recent peak where sellers stepped in) Support 1: 20.269 (7-day MA, acting as the immediate battleground right now) Support 2: 18.757 (24-hour low, the stronger structural support below) Looking at the moving averages, the trend is still overall bullish. Price is holding right on the 7-day MA (20.269) and remains well above MA14 (19.767) and MA28 (19.512). The current test is whether the 7-day MA will hold as support or break. Volume is healthy, with 2.23M USDT in 24-hour turnover. The chart shows that the selling volume during this pullback is much lower than the buying volume during the initial push, which is a good sign for the bulls. Fundamentally, Venice Token (VVV) is holding its recent gains well. Pullbacks like this are often necessary to cool off overheated indicators and allow new buyers to step in. If the price bounces off this 20.269 support level, we could see another attempt at the 20.777 high. However, if it loses this level, a drop toward the 19.800 area (near MA14) is very possible. Are you buying this dip on VVV, or waiting to see if the support holds? Let’s hear your thoughts below. #ByXIMPACT #WSOT2026
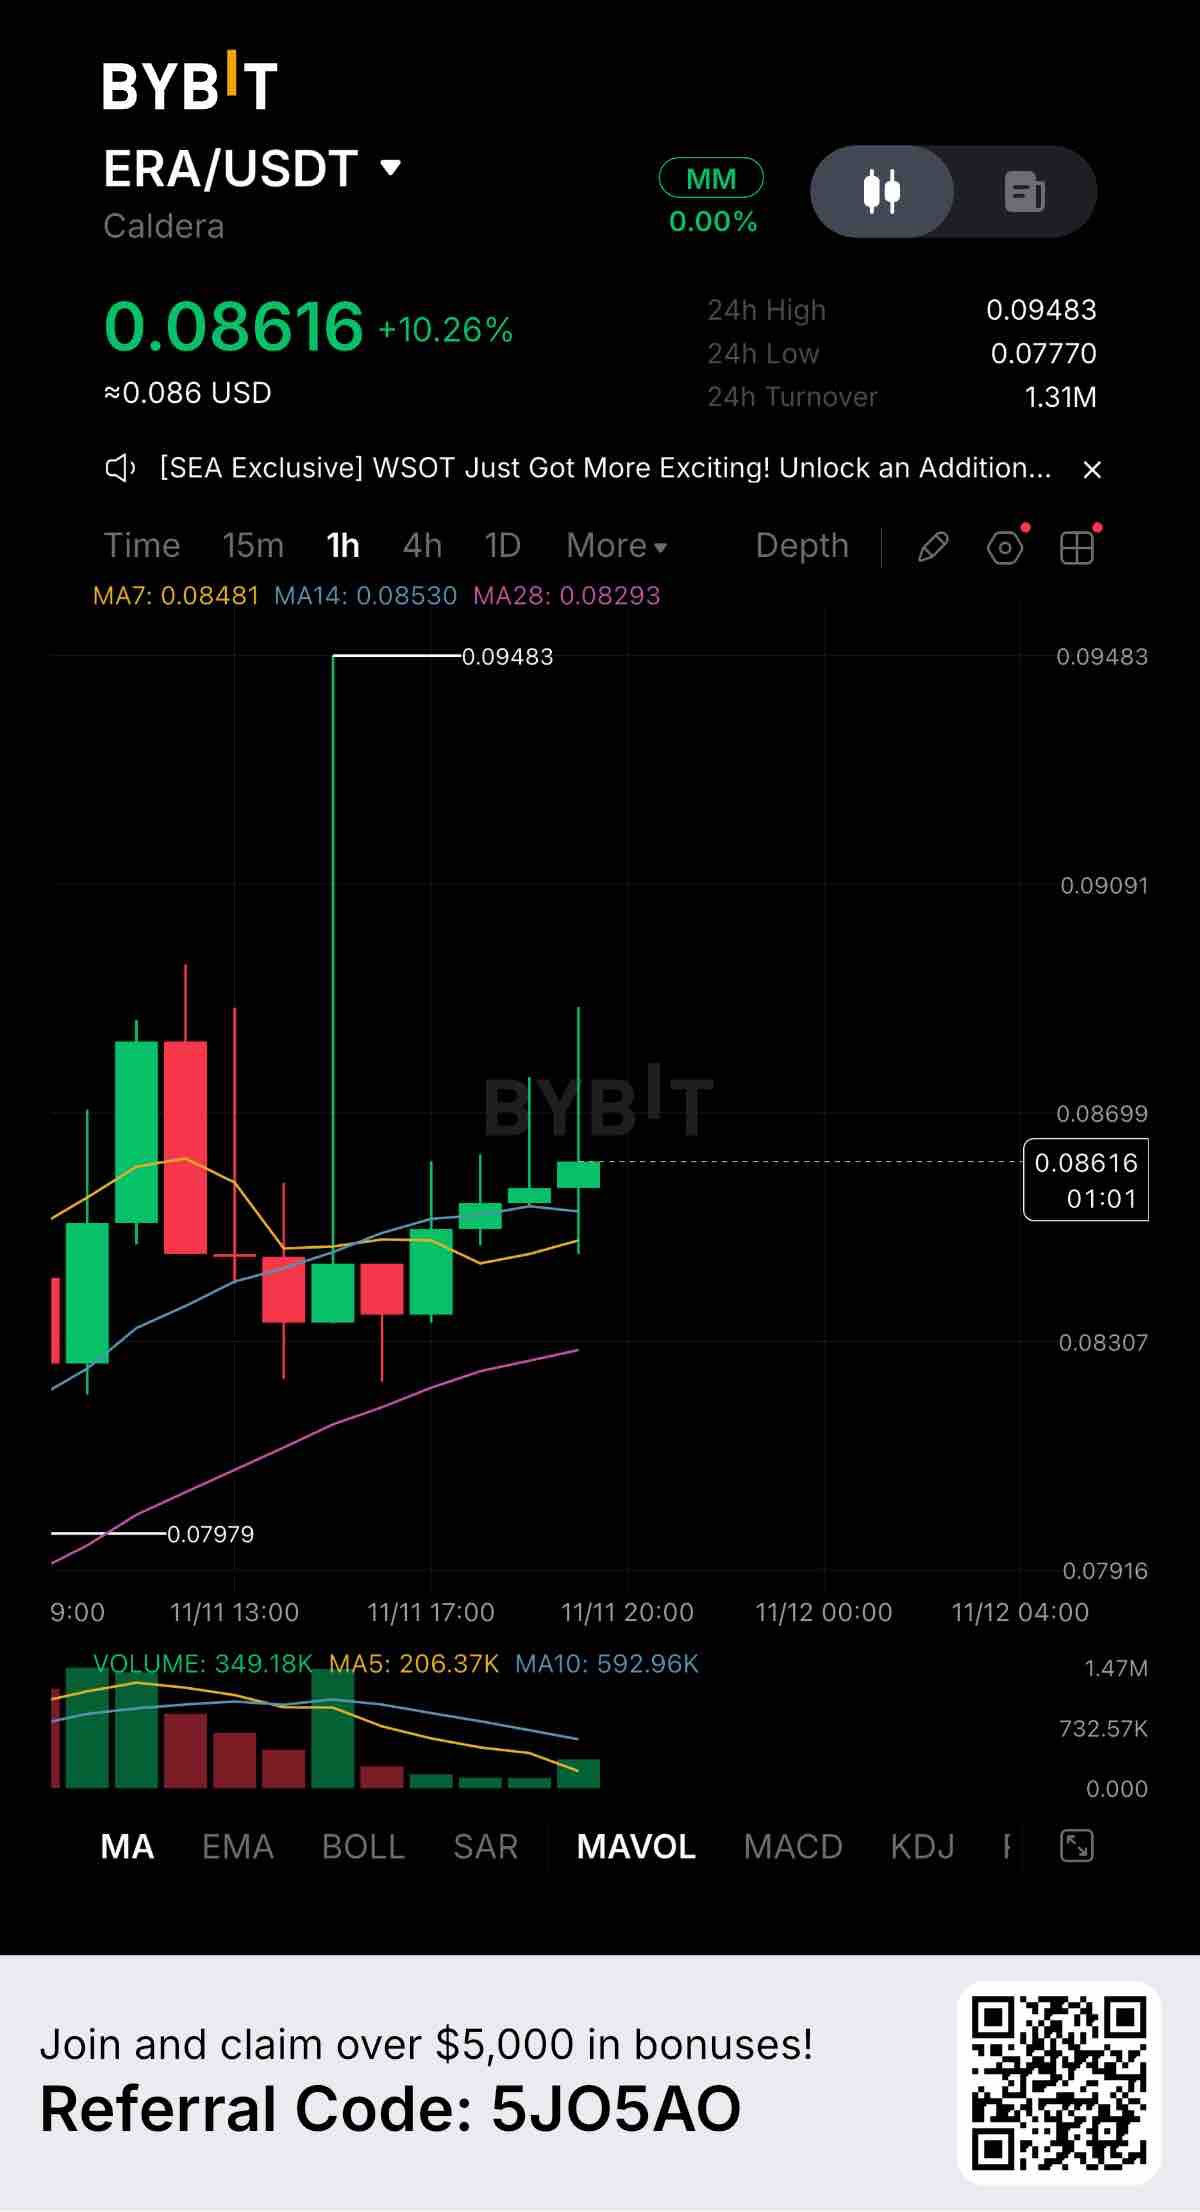
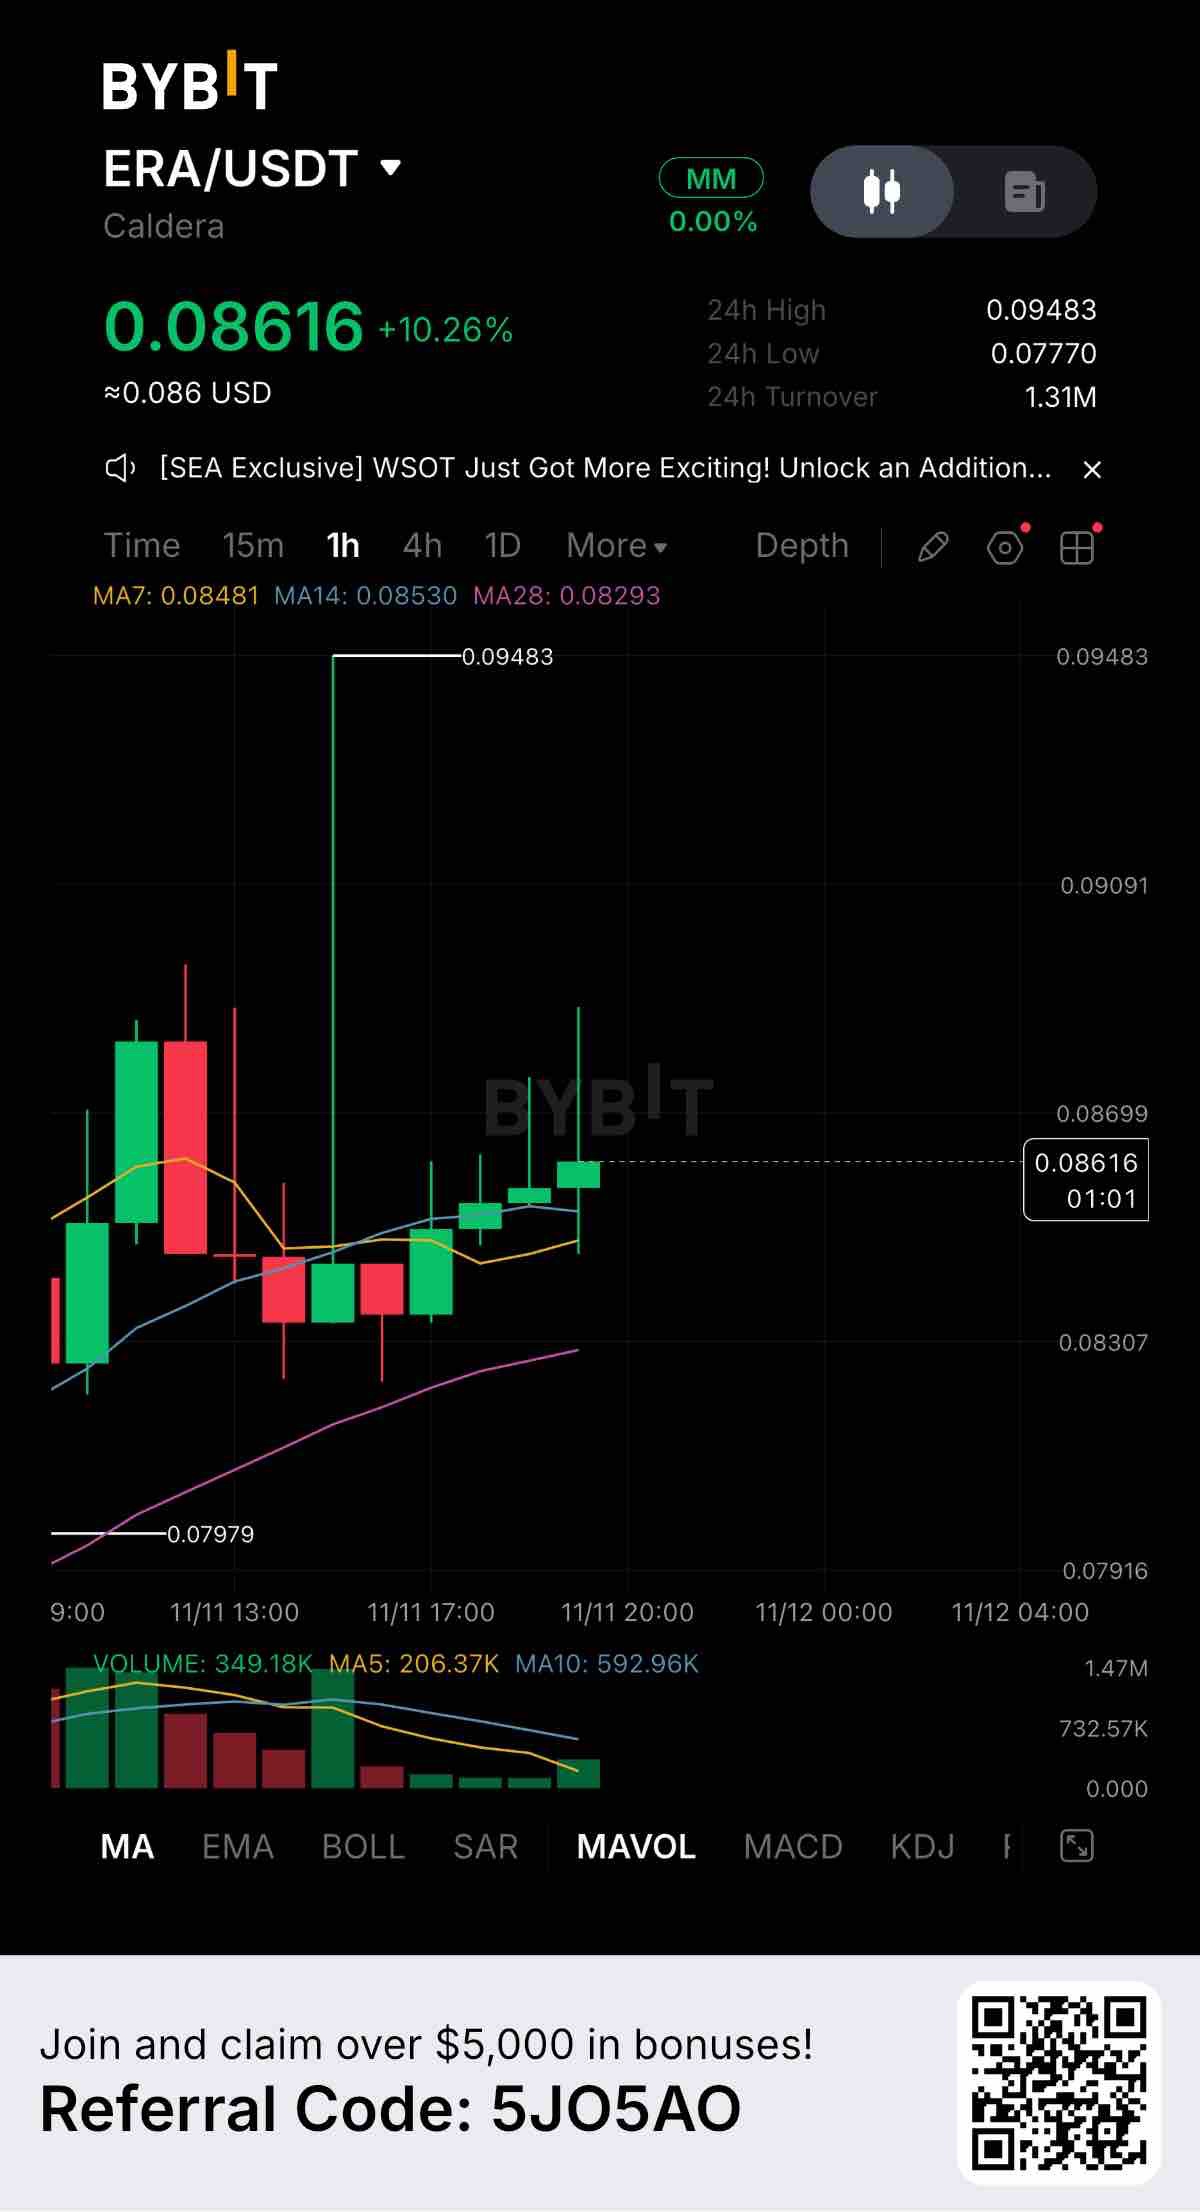
$ERAUSDT is showing interesting price action on the 1-hour chart, currently trading at 0.08616 with a solid +10.26% gain. However, looking closely at the chart, this isn't a simple straight line up. We saw a massive volatility spike that left a huge upper wick reaching all the way to 0.09483 before sellers pushed the price back down. Key Levels to Watch: Resistance: 0.09483 (The massive 24-hour high and the top of the recent wick) Support 1: 0.08481 (7-day MA, acting as immediate dynamic support) Support 2: 0.07770 (24-hour low, the structural floor) The moving averages are currently pinching together, but price is holding above MA7, MA14, and MA28. After that massive spike and rejection, the price is now consolidating and forming a series of smaller green candles. This suggests buyers are trying to build a base and regain control. Volume is a key factor here. The initial spike was met with heavy selling pressure, but the 24-hour turnover remains strong at 1.31M USDT. We need to see if buying volume can step back in to push through the previous rejection zone. Fundamentally, Caldera (ERA) is getting attention, and the sudden volatility spike often points to a reaction to news or a liquidity grab by larger players. If buyers can build enough momentum to test 0.09483 again, a breakout could follow. But right now, the safer play is watching to see if the 0.08481 support holds. If it does, we might have a solid setup for the next leg up. If it breaks, we could retest the lows. What is your read on ERA after that massive wick? Are you buying this consolidation? Let’s discuss in the comments. #ByXIMPACT #WSOT2026
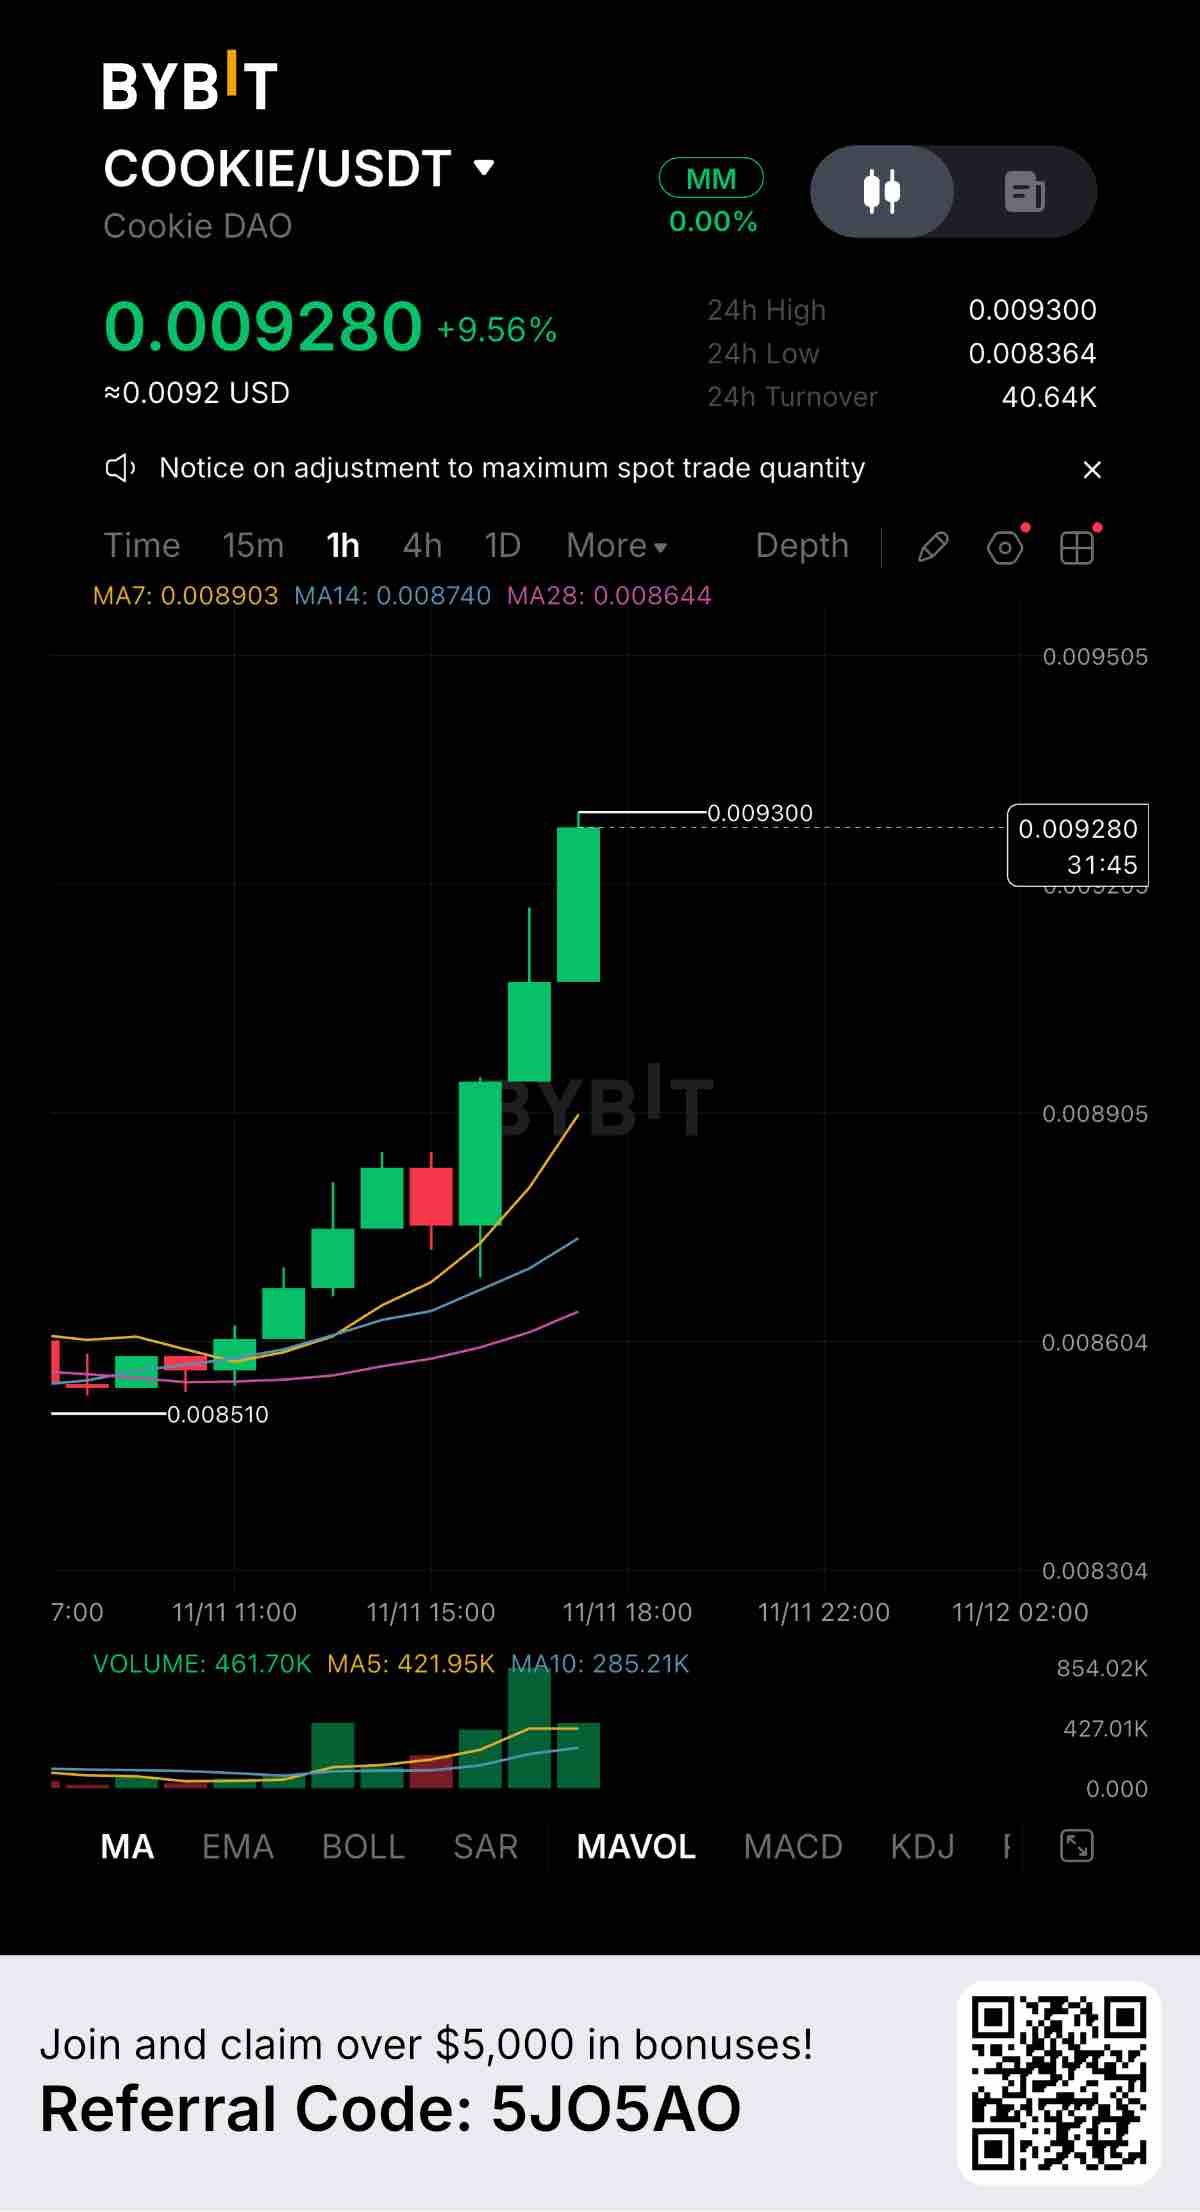
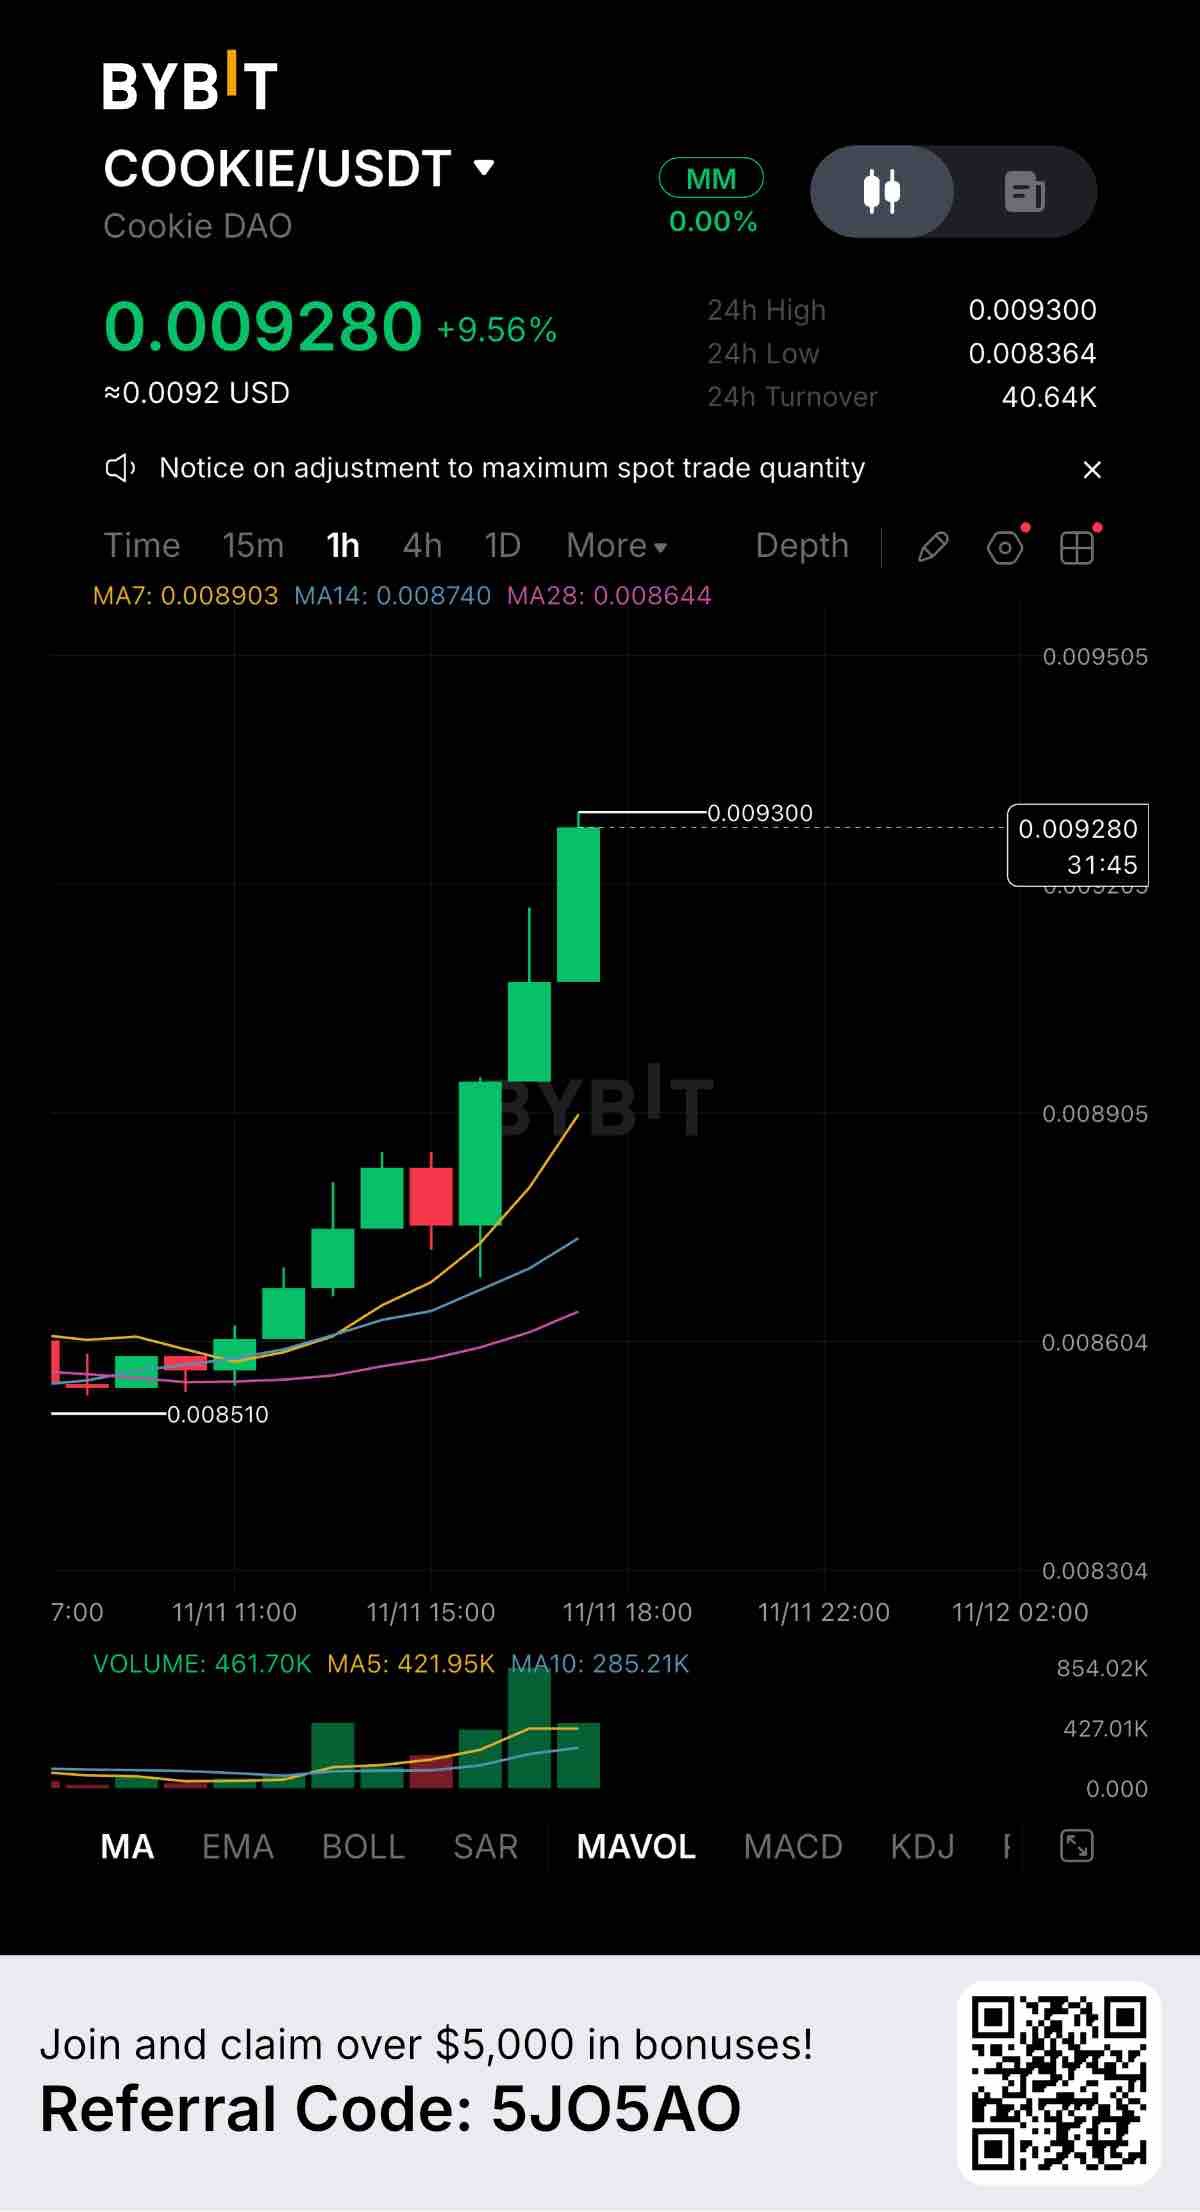
$COOKIEUSDT is putting in serious work on the 1-hour chart, currently trading at 0.009280 with a strong +9.56% gain. The price action is showing a relentless staircase pattern, with buyers stepping in aggressively on every pullback. Key Levels to Watch: Resistance: 0.009300 (The current 24-hour high, acting as the immediate ceiling) Support 1: 0.008903 (7-day MA, the first dynamic support zone) Support 2: 0.008364 (24-hour low, the stronger structural floor) The moving averages are perfectly fanned out. Price is trading well above MA7, MA14, and MA28, confirming a highly aggressive short-term uptrend. The chart shows almost no selling resistance, with only minor red candles before the next leg up. Volume is the real confirmation here. The green volume bars are expanding as the price pushes higher, backed by 40.64K USDT in 24-hour turnover. This indicates genuine buying pressure, not just low-liquidity spikes. Fundamentally, Cookie DAO (COOKIE) is capturing heavy attention. Steady, stair-step moves like this usually indicate strong community momentum and active accumulation. If buyers manage to break and hold above 0.009300, price discovery is likely. However, because the price is extended from the 7-day MA, chasing here carries risk. A retest of 0.008903 is the safer setup if you are looking to enter. Are you holding COOKIE or waiting for a pullback? Let’s hear your thoughts below. #ByXIMPACT #WSOT2026
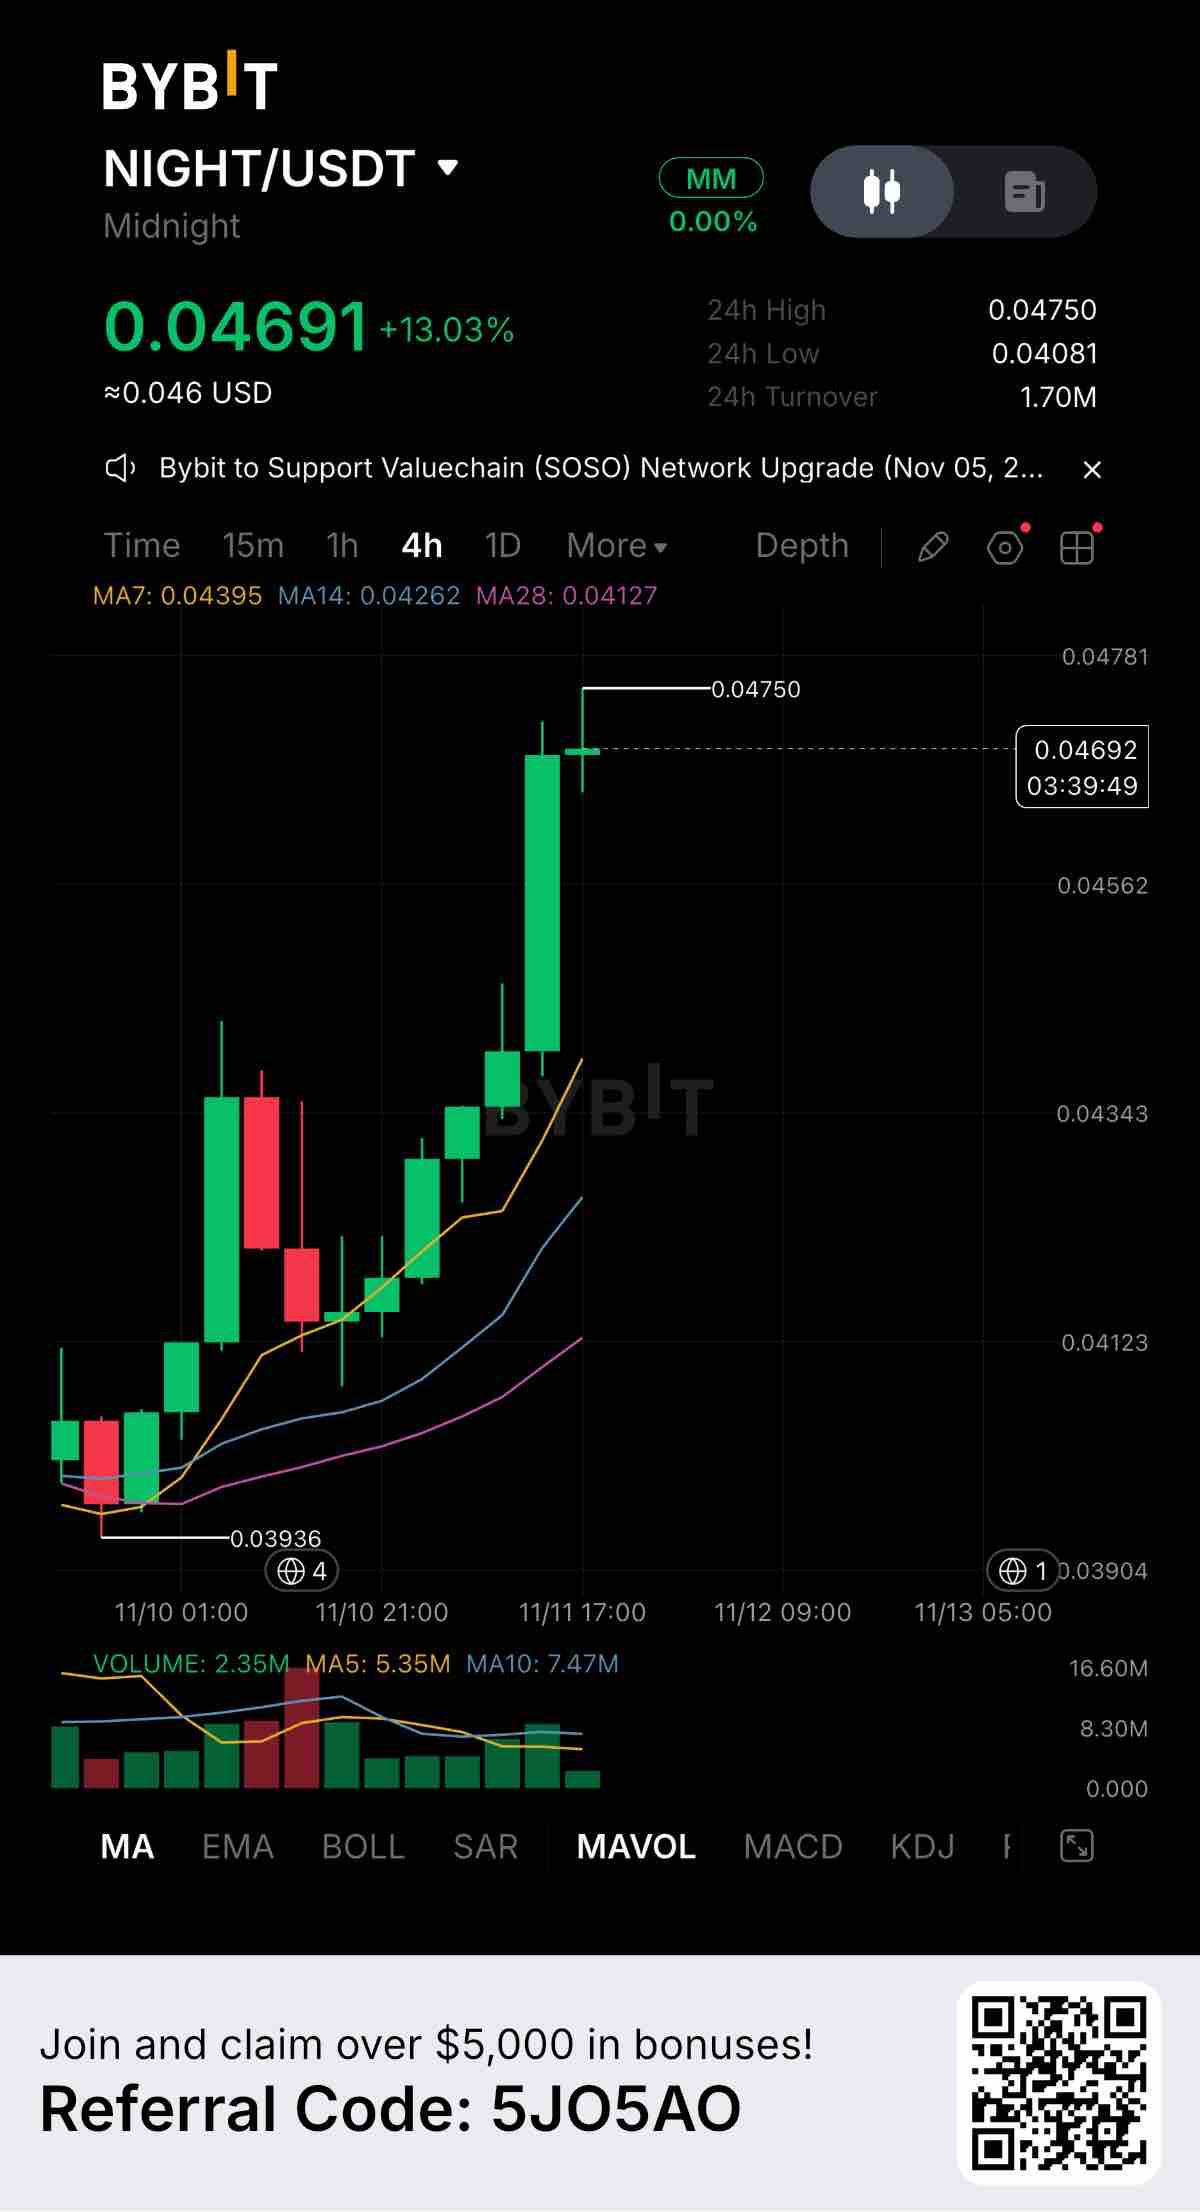
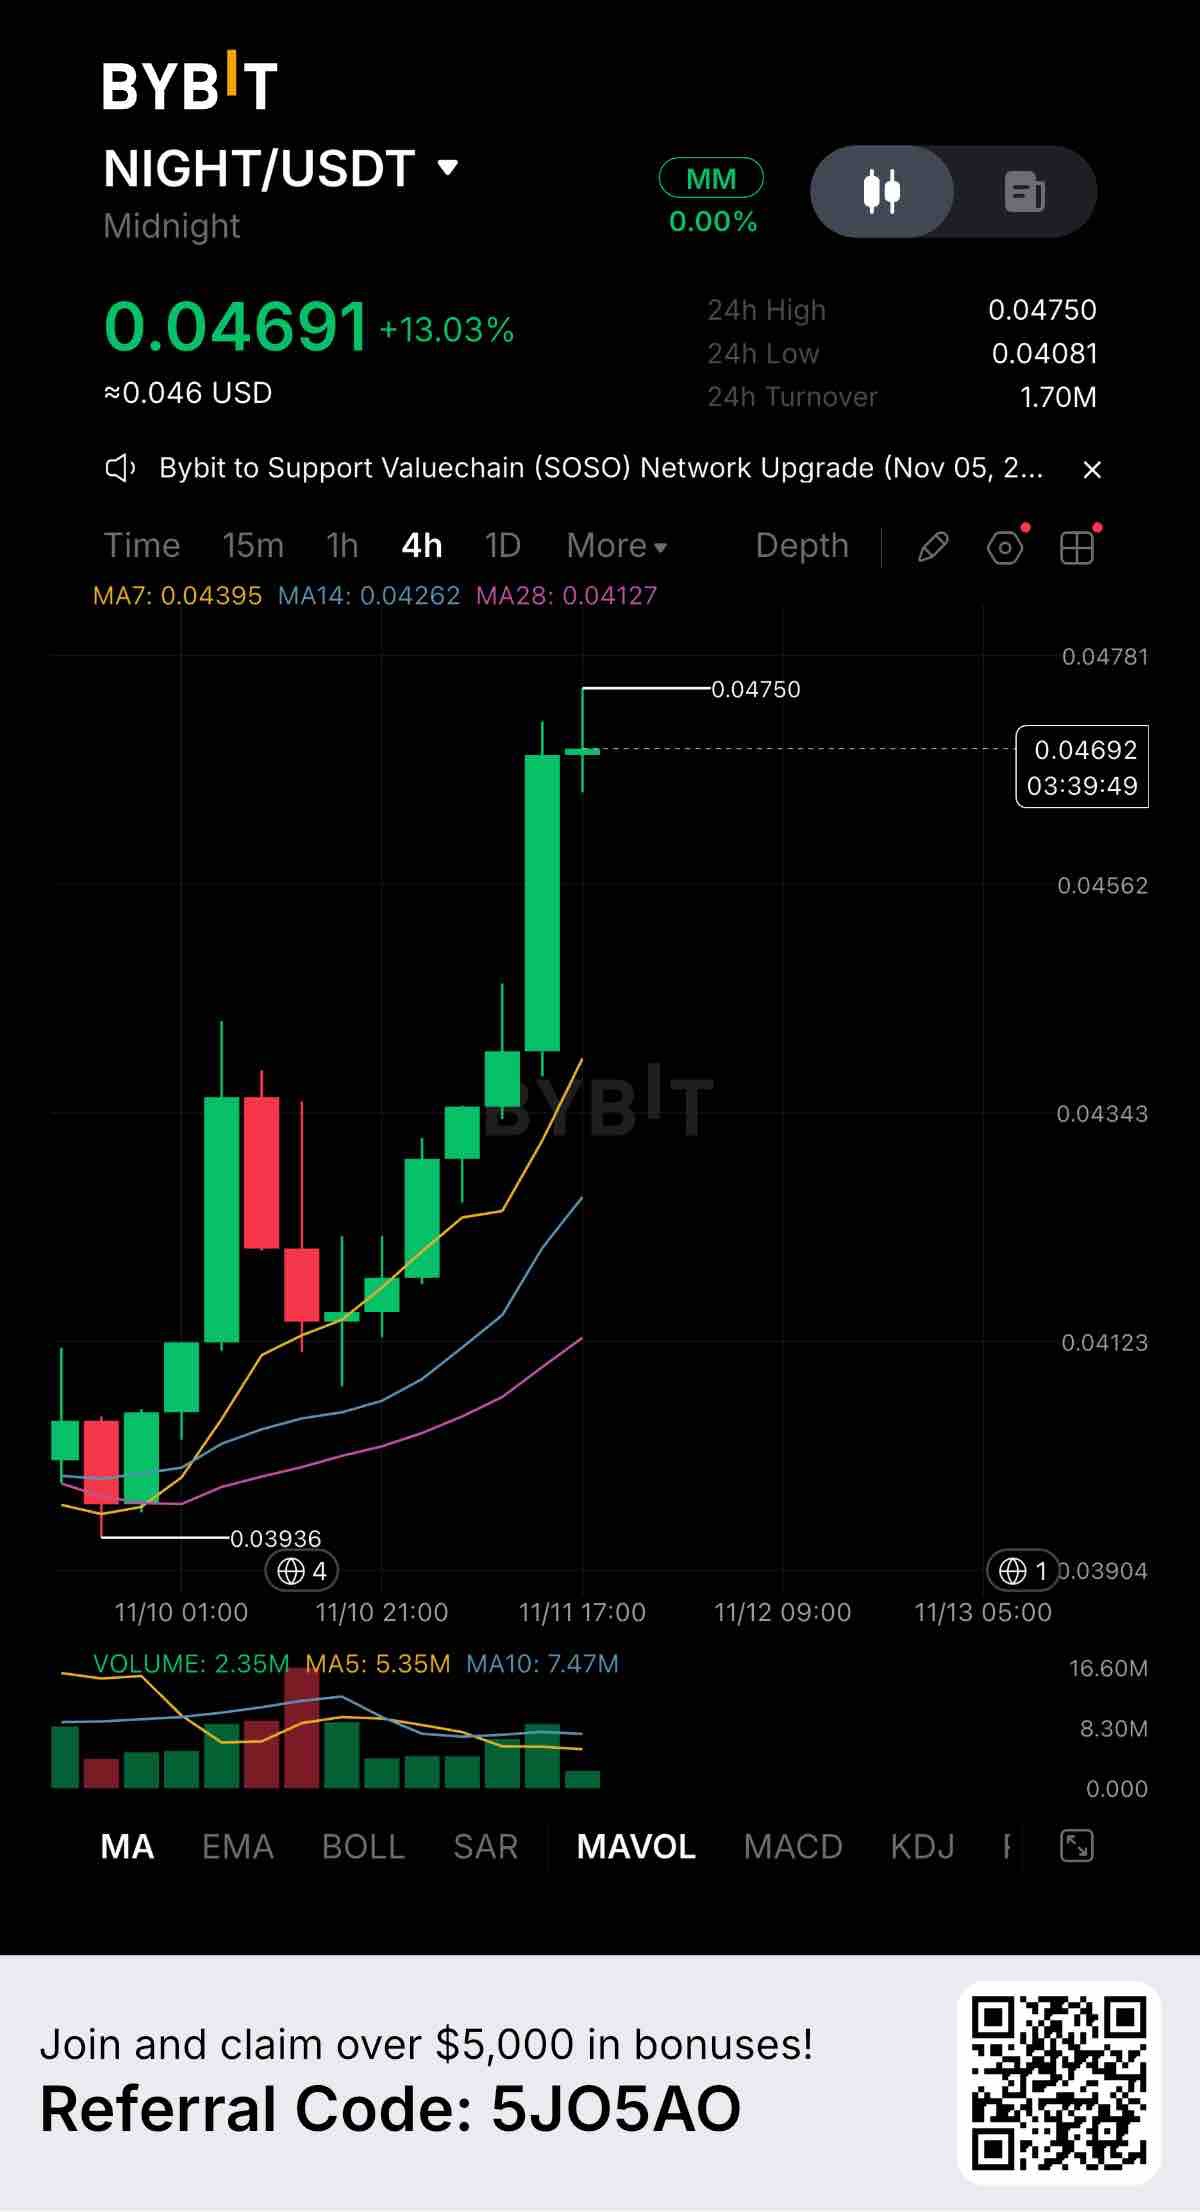
$NIGHTUSDT 今日展現強勁的上漲勢頭,目前價格為 0.04691,過去 24 小時內上漲了 +13.03%。4 小時線圖顯示出教科書般的上升趨勢,買方明顯佔據主導地位。 值得關注的關鍵價位: 阻力位:0.04750(目前的 24 小時高點,作為短期天花板) 支撐位 1:0.04395(7 日均線,回調時的第一道防線) 支撐位 2:0.04081(24 小時低點,更強的結構性支撐位) 移動平均線排列呈現完美的多頭趨勢。價格目前遠高於 MA7、MA14 和 MA28,證實了短期走勢依然非常強勁。不過,價格與 7 日均線已有一定乖離,因此出現短暫的回調修正並不令人意外。 成交量表現健康,24 小時成交額達 170 萬 USDT。圖表顯示持續的買盤正在支撐這波漲勢。 基本面上,Midnight (NIGHT) 正在吸引強勁的市場關注。這類動能通常意味著市場對該生態系統的興趣日益濃厚,或是交易者正轉向新的敘事熱點。 如果買方能成功突破並站穩 0.04750,價格可能會繼續進入價格發現階段。然而,如果賣方在此處拒絕進一步上漲,那麼等待價格回踩至 0.04395 附近會比追高來得更為穩妥。 你現在有在交易 NIGHT 嗎?在留言區分享你的策略吧。 #ByXIMPACT #WSOT2026
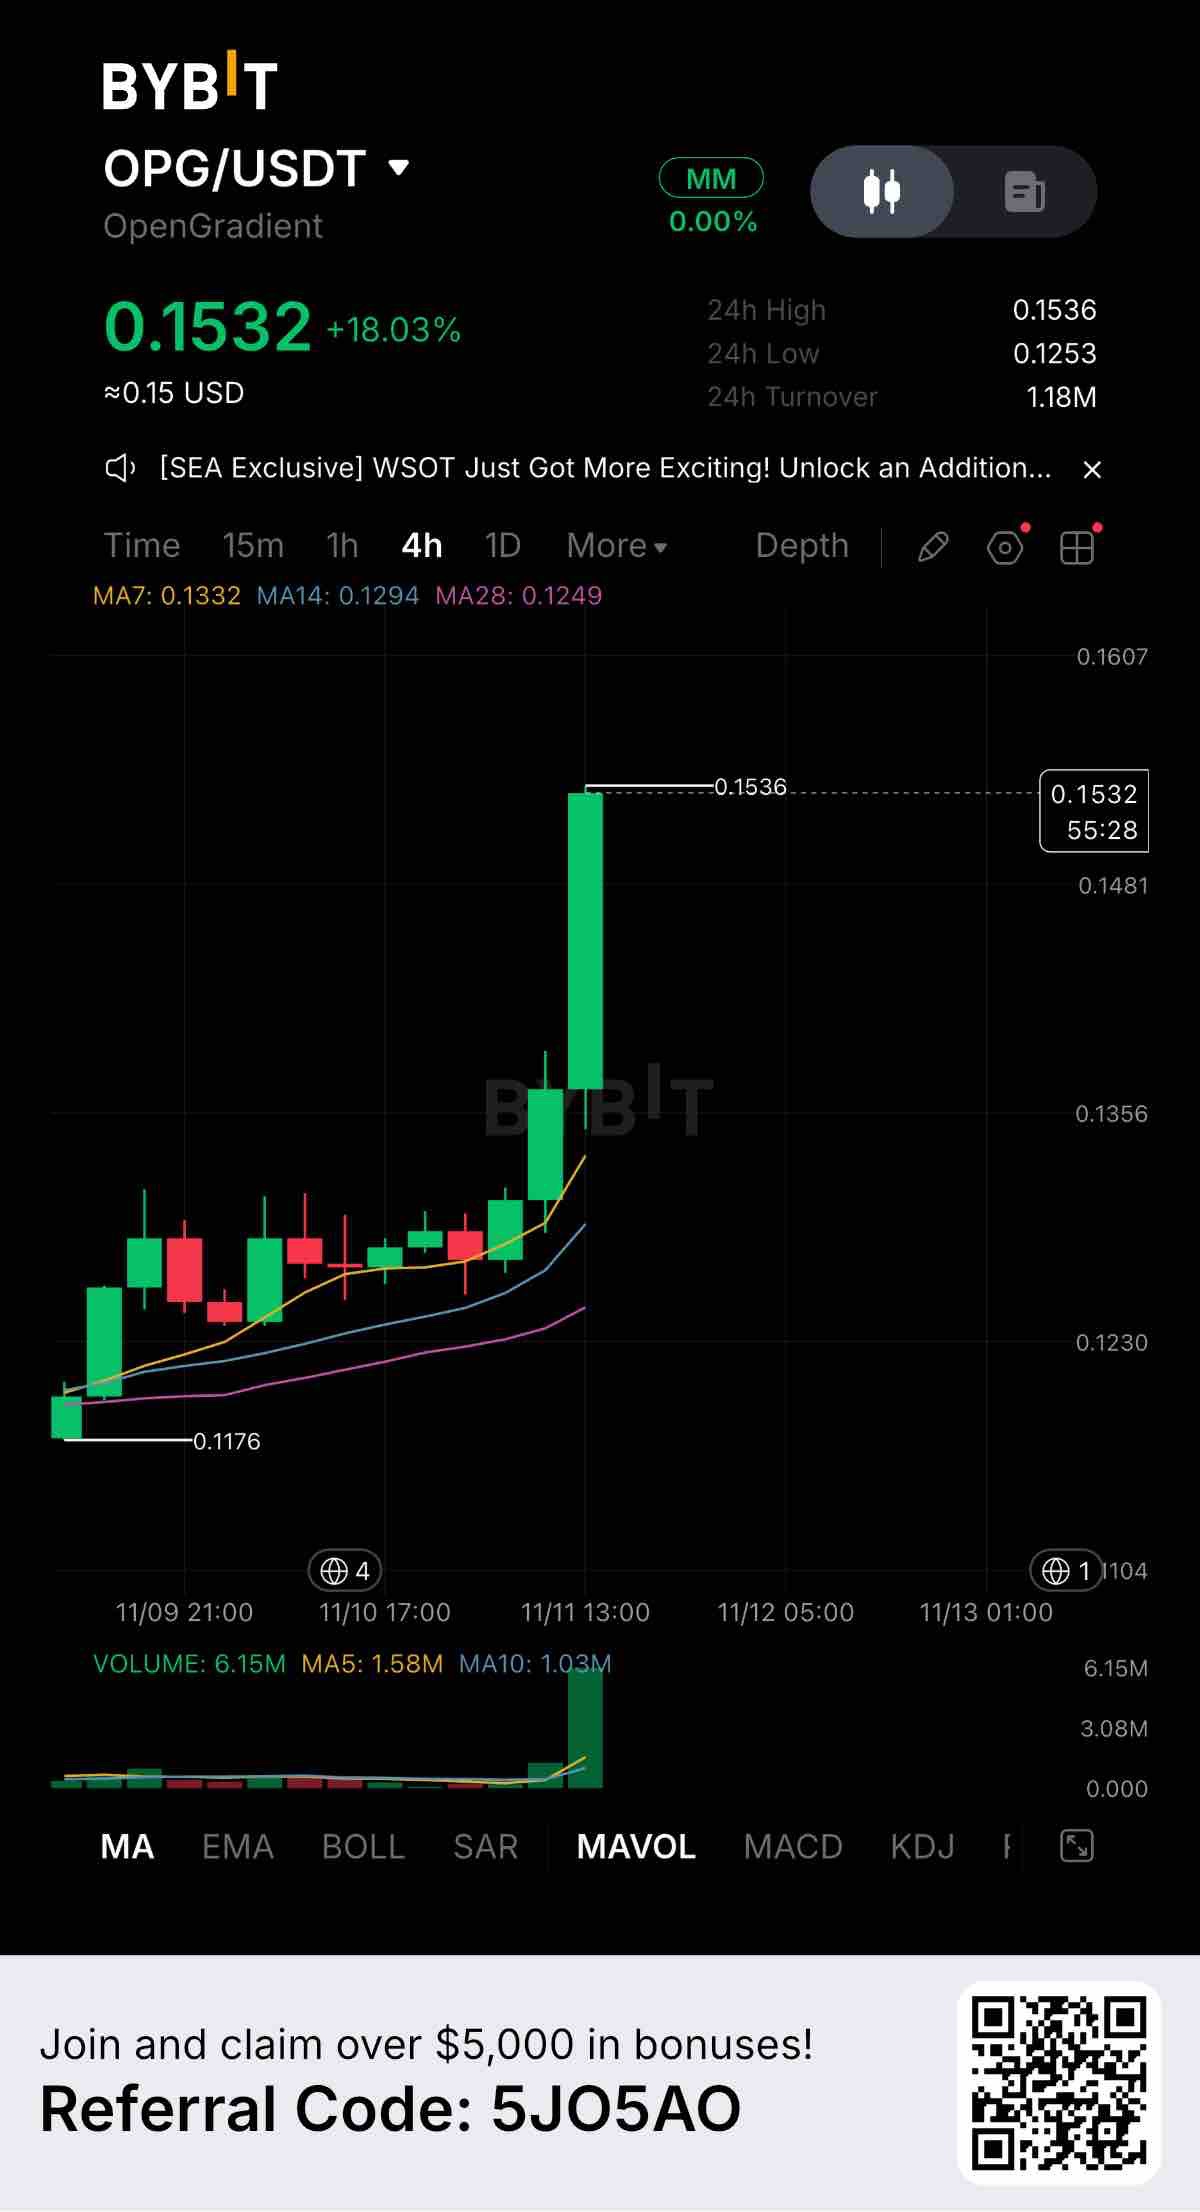
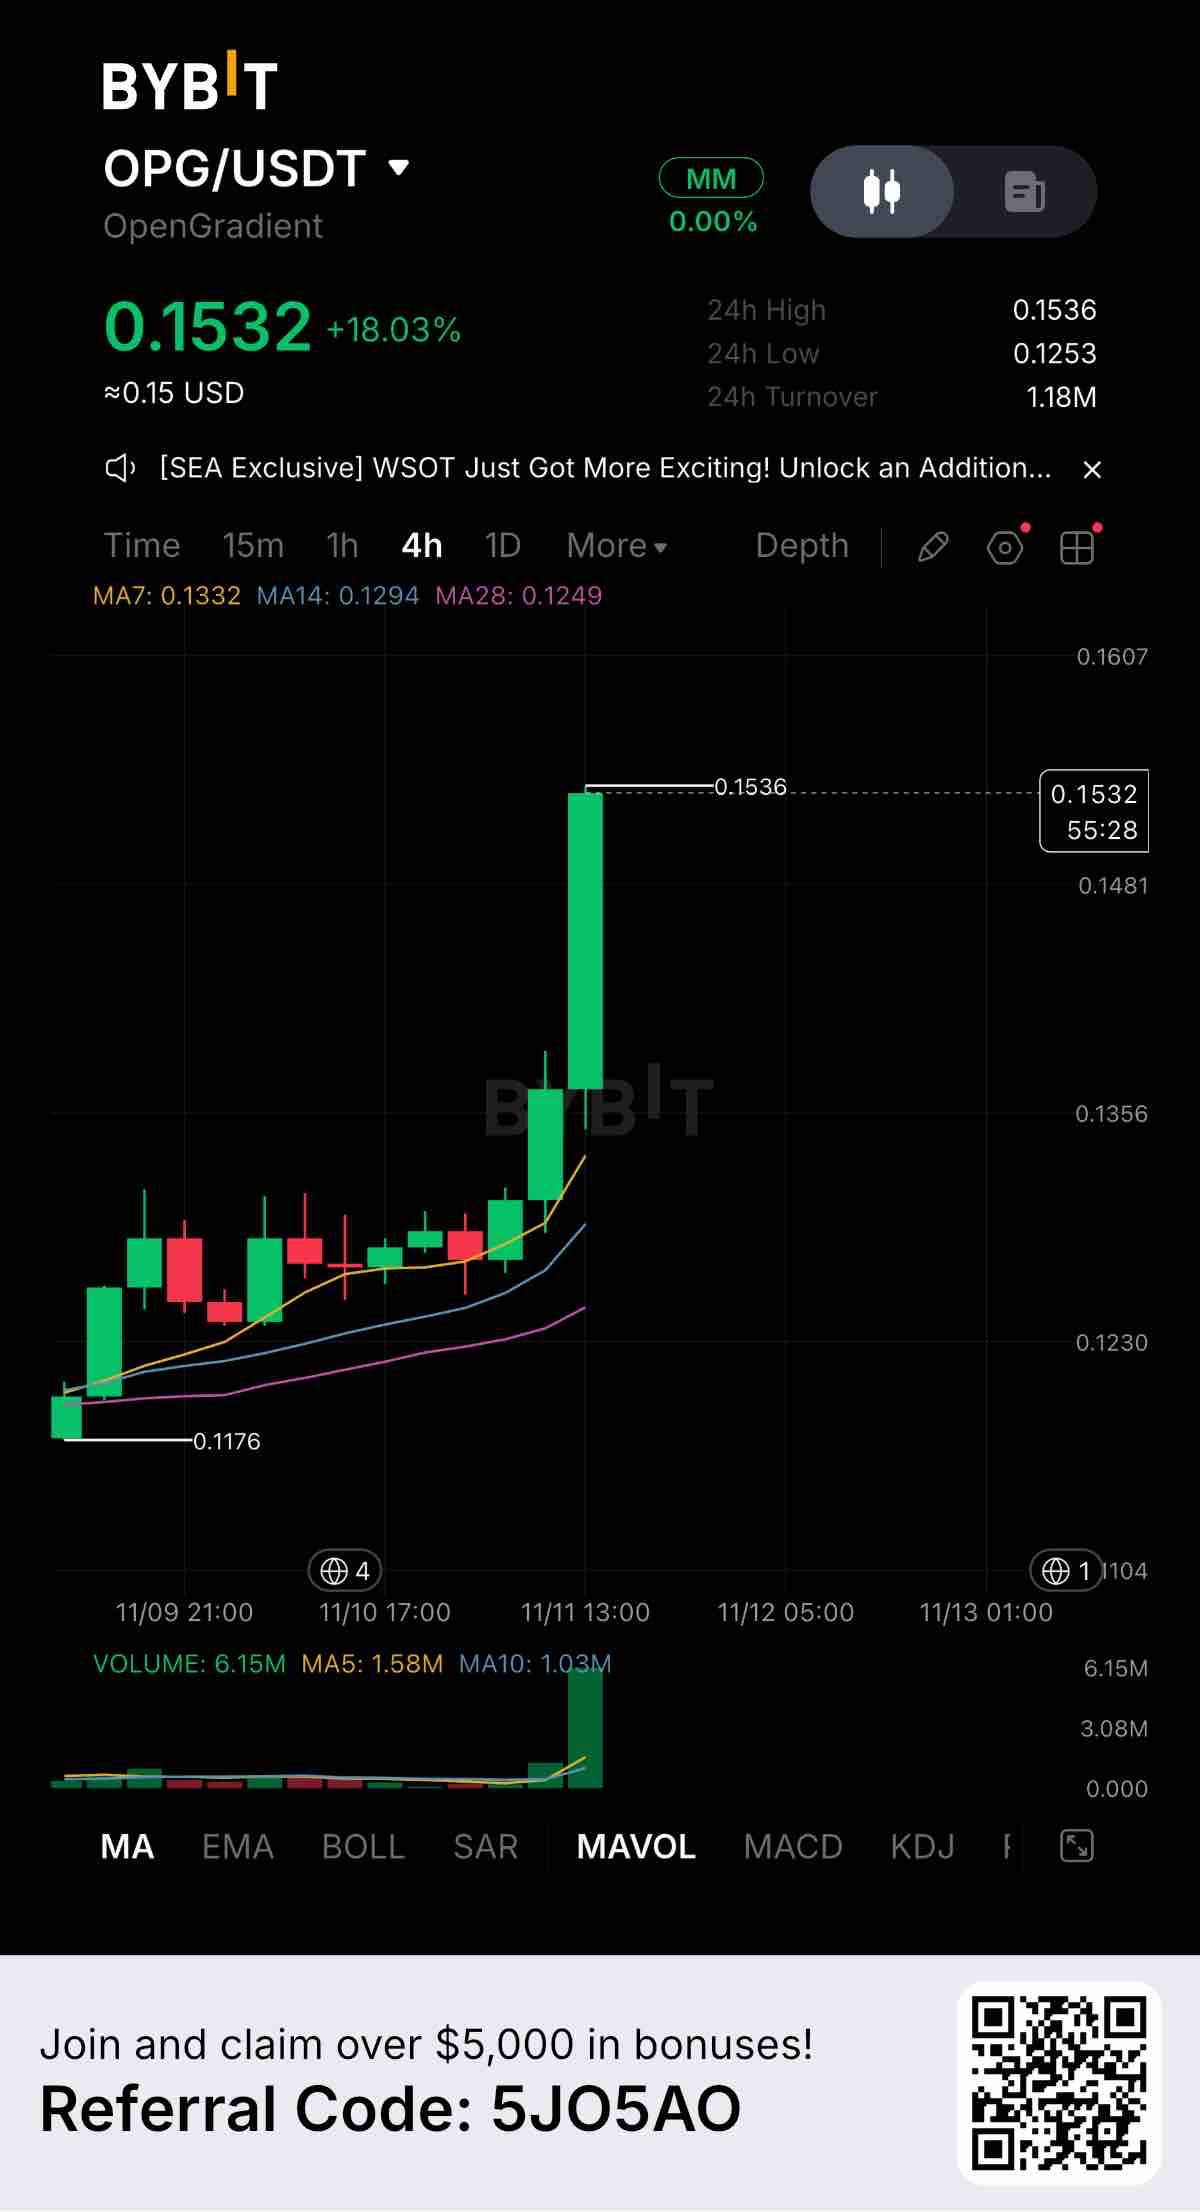
$OPGUSDT is making a massive statement today, currently trading at 0.1532 with an explosive +18.03% gain over the past 24 hours. The 4-hour chart is showing a textbook vertical breakout, and the volume confirms real money is entering the market. Key Levels to Watch: Resistance: 0.1536 (The current 24-hour high, being tested right now) Support 1: 0.1332 (7-day MA, first downside cushion) Support 2: 0.1253 (24-hour low, stronger structural floor) Looking at the moving averages, price is trading far above MA7, MA14, and MA28. This tells us momentum is incredibly fierce, but also means the asset is highly extended. Chasing a green candle this big carries risk. Volume is the real story here. The massive spike on the 4-hour chart shows strong buying pressure, backed by 1.18M USDT in 24-hour turnover. Fundamentally, OpenGradient (OPG) is capturing heavy market attention right now. Moves like this are usually driven by ecosystem developments or community momentum, and the volume proves capital is rotating in. If buyers manage to break and hold above 0.1536, we could see immediate price discovery. However, if sellers reject this level, waiting for a retest toward 0.1332 is the safer play. Are you riding this momentum or waiting for a pullback? Drop your thoughts below. #ByXIMPACT #WSOT2026
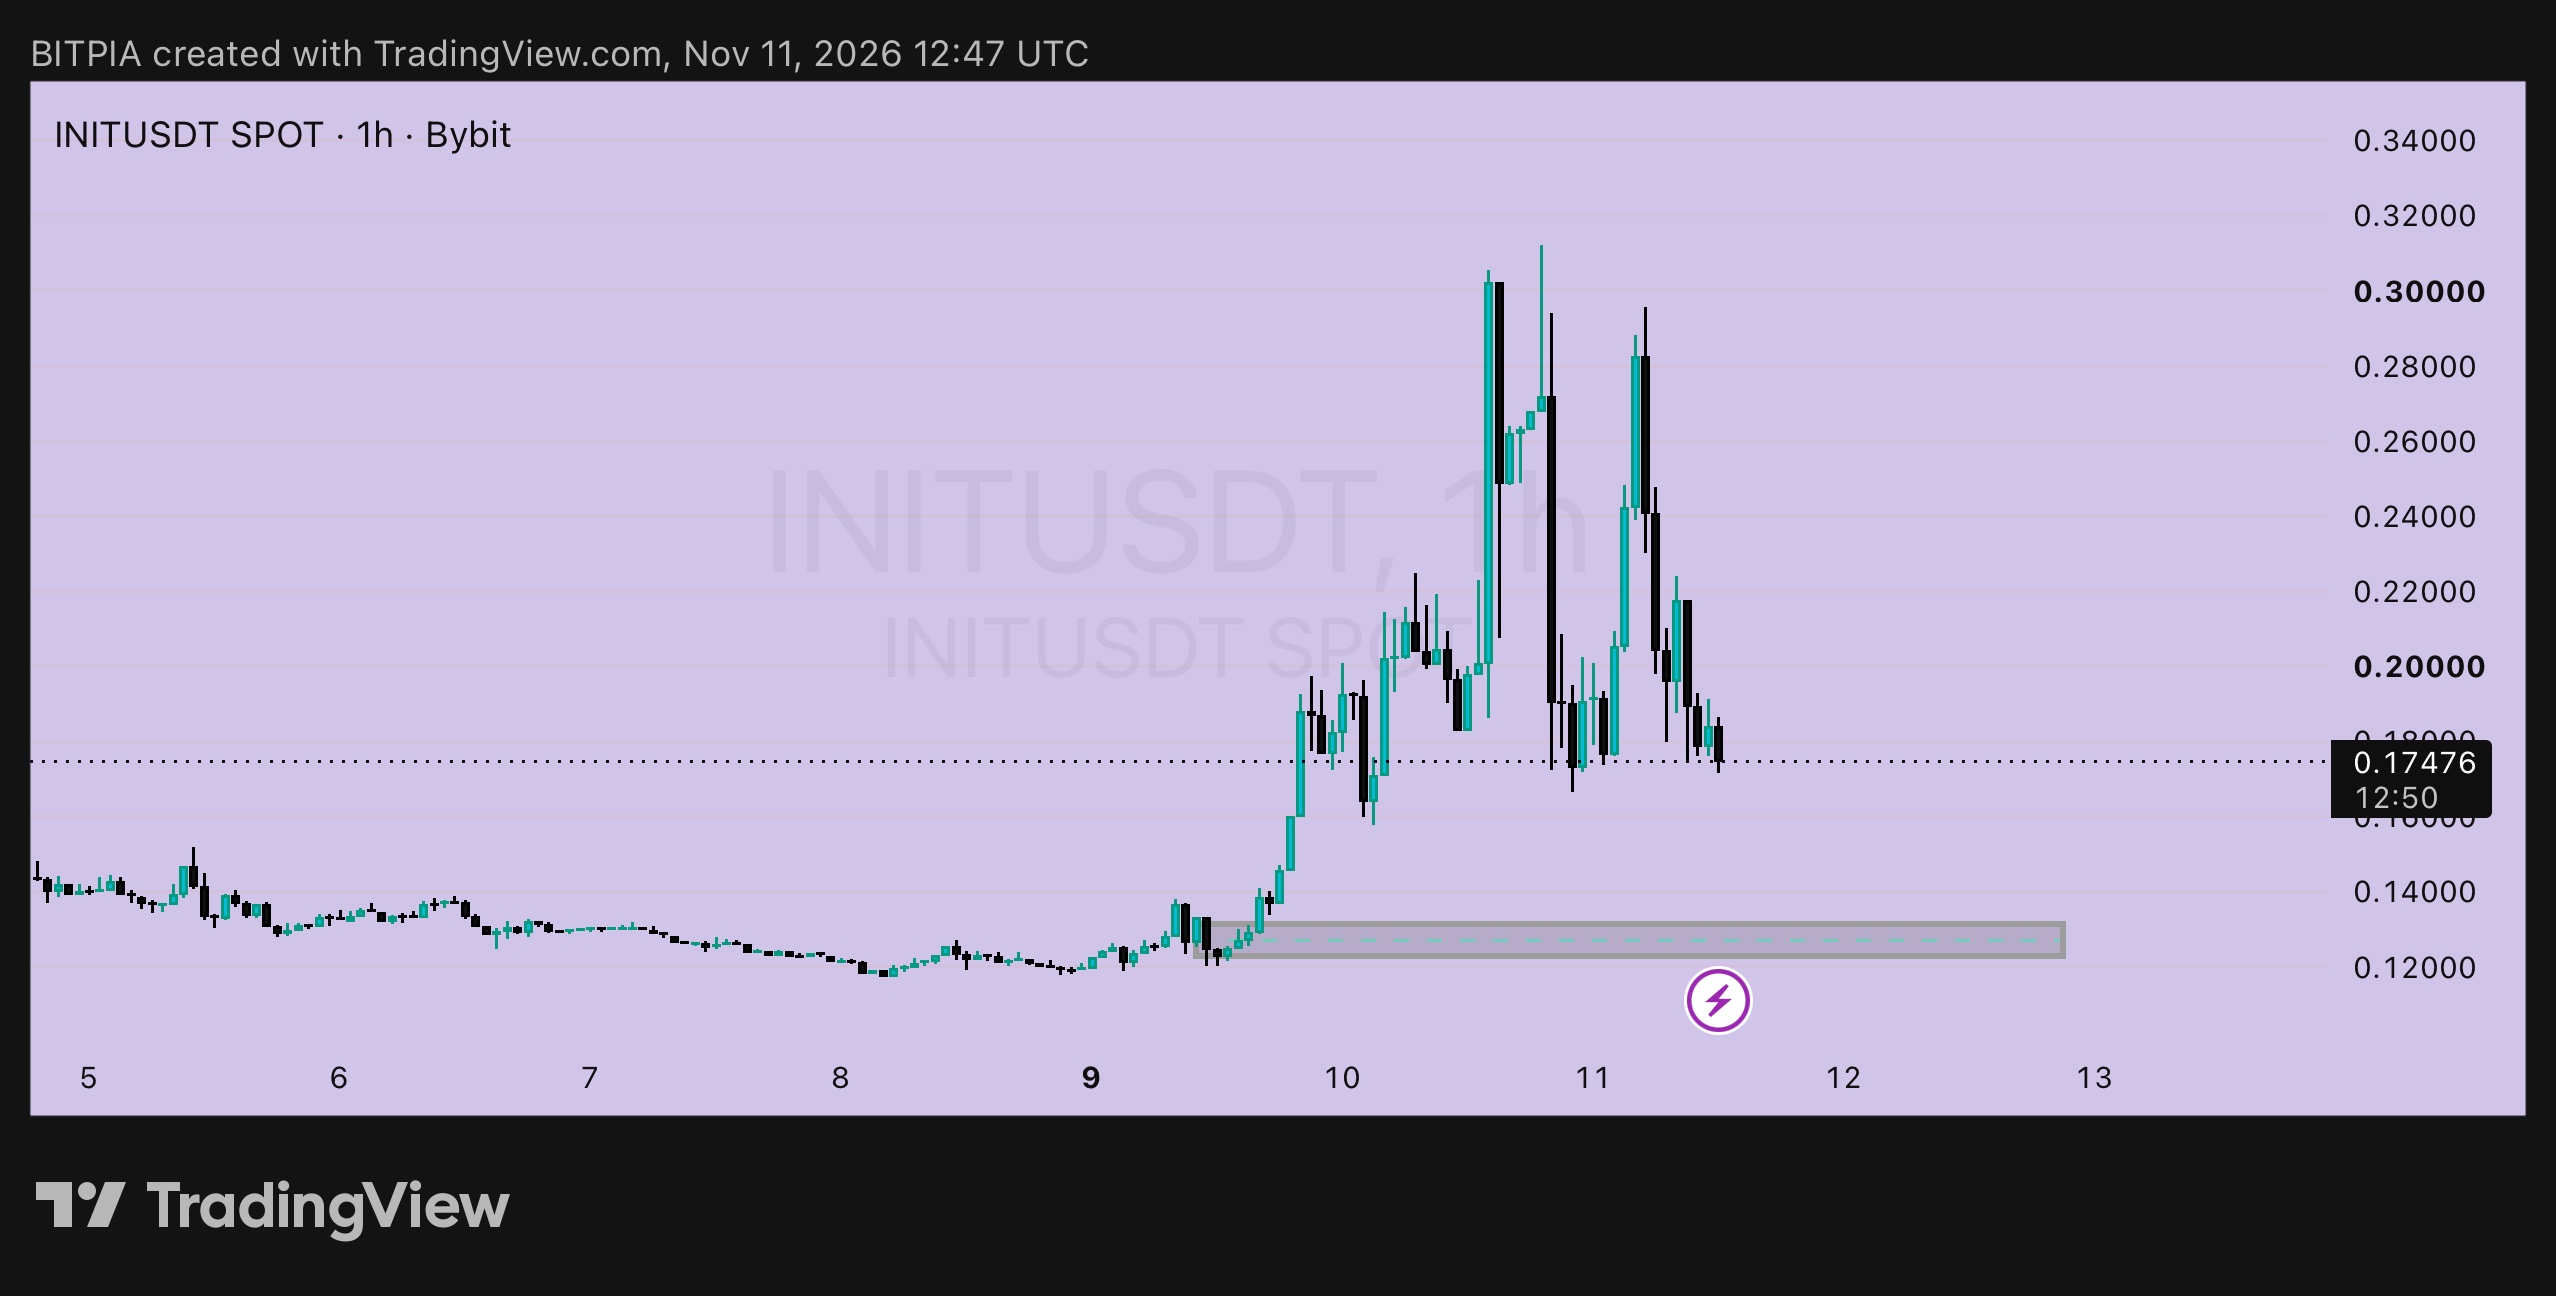
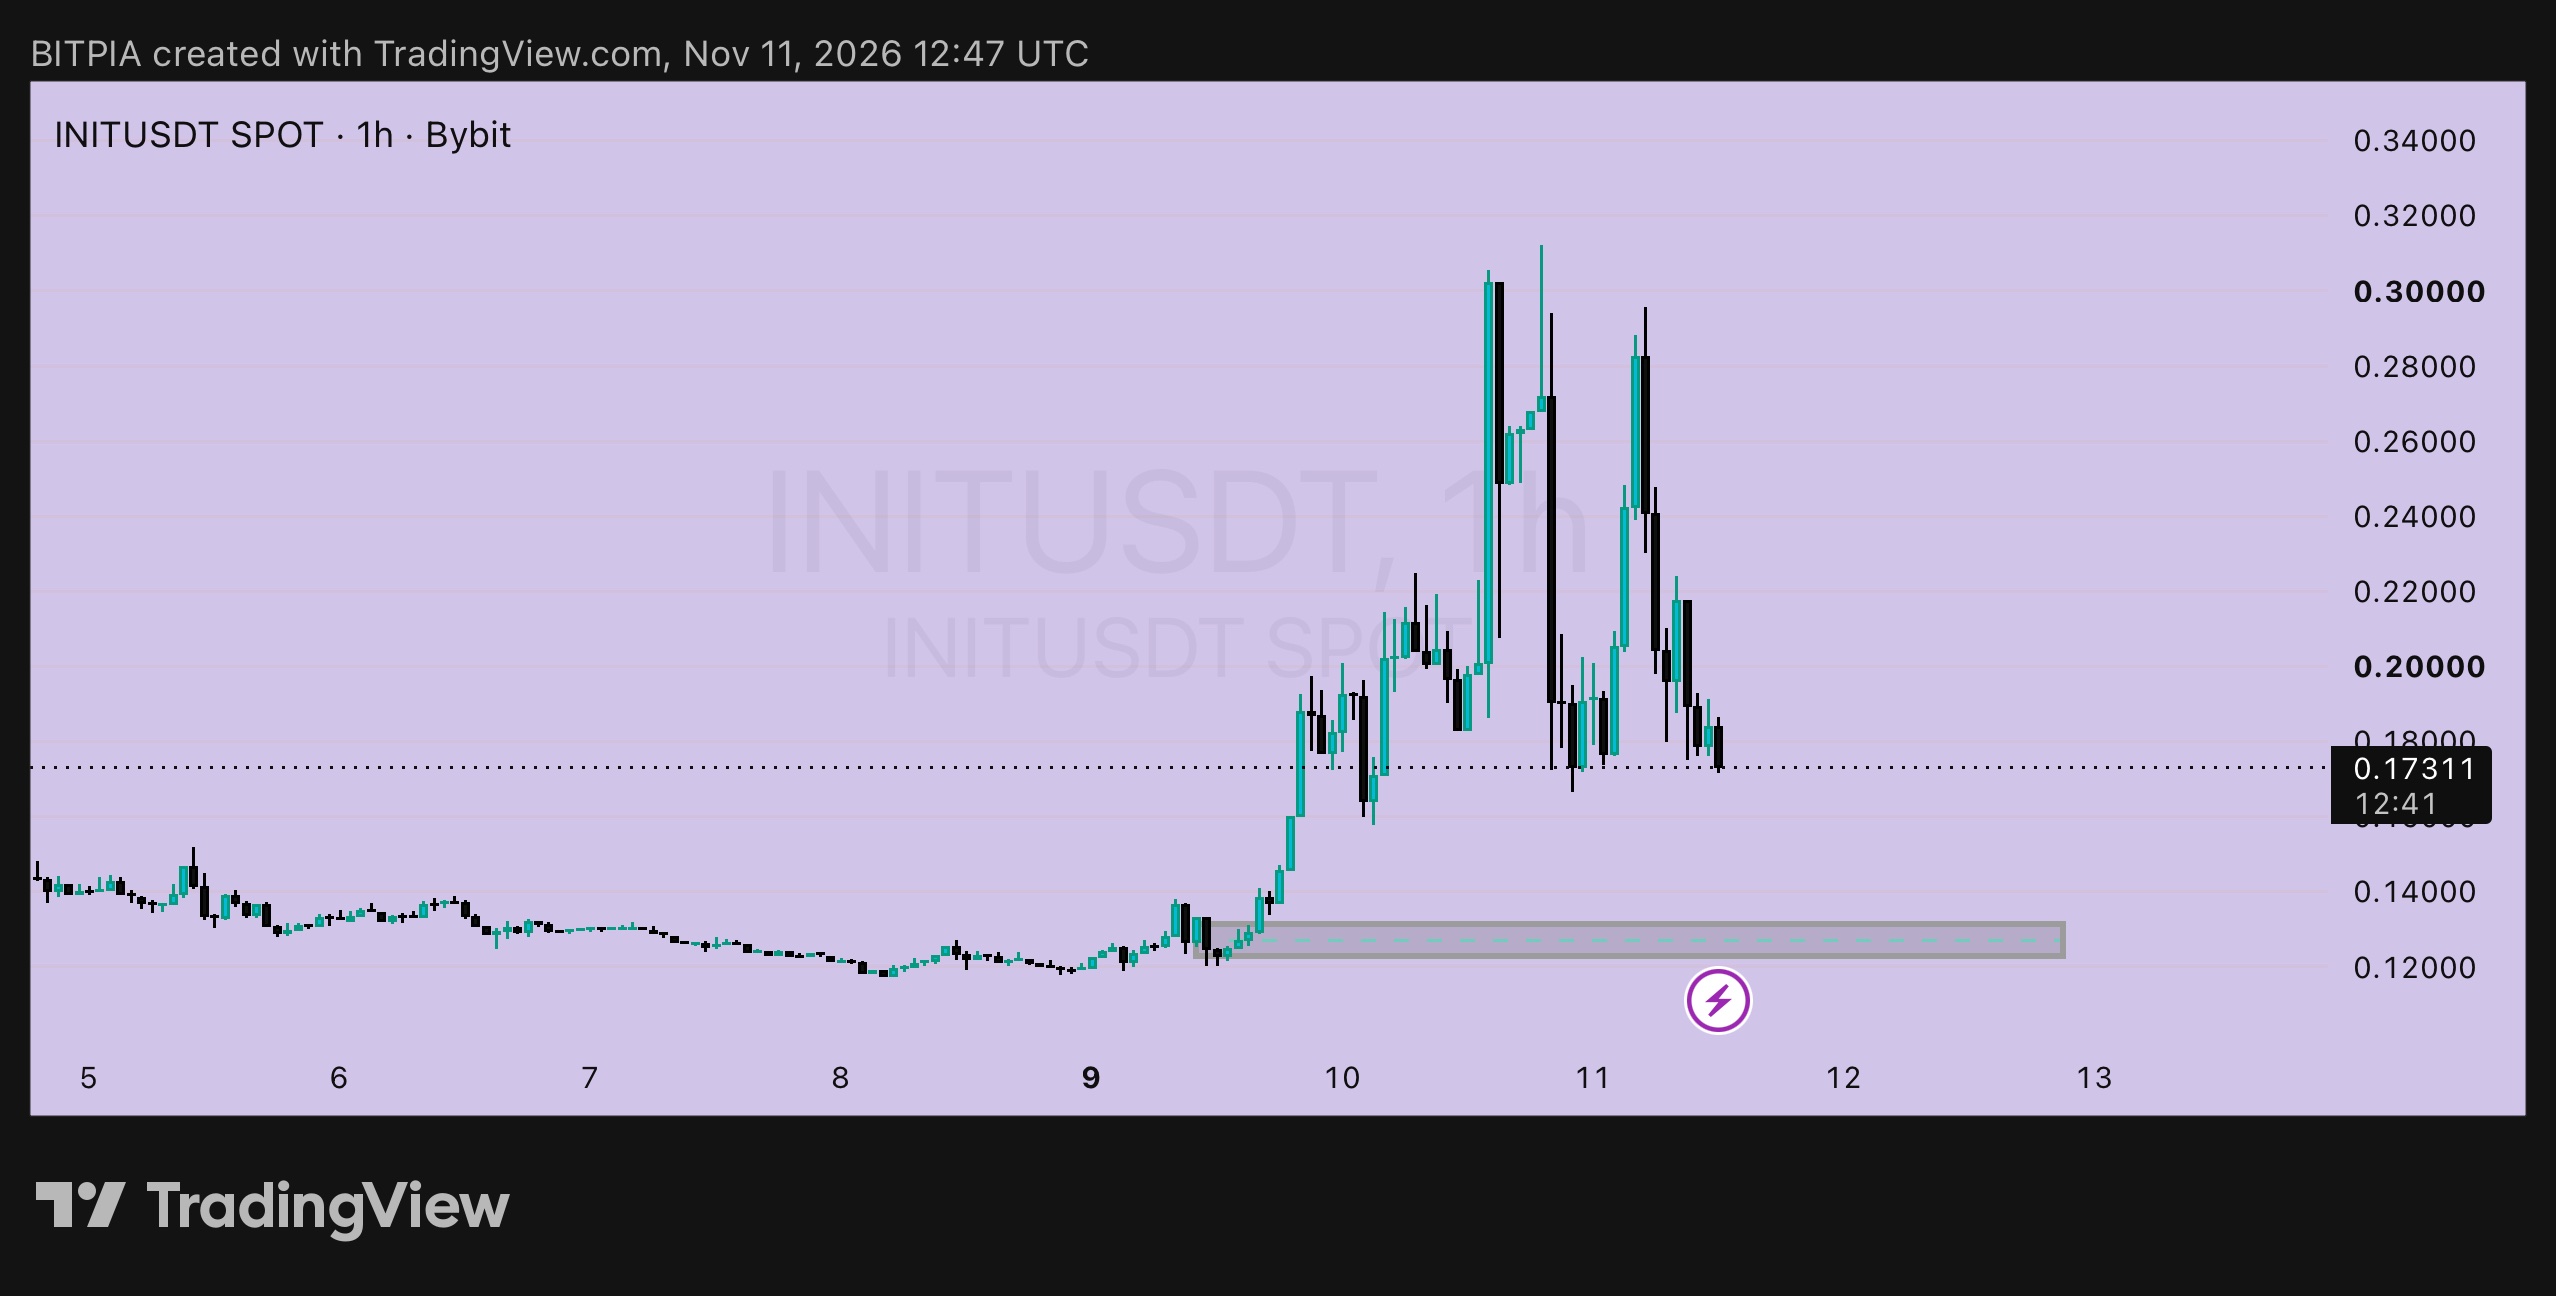
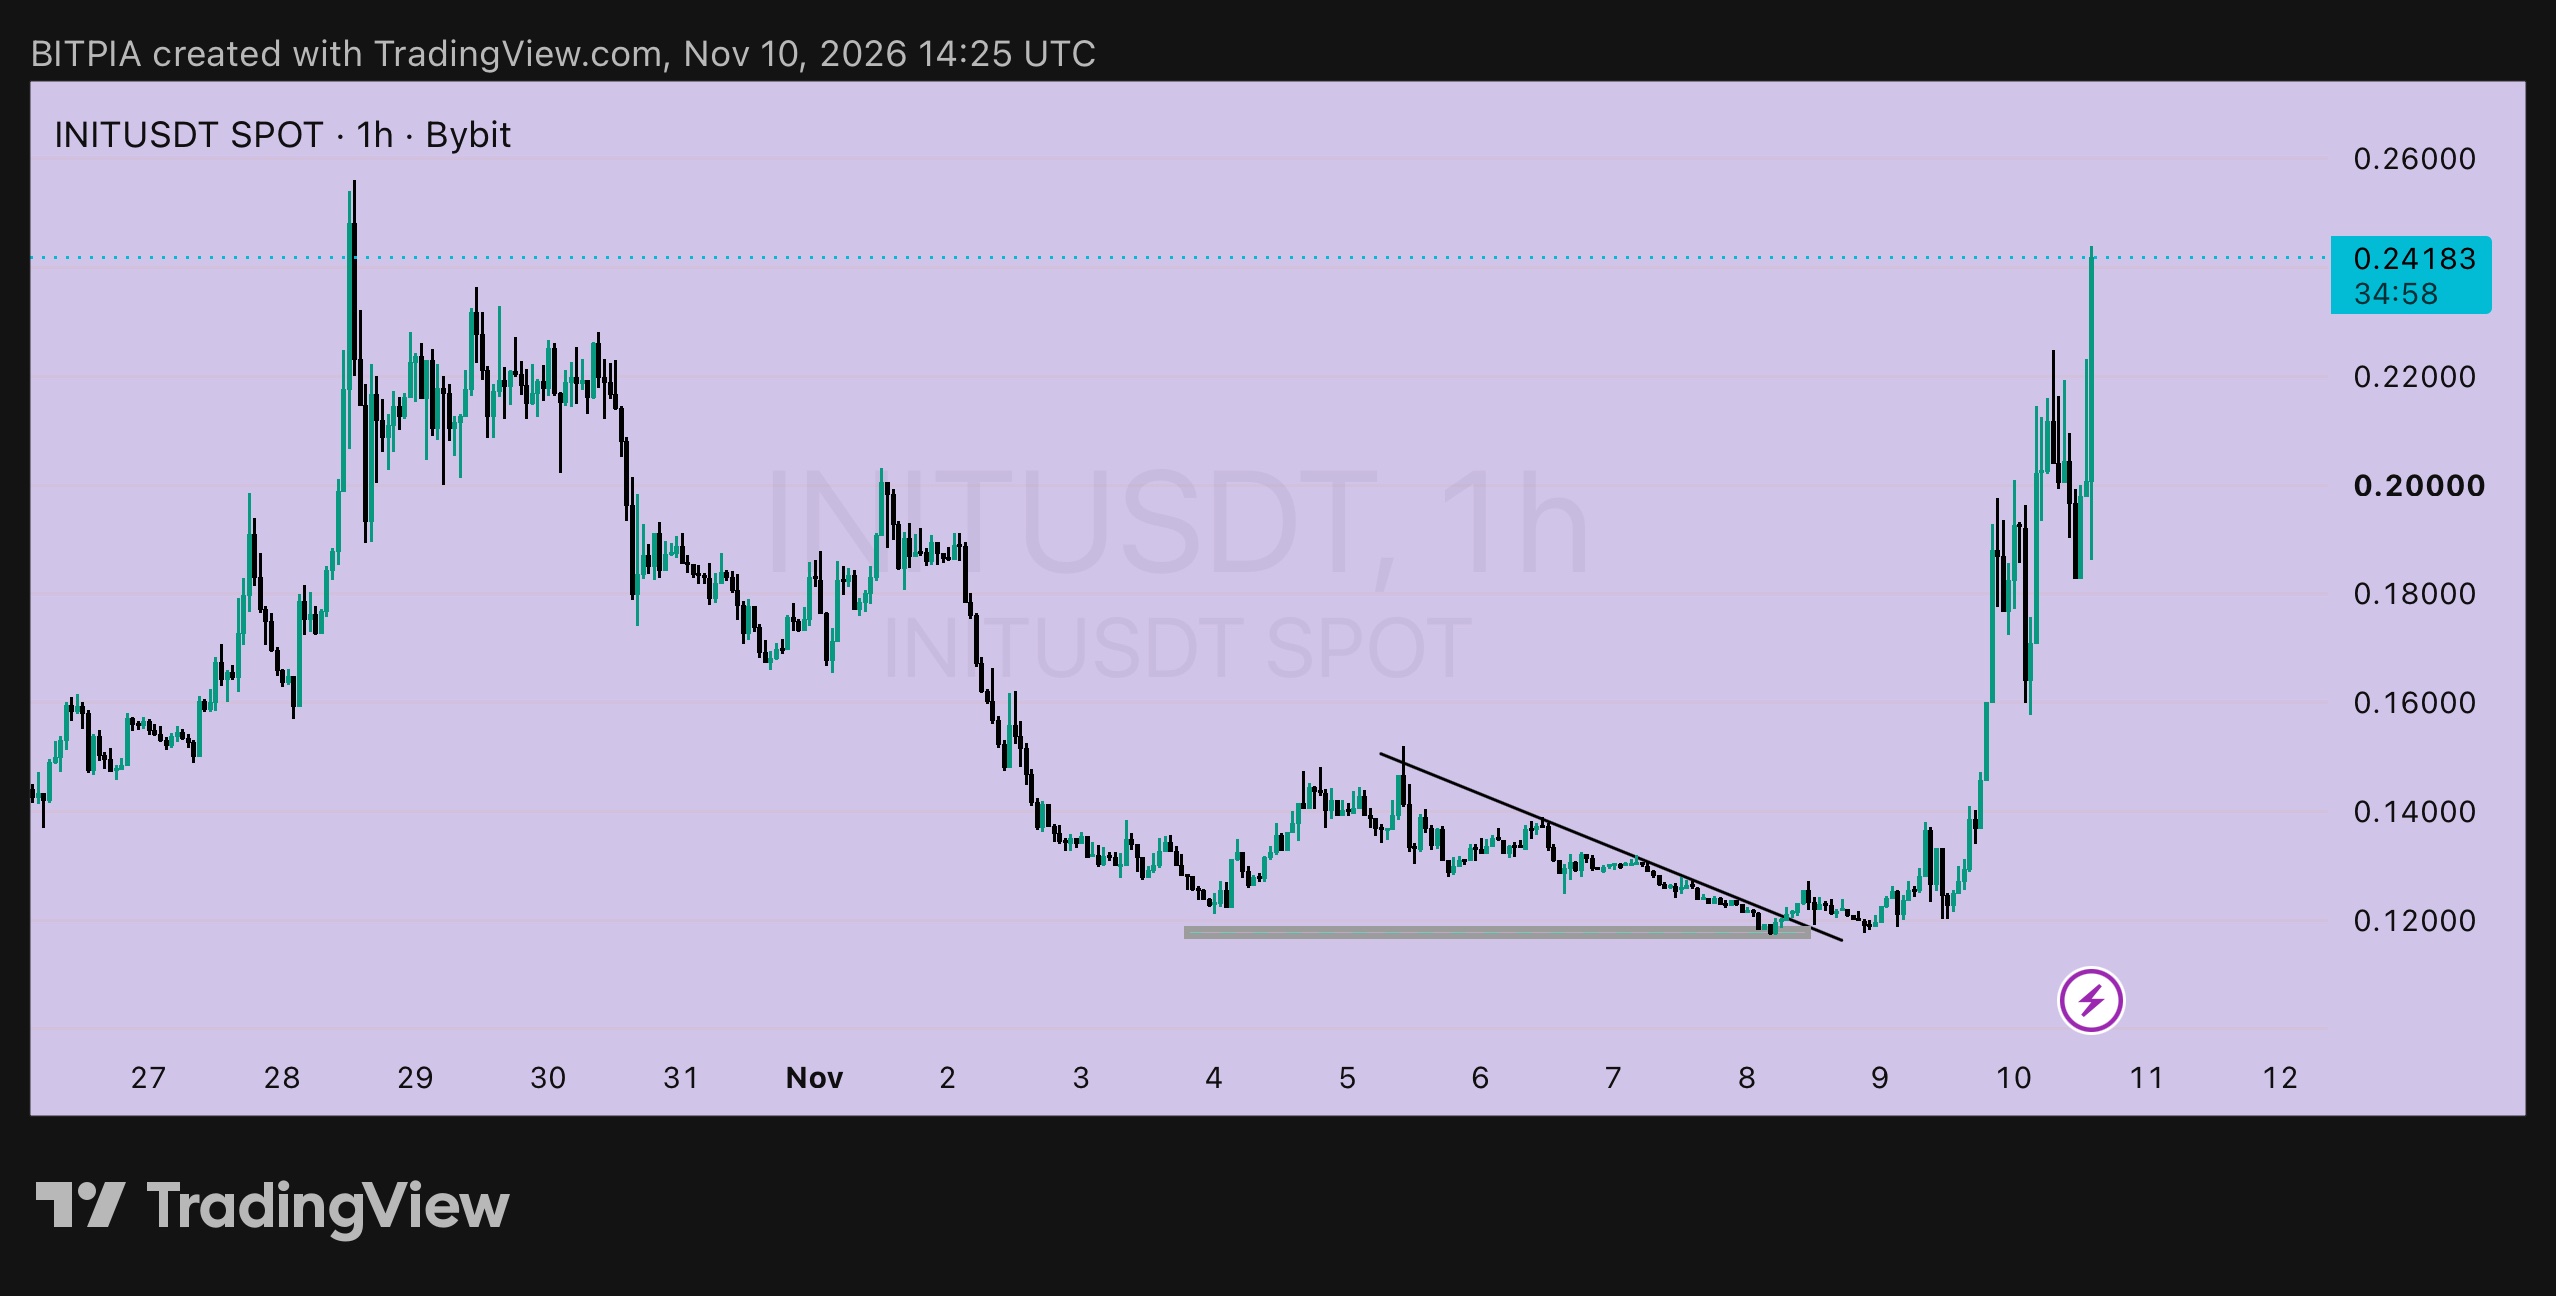
INIT 1h: closing the books 🧾 My last $INITUSDT post was at 0.24183 on Nov 10, with a plan to sell half near 0.2400 to 0.2500 and trail the stop on the rest to about 0.1800. Price went to about 0.312, fell back, made a second peak near 0.295, and is now 0.17311, under the trailing stop. Here's the receipt. ➤ The trade ▸ Entry (Door 2): 0.1200, risk 0.0050 ▸ First half: sold near 0.2400 to 0.2500, roughly 24R to 26R on that half ▸ Second half: stopped near 0.1800, roughly 12R on that half ▸ Blended result: around 18R on the whole position. A great outcome, even with a trailing stop catching the dip ➤ The honest part Price went well past my first sell zone, up to about 0.312, so selling near 0.2400 left some on the table. That's the price of taking profit before the top. I don't know the top in advance, and neither does anyone else. A 12R to 26R trade is not one I regret. ➤ What the chart says now ▸ The two tall peaks near 0.30 are behind us, and each one was sold into ▸ Price is at 0.1731, with a recent low near 0.160 ▸ The launch zone near 0.125 to 0.132 sits far below, and price may or may not return to it ➤ If you want back in Pullback plan: ▸ Entry: around 0.1650, only if the 0.160 area holds ▸ Stop-loss: below 0.1500 ▸ Risk per unit: 0.0150 ▸ Targets: 0.2000 (+0.0350, about 2.3R) and 0.2400 (+0.0750, about 5R) Reclaim plan: ▸ Trigger: a 1h close above 0.2000 ▸ Entry: around 0.2050 ▸ Stop-loss: below 0.1800 ▸ Risk per unit: 0.0250 ▸ Targets: 0.2400 (about 1.4R) and 0.2950 (+0.0900, about 3.6R) ➤ What cancels the pullback idea A 1h close under 0.1500 means the 0.160 area has failed, and I'd wait for the 0.125 to 0.132 zone before even thinking about it. Moves like this one are wild in both directions, so small size, and low leverage if you use perps. Not financial advice. Do your own research and only risk what you can afford to lose. #ByXIMPACT #WSOT2026
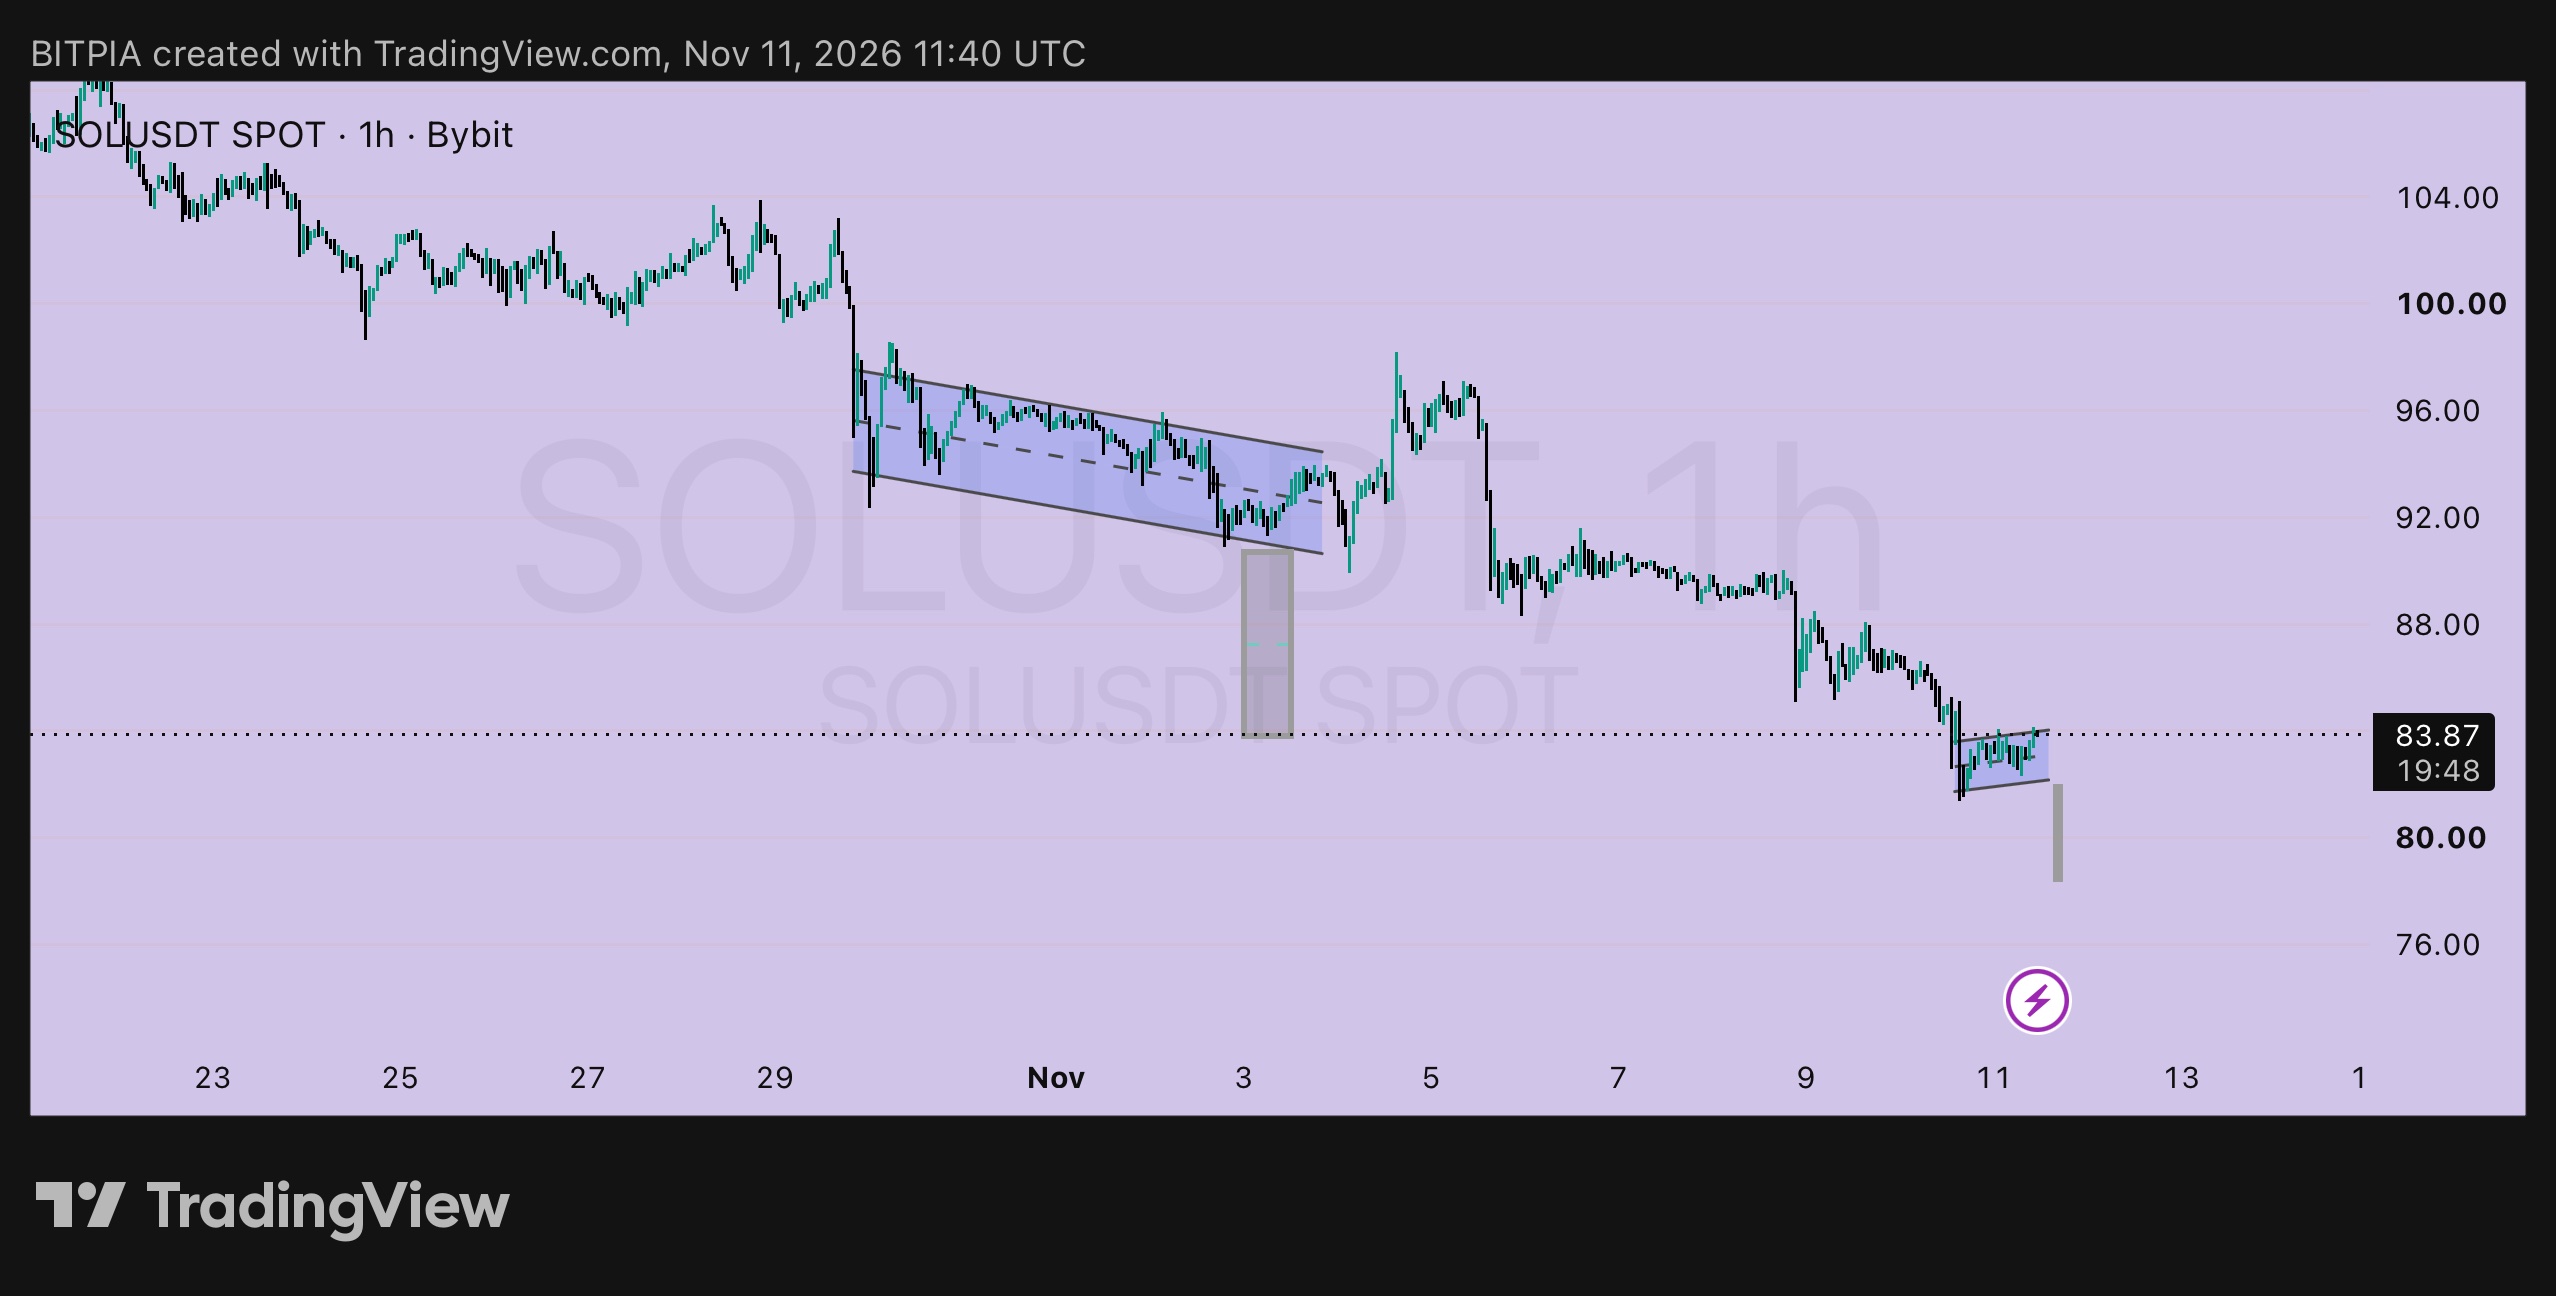
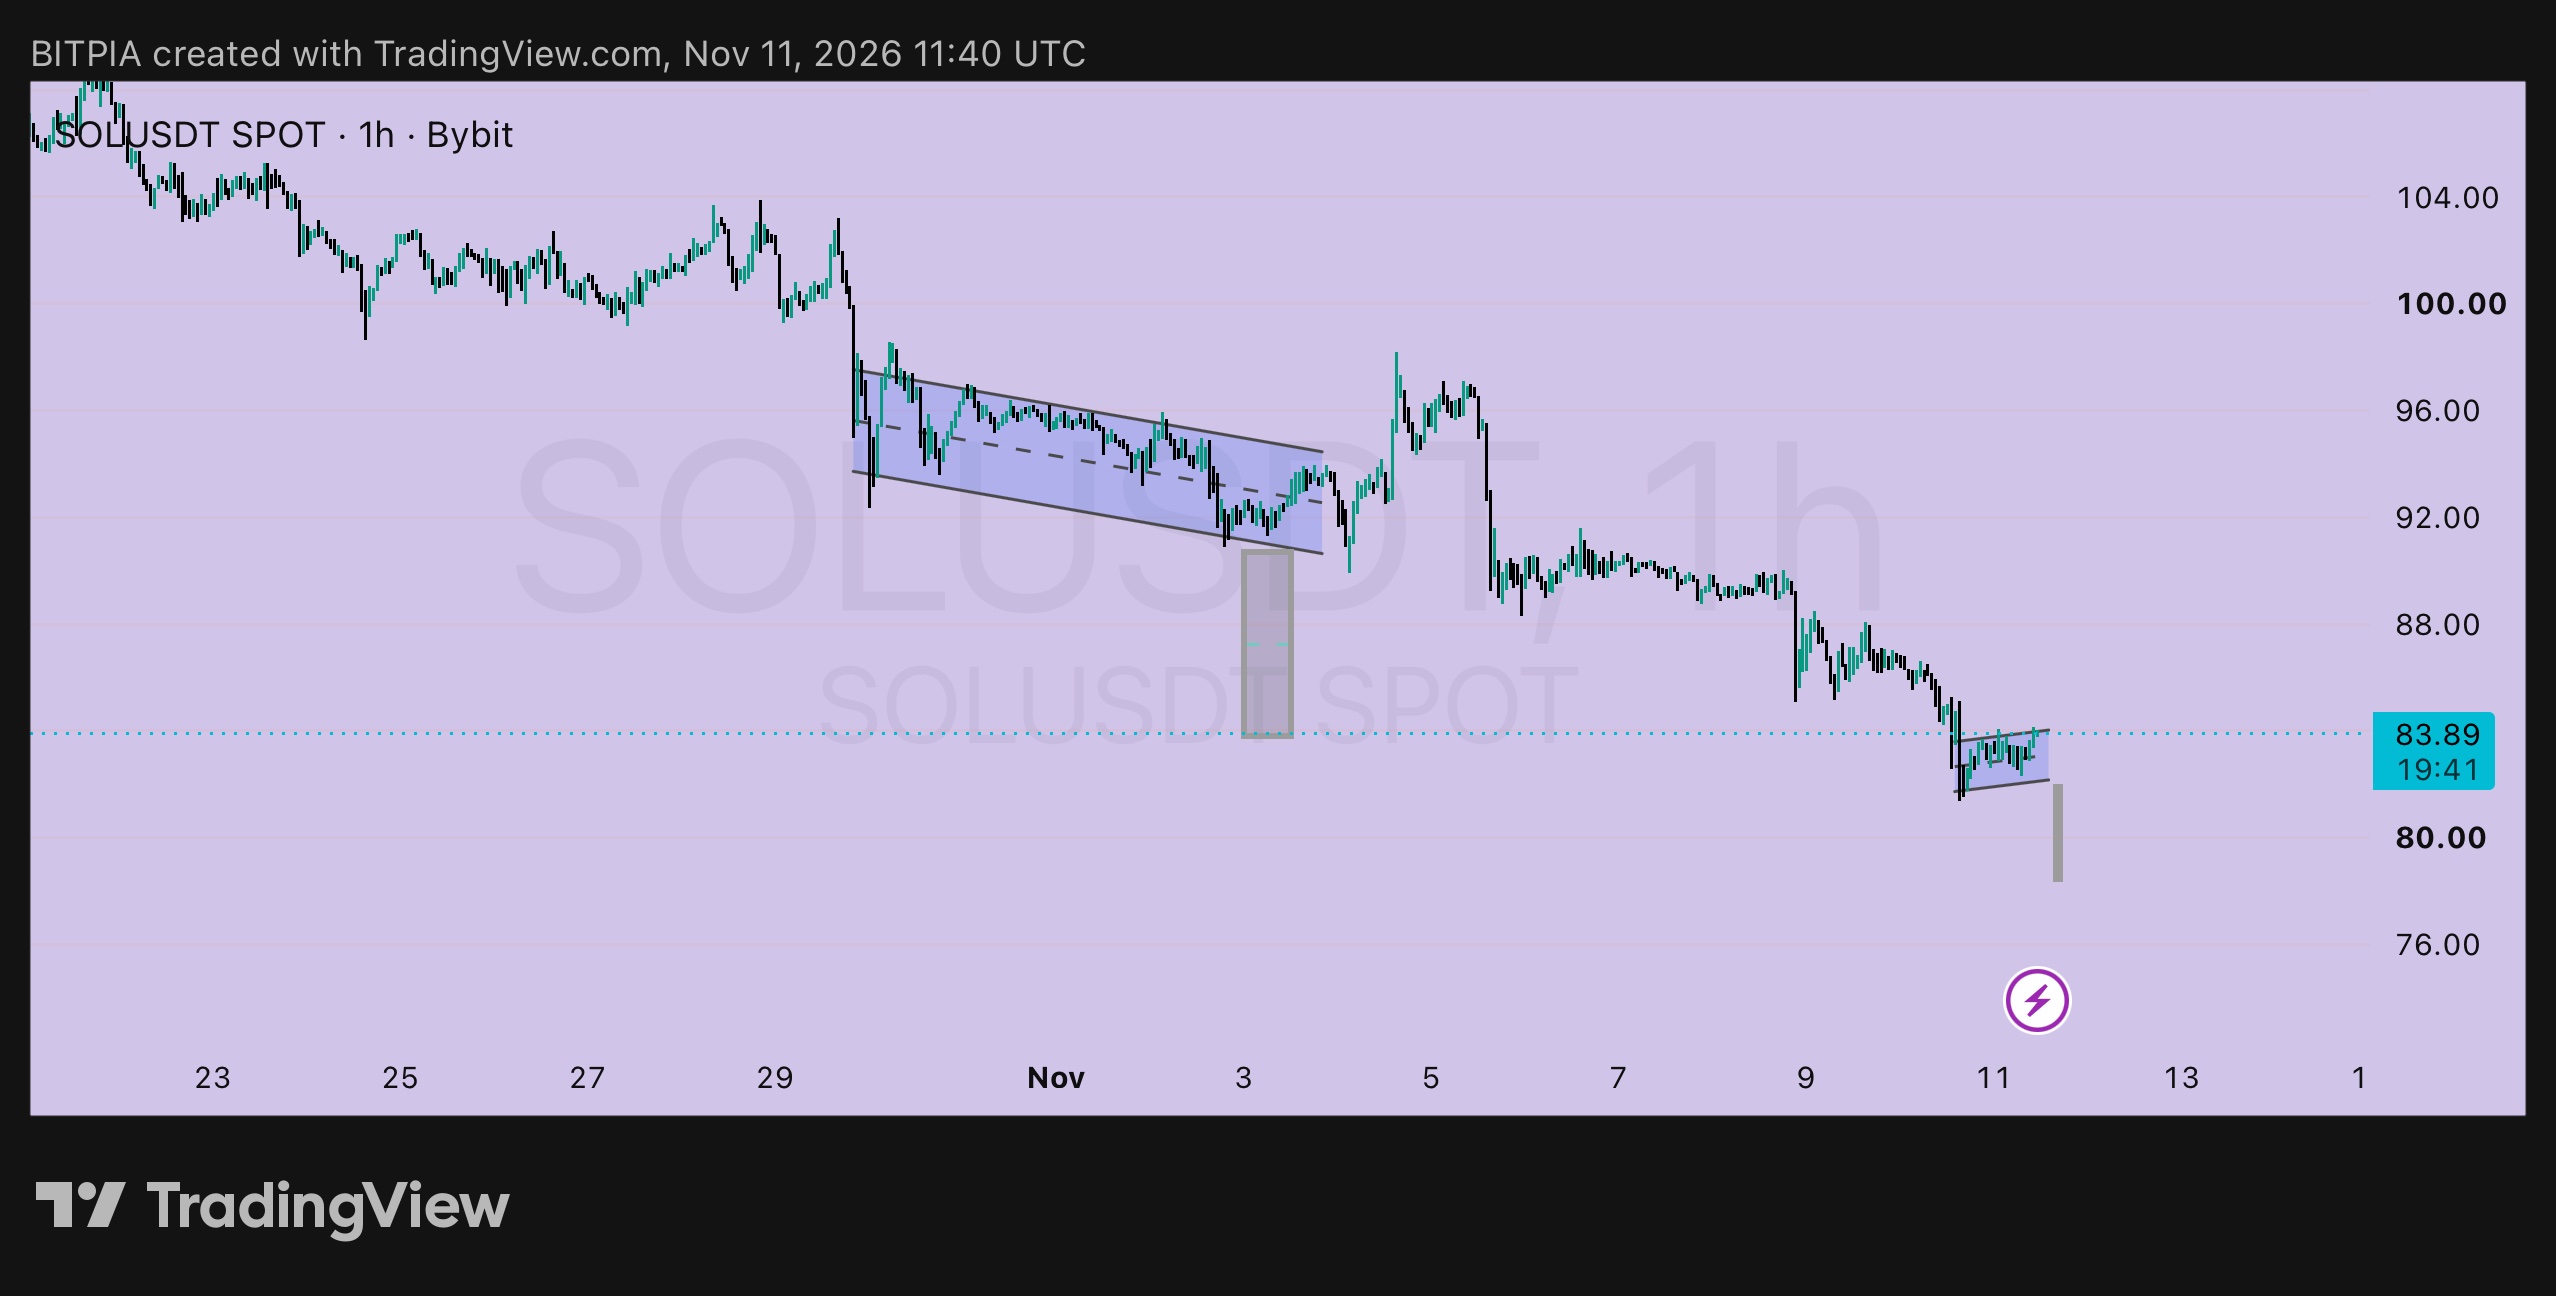
$SOLUSDT 1h: mirror review of my last plan 🪞 On Nov 6 I posted SOL at 89.77 with two sides. Here's what each one did. ➤ Side 1: short on a retest of 91.5 ▸ Plan: entry 91.5, stop above 94.0, targets 86 and 84 ▸ Result: price retested the area, then rolled over, and now trades at 83.89 ▸ Both targets were reached, about 3R from the entry for anyone who took it on a perp ➤ Side 2: long near 85 ▸ Plan: entry 85, stop below 82.5 ▸ Result: price went through 85 and made a low near 81.5, so the stop was hit ▸ Loss: about 1R. The 84 to 86 zone I expected didn't hold One side paid and the other cost me a small, planned loss. That's the reason I post both. ➤ What the chart says now ▸ Price is in a small flag on the 1h chart, roughly 82 to 84, after the move down ▸ The measured move from that flag points to about 78 ▸ The older channel and the Nov 3 flag target at 84 are both behind us ➤ Plan from here: short side, perps only ▸ Entry: around 84.0, on a retest of the flag top ▸ Stop-loss: above 85.5 ▸ Risk per unit: 1.5 ▸ Targets: 80 (+4, about 2.7R) and 78 (+6, about 4R) ➤ Plan from here: long side ▸ Trigger: a 1h close above 88 ▸ Entry: around 88.5 ▸ Stop-loss: below 86 ▸ Risk per unit: 2.5 ▸ Targets: 92 (+3.5, about 1.4R) and 96 (+7.5, about 3R) ➤ What cancels the short idea A 1h close above 85.5 means the flag is breaking up, and I'd drop it. For spot traders, the better move is to wait for a base to form, not to catch the move down. Small size, and low leverage on perps. Not financial advice. Do your own research and only risk what you can afford to lose. #ByXIMPACT #WSOT2026
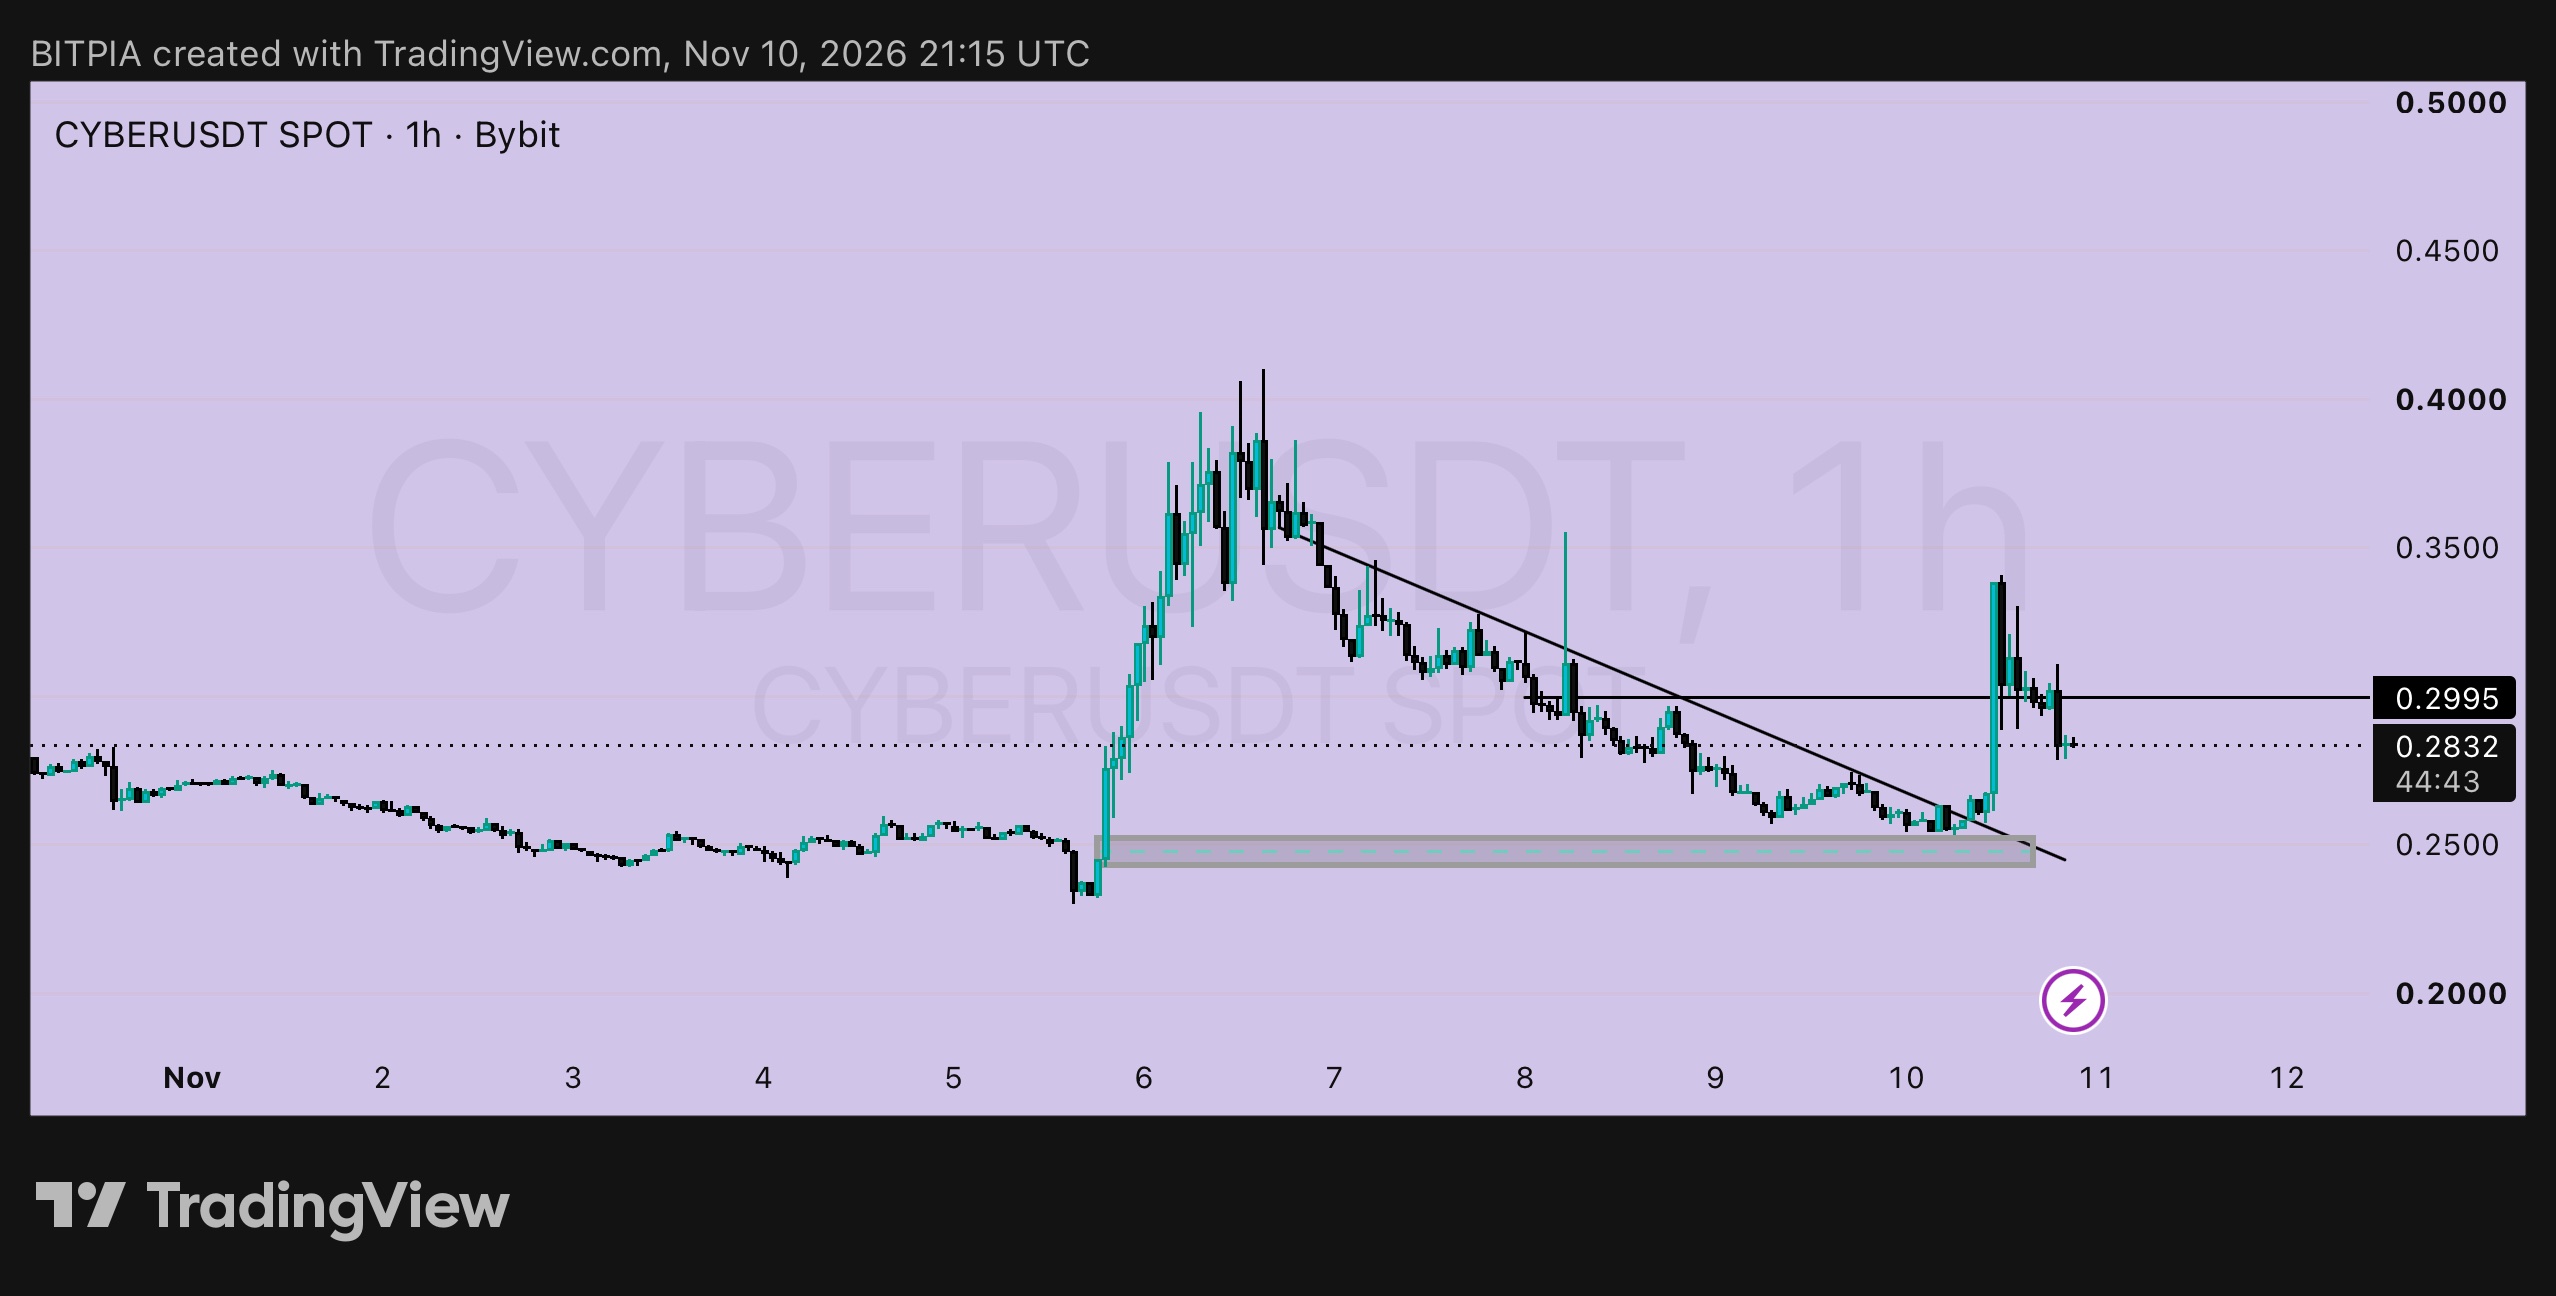
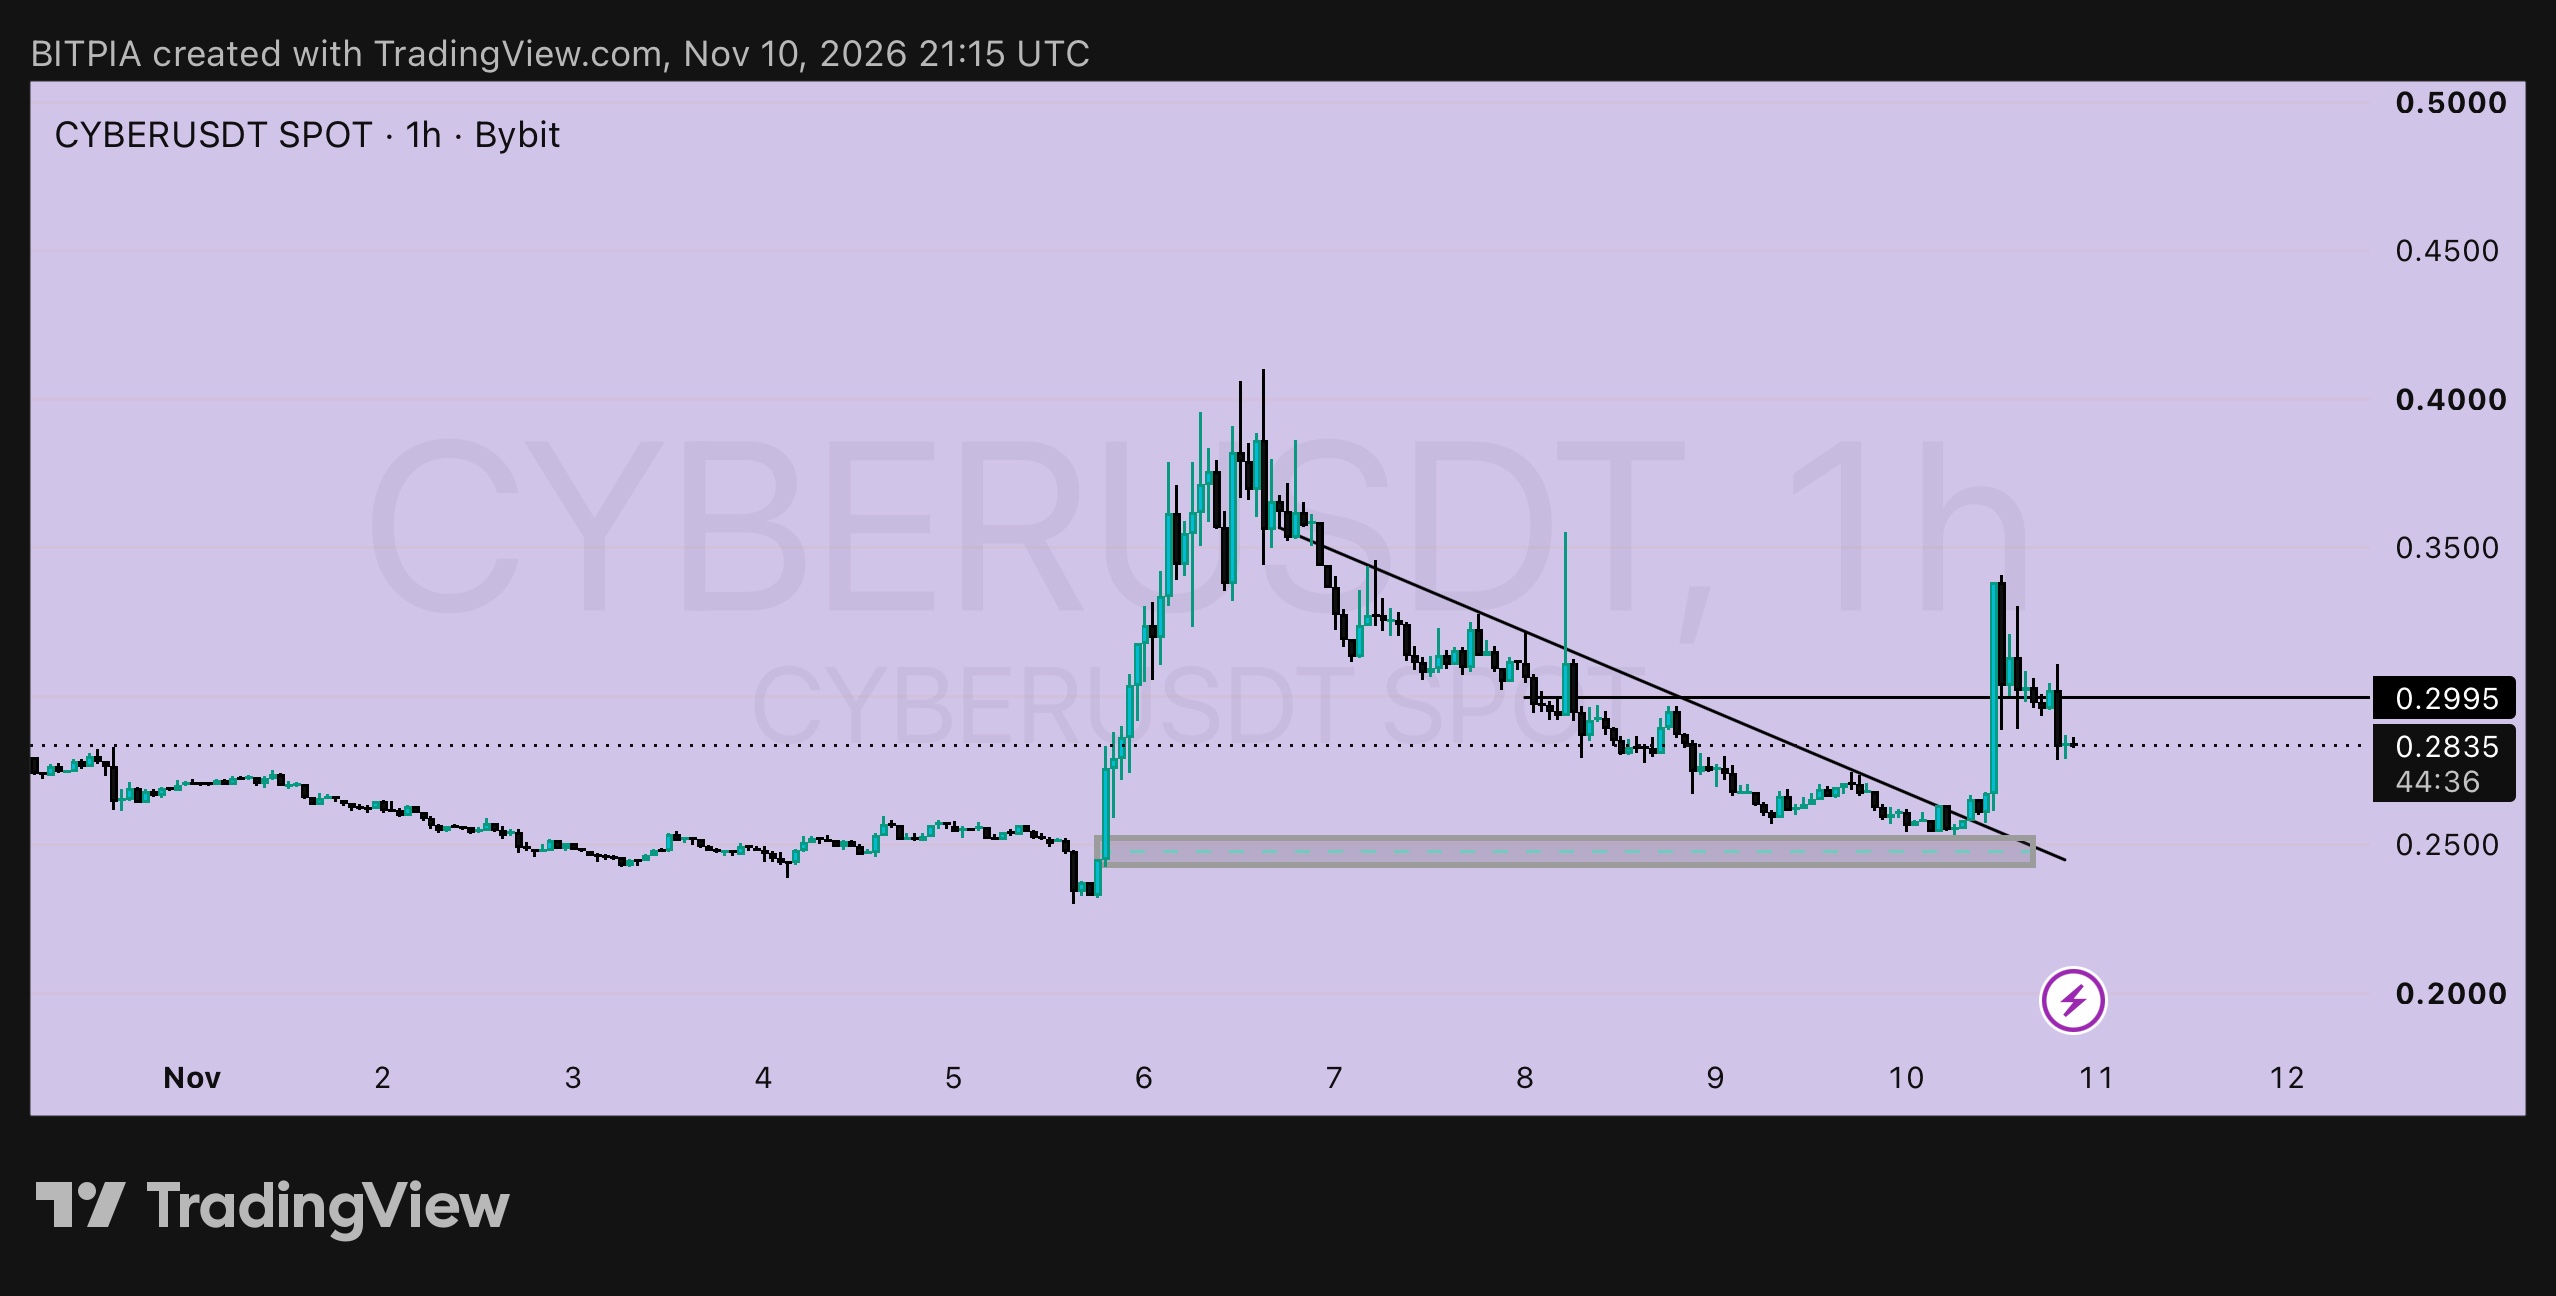
CYBER 1小時線:簡短明瞭 🍬 $CYBERUSDT 今天早上突破了下跌趨勢線並跳升至約 0.345,但隨後回吐了大部分漲幅,滑落至 0.2995 以下。目前價格在 0.2835。無法守住第一阻力位的突破是一個警訊,但還不算失敗。我會等待以下兩個明確訊號之一: ➤ 訊號 1:回測底部 ▸ 進場:約 0.2600,靠近 0.245 至 0.255 的支撐區以及舊趨勢線 ▸ 止損:0.2420 以下 ▸ 每單位風險:0.0180 ▸ 目標 1:0.2995,+0.0395,約 2.2R ▸ 目標 2:0.3450,+0.0850,約 4.7R ➤ 訊號 2:明確收盤於 0.2995 之上 ▸ 進場:約 0.3030 ▸ 止損:0.2800 以下 ▸ 每單位風險:0.0230 ▸ 目標:0.3450(+0.0420,約 1.8R)及 0.4000(+0.0970,約 4.2R) ➤ 為何現在不進場 在 0.2835 的價格,止損設在 0.2420,風險為 0.0415,而上方第一個阻力位僅距 0.0160。這意味著風險回報比不到 0.5。 ➤ 什麼情況會取消計畫 1 小時線收盤跌破 0.2420,意味著支撐區失守,我會選擇觀望。 11 月 6 日接近 0.41 的高點顯示這隻幣波動極快,雙向皆然。請小倉位操作,若使用永續合約請保持低槓桿。 非投資建議。請自行研究,僅投入你能承受損失的資金。 #ByXIMPACT #WSOT2026
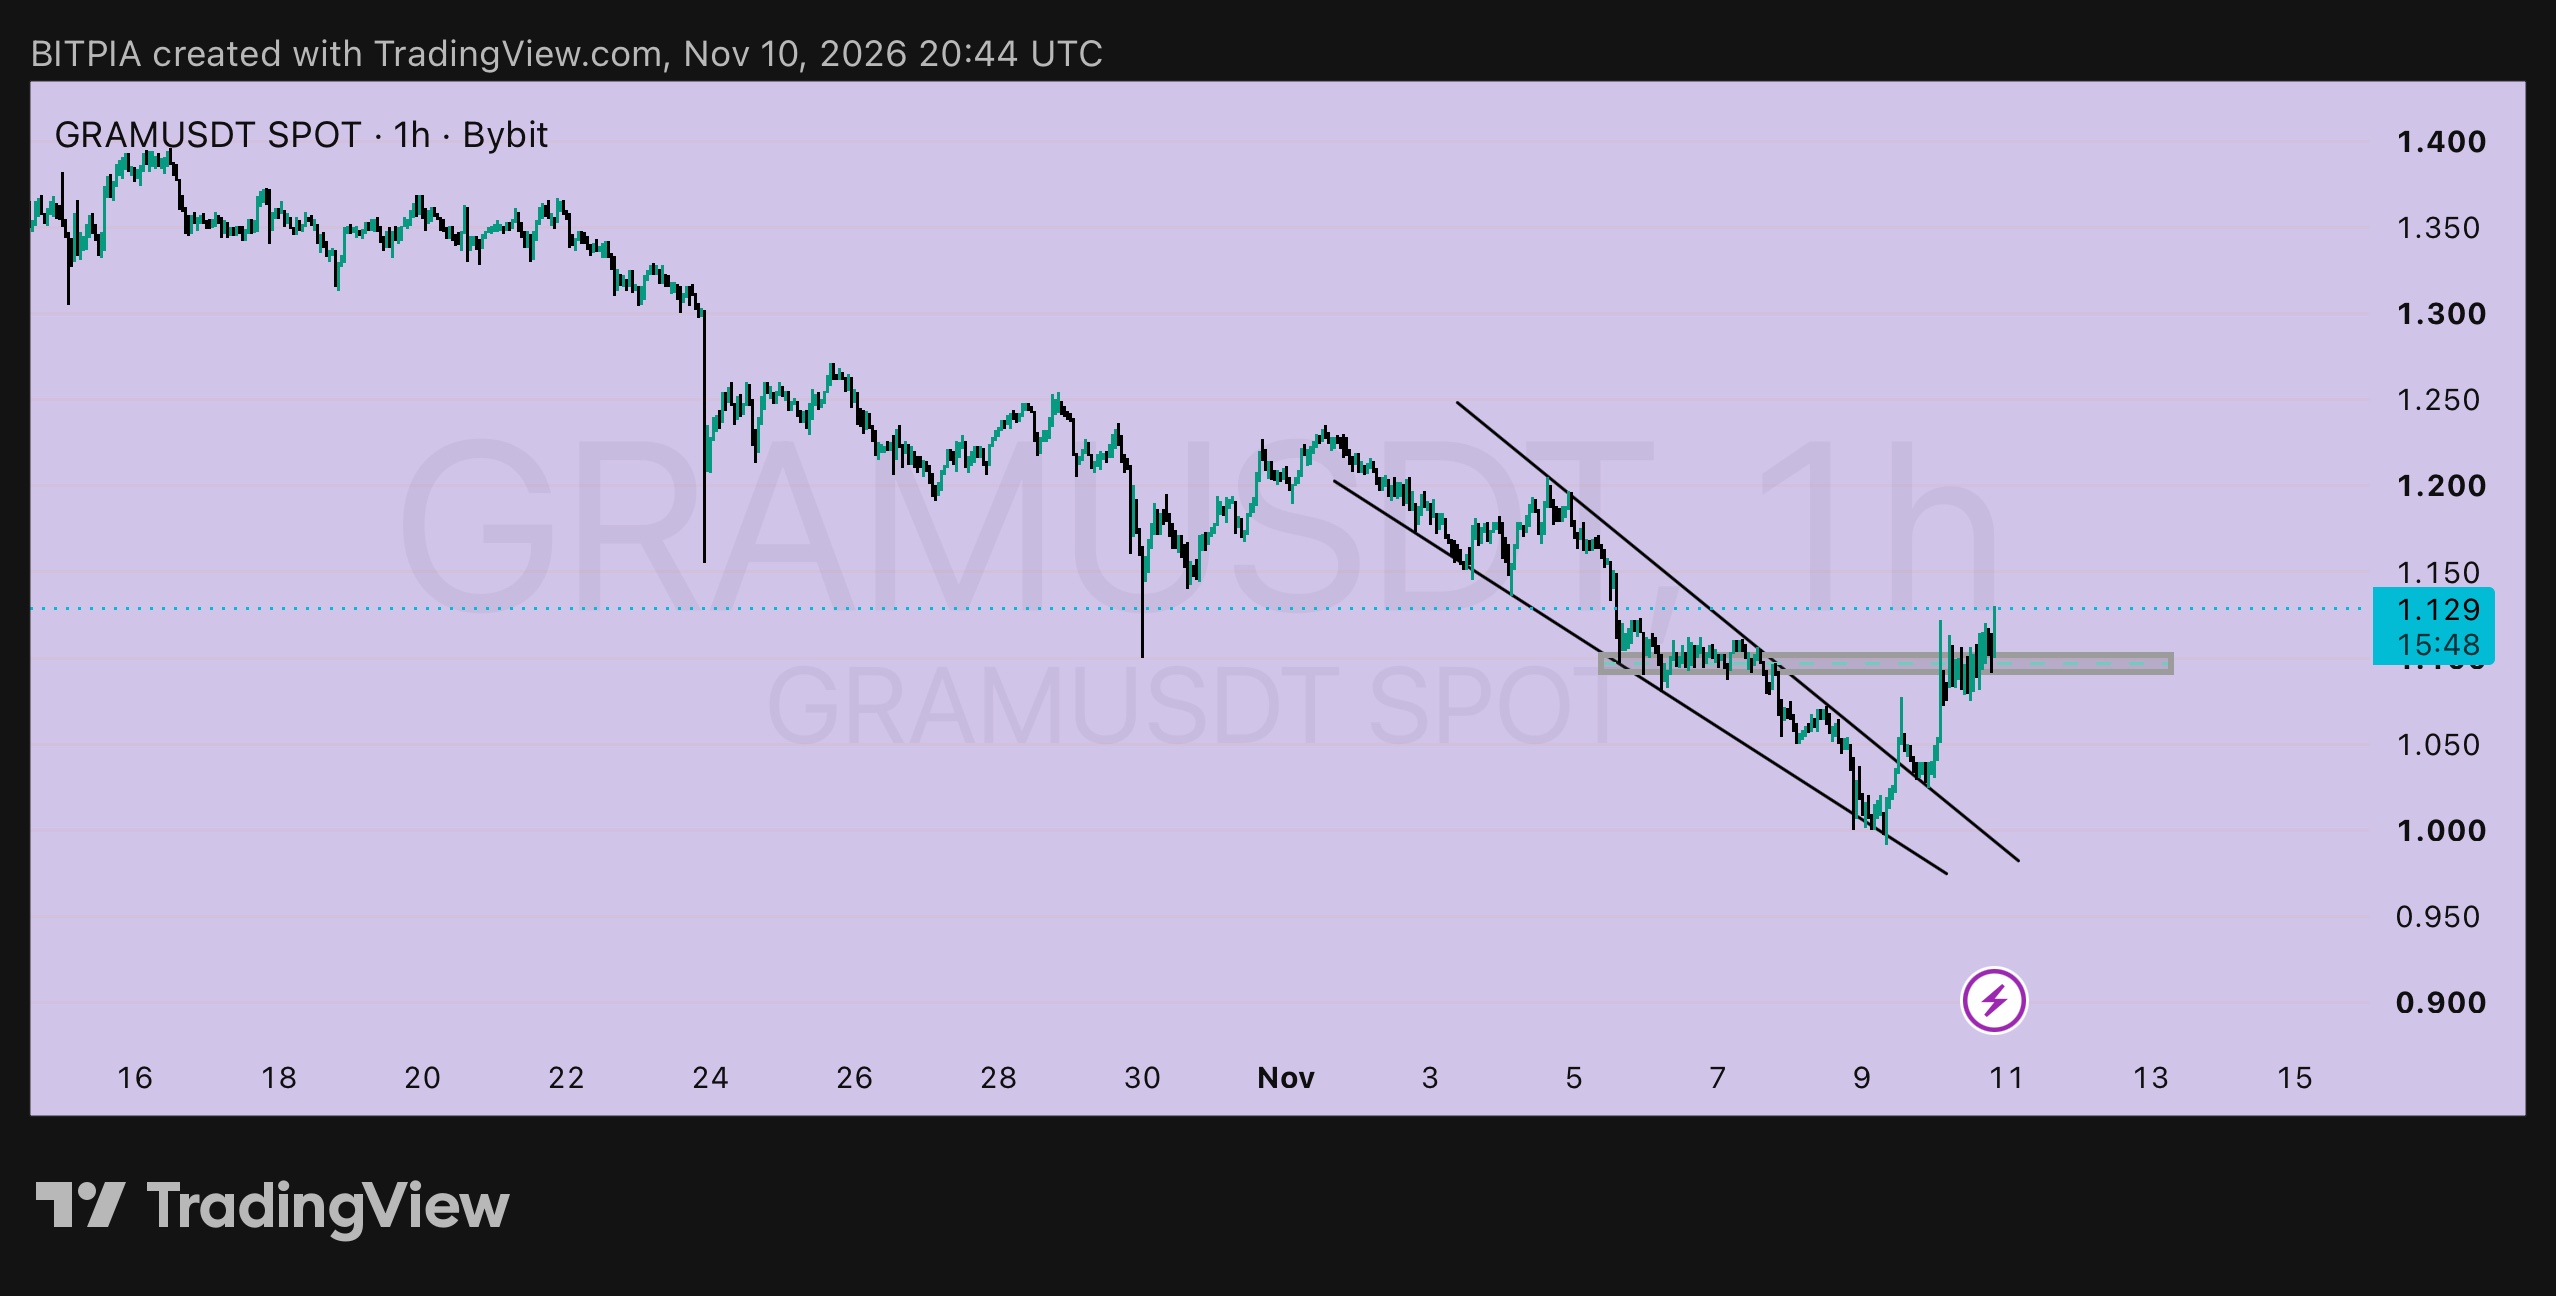
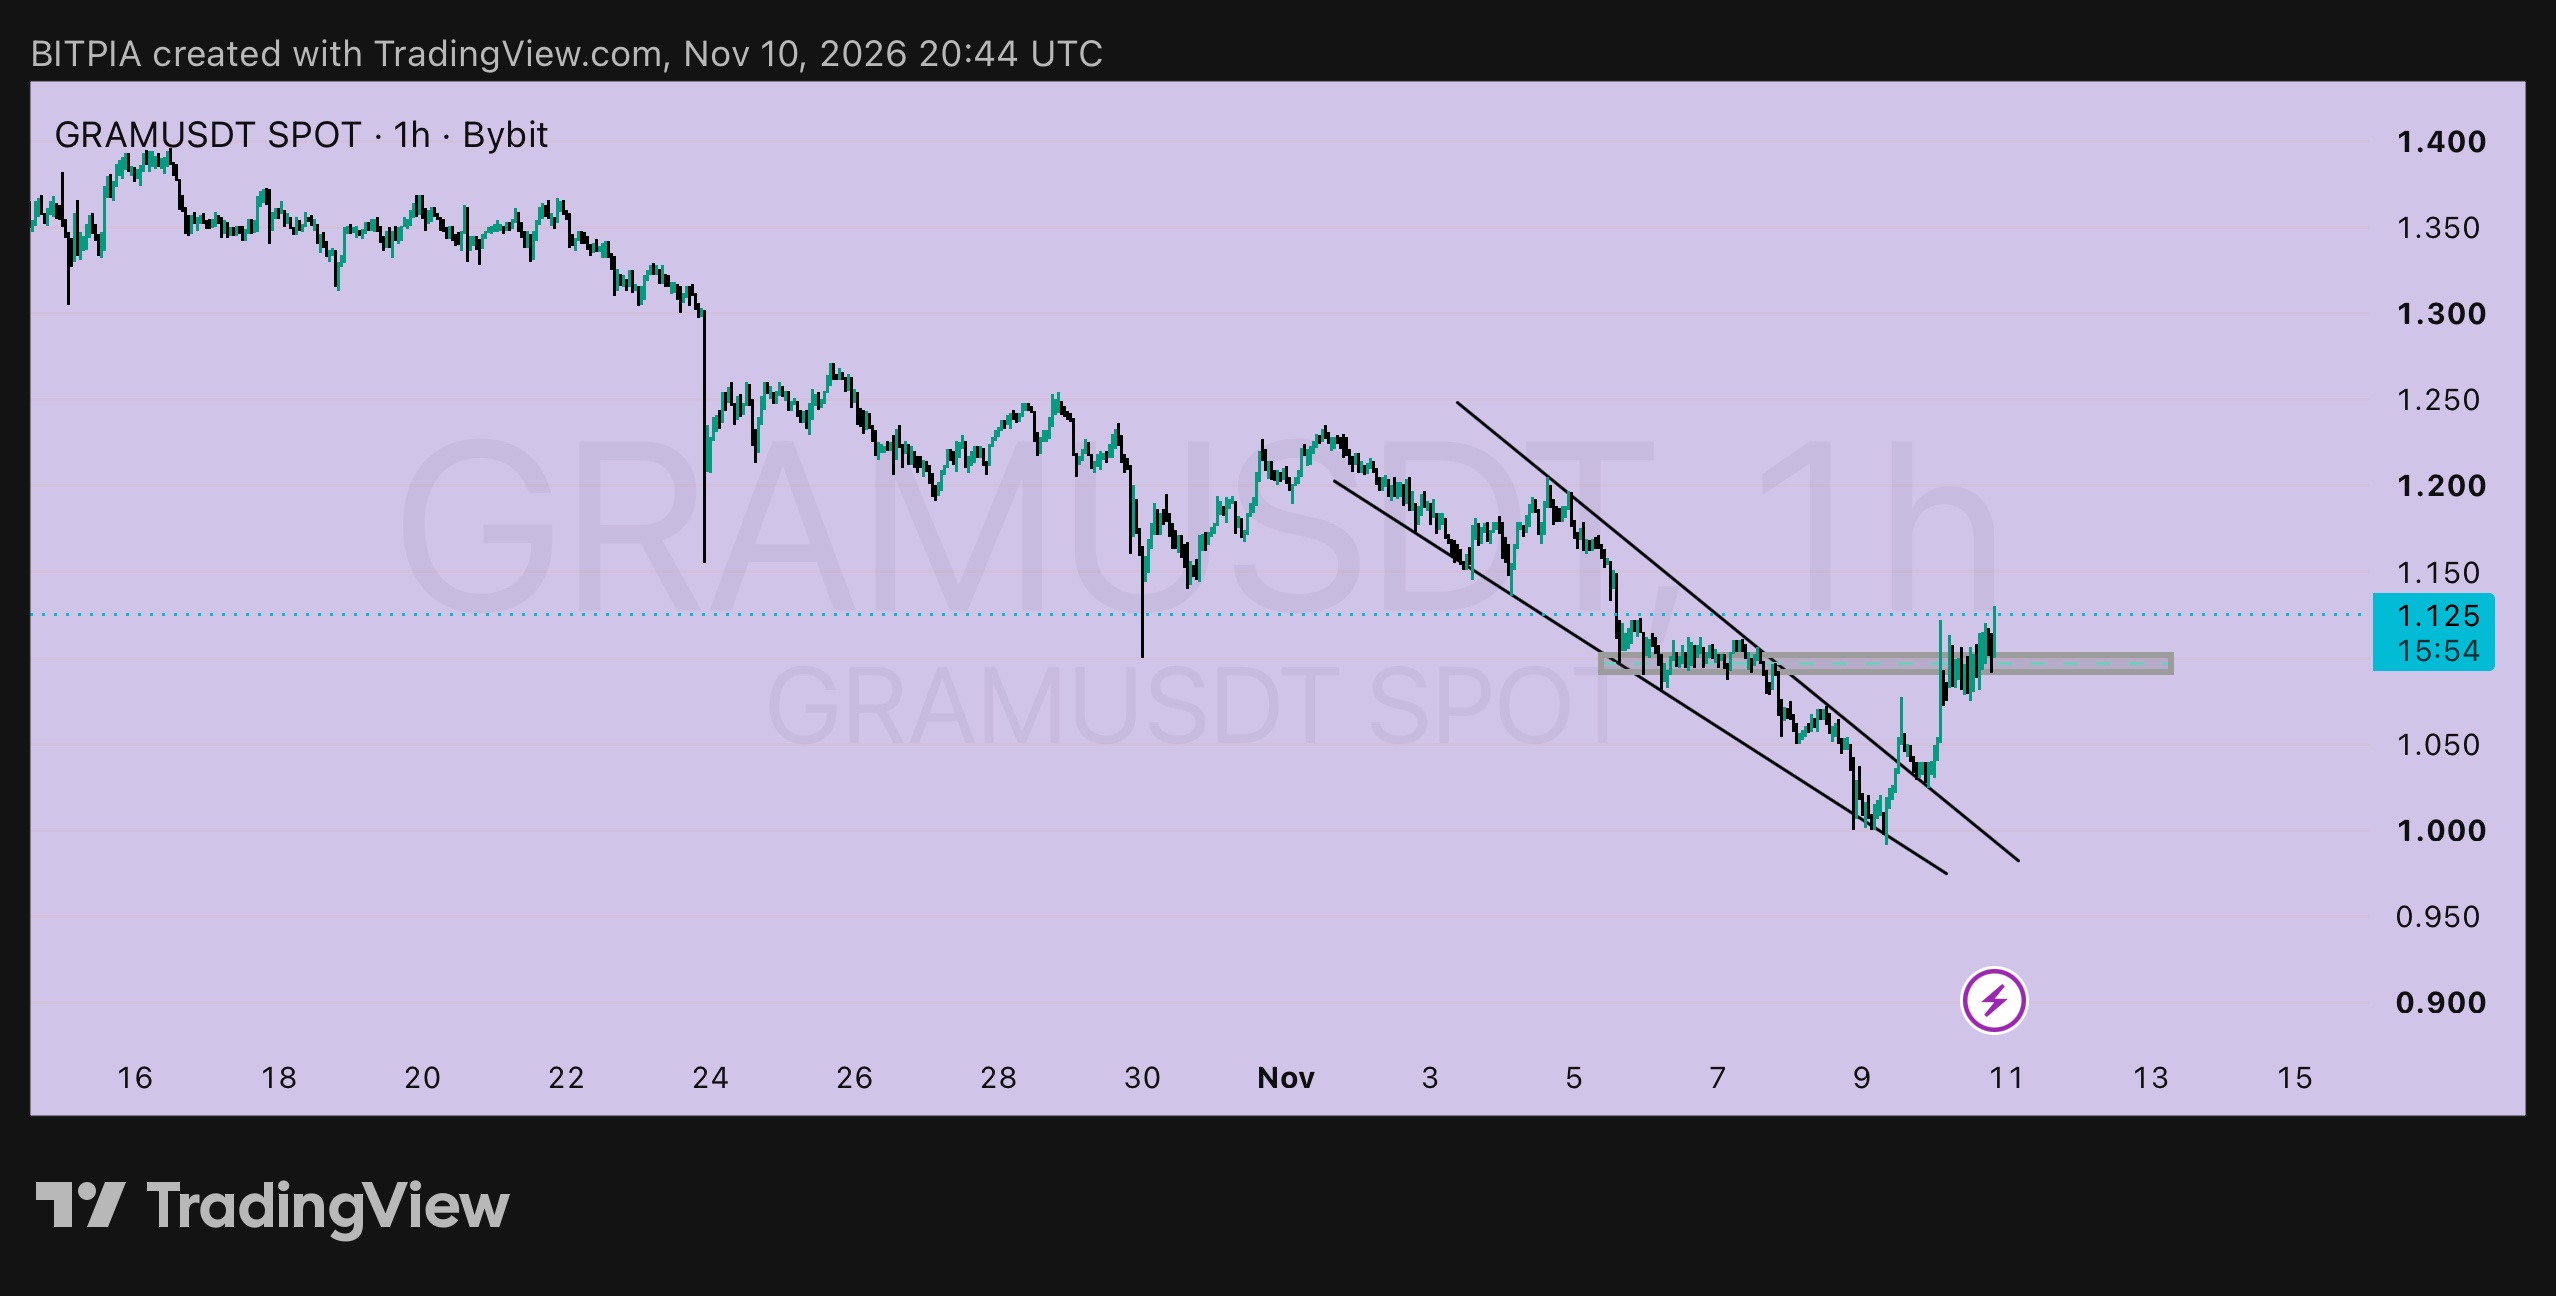
$GRAMUSDT 1小時線:我們處於突破週期的哪個階段? 突破通常會經歷三個階段:突破 (break)、回測 (retest) 和延續 (continuation)。以下是 GRAM 目前的情況,價格為 1.129。 ➤ 第一階段:突破 ✅ 已完成 ▸ 價格在 11 月 9 日創下接近 0.99 的低點後,脫離了下跌通道 ▸ 突破非常乾淨俐落,強勁的 K 線直接穿過上軌 ➤ 第二階段:回測 ✅ 大致完成 ▸ 價格收復了 1.095 至 1.105 的區間,這在上一波下跌前曾是支撐位 ▸ 目前價格一直徘徊在該區間並守住,這正是我樂見的走勢 ➤ 第三階段:延續 ⏳ 尚未開始 ▸ 1 小時線收盤站上 1.150 將是第一個確認訊號 ▸ 在那之後,下一個目標位是 1.210(11 月 3 日至 4 日的高點),接著是 1.250(10 月底區域) ➤ 我的計畫 ▸ 入場點:1.105 附近,逢低買入該支撐區間 ▸ 止損:1.055 以下,位於被突破的通道線下方 ▸ 每單位風險:0.050 ▸ 目標 1:1.150,+0.045,約 0.9R ▸ 目標 2:1.210,+0.105,約 2.1R ▸ 目標 3:1.250,+0.145,約 2.9R ➤ 追價計算 目前價格 1.129,若維持相同止損,風險為 0.074。漲至 1.210 約為 1.1R,至 1.250 約為 1.6R。不算太差,但也沒特別好。逢低買入當然更好,但不能保證價格會回來。 ➤ 什麼情況會否定該計畫 如果 1 小時線收在 1.055 以下,代表回測失敗,價格回到舊通道內,我就會離場觀望。 目前更大的趨勢仍延續本月初從 1.40 下跌以來的走勢,所以倉位要小,如果你使用永續合約,請保持低槓桿。 以上非投資建議。請自行做好研究,並僅投入你虧損得起的資金。 #ByXIMPACT #WSOT2026
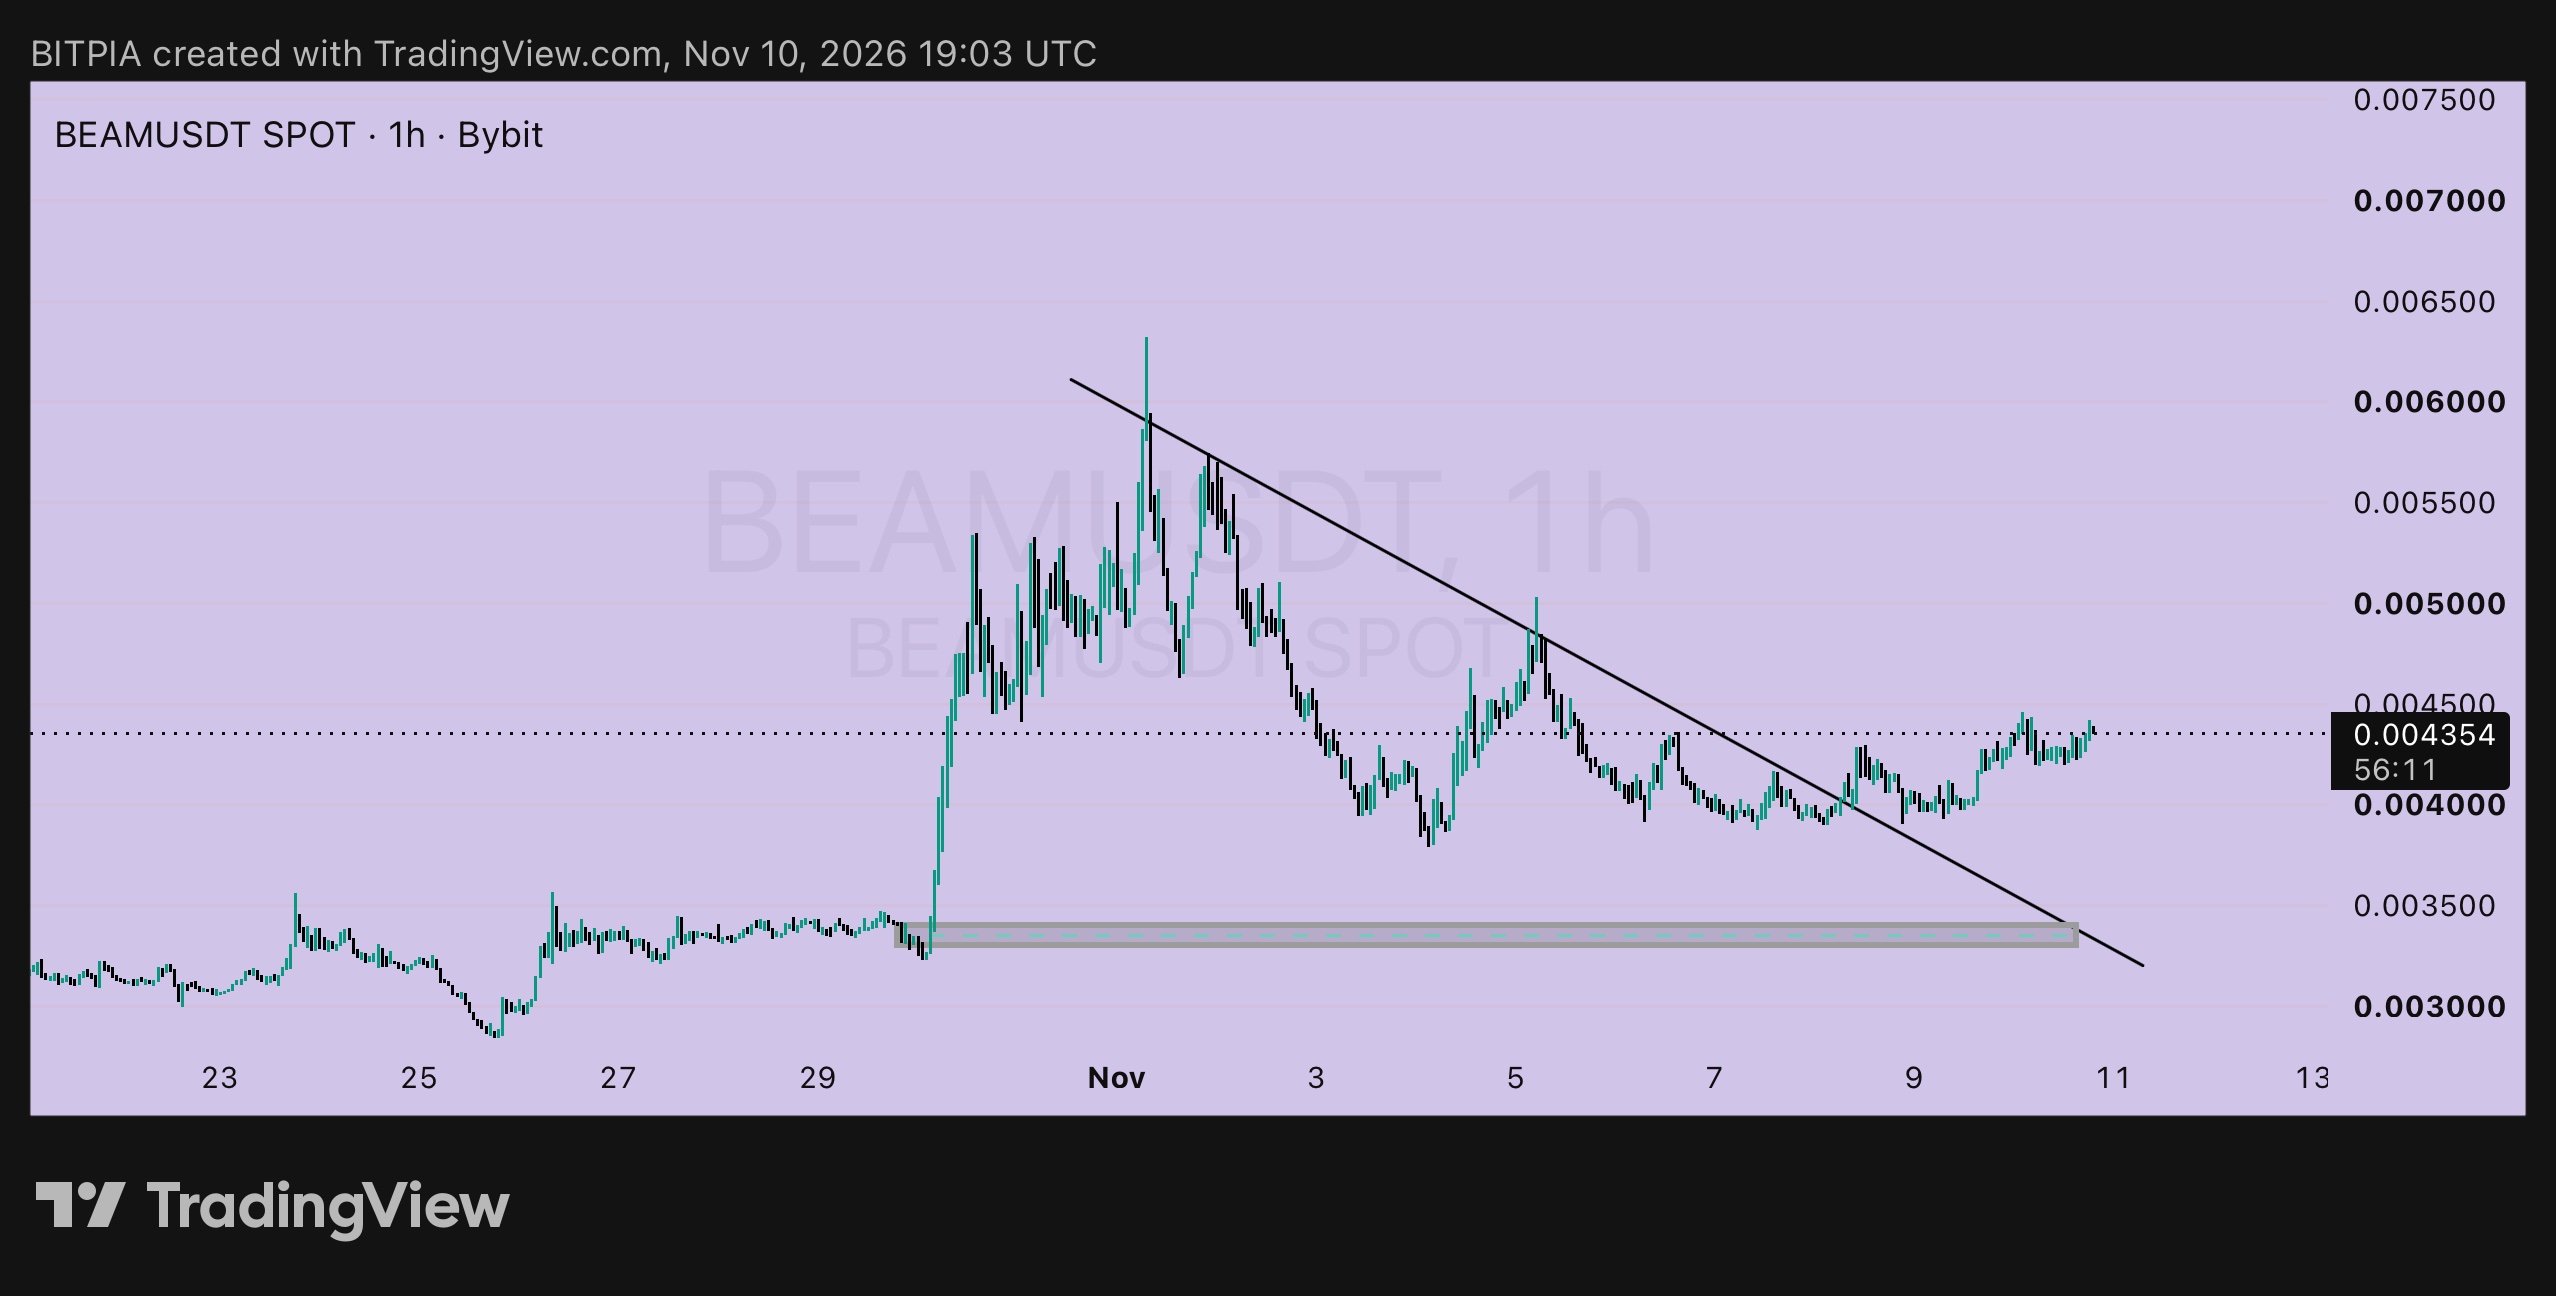
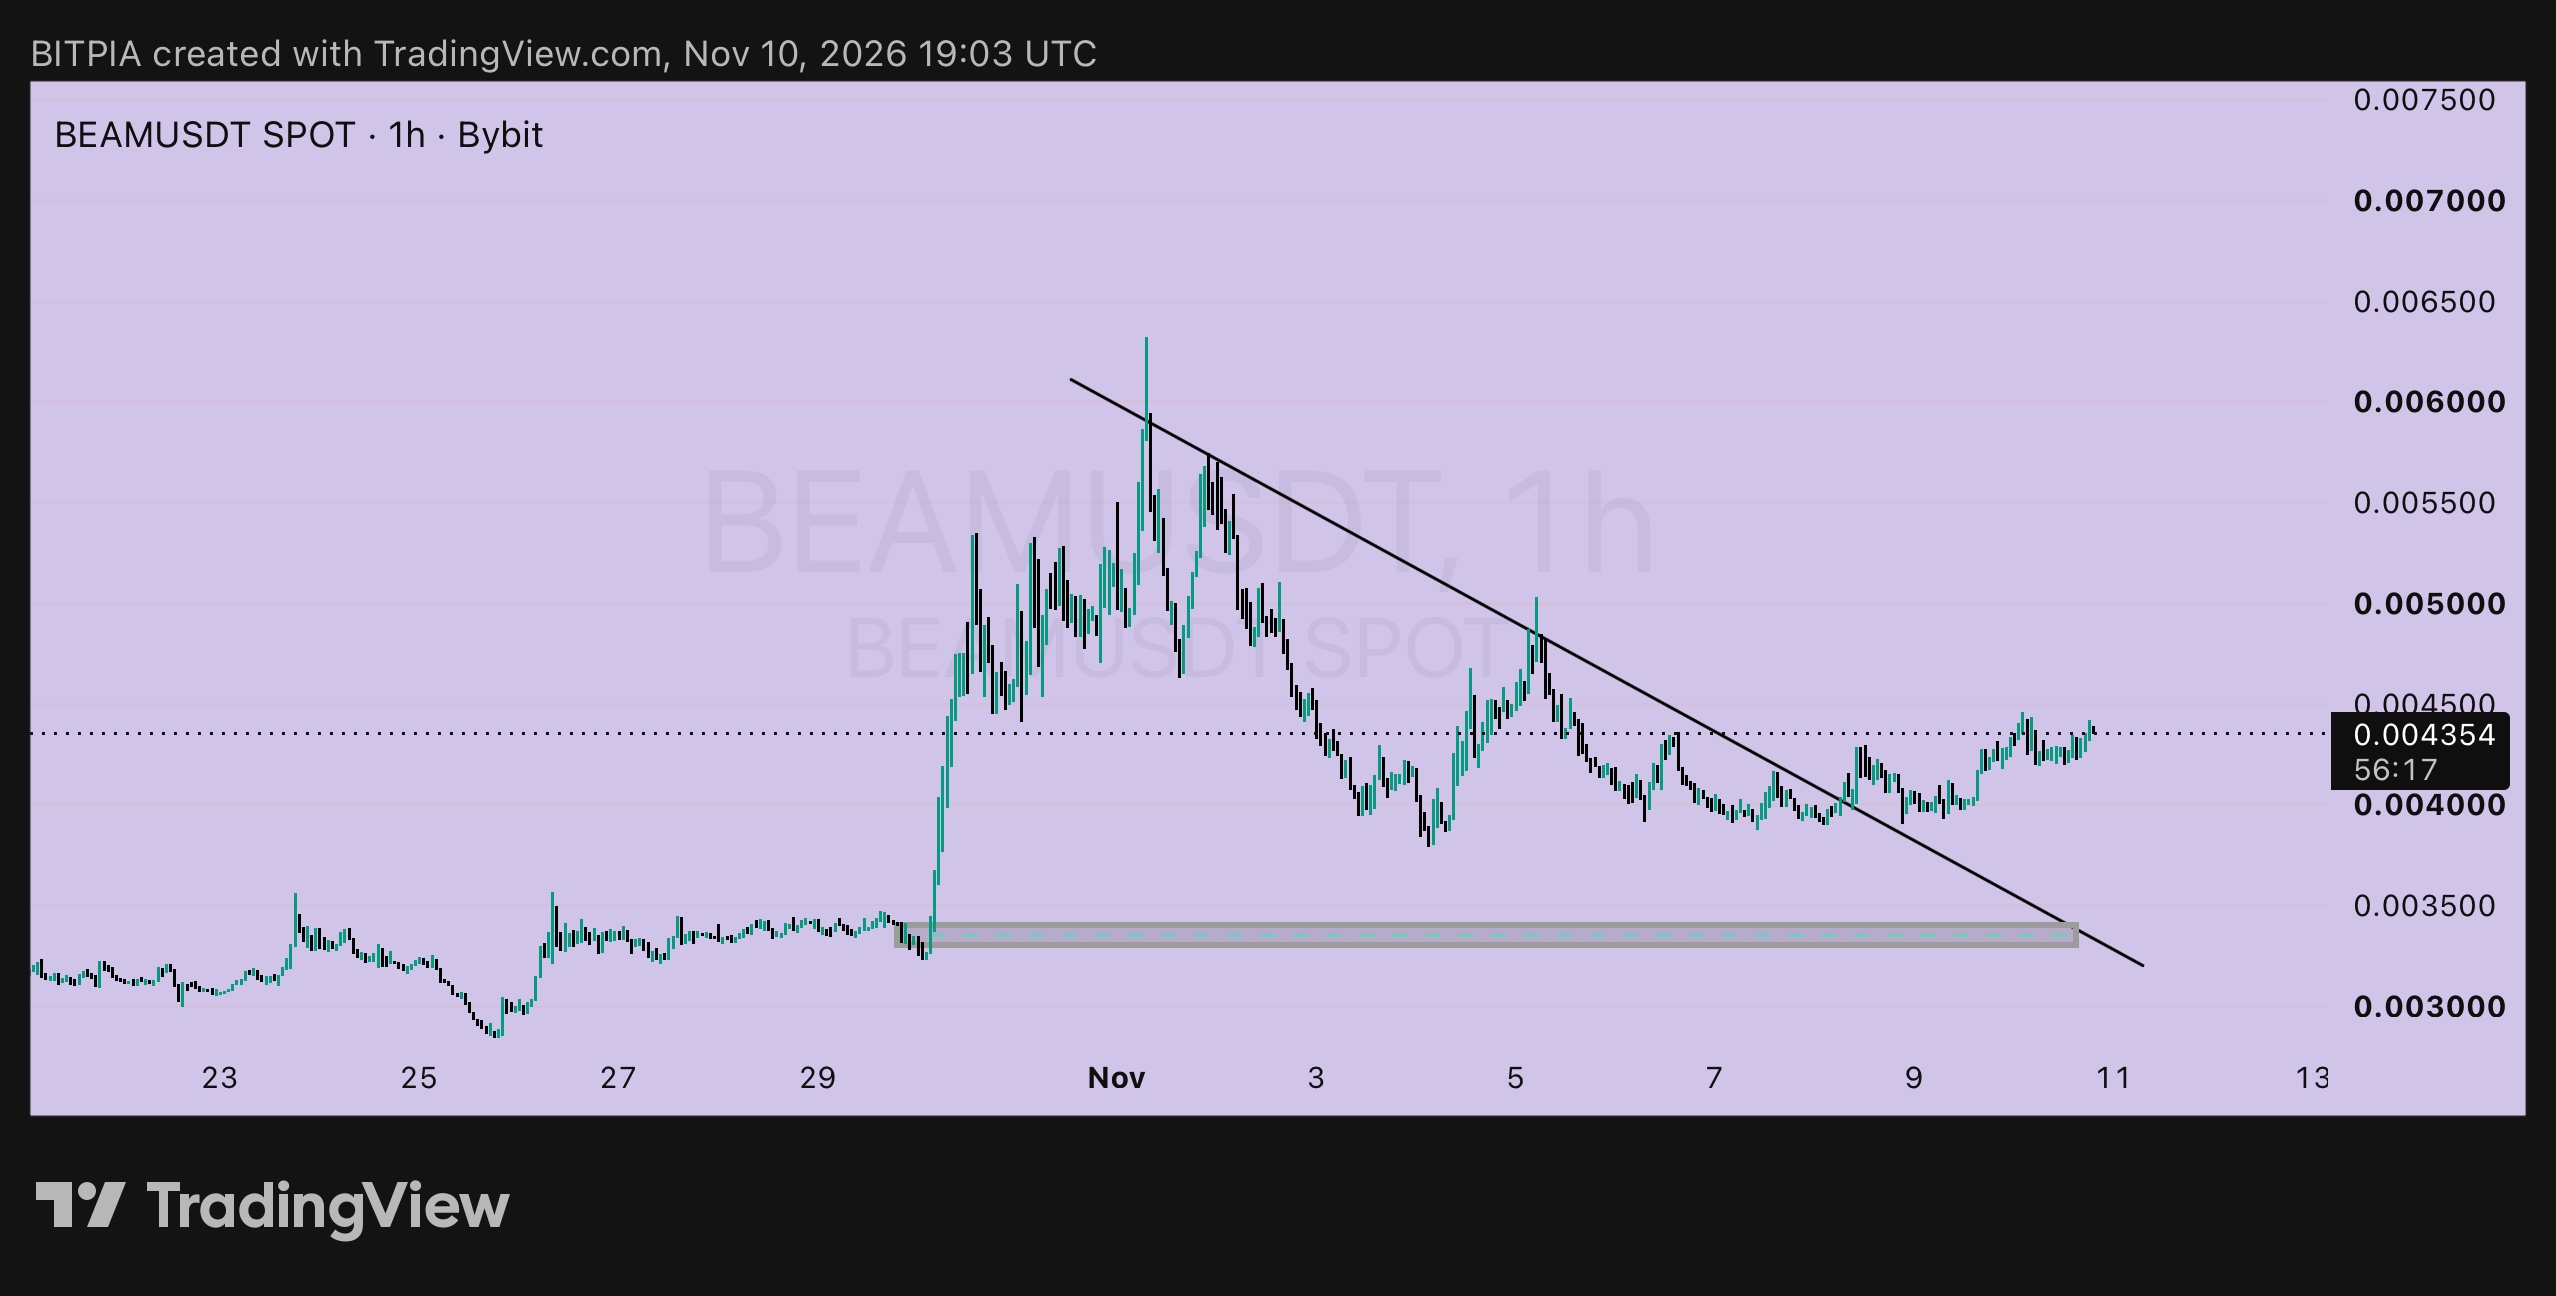
$BEAMUSDT 1小時線:行情快訊 📰 ➤ 快訊:趨勢線已被突破 ▸ 價格在 11 月 8 日突破了自 11 月 1 日高點以來的下跌趨勢線,並已連續兩天保持在該線上方 ▸ 目前價格為 0.004354,高於 11 月 7 日我發文時的 0.004041 ➤ 計劃回顧:計劃 A,突破點進場,價位 0.00425 ▸ 狀態:已觸發,價格收盤高於該線 ▸ 止損設為 0.00385,風險 0.00040 ▸ 目前約 +0.0001,利潤大約 0.25R。雖然還不多,但突破有效 ➤ 計劃回顧:計劃 B,提前進場,價位 0.00395 ▸ 狀態:11 月 9 日低點達到約 0.0039,因此應該已成交 ▸ 止損設為 0.00370,風險 0.00025 ▸ 目前約 +0.0004,利潤大約 1.6R ➤ 後續展望:我接下來會怎麼做 ▸ 對於現有倉位,將止損調高至 0.00385 下方,即 11 月 9 日低點和已突破線的下方 ▸ 目標 1:0.00500,這是 11 月 5 日價格遇阻的位置 ▸ 目標 2:0.00550 ▸ 目標 3:0.00600,接近 11 月 1 日高點區域 以計劃 A 的進場點 (0.00425) 計算,分別約為 1.9R、3.1R 和 4.4R。 ➤ 如果你還未進場 ▸ 進場:若舊趨勢線能作為支撐,回調至 0.00415 附近可考慮進場 ▸ 止損:0.00385 下方 ▸ 每單位風險:0.00030 ▸ 目標:0.00500 (+0.00085,約 2.8R) 和 0.00550 (+0.00135,約 4.5R) ➤ 行情展望 0.0033 至 0.0034 附近的底部區域還很遠,因此如果行情反轉,目前價格與發射基地之間還有很大的空間。 ➤ 失效條件 1 小時線收盤價低於 0.00385 意味著突破失敗,我會選擇離場觀望。 倉位要小,若使用永續合約請保持低槓桿。 以上並非財務建議。請自行做好研究,並僅投入你能承受損失的資金。 #ByXIMPACT #WSOT2026
1小時線啟動:落袋為安 💰 $INITUSDT 目前在 0.24183。兩天前我發文時價格是 0.12304,當時我說「門檻 2」(在 0.1200 附近的重新測試,止損設在 0.1150 以下)是我的首選。昨天我將止損移到了 0.1200。從那時起價格幾乎翻倍,現在是時候算算帳了。 ➤ 數據分析 ▸ 「門檻 2」進場點:0.1200,風險 0.0050 ▸ 目前:每單位獲利約 +0.1218,大約 24R(風險回報比) ▸ 「門檻 1」(0.1230,風險 0.0080)也遙遙領先,約 14R ▸ 我發布的兩個目標位(0.1390 和 0.1520)早已突破 像這樣的漲幅,就是為什麼要在行情發生前就擬定計畫的原因。 ➤ 我會如何獲利了結 ▸ 在 0.2400 到 0.2500 區域附近平掉一半倉位,這接近 10 月 28 日的高點 0.2550,賣壓先前曾在該處出現 ▸ 將剩餘部位的止損移動到 0.1800 左右,也就是今天早晨回調低點的下方 ▸ 突破 0.2550 後,圖表上已沒有舊的關鍵點位可作為目標,所以就交給移動止損來處理 ➤ 為什麼我不加倉 ▸ K 線實體非常大。價格在幾小時內從約 0.158 波動到 0.225,又回落至 0.183 ▸ 在 0.2418 進場且止損設在 0.1780,風險為 0.0638,而 0.2550 距離進場點僅約 0.2R 的獲利空間。那不叫交易,那叫賭博。 ➤ 如果你還沒進場 ▸ 我會等待回調至 0.2050 附近,並觀察是否能在 0.2000 以上站穩 ▸ 止損點:0.1780 以下 ▸ 每單位風險:0.0270 ▸ 目標價:0.2550,+0.0500,約 1.9R ▸ 如果價格從未回調,那也沒關係。這波行情已經結束了 ➤ 什麼情況下失效 1 小時線收在 0.1800 以下,代表行情已經冷卻。對於現有交易,移動止損會自動發揮作用。 經歷過這麼大的漲幅後,請縮小倉位;如果使用永續合約,請降低槓桿。 以上非投資建議。請自行研究,並僅投入你虧得起的資金。 #ByXIMPACT #WSOT2026
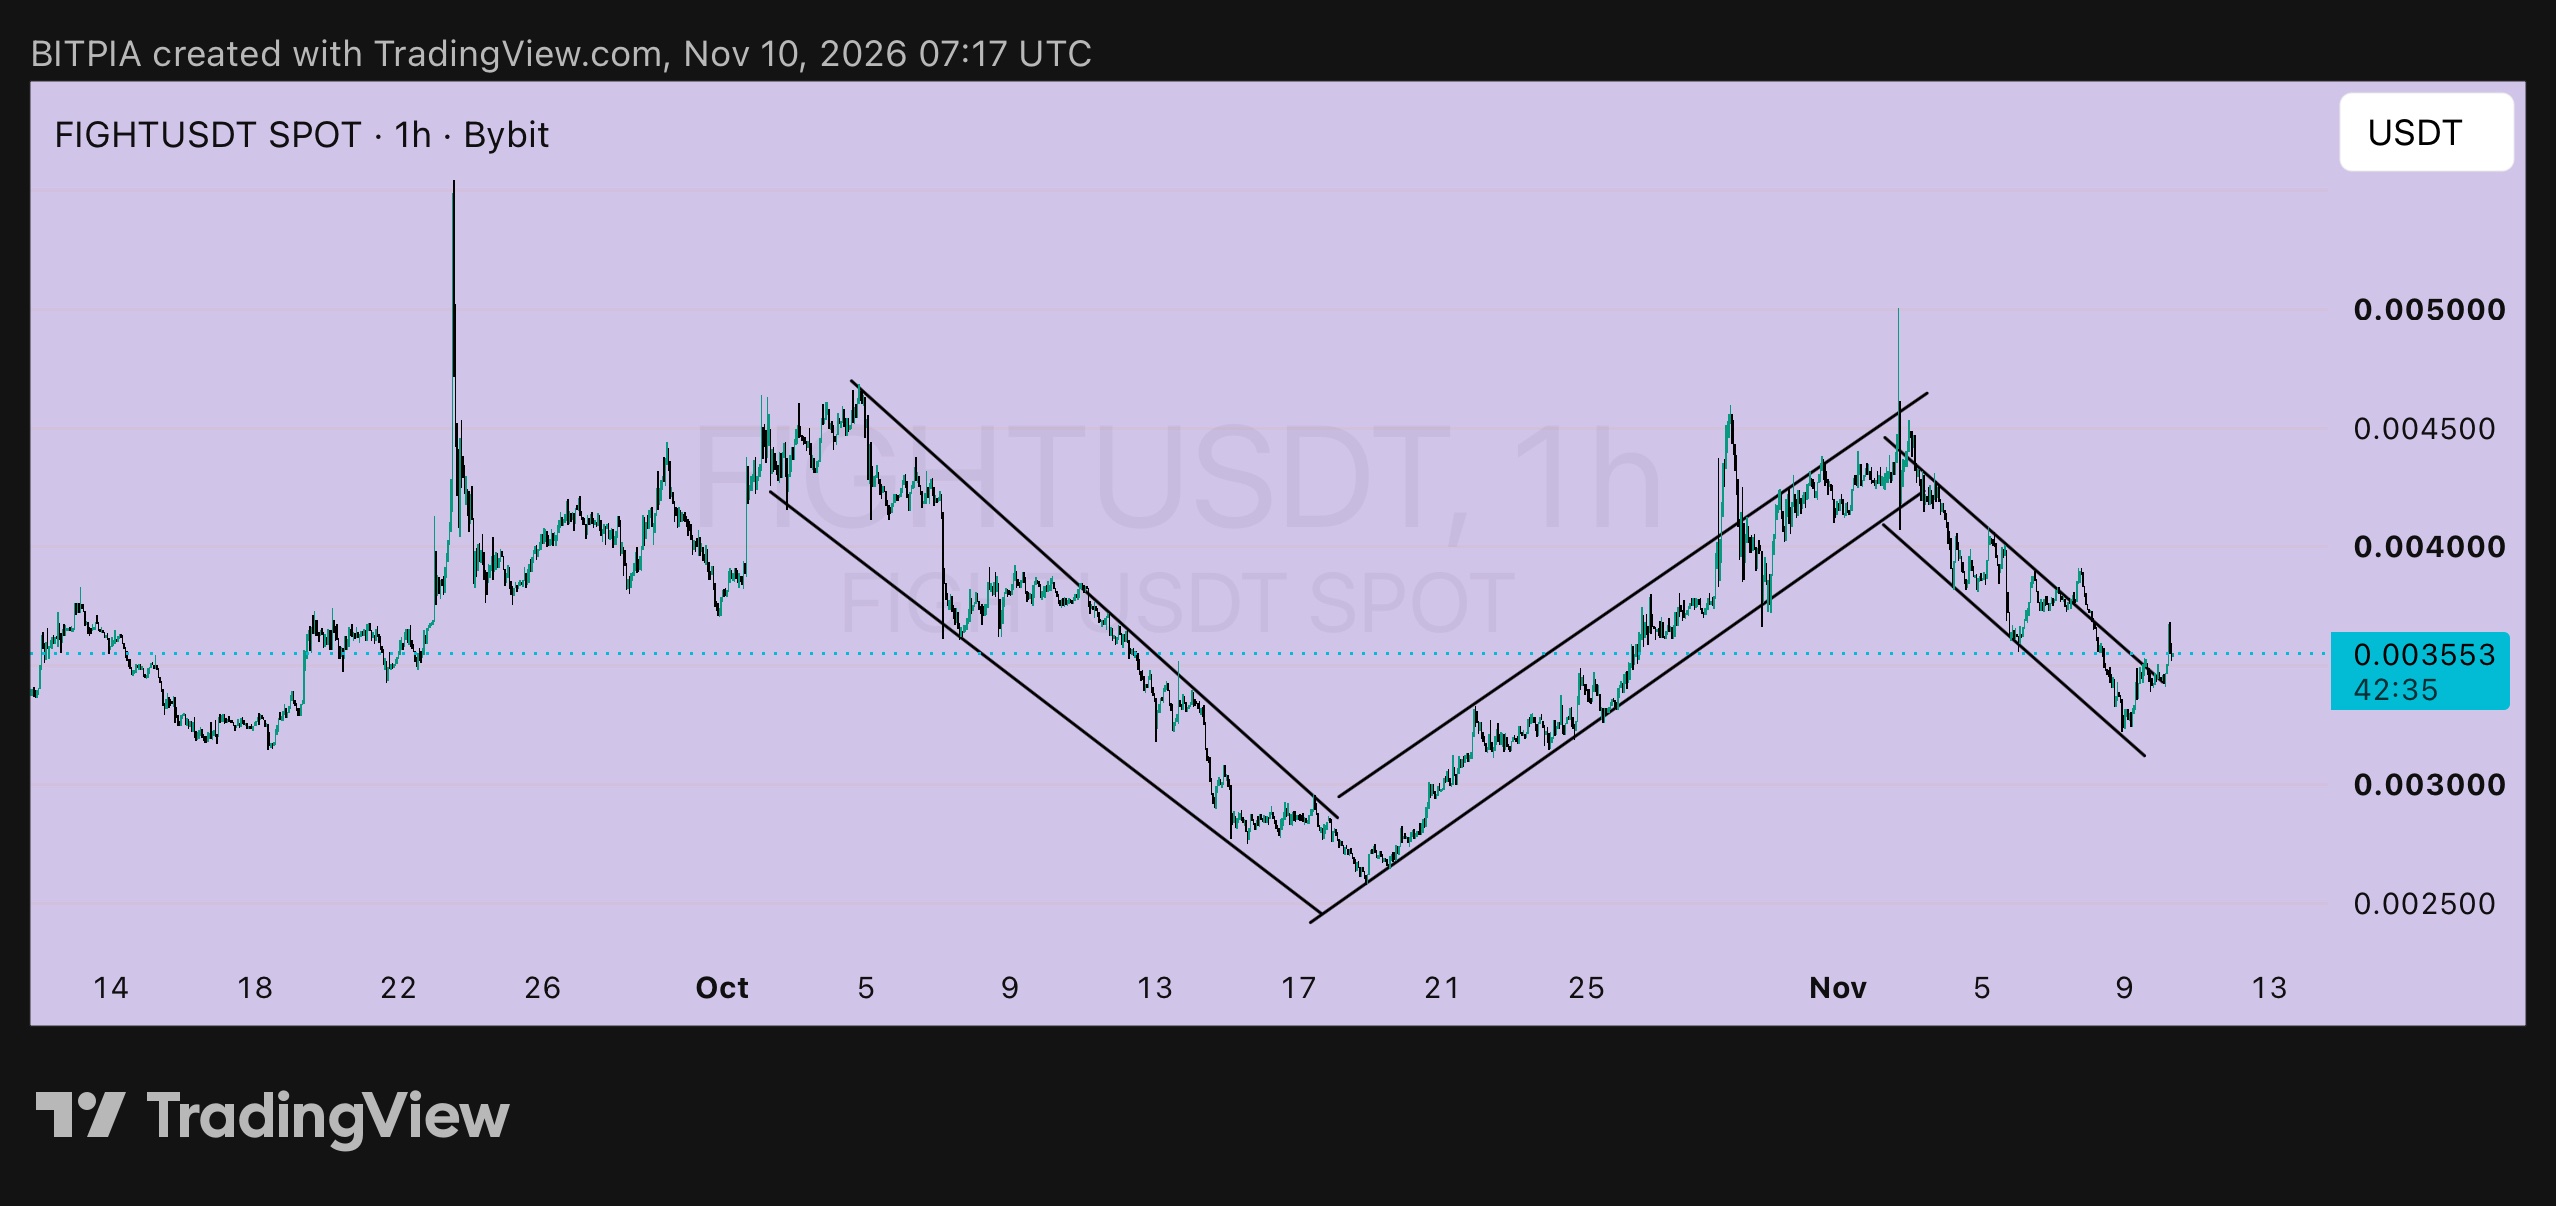
$FIGHT 1h: the zigzag 〰️ Since October, $FIGHTUSDT has been moving in clean legs, and this is the picture I like to keep in mind. ➤ The legs so far ▸ Oct 5 to 18: a falling channel down to about 0.0026 ▸ Oct 18 to Nov 2: a rising channel up to about 0.0046 to 0.0050 ▸ Nov 2 to 9: another falling channel, down to a low near 0.00322 ▸ Now: price is at 0.003553, and it has just moved above the top line of that last falling channel If the pattern repeats, a new leg up may be starting. I'm not counting on it, because legs can fail and the 0.00375 floor from last week has turned into resistance. ➤ Where I stand on my Nov 9 plan ▸ Trigger: a 1h close above 0.00358 ▸ Status: not confirmed yet. Price touched about 0.00367 this morning, then eased back ▸ Nothing has been triggered, so nothing lost ➤ Plan A: wait for the close ▸ Entry: around 0.00360 ▸ Stop-loss: below 0.00330 ▸ Risk per unit: 0.00030 ▸ Target 1: 0.00385, +0.00025, about 0.8R ▸ Target 2: 0.00420, +0.00060, about 2R ▸ Target 3: 0.00455, +0.00095, about 3.2R ➤ Plan B: a retest ▸ Entry: around 0.00345, if price returns to the broken channel line and holds ▸ Stop-loss: below 0.00322, under the last low ▸ Risk per unit: 0.00023 ▸ Targets: 0.00385 (+0.00040, about 1.7R) and 0.00420 (+0.00075, about 3.3R) Plan B has better numbers, and it only works if price gives it to me. ➤ What cancels it A 1h close under 0.00322 means the new leg has failed, and I step aside. The 0.0030 area would be the next level I'd watch. Small size, and low leverage if you use perps. Not financial advice. Do your own research and only risk what you can afford to lose. #WSOT2026
FIGHT 1h: the floor failed, and I'm saying it plainly On Nov 7 I posted $FIGHTUSDT at 0.003873 and said the 0.00375 to 0.00385 floor was the level to watch, with a stop under 0.00352. It didn't hold. Price slid to a low near 0.00322 and is now bouncing at 0.003442. ➤ What it means for the trade ▸ If you entered near 0.00385 and used the 0.00352 stop, you were stopped out for roughly a 1R loss ▸ If you added at 0.00375 with the 0.00355 stop, the loss is about the same size, a full 1R ▸ That's the job of a stop: it kept a wrong idea small. I'd rather show you this than hide it ➤ What the chart shows now ▸ Since October, FIGHT has been moving in clean swings: a falling channel, then a rising one, and now a falling one again ▸ Price is trading under the old floor, which has turned into resistance near 0.00375 ▸ The top line of the current channel sits near 0.00352 to 0.00358, and that's the first thing to clear ➤ Plan A: wait for the channel to break up ▸ Trigger: a 1h close above 0.00358 ▸ Entry: around 0.00360 ▸ Stop-loss: below 0.00330 ▸ Risk per unit: 0.00030 ▸ Targets: 0.00385 (+0.00025, about 0.8R), 0.00420 (+0.00060, about 2R), 0.00455 (+0.00095, about 3.2R) ➤ Plan B: the next real floor ▸ Entry: around 0.00305, only if buyers show up near 0.0030 ▸ Stop-loss: below 0.00285 ▸ Risk per unit: 0.00020 ▸ Targets: 0.00345 (+0.00040, about 2R) and 0.00380 (+0.00075, about 3.75R) ➤ What I'm not doing Not buying at 0.003442 in the middle of the channel. I have no close stop there and no confirmation. ➤ What cancels it Under 0.0028, I'd look at the 0.0025 to 0.0026 area from October and wait. Small size, and low leverage if you use perps. Not financial advice. Do your own research and only risk what you can afford to lose. #ByXIMPACT #WSOT2026
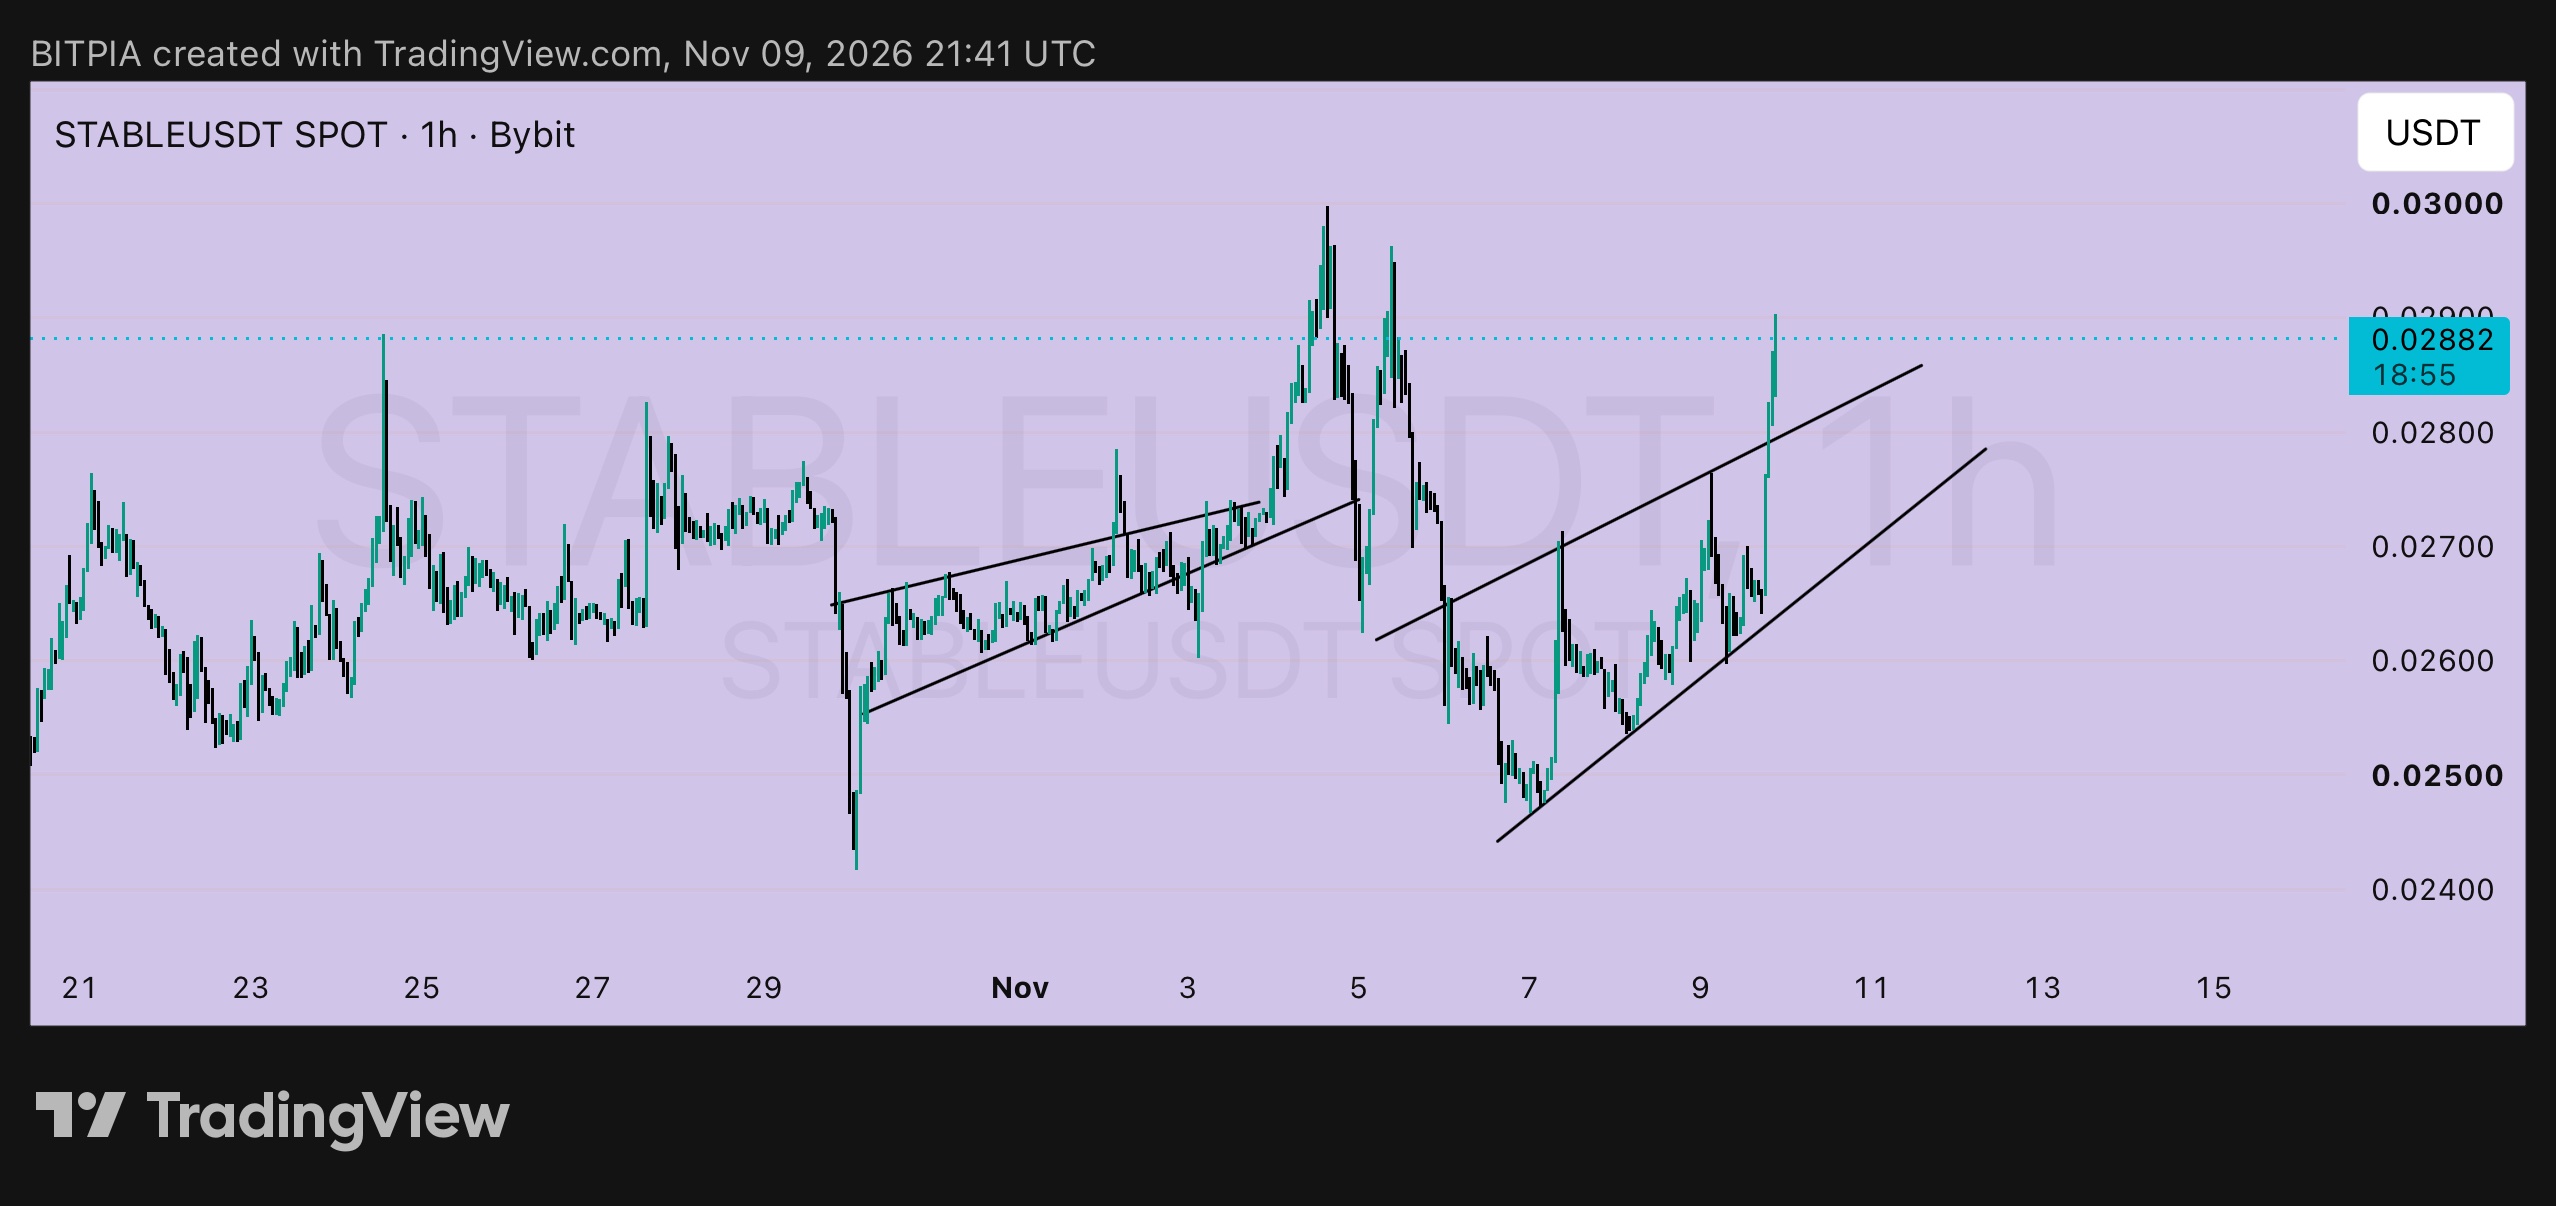
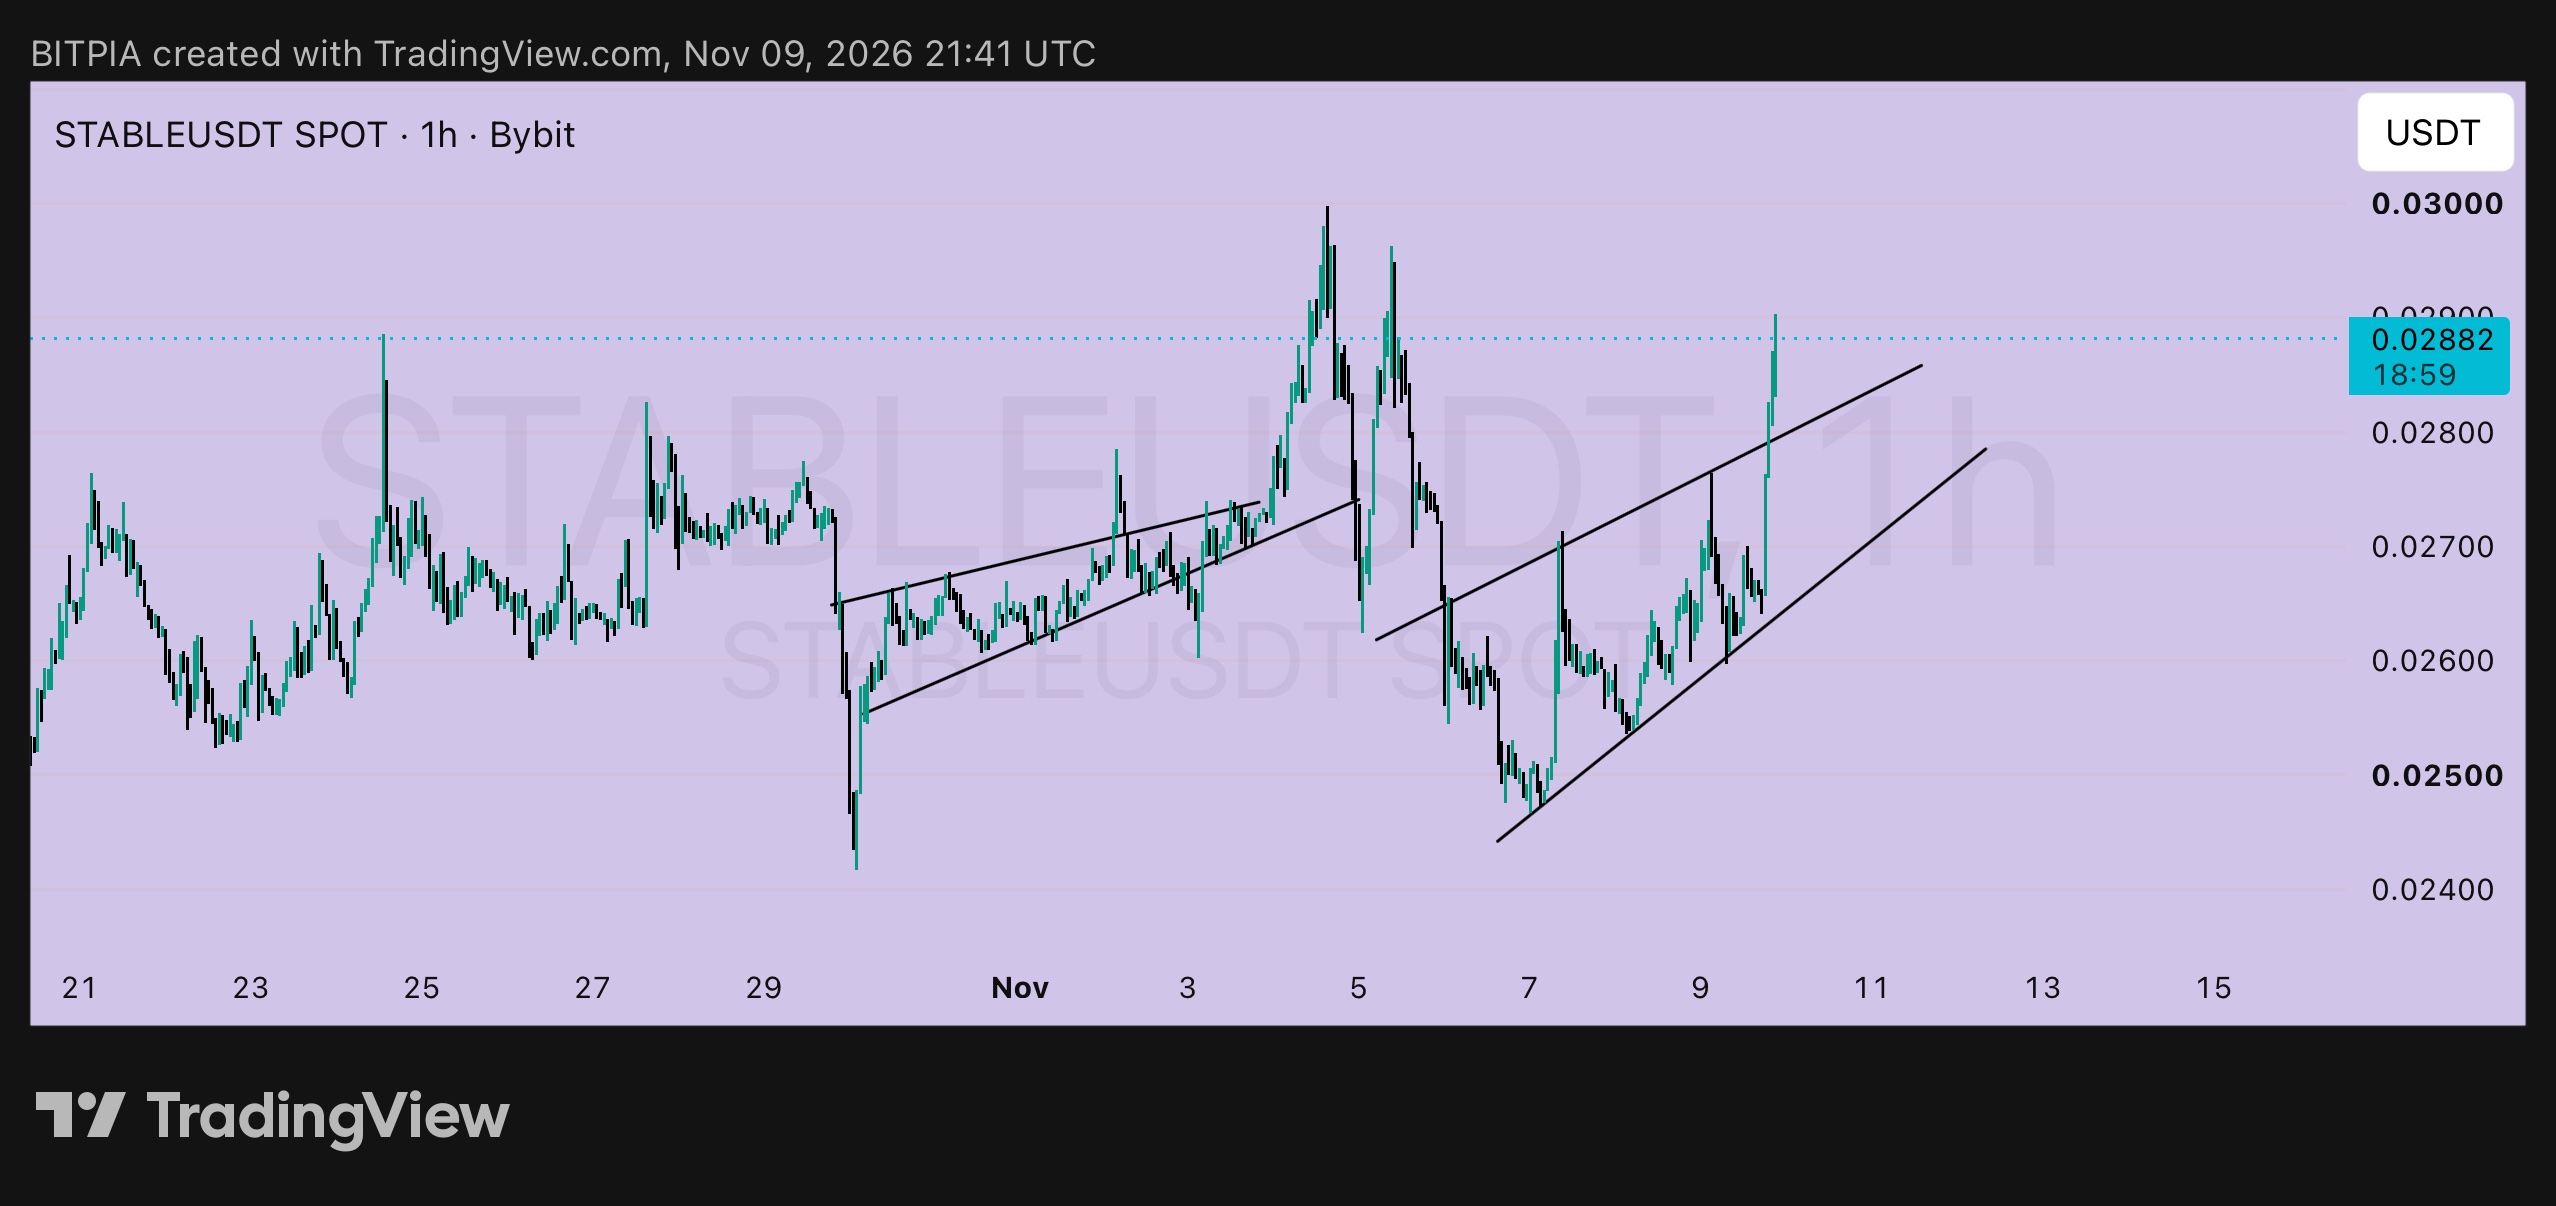
STABLE 1小時線:睡前策略 🌙 拉各斯現在很晚了,所以提供一個 $STABLEUSDT 的掛單即忘策略。價格突破上升通道後來到 0.02882,上軌支撐現已來到 0.0280 附近。只要設定好以下這三點,就不需要整晚盯盤。 ➤ 警示 1:0.0290 ▸ 10 月 24 日的高點水平,也是 11 月 5 日測試未果的阻力位 ▸ 如果 1 小時線收盤站上此位,漲勢動能才算確立 ➤ 警示 2:0.0300 ▸ 11 月 4 日的高點,也是下一個重要的整數關卡 ▸ 收盤站上這裡是我的突破進場觸發點 ➤ 交易點子:回測策略 ▸ 進場:0.0278 附近(靠近舊通道線),若價格回踩並站穩 ▸ 止損:0.0262 以下(通道下軌下方) ▸ 單單位風險:0.0016 ▸ 目標 1:0.0300,+0.0022,約 1.4R ▸ 目標 2:0.0330,+0.0052,約 3.25R ➤ 突破策略 ▸ 進場:0.0302 附近,待 1 小時線收盤突破 0.0300 後 ▸ 止損:0.0286 以下 ▸ 單單位風險:0.0016 ▸ 目標:0.0330 (+0.0028,約 1.75R) 及 0.0350 (+0.0048,約 3R) ➤ 為何現在不買 現價 0.02882,止損 0.0262,風險為 0.0026,而目標 0.0330 僅有約 1.6R 的空間。此外,價格剛好在 0.0290 下方,這之前曾是阻力。我寧願等待回測或乾淨的突破再進場。 ➤ 策略失效條件 若 1 小時線收盤跌回通道內且低於 0.0262,意味著突破失敗,我會選擇觀望。 倉位放小,若使用永續合約請降低槓桿。然後安心睡覺吧。💙 非投資建議。請自行研究,且只承擔你虧得起的風險。 #ByXIMPACT #WSOT2026
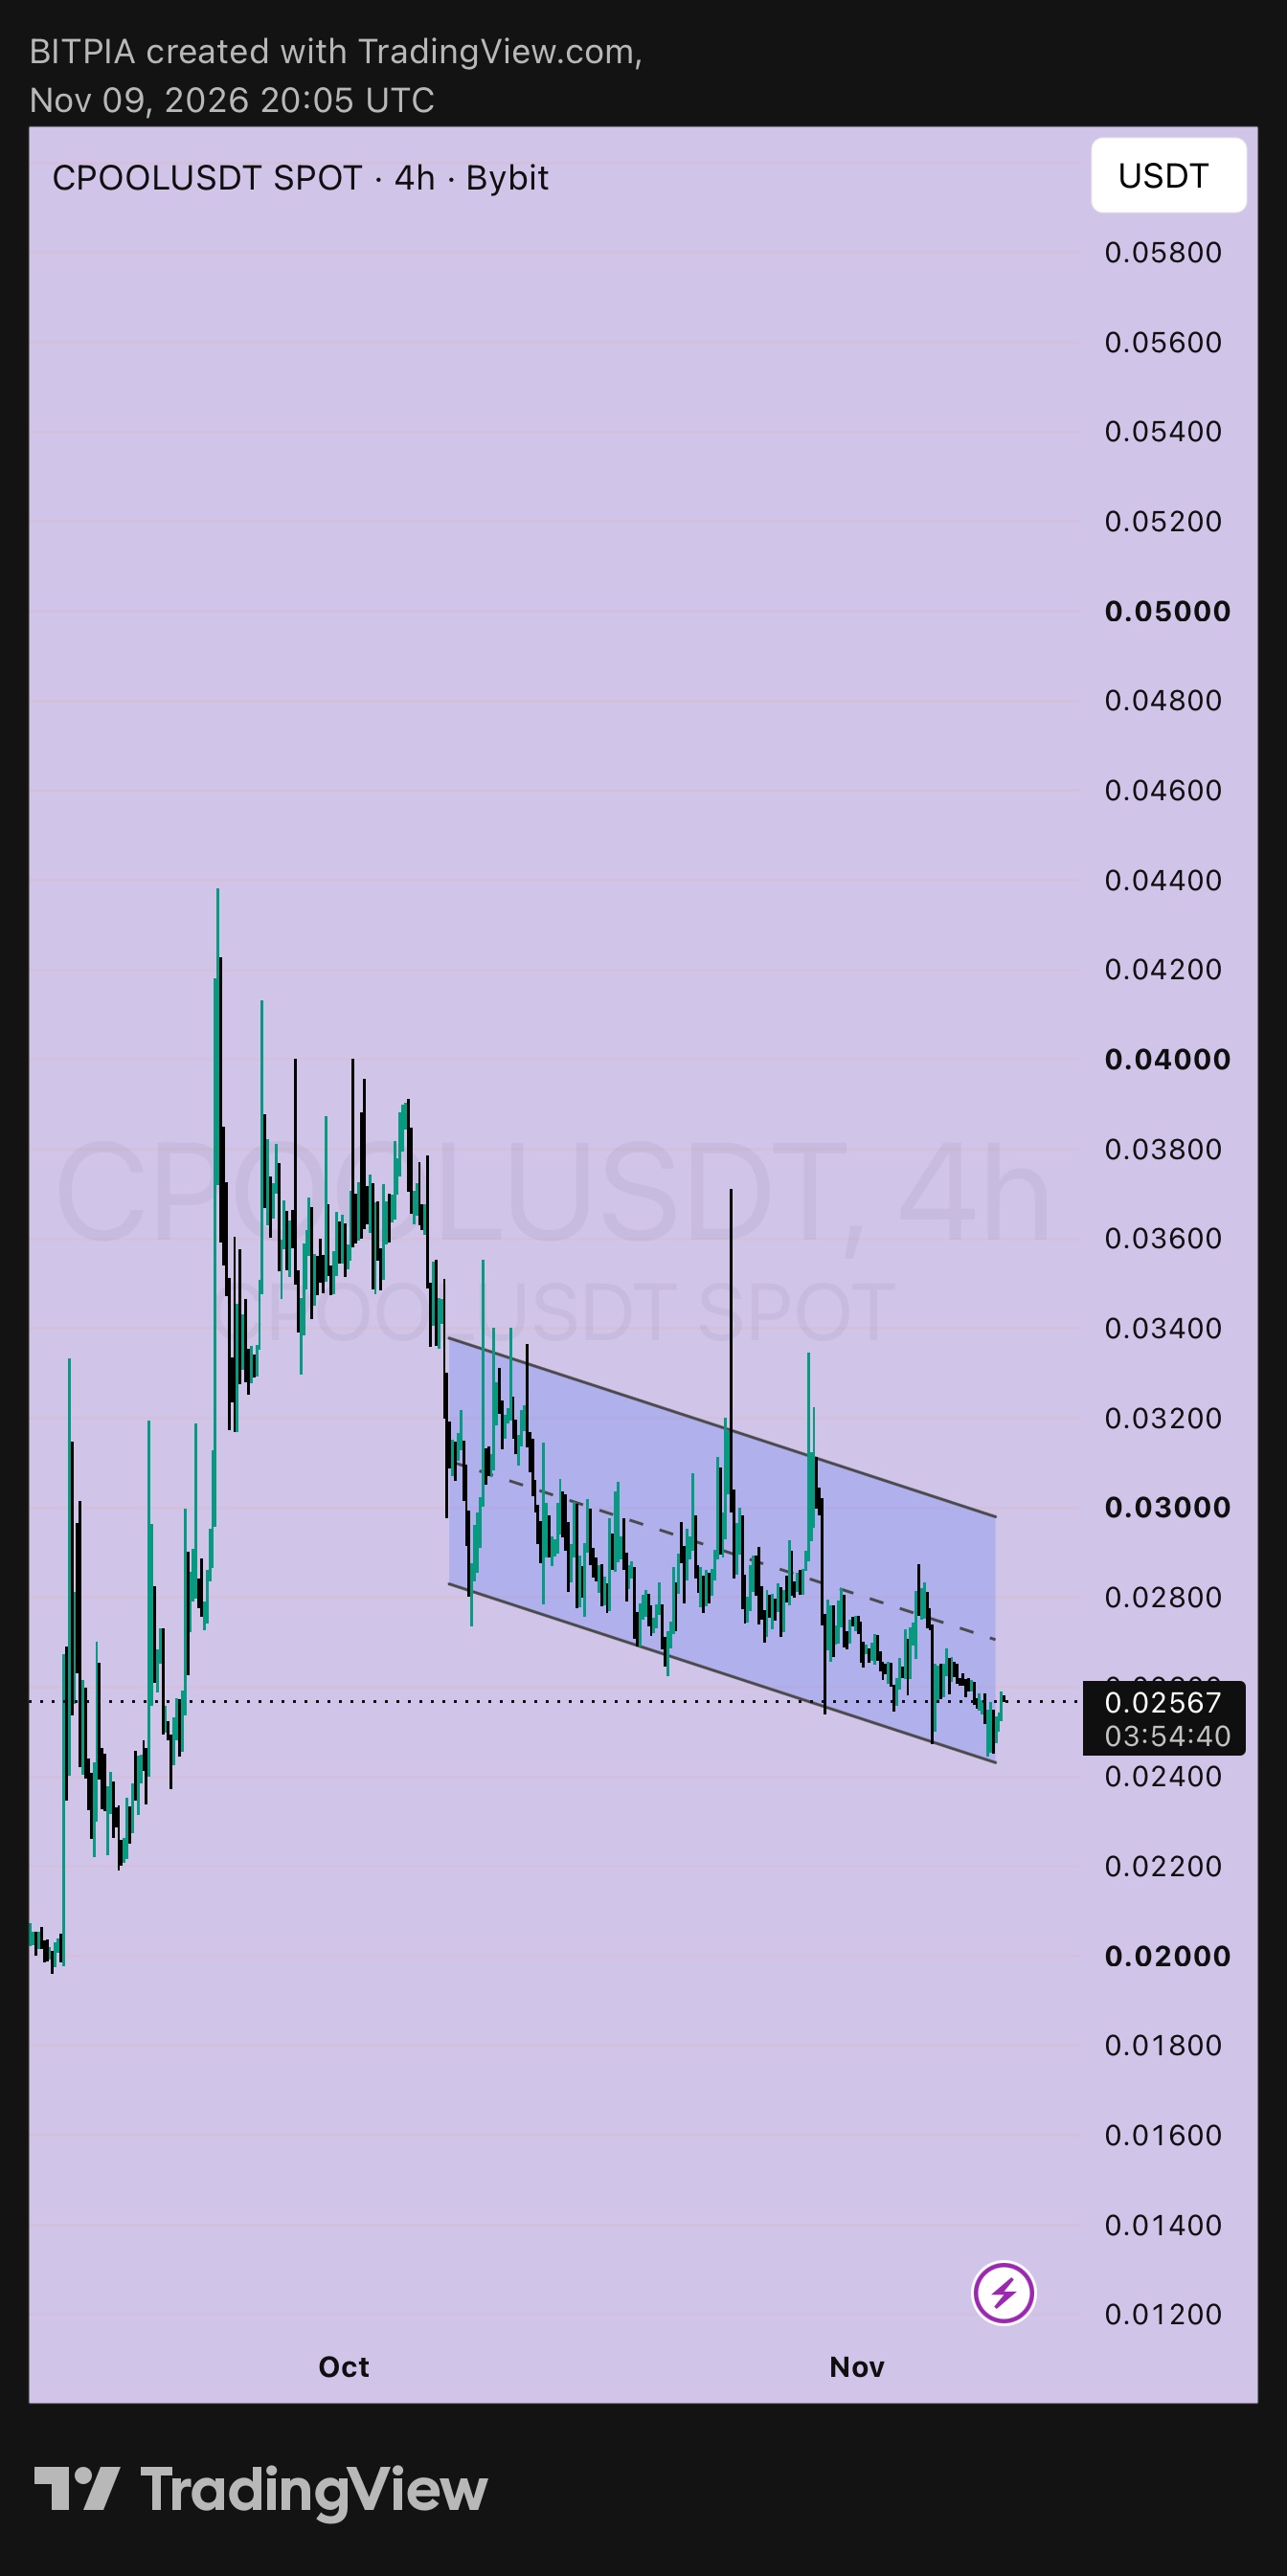
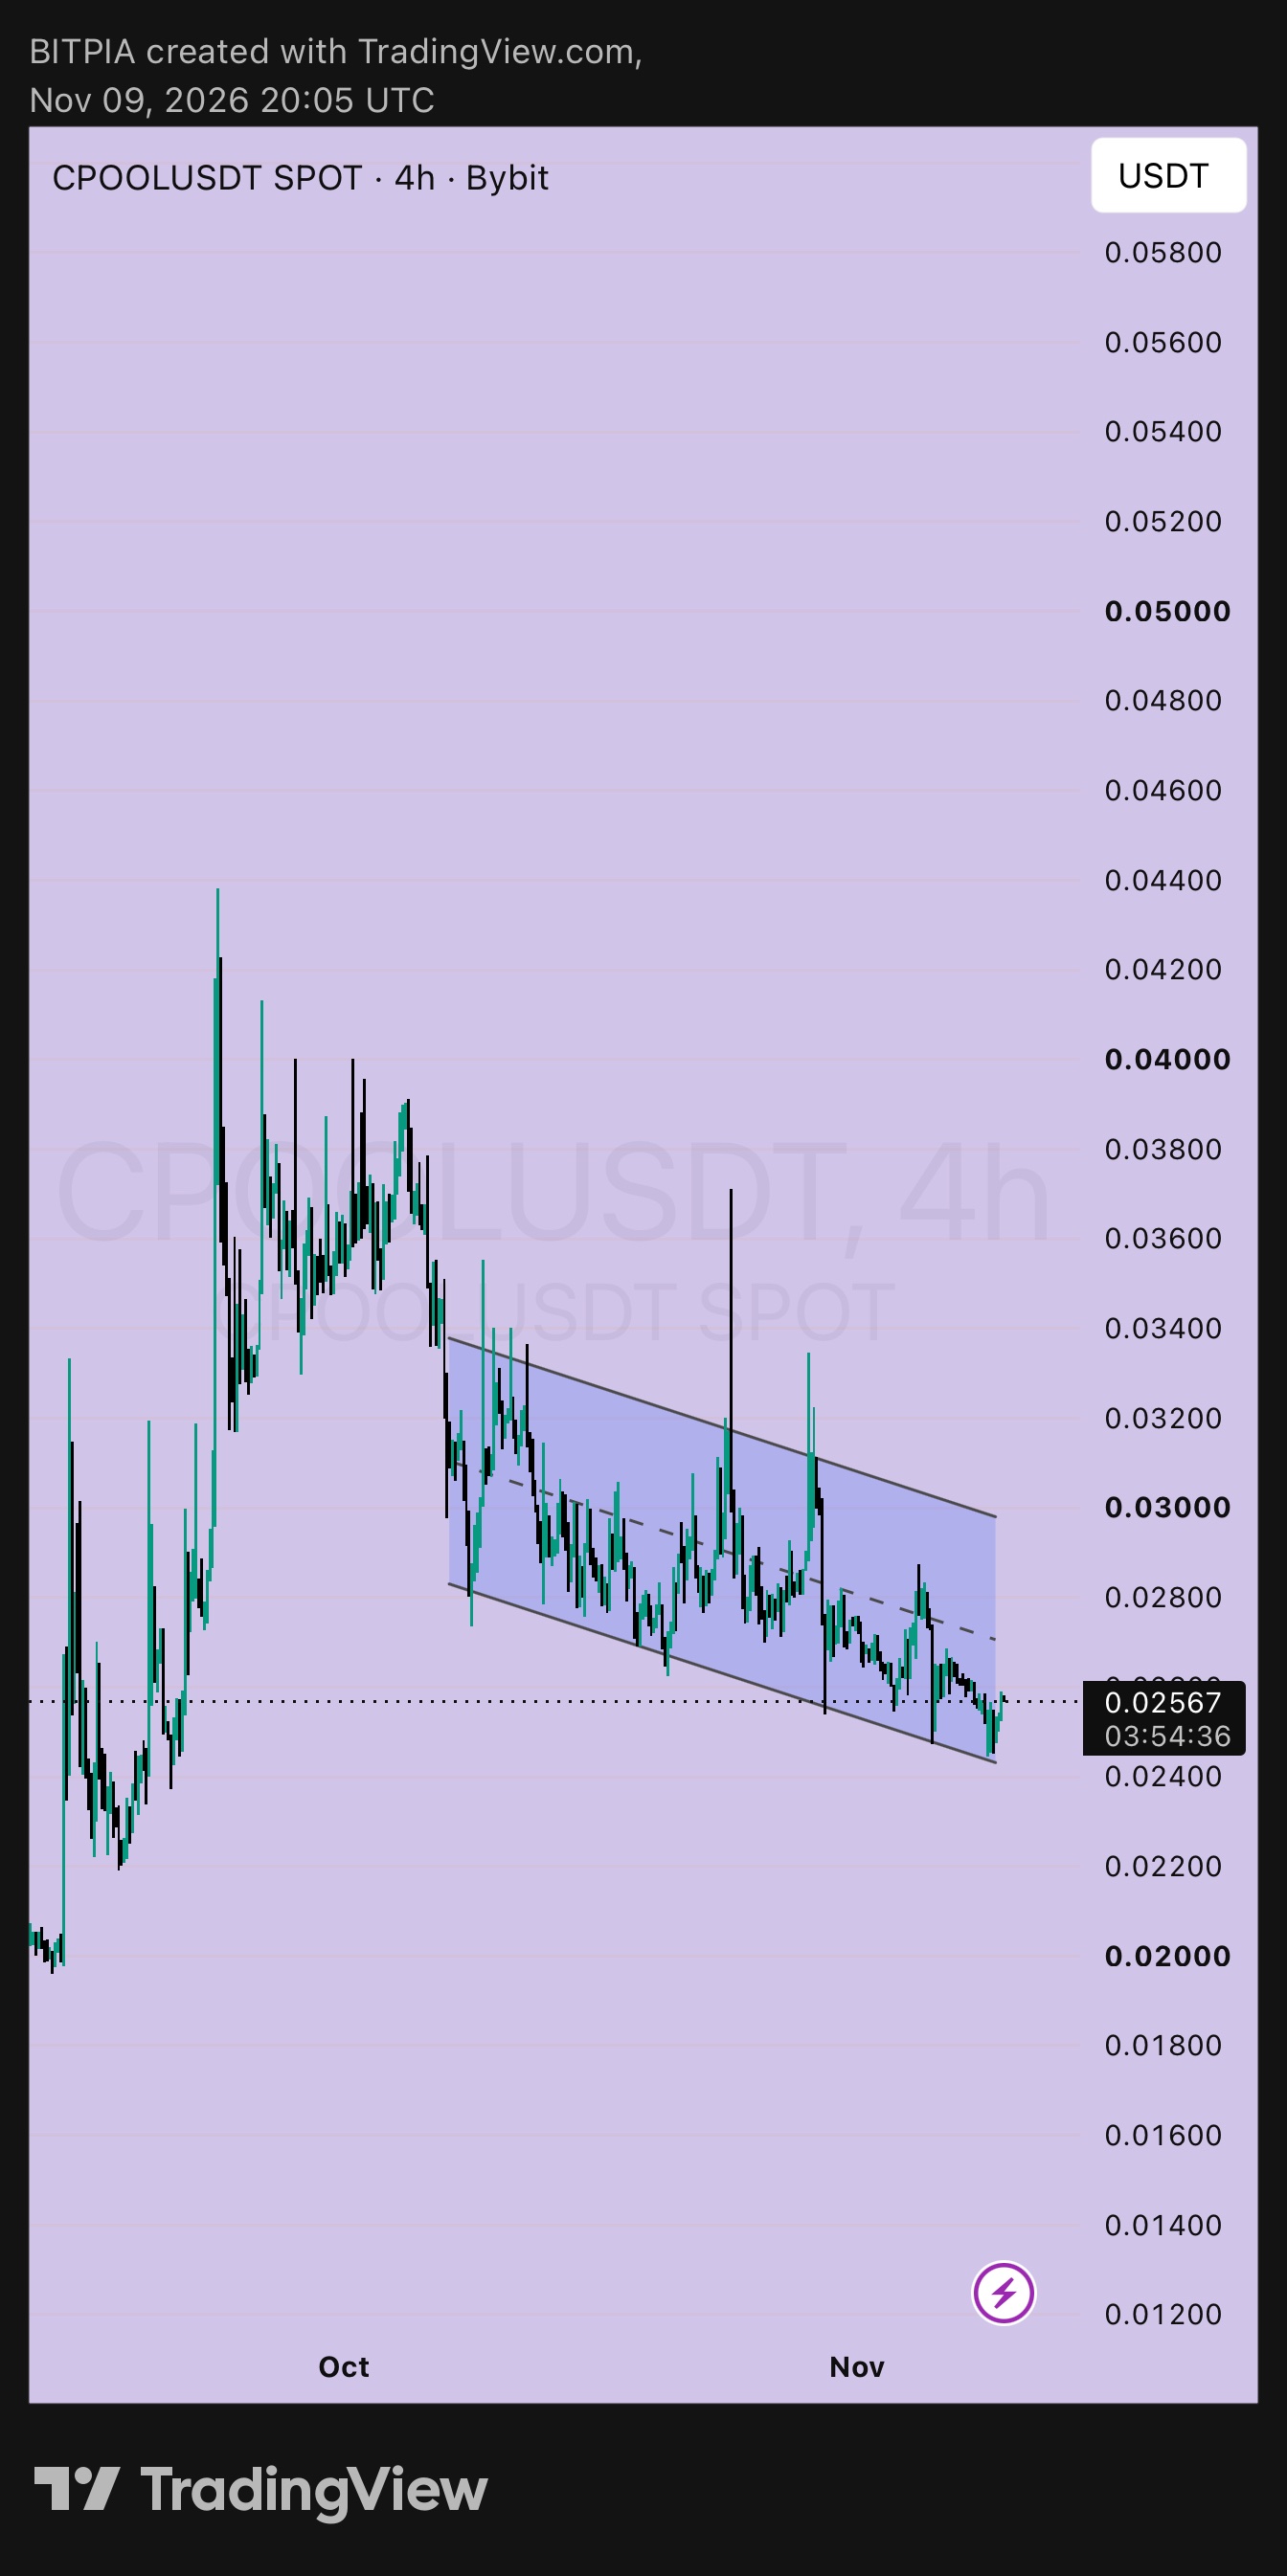
CPOOL 4h: three prices to remember 🔑 I used the latest of your two charts, with price at 0.02567. $CPOOLUSDT has been drifting down inside a falling channel since early October, and price is back near the lower line. If you remember only three prices on this chart, make it these. ➤ 0.0245: the floor ▸ The lower line and the recent lows, which buyers have defended several times ▸ Below it, the next area is the 0.0200 to 0.0220 base from September ➤ 0.0270: the middle ▸ The dashed centre line of the channel, and the first place I'd expect sellers ▸ It's also my first target ➤ 0.0300: the ceiling ▸ The upper line of the channel, with the older highs sitting above it at 0.0336 and 0.0370 ▸ A 4h close above it would be the first real sign that the channel is over ➤ Plan A: near the floor ▸ Entry: around 0.0250 ▸ Stop-loss: below 0.0235 ▸ Risk per unit: 0.0015 ▸ Target 1: 0.0270, +0.0020, about 1.3R ▸ Target 2: 0.0300, +0.0050, about 3.3R ▸ Target 3: 0.0340, +0.0090, about 6R ➤ Plan B: after the breakout ▸ Entry: around 0.0305, after a 4h close above 0.0300 ▸ Stop-loss: below 0.0280 ▸ Risk per unit: 0.0025 ▸ Targets: 0.0340 (about 1.4R) and 0.0370 (+0.0065, about 2.6R) ➤ Chase math At 0.02567 with the same stop, risk is 0.0022, and 0.0300 is about 2R away. Not terrible, but Plan A gives a better price if the floor is retested. ➤ What cancels it A 4h close under 0.0235 means the channel's lower line has failed. I'd step aside and watch the 0.0200 to 0.0220 base instead of guessing. Small size, and low leverage if you use perps. Not financial advice. Do your own research and only risk what you can afford to lose. #ByXIMPACT #WSOT2026
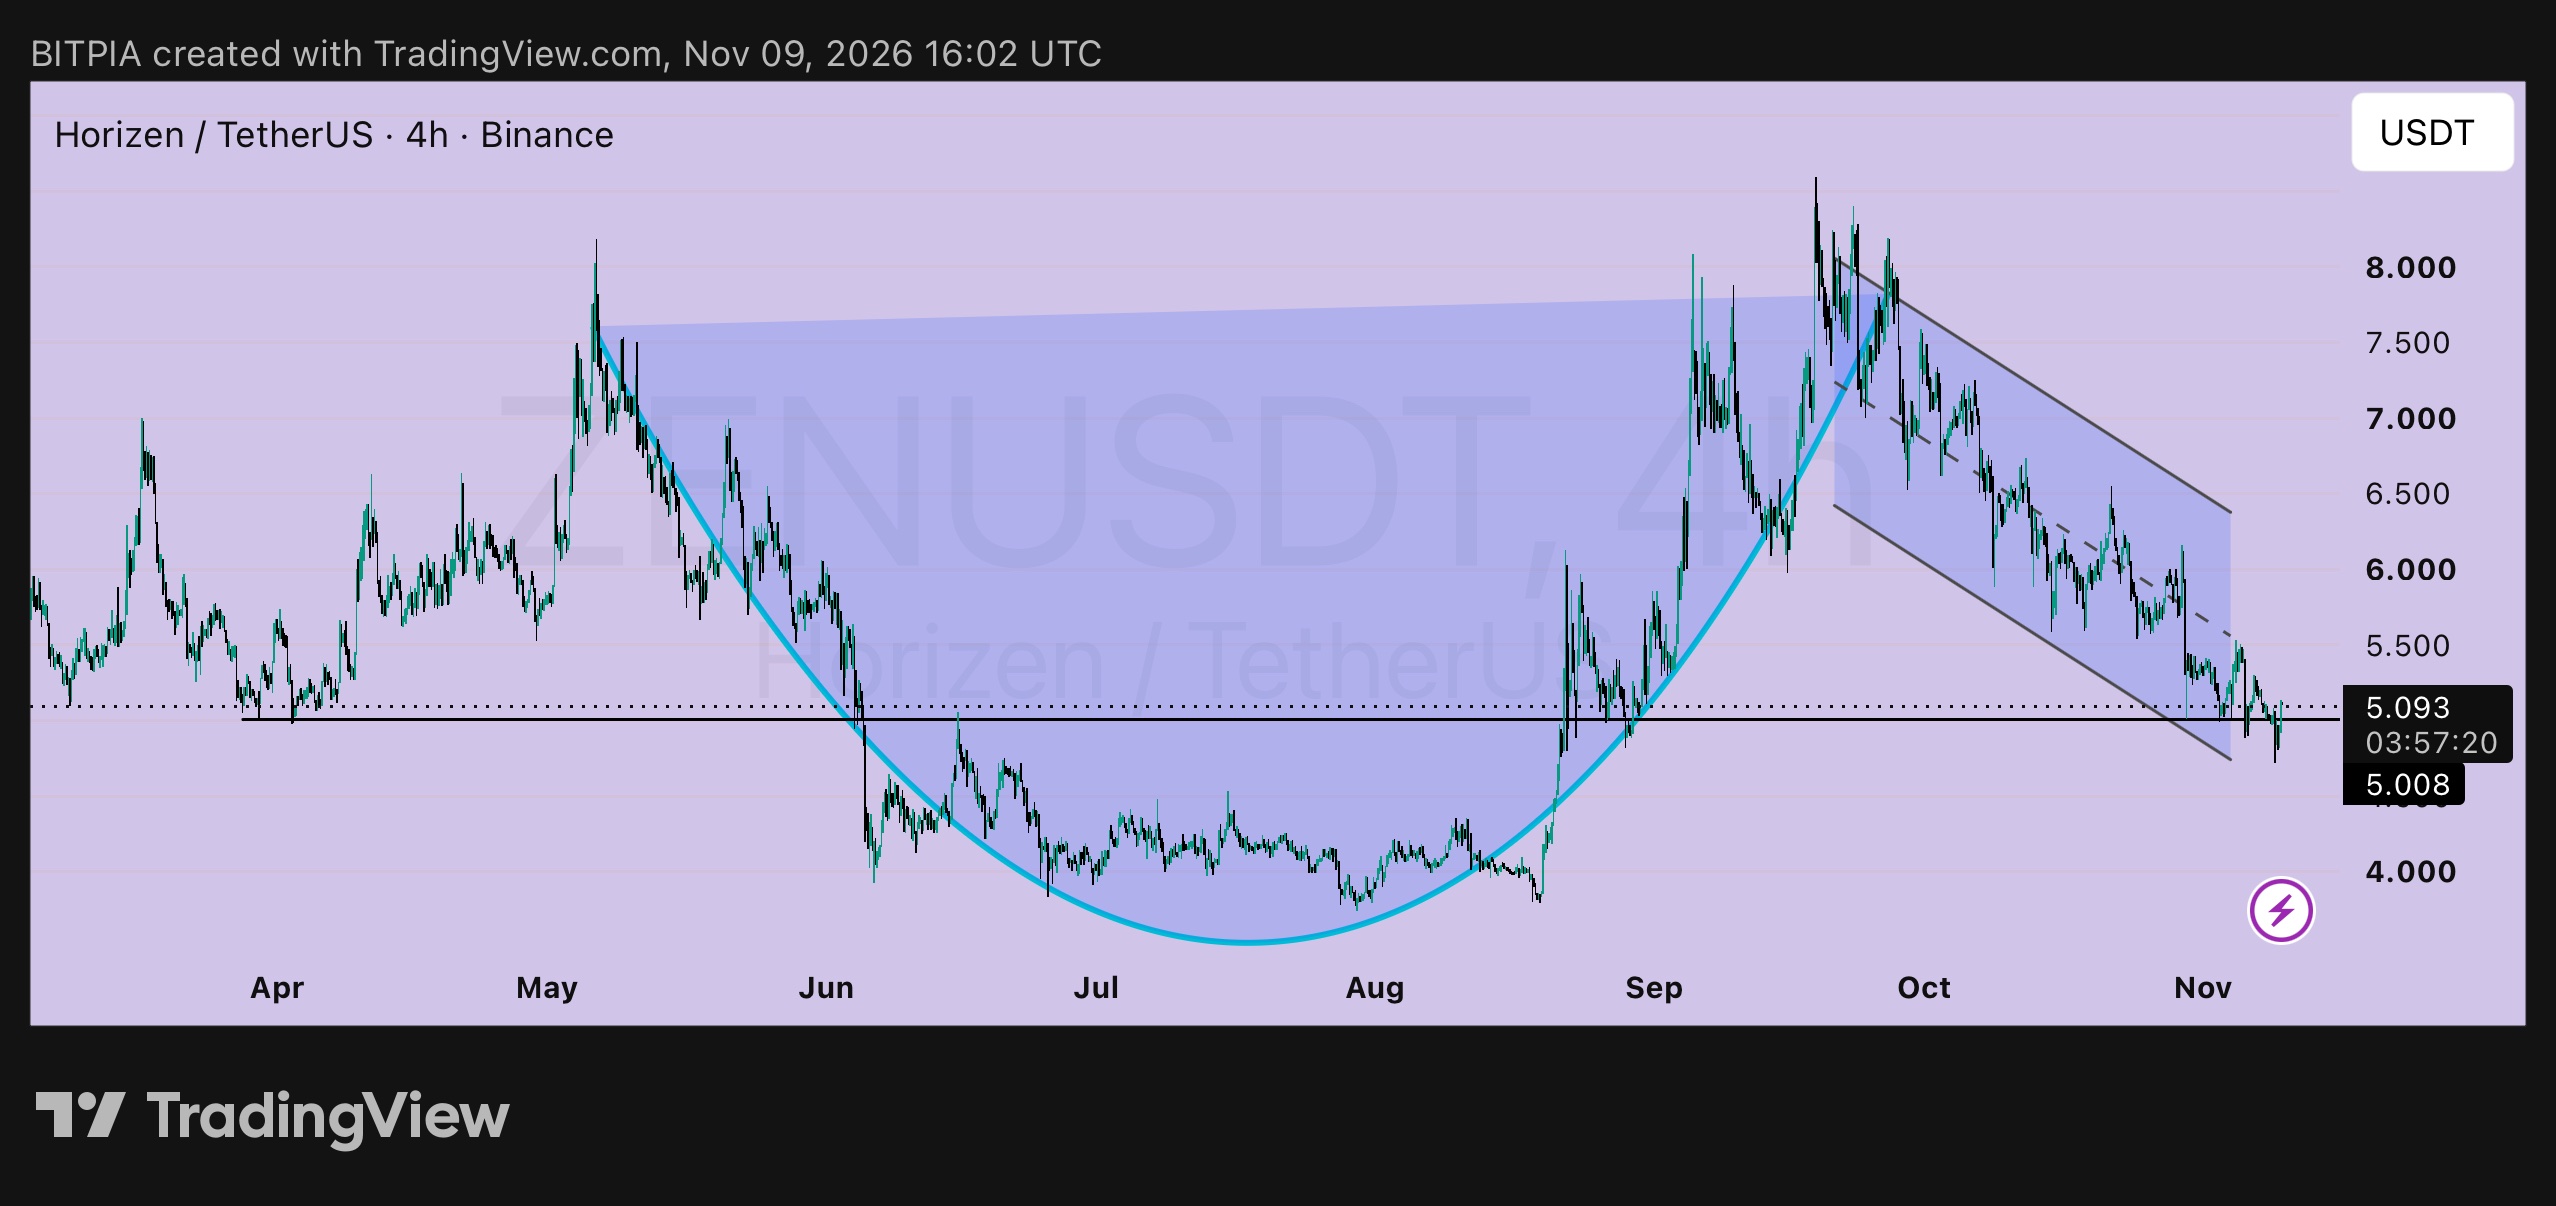
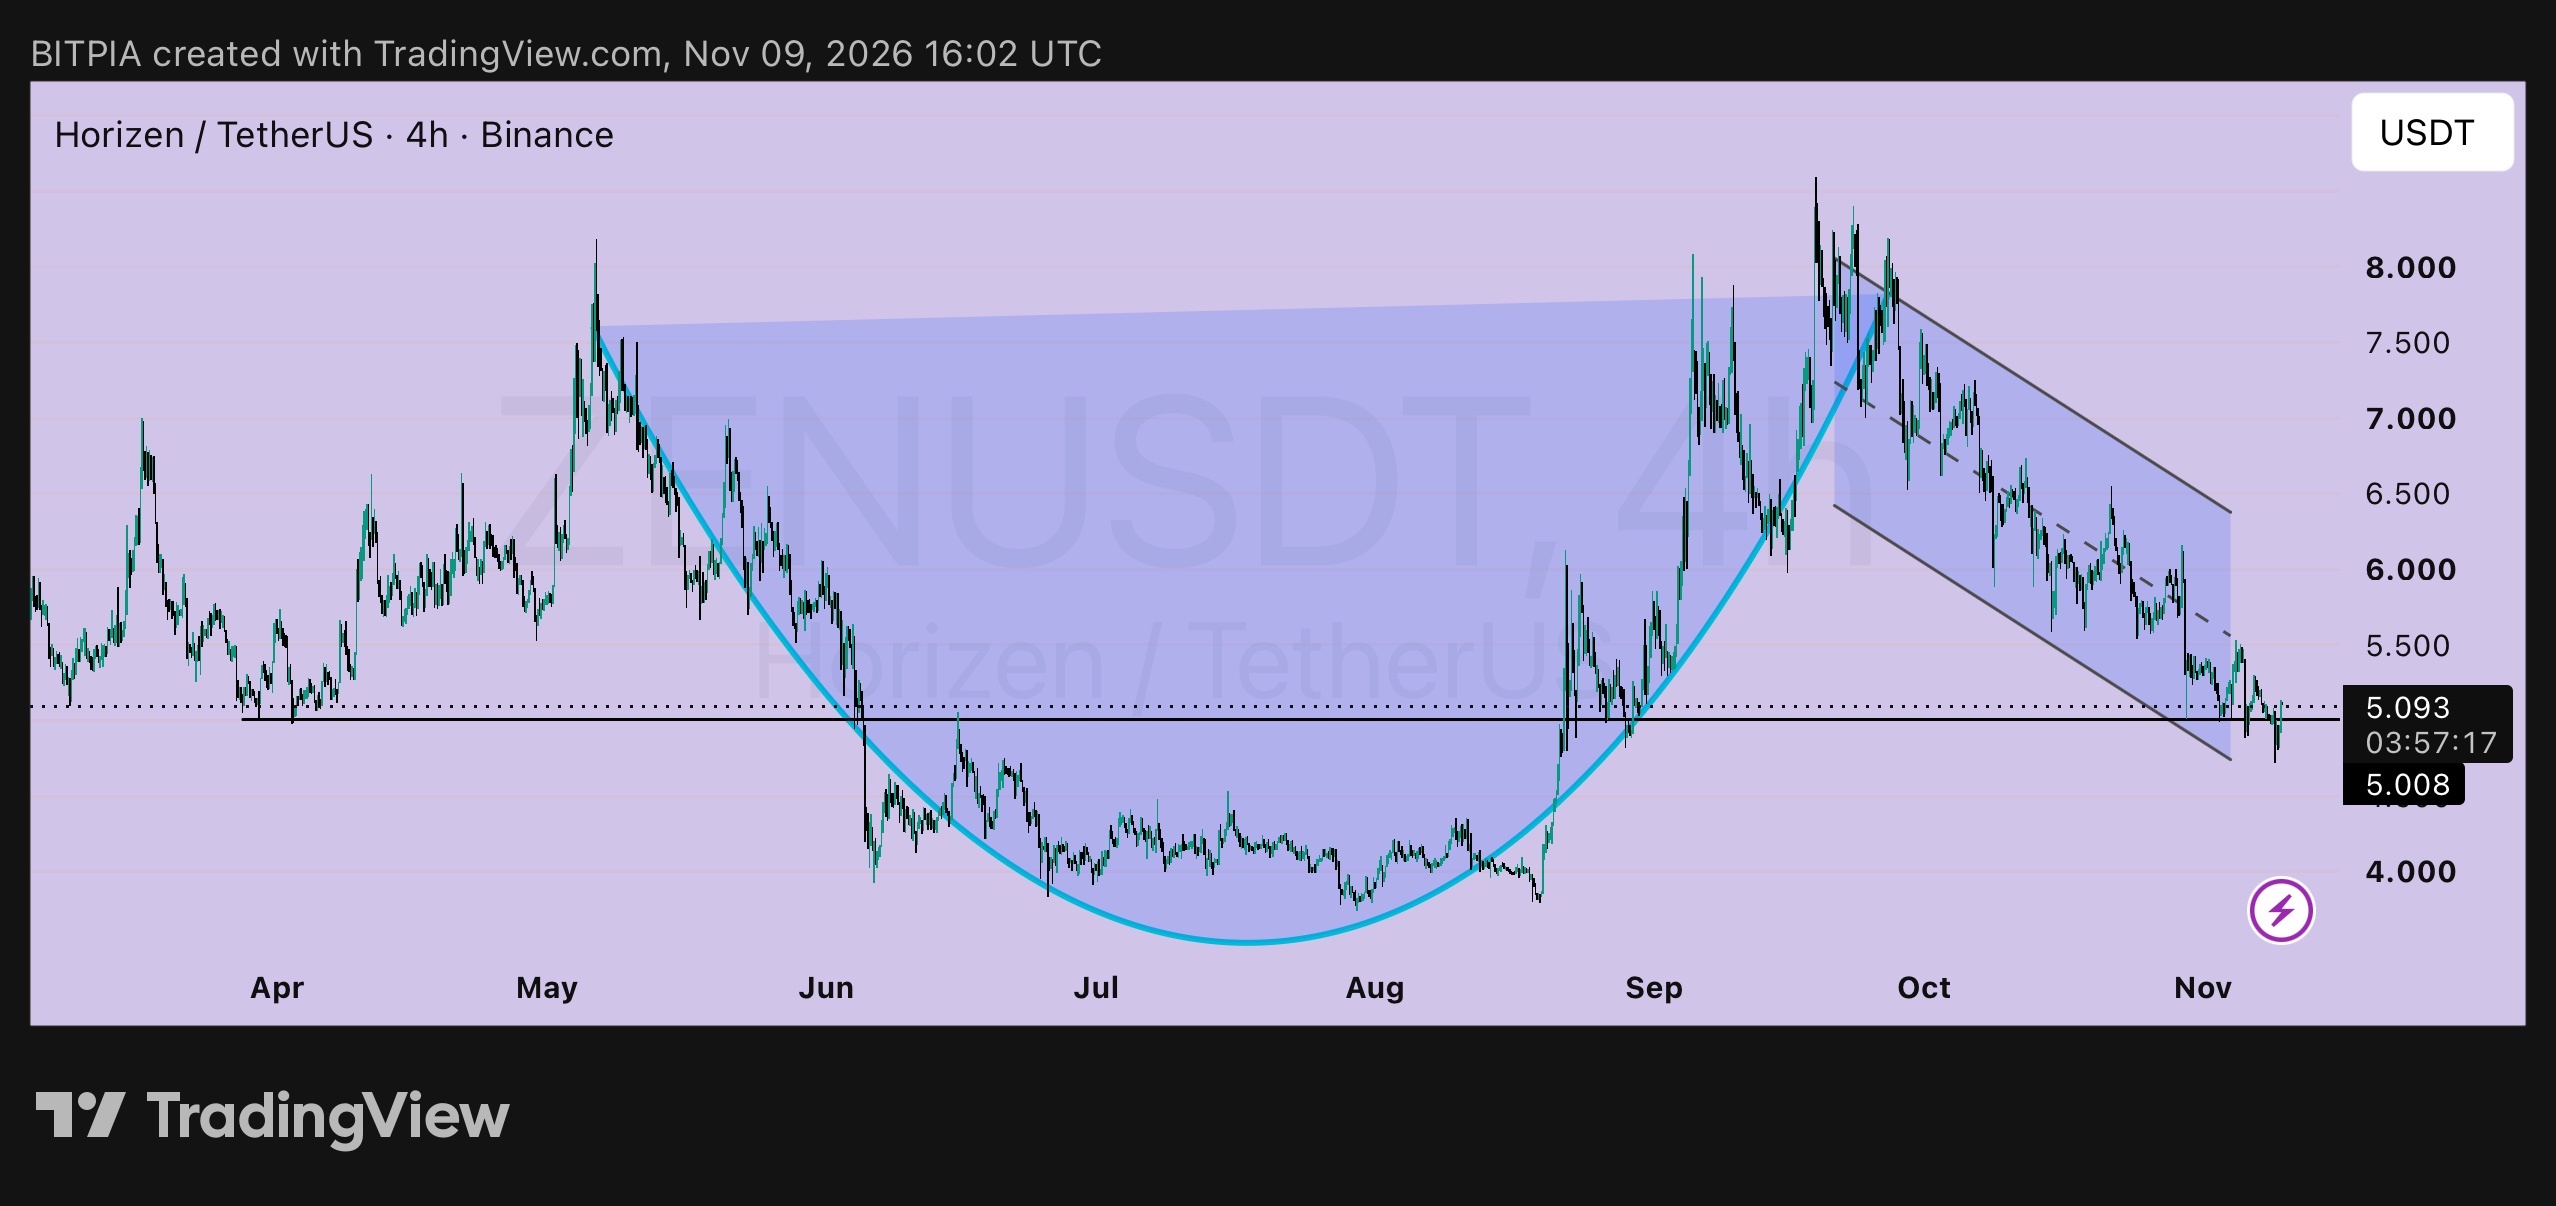
$ZEN: two timeframes, one story 🔭 I posted the daily $ZENUSDT chart on Nov 6 at 5.231 with a cup and handle plan. Now the 4h chart is at 5.093, so here's how the two views fit together. ➤ The daily view (the big picture) ▸ A rounded base from May to September, then a handle drifting down in a falling channel ▸ The cup rim sits near 7.8, and a daily close above the channel top near 6.4 would be the first sign of a breakout ▸ My early plan: entry 5.05, stop 4.65, risk 0.40 ➤ The 4h view (the details) ▸ Price is sitting on 5.008, the horizontal level that held in April and again in early September ▸ The dip this session reached about 4.97 and recovered, so buyers defended the level once more ▸ The channel's lower line sits just under, near 4.85 to 4.90 ➤ How they fit The handle looks like it's testing its lower end. If 5.008 holds and the 4h chart starts making higher lows, the early entry is working. If it doesn't, the 4.65 stop is there to keep the loss small. ➤ If you entered at 5.05 ▸ About +0.04, essentially flat ▸ Stop-loss stays at 4.65. I'm not tightening it just because price is near the level ▸ Targets: 6.40 (+1.35, about 3.4R) and 7.80 (+2.75, about 6.9R) ➤ If you're waiting for proof ▸ Trigger: a 4h close above 5.50 ▸ Entry: around 5.55 ▸ Stop-loss: below 5.00 ▸ Risk per unit: 0.55 ▸ Targets: 6.40 (about 1.5R) and 7.80 (+2.25, about 4.1R) ➤ What cancels it A 4h close under 4.85 would mean the 5.008 level and the channel's lower line have both failed, and I'd step aside. The daily plan fails below 4.65. Daily patterns take weeks, so small size, and low leverage if you use perps. Not financial advice. Do your own research and only risk what you can afford to lose. #ByXIMPACT #WSOT2026