Mdleganttop1
40770點贊10分享862粉絲6關注
💹 Bybit Square | Trade Smart, Earn Big 🚀 Crypto Moves | Bybit Square Hustler 💎 Trade 💰 Learn 📚 Grow 🌱 | Bybit Square 📈 Market Insights & Smart Trading | Bybit S
💹 Bybit Square | Trade Smart, Earn Big 🚀 Crypto Moves | Bybit Square Hustler 💎 Trade 💰 Learn 📚 Grow 🌱 | Bybit Square 📈 Market Insights & Smart Trading | Bybit S
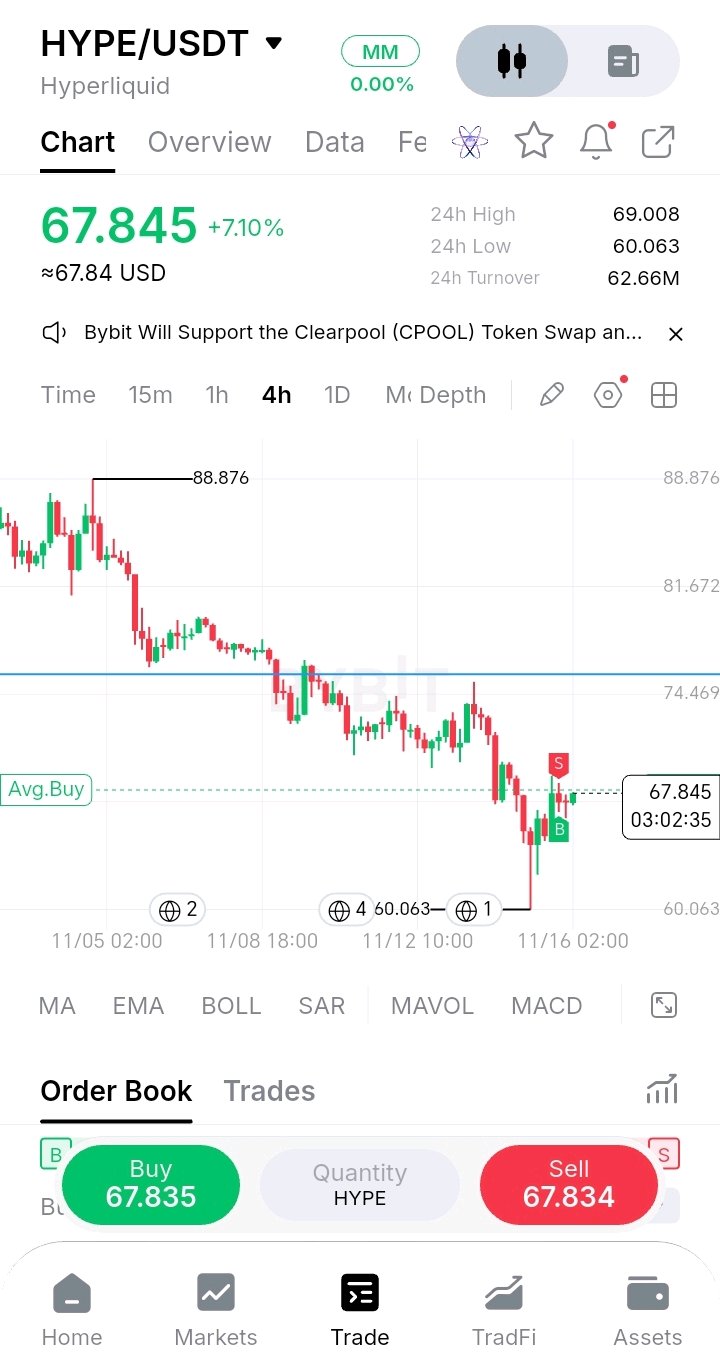
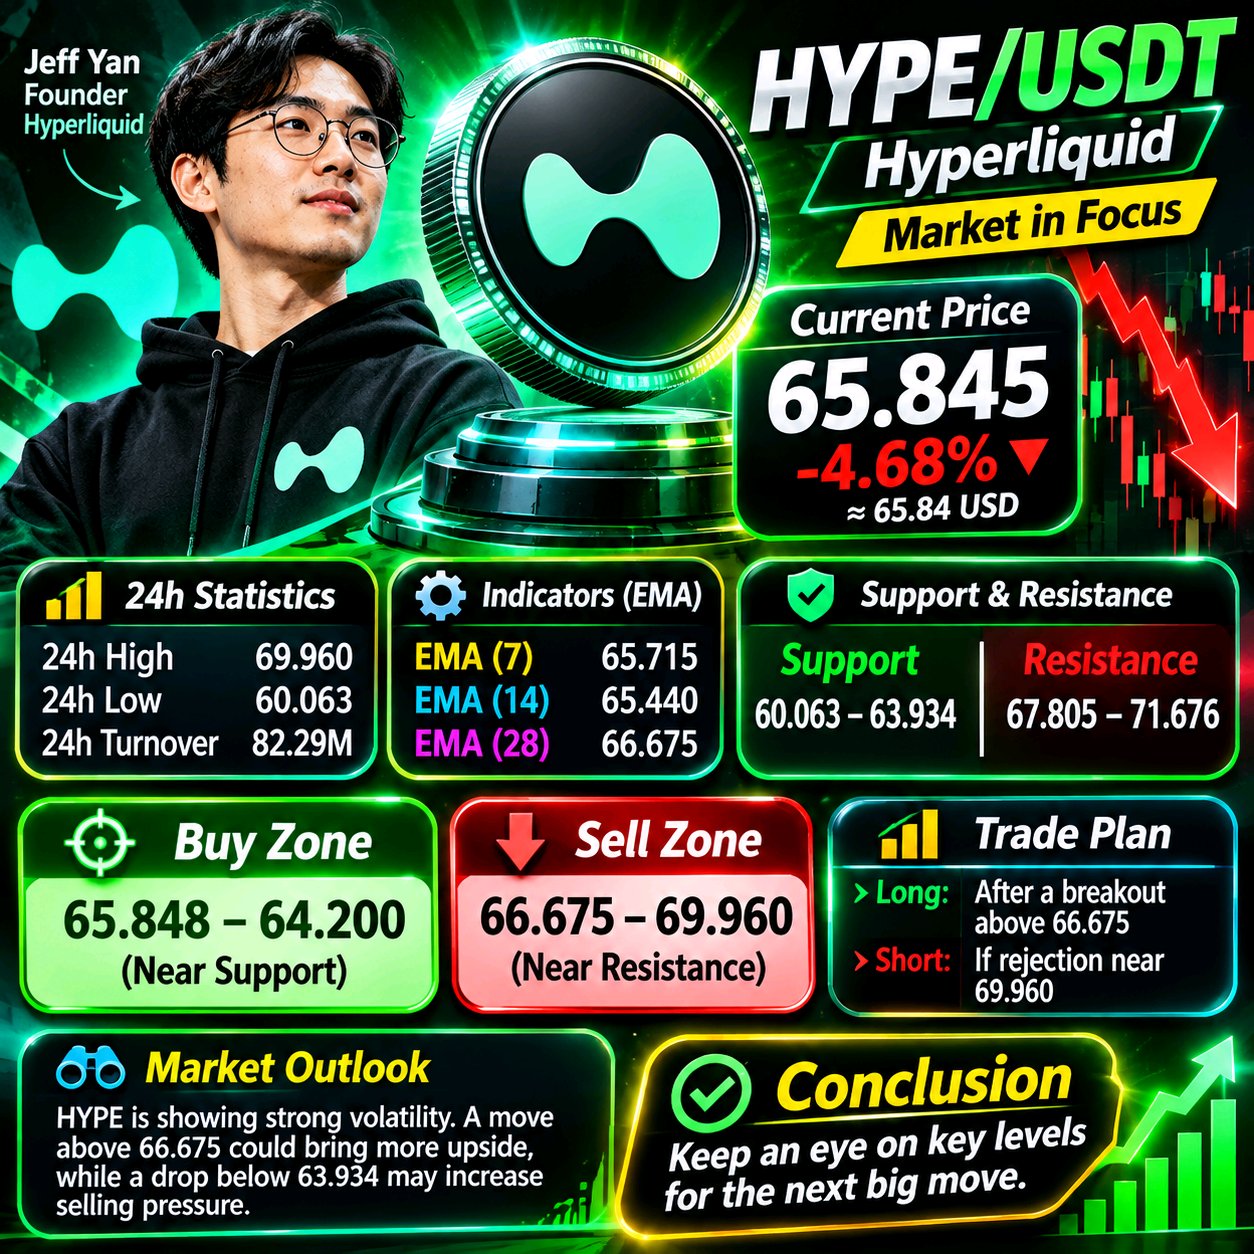
HYPE 強勢反彈 7.1% — 前方是轉折點嗎? Hyperliquid 在經歷長時間下跌後,正展現強勁的復甦跡象。HYPE 已回升至 67.845 美元,24 小時內上漲 7.10%,此前在 60.063 美元附近出現劇烈拒絕。最新的陽線暗示買方正在回歸,但單次強勁反彈並不代表趨勢已完全逆轉。 市場結構 4 小時線圖仍反映出較廣泛的看跌結構,價格先前曾從 88.876 美元下跌。然而,最新的反彈顯示需求已在近期低點附近浮現。 立即支撐位:65.00–63.00 美元 主要支撐位:60.063 美元 立即壓力位:69.008 美元 主要壓力位:74.469 美元 看漲路徑 若能持續站穩 69.008 美元上方,買方將有機會挑戰 72.00 美元及 74.469 美元的壓力區間。若能成功突破並回測,將增強復甦情境的可信度。 當復甦失敗時 如果 HYPE 失守 65 美元區域且賣壓加劇,反彈力道可能會減弱。更深層的修正可能會使價格重新回測 63 美元區域,甚至再次回到 60.063 美元。 我的市場觀點 有趣的不僅僅是 7% 的漲幅,而是 HYPE 在觸及近期低點後的反應。買方已經採取了初步行動,但他們仍需克服上方的壓力。我傾向於等待確認訊號,而不是盲目追逐動能,並會保持風險控管。 HYPE 會走向 74 美元,還是會被賣方中斷這次反彈? #HYPE #Hyperliquid #加密貨幣市場 #WSOT2026 #WSOT曬出你的AI交易即可贏取10USDT #黃仁勳離任考驗Nvidia的AI領導地位 #美國PPI測試「更高更久」交易策略 #美國通膨升溫,升息押注升高 $HYPEUSDT $BTCUSDT

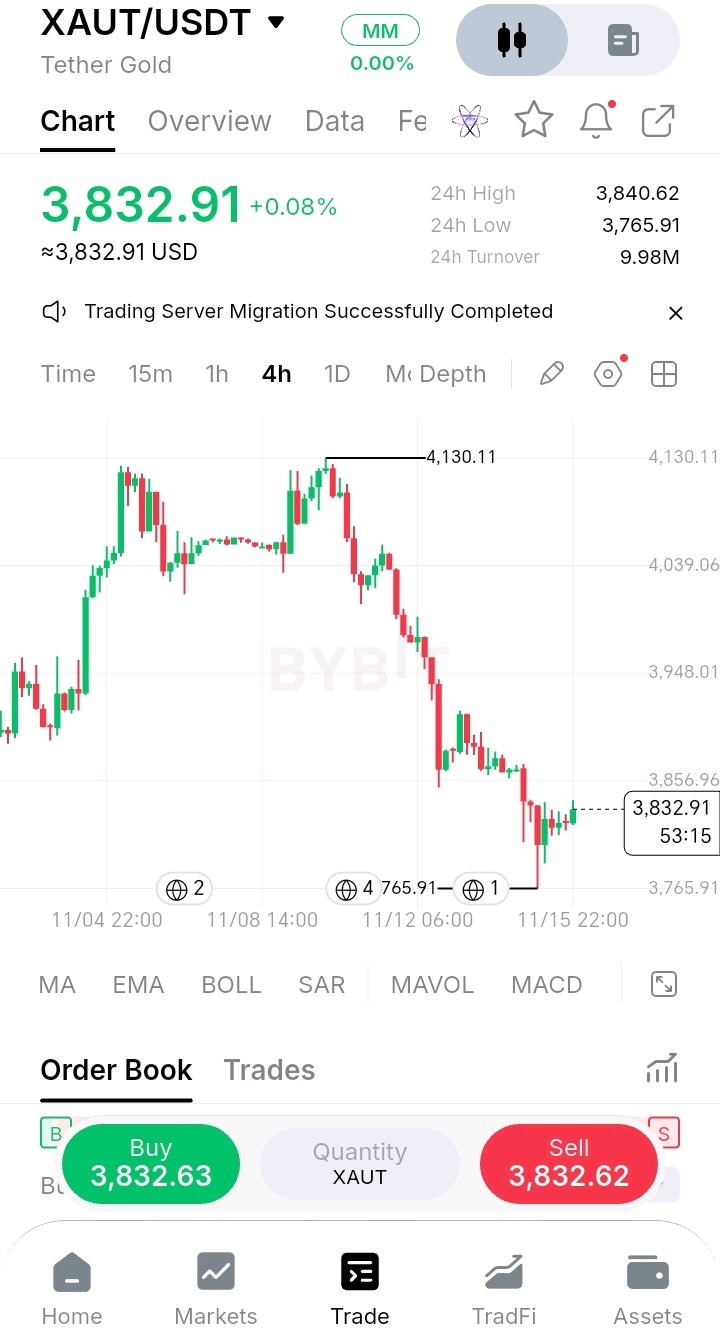
🏔️ 雙頂形態奏效,隨後行情持續下探。 我不想單憑第一次反彈看起來不錯,就斷定 $XAUT 已經觸底。我希望看到 4 小時線收盤價高於 3,872.51,因為那是現在轉為阻力位的舊底部。 以下是 4 小時圖表顯示的內容: 🔹 雙頂形態:黃金價格在 4,125 附近見頂,回落至約 4,005,隨後反彈並再次於 4,130.11 見頂。在同一水平出現兩個高點,中間夾著一個低點,這是典型的雙頂形態。 🔹 跌破:當價格跌破 4,005 的頸線時,該形態便已確立。這類形態常見的目標位大約在 3,880。 🔹 超跌:黃金跌幅遠超預期,觸及 3,765.91 的低點,比 4,130 的高點下跌了約 8.8%。跌勢超過了教科書式的目標位。 🔹 反彈:從低點算起,價格已經回升約 1.8% 至 3,832.91。第一次反彈觸及 3,910 區域,隨後是 3,870,而最近幾次的反彈幅度變得更小、更緊湊。 🔹 舊底部:早先的 3,872.51 水平目前位於價格上方。跌破的支撐位在首次回測時,往往會轉變為阻力位。 🔹 區間:24 小時高點 3,840.62,低點 3,765.91,成交量 998 萬。與之前的拋售相比,市場已經平靜下來。 🟢 看漲:4 小時線收盤高於 3,872.51,接著看 3,948。這將表明買方正在奪回跌勢開始之前的區域。 🔴 看跌:4 小時線收盤低於 3,765.91,且在此圖表上下方沒有明確的支撐位。 型態能提供目標,但無法保證結果。一旦價格跌破目標位,下一個需要觀察的關鍵位就是剛失守的那個價位。 你在關注 $XAUT 還是其他幣種? #XAUT #黃金 #加密貨幣 #BinanceSquare #WSOT2026 #WSOT曬出你的AI交易即可贏取10USDT #黃仁勳離任考驗Nvidia的AI領導地位 #美國PPI測試「更高更久」交易策略 #美國通膨升溫,升息押注升高 $XAUTUSDT $BTCUSDT

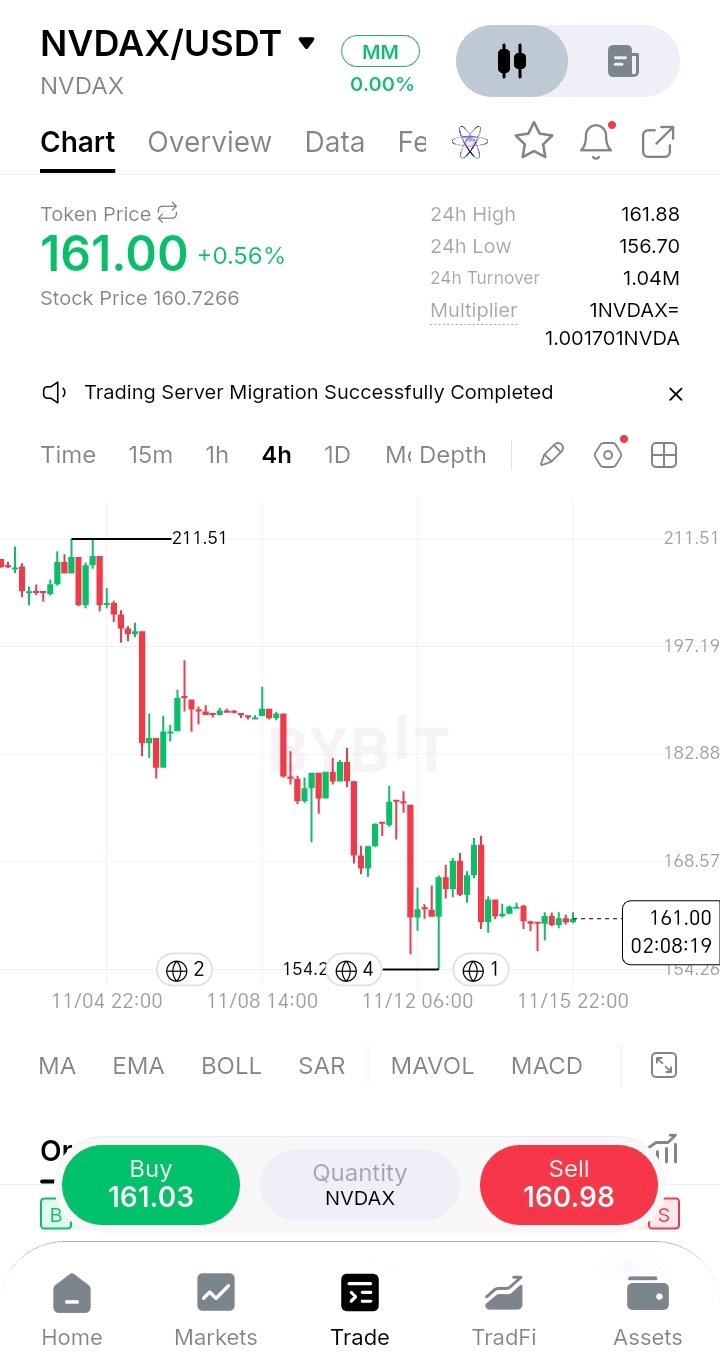
🧘 After a 27% slide, $NVDAX has gone almost silent. I don't want to call a bottom on $NVDAX just because candles got small. I want to see a 4H close above 168.57, because that's the first marked level that would break the sequence of lower highs. Here's what the 4H chart shows: 🔹 The slide: From the 211.51 high, price dropped to a low of about 154.2, roughly 27%, in a staircase of lower highs and lower lows. That's also well below the 186.64 close from the last NVDA chart. 🔹 The bounce: After the low, price recovered to the low 170s, was rejected, and has since pulled back to 161.00. 🔹 The silence: The last several candles are tiny and tightly packed. The 24H range is only 156.70 to 161.88, about 3.3%, so the market is waiting. 🔹 The token vs the stock: The token price is 161.00 and the underlying stock price is 160.7266, a gap of about 0.17%. The multiplier is 1 NVDAX = 1.0017 NVDA, so the token tracks the stock closely. 🔹 The market: $NVDAX trades around the clock, so it can move on weekends and overnight when the regular stock market is closed. 24H turnover is 1.04M. 🟢 Bullish: a 4H close above 168.57, then the low 170s where the last bounce failed. That would break the pattern of lower highs. 🔴 Bearish: a 4H close under 156.70 puts the 154.2 low back in play, with no marked support below it on this chart. Quiet charts after a big drop are decisions waiting to happen. The first close outside the range usually picks the side. Are you watching $NVDAX or another stock? #NVDAX #NVIDIA #Crypto #BinanceSquare #WSOT2026 #WSOTShowYourAITradeToEarn10USDT #JensenHuangExitTestsNvidiasAILeadership #USPPITestsTheHigherForLongerTrade #USInflationRunsHotAndRateHikeBetsRise $NVDAXUSDT $HYPEUSDT

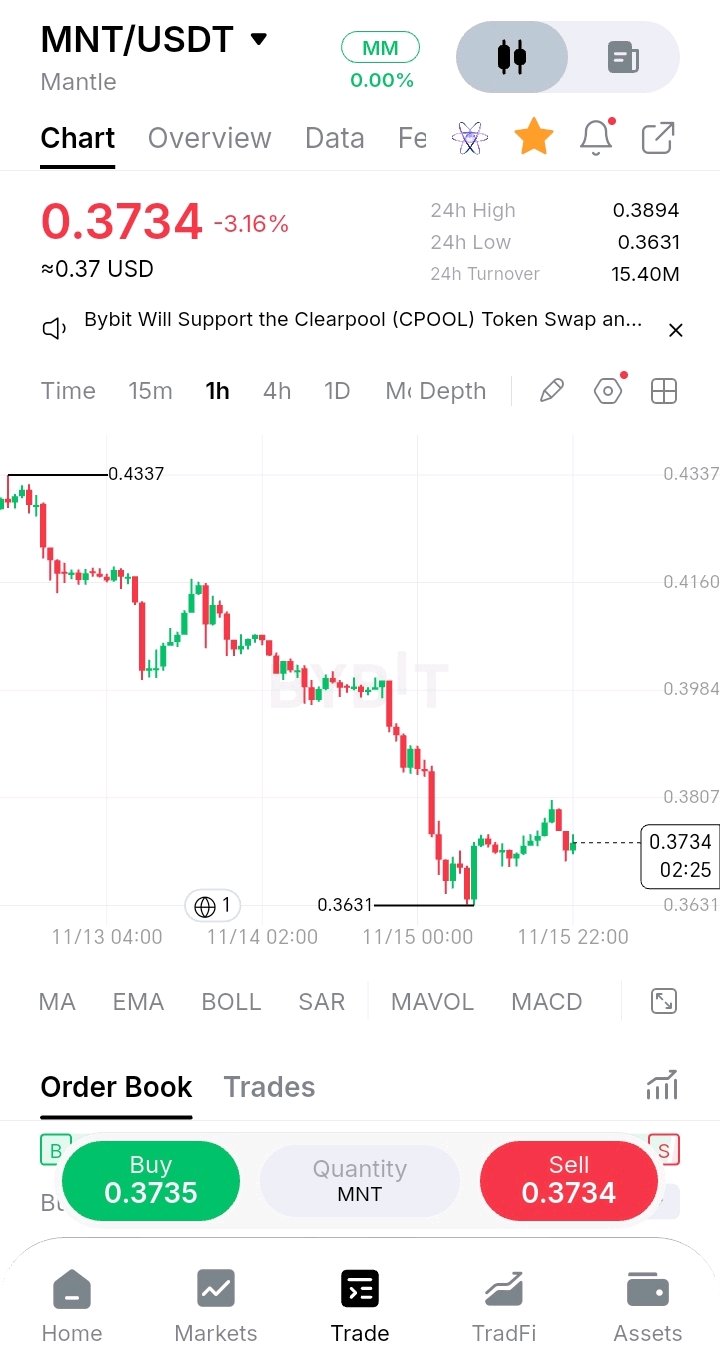
🪜 Every bounce on $MNT is getting smaller than the last. I don't want to buy $MNT just because it's down 16% and looks cheap. I want to see a 1H close above 0.3807, because that's the level that capped the latest bounce. Here's what the 1H chart shows: 🔹 The slide: From the 0.4337 high, $MNT has dropped to a low of 0.3631, about 16%, in a steady staircase of lower highs and lower lows. 🔹 The shrinking bounces: The first bounce reached about 0.4160, the next about 0.4075, then 0.3984, and the latest only reached 0.3807. Each recovery is shorter than the one before it. 🔹 The latest low: A sharp drop printed the 0.3631 low, followed by a V-shaped bounce of nearly 5%. Since then price has pulled back to 0.3734. 🔹 The range: 24H high 0.3894 and low 0.3631, with 24H turnover at 15.40M. The market is active, not quiet. 🔹 The support: 0.3631 is the lowest point on this chart. There is no marked support below it, so a break would be in open space. 🟢 Bullish: a 1H close above 0.3807, then 0.3984. Breaking the pattern of lower highs would be the first real sign of a change. 🔴 Bearish: a 1H close under 0.3631 extends the staircase with no marked floor nearby. Shrinking bounces show buyers losing strength. The first bounce that breaks the pattern is the one to watch. Are you watching $MNT or another coin? #MNT #Mantle #Crypto #BinanceSquare #WSOT2026 #WSOTShowYourAITradeToEarn10USDT #JensenHuangExitTestsNvidiasAILeadership #USPPITestsTheHigherForLongerTrade #USInflationRunsHotAndRateHikeBetsRise $MNTUSDT $BTCUSDT

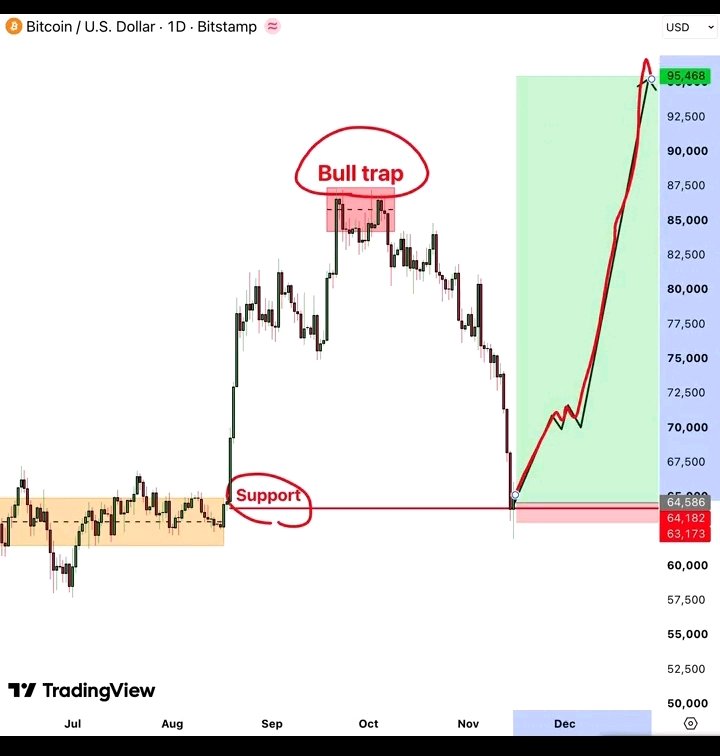
比特幣:64,000 美元的反應可能改變一切 比特幣近期的價格走勢呈現出一個有趣的可能:一個過去曾作為發射台的主要支撐區域,或許正準備再次扮演這個角色。但這一次,市場有重要的事情需要證明。 圖表凸顯了 64,586 美元附近的潛在復甦結構,這個區域此前在比特幣加速衝向 85,000–87,000 美元區間前,支撐了一段長時間的盤整。近期回落至此區域,使其對於下一個方向性的走勢顯得尤為重要。 多頭陷阱的教訓 早前衝向 85,000–87,000 美元的漲勢未能建立持續的強勢。那次拒絕後隨之而來的是漫長的下跌,這顯示了單靠突破是不夠的。買方需要的是後續跟進,而不僅僅是短暫的價格飆升。 為何 64,586 美元至關重要 這是該配置中的核心支撐參考點。如果比特幣能維持在該區域上方並開始構築更高低點,復甦情境將變得更具建設性。附近的 63,173–64,182 美元區域代表圖表上標註的下行風險區。 潛在復甦路線 圖示的預測建議了幾個可能的階段: - 70,000–72,500 美元:初步復甦與動能測試。 - 75,000–77,500 美元:中期阻力區域。 - 82,500–85,000 美元:更強勁的復甦挑戰。 - 95,468 美元:配置中顯示的延伸上行預測。 這些是預測的參考區域,而非確定的目標。 交易觀點 看漲倉位需要證據顯示 64,586 美元守住,隨後是令人信服的復甦和持續的買盤壓力。日線收盤價若低於 63,173 美元,將會嚴重削弱圖示的看漲情境。 我的觀點 這個配置中最有趣的部分不是預測朝 95,000 美元邁進,而是舊有的盤整區可能成為新一輪復甦的基礎。比特幣必須先證明買方能夠捍衛這一區域。如果發生這種情況,市場可能會開始發展出一種與導致近期下跌的結構截然不同的型態。 耐心與確認在此至關重要。強勁的復甦在形成趨勢前需要打好基礎。#WSOT曬出你的AI交易即可贏取10USDT #黃仁勳離任考驗Nvidia的AI領導地位 #美國PPI測試「更高更久」交易策略 #美國通膨升溫,升息押注升高 #SanDisk 宣佈 8 比 1 股票分割 $BTCUSDT $HYPEUSDT
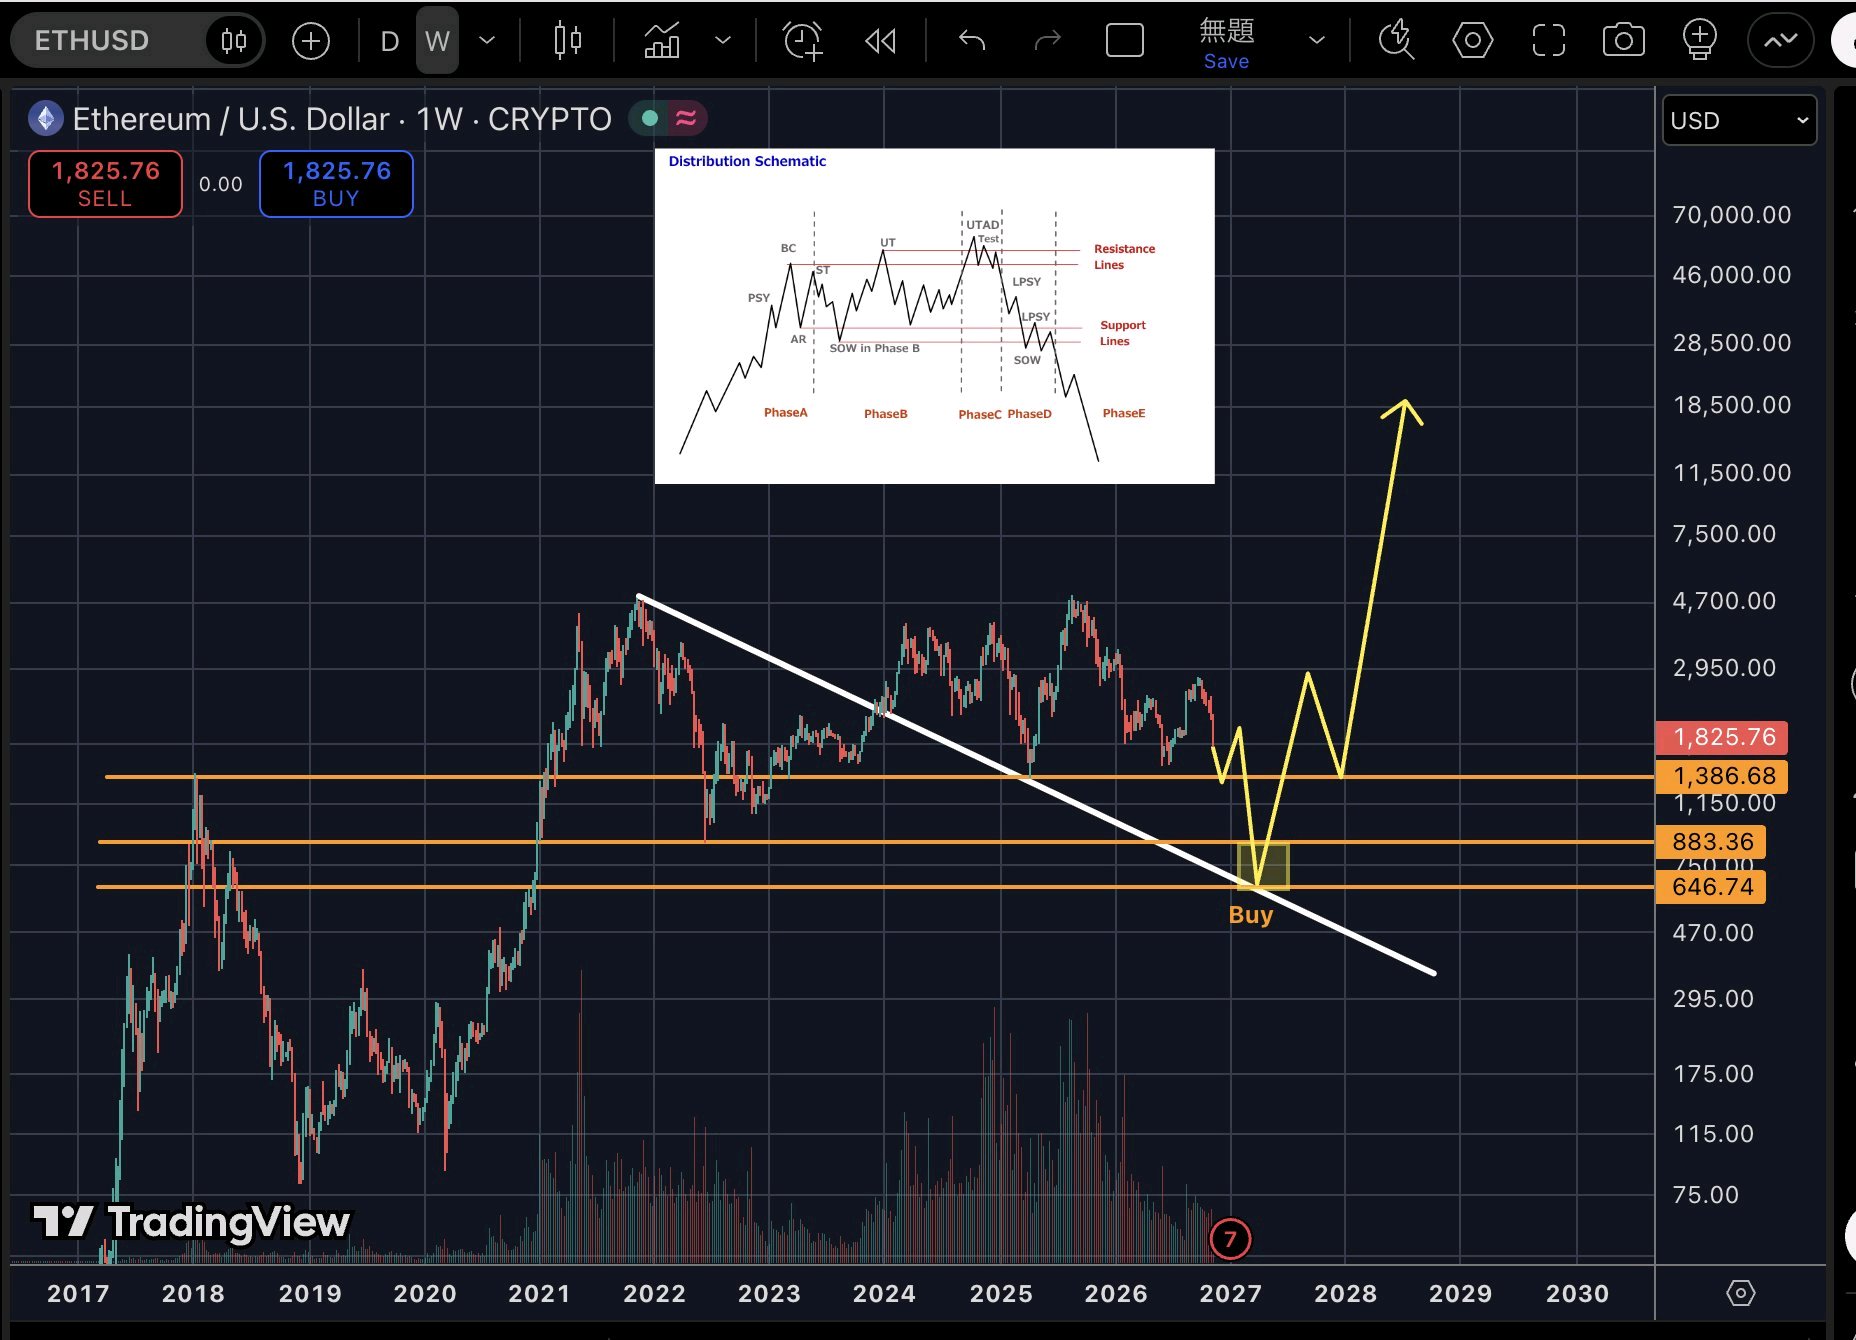
🗺️ 這是一份 $ETH 的走勢圖,但這背後有一個很大的「如果」。 我不願預設 $ETH 的底部已經出現。我想觀察它在週線圖上 1,386.68 價位的表現,因為這是一個關鍵水平,決定了哪種走勢預測適用。 以下是這張週線圖顯示的內容: 🔹 大局觀:$ETH 目前價格為 1,825.76,較 4,800 附近的頂峰下跌了約 60%。自 2025 年見頂以來,該圖表一直呈現低點下移的趨勢。 🔹 階梯式支撐位:在當前價格下方標記了三個水平支撐位:1,386.68、883.36 和 646.74。它們分別位於當前價格下方約 24%、52% 和 65% 的位置。 🔹 趨勢線:一條從 2021 年高點畫出的下降趨勢線已經被觸及多次,預計將在 2027 年與較低的支撐水平相交。 🔹 型態:該圖表疊加了威科夫(Wyckoff)派發模型。在該模型中,漫長的派發階段後會跟隨下跌階段,隨後才會形成新的底部。 🔹 情境:該計劃標記了一個買入區間,即趨勢線與 646 至 883 區域的交匯處,隨後預期出現回升。這只是一個情境假設,而非預測,且這需要先經歷非常深度的下跌。 🟢 看漲:週線收盤若能守在 1,386.68 之上,意味著更深度的下跌情境未發生,目前的結構依然完好。 🔴 看跌:週線收盤若低於 1,386.68,將打開通往 883.36 以及隨後 646.74 區域的路徑。 長期走勢圖對於把握大局很有幫助,但不適用於精確擇時。每個水平位的週線收盤情況才能告訴你市場實際正在發生什麼。 你在關注 $ETH 還是其他代幣呢? #ETH #Ethereum #Crypto #BinanceSquare #WSOT2026 #WSOT曬出你的AI交易即可贏取10USDT #黃仁勳離任考驗Nvidia的AI領導地位 #美國PPI測試「更高更久」交易策略 #美國通膨升溫,升息押注升高 $ETHUSDT $HYPEUSDT

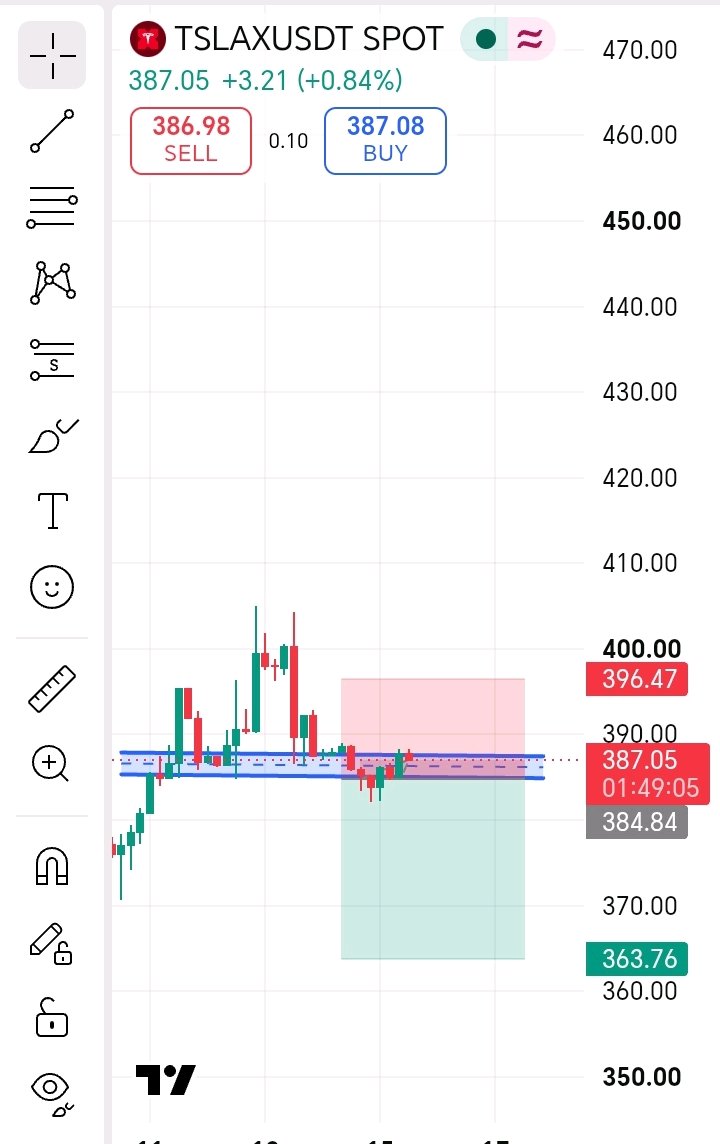
🎯 Price is back at the zone it couldn't hold, and this is where a short idea gets tested. I don't want to short $TSLAX just because price is sitting at resistance. I want to see a rejection that closes back under 384.84, because that's the level that would confirm sellers are defending the zone. Here's what this chart shows: 🔹 The zone: A tight band around 385 to 388 has been acting as a pivot. Price dipped under it to the low 380s, bounced, and is now back inside it at 387.05. 🔹 The context: Price recovered strongly from the lows, then peaked near 405 and has since been chopping sideways. The momentum from the rebound has slowed down. 🔹 The short idea: Entry near 384.84, stop at 396.47 above the recent range, target at 363.76. That's about 3% of risk for 5.5% of reward, or roughly 1:1.8. 🔹 The catch: The bounce back into the zone is still green, and price can easily push through. A stop 3% away only works if the position size matches it. 🔹 The market: $TSLAX is a tokenized stock that trades around the clock, so gaps and weekend moves can differ from regular market hours. 🔴 Bearish: a close under 384.84 with the zone rejected opens the move toward 363.76. 🟢 Bullish: a close above 396.47 invalidates the short idea, with the 405 high as the next reference. A zone only matters if price reacts to it. The next close tells us which way. Are you watching $TSLAX or another stock? #TSLAX #Tesla #Crypto #BinanceSquare #WSOT2026 #WSOTShowYourAITradeToEarn10USDT #JensenHuangExitTestsNvidiasAILeadership #USPPITestsTheHigherForLongerTrade #USInflationRunsHotAndRateHikeBetsRise $TSLAXUSDT $BTCUSDT

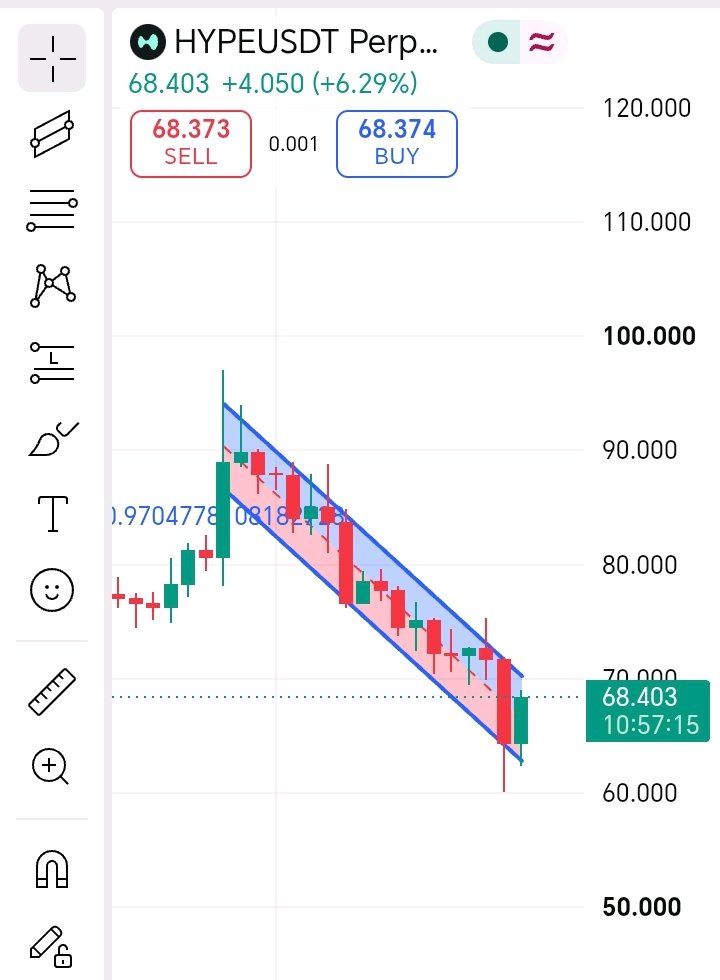
🪝 價格跌破了通道,隨後立刻被拉了回來。 我不想僅僅因為一根大陽線就斷言 $HYPE 的趨勢發生了改變。我希望看到價格收在 70 到 71 附近的通道上軌上方,因為那才是真正打破下跌趨勢的關鍵。 這張圖表顯示了以下內容: 🔹 通道:自 97 附近的峰值以來,$HYPE 一直在一個清晰的下跌通道內運行,呈現出低點更低、高點更低(lower highs and lower lows)的形態,每次反彈都受到上軌的壓制。 🔹 跌破:上一根 K 線跌破了通道下軌,並留下長下影線觸及約 60 的低點。這較峰值下跌了約 38%,並伴隨著劇烈的拋售。 🔹 回抽:最新的一根 K 線為陽線,上漲了 6.29%,並回升至通道內的 68.40 收盤。這種跌破通道後立即反轉的情況通常被稱為「假跌破」(false breakdown)。 🔹 當前位置:價格目前處於通道上半部,距離上軌約 3%。這是第一個真正的考驗。 🔹 反彈幅度:從 60 的下影線低點算起,價格已經反彈了約 14%。這是一個強勁的反應,但在通道被打破之前,這仍然只是下跌趨勢中的一次反彈。 🟢 看漲:收盤價高於 70 到 71(通道上軌)。這將終結低點更低、高點更低的模式,並將這次假跌破轉化為真正的反轉信號。 🔴 看跌:收盤價再次跌破 62 到 63 附近的下軌,特別是跌破 60。這將證實之前的下影線僅僅是暫時的喘息。 假跌破可能會開啟反轉,但唯有突破上軌,通道才算真正被打破。 你在關注 $HYPE 還是其他幣種? #HYPE #Hyperliquid #加密貨幣 #BinanceSquare #WSOT2026 #WSOT曬出你的AI交易即可贏取10USDT #黃仁勳離任考驗Nvidia的AI領導地位 #美國PPI測試「更高更久」交易策略 #美國通膨升溫,升息押注升高 $HYPEUSDT $BTCUSDT

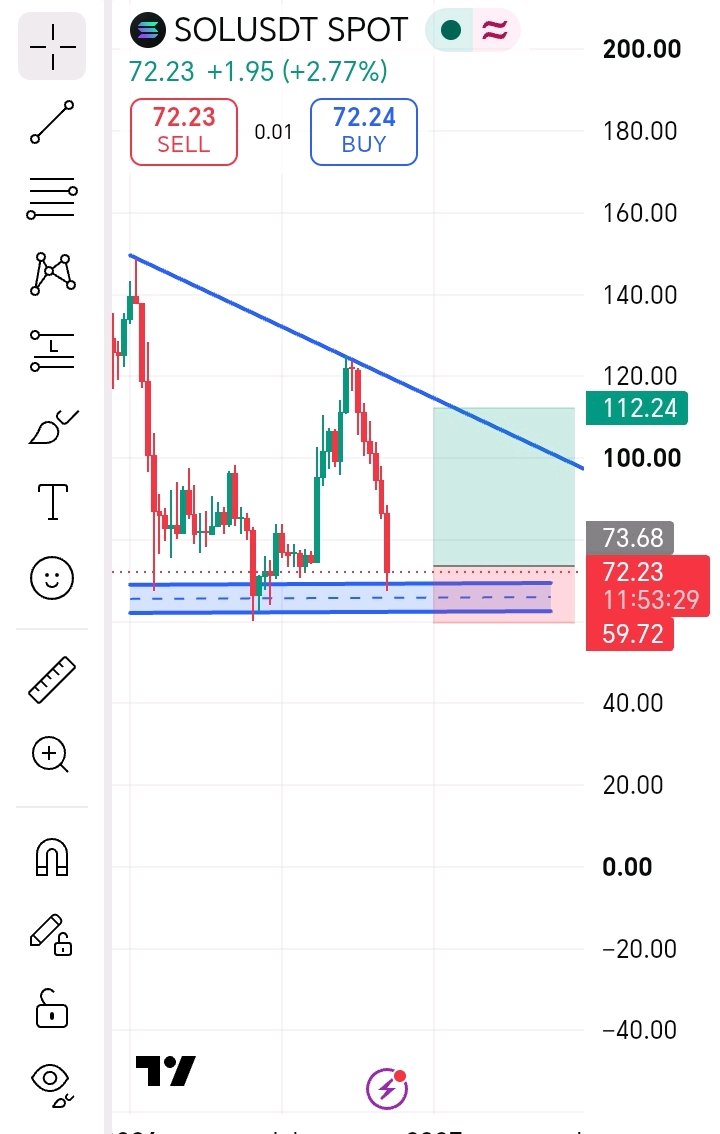
⚖️ A flat floor and a falling ceiling: $SOL is squeezing into a descending triangle. I don't want to buy the floor just because it has held before. I want to see $SOL reclaim 73.68 and hold it, because that's what would show buyers are defending the zone again. Here's what this chart shows: 🔹 The floor: A flat support zone around 62 to 69 has been tested several times. Each time, price bounced, but the bounces have gotten weaker. 🔹 The ceiling: A falling trendline connects the lower highs from the early peak near 150, through the rejection near 125, and down toward the 100 area. Sellers keep showing up at lower prices. 🔹 The pattern: That's a descending triangle, a flat bottom with falling highs. It's often a bearish pattern because the floor gets tested more and more, but it can also resolve up if buyers defend it. 🔹 The price now: $SOL is at 72.23, up 2.77% on the day, sitting just above the zone. 🔹 The trade math: A long from 73.68 with a stop at 59.72 and a target at 112.24 works out to about 1:2.8. The stop is about 19% away, so position size matters. 🟢 Bullish: a close back above 73.68, then the 90s, and the falling trendline near 100 to 112 as the bigger target. 🔴 Bearish: a close under the zone near 62, and especially under 59.72. A breakdown from a descending triangle often targets a move similar to the pattern's height. The floor has held so far. The question is whether it holds a fourth time. Are you watching $SOL or another coin? #SOL #Solana #Crypto #BinanceSquare #WSOT2026 #byx #WSOTShowYourAITradeToEarn10USDT #JensenHuangExitTestsNvidiasAILeadership #USPPITestsTheHigherForLongerTrade #USInflationRunsHotAndRateHikeBetsRise

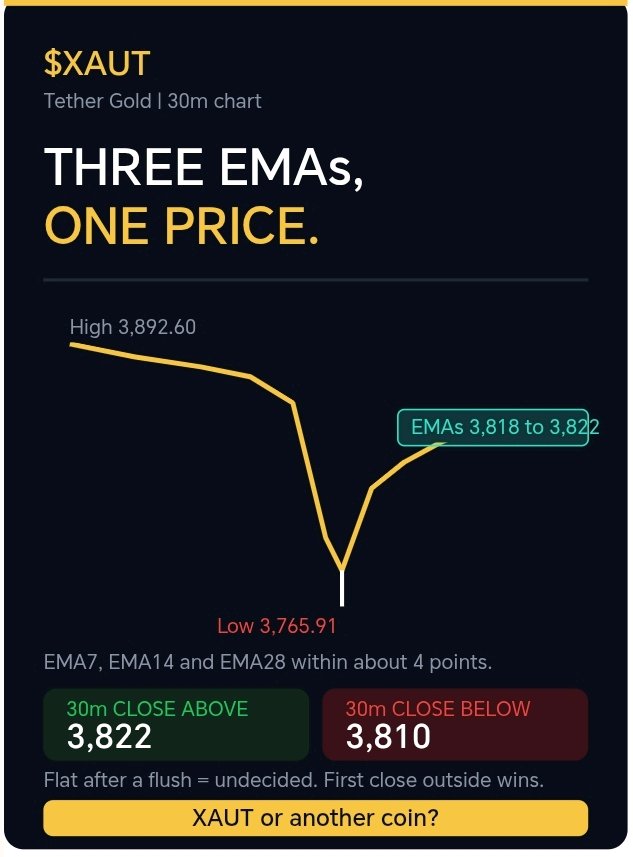
🧲 三條 EMA,一個價格,中間什麼都沒有。 當 30 分鐘線圖走得這麼平時,我不想去猜測 $XAUT 的方向。我希望能看到 30 分鐘收盤價落在 3,810 到 3,822 這個區間之外,因為那才是下一波真正行情開始的地方。 以下是 30 分鐘線圖顯示的狀況: 🔹 閃崩:黃金從 3,892.60 區域跌落,留下一根長下影線,最低點來到 3,765.91。這低於上週的 3,872.51 支撐位,且比 4,128 的區間高點低了約 9%。 🔹 反彈:價格回升了約 1.4%,來到 3,834 區域,隨後停滯並維持橫盤整理。 🔹 聚集:EMA7 為 3,818.70,EMA14 為 3,818.17,EMA28 為 3,822.07。這三條均線彼此距離不到 4 點,而價格目前就壓在 3,817.01 的位置。這是一個異常緊湊的擠壓狀態。 🔹 布林帶:上軌 3,839.25 | 中軌 3,810.32 | 下軌 3,781.39。波動率激增後帶口正在收窄,這也符合目前的平盤走勢。 🔹 區間:24 小時高點 3,871.27,低點 3,765.91,成交額為 13.33M。大行情已經發生了,現在市場正在決定下一步怎麼走。 🟢 看漲:30 分鐘收盤價站上 3,822,接著上看上軌 3,839 以及 3,870 水平。這將使目前的橫盤整理轉變為復甦走勢。 🔴 看跌:30 分鐘收盤價跌破 3,810,則下軌 3,781 以及低點 3,765.91 將面臨考驗。 經歷大跌後的均線走平,意味著市場目前舉棋不定。通常第一個收盤價突破這個集群的位置,就會決定接下來的方向。 你在關注 $XAUT 還是其他幣種呢? #XAUT #黃金 #加密貨幣 #BinanceSquare #WSOT曬出你的AI交易即可贏取10USDT #WSOT2026 #黃仁勳離任考驗Nvidia的AI領導地位 #美國PPI測試「更高更久」交易策略 #美國通膨升溫,升息押注升高 $XAUTUSDT $BTCUSDT

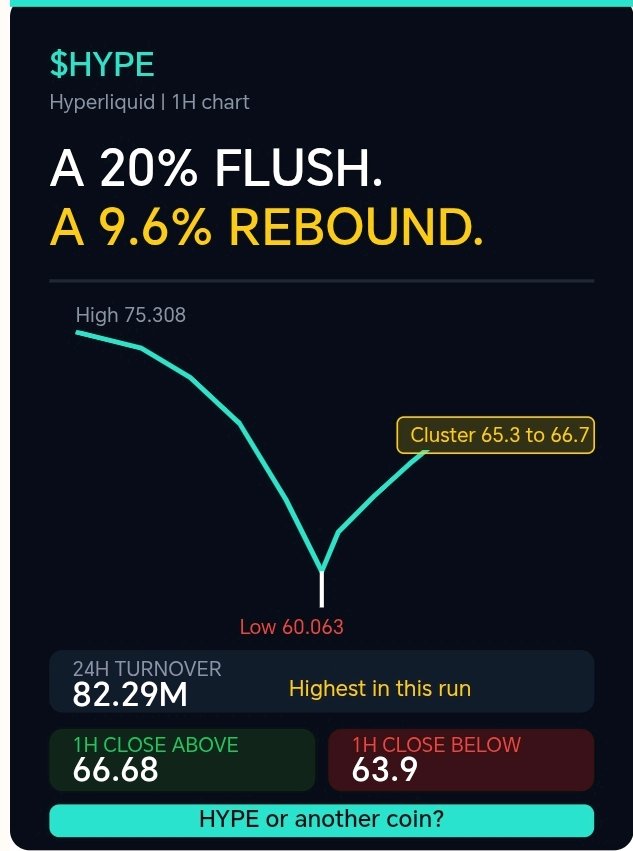
🌊 A 20% flush, a 9.6% rebound, and the biggest volume in a while. I don't want to call the low on $HYPE just because the wick was dramatic. I want to see a 1H close above 66.68, because that's where the rebound has to break through to mean something. Here's what the 1H chart shows: 🔹 The flush: From the 75.308 high, $HYPE dropped to 60.063, about 20%, with the final leg ending in a long red wick that looks like a forced selloff. 🔹 The rebound: Buyers stepped in at the low and price recovered to around 66.6, a gain of nearly 10% off the bottom. It has since pulled back slightly to 65.85. 🔹 The volume: 24H turnover is 82.29M, the highest in this run and well above the 25M to 53M range of the last few sessions. Big flushes tend to come with big volume. 🔹 The cluster: EMA7 65.28, EMA14 65.44, the Bollinger mid 65.72 and EMA28 66.68 are all bunched within about 2% of price. The rebound has run straight into them. 🔹 The bands: Upper 69.76 | Lower 61.68. Volatility is high, so moves in either direction can be sharp. 🔹 The context: Even after the bounce, price is still about 12% below the 75.3 high, and the broader trend has been down. 🟢 Bullish: a 1H close above 66.68, then 67.8 and the upper band near 69.8. That would turn the flush into a trap for sellers. 🔴 Bearish: a 1H close under 63.9 puts the 60.063 low back in play, and a break there extends the slide. Flushes can mark exhaustion, or just a pause. The next few 1H closes after the rebound will tell us which one this is. Are you watching $HYPE or another coin? #HYPE #Crypto #BinanceSquare #WSOT2026 #WSOTShowYourAITradeToEarn10USDT #JensenHuangExitTestsNvidiasAILeadership #USPPITestsTheHigherForLongerTrade #USInflationRunsHotAndRateHikeBetsRise $HYPEUSDT $BTCUSDT
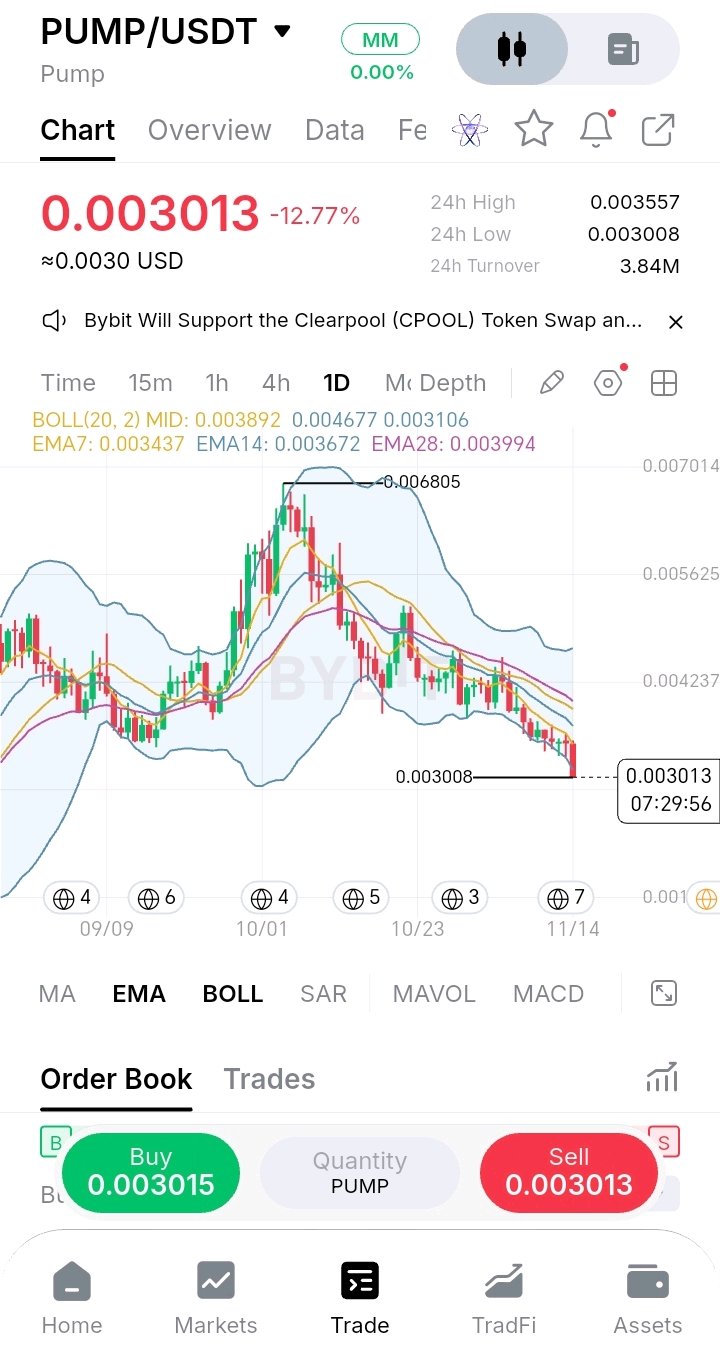
🧨 一根 12.8% 的紅K棒剛剛擊穿了下布林通道。 我不想因為 $PUMP 從高點跌了一半以上就進場抄底。我想看到日線收盤價回到 0.003106 之上,因為這代表價格回到了布林通道內,顯示這波走勢屬於過度延伸。 以下是日線圖的觀察: 🔹 大K棒:今天的日K下跌 12.77%,現價 0.003013,就在日內低點 0.003008 上方。 🔹 通道突破:下布林通道位於 0.003106,價格已跌破該位置。這是一波延伸行情,而延伸行情可能會出現回抽,也可能持續下跌。 🔹 下跌走勢:從 0.006805 的高點算起,$PUMP 已經下跌約 56%,一路呈現更低的高點和更低的低點。今日低點是這張圖表上可見的最低水位。 🔹 均線:EMA7 為 0.003437、EMA14 為 0.003672、EMA28 為 0.003994,布林中軌在 0.003892。所有均線皆向下傾斜並位於價格上方。最近的一條均線距離現價約 14%。 🔹 活躍度:24 小時成交量為 3.84M,價格區間在 0.003008 到 0.003557 之間。這波走勢伴隨著實際的參與度。 🔹 支撐位:圖表上 0.0030 下方幾乎沒有明顯的支撐位,所以一旦跌破,價格幾乎無處可倚。 🟢 看漲:日線收盤價需回到 0.003106 之上,接著是 0.003437 (EMA7)。若能收復 EMA7,將顯示賣方正在失去控制權。 🔴 看跌:日線收盤價低於 0.003008,將維持下行趨勢,且附近沒有明顯的支撐地板。 日K尚未收盤,所以收盤價比盤中波動更重要。 你在關注 $PUMP 還是其他幣種? #PUMP #Crypto #BinanceSquare #WSOT曬出你的AI交易即可贏取10USDT #WSOT2026 #黃仁勳離任考驗Nvidia的AI領導地位 #美國PPI測試「更高更久」交易策略 #美國通膨升溫,升息押注升高 $PUMPUSDT $TRUMPUSDT

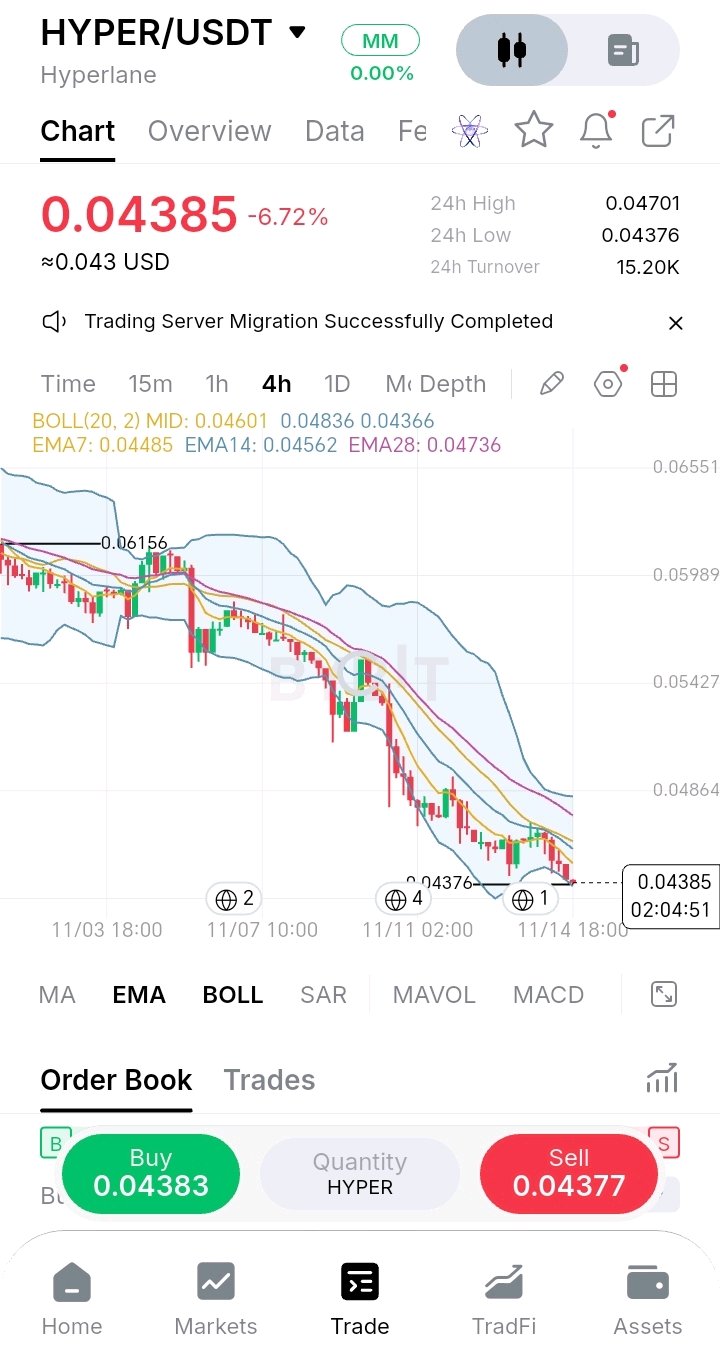
🥀 綠芽沒能存活下來。 我不想僅僅因為 $HYPER 又跌了 6.7% 且看起來很便宜就去買入。我想看到 4 小時線收盤價高於 0.04485 (EMA7),因為那是反彈嘗試重啟的第一個跡象。 以下是 4 小時圖顯示的內容: 🔹 反彈失敗:價格回升至 0.047 區域,正好在布林通道中軌下方,隨後遭到拒絕。接著回吐了整個漲幅。 🔹 新低:先前的 0.04420 低點已被跌破。最新低點為 0.04376,價格目前在 0.04385 交易,正處於 0.04366 的下軌之上。 🔹 下滑:從圖表上的 0.06156 高點來看,價格下跌了約 29%,仍處於不斷創新低與反彈高點走低的趨勢中。 🔹 均線:EMA7 為 0.04485,EMA14 為 0.04562,EMA28 為 0.04736,均位於價格上方且向下傾斜。布林通道中軌 0.04601 是下一個天花板。 🔹 流動性:24 小時成交量僅為 1.52 萬,比之前更稀薄。像這樣的小盤市場可能會出現跳空與滑價,雙向皆有可能。 🔹 區間:24 小時最高價 0.04701,最低價 0.04376,波動幅度約 7%。 🟢 看漲:4 小時線收盤價高於 0.04485,接著是 0.04562 和 0.04601。重新站上中軌將使其轉變為一次失敗的跌破。 🔴 看跌:4 小時線收盤價低於 0.04366,且在此圖表下方幾乎沒有明顯支撐。 一次反彈失敗並不會終結下跌趨勢,但它顯示了誰掌握著主導權。在如此稀薄的市場中,請控制倉位並設置停損。 你正在關注 $HYPER 還是其他幣種? #HYPER #Hyperlane #加密貨幣 #BinanceSquare #WSOT曬出你的AI交易即可贏取10USDT #黃仁勳離任考驗Nvidia的AI領導地位 #美國PPI測試「更高更久」交易策略 #美國通膨升溫,升息押注升高 #WSOT2026 $HYPERUSDT $BTCUSDT

The Bybit Stockholm Open, on and off court 🎾 Our VIPs got their turn on court, fans picked up exclusive merch at the booth, and one winner had €1,000 to celebrate. An unforgettable event filled with thrilling matches, amazing energy, and unforgettable moments for everyone involved! 🏆✨ #WSOTShowYourAITradeToEarn10USDT #JensenHuangExitTestsNvidiasAILeadership #USPPITestsTheHigherForLongerTrade #USInflationRunsHotAndRateHikeBetsRise #SanDiskAnnounces8For1StockSplit $HYPEUSDT $BTCUSDT

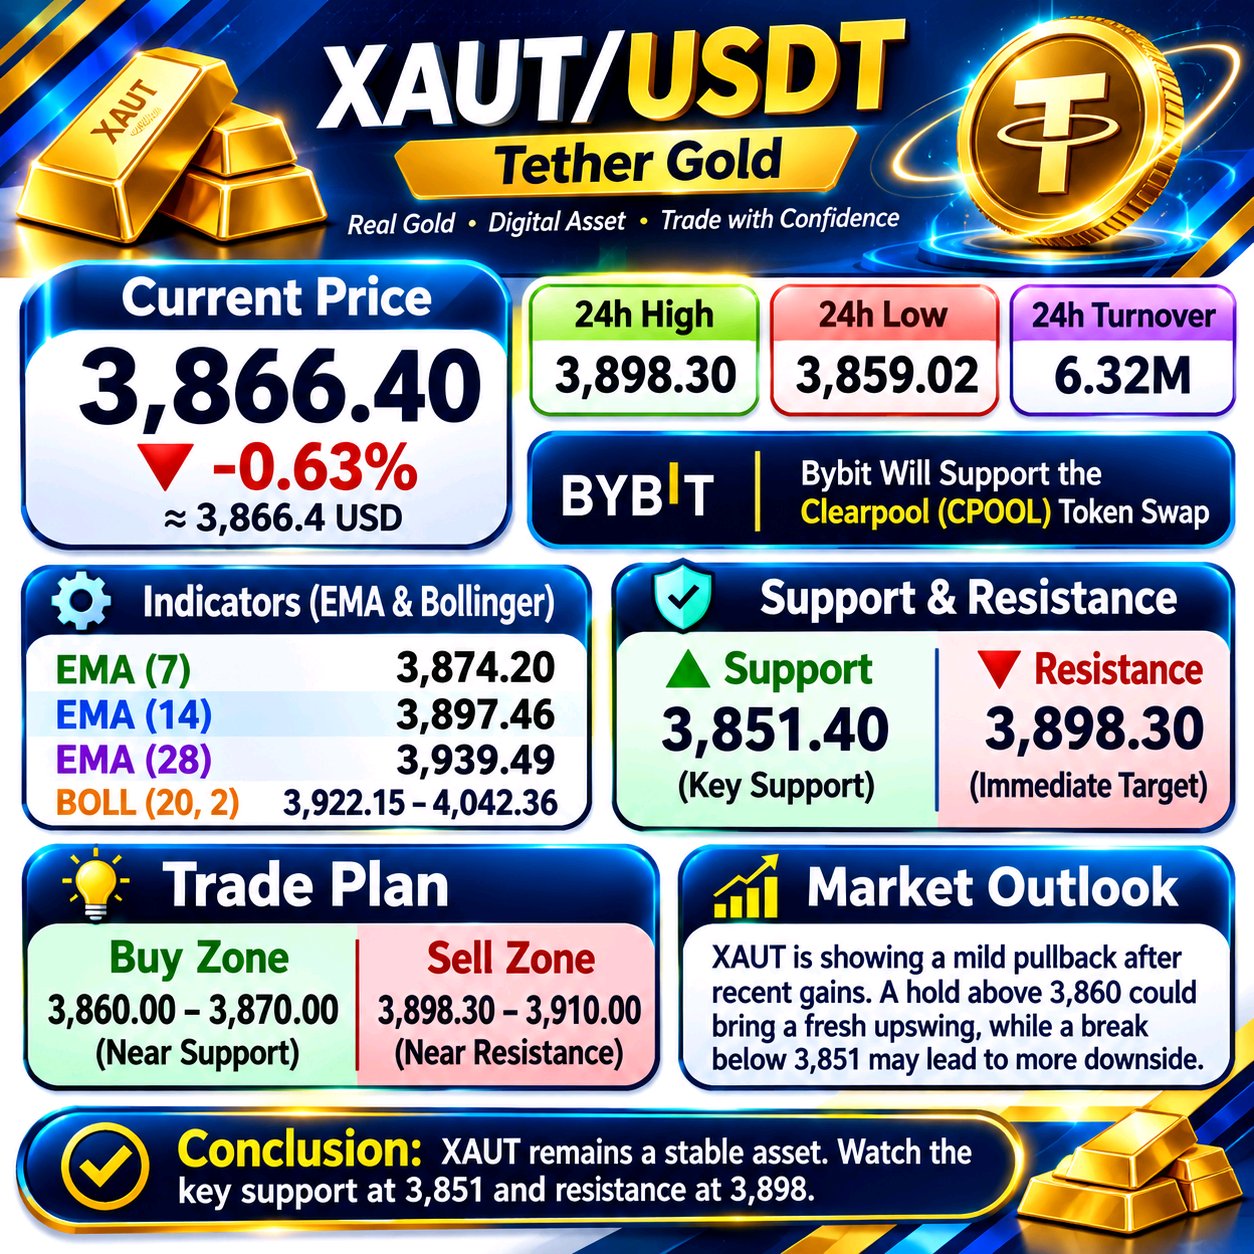
XAUT:黃金正在測試買家信心 以黃金作為抵押的加密資產,即使其基礎價值主張依然具有吸引力,也可能面臨短期拋售壓力。XAUT 目前正展現出長期資產曝險與短期市場動能之間的差異。 XAUT 目前價格為 3,866.40 美元,24 小時內下跌了 0.63%。最新的 4 小時圖結構顯示,價格已從先前接近 4,130.11 美元的高點大幅下跌。在觸及 3,851.40 美元的低點後,價格試圖趨於穩定,但反彈力道尚不足以改變整體趨勢。 技術面分析 目前有三條移動平均線位於價格上方:7 日指數移動平均線 (EMA) 為 3,874.20 美元,14 日 EMA 為 3,897.46 美元,以及 28 日 EMA 為 3,939.49 美元。這種排列顯示賣方在短期結構中仍佔據優勢。布林通道中軌 3,922.15 美元也代表了一個重要的反彈門檻。 關鍵價格區間 3,859 美元至 3,851 美元區域是目前的立即支撐區。如果買方能守住該區域並收復 3,874 美元,市場可能會嘗試反彈至 3,897 美元至 3,898 美元區間。若能強勢突破該區域,則有望進一步挑戰 3,922 美元。 然而,若價格持續跌破 3,851.40 美元,可能會下探至 3,801.94 美元附近的布林通道下軌區域。這將顯示目前的盤整未能吸引足夠的買盤需求。 交易策略 若價格能確認反彈突破 3,898 美元,建立多頭部位會更具吸引力,潛在的上行參考目標為 3,922 美元與 3,939 美元。至於空頭部位,若價格在 3,897 美元至 3,922 美元附近遭遇阻力,或確認跌破 3,851.40 美元,則會形成更具說服力的看跌情境。 市場情緒 值得注意的一個細節是掛單簿 (order-book) 的不平衡狀況:賣單佔 96%,買單僅佔 4%。這顯示該快照數據中存在龐大的拋售意願,儘管掛單簿百分比變化極快,且不保證未來的價格走勢。報告顯示 24 小時成交額約為 632 萬美元。 最終觀點 XAUT 目前正處於保衛近期低點比製造暫時性反彈更為重要的階段。該資產仍透過數位形式提供黃金曝險,但其交易價格可能會有所波動。我會傾向觀察更強勁的買方參與度,以及價格回升至移動平均線上方,才會認為這波跌勢已經結束。在當前環境下,耐心與確認訊號尤為重要。#WSOT曬出你的AI交易即可贏取10USDT #黃仁勳離任考驗Nvidia的AI領導地位 #美國PPI測試「更高更久」交易策略 #美國通膨升溫,升息押注升高 #SanDisk 宣佈 8 比 1 股票分割 $XAUTUSDT $BTCUSDT
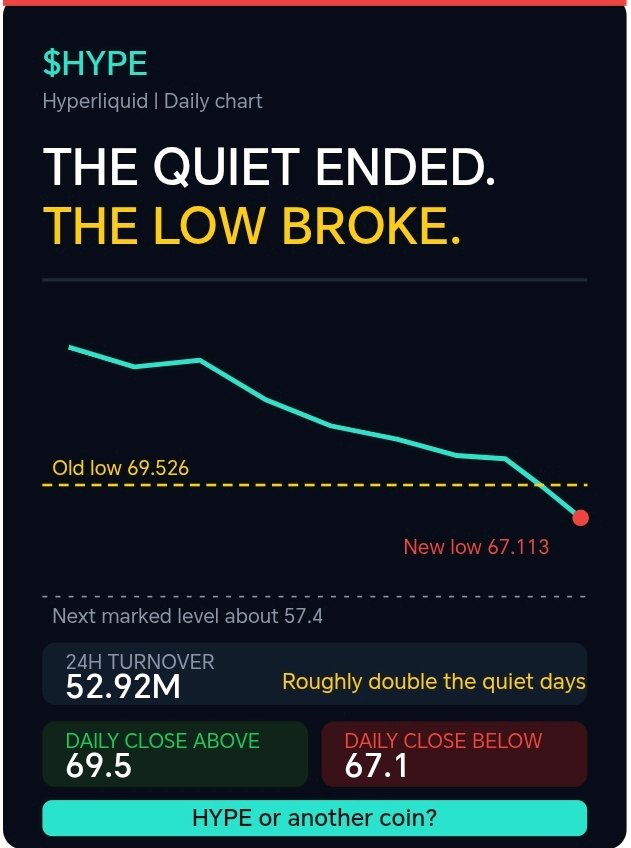
🔔 寧靜已被打破,69.5 的低點也隨之失守。 我不想把這次 $HYPE 的下跌稱為投降式拋售。我希望看到日線收盤價能重回 69.5 之上,因為那樣會讓這次跌破變成一個「陷阱」而非趨勢的開始。 日線圖顯示如下: 🔹 跌破:幾天以來,69.526 的低點一直是大家關注的防線。今天的 K 線跌至 67.113,已經跌破該位置,目前仍在 69.05 附近震盪。 🔹 波動:24 小時價格區間為 67.113 到 75.308,波動幅度約 11%。在經歷了幾天的平靜後,波動率終於回歸了。 🔹 成交量:24 小時成交額為 5,292 萬,大約是近期平靜日子裡的兩倍。這意味著這次行情是有實質參與的,而非單純的無量漂移。 🔹 移動平均線:EMA7 為 72.82,EMA14 為 75.62,EMA28 為 78.44,布林通道中軌則在 79.44。所有指標均向下傾斜,且位於價格上方。 🔹 布林通道:下軌位於 66.83,就在今日低點下方不遠處。價格已接近此延伸區域。 🔹 訂單簿:賣單約佔 60%,買單約佔 40%,賣壓略重。 🔹 下方缺口:在此圖表中,下一個標記的水平位大約在 57.4,距離目前價格約有 17% 的空間。 🟢 看漲:若日線收盤能重回 69.5 之上,接著挑戰 72.8。那樣會讓今天的低點成為一次失敗的跌破。 🔴 看跌:若日線收盤低於 67.1,且跌破下軌 66.8 附近,將為跌向 57.4 區域打開空間。 日線尚未收盤,收盤價比單一的日內波動更為關鍵。 你是在關注 $HYPE 還是其他幣種呢? #HYPE #加密貨幣 #BinanceSquare #WSOT曬出你的AI交易即可贏取10USDT #黃仁勳離任考驗Nvidia的AI領導地位 #美國PPI測試「更高更久」交易策略 #美國通膨升溫,升息押注升高 #SanDisk 宣佈 8 比 1 股票分割 $HYPEUSDT $BTCUSDT

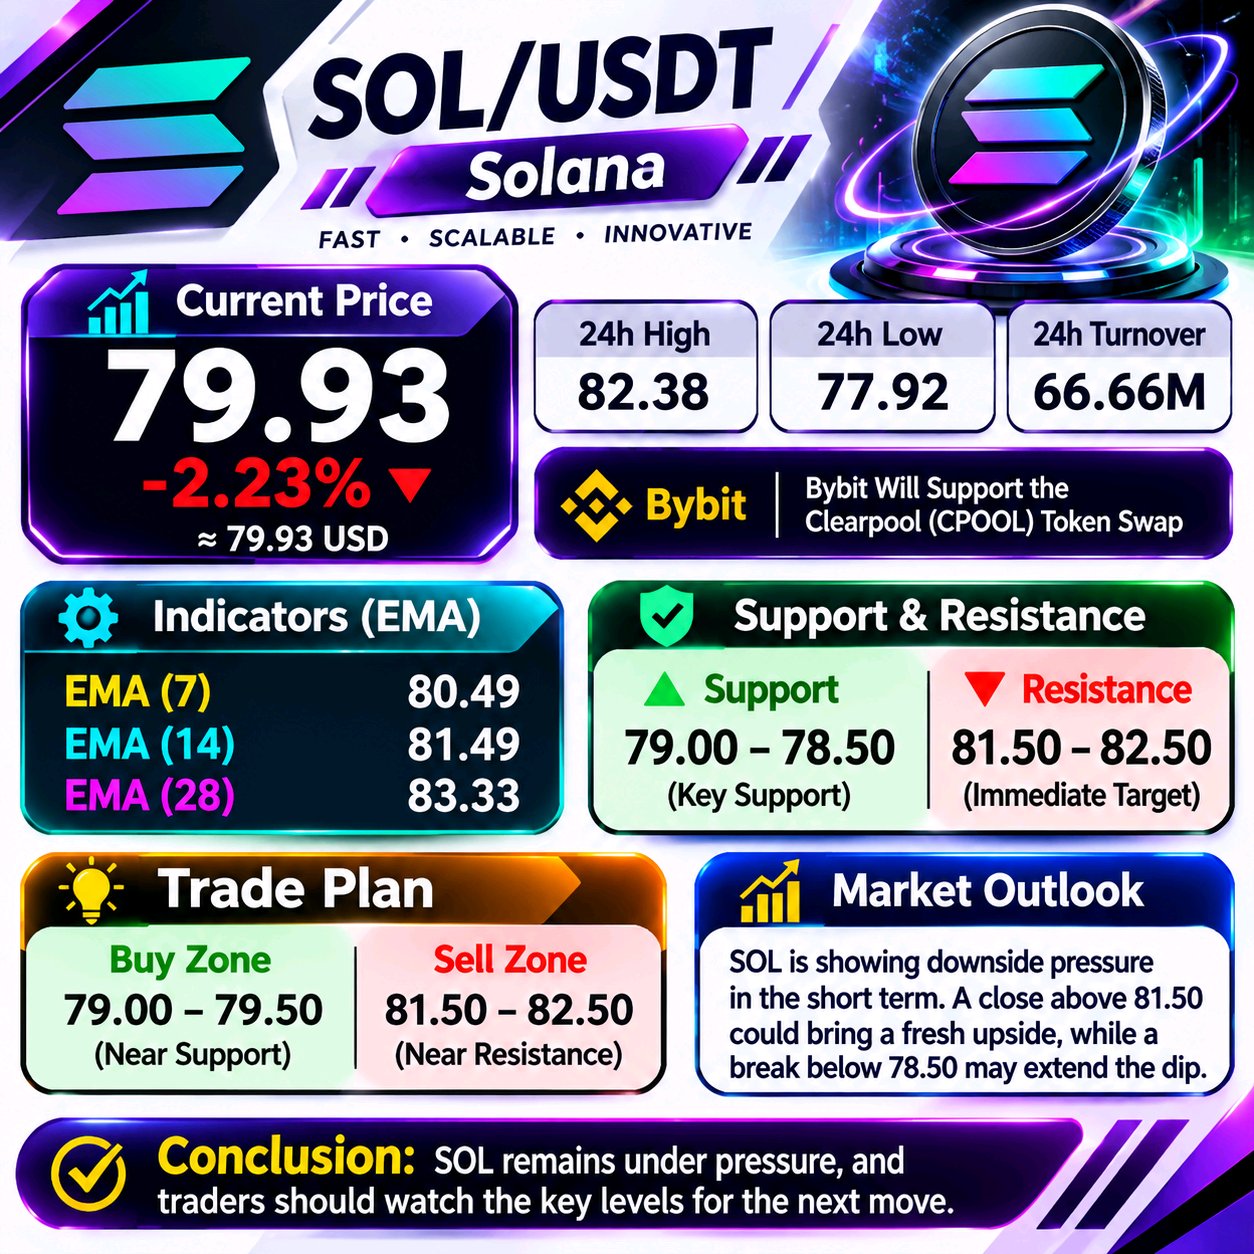
SOLANA IS FACING A TOUGH MARKET TEST Solana is going through a period where sellers are controlling the broader price structure. At $79.93, SOL is down 2.23% over 24 hours, and the gap between its current price and the higher moving averages shows that buyers still have work to do before a meaningful trend recovery can develop. UNDERSTANDING THE CURRENT STRUCTURE The 4-hour indicators show EMA 7 at $80.49, EMA 14 at $81.49 and EMA 28 at $83.33. All three are above the current price, creating multiple resistance points. The Bollinger middle line at $82.24 also reinforces the overhead pressure. However, the recent low of $77.92 has attracted some buying interest. This suggests that sellers have not yet achieved a decisive breakdown. WHERE THE NEXT MOVE COULD DEVELOP The $77.92–$78.50 region is the first important support area. If buyers defend this zone and price moves back above $80.50, a recovery toward $81.49 and $82.24 becomes possible. On the other hand, a confirmed breakdown below $77.92 could expose SOL to additional downside pressure. For a stronger bullish recovery, buyers would need to reclaim $83.33 and sustain their momentum beyond it. TRADING APPROACH A cautious long setup would require a confirmed recovery above $80.50, with $81.49 and $82.24 as potential objectives. For a short setup, a failed rebound near $81.49–$83.33 or a confirmed support breakdown would provide a more convincing bearish scenario. MARKET PARTICIPATION The 24-hour turnover stands at approximately $66.66M. The order-book snapshot also shows 81% sell-side versus 19% buy-side, indicating heavier displayed selling interest at that moment. Order-book figures can change quickly and should not be treated as a guarantee of future direction. FINAL VIEW SOL needs to overcome several layers of resistance before its recovery can be trusted. Until that happens, protecting capital and waiting for price confirmation may be more effective than entering trades based on short-term excitement. The reaction around $77.92 and $80.50 will be particularly important for understanding the next phase. #WSOTShowYourAITradeToEarn10USDT #JensenHuangExitTestsNvidiasAILeadership #USPPITestsTheHigherForLongerTrade #USInflationRunsHotAndRateHikeBetsRise #SanDiskAnnounces8For1StockSplit $SOLUSDT $BTCUSDT

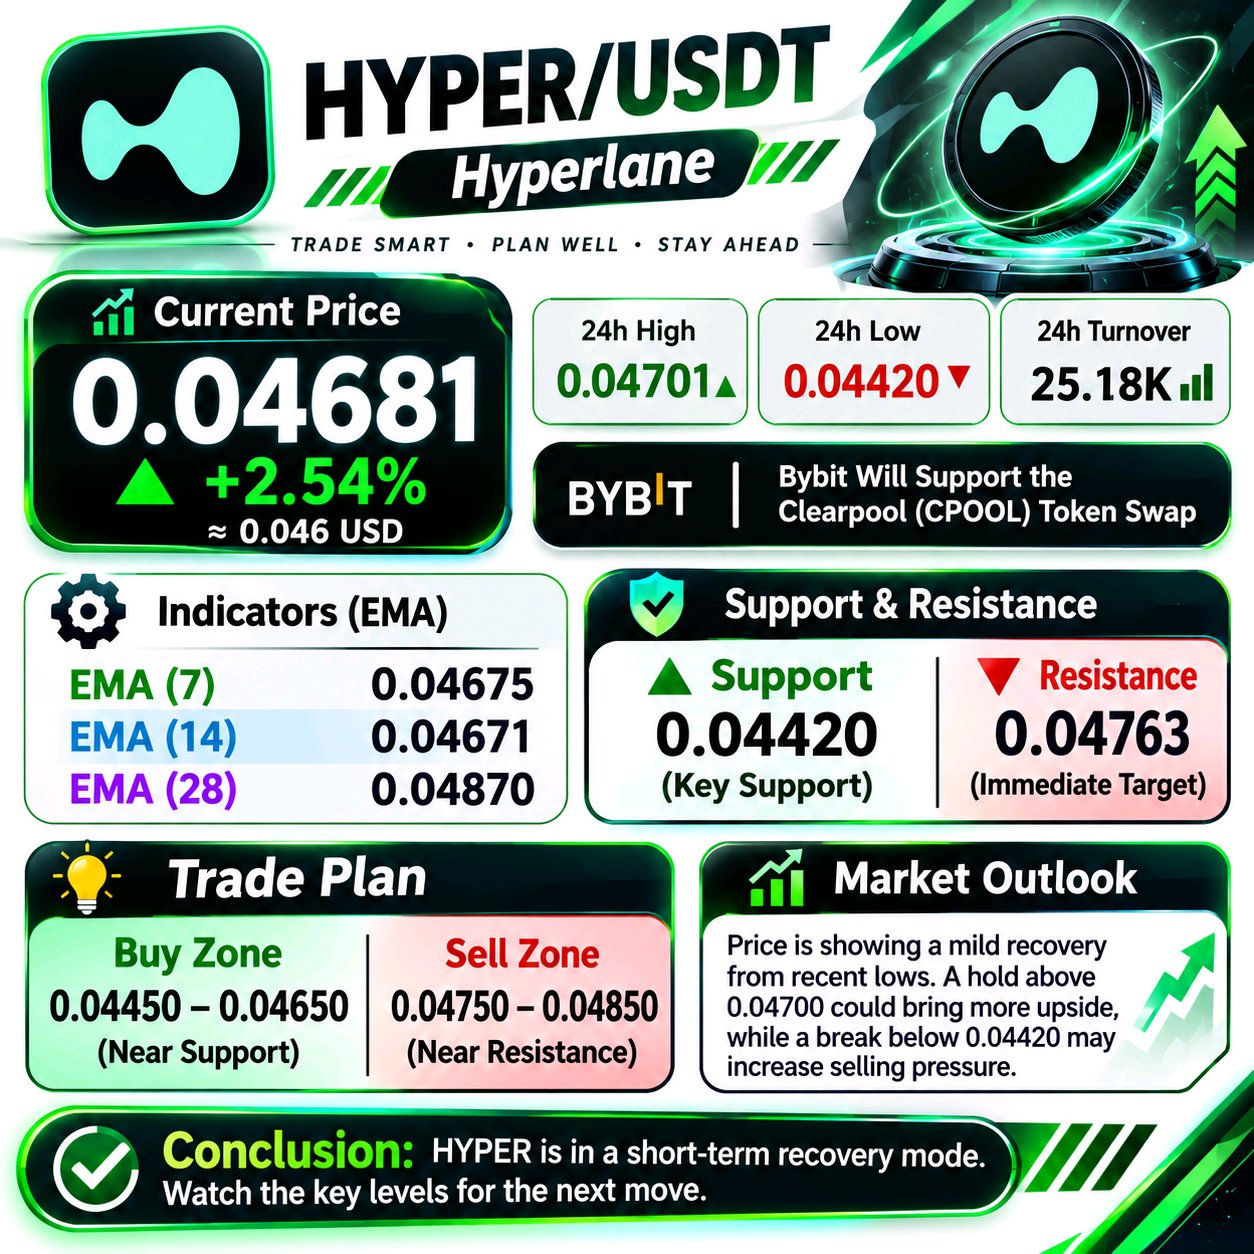
🌱 First green shoot after a 36% slide, but it's a very small one. I don't want to chase a +2.5% candle on $HYPER without more proof. I want to see a 4H close above 0.04704 (mid-band), because that would turn a bounce into a real attempt at a recovery. Here's what the 4H chart shows: 🔹 The slide: $HYPER fell from 0.06904 to a low of 0.04420, about 36%, in a steady staircase of lower highs and lower lows. 🔹 The bounce: Price touched the lower Bollinger Band area, printed the 0.04420 low, and has recovered about 6% to 0.04681. The latest candle closed back above EMA7 (0.04619) and right at EMA14 (0.04680). 🔹 The ceiling: The Bollinger mid at 0.04704 and EMA28 at 0.04870 sit just above. Both slope down and are the first real tests. 🔹 The bands: Upper 0.04961 | Mid 0.04704 | Lower 0.04447. The channel has narrowed since the selloff, which fits a pause after a long fall. 🔹 The order book: Asks are about 67% vs 33% bids. Sellers are still leaning on it, so the bounce hasn't convinced the book yet. 🔹 The liquidity: 24H turnover is only 25.18K. That's extremely thin. Price can jump or drop quickly on small orders, and slippage can be large. 🟢 Bullish: a 4H close above 0.04704, then 0.04870 and 0.04961. That would show the downtrend is losing control. 🔴 Bearish: a close under 0.04619, then the lower band at 0.04447 and the 0.04420 low. A break there continues the slide. One green candle in a downtrend is a spark, not a fire. On a market this thin, size small and respect your stop. Are you watching $HYPER or another coin? #HYPER #Hyperlane #Crypto #BinanceSquare #WSOT2026 #WSOTShowYourAITradeToEarn10USDT #JensenHuangExitTestsNvidiasAILeadership #USPPITestsTheHigherForLongerTrade #USInflationRunsHotAndRateHikeBetsRise $HYPERUSDT $HYPEUSDT

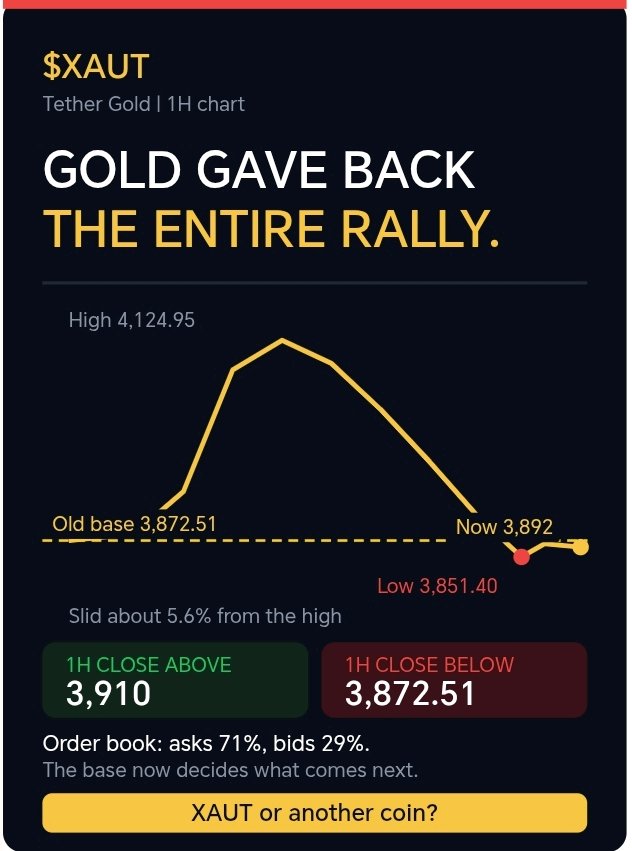
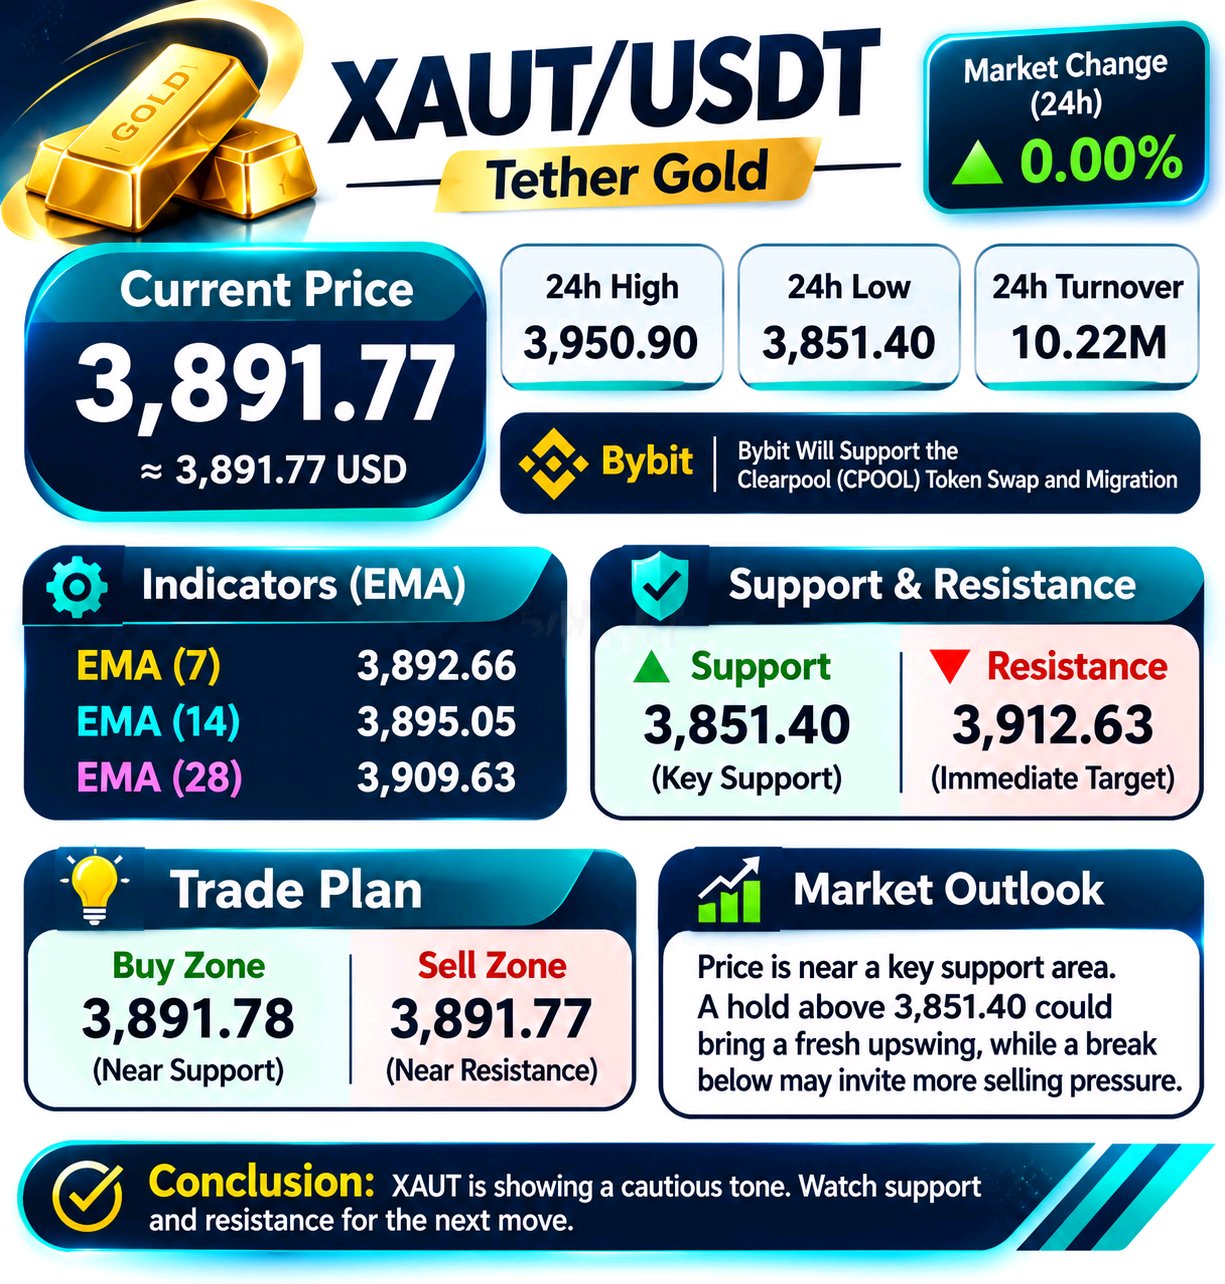
🔄 Gold just gave back the entire rally. I don't want to call a bottom on $XAUT while sellers still lean on the book. I want to see price hold above the old 3,872.51 base and then close above 3,910 on the 1H chart. Here's what the 1H chart shows: 🔹 The round trip: Gold launched from 3,872.51 last week and ran to the 4,128 area. Since then it has fallen all the way back, with a low of 3,851.40, just under the original base. 🔹 The drop: From the 4,124.95 high, price slid about 5.6% in a steady staircase of lower highs and lower lows. 🔹 The wick: The 3,851.40 low pierced the old base briefly, then price bounced and is back above it at around 3,892. That's a possible failed breakdown, but it hasn't been confirmed yet. 🔹 The averages: Price is sitting right on EMA7 (3,892.66) and EMA14 (3,895.05), with the Bollinger mid at 3,886.56. EMA28 at 3,909.63 is the first ceiling. 🔹 The bands: Upper 3,913.02 | Lower 3,860.09. They're narrowing, which fits the sideways drift of the last few hours. 🔹 The order book: Asks are about 71% vs 29% bids. Sellers are leaning on it, which matches the failed attempts to push higher. 🔹 The range: 24H high 3,950.90 and low 3,851.40, with 10.22M turnover. 🟢 Bullish: a 1H close above 3,910, then 3,950.90. Holding above 3,872.51 means the dip under the base was a trap. 🔴 Bearish: a 1H close under 3,872.51 and then 3,860 sends price back toward the 3,851.40 low. There is little marked support below it. A full round trip erases the whole rally. The base is now the line that decides what comes next. Are you watching $XAUT or another coin? #XAUT #Gold #Crypto #BinanceSquare #WSOT2026 #USInflationRunsHotAndRateHikeBetsRise #SanDiskAnnounces8For1StockSplit #AnthropicIPOTestsTheAIBoom #BitcoinHitsTwoMonthLowAfterUSMidterms $XAUTUSDT $BTCUSDT
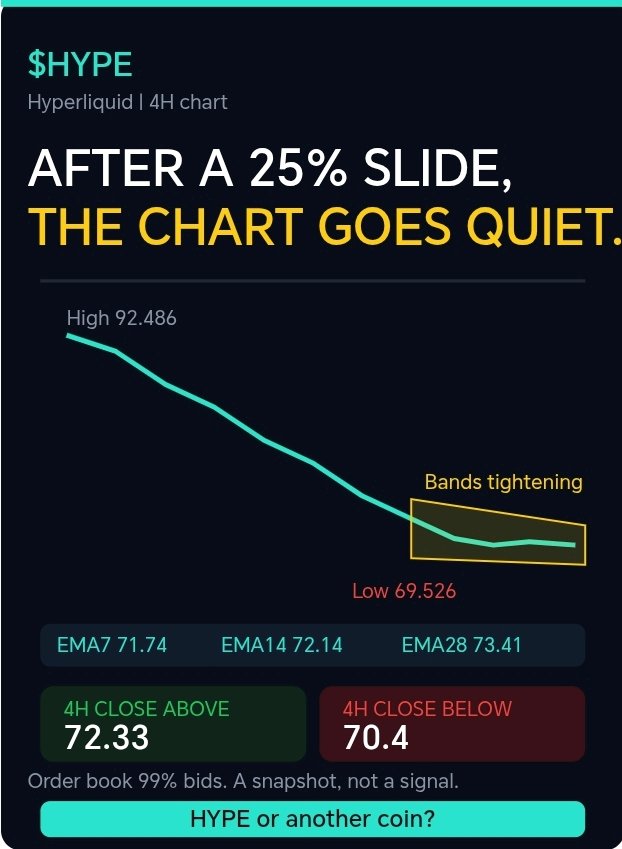
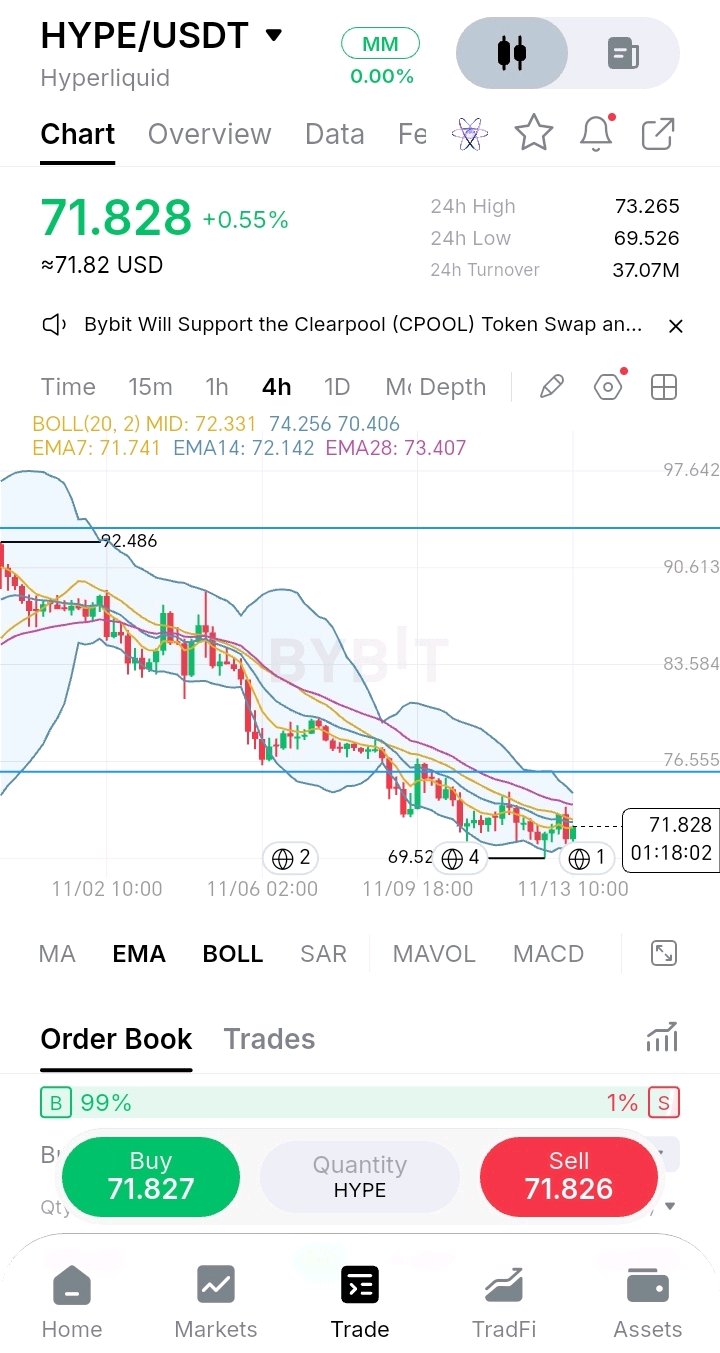
🧘 在不到兩週的時間內下跌 25% 後,4 小時線圖終於趨於平靜。 我不想將這種平靜稱為 $HYPE 的反轉。我希望能看到 4 小時線收在 72.33(中軌)之上,因為那才是讓停滯轉為復甦的關鍵。 以下是 4 小時線圖顯示的內容: 🔹 下跌:從 92.486 的高點,$HYPE 一路跌至 69.526,跌幅約 25%,呈現出連續的高點降低與低點降低的階梯式下跌。 🔹 平靜:過去幾天,K 線實體縮小,價格在同一個區間內震盪,而沒有再創新低。69.526 的低點自出現以來一直守住。 🔹 移動平均線:EMA7 為 71.74,EMA14 為 72.14,EMA28 為 73.41。兩條短期均線的距離在 0.6% 以內,且價格正好位於上方。它們正在走平,而非持續下探。 🔹 布林通道:布林通道正在收窄。上軌 74.26 | 中軌 72.33 | 下軌 70.41。這比拋售期間的通道更窄。 🔹 掛單簿:買單佔約 99%,賣單佔 1%。這雖然極端,但在買單佔 90% 以上時,早期的下跌也並未停止。這只是一個瞬間快照,而非訊號。 🔹 區間:24 小時高點 73.265,低點 69.526,成交額 3,707 萬。 🟢 看漲:4 小時線收於 72.33 之上,接著是 73.4 和 74.3。若能向 75.8 一線移動,將是真正的首波復甦。 🔴 看跌:4 小時線收於 70.4 以下會讓 69.526 的低點再次面臨考驗,若跌破該點位,下跌趨勢將重新開始。 下跌後的盤整圖表只是暫時的停滯。停滯之後的走勢才是關鍵。 你在關注 $HYPE 還是其他幣種? #HYPE #加密貨幣 #BinanceSquare #美國通膨升溫,升息押注升高 #SanDisk 宣佈 8 比 1 股票分割 #AnthropicIPOValuationTest #比特幣在美國中期選舉後跌至兩個月低點 #AI科技股拋售使納斯達克100指數蒸發2.5兆美元 $HYPEUSDT $BTCUSDT