
KnoxCrypto
5227點贊0分享102粉絲58關注
Spot Trader & Comunty Builder
Spot Trader & Comunty Builder
$ZILUSDT DELIVERS ALL THREE TARGETS SUCCESSFULLY ACHIEVED! Another strong move from Zilliqa ($ZIL)! Price followed the expected direction, with TP1, TP2, and TP3 all reached successfully. ZILUSDT Perpetual Current Price: $0.001179 24H Change: -14.99% All three targets have been completed, marking another successful trading opportunity. Congratulations to everyone who followed the analysis and captured this move. More market opportunities ahead. Stay focused, manage risk, and keep watching the charts! #WSOT2026

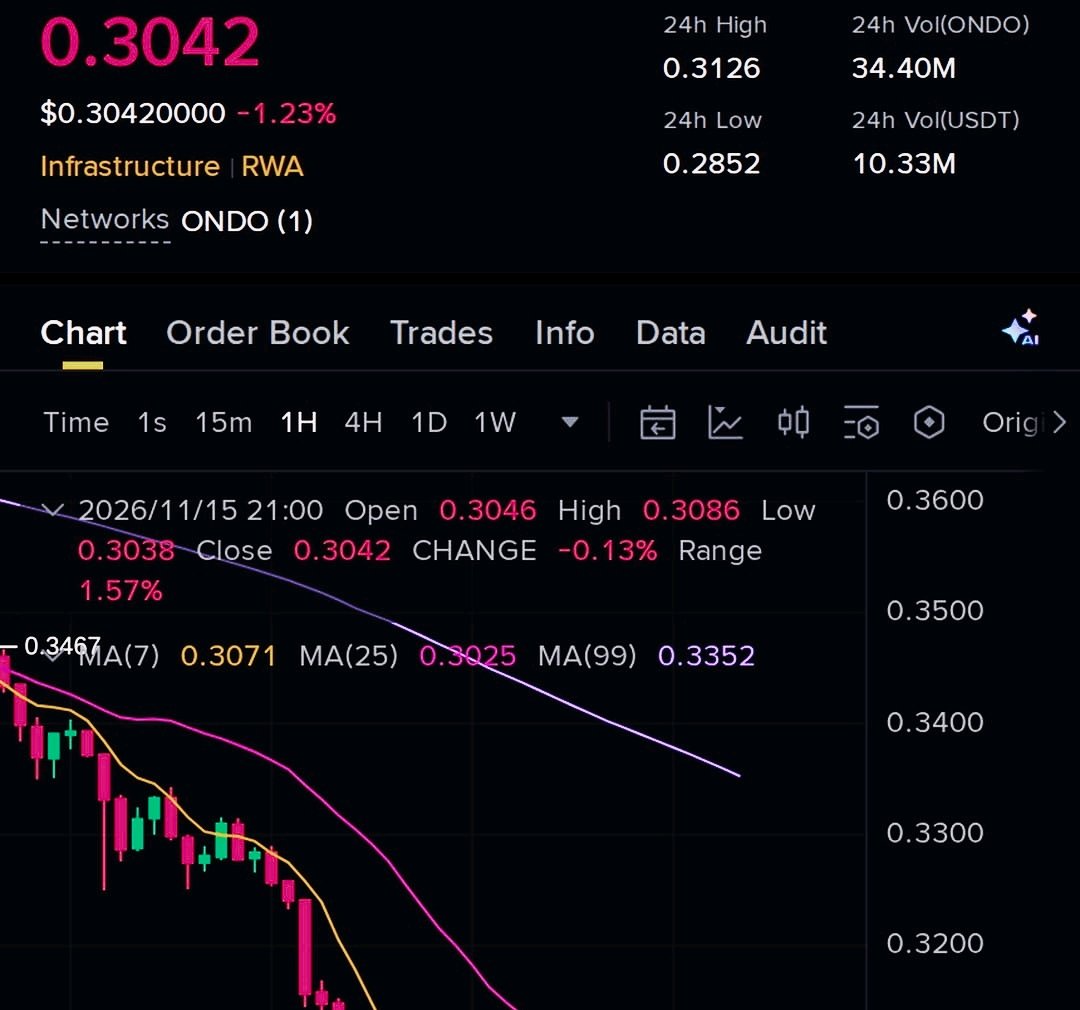
$ONDOUSDT FACES ANOTHER REJECTION SELLERS REMAIN IN CONTROL ONDO bounced toward a key resistance zone, but buyers failed to maintain upward momentum. Sellers quickly stepped in, suggesting that bearish pressure is still present and the recovery may be losing strength. The rejection around $0.3041–$0.3055 is an important area to watch. If price continues to struggle below this zone, further downside could develop. Key figures $0.3041–$0.3055 — Resistance and rejection zone $0.3122 — Level that would invalidate the bearish outlook $0.2941 — First downside support $0.2850 — Secondary support $0.2743 — Deeper downside level Bearish outlook: Continued rejection below resistance could keep sellers in control, with $0.2941 as the first important downside area. A breakdown could expose $0.2850 and potentially $0.2743. Bullish outlook: If ONDO reclaims resistance and establishes acceptance above $0.3055, bearish momentum could weaken. A move above $0.3122 would further challenge the current bearish structure. For now, ONDO remains under pressure, and the next reaction around resistance will be important. #WSOT2026

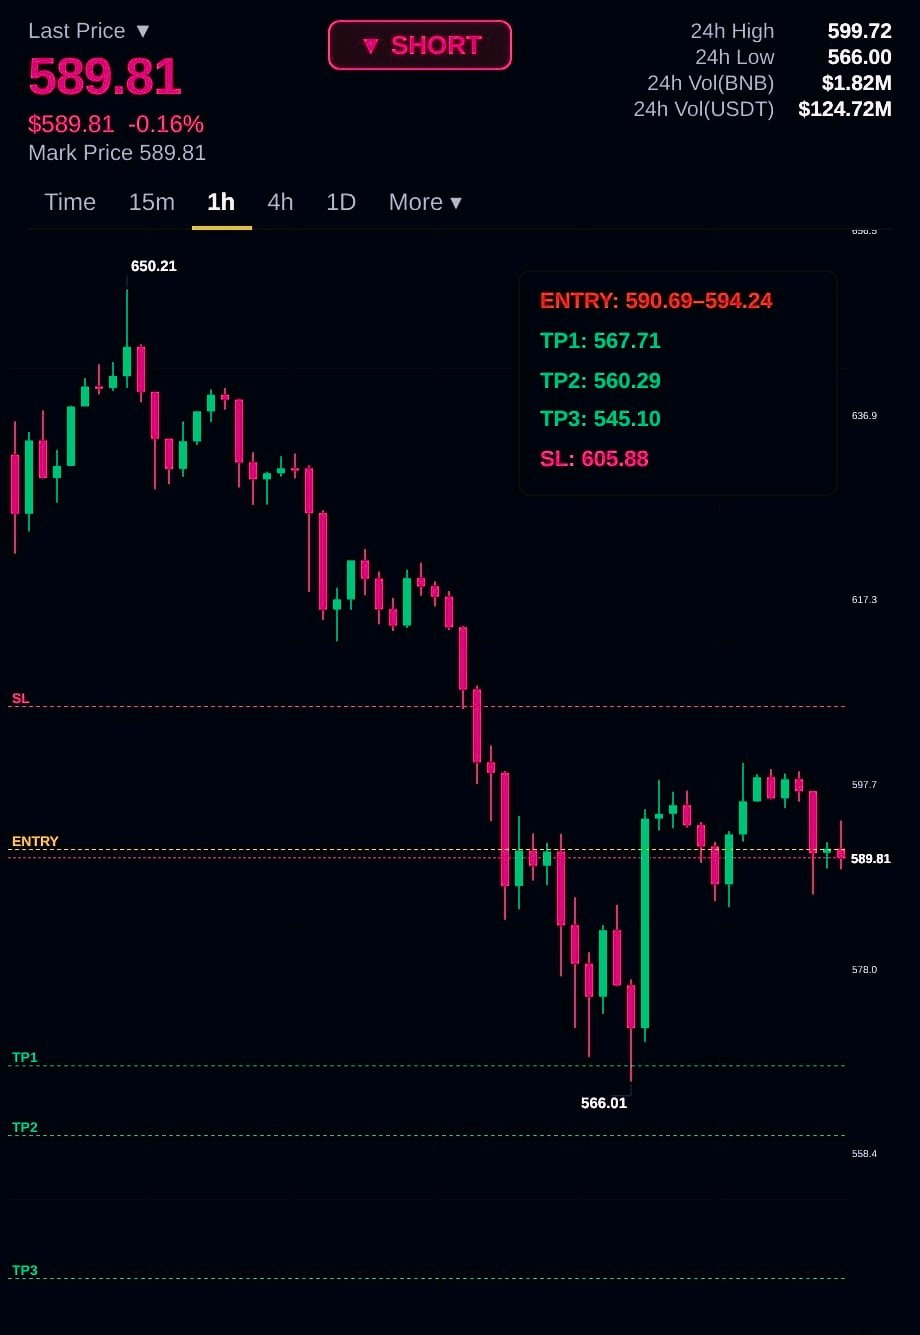
$BNBUSDT BEARS REMAIN IN CONTROL SELLING PRESSURE PERSISTS BNB is showing signs of weakness, with RSI currently around 43, indicating that bearish momentum remains stronger than buying pressure. The price is struggling to regain bullish strength, keeping the short-term outlook tilted toward the downside. Key figures $590.69–$594.24 — Entry zone $605.88 — Stop-loss level $567.71 — First downside target $560.29 — Second downside target $545.10 — Extended downside target Market outlook As long as BNB remains below the $594.24 region, sellers may continue to dominate. A rejection from this area could increase the possibility of further downside movement. However, a sustained recovery above $594.24 would weaken the bearish structure, while a move above $605.88 would invalidate this short-term bearish outlook. RSI: 43 — Momentum currently favors sellers, but further confirmation is important. Stay disciplined and manage risk carefully. #WSOT2026
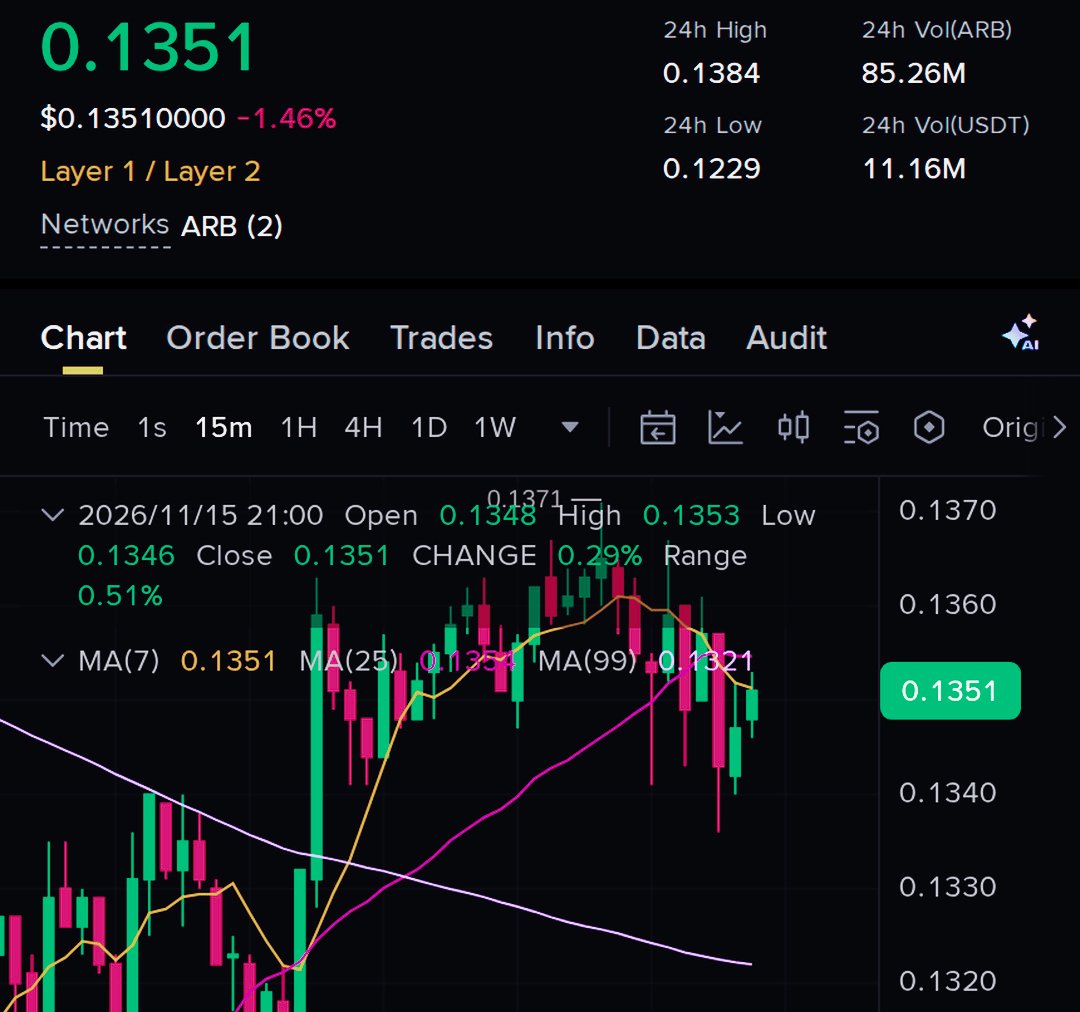
$ARBUSDT 展現韌性,買方試圖重奪控制權。 Arbitrum (ARB) 在成功穩住近期跌勢後,表現出令人鼓舞的強勢跡象。儘管大盤存在不確定性,買方仍守住了當前的價格區間,這表明拋售壓力可能正在逐漸減弱。 $0.1348–$0.1352 附近的反應尤為重要。若價格能在此區域保持穩定,將有助於建立短期的復甦結構,特別是在買方持續進場並防止再次跌破的情況下。不過,ARB 仍需更強勁的買盤成交量來確認此次反彈是否具備足夠的動能,以發展為持續的上漲走勢。 關鍵數據 $0.1348–$0.1352 — 買方試圖防守價格的重要需求區。 $0.1382 — 第一個阻力位及初步復甦檢查點。 $0.1406 — 若看漲動能持續,下一個上行區域。 $0.1449 — 擴大復甦中的更高阻力目標。 $0.1328 — 當前看漲結構的關鍵支撐及失效水平。 看漲情境 如果 ARB 能持續守在 $0.1348 區域上方,買方可能會逐步將價格推向 $0.1382。若能成功站上此水平,將改善短期結構,並可能為進一步復甦至 $0.1406 創造空間。 如果買盤壓力增強且成交量足以支撐突破,$0.1449 區域可能成為下一個值得關注的重要目標。 看跌情境 如果買方無法守住當前的需求區,復甦走勢仍相當脆弱。若價格持續跌破 $0.1348,將顯示需求減弱,並可能帶來額外的拋售壓力。 失守 $0.1328 支撐位將使當前的看漲觀點失效,並表明賣方已重新掌握短期趨勢的控制權。 市場展望 ARB 在近期低點附近展現出更好的韌性,這對買方而言是一個令人鼓舞的發展。然而,守住支撐只是第一步。真正的確認將來自於價格能否持續回升至 $0.1382 之上,隨後在 $0.1406 附近獲得更強的認可。 目前關鍵在於買方能否將這種防禦性的價格行為轉化為真正的上漲動能。 #WSOT2026

$UNIUSDT 面臨另一次拒絕,拋售壓力回歸。 Uniswap (UNI) 正努力維持其復甦,因為賣方在重要的阻力區附近再次介入。近期的反彈將價格帶回了看跌壓力顯現的區域,這表明買方在確立控制權方面仍然遇到困難。 $5.12–$5.148 附近的拒絕值得注意。如果 UNI 繼續無法維持在該區域上方,復甦可能會失去動力,並為另一次下跌走勢打開大門。然而,在預期更深層次的修正之前,來自價格走勢的確認仍然很重要。 關鍵數據 $5.12–$5.148 — 即時阻力與拒絕區。 $4.972 — 需要關注的第一個下行水平。 $4.849 — 若賣方保持控制權,則為第二支撐位。 $4.679 — 若出現更廣泛的疲軟,則為更深層的下行區域。 $5.241 — 看跌設置的失效水平。 看跌情境 如果 UNI 保持在阻力區下方,賣方可能會繼續控制短期結構。跌破 $4.972 可能會增加向 $4.849 的下行壓力。更廣泛加密貨幣市場的進一步疲軟可能會暴露 $4.679 區域。 看漲情境 另一方面,強勁反彈至 $5.148 以上可能會挑戰看跌前景。如果買方設法收復阻力位並維持在其上方,拋售壓力可能會逐漸減弱。向 $5.241 移動將是一個重要訊號,表明當前的看跌結構正在失去力量。 市場展望 UNI 在其最新的復甦嘗試後表現出猶豫,阻力位繼續吸引賣方。下一步走勢將取決於買方能否收復 $5.14 區域,或者賣方是否設法將價格推向更低的支撐位。 保持專注於確認訊號並謹慎管理風險,而不是對每一次短期波動做出反應。 #WSOT2026

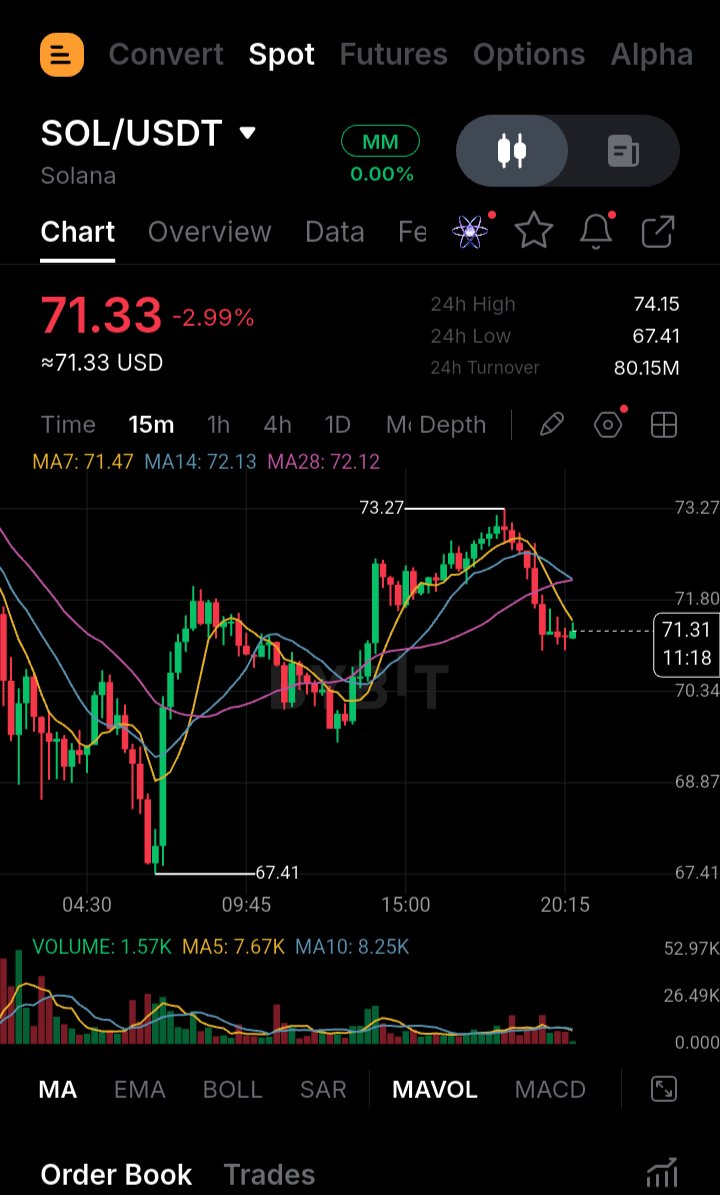
$SOLUSDT 面臨拋售壓力,需留意深度回調風險 Solana 在關鍵阻力位附近難以維持上漲勢頭,顯露出疲態。買方曾試圖推高價格,但拋售壓力漸顯,顯示復甦力道可能正在減弱。 目前的結構傾向於謹慎看跌,特別是如果 SOL 在 71.30 區域持續遭遇拒絕。若無法收復該區域,賣方可能獲得進一步將價格推向更低支撐位的機會。 關鍵數據 $71.14–$71.30 — 重要阻力與入場區間。 $69.09 — 第一個需要監控的下行水位。 $67.30 — 若拋售壓力增加,將作為第二支撐位。 $65.52 — 若回調擴大,更深層的下行水位。 $73.39 — 看跌結構失效點。 看跌情境 若 SOL 無法突破阻力區間並持續形成更低的高點,賣方可能重新掌控局面。若價格持續跌破 $69.09,將增強下行勢頭,並可能測試 $67.30 區域。若整體市場持續疲軟,價格可能會進一步關注 $65.52。 看漲情境 然而,如果買方成功收復 $71.30 並在阻力位上方站穩,看跌觀點可能會減弱。回升至 $73.39 將使目前的下行結構失效,並暗示買方正在重新掌握主導權。 市場展望 SOL 在阻力位附近仍承受壓力,但在預判另一次大幅下跌前,確認訊號至關重要。請密切關注 $71.14–$71.30 附近的反應,以及價格在第一個支撐位附近的表現。 提及槓桿:24x。在波動劇烈的市場條件下,風險管理至關重要。 #WSOT2026

加密貨幣市場爆倉 20.5 億美元,多頭部位面臨巨大壓力 過去 24 小時內,加密貨幣市場經歷了一波大規模清算,共有 329,339 名交易者受到影響。 多頭交易者承擔了大部分損失,約佔總清算金額的 19.22 億美元(93%)。單筆最大清算為幣安(Binance)上一筆價值 1,617 萬美元的 ETH 部位。 目前,ETH 交易價格約為 1,831.38 美元,跌幅為 3.21%。 這場大規模拋售究竟是在潛在市場反彈前清理過度槓桿,還是未來仍有進一步下跌的空間? 下一步走勢可能會揭示買方是否準備進場,或者賣方是否仍掌控局勢。$ETHUSDT $NEARUSDT #WSOT2026

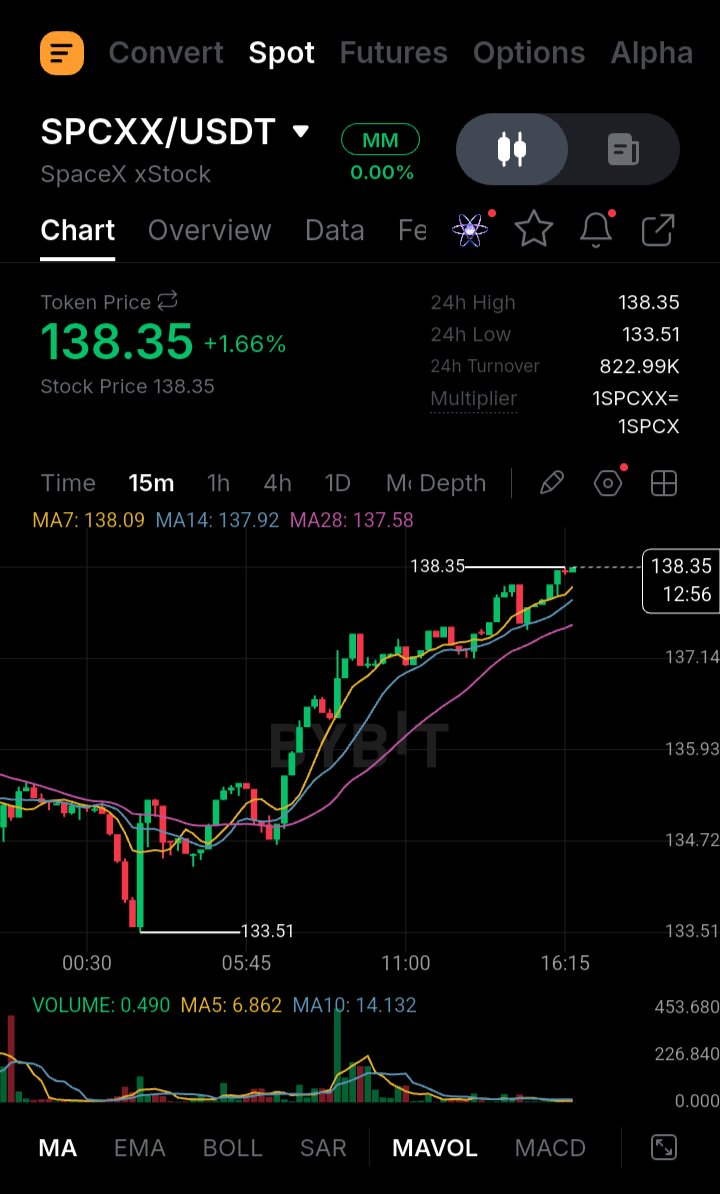
$SPCXXUSDT RECOVERY MOMENTUM BUILDING CAN BUYERS PUSH TOWARD $148.50? SPCX is showing encouraging signs of recovery after buyers stepped in around the $133.00 support region and prevented further downside. Price has climbed from $133.55 to $138.33, indicating that buying interest is gradually returning after the recent correction. The latest rebound suggests that sellers are losing some control, but bulls still need to overcome nearby resistance before a stronger upward move can develop. The $139.40 level is particularly important because a decisive breakout above this area could attract additional buying pressure and strengthen the recovery structure. Key figures $138.33 — Current price area $133.00–$133.55 — Major support zone $139.40 — Immediate resistance and breakout level $142.70 — Next upside objective $148.50 — Extended recovery level Bullish Scenario If SPCX continues holding above $133.00, buyers may have an opportunity to extend the current recovery. A sustained move above $139.40 would be an important confirmation of improving momentum and could open the way toward $142.70. If bullish pressure remains strong beyond that level, the next area to watch would be $148.50. Reaching this zone would indicate a more substantial recovery rather than just a temporary bounce. Bearish Scenario On the downside, failure to break above $139.40 could lead to another period of consolidation or a short-term pullback. Losing the $133.00 support zone would weaken the recovery structure and suggest that sellers are regaining control. Market Outlook SPCX is showing early signs of renewed buying interest, but confirmation is still needed. The reaction around $139.40 will be important in determining whether this recovery can develop into a stronger rally. Can SPCX bulls secure a breakout above $139.40 and push toward $142.70, or will sellers interrupt the recovery? #WSOT2026

$ADAUSDT SHOWS RECOVERY STRENGTH AFTER RECLAIMING $0.1539 BUYERS TRY TO REGAIN CONTROL Cardano is showing renewed buying interest after recovering from the $0.1430 support area and pushing back above the important $0.1539 level. This recovery suggests that buyers are attempting to regain control after the recent downside pressure. The latest price movement is encouraging, but the bigger question is whether ADA can maintain its position above the reclaimed level and attract enough buying volume to extend the recovery. The $0.1539 area is now an important level to monitor. If buyers successfully defend it during upcoming pullbacks, it could gradually become a stronger support zone rather than acting as previous resistance. However, a brief move above resistance is not enough to confirm a sustained trend reversal. Consistent buying activity and stronger volume will be important. Key figures $0.1430 — Previous support and recent recovery base $0.1539 — Important reclaimed price level $0.1539–$0.1548 — Current breakout and retest area $0.1580 — First major upside resistance $0.1600 — Psychological resistance and important market level $0.1630 — Higher resistance and potential recovery objective $0.1500 — Important downside level to monitor Bullish market scenario: If ADA continues holding above $0.1539, buyers could maintain the recovery structure and attempt another move toward $0.1580. A convincing breakout above this resistance, supported by stronger volume, would improve the short-term outlook and potentially open the way toward $0.1600. If buying pressure remains consistent beyond $0.1600, the next important area to watch would be $0.1630. A successful move above these resistance levels could indicate that market sentiment is gradually shifting in favor of buyers. Bearish market scenario: On the other hand, failure to maintain $0.1539 could weaken the current recovery. If sellers push ADA back below this level and buyers fail to reclaim it, the market may experience another pullback. A move toward $0.1500 would become important to monitor, as losing this area could increase downside pressure and bring the previous $0.1430 support zone back into focus. Overall market structure: ADA is showing early signs of recovery, but the market still needs stronger confirmation before calling this a sustained bullish reversal. The most important factor now is whether buyers can turn $0.1539 into reliable support. Trading volume, Bitcoin's overall direction, and ADA's reaction around nearby resistance levels will help determine whether this recovery has enough strength to continue or whether sellers will regain control. For now, $0.1539 remains the level that deserves the closest attention. #WSOT2026

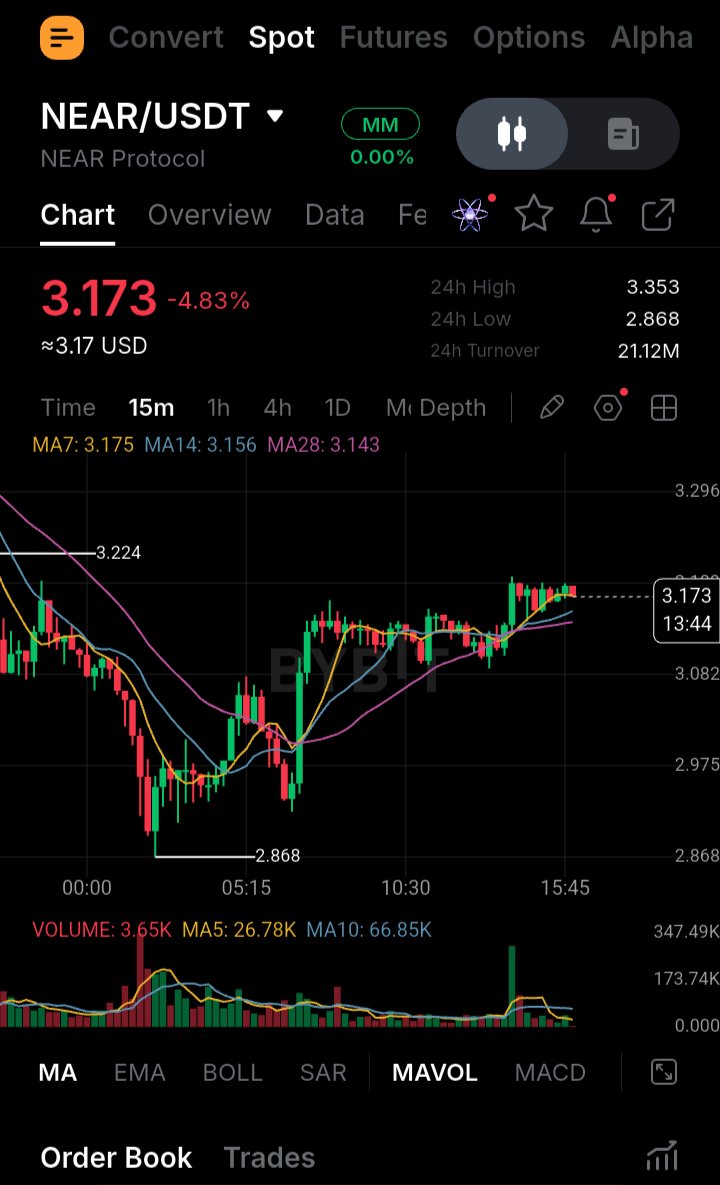
$NEARUSDT BULLISH MOMENTUM: BUYERS DEFEND $3.087 SUPPORT AS RECOVERY CONTINUES NEAR is showing signs of renewed buying interest after bouncing from the $3.0870 support zone. Price is currently trading around $3.183, indicating that buyers are attempting to maintain control and extend the recovery. The key area to watch is $3.130–$3.087. As long as buyers continue defending this zone, the bullish structure remains intact. A strong breakout above $3.198, supported by increasing trading volume, could provide further momentum for an upward move. Key figures $3.183 — Current market price $3.130–$3.087 — Major support and demand zone $3.198 — Important breakout resistance $3.220 — First upside target $3.300 — Secondary resistance $3.400 — Major upside objective $3.050 — Critical downside invalidation level Bullish scenario: If NEAR holds above the support zone and successfully breaks through $3.198 with strong volume, buyers could push the price toward $3.220. Continued momentum may open the way toward $3.300, with $3.400 becoming the next major upside objective. Bearish scenario: However, losing the $3.087 support could weaken the recovery and bring sellers back into control. A deeper move below $3.050 would invalidate the current bullish setup and suggest further downside risk. Market outlook: NEAR is showing encouraging recovery signals, but confirmation is still important. Watch the $3.198 breakout level, support strength, trading volume, and Bitcoin's direction before drawing conclusions. The next move will depend on whether buyers can turn this recovery into a sustained bullish continuation. #WSOT2026
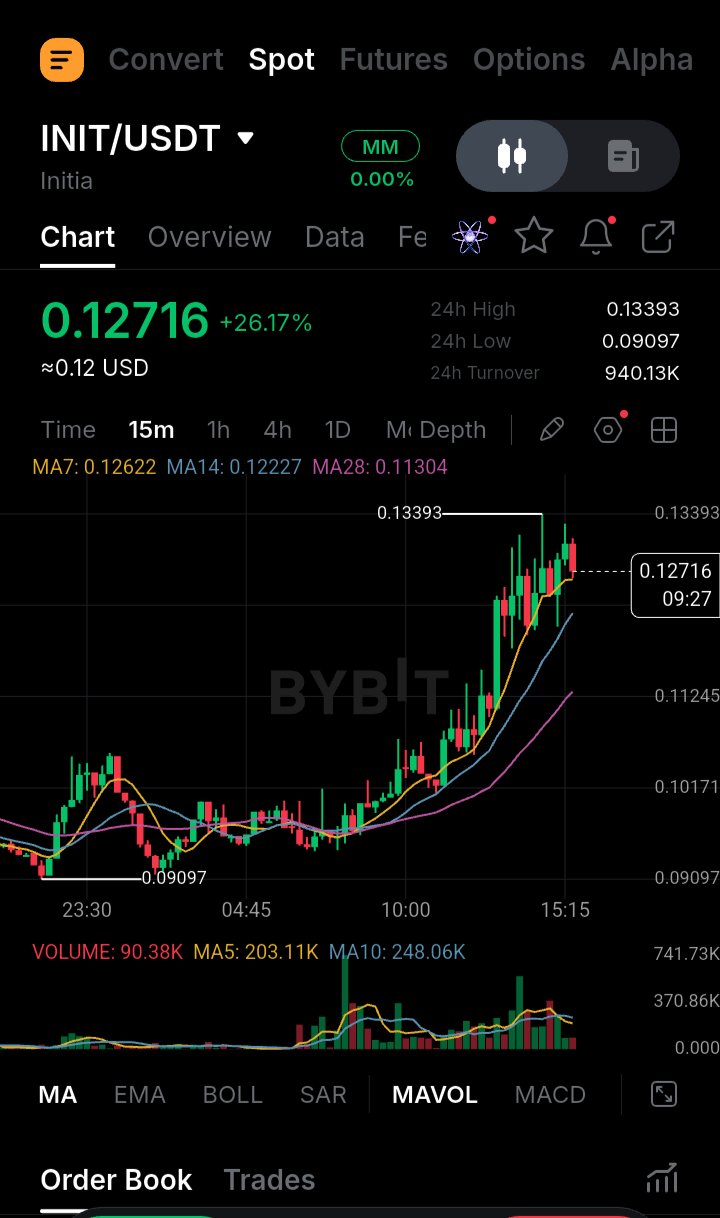
$INITUSDT 在 32% 的漲幅後展現強勢,買家能否將價格推向 $0.15? INIT 在近期暴漲 32% 後,展現出令人鼓舞的看漲勢頭。買家正試圖維持控制權,$0.1320 區域已成為值得關注的重要關卡。 只要價格保持在該區域之上,復甦結構就保持建設性。若能突破 $0.1397,可能會吸引更多買盤興趣,並為進一步上漲至 $0.1450 甚至 $0.1520 創造空間。 關鍵數據 $0.1320–$0.1340 — 重要支撐及價格守穩區。 $0.1397 — 關鍵阻力及看漲突破水平。 $0.1450 — 下一個上行區域。 $0.1520 — 更高的阻力目標。 看漲情境:保持在 $0.1320 之上並突破 $0.1397,可能會增強上行勢頭,並支持價格邁向 $0.1450–$0.1520。 看跌情境:失守 $0.1320 可能會削弱復甦結構,而跌破 $0.1270 則會使看漲前景面臨進一步壓力。 市場展望 依然值得關注,但在假設行情仍有上漲空間之前,確認突破阻力位至關重要。 #WSOT2026

Tom Lee sees the crypto crash as temporary, believing current market pressures won't derail the bigger supercycle. Is he right, or is more downside coming? $NVDA


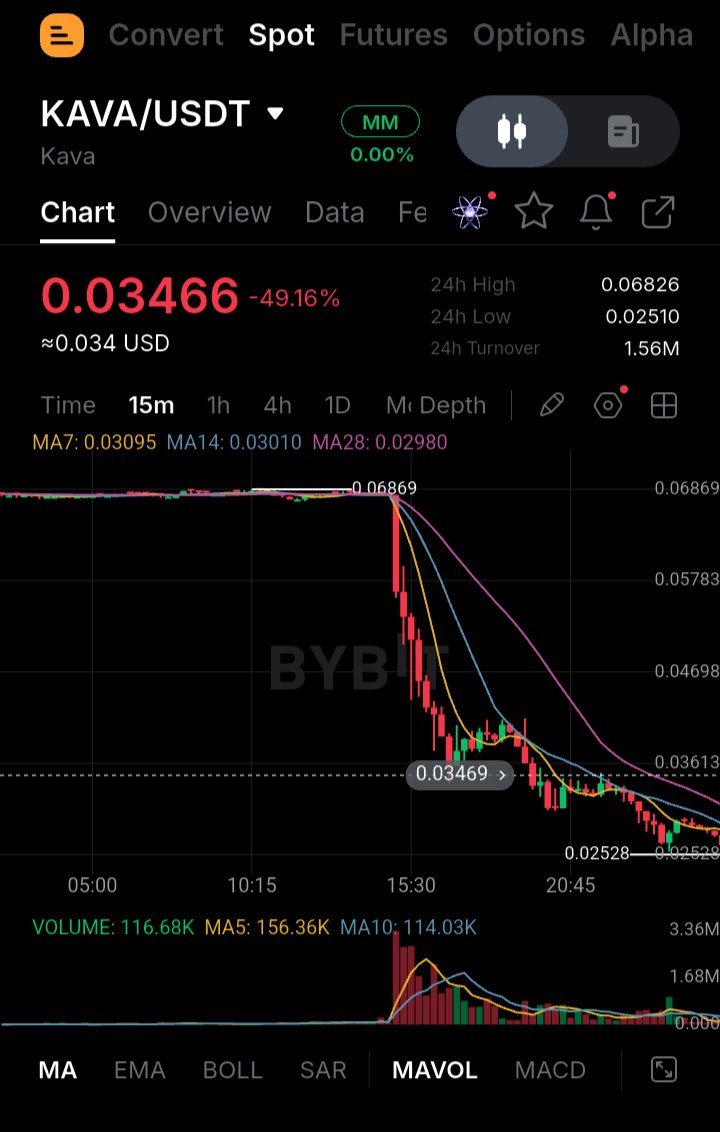
$KAVAUSDT 顯示出初步復甦跡象,$0.043 會重新成為焦點嗎? 經歷了超過 52% 的大幅下跌,但近期的價格走勢表明買家開始守護 $0.025 的支撐區。反彈至 $0.03234 顯示賣壓可能正在緩解,儘管仍需確認趨勢是否反轉。 關鍵數據 $0.03234 — 當前價格區間 $0.02500 — 值得關注的主要支撐區 $0.03700 — 第一個重要阻力位 $0.04300 — 若復甦持續,下一個上行目標位 看漲情境: 如果 KAVA 能持續保持在 $0.025 上方,買家可能會逐漸重掌控制權。持續突破 $0.03234 將增強復甦前景,屆時 $0.037 和最終的 $0.043 將成為重要的阻力區。 看跌情境: 儘管近期出現反彈,但整體市場結構依然疲軟。如果買家未能維持動能且 KAVA 失守 $0.025 的支撐,新一輪的賣壓可能會將價格推向更低水平。 目前,$0.025 區域仍是觀察的最重要點位。下一步走勢將取決於買家能否將此次緩解性反彈轉化為更強勁的復甦。 $KAVA 是在為真正的回歸做準備,還是我們僅僅看到了短暫的紓困性反彈?

Tom Lee 認為近期的加密貨幣拋售只是暫時的挫折,並非牛市週期的終結。 Tom Lee 相信加密市場目前的壓力主要由幾個外部因素所驅動,而非長期市場前景出現惡化。 他指出,導致市場波動的原因包括與 Nvidia 相關的追加保證金通知(margin calls)、投資者在 Anthropic IPO 前減少曝險、先前遭凍結的駭客相關資金被釋放、對 AI 破壞市場的擔憂日益增加,以及美國加強對晶片出口的審查。 儘管面臨這些挑戰,Lee 仍對整體加密超級週期(supercycle)保持信心。在他看來,目前的疲軟只是暫時性的階段,隨著時間推移,這些市場壓力可能會逐漸消退。 但你怎麼看呢? 這是否只是下一次加密貨幣大漲前的短期回調,還是市場在復甦前可能面臨更深的跌幅? #WSOT2026 $NAVXUSDT $ETHUSDT


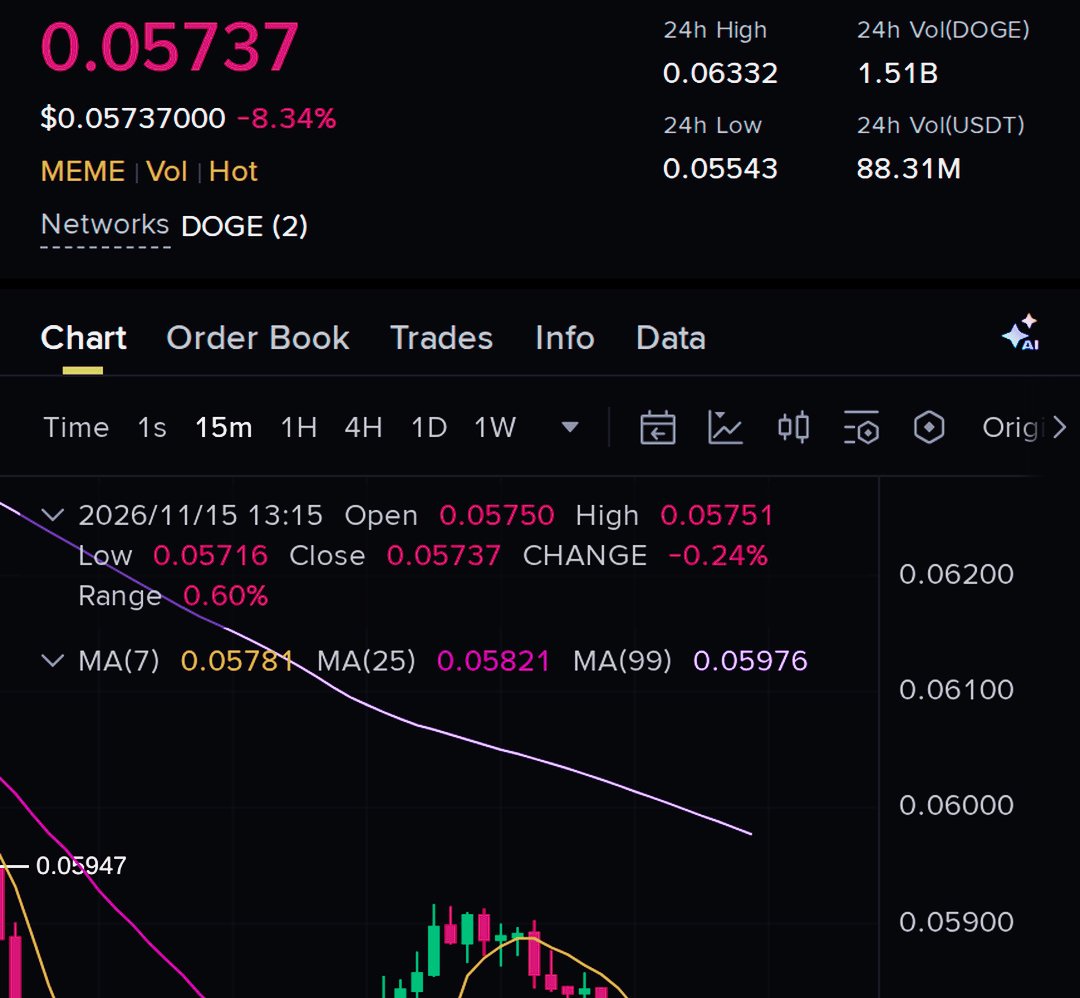
$DOGEUSDT 看跌動能依然是關注焦點 Dogecoin 仍在努力重回先前的支撐區域,顯示買方尚未展現足夠的力道來扭轉當前的短期弱勢。每一次未果的復甦嘗試都讓賣壓持續存在,而無法在先前支撐區上方建立更強的立足點,則讓賣方佔據優勢。 此處的關鍵因素在於 DOGE 對其當前價格區域的反應。如果買方持續無法守住該區域,可能會出現新一波的跌勢。然而,若出現突發的強勁反彈和買入量,則可能挑戰目前的看跌結構。 關鍵數據 進場區間:0.05735–0.05747 — 監控潛在看跌延續的區域。 止盈點 1 (TP1):0.05569 — 第一個下行參考點。 止盈點 2 (TP2):0.05425 — 下一個重要的下行水平。 止盈點 3 (TP3):0.05282 — 若賣壓加速,更深層的下行目標。 止損點 (Stop Loss): 0.05867 — 將使此設置失效的水平。 槓桿:40x — 高風險槓桿倉位。 看跌情境 若 DOGE 持續在復甦區下方交易且賣方保持控制,價格可能逐步邁向 0.05569。若明確跌破該水平,可能會觸及下一個支撐位 0.05425 附近。若整體市場疲軟持續,0.05282 可能成為另一個值得關注的重要區域。 看漲情境 另一方面,如果 DOGE 成功收復失土並維持買壓,看跌前景可能會開始減弱。價格若來到 0.05867 將使當前的看跌設置失效,並顯示買方正在重新奪回控制權。 市場展望 目前而言,由於 DOGE 尚未展現出令人信服的復甦,重心仍放在做空。然而,40 倍槓桿帶有顯著的強制平倉風險,因此倉位管理和風險控制顯得格外重要。 #WSOT2026

比特幣巨鯨正在增持,而小型投資者則減少風險敞口$BTCUSDT $DOGEUSDT 儘管比特幣經歷了 24% 的劇烈回調,但大型持幣者似乎採取了不同的策略。CryptoQuant 的數據顯示,持有超過 1,000 枚比特幣的錢包在市場低迷期間增持了約 47,000 枚比特幣。 另一方面,中型投資者一直在減持,而比特幣的整體需求已降至 2025 年 4 月以來的最低點。 這創造了一種有趣的市場動態:主要持有者正在增加其風險敞口,而更廣泛的市場需求仍面臨壓力。 現在的關鍵問題是,巨鯨的增持能否最終超過拋售壓力,並支撐比特幣的下一個復甦階段。 #WSOT2026

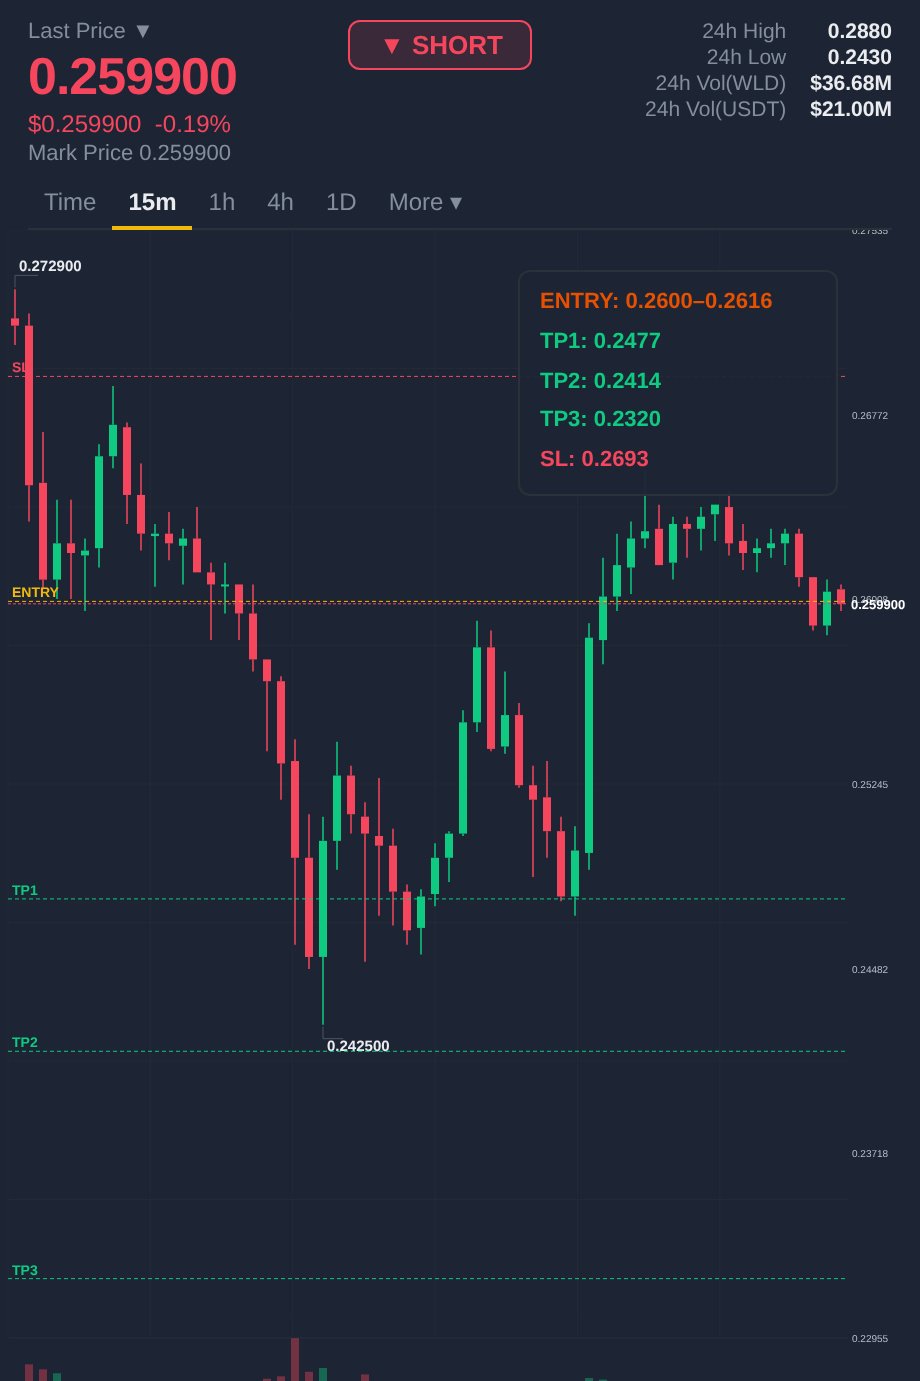
$WLDUSDT 在阻力位附近遇阻後,顯示出潛在的看跌反轉跡象。由於 RSI 已回落至 42,動能需要密切關注。 負資金費率為 -0.044%,也凸顯了衍生品市場中不同尋常的倉位配置。如果賣方持續施壓,WLD 可能會重新測試下方的支撐區域。 關鍵數據 $0.2600–$0.2616 — 阻力與遇阻區間 $0.2693 — 重要失效水平 $0.2477 — 第一下行支撐位 $0.2414 — 次要支撐位 $0.2320 — 主要下行水平 市場展望 若持續在阻力位下方遇阻,可能會加劇看跌動能,並增加進一步下行的可能性。然而,若價格突破 $0.2693,則會削弱看跌觀點。 在得出結論前,請觀察價格走勢與成交量以進行確認。 #WSOT2026

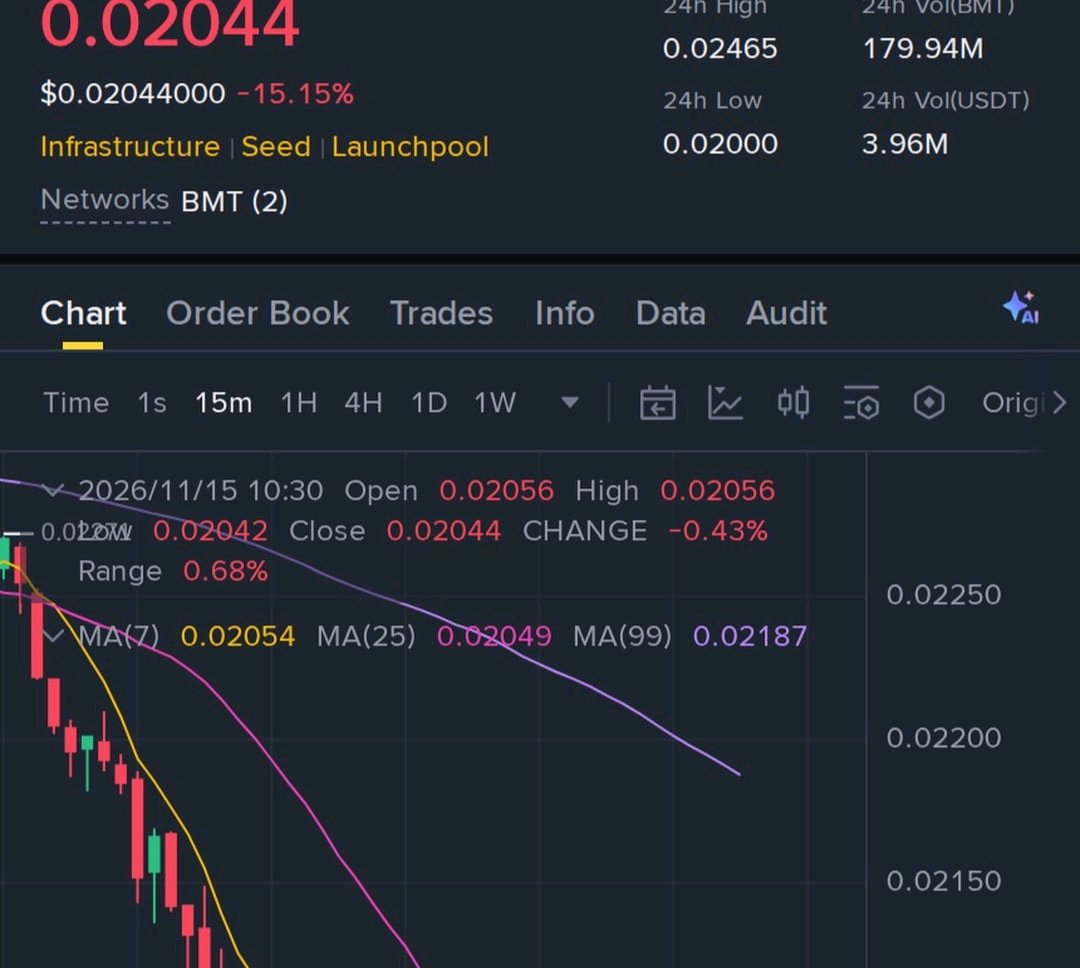
$BMTUSDT is showing potential signs of a bullish recovery, and buyers could step in if the price manages to hold its nearby support zone. After recent price movements, a successful bounce could open the door for another upward move. Keeping this long setup on watch with approximately 46x leverage. Entry Zone: 0.02038–0.02045 Key figures - 0.01980 — First upside target - 0.01929 — Second upside target - 0.01878 — Third upside target - 0.02088 — Risk level A strong bounce from the current area could support a recovery, but confirmation from buying volume is important before expecting further upside. #WSOT2026
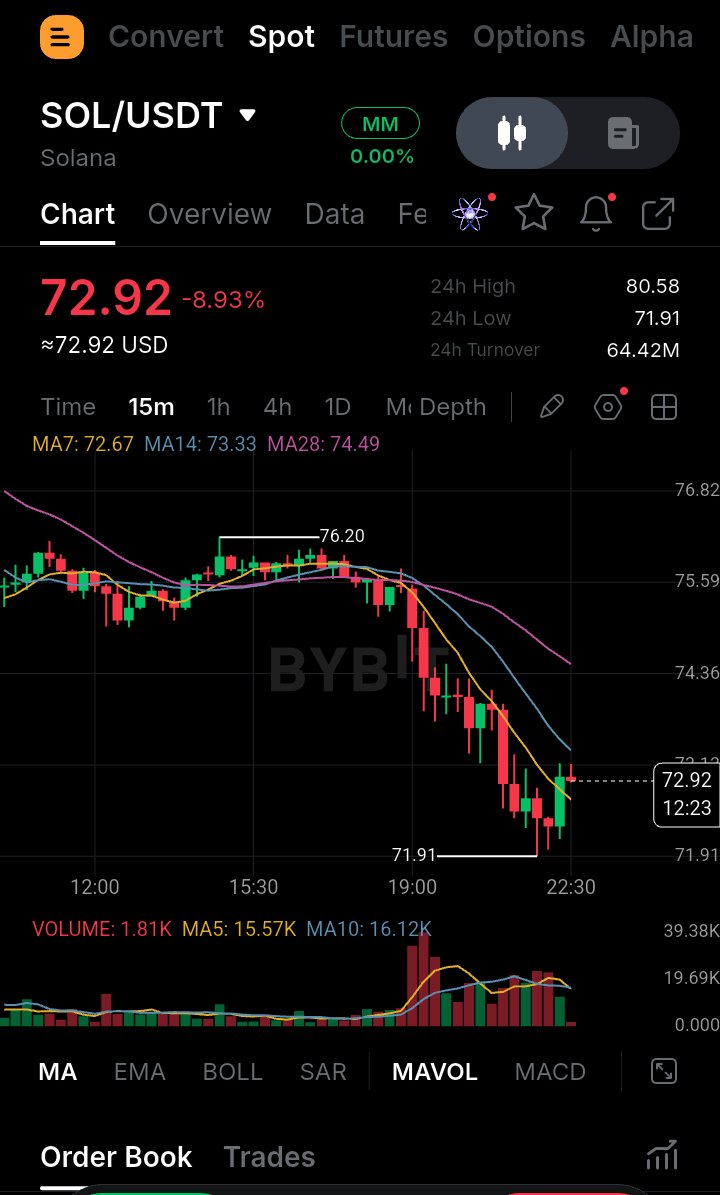
$SOLUSDT Market Analysis: Bears Are Testing Lower Support Solana is showing continued bearish pressure as sellers attempt to push the price below its recent support structure. With SOL trading around $72.96, the market remains vulnerable to further downside if buyers fail to defend the current region. Key figures $76.50 — Upper resistance area $73.50 — Important short-term price zone $72.96 — Current reference price $71.80 — First downside support $70.00 — Psychological support level $68.50 — Next potential support $66.00 — Deeper downside area Bearish Scenario If SOL fails to reclaim the $73.50–$76.50 region, selling pressure could remain dominant. A sustained move below $71.80 may expose the $70.00 and $68.50 support zones, while continued weakness could bring $66.00 into focus. Bullish Scenario On the other hand, a strong recovery above $76.50 could weaken the bearish structure. A move toward $80.50 would be an important sign that buyers are regaining control. For now, SOL remains under selling pressure, and traders should watch how price reacts around nearby support before drawing conclusions. #WSOT2026

$HYPEUSDT Shows Bullish Potential as Buyers Defend Key Support HYPE is attracting attention as buyers attempt to defend the current support zone on the 1H timeframe. The RSI is around 30, indicating oversold conditions and the possibility of a short-term recovery. Funding is currently at +0.002%, while price action suggests buyers are stepping in around the $65.80–$66.20 region. However, sustained buying pressure will be important to confirm a stronger upward move. Key figures - $65.80–$66.20 — Important support and reaction zone - $63.81 — Critical downside level - $68.16 — First upside resistance - $68.50 — Next resistance area - $69.80 — Higher recovery target - RSI: 30 — Oversold territory - Funding Rate: +0.002% Bullish Scenario If HYPE continues holding support and buying volume increases, a recovery toward $68.16 and $68.50 could develop. A sustained move above these levels may open the way toward $69.80. Bearish Scenario If buyers fail to defend the current zone, selling pressure could push price lower. A break below $63.81 would weaken the bullish recovery outlook. HYPE is at an important technical area, and the next reaction from buyers could determine its short-term direction. #WSOT2026