Bit_Space77
75點贊0分享20粉絲44關注
$BTC Since Day Zero •|• #Bybit KOL & CMC & Web3 Growth 📈💹 Content Creator 💫
$BTC Since Day Zero •|• #Bybit KOL & CMC & Web3 Growth 📈💹 Content Creator 💫
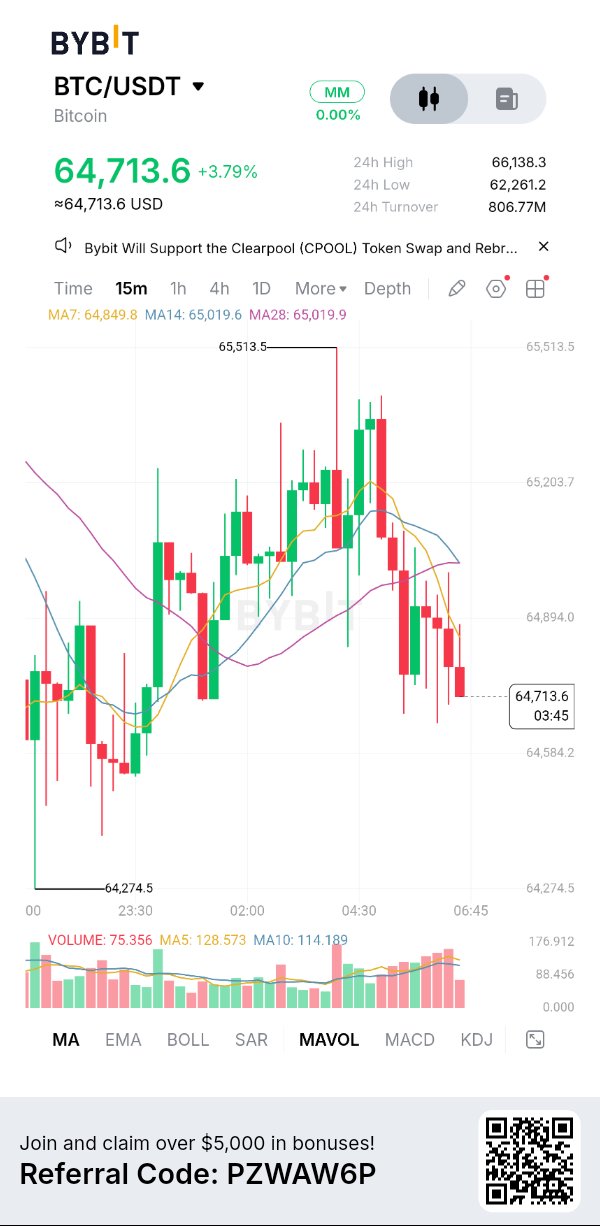
Bitcoin is showing a serious battle between exhausted sellers and buyers desperately searching for a floor. After suffering a massive correction from the $87,000 region, BTC is now hovering around $65,000, and the broader daily structure remains heavily damaged. What makes this situation particularly interesting is that the market is approaching a critical demand region where the next reaction could determine whether Bitcoin stabilizes or extends its correction even further. Looking closely at the daily chart, Bitcoin is trading significantly below its major moving averages. The EMA50 is around $77,131, while the EMA200 is near $77,735 on the reference daily analysis. This leaves a substantial resistance structure overhead, confirming that the broader trend remains under pressure. The RSI is sitting around 24, deeply inside oversold territory. Meanwhile, the daily MACD histogram remains negative, showing that bearish momentum is still a major concern. However, I would not ignore the possibility of a temporary relief rally after such an aggressive decline. Here is what I am watching closely: 📉 Critical Support Zone: Bitcoin is approaching the $62,830–$62,180 region. This is an important support area where buyers need to demonstrate meaningful strength. A decisive daily close below this zone could expose BTC to another wave of downside pressure. 🎯 Downside Targets: If the current support fails, the next levels I am watching are $60,350 and $58,720. A sustained breakdown below these areas would indicate that the corrective structure is extending further. 📈 Recovery Scenario: On the upside, Bitcoin first needs to reclaim $66,937. Above that, the $68,565 region becomes the next important resistance. A convincing move beyond $70,000 would provide stronger evidence that buyers are beginning to regain control. Momentum & Market Structure The most important thing right now is understanding the difference between an oversold market and a confirmed reversal. RSI near 24 tells us that selling pressure has been extremely aggressive, but it does not guarantee that the bottom is already in. Bitcoin can remain oversold while sellers continue controlling the trend. I want to see a meaningful change in market structure, stronger buying volume, and a confirmed higher low before considering a bullish shift. Trading Strategy & Risk Management I am not interested in chasing Bitcoin with a fresh short position after such an extended decline. Selling directly into major support without confirmation can expose traders to an aggressive relief bounce. My focus is on two possible scenarios. If BTC bounces toward the $66,937–$68,565 resistance region and sellers produce a clear rejection, a potential lower-high short setup could develop. I would require a confirmed entry, a stop-loss above the resulting swing high, and a worthwhile risk-to-reward ratio. On the other hand, if buyers successfully defend the $62,180 support region, establish a higher low, and reclaim nearby resistance, a short-term recovery opportunity could emerge. A sustained daily breakdown below $62,180 would invalidate the immediate recovery scenario. Conversely, a strong reclaim above $68,565 would weaken the bearish continuation thesis and bring the $70,000 region into focus. Bitcoin is at a critical technical decision point. The market has already experienced substantial damage, but the next move still needs confirmation. I would rather miss the first part of a recovery than enter blindly and risk unnecessary losses. Respect the trend, protect your capital, and let price action reveal the next opportunity. $BTCUSDT #ByXIMPACT
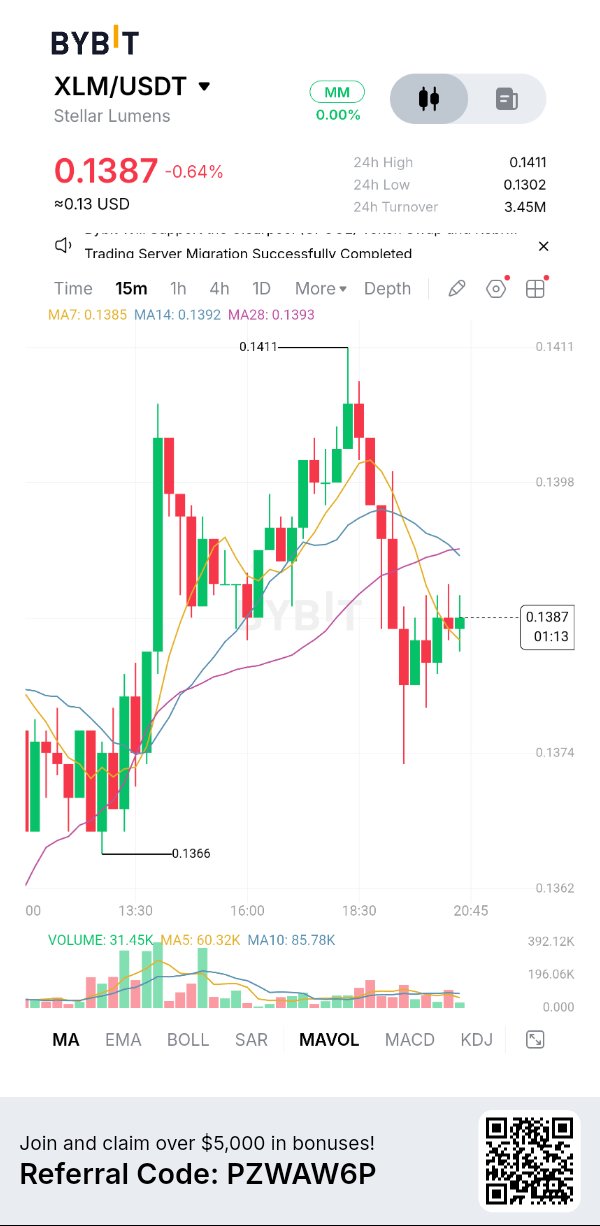
Stellar is showing serious technical weakness, and the current price action suggests that sellers are still controlling the broader market structure. After struggling to maintain its previous bullish momentum, XLM has slipped into a deeper corrective phase, with price trading around the $0.138–$0.140 region. What makes this situation particularly interesting is that the market is approaching an important support area where buyers will need to demonstrate real strength to prevent another leg lower. Looking at the daily chart, XLM is trading significantly below its 20-day and 50-day moving averages, which are approximately $0.1555 and $0.1793 respectively. This positioning confirms that the recovery structure remains damaged. The daily RSI is sitting around 26–28, placing Stellar close to oversold territory. Meanwhile, MACD remains bearish, indicating that downside momentum has not yet produced a convincing reversal. Here is what I am watching closely: 📉 Critical Support Zone: The $0.1325–$0.1283 region is the first important demand area. If sellers manage to break below this zone with strong momentum, the market could experience another wave of downside pressure. 🎯 Downside Targets: A confirmed breakdown below $0.1283 would bring $0.1215 into focus. If that level also fails to attract buyers, the deeper $0.1147 region becomes another potential downside target. 📈 Recovery Scenario: On the upside, XLM first needs to reclaim the $0.1425 resistance. A stronger move above $0.1442 would provide an early indication that buyers are attempting to regain control. However, the bigger challenge remains the $0.1555–$0.1611 region, where stronger resistance could emerge. Momentum & Market Structure One important detail I don't want traders to overlook is the RSI approaching oversold territory. This condition can create opportunities for a relief bounce, but it does not automatically confirm that the market has reached its bottom. The broader trend remains under pressure, and I want to see a meaningful improvement in buying volume, a higher low, and a confirmed break above resistance before considering a bullish shift. Trading Strategy & Risk Management I am not interested in blindly buying XLM simply because it has experienced a significant decline. First, I want to see whether buyers can defend the $0.1283 demand area and establish a stronger recovery structure. On the bearish side, a weak relief rally followed by a rejection around the $0.1425–$0.1442 resistance zone could create another potential short opportunity. However, I would wait for a confirmed lower high, a clear entry, and a stop-loss above the resulting swing high. A decisive daily breakdown below $0.1283 would invalidate the immediate recovery scenario and expose the deeper support levels. Conversely, a sustained reclaim of $0.1611 would significantly weaken the current bearish outlook and suggest that buyers are finally making progress. Stellar is approaching an important technical decision point. The next meaningful move could come from either side, but I don't want to predict a reversal before the chart confirms it. For now, patience is my strategy. I am watching the support reaction, respecting the market structure, and prioritizing capital protection over chasing an uncertain move. Let XLM show its next direction before making the decision. $XLMUSDT #ByXIMPACT
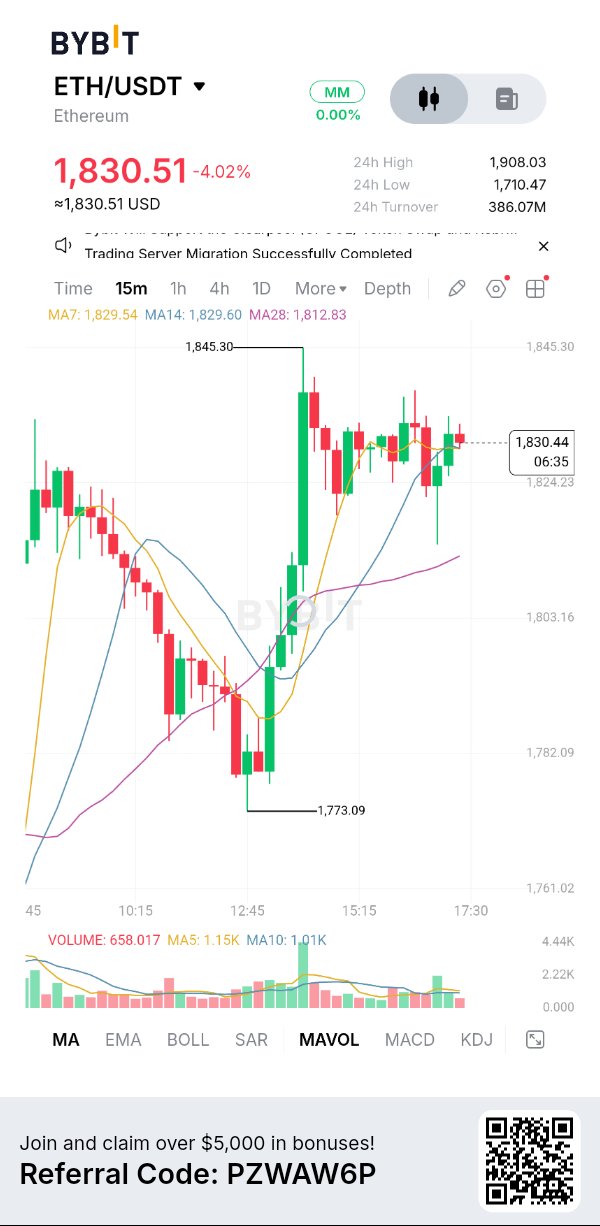
以太坊(Ethereum)正經歷極其困難的階段,目前的市場結構正在向交易者發出嚴重的警告。在從之前的高點大幅回落後,ETH 一直難以建立令人信服的復甦,賣方持續主導著整體趨勢。值得關注的是,價格目前正接近一個主要支撐區域,下一次的市場反應可能決定這次修正是否會進一步擴大,或是買方最終會進場護盤。 觀察日線圖,截至 11 月 15 日,以太坊交易價格約在 1,800 至 1,840 美元區間。價格仍遠低於其主要移動平均線,其中 50 日均線在 2,398 美元附近,200 日均線則在 2,146 美元左右。這種倉位反映了嚴重的技術性損害,並使整體趨勢持續承壓。日線 RSI 指標在 20-25 之間徘徊,顯示出極度超賣的狀態。同時,MACD 仍低於信號線,顯示看跌動能尚未出現令人信服的反轉。 📉 關鍵支撐區:1,730 美元區域是我目前觀察的第一個重要支撐。如果賣方成功將日線收盤價決定性地壓在此水平下方,以太坊可能會面臨新一波的拋售壓力。 🎯 下行目標:一旦確認跌破,可能會下探 1,687 美元的支撐,隨後是 1,604 美元。如果市場疲軟在這些水平之上進一步加劇,更深處的 1,587 美元區域將成為另一個需要關注的重要區間。 📈 復甦情境:在上行方面,ETH 首先需要收復 1,840 美元。若能有效突破 1,894 美元,將提供買方回歸的強烈信號。在此之後,2,019 美元區域將成為下一個主要阻力位,隨後更廣泛的移動平均線結構才會重新進入視野。 動能與市場結構 有一點我不想忽視,那就是極度超賣的 RSI。這種情況可能會引發強勁的反彈,但超賣並不自動意味著底部已經出現。在強烈的看跌環境中,即使動能指標顯示已耗盡,價格仍可能持續承壓。 重要的問題在於,買方能否將這種暫時的拋售耗竭轉化為真正的結構性復甦。在改變我對整體市場的看法之前,我希望能看到更強的成交量、更高的低點,以及對阻力位的有效收復。 交易策略與風險管理 我對僅僅因為 ETH 大跌而開設多頭倉位不感興趣。首先,我希望看到買方捍衛 1,730 美元的需求區,並展現出足夠的強度來收復 1,840–1,894 美元的阻力區。 在看跌方面,若出現無力的反彈隨後被明確拒絕,可能會創造另一個潛在的空頭機會。然而,我會等待一個確認的較低高點、明確的進場點以及高於波段高點的止損設定,而不是去追逐已經延伸的紅色蠟燭圖。 若跌破 1,687 美元且無法回升,將嚴重削弱復甦情境並可能下探至 1,604 美元的支撐位。相反地,若日線能強勢收復 1,894 美元,將削弱短期的看跌前景,並將目光轉向更高的阻力位。 以太坊正接近一個重要的決策點。雖然雙向都有可能出現顯著的反應,但我更傾向於等待確認,而非預測市場。保護資本比捕捉精確的底部更重要。 目前,我正在觀察支撐位的反應,尊重整體趨勢,並等待市場揭示其下一個動向。 $ETHUSDT #ByXIMPACT