MSALIS
1797點贊0分享27粉絲31關注
BUILDER BY PROFESSION
BUILDER BY PROFESSION
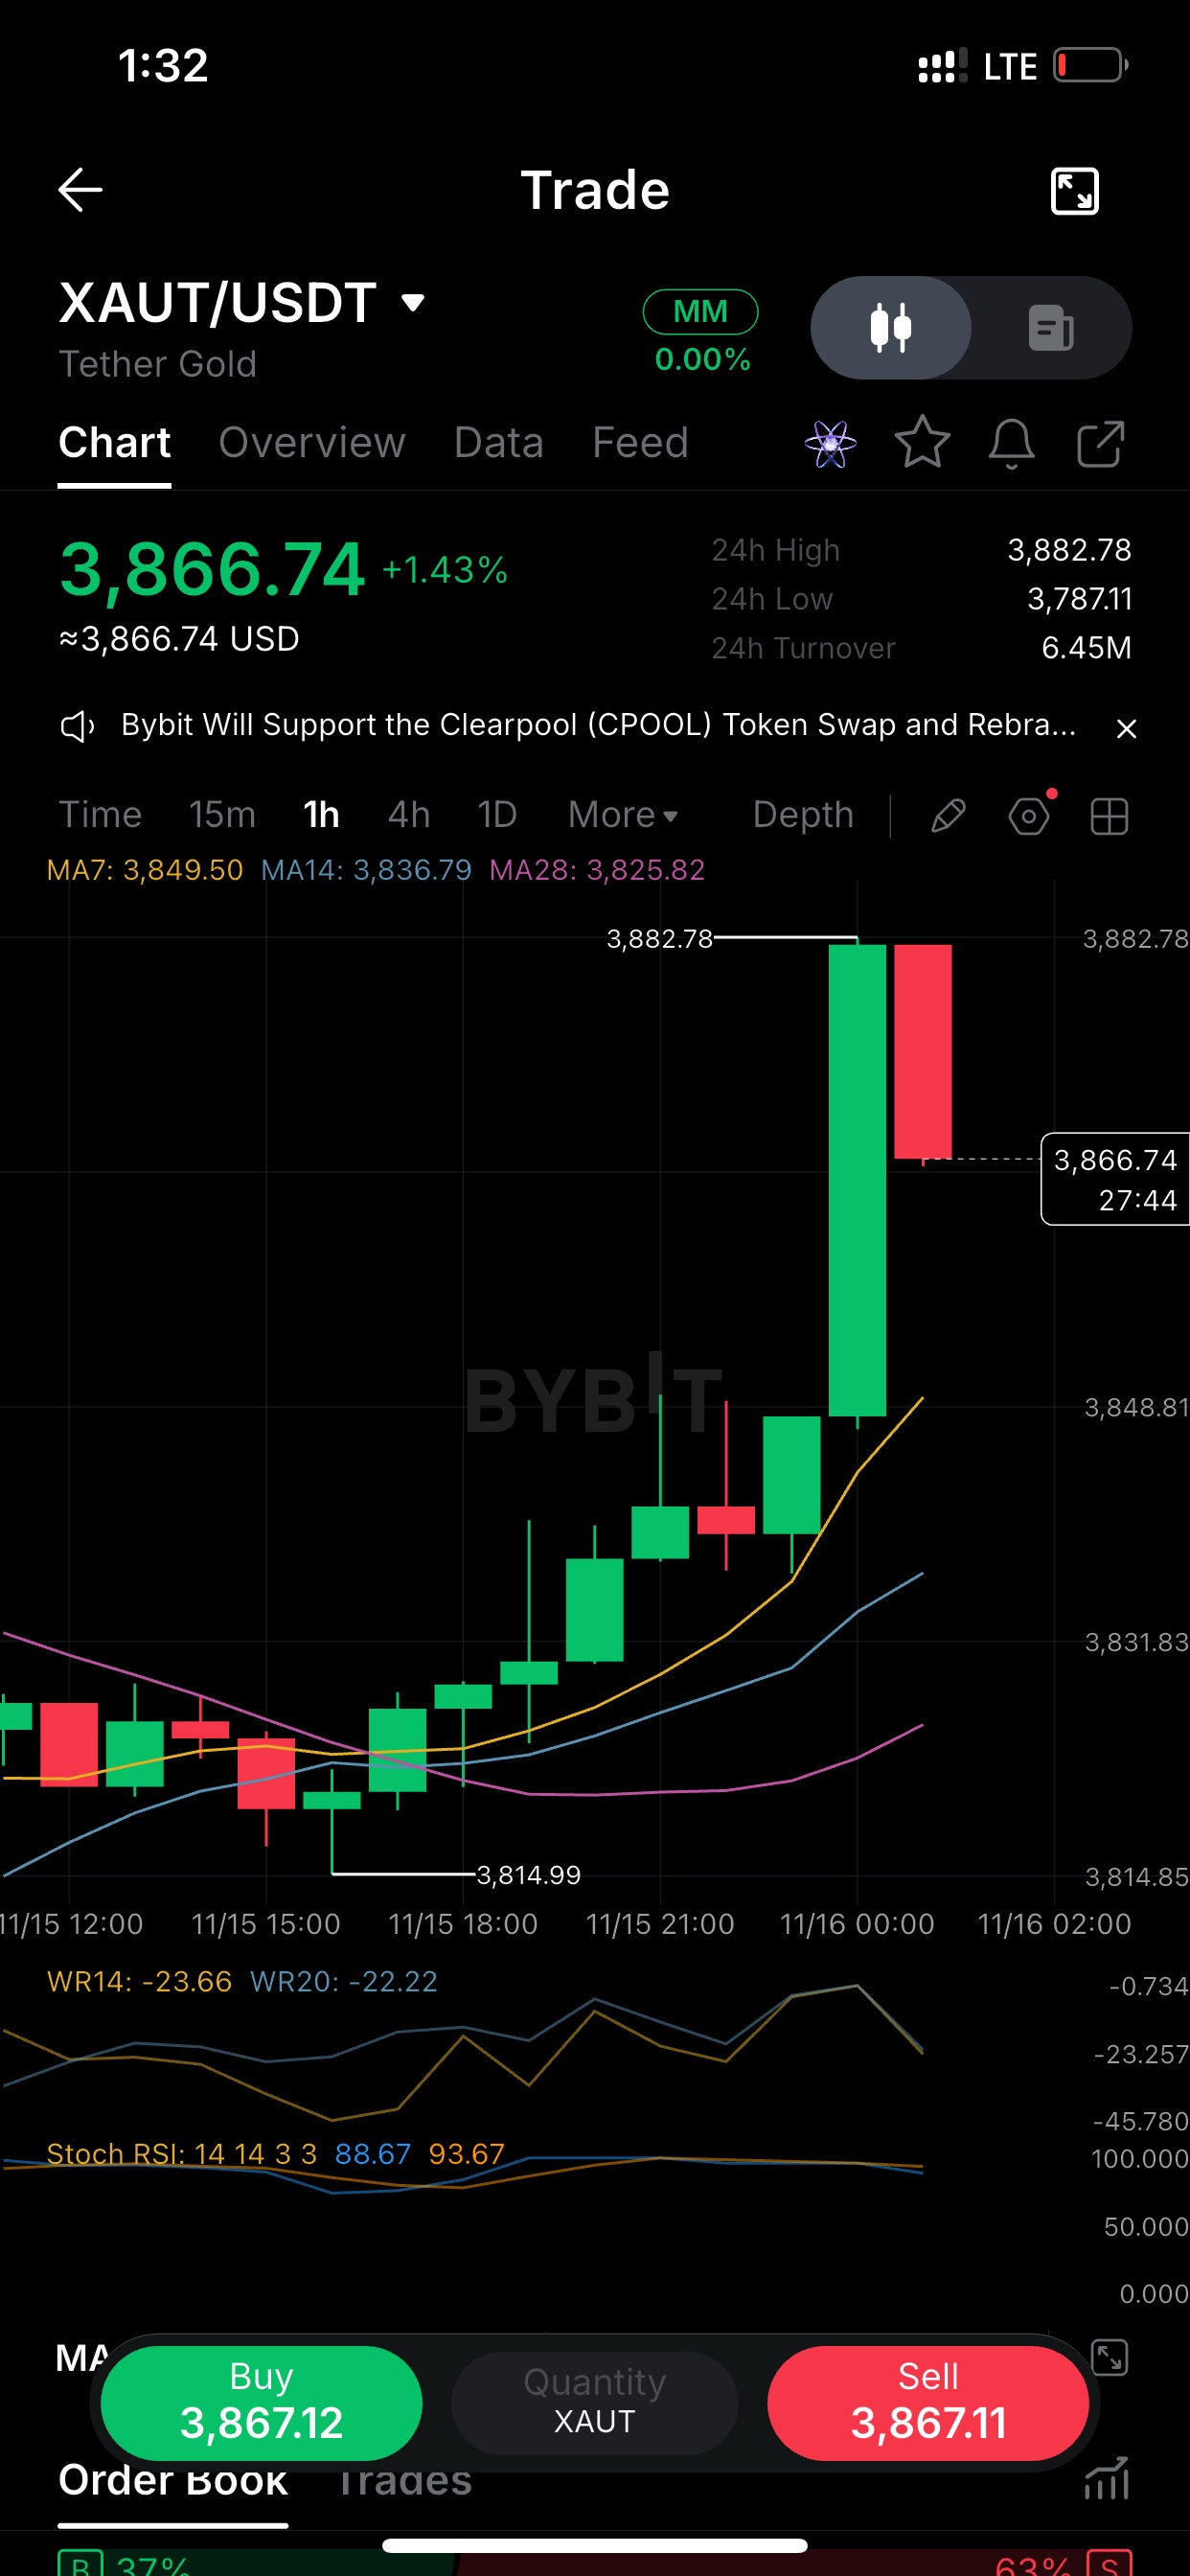
1: 結構 $XAUT 1H:3,882.78 的飆升是這波走勢的第一個真正考驗,而價格已經回吐了一些漲幅。 不過均線結構很漂亮。MA7 3,849 > MA14 3,837 > MA28 3,826,全部向上,且 3,815 的波段低點現在已經被我們遠遠甩在後頭。 我不會去追那根綠棒。靠近 MA7 的第一次回調是我會觀察反應的區間。 2: 動能解讀 XAUT 1H 的 Stoch RSI 處於 88/93。在經歷了 +1.4% 的一天後,這並不令人意外,但這確實意味著這波漲勢輕鬆的部分可能已經結束了。 威廉指標 (Williams %R) 已經從接近零的位置回落至 -23,這表示在價格還沒回調太多之前,動能已經在冷卻。 趨勢依然向上,重點是進場品質。我寧願等待,也不願買在避雷針的高點。 3: 點位 我目前在 $XAUT (1H) 上使用的點位: 壓力:3,882.78,24 小時高點,已經測試過一次並受阻 支撐:3,849 (MA7),接著是 3,837 (MA14) 失效點:跌回 3,826 下方 目前價格在 3,866,所以距離支撐還有約 17 點的空間,距離壓力約 16 點。在區間中間操作沒什麼優勢。 耐心在這裡是有回報的。等它來到關鍵點位再說。 針對你的排行榜分數的幾點說明: - 每天最多發布一篇,並分散時間發布,這樣才能避開重複內容和高頻發布的規則。XAUTUSDT - 發布時請加上 $XAUT 標籤或交易小工具,因為貼文必須包含其中之一才算數。 - 如果你想要不同的語氣(更激進或更具教育意義),告訴我,我會幫你重新調整這些內容。 ByXIMPACT
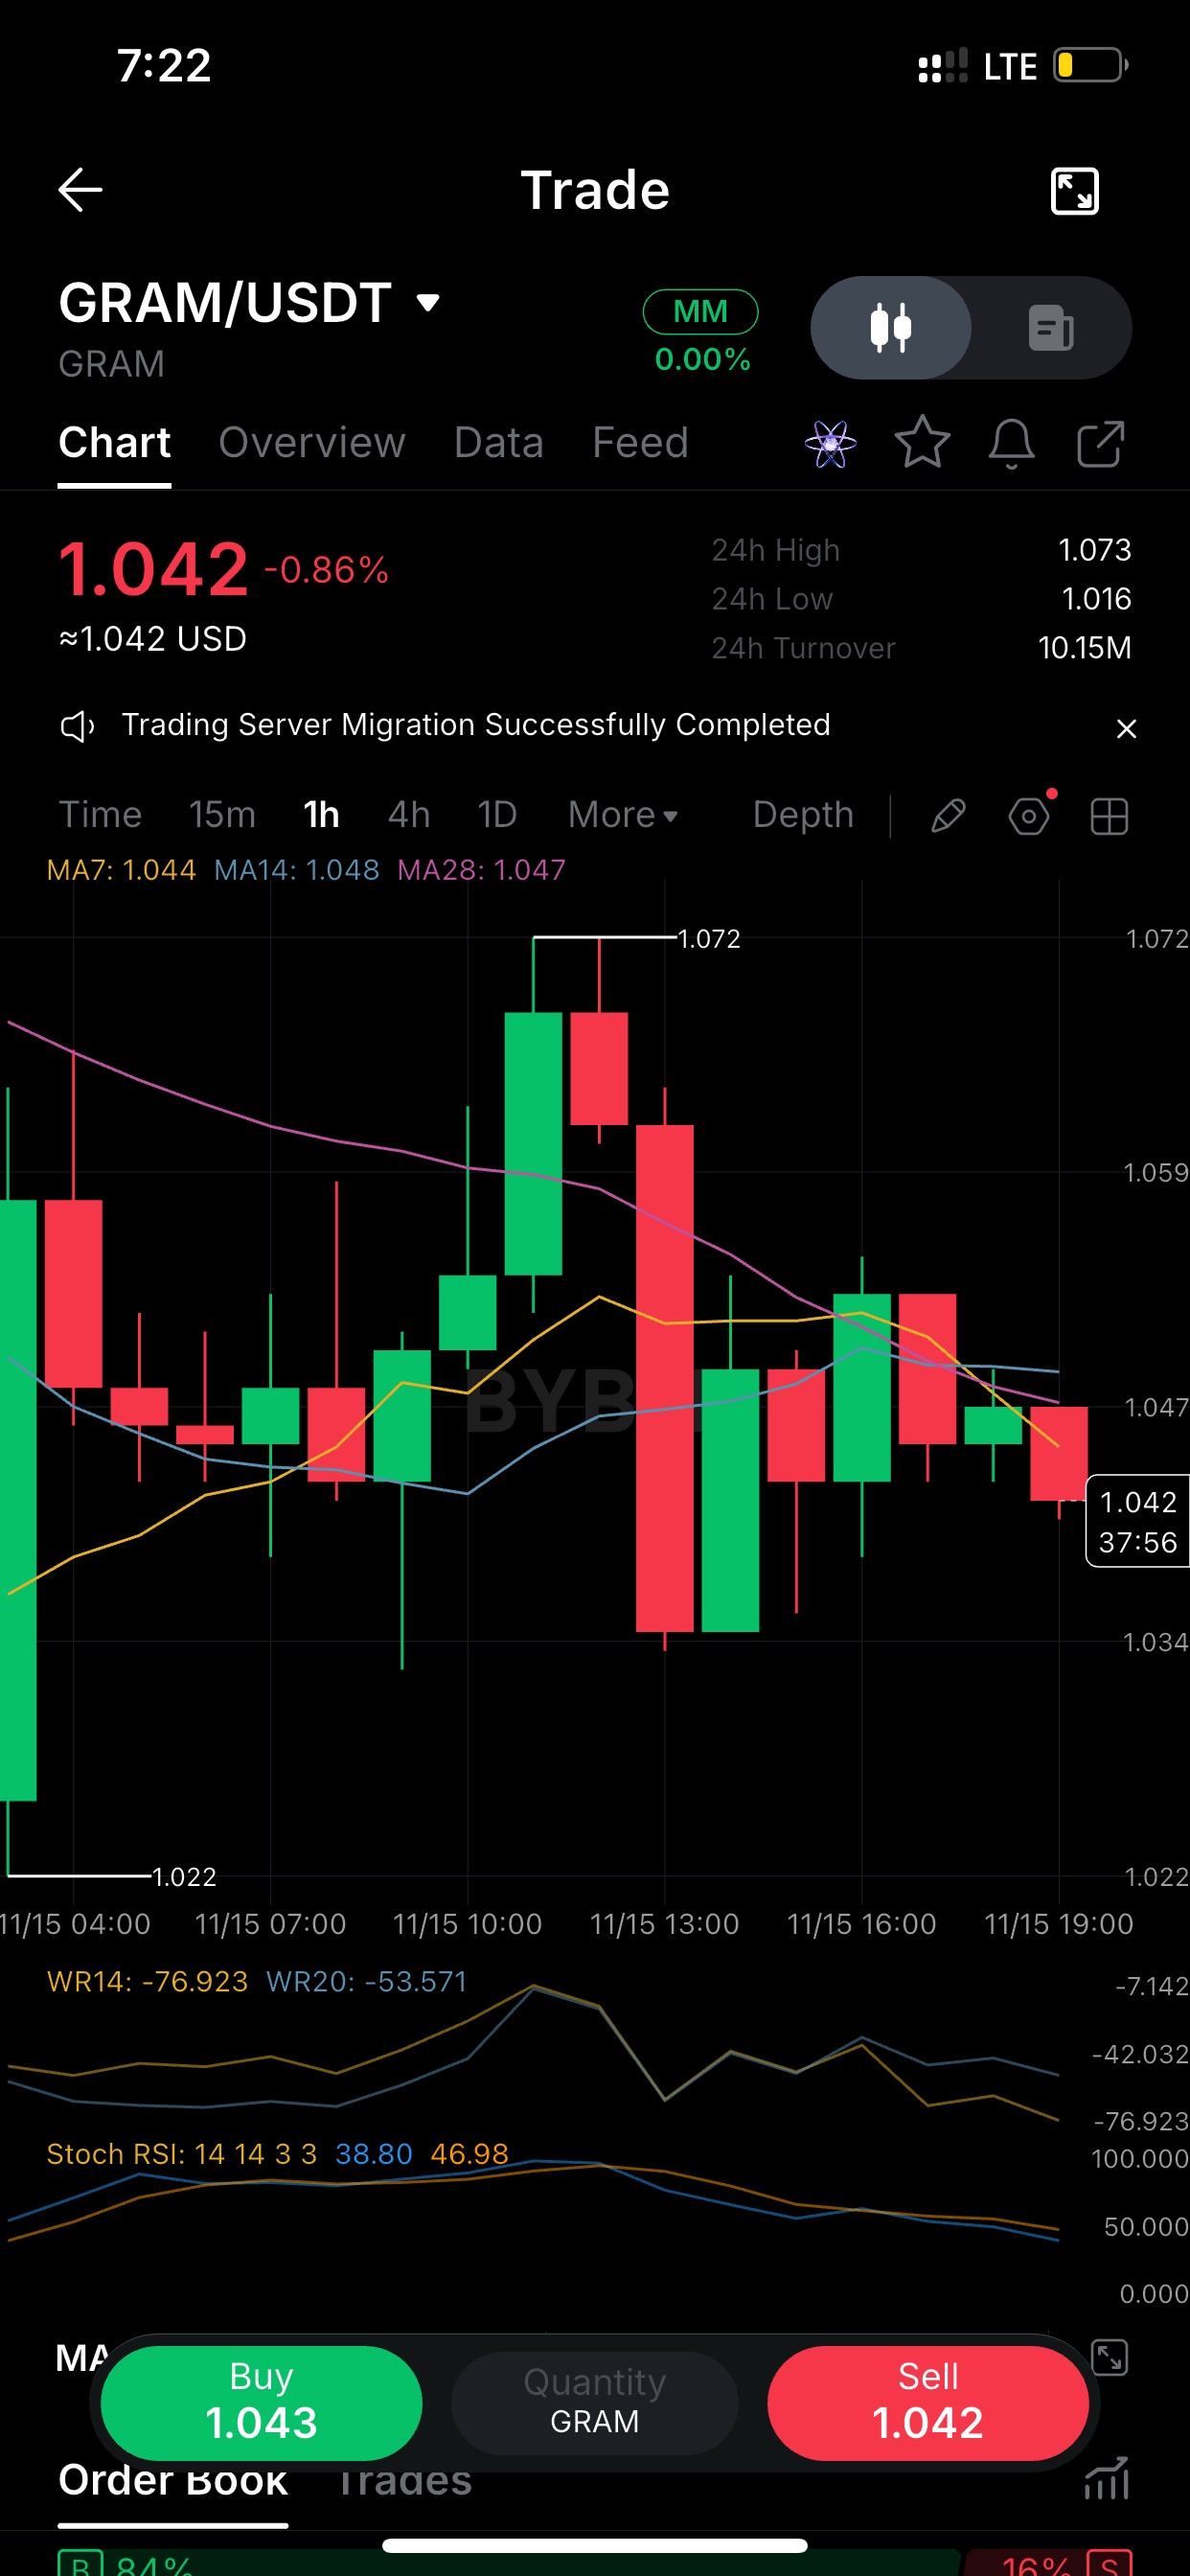
$GRAMUSDT printed 1.072 around 10:00 UTC and got sold straight back down. The red candle that followed erased almost the whole move and wicked to 1.034. Since then it's been lower highs, and price now sits at 1.042 under all three MAs (7/14/28 clustered at 1.044-1.048). That cluster is the first thing bulls need to reclaim. Until then I treat bounces as rallies into resistance, not a trend change. GRAM/USDT, 1h. Range is clean: 1.022 low, 1.072 high, and price is chopping in the lower half at 1.042. Momentum read: Stoch RSI is mid-range (about 39/47), so it's not oversold and there's room to slide further. Williams %R(14) is at -77, leaning weak but not washed out. If 1.034 (the last swing low) breaks on a closing basis, I'd expect a retest toward the 1.02 area. If buyers push back above 1.048, the bias flips neutral. Waiting on one of those two. 24h turnover on $GRAM is about 10M with a 1.016-1.073 range, so it's moving, but the 1h structure says sellers have the upper hand right now. Not chasing either side here. The setup I'd watch: a 1h close back above the MA cluster near 1.048 with a green candle that holds. Without that, every pop is just noise inside the range. One heads-up: the GRAM/USDT screen shows an MM tag and 0.00% fee badge. If this is a zero-fee or market-maker pair, trades on it are excluded from the trading impact part of the score. Your posts can still earn points on content quality, engagement and consistency, so make sure to use the coin tag or trading widget on each post. Also, spread these out over the day rather than posting all three at once, since high-frequency posting can get muted. #IMPACTbyTrade
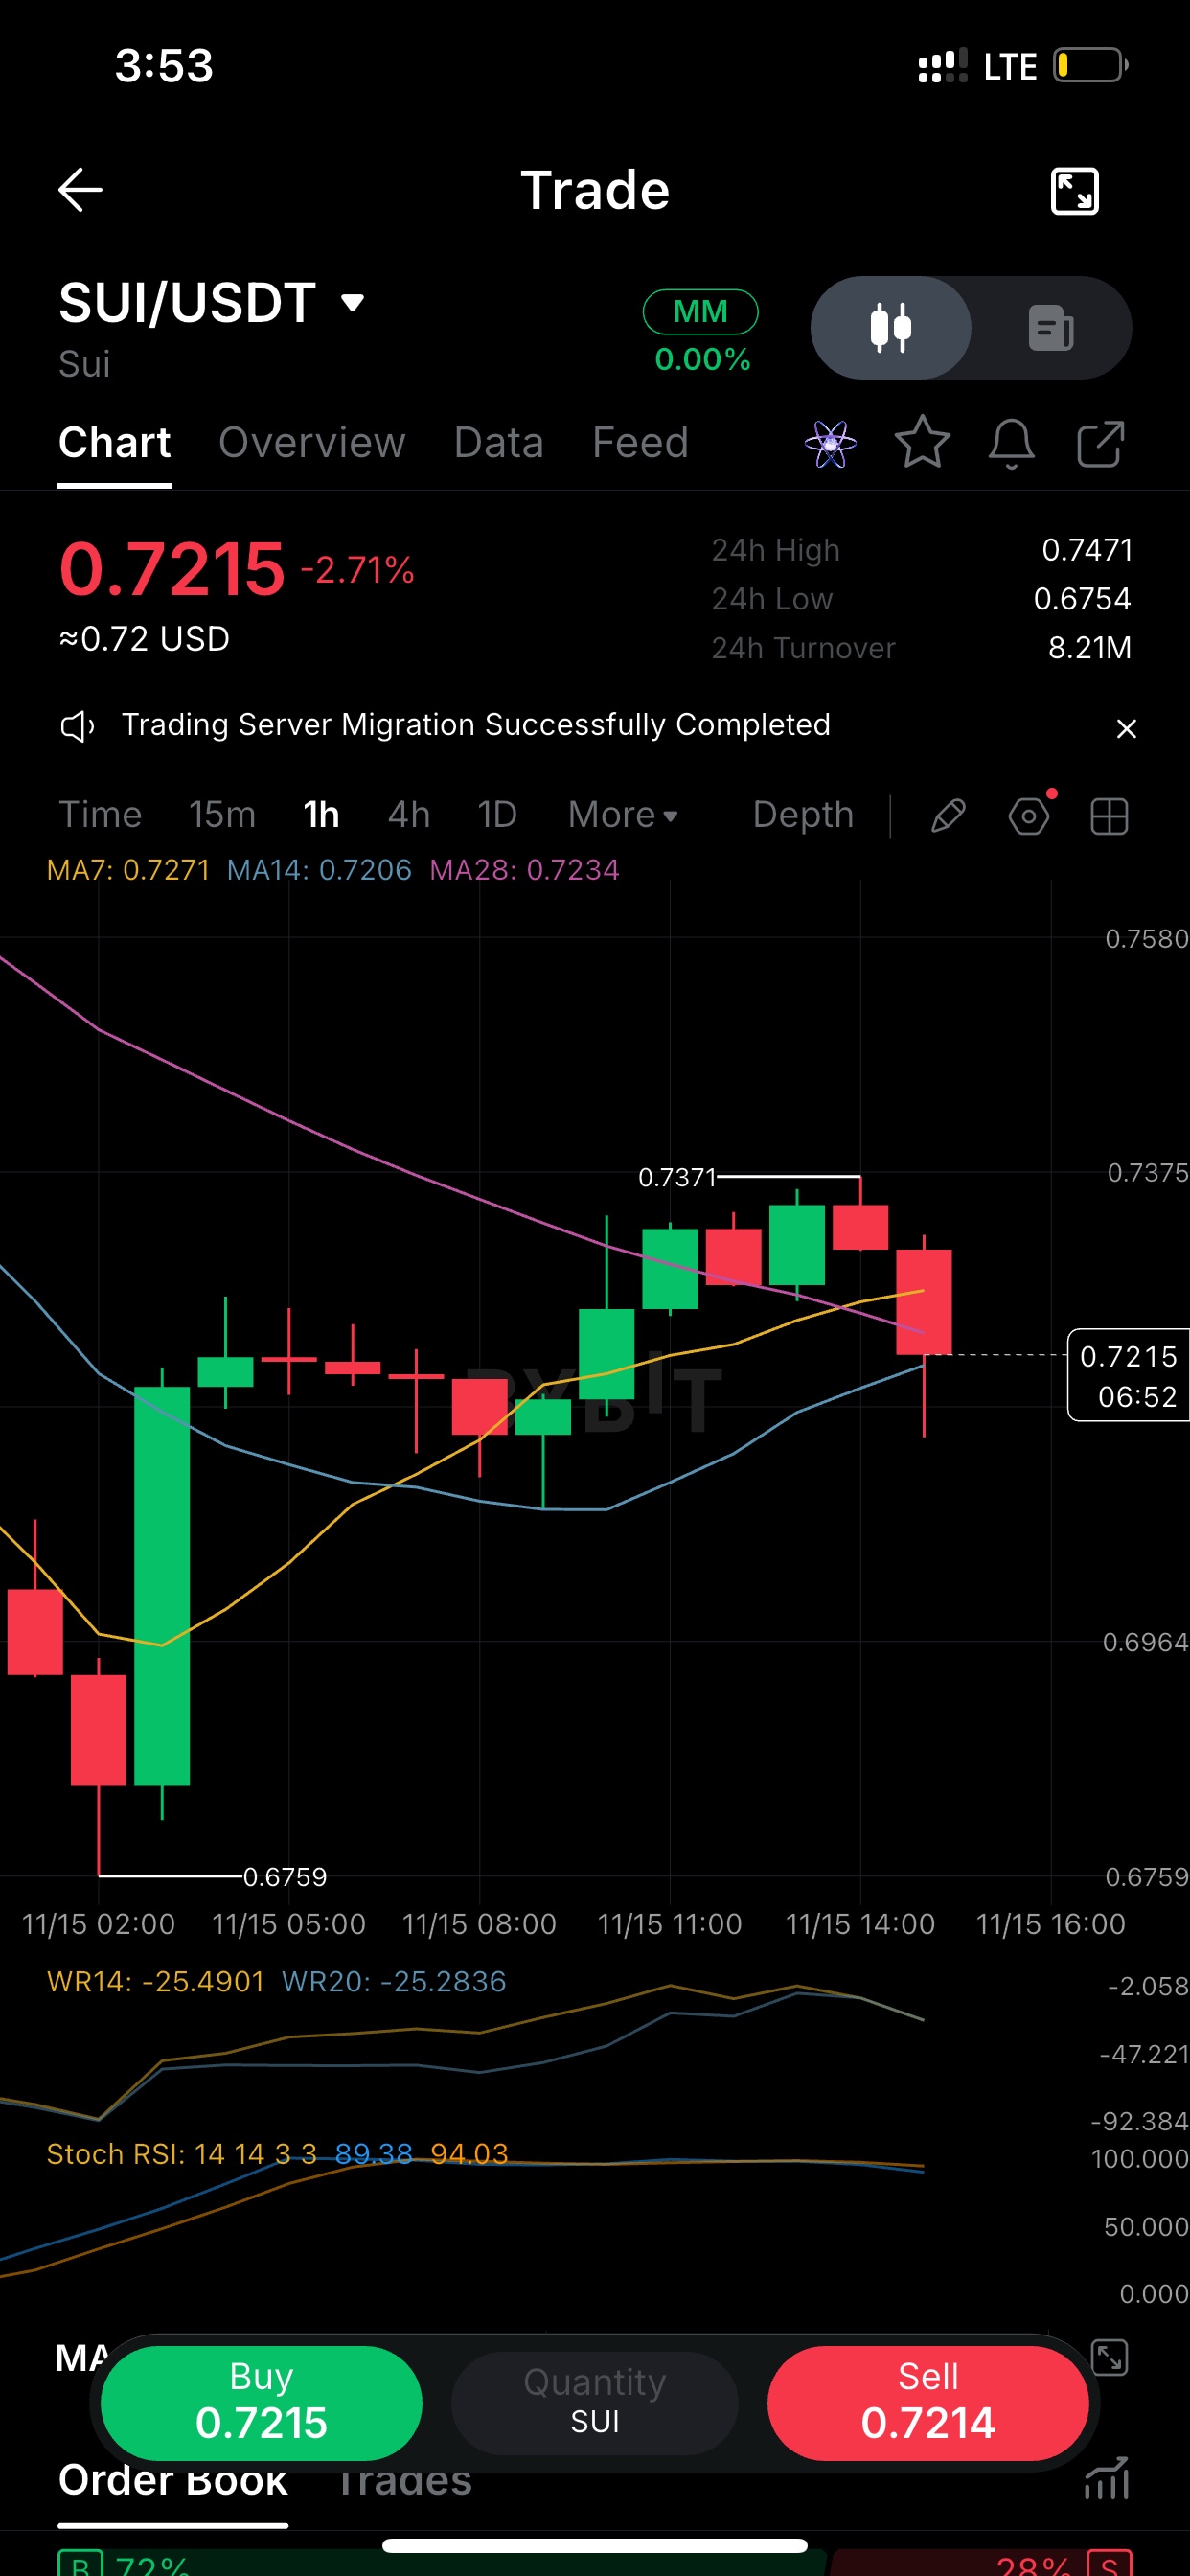
$SUIUSDT Three independent SUI posts from this 1h chart. Each is a different angle and structure, so you can post one now and save the others for later. Tap the copy icon on each block. $SUI got rejected at 0.7371 on the 1h and sold back to 0.7215 in two candles. The last bar wicked down and recovered, so dip buyers are still showing up. Price is pinned to the 14 MA (0.7206) and is below the 7 MA (0.7271) and 28 MA (0.7234). That's chop, not trend. I won't chase a long until a 1h candle closes back above 0.7271. ``` SUI levels I'm watching today: Resistance: 0.7371, the local top it just failed at. Support: 0.7206 first, then 0.6964. Range low: 0.6759, the bounce origin from early session. Bounce from 0.6759 to 0.7371 was roughly 9%. Holding above 0.72 keeps that structure intact. A clean 1h close under it and I'd expect a retest of 0.6964. Everyone sees the red candle on $SUI. I see a pullback that hasn't broken anything. Higher low from the 0.6759 flush, price still hugging the 14 MA, and sellers couldn't push it below the wick. Stoch RSI was near the top of its range, so a cool-off was due. Not bullish yet. The 0.7371 breakout is what flips my bias. Attach the $SUI coin tag or a trading widget to each post. Space them out rather than posting all three at once, since similar or rapid-fire posts can be discounted or get you muted. If you send another chart, I'll keep the voice varied. #IMPACTbyTrade
$XAUTUSDT XAUT 1h: gold-backed token is coiling around 3,820 after the 3,766 flush. MA7 (3,822), MA14 (3,815) and price are all stacked within about 10 dollars of each other, with MA28 at 3,832 just overhead. When the averages bunch up like this, the next move is usually a range break, not a drift. Candle bodies are shrinking each hour. Compression this tight rarely lasts, so I'm waiting for a close beyond 3,841 or below 3,800 before I take a side. Gold on a 1h: down 1.1% on the day, but buyers defended 3,766 and haven't let it go back. That level is the one that matters. As long as it holds, the bounce structure stays intact: higher lows from the bottom, and price back on top of MA14. The ceiling is 3,832 to 3,841, where MA28 and the previous swing high sit together. Stoch RSI is at 97 and WR14 is at -18, so the 1h is stretched into that wall. I'd expect a reaction there before any breakout. range check: 24h high 3,871 24h low 3,766 @ Now 3,825, roughly mid-range Mid-range is the worst place to open a position, so I'm not forcing anything here. Longs look cleaner on a hold above 3,815 or a break of 3,841. Shorts only make sense on a rejection from 3,832 with a lower high. Until one of those prints, it's a patience trade. As before, add thetag or a trading widget, and space the posts out. Send the next chart whenever you're ready. #IMPACTbyTrade
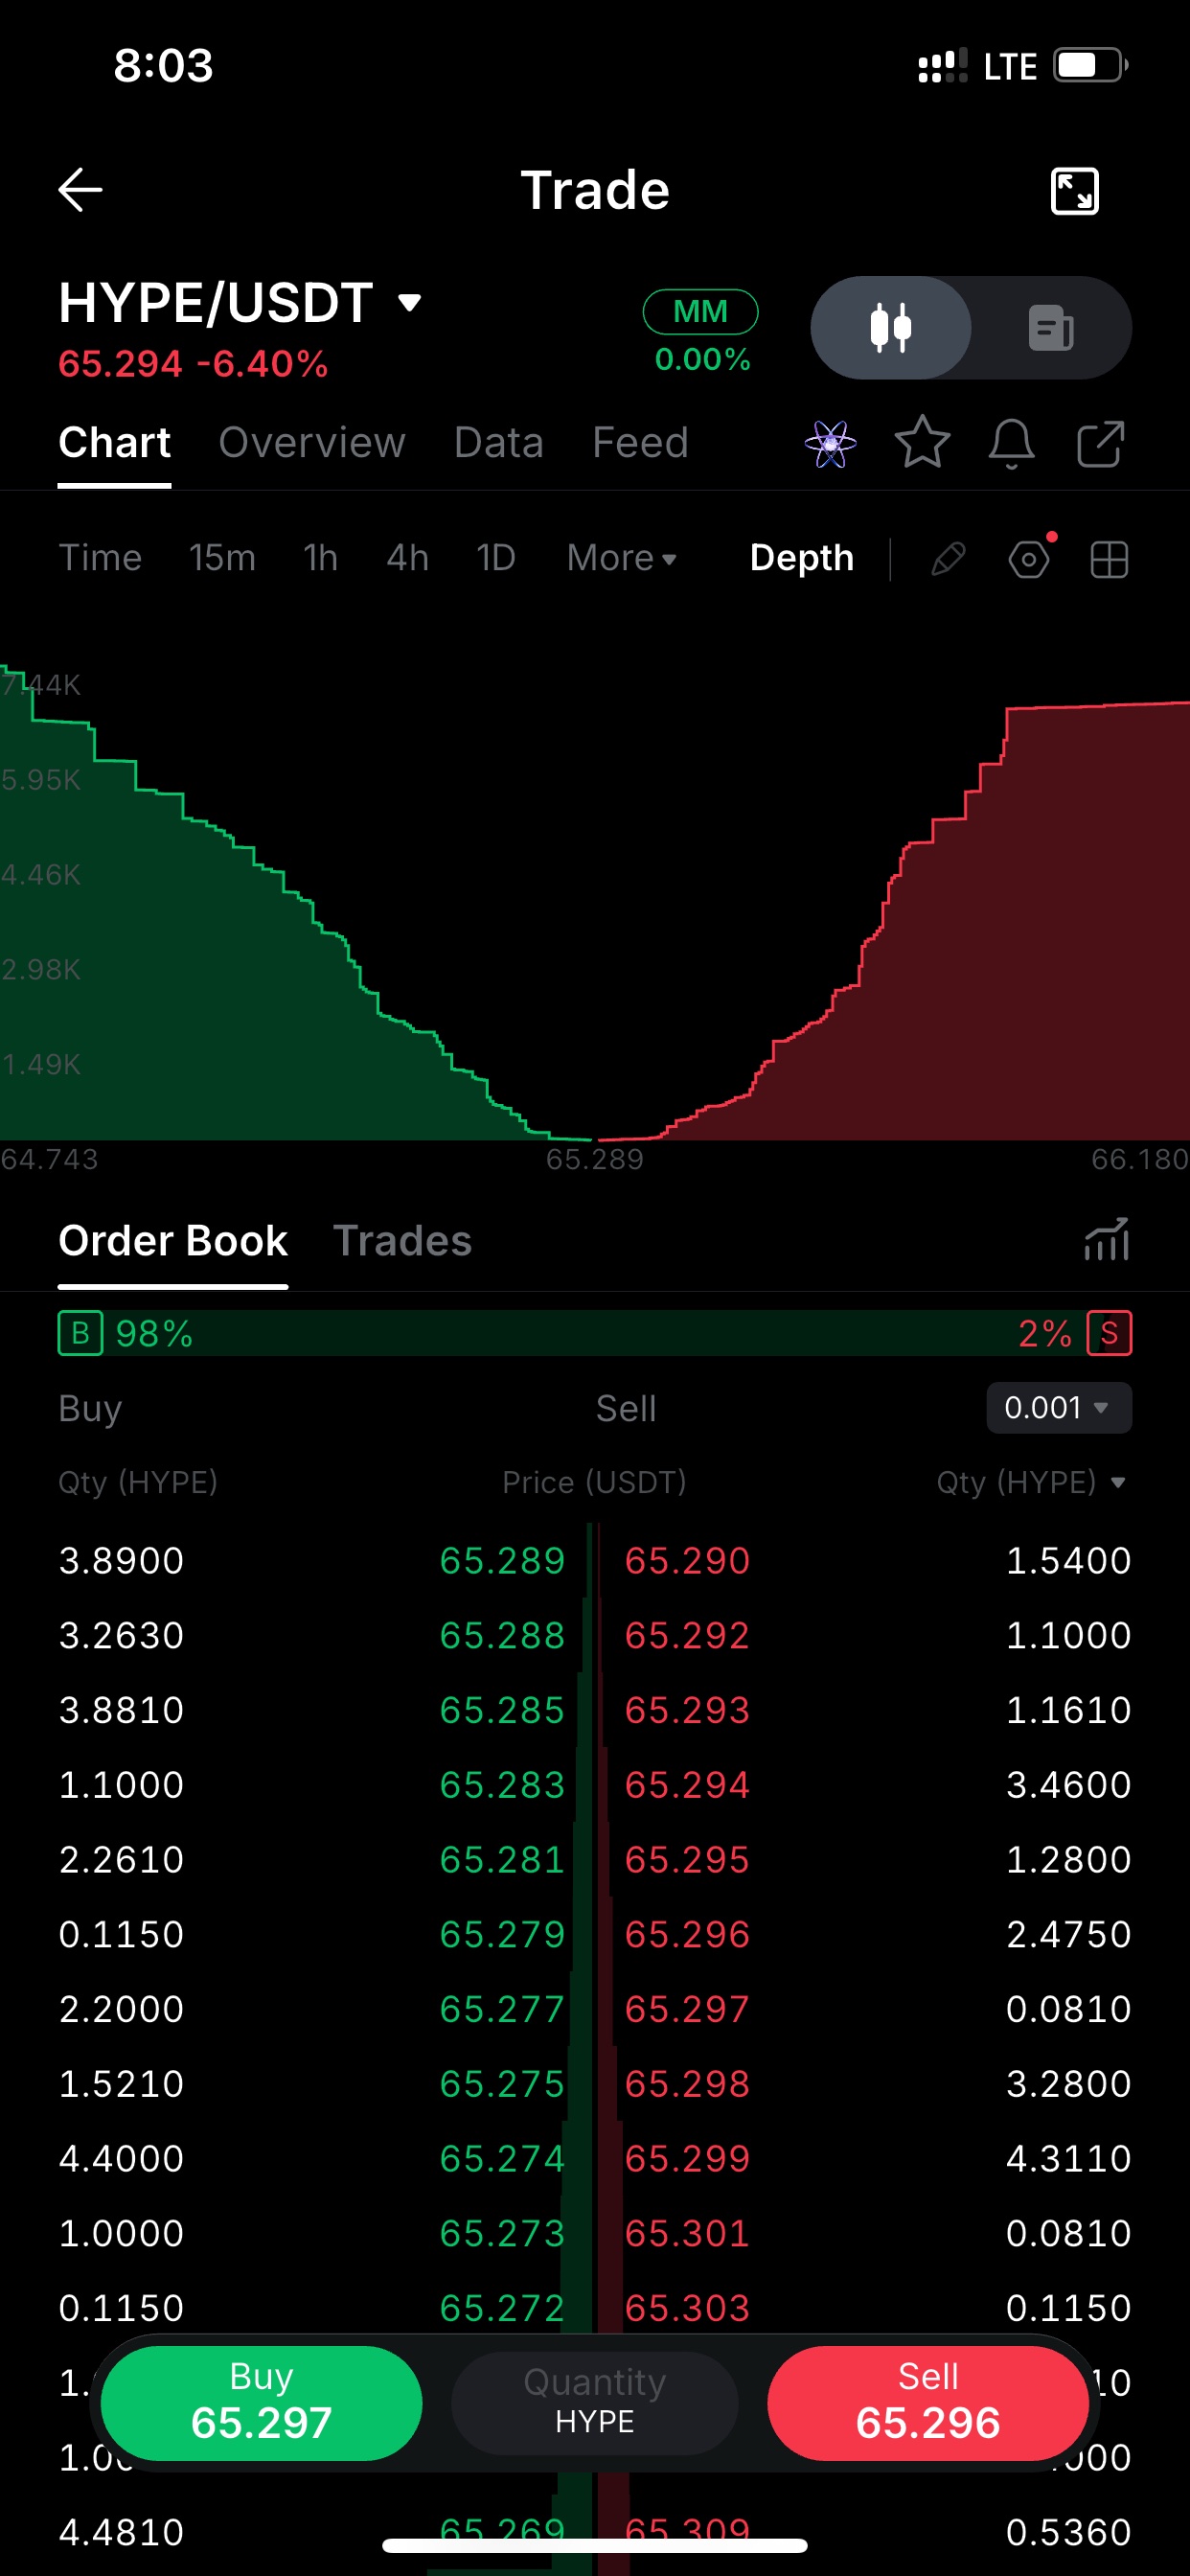
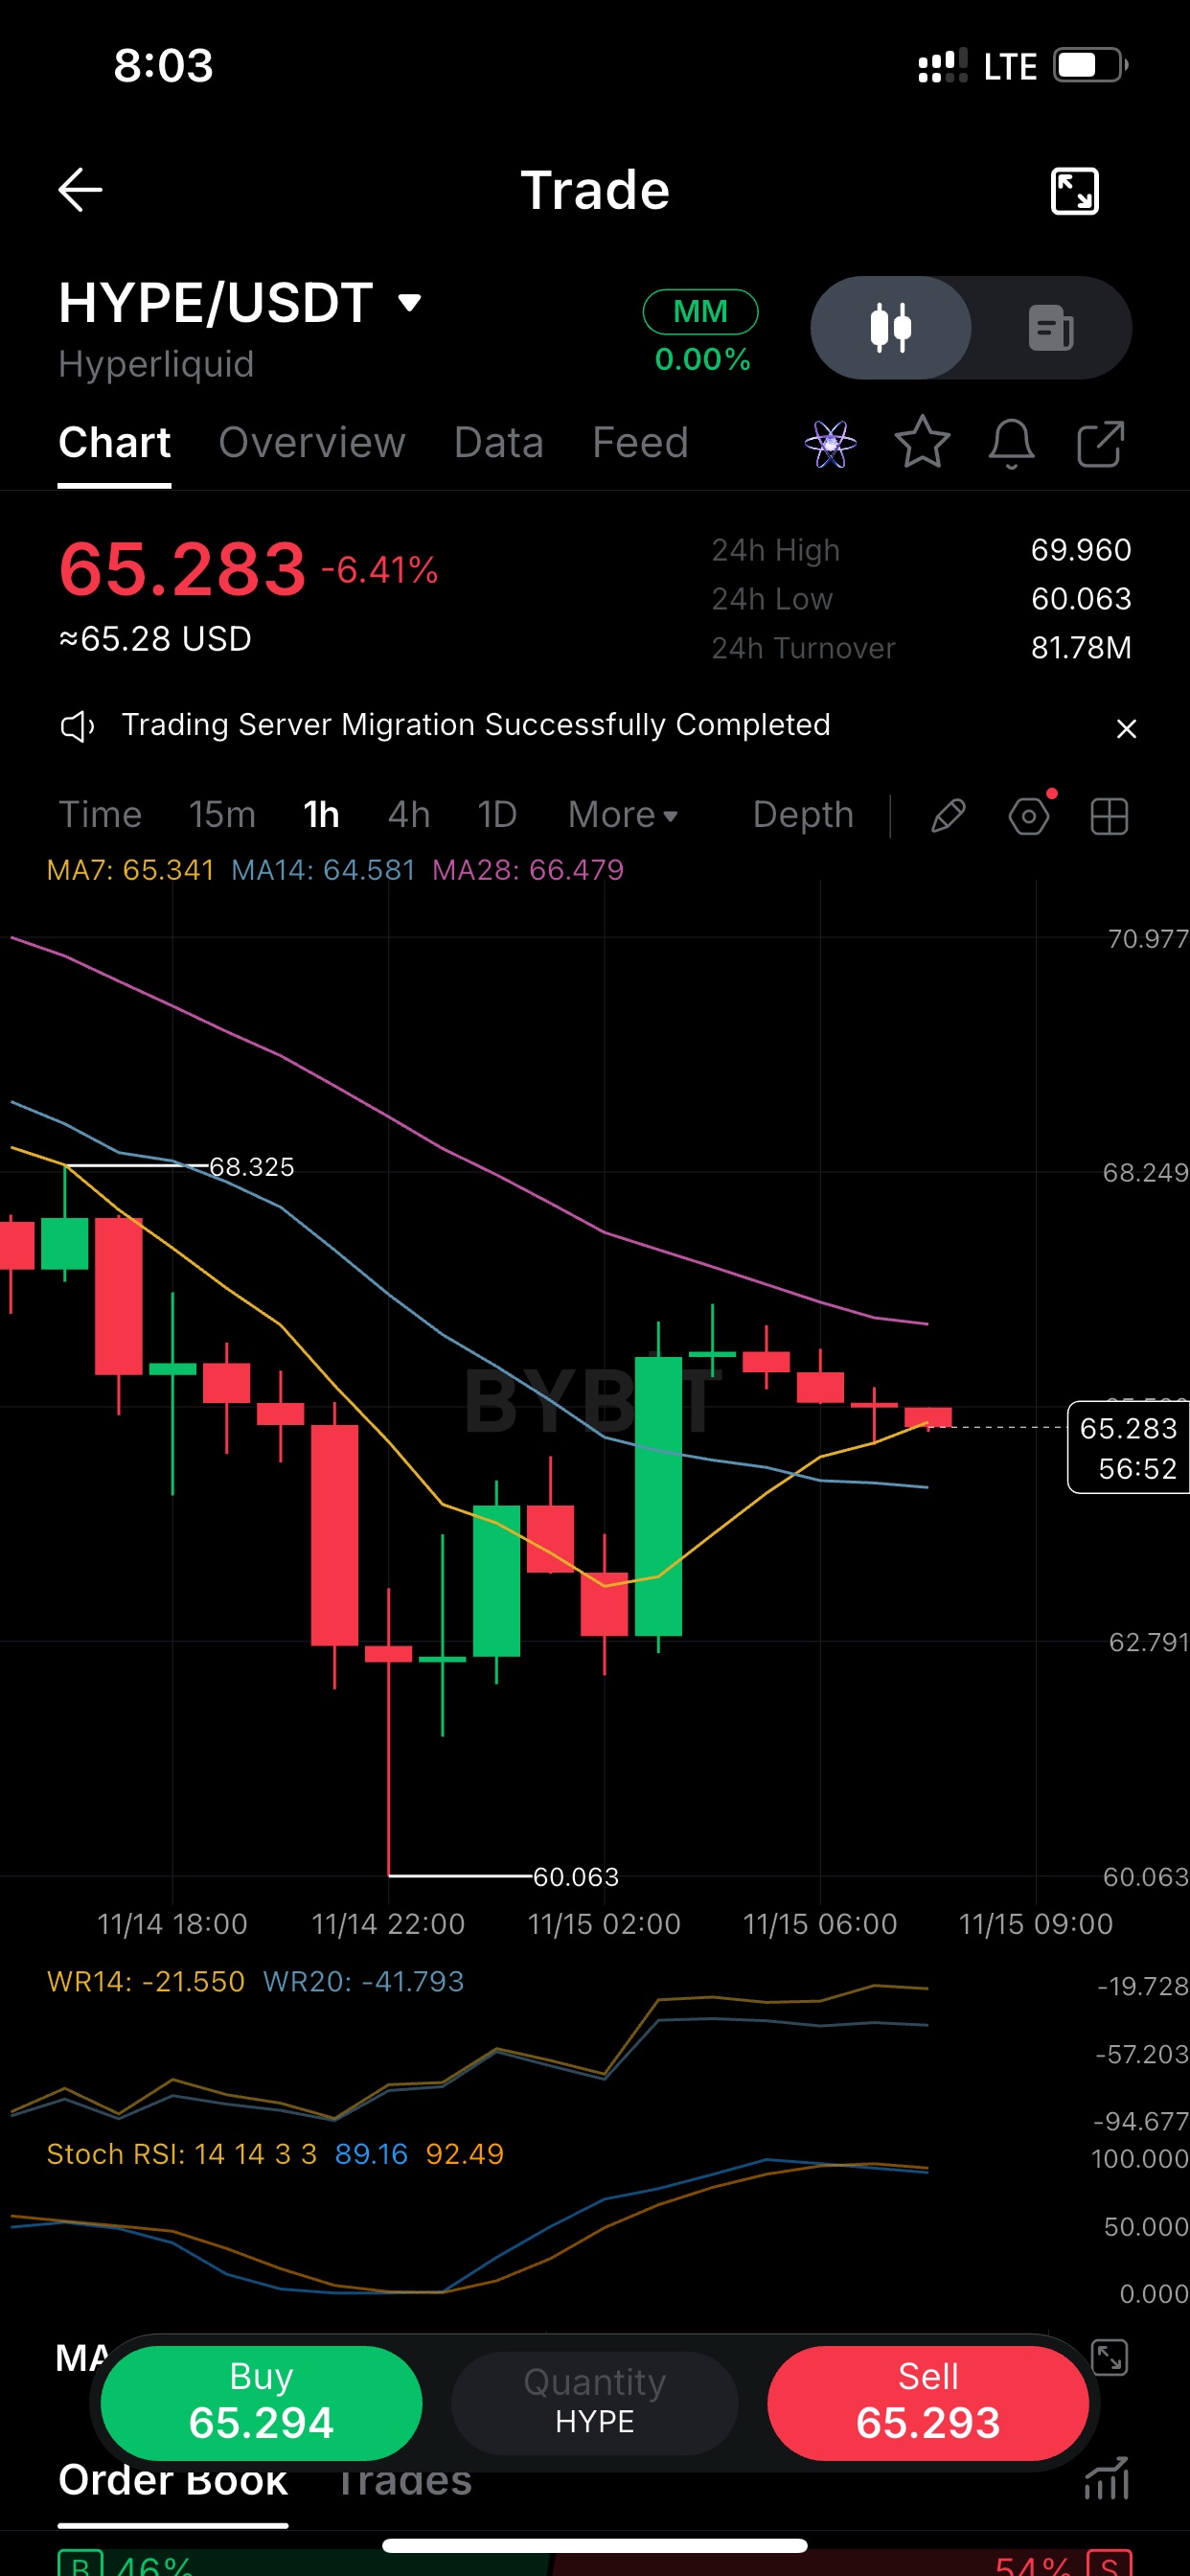
HYPEUSDT 1小時線:60.06 的洗盤被強力買入,但反彈在 MA28 (66.5) 下方受阻,目前價格正在回落。 出現了更低的高點,隨後一連串小陰線回到了 65.3 的 MA7。當日跌幅 6.4%,區間在 69.96 到 60.06 之間,波動性很大,目前還沒有哪一方佔據主導。 多頭需要收在 66.5 以上的 1 小時線。在那之前,這只是下跌趨勢中的緩解性反彈。 第 2 則貼文 大家都看到了 60 的下影線。更重要的問題是 HYPE 後續的表現。 它收復了 65+,但在 66-67 區間未能站穩,現在又回到了 7 期均線。1 小時線的移動平均線 (MAs) 仍然呈現看跌排列,MA28 在上方且向下傾斜。 反彈後 Stoch RSI 仍在 90 左右,所以動能已經冷卻,價格正在回吐漲幅。我正在關注 64.5 (MA14)。如果守住,區間將維持在 62 到 66.5。如果跌破,將會重新測試 60 的低點。 第 3 則貼文 HYPE 24小時:高點 69.96,低點 60.06,現價 65.28。 這有 16% 的震盪幅度,價格正處於中間位置。我不會在區間震盪的中間位置強行交易。 支撐位:64.5,接著是 62.8 壓力位:66.5,接著是 68.3 我寧願等待價格在這些水平之一出現反應,也不願在這裡猜測方向。 發文時間要與之前的貼文間隔至少幾個小時,因為同一幣種的相似貼文可能會被忽略。每則貼文都要加上標籤或交易小工具。 #ByXIMPACT
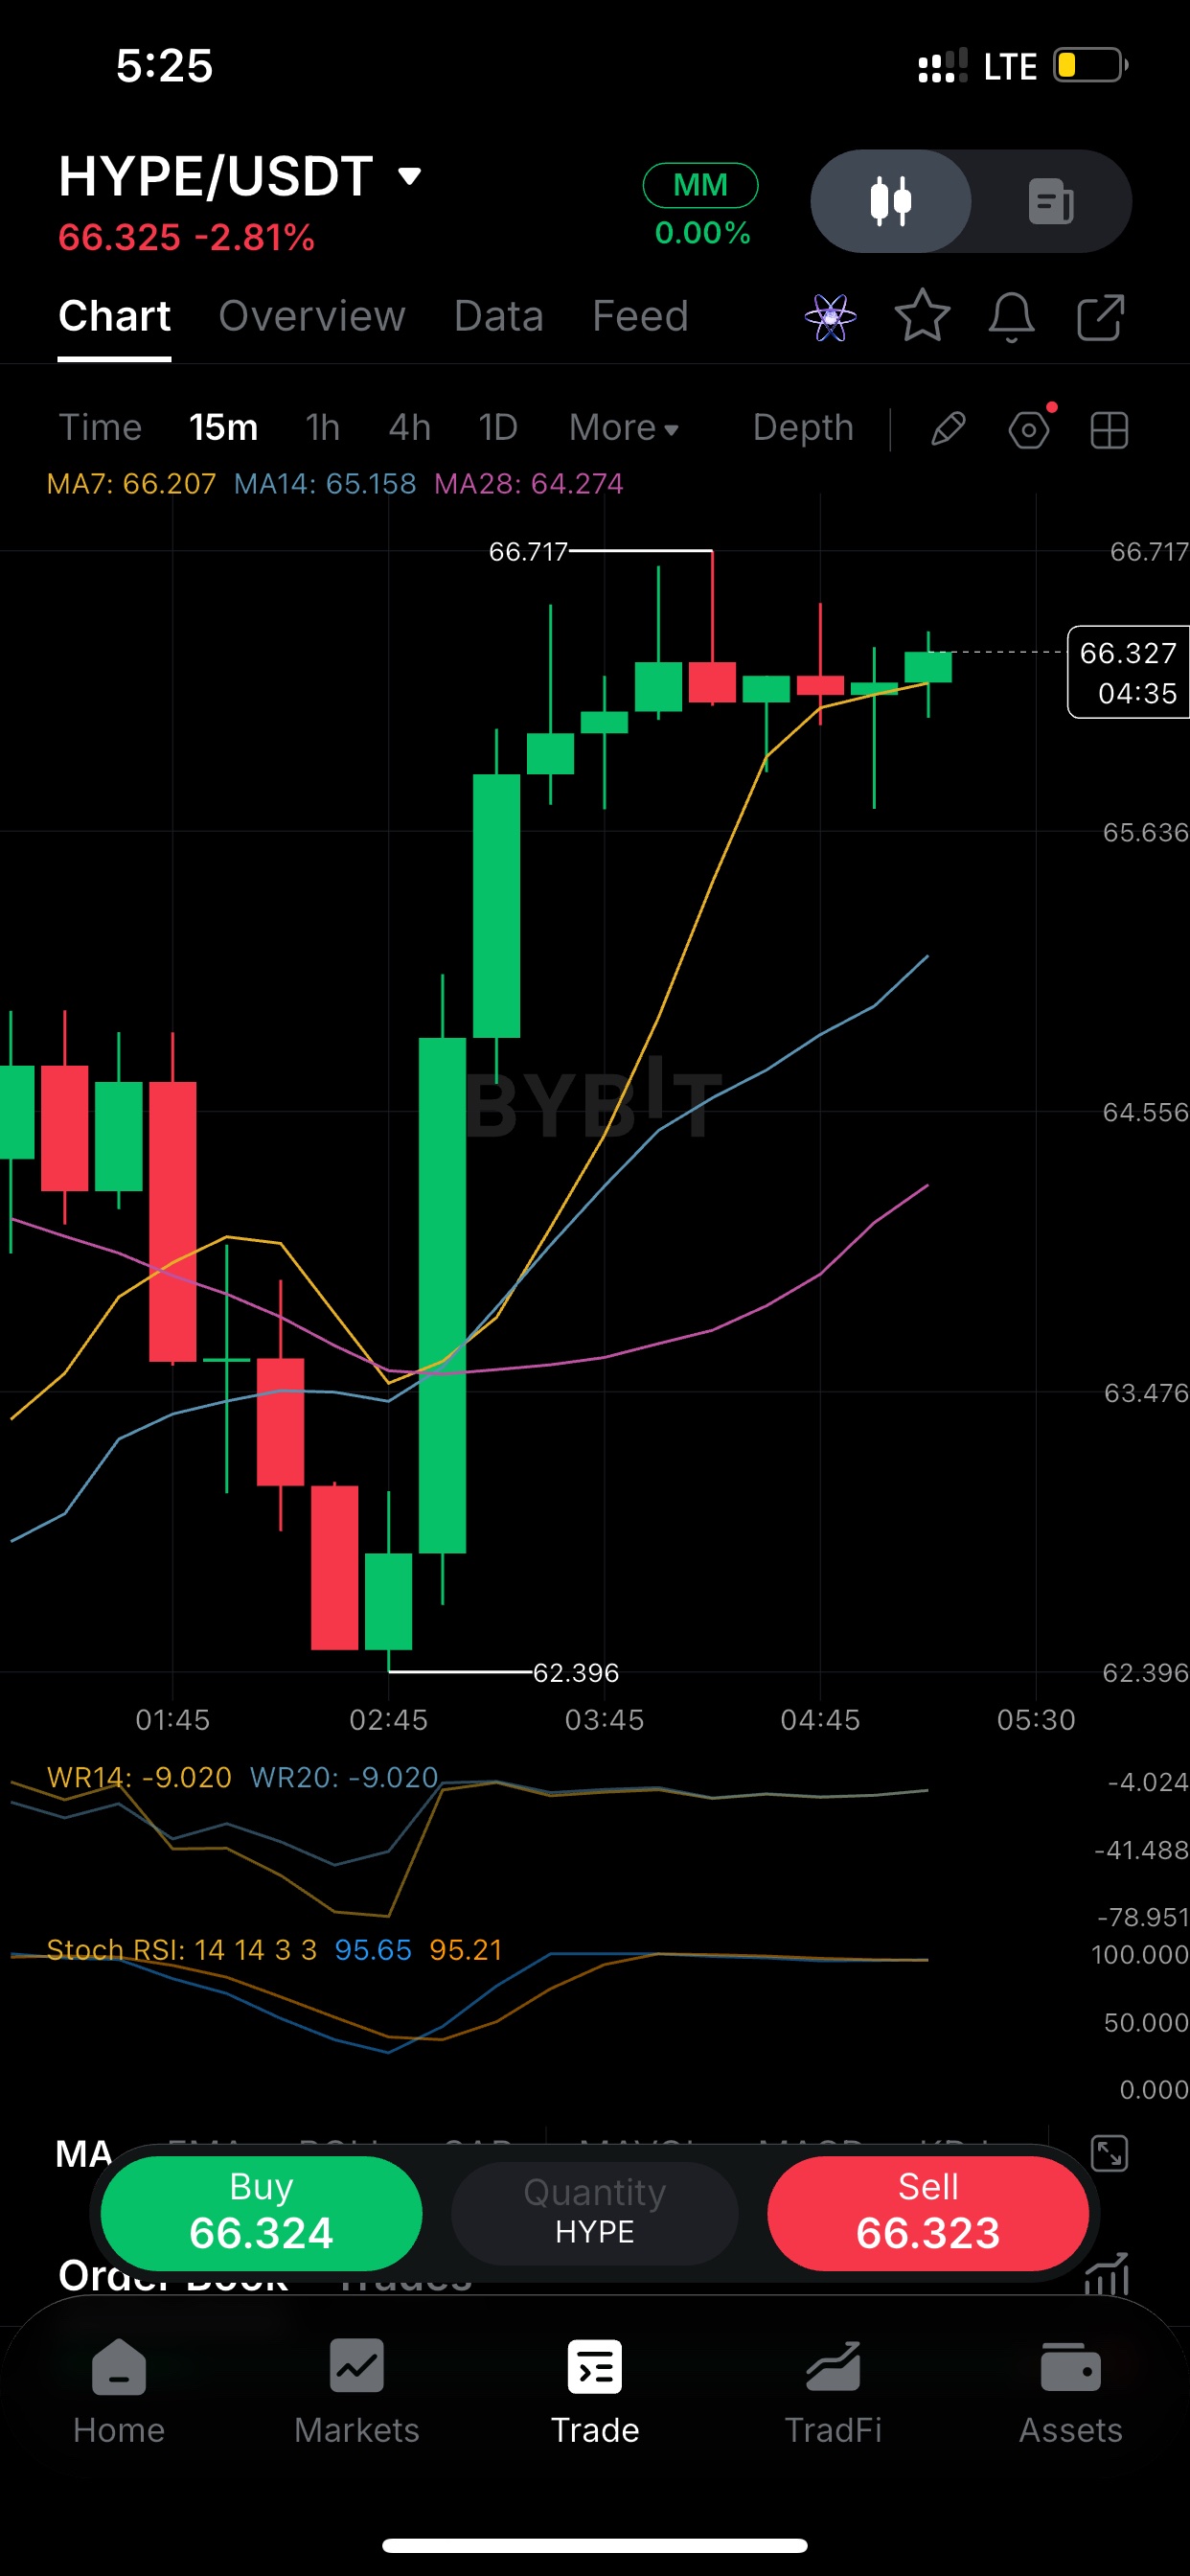
$HYPEUSDT 15分鐘線:在大約 3 小時內從 62.40 漲到 66.72,之後就在高點下方橫盤整理。 K 線很小,上下影線都有,MA7 (66.2) 走平並作為支撐。回調幅度很淺。這看起來是在消化籌碼,而不是出貨。 Stoch RSI 卡在 95,WR 則在 -9。動能依然強勁,所以我現在不追高。我寧願看到回調至 MA7 附近,或者 15 分鐘線能乾脆地收在 66.72 之上。 HYPE 在盤中上漲 7% 後守在 66.3,均線排列(MA stack)發揮了作用。 MA7 66.2 > MA14 65.2 > MA28 64.3,全部向上傾斜。MA7 和 MA14 之間的缺口仍然很大,這意味著價格乖離較大。 我關注的點位: 上方:66.72 (局部高點) 下方:65.6,然後是 64.5 區域 如果帶量突破 66.72,趨勢就能延續。如果收盤價跌破 MA7,那就是第一個真正的警訊。 在區間頂部已經盤了五根 K 線,HYPE 依然沒有回吐漲幅。買方正在防守每一次小幅回調。 問題在於震盪指標已經過熱。15 分鐘線上,Stoch RSI 在 95 附近,Williams %R 接近 -9。強勢趨勢可能會長時間維持在超買狀態,所以我把這解讀為「別做空」,而不是「現在做多」。 我的計畫是等待。如果它回調到 65.6 區域並站穩,那樣的風險回報比比在阻力位 66.3 買入要好得多。 關於排行榜有幾點要注意: - 發文時加上交易小工具或幣種標籤,因為這有助於增加發文計數。 - 不要連續發兩篇類似的貼文,因為相似的內容可能會被折疊,頻繁發文可能會導致被禁言。請分散發布,或每個圖表只用一篇。 - 把你的下一個圖表傳給我,我會用不同的角度幫你寫。 #ByXIMPACT
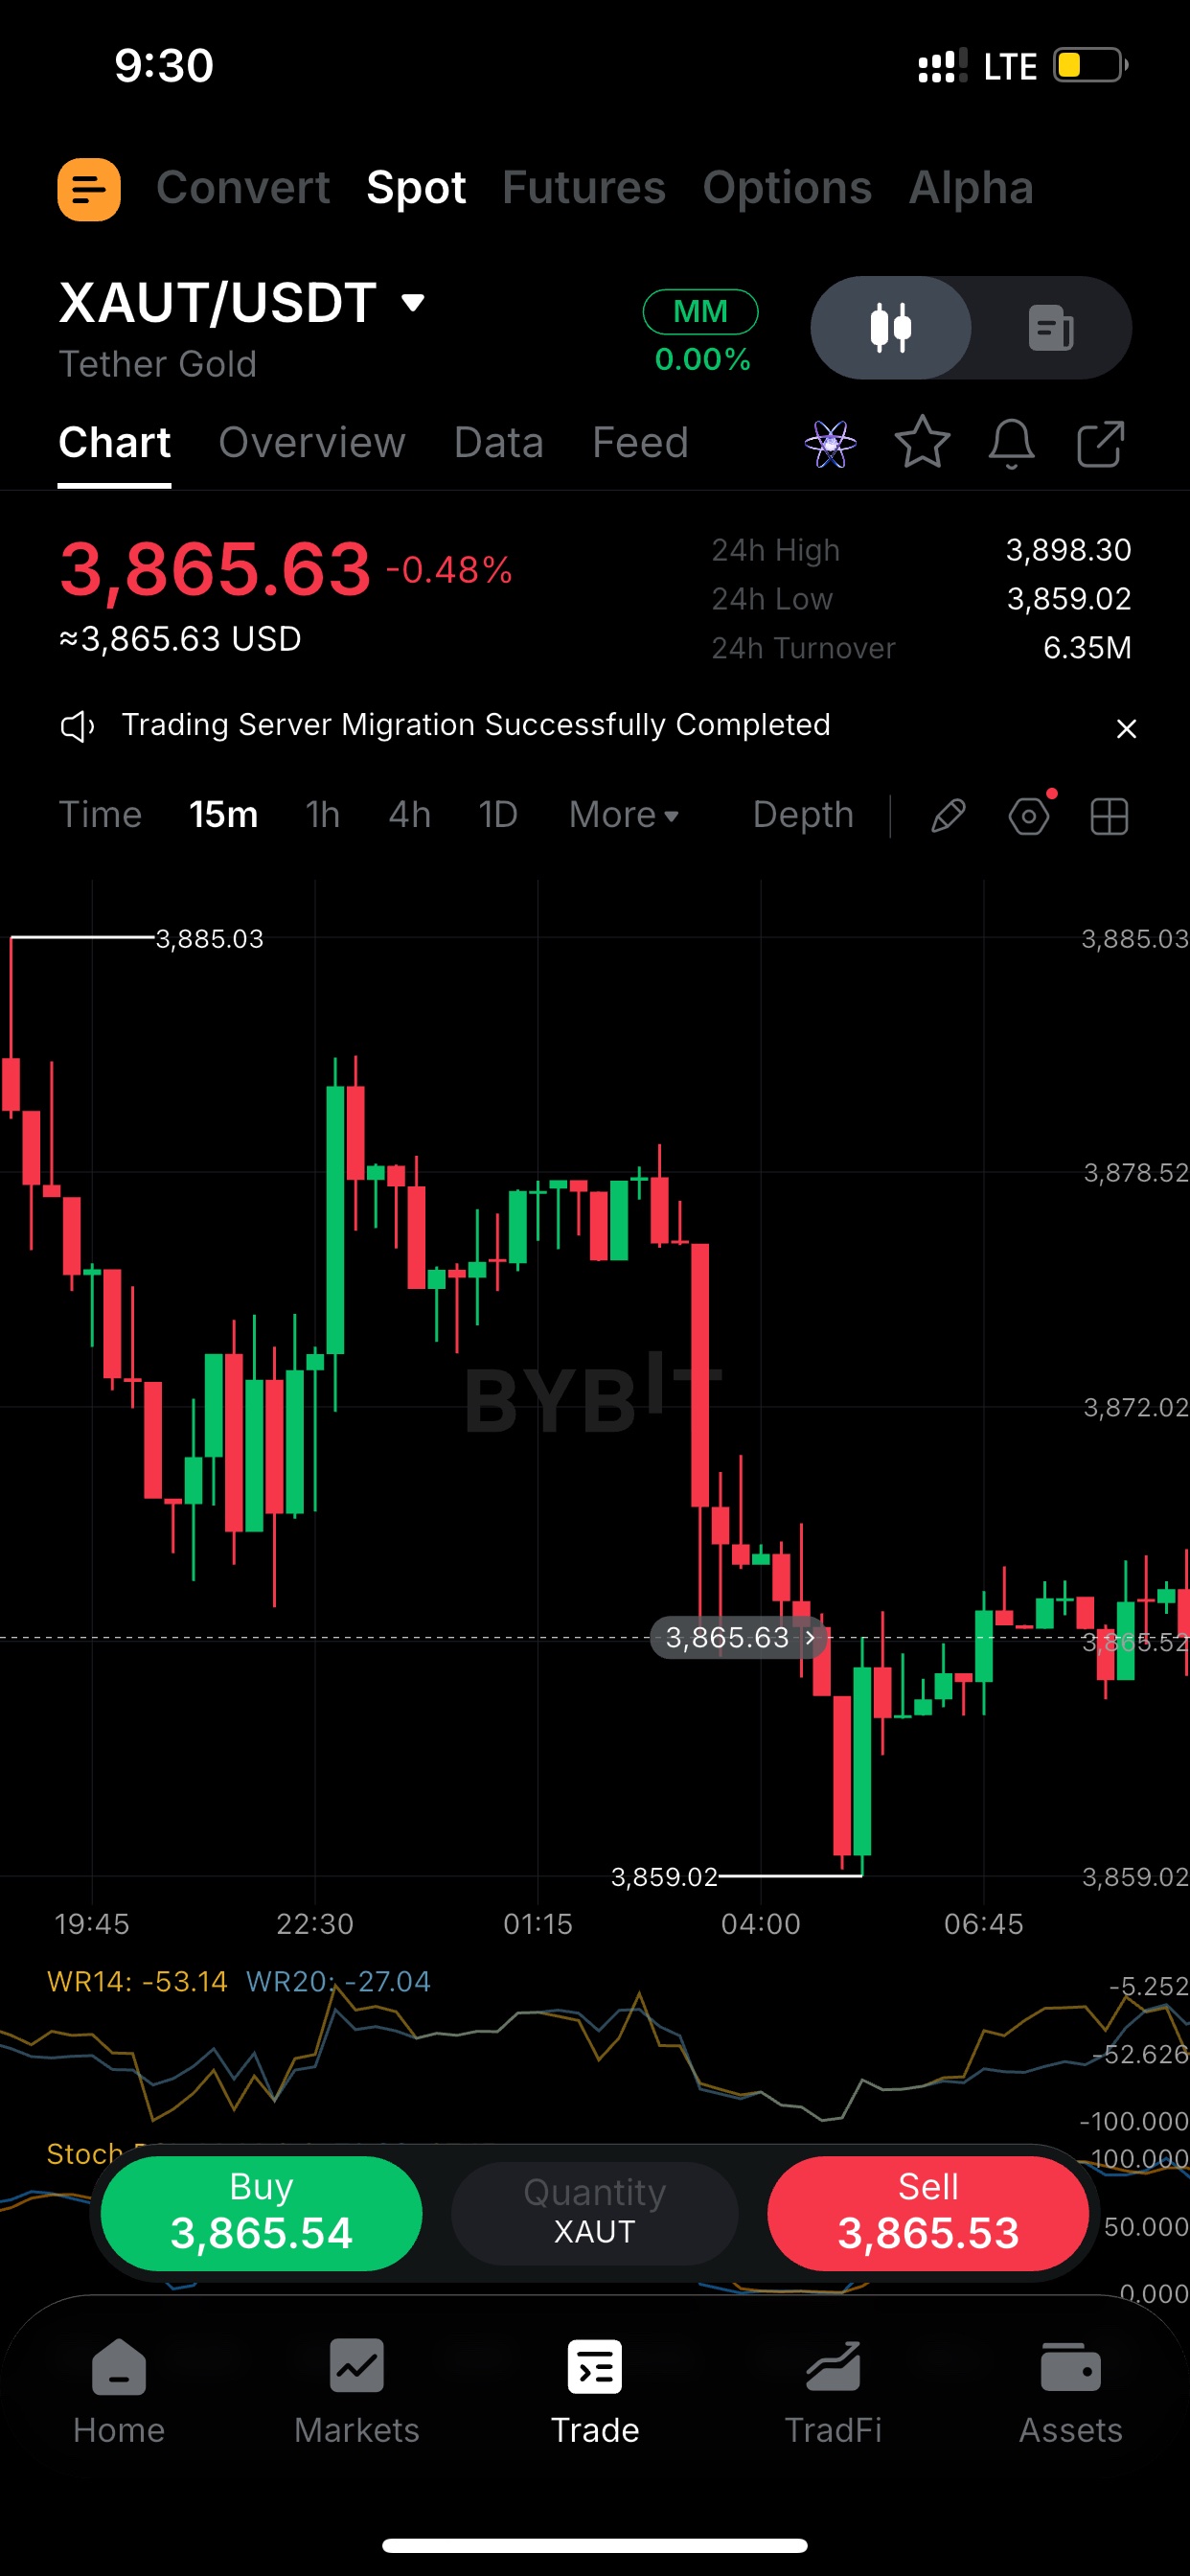
$BTCUSDT 15分鐘線掃到了65,004,隨即幾乎立刻反轉。18:00那根K線下方的長下影線看起來像是止損單被掃掉,而不是真正的拋售。 反彈在66,235處遇阻並失敗。現在回到65.8k,賣方依然在防守這個區間的上緣。 65,000到66,200是目前的震盪箱體。我只做兩邊的邊緣,不碰中間。 2 (背景與風險) 比特幣在創下69,126的高點後,日內下跌了4.5%,15分鐘線的反彈並沒有改變趨勢。今天下午以來低點不斷降低,自66,645高點算起。 Stoch RSI指標鎖定在91/95,所以短期走勢已經過熱。回調到65,400附近我不會感到意外。如果跌破65,000且站不穩,我預期會有一波快速的下跌。 在跌破或突破這兩個關鍵點位之前,我不會開倉。 3 15分鐘線:65,004有支撐,但反彈在66.2k下方停滯。 哪邊會先突破? 1) 收復66.2k,然後回測66.6k 2) 再次掃蕩65k,這次會有後續走勢 除非買方帶量進場,否則我傾向於第2種情況。你的看法呢? - 把這些內容分散在一週內發佈,每篇都標記一下。 - 如果你需要另一個角度,我可以寫一篇關於24小時區間(65,004到69,126)以及目前價格在其內部位置的短文。 #IMPACTbyTrade
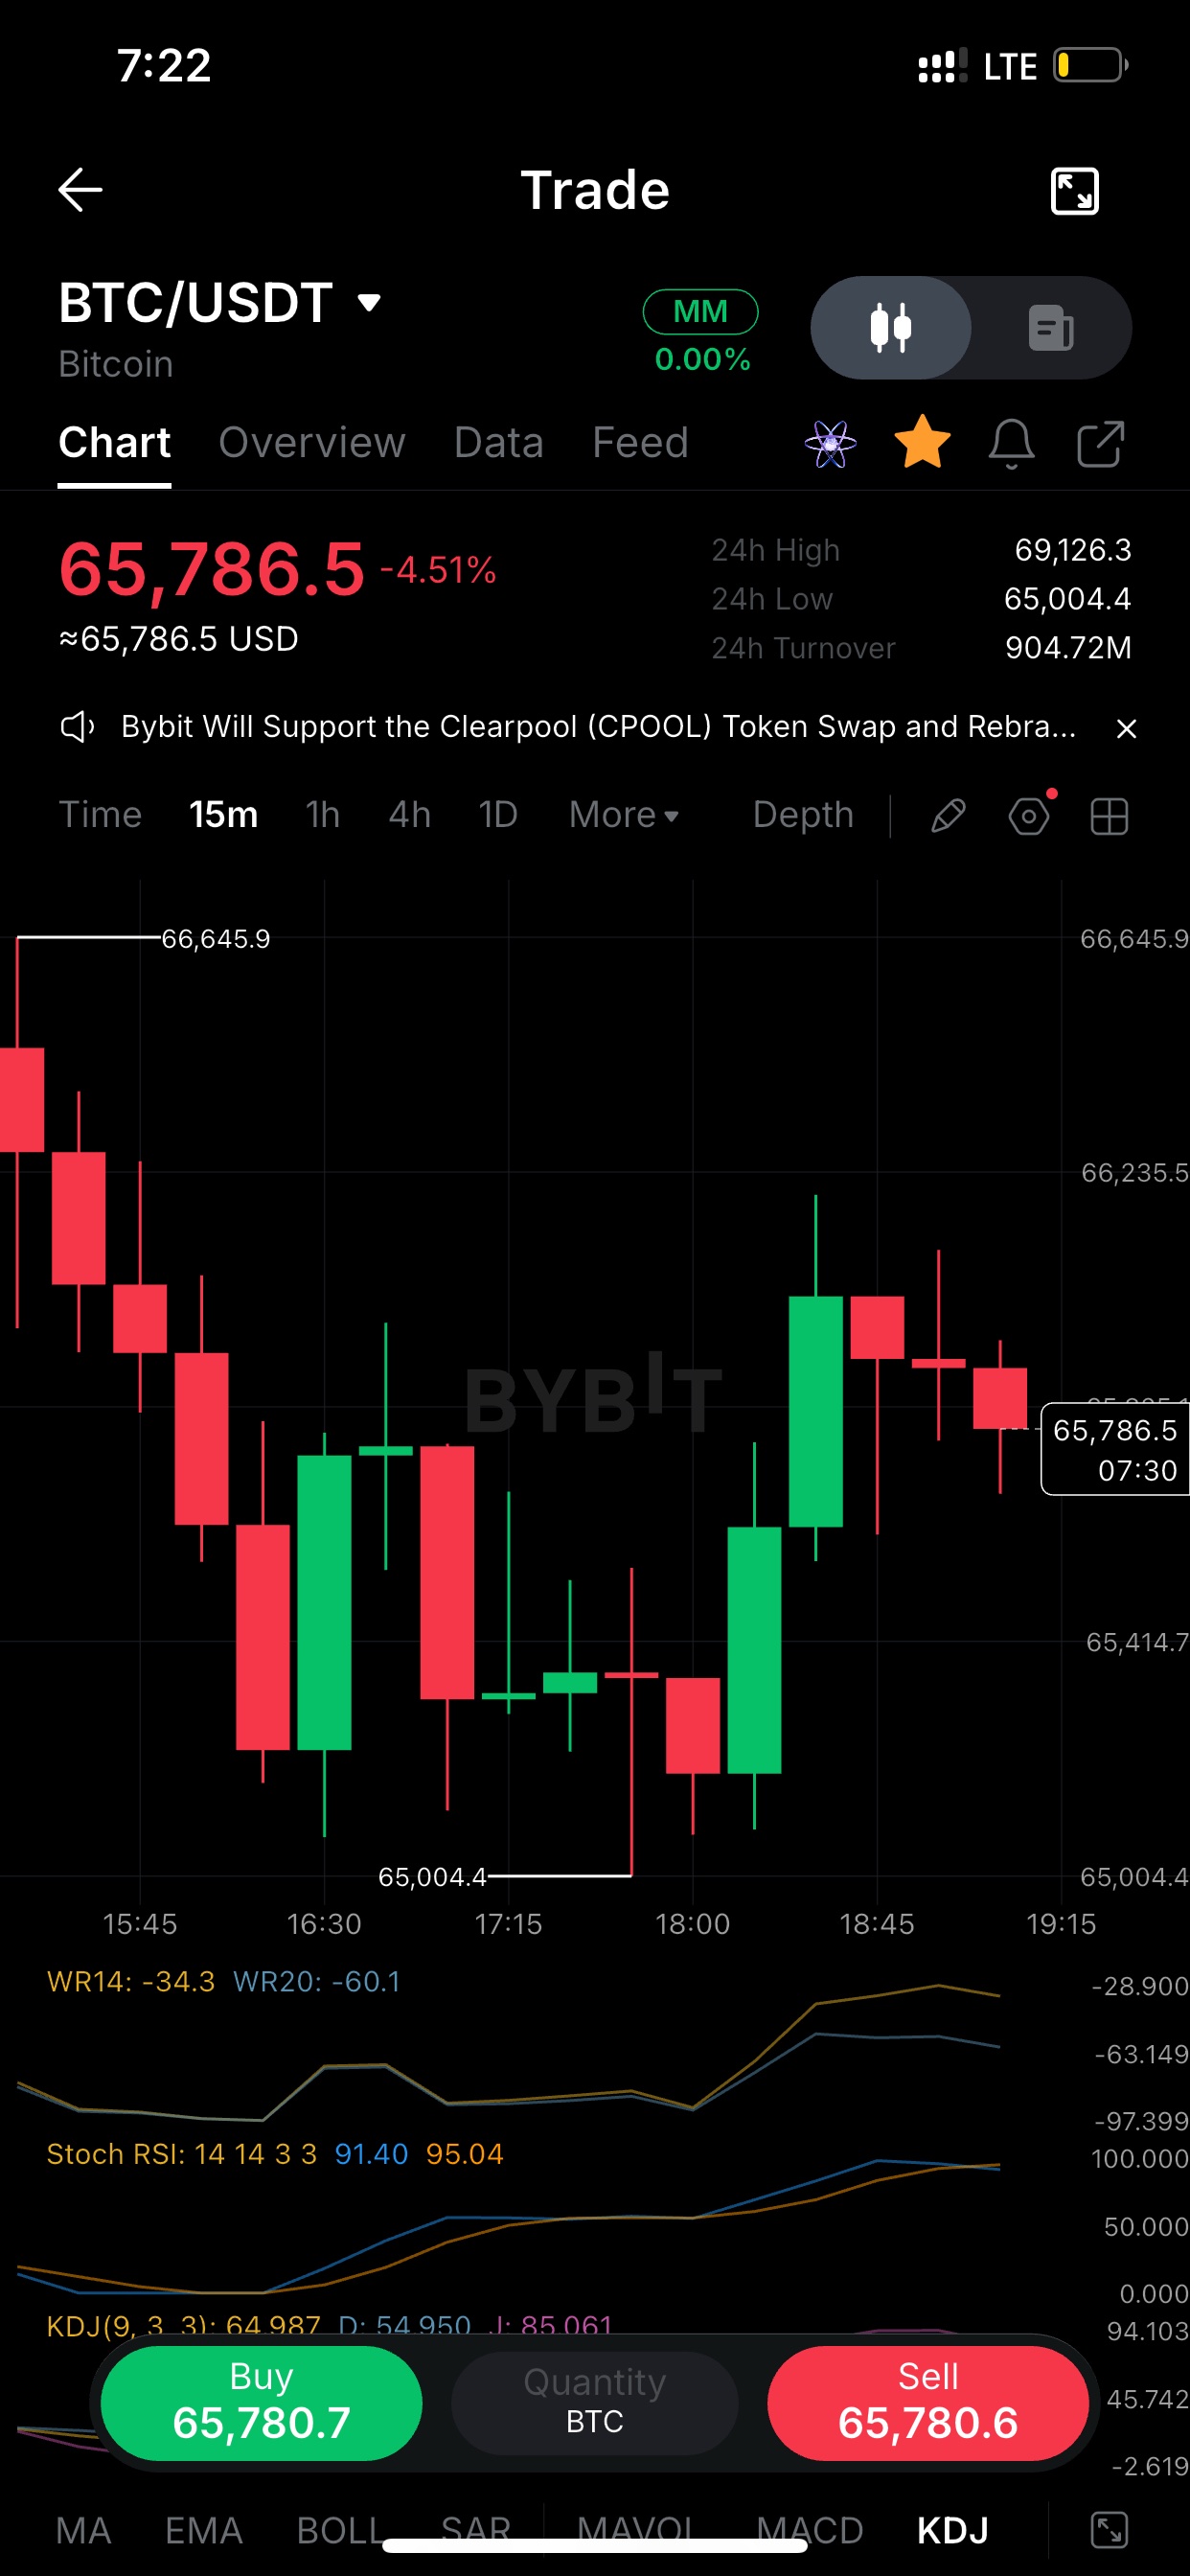
$HYPEUSDT 15m:66.60 在 15:30 得到支撐,價格反彈至 68.4–69.0 區間。69.03 兩次遇阻,現在又在 67.5 附近回落。 今日下跌 7.6%,從 73.56 的高點回落。只要 66.60 守住,這就是一個震盪區間。15 分鐘線收盤跌破該位置,將開啟測試新低的空間。 我在等待放量收復 68.4,才會考慮做多。 2 (動能解讀) 從 66.60 強勢反彈,但振盪指標已經過熱。15 分鐘線上的隨機 RSI 處於 86/90,而價格在大級別下跌趨勢中仍不斷創出更低的高點。 動能跑在價格前面。這通常意味著在真正延續趨勢前,會先回調測試低點。KDJ 也在回落(J 值為 73)。 我不會追這波反彈。 3 (社群提問) 今日下跌 7.6%,24 小時區間為 66.60 到 73.56。15 分鐘線在低點上方盤整,但每次衝擊 68.5+ 都遭到拋售。 你認為這是在 66.6 附近的吸籌,還是下一波下跌前的熊旗?在 68.4 轉為支撐前,我傾向於後者。好奇你們都在觀察什麼位置。 發文給排行榜的小撇步: - 每篇貼文都加上標籤或交易小工具。 - 本週發文要分散時間,避免因高頻發文被靜音。 - 附上你自己的圖表截圖。原創內容分數更高。 - 第 3 篇貼文以提問結尾,通常更容易吸引回覆。 這些僅為圖表解讀,非投資建議。如果你告訴我你實際的觀點或交易(做多、做空或觀望),我會圍繞你的想法重寫這些內容。 #ByXIMPACT
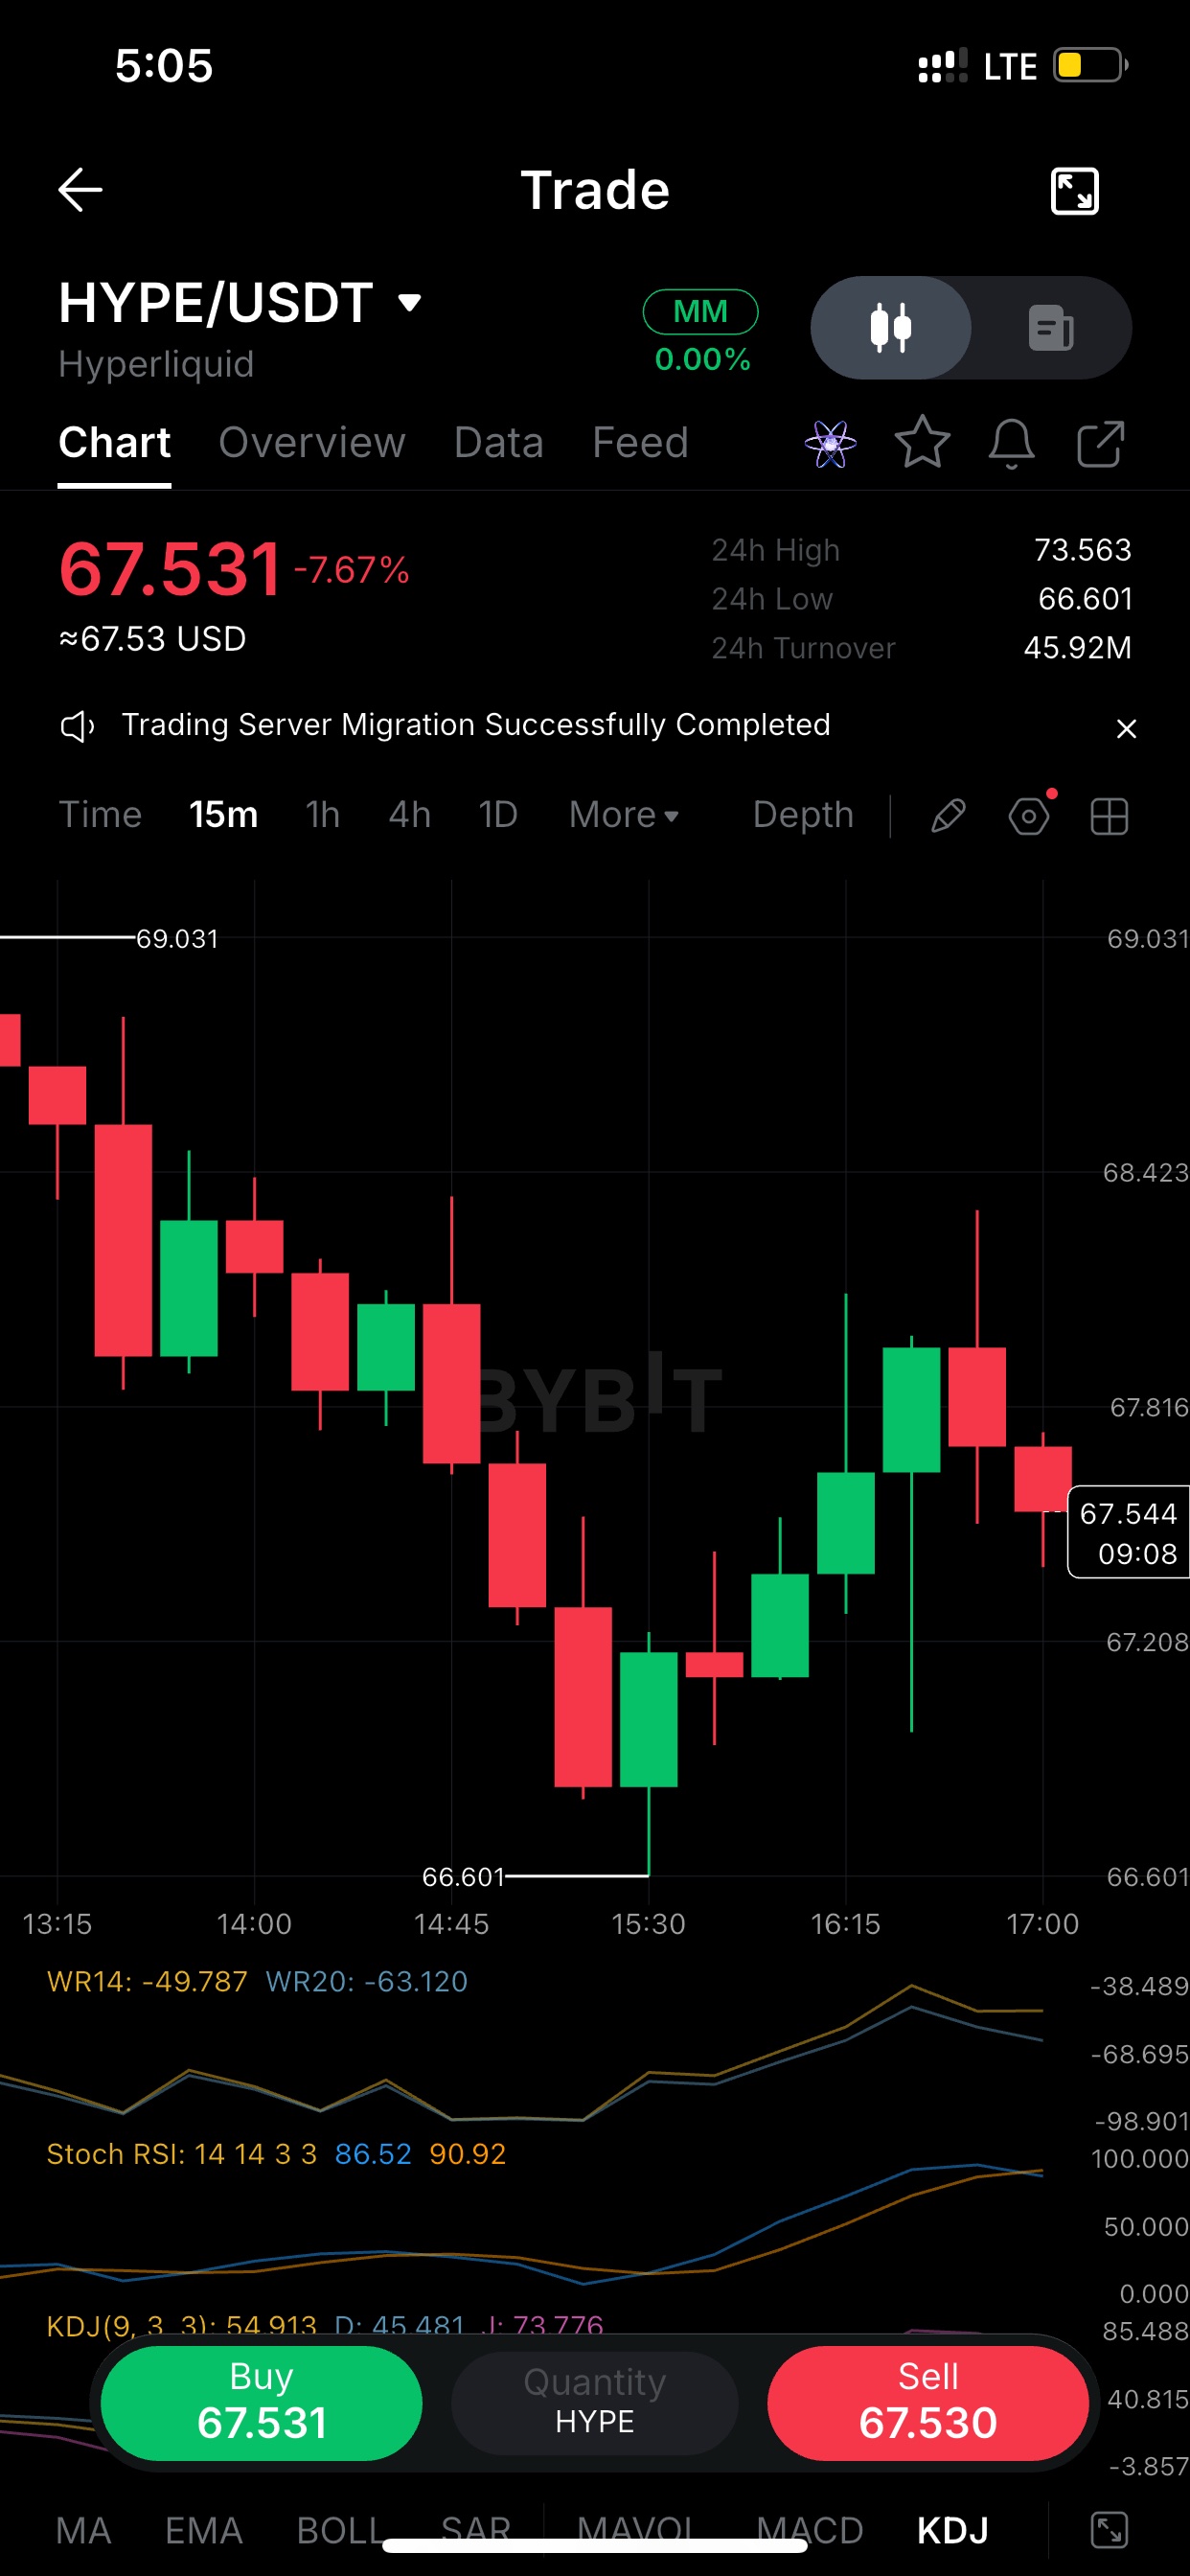
$BTCUSDT 15m:今日下跌 3.16%,價格正處於 66,966 的日內低點。 動能向下延伸。WR14 位於 -99.9,Stoch RSI 近 3,KDJ 的 J 線已經為負值。這顯示的是拋壓衰竭,而非新的強勢。 10:45 衝高至 67,527 後立刻被拋售,顯示賣方仍掌控上方壓力。我正在觀察 66,966 在下次測試時能否守住。 若能收復 67,250 將是買方回歸的第一個訊號。若 15 分鐘線確定收低於 66,966,則將開啟下探 66,448 日內低點的空間。 2: 我關注的 $BTC 15 分鐘線點位: 阻力位:67,527(強力拒絕),其次為 67,246 支撐位:66,966,其次為 24 小時低點 66,448 現貨價格:67,064,介於兩者之間 日線區間為 66,448 至 70,217,因此 BTC 正處於區間底部附近。當超賣指標在區間底部排列時,通常會出現向中間回彈或跌破的走勢,很少會出現橫盤震盪。 在 66,966 或 67,250 被突破之前,我不會貿然追漲殺跌。 3: $BTC 下跌 3.16%,目前位於 24 小時低點上方 600 點處,15 分鐘線的震盪指標均處於超賣狀態。 與此同時,10:45 以來的每一次反彈嘗試都被迅速打壓。 你更相信哪一方:超賣反彈,還是不斷降低的高點?我傾向於先出現回調至 67,250 的走勢,但前提是 66,966 必須守住。 你的觀察點位在哪裡? 點擊每個區塊的複製圖示,即可直接貼上至 ByX。發文時記得加上 $BTC 標籤或交易小工具,因為貼文必須包含這些才能計數。 #ByXIMPACT
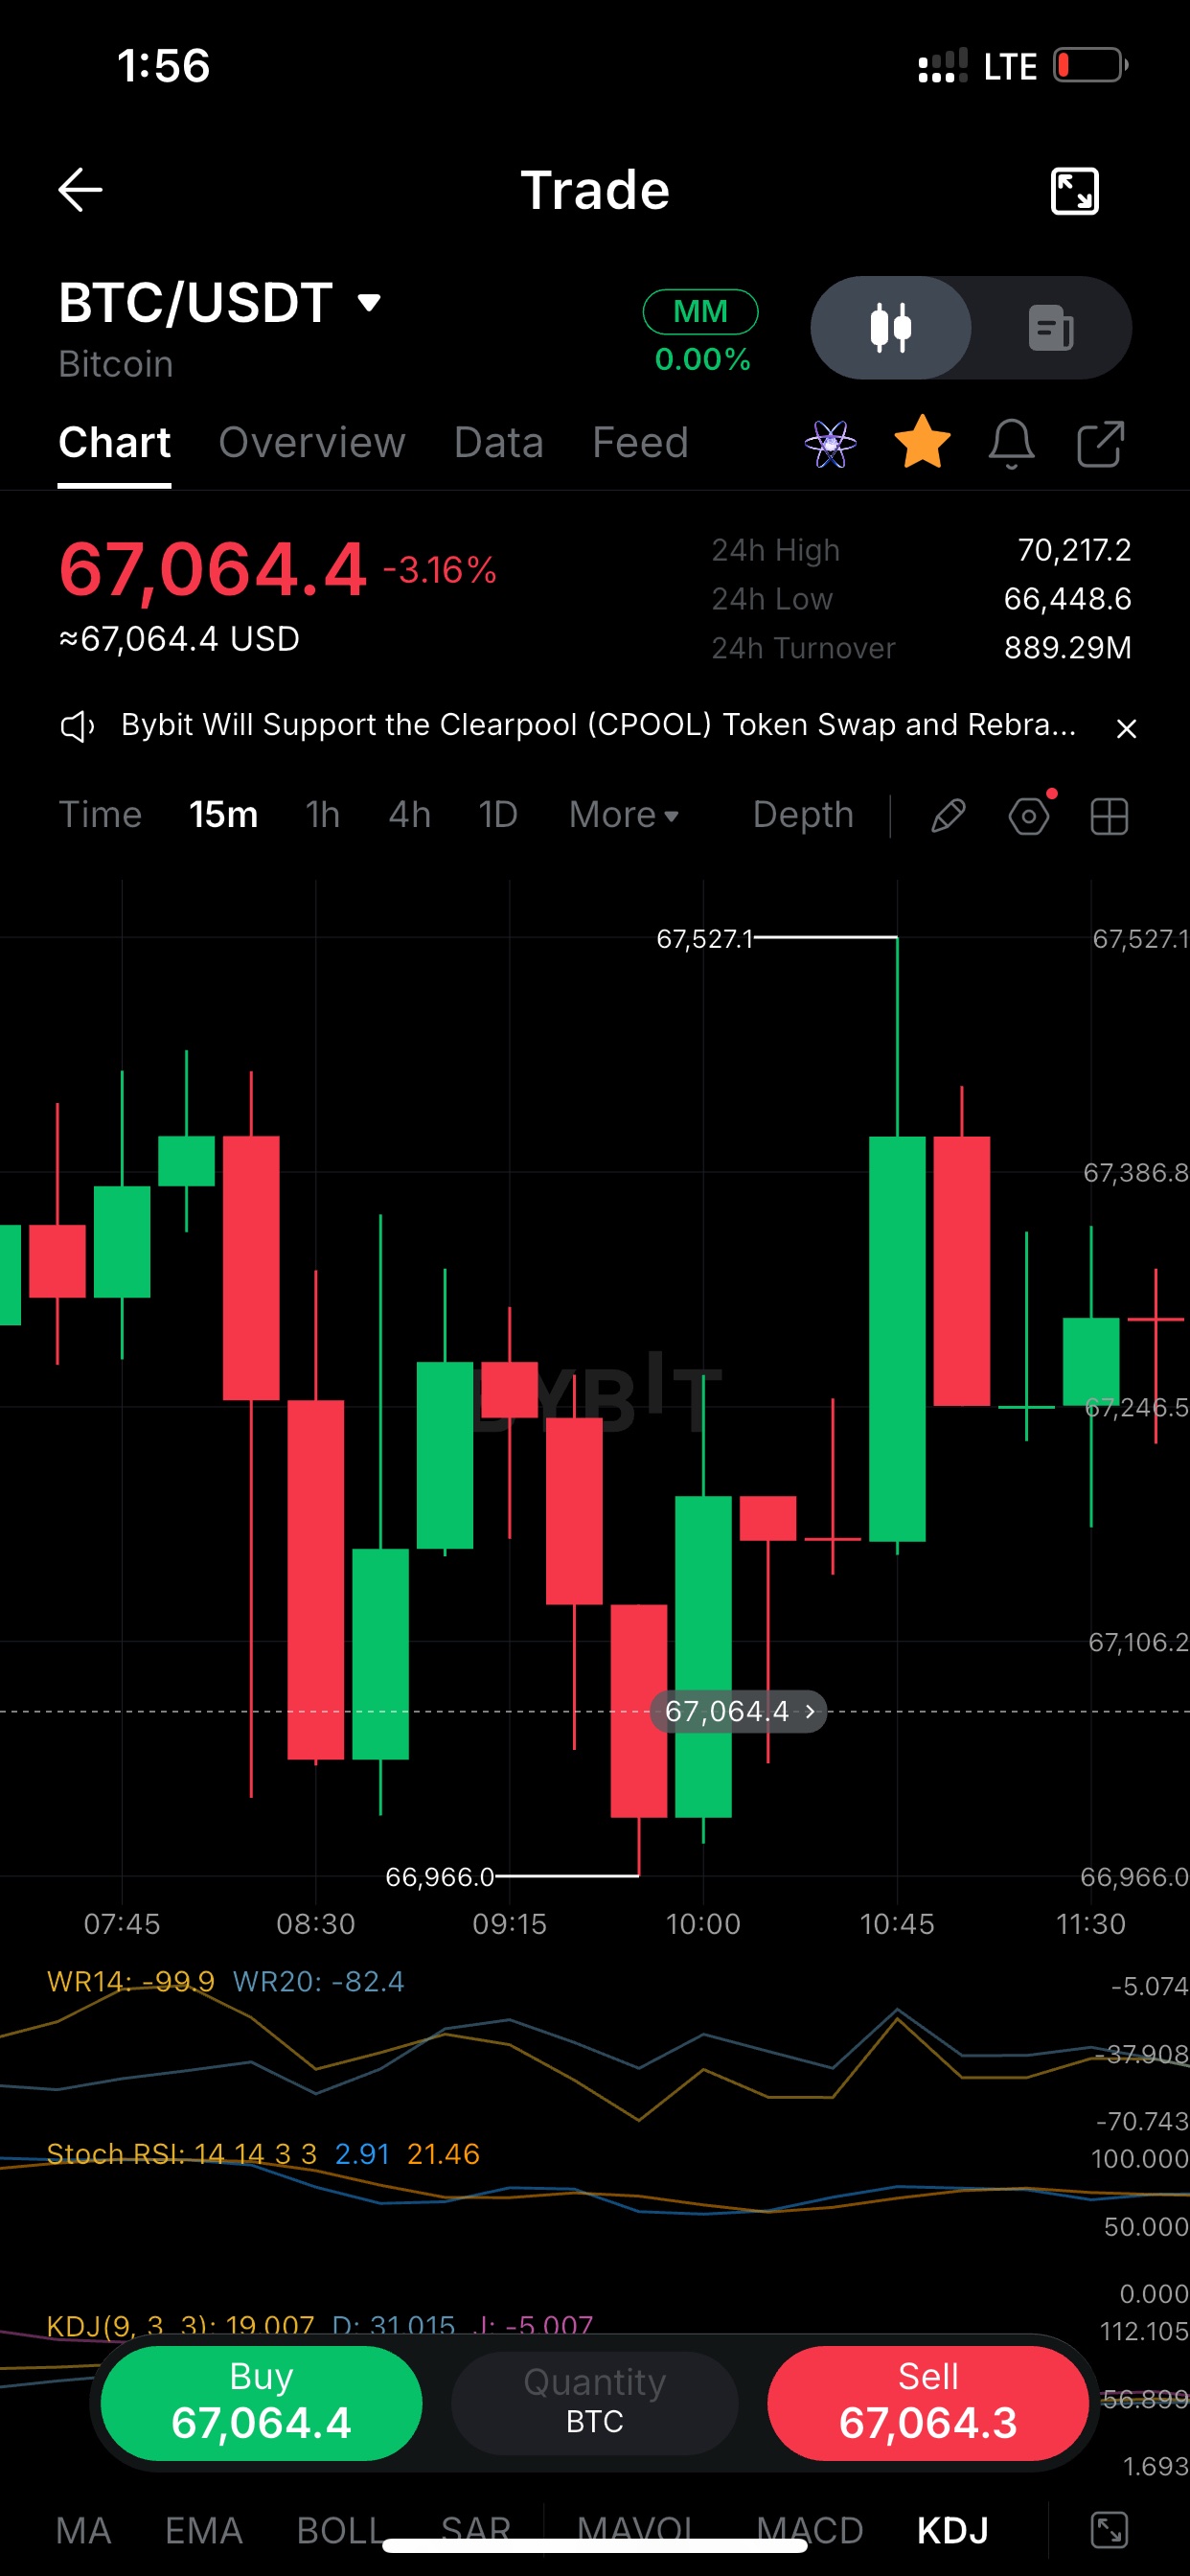
$XAUTUSDT 15分鐘線:一波急殺就造成了這波跌勢。價格在單根賣出 K 線中從 3,878 左右直接跌至 3,859 的低點,隨後花了 2 小時在橫盤震盪,沒有出現真正的後續走勢。 反彈至 3,865 的力道微弱。3,872 區域是第一個真正的考驗。除非突破該價位,否則我將此視為區間內的喘息反彈,而非反轉。 $XAUT 快速解讀: 區間:3,859 至 3,885 現價:3,865.5,位於區間下三分之一處 威廉指標 (Williams %R14) 約為 -53,動能中性,並未超賣 急跌後的數據中性意味著市場尚未做出決定。我會等待 15 分鐘線收在 3,872 上方再考慮做多,或者在跌破 3,859 後再考慮做空。中間的震盪都是雜訊。 賣方在隔夜時段佔據主導地位,但在 3,859 低點處有防守,且買方在底部出現了一根強勁的陽線進場。 這是一個不錯的初步跡象,但單根 K 線並不能代表趨勢。在信任這次反彈之前,我想看到更高的高點維持在 3,860 之上。如果失敗,低點將會迅速面臨重新測試。 如果你告訴我你的交易方向(做多、做空,或是觀望),我可以為你寫出具體的交易策略。 #ByXIMPACT
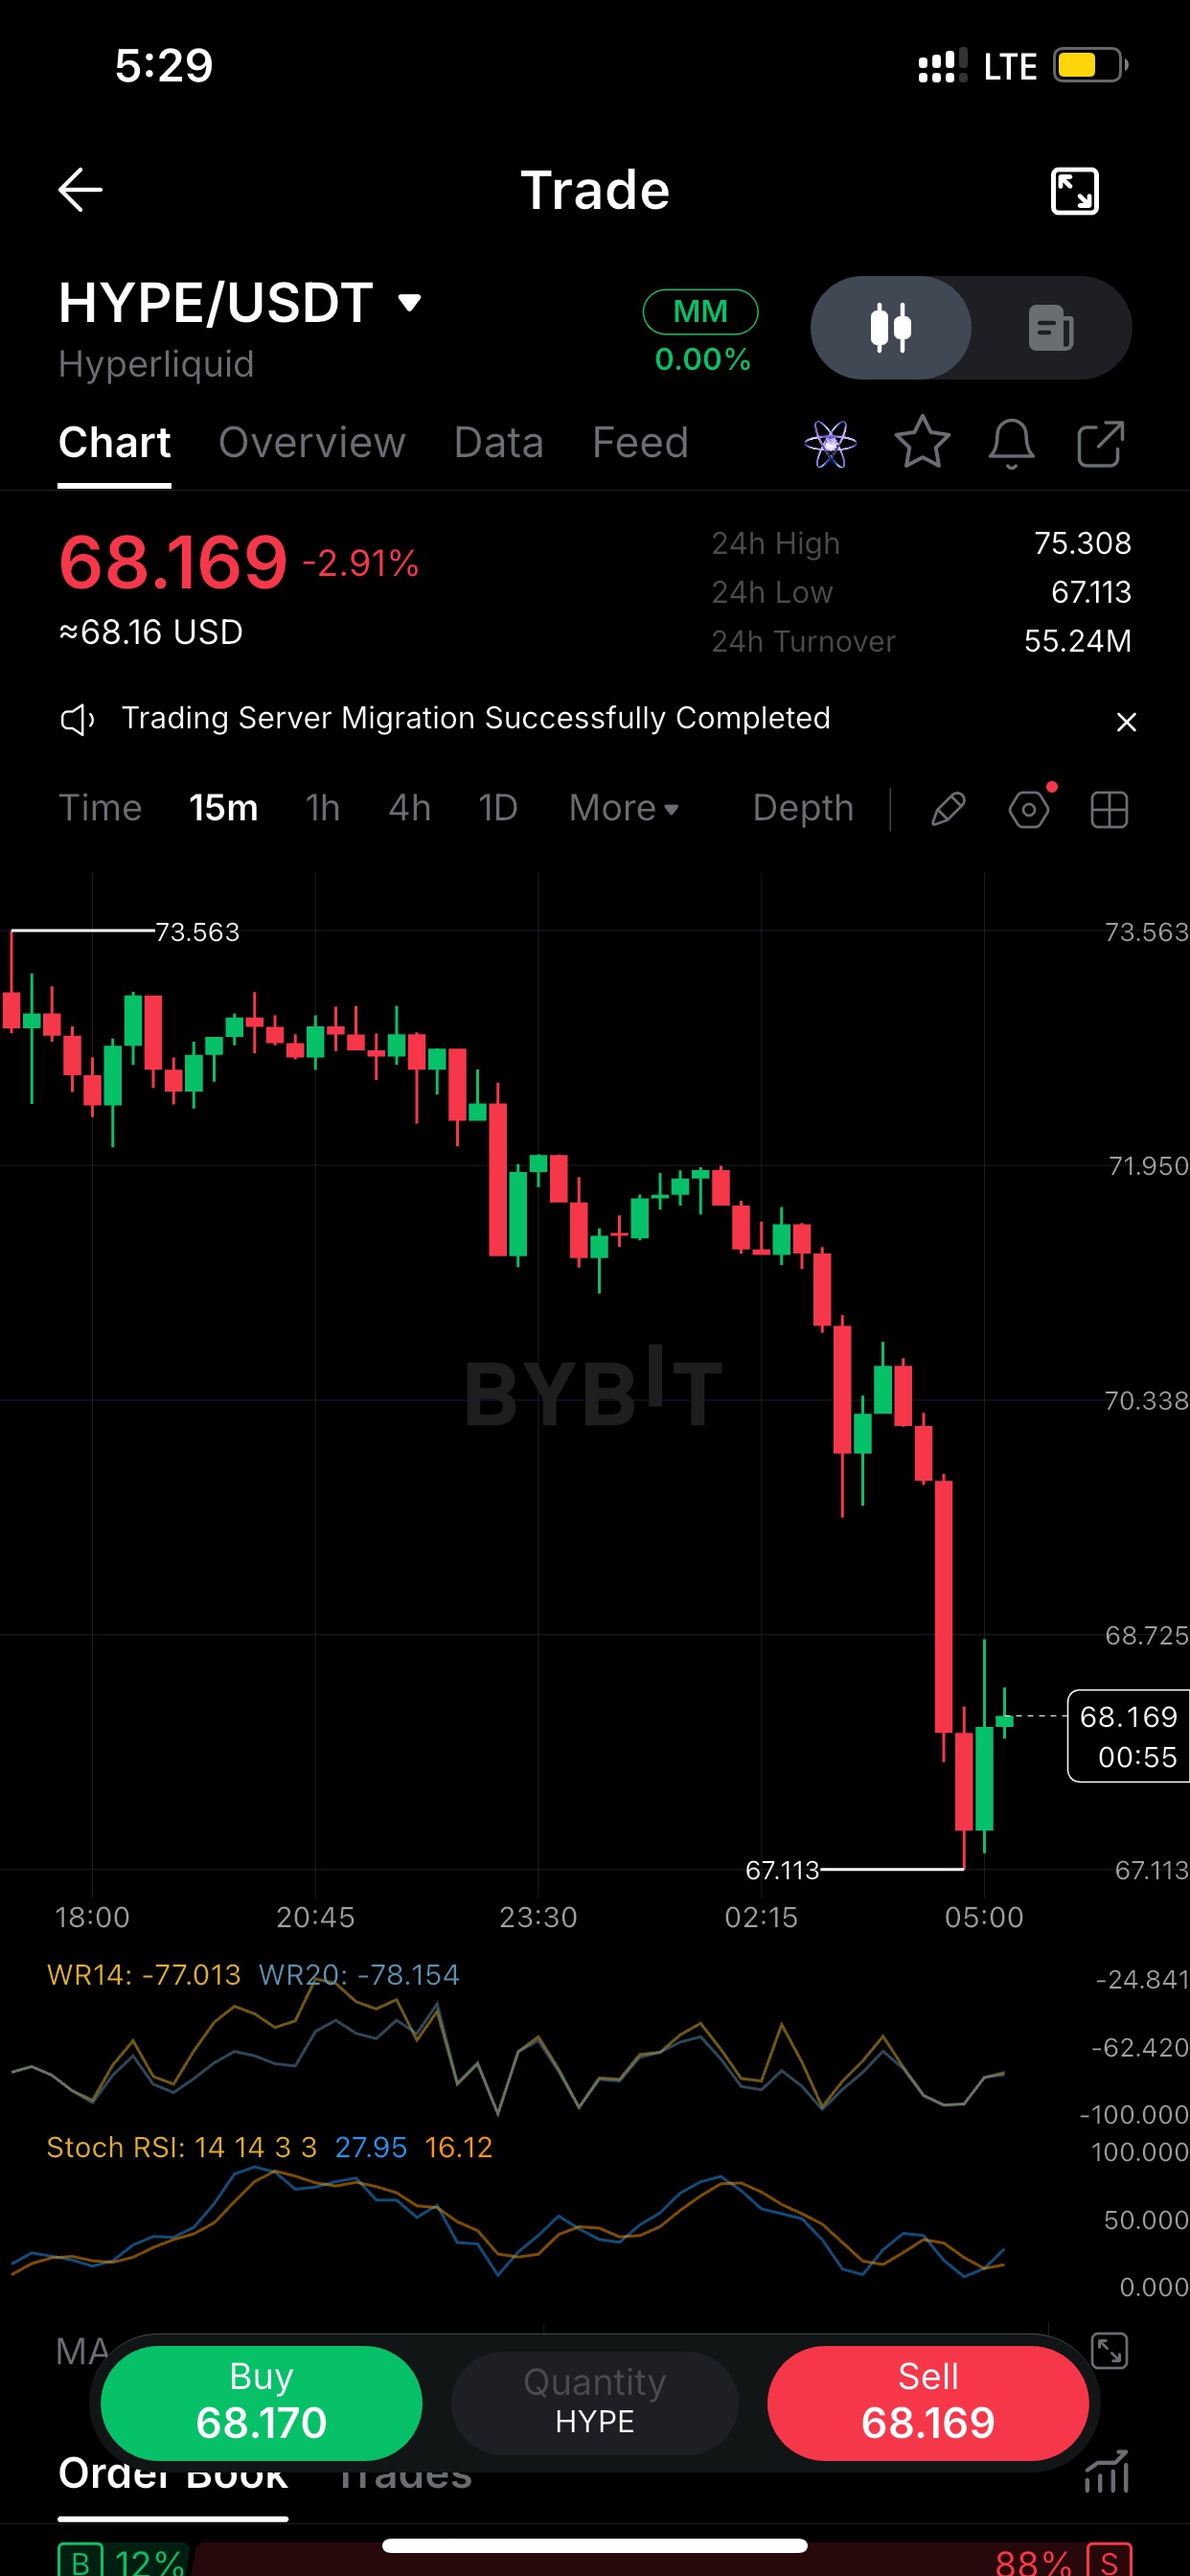
1 市場結構 $HYPEUSDT 在 15 分鐘線磨了 11 個小時一路走低,最後一波是從 ~70.3 到 67.1 的單根光頭光腳大陰線(Marubozu)。那是典型的清算式閃崩,不是緩慢陰跌。 67.113 出現買盤,拉出兩根陽線,但價格仍在 73.5 以來的所有低點阻力位下方。在 68.7 轉為支撐之前,反彈並不代表反轉。 2 動能解讀 15 分鐘線的隨機相對強弱指標 (Stoch RSI) 為 27.95 / 16.12,正從底部勾頭向上。威廉指標 (Williams %R) 還在 -77 左右,甚至還沒完全進入超賣區。 動能正在轉變,但價格尚未確認。與其在 68.1 接飛刀,我寧願等它收盤站上 68.7 再說。 3 關鍵點位與無效化條件 日內跌幅 -2.91%,24 小時波動區間 67.11 至 75.31,成交額 5500 萬。 我關注的點位: - 67.11:目前守住的低點 - 68.72:第一個收復目標 - 70.34:跌勢開始的地方 若 15 分鐘線收盤跌破 67.11,那這次反彈就只是中場休息而已。 建議分不同時間發布,不要連續發文,因為平台規則會對高頻發文和相似內容進行降權。如果你在 App 中添加交易小工具或幣種標籤,應該有助於提高評分。準備好發下一張圖表時隨時告訴我。 #ByXIMPACT
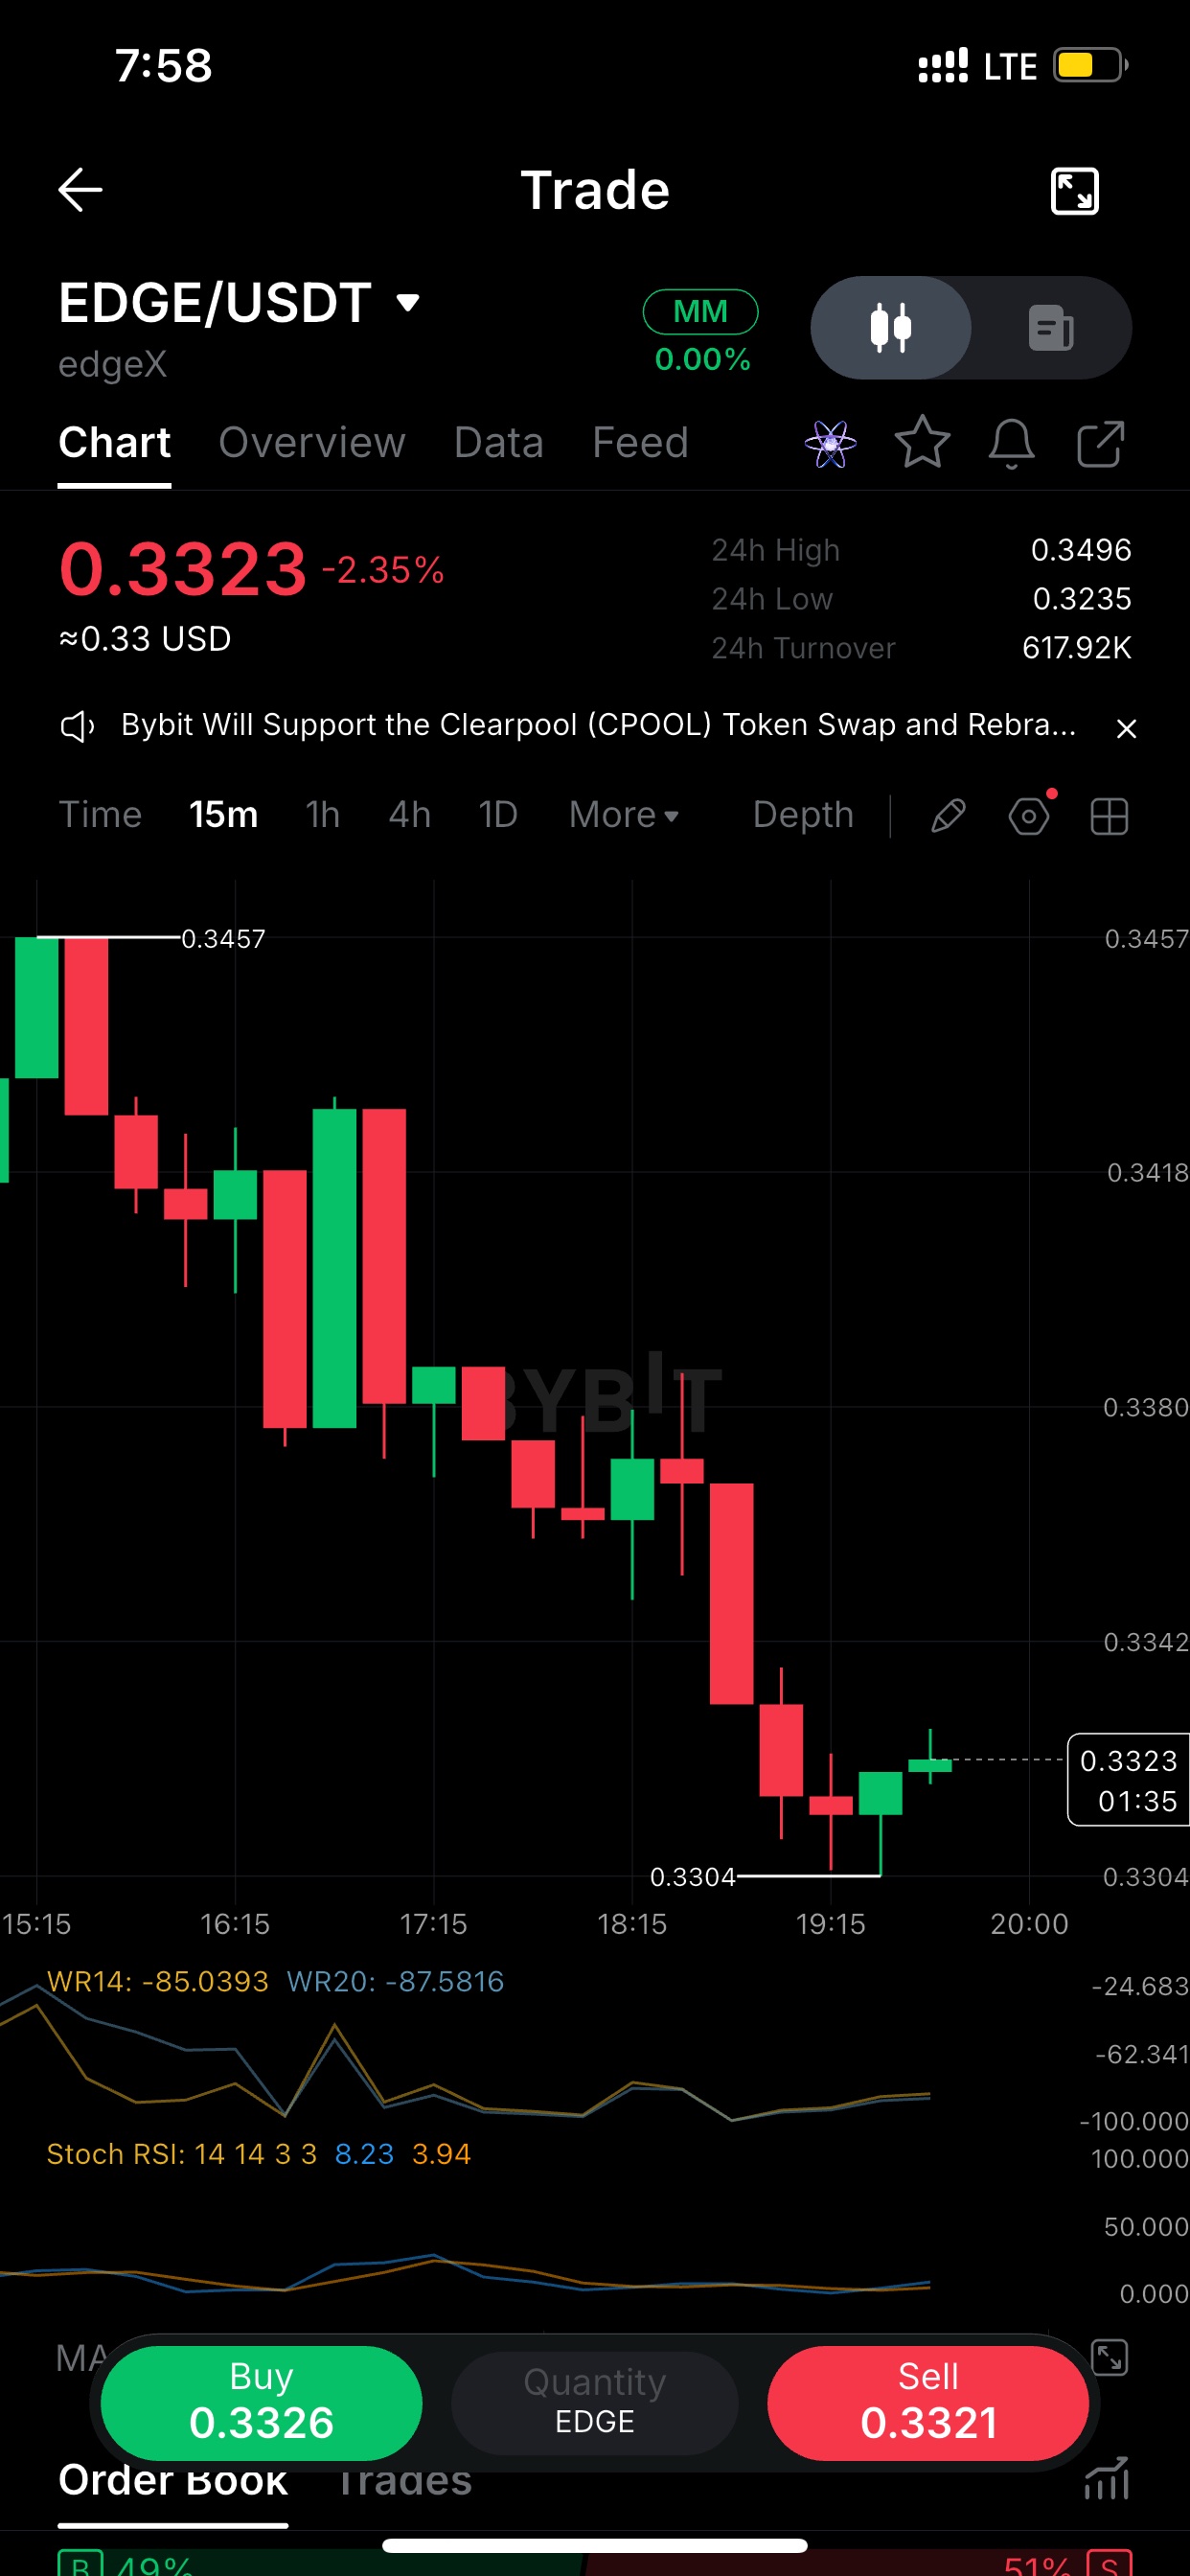
$DOGEUSDT $EDGE 15m: sellers had control from 0.3457 down to 0.3304, then it printed a higher low and the last two candles closed green. That's a bounce, not a reversal yet. Price needs to reclaim the 0.3342 area and hold it before I'd call the downtrend broken. Lose 0.3304 and the bounce thesis is dead. Volume is thin (24h turnover ~618K), so moves can overshoot in both directions. ``` **Post 2: the momentum read** ``` Stoch RSI on $EDGE 15m is at 8 / 4, and Williams %R is around -85. Both are deep in oversold territory after a roughly 4% slide in a few hours. Oversold can stay oversold in a trend, so I'm not buying the reading alone. I want a close back above the last red candle's body first. The indicators say selling is stretched, and price still has to confirm. ``` **Post 3: the risk framing** ``` Trade idea on $EDGE, not a call: the 0.3304 low is a clean invalidation level. It's only about 0.6% below the current price of 0.3323. Targets are 0.3342, then 0.3380 if buyers follow through. That's a small stop against a decent reward, but only if 0.3304 holds. If it breaks, I'm out and the idea is wrong. Order book is close to even (49% bids / 51% asks), so there's no clear edge from depth. ``` Before posting: - Attach the EDGE/USDT trading widget or coin tag so it counts as original market content. - Space the posts out. Posting too often can get you muted, and similar posts don't count. - Don't edit a post after publishing. Edits don't trigger a re-evaluation. If you send a chart on a different timeframe (1h or 4h), I can write posts around that structure instead. #IMPACTbyTrade
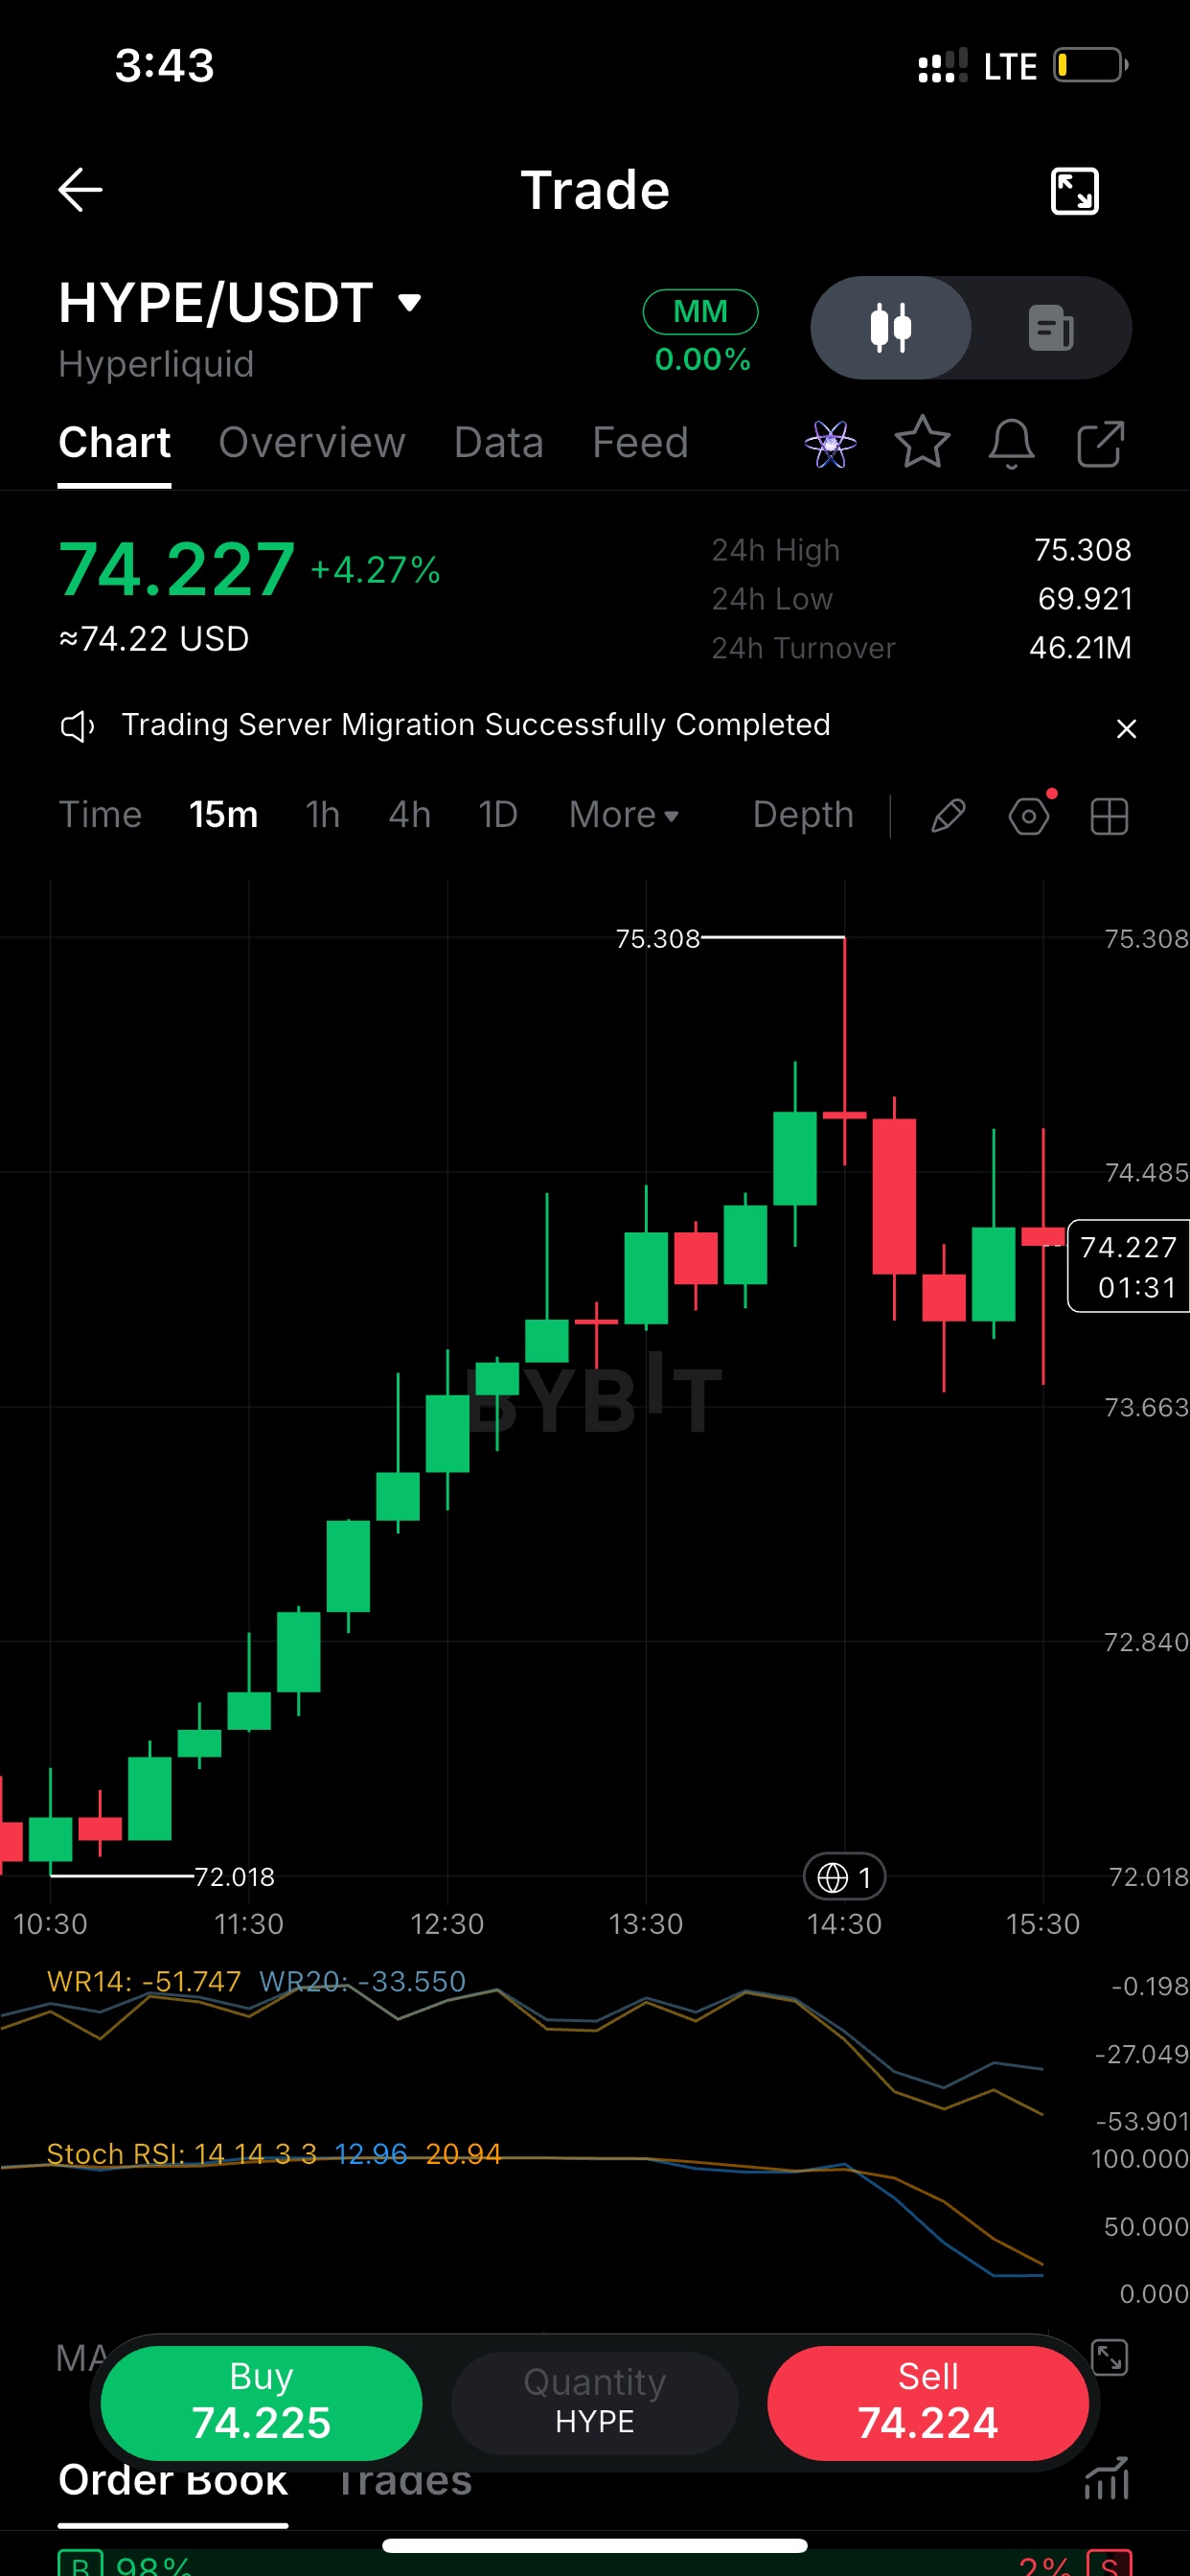
$HYPEUSDT 在 15 分鐘線走出一波漂亮的階梯式上漲,從 72.0 一路來到 75.3,中間幾乎沒有出現任何紅K。隨後在 75.308 遭遇強烈拒絕:留下了長上影線,且下一根K線收黑。 此後價格一直在 73.7 到 74.5 之間震盪。雖然單日漲幅仍達 4.27%,但動能已經冷卻。Stoch RSI 指標已降至 13/21 附近,不過價格仍穩守在 72 的底部之上。 我將 73.66 視為關鍵分水嶺。如果守住,75.3 的高點就還有機會挑戰。如果跌破,下一個買盤支撐位就在 72.8。 15 分鐘線快訊: 整體趨勢看起來依然健康:整個上午都在創新低點,24 小時區間在 69.9 到 75.3 之間,價格維持在區間上三分之一處。但震盪指標顯示漲勢暫時力竭。Williams %R 從接近 0 的位置滑落至 -51,Stoch RSI 也在 14:30 遭遇拒絕後大幅反轉向下。 這種修正通常會有兩種結果:要麼築底後再次上攻,要麼繼續陰跌至 72.8 區域。我傾向先觀察 K 線在 74.5 附近的表現,而不急於猜測。 交易想法,15 分鐘線,非財務建議。 這波推升浪潮從 72.0 到 75.3,但在頂部遭到拒絕。我不會在 74.2 這個位置追多。更好的進場點是回測 73.66,或是收盤價能重新站上 74.5 並收紅。 失效點(止損)設在 72.84 下方,跌破這裡結構就會被破壞。上方目標是重回 75.3。24 小時成交量達到 46M,流動性足夠支撐後續的行情走向。 你的觀察點位在哪? 如果你告訴我你想看的時間週期或角度(波段 vs 短線,看多 vs 謹慎),我可以為你量身定做下一組分析。 #ByXIMPACT
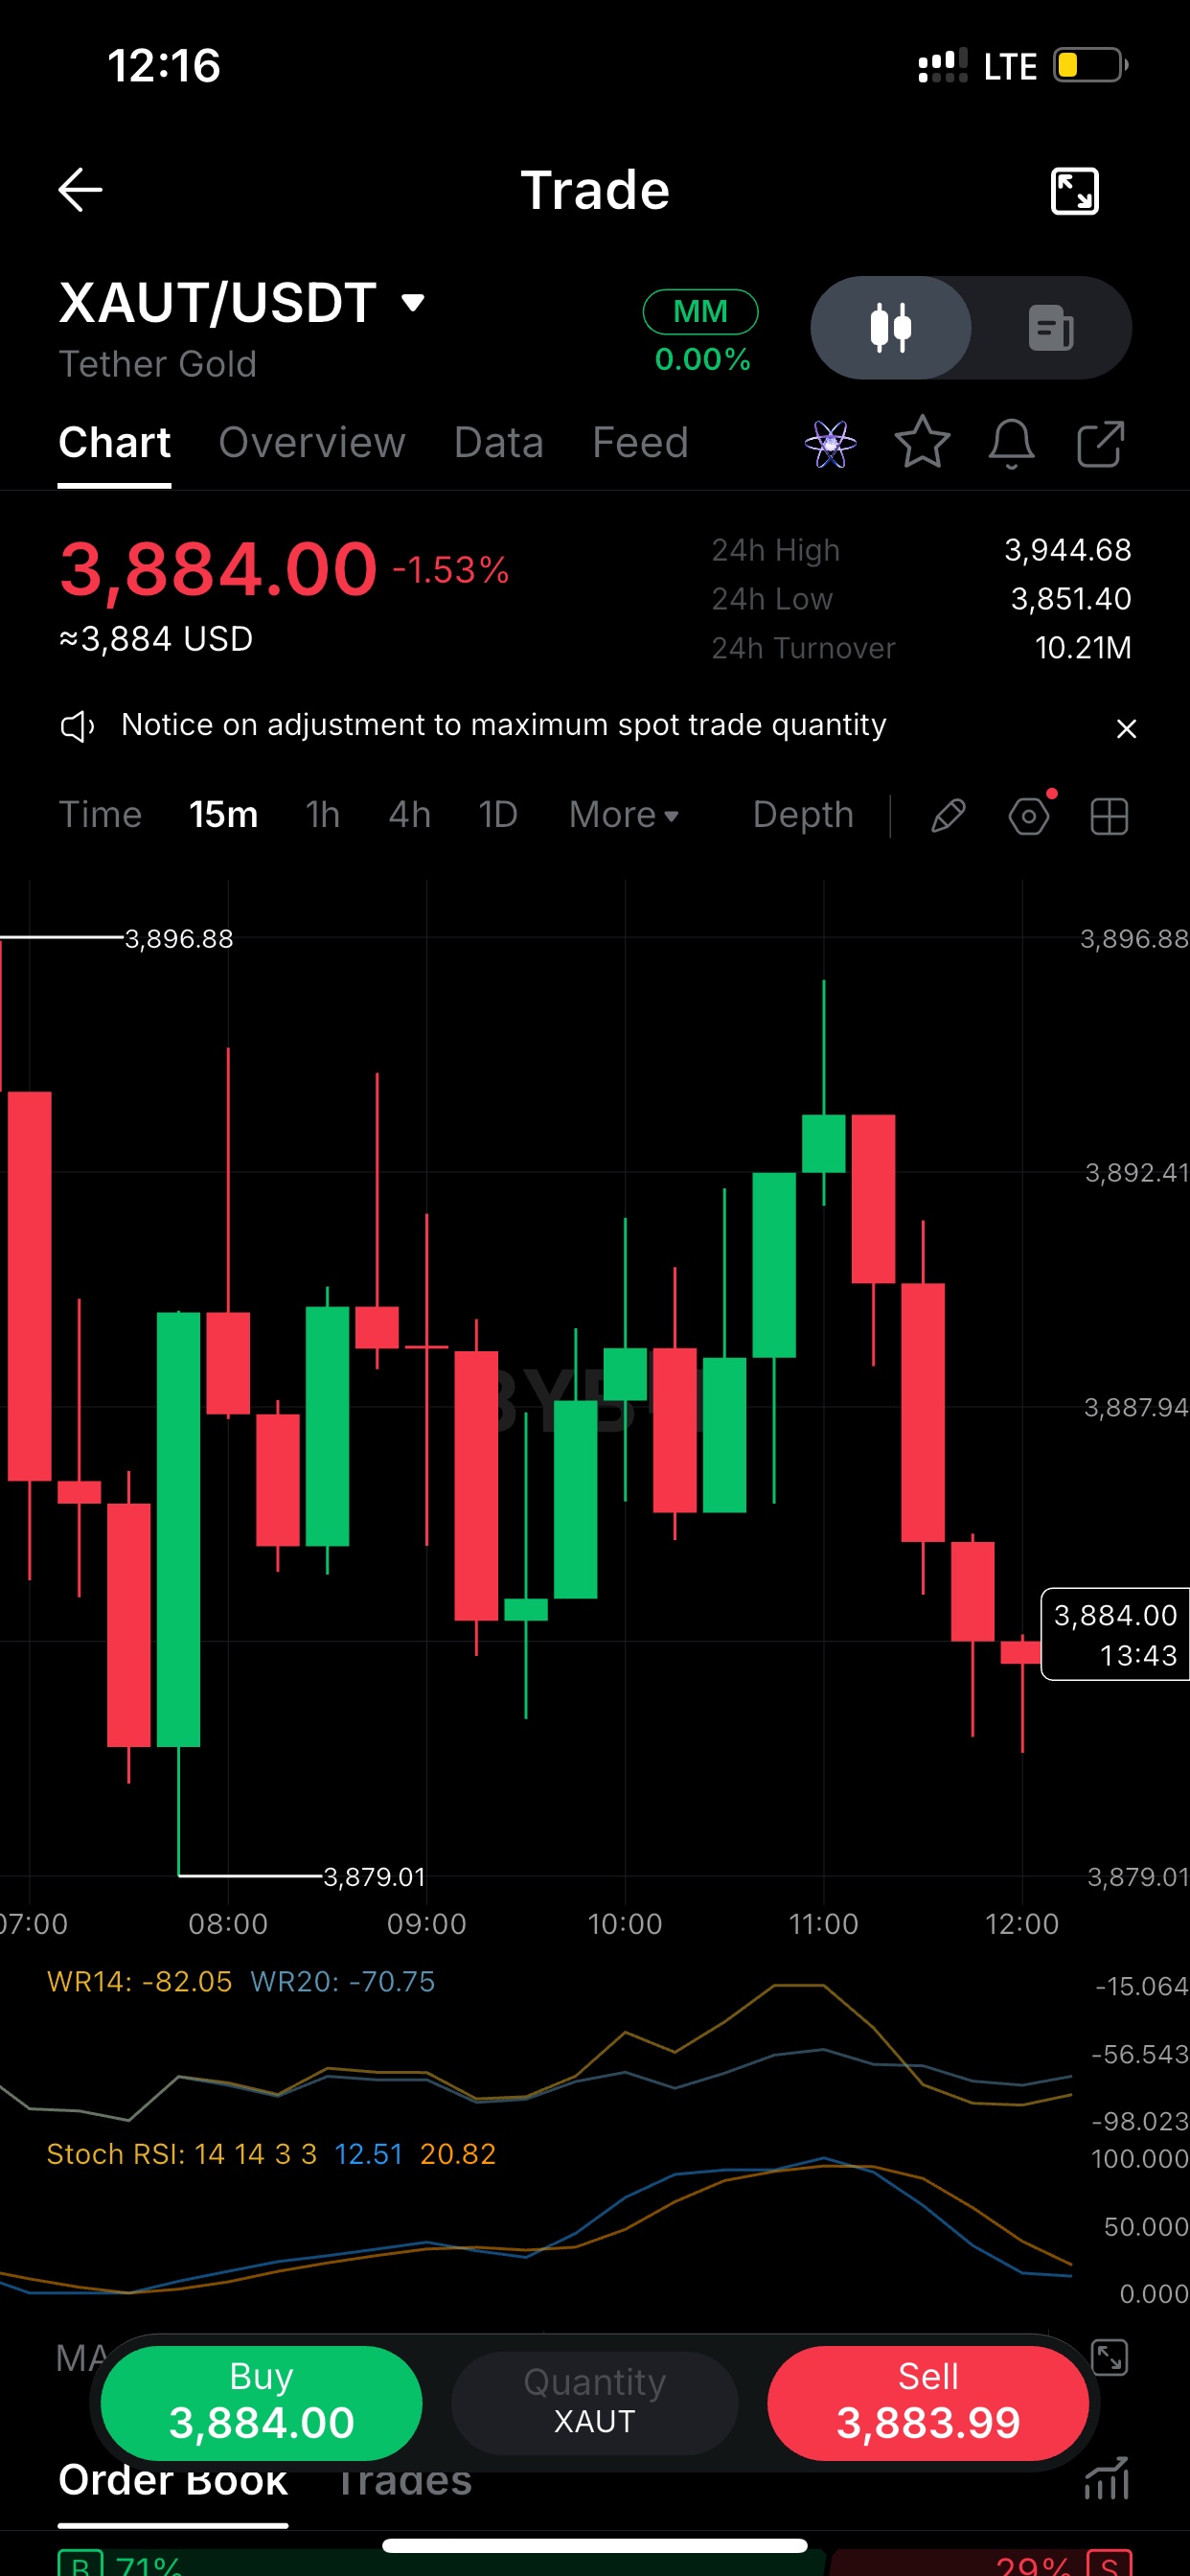
$XAUTUSDT lost the 3,896 area at 11:00 astepped down in lower highs since. 3,884 now, -1.5% on the day. The 3,879 low from the 08:00 sweep is the level that matters. A clean break under it opens the 3,851 daily low. A hold keeps this as a range inside the 3,879-3,896 box. Not chasing the middle of the range here. $XAUT on the 15m: Stoch RSI is down at 12/20 and Williams %R is around -82. Momentum is stretched to the downside, but oversold isn't a buy signal by itself. What I want to see is a reclaim of 3,888 with a green close. Until then, bounces are just relief inside a short-term downtrend. Tether Gold is trading 3,884 against a 24h range of 3,851-3,944. That puts price in the lower third after a 60-point rejection from the high. Selling pressure has been steady and bounces keep getting sold into. I'd wait for either a sweep of 3,879 that reverses, or a reclaim of 3,896, before taking a side. $XAUT I haven't added any external links, in line with the rules. Want a different angle, like a longer-timeframe view or a trade-idea format with entry and invalidation? #ByXIMPACT
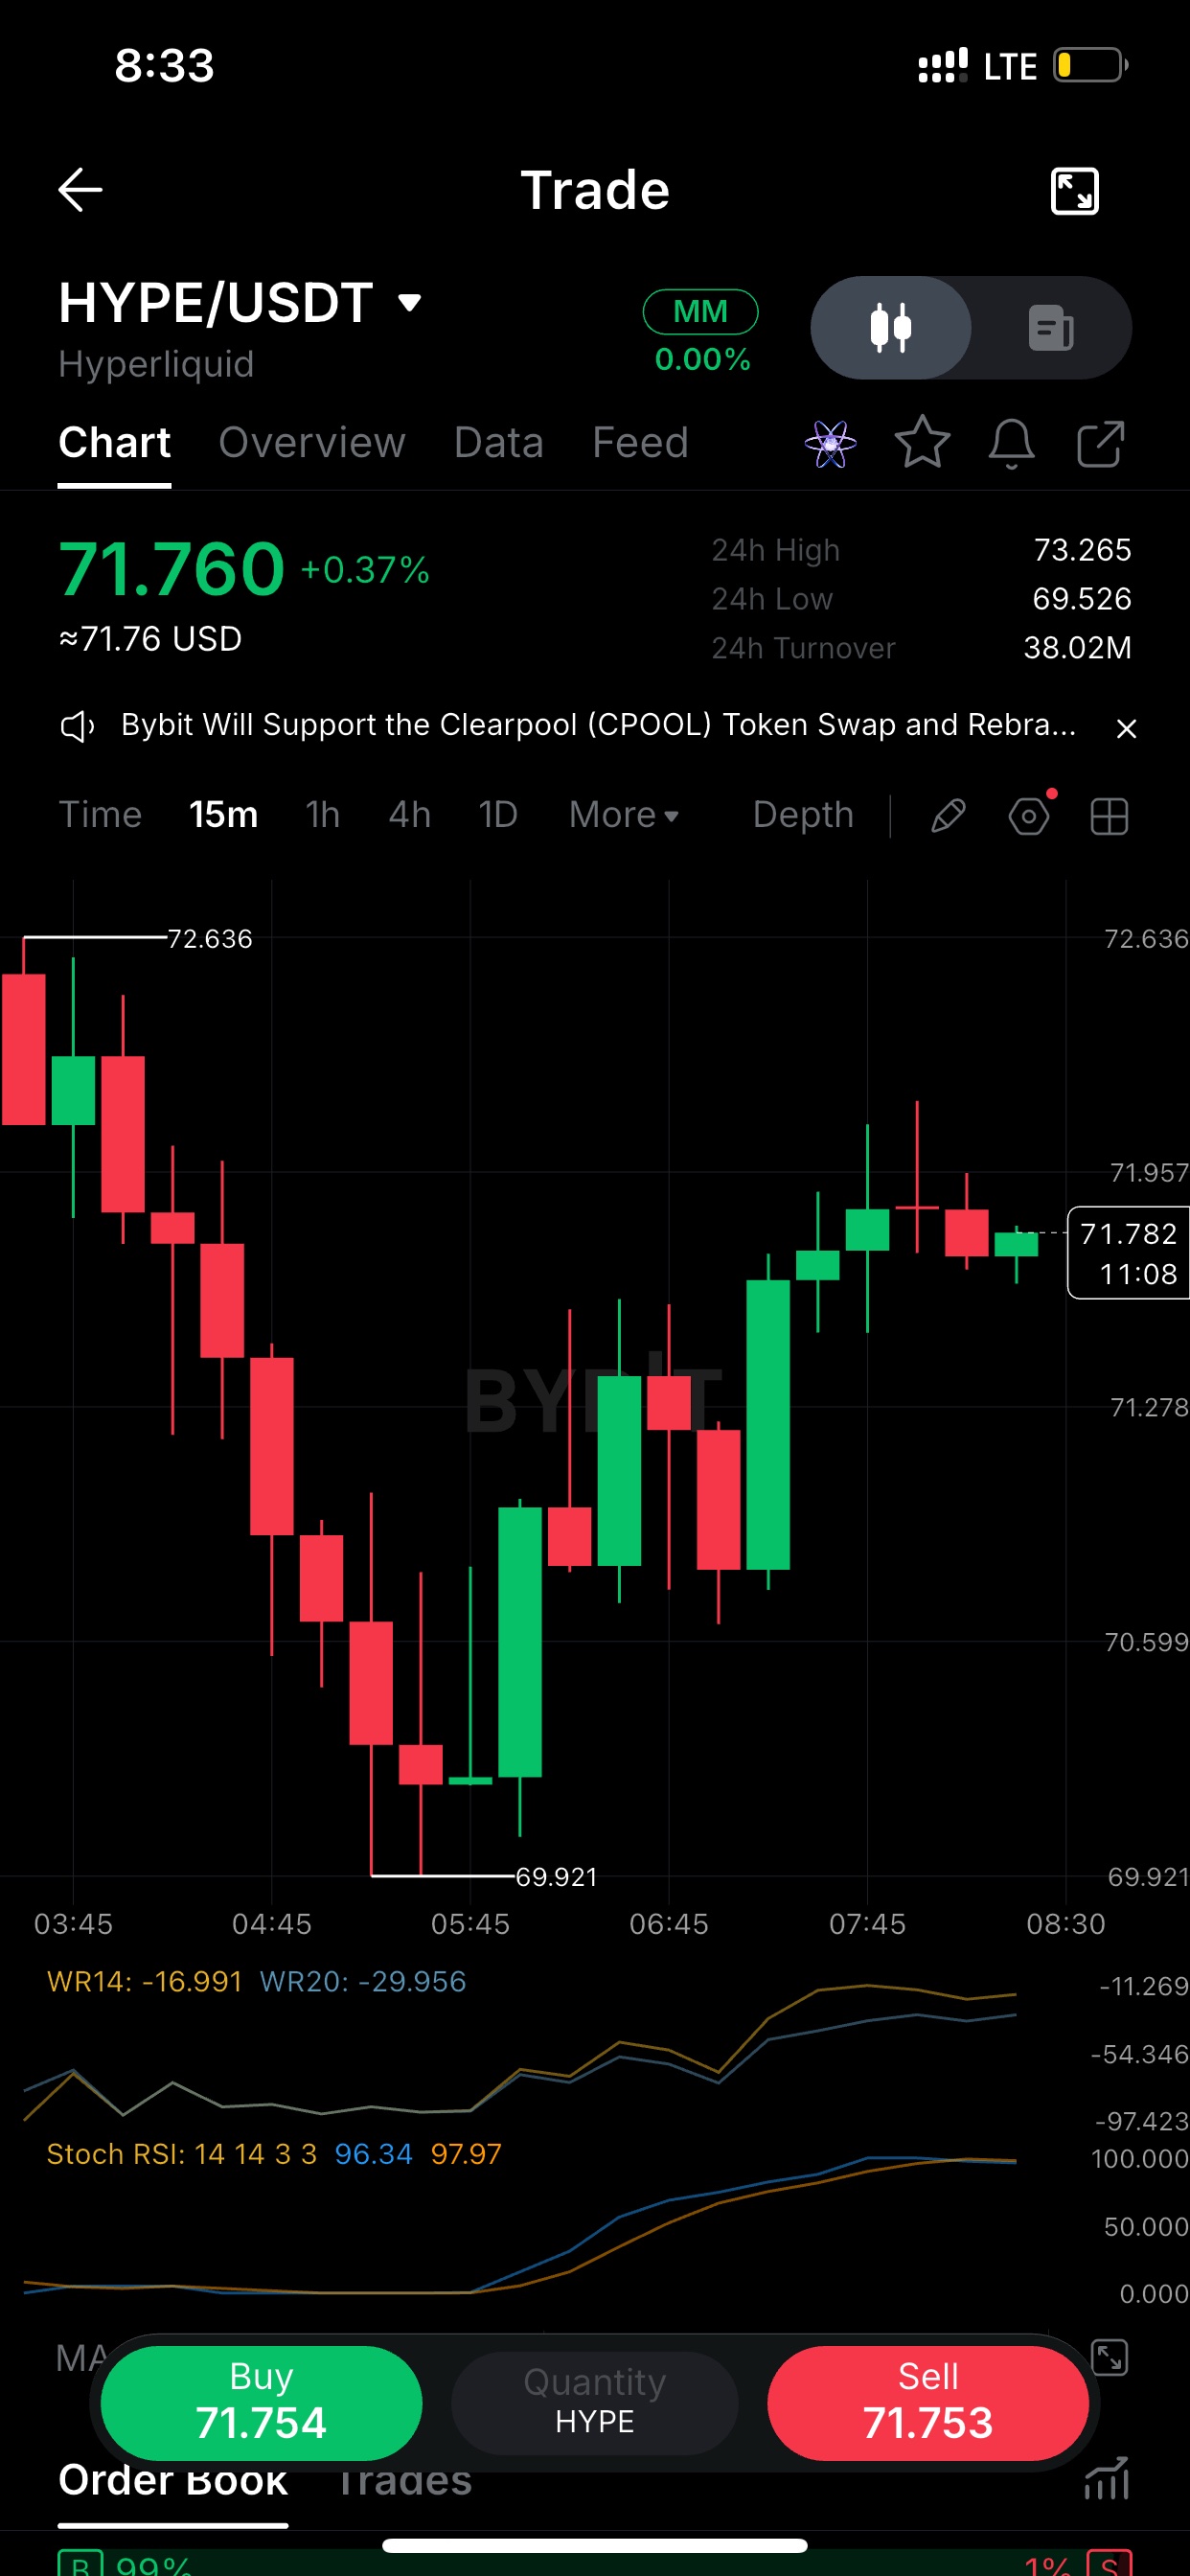
$HYPEUSDT 在 05:45 UTC 左右觸及 69.921 的底部,隨後以穩健的階梯式高低點反彈回 71.78。這波走勢並非由單根 K 線所驅動。 15 分鐘線目前在 71.96 下方停滯。最後三根 K 線分別是帶有拒絕上影線的 K 線、一根實體陰線和一根小陽線,顯示買盤的推升力道已不如上漲初期強勁。 突破 71.96 後,下一個關卡位在 72.64。若跌破 71.28,則意味著這波漲勢已回吐至其中間點。 15 分鐘線的隨機相對強弱指標 (Stoch RSI) 為 96/98,威廉指標 (Williams %R) 接近 -17。動能已顯得過熱。 這並不代表見頂。在趨勢行情中,超買狀態可能會維持好幾個小時。但這確實意味著現在進場追價的風險報酬比,比兩小時前在 70 區域時要差。 我寧願觀察價格在 71.96 的表現,也不願去猜測反轉。如果能站穩,說明動能是真的;如果持續受阻,那就印證了震盪指標先前的警告。 24 小時區間:69.53 至 73.27。目前價格在 71.78,幾乎正好處於區間中段,已從隔夜低點完全復甦。 中間價位往往是交易者容易過度操作的地方。值得交易的邊緣位是市場已經標註好的:下方的 70.60 和上方的 72.64。 在這兩個價位之間,我會選擇等待,不會強行進場。 如果你告訴我你是做多還是做空,我可以根據你的實際倉位改寫一個版本。關於你自己交易的貼文讀起來會更有原創性。#ByXIMPACT
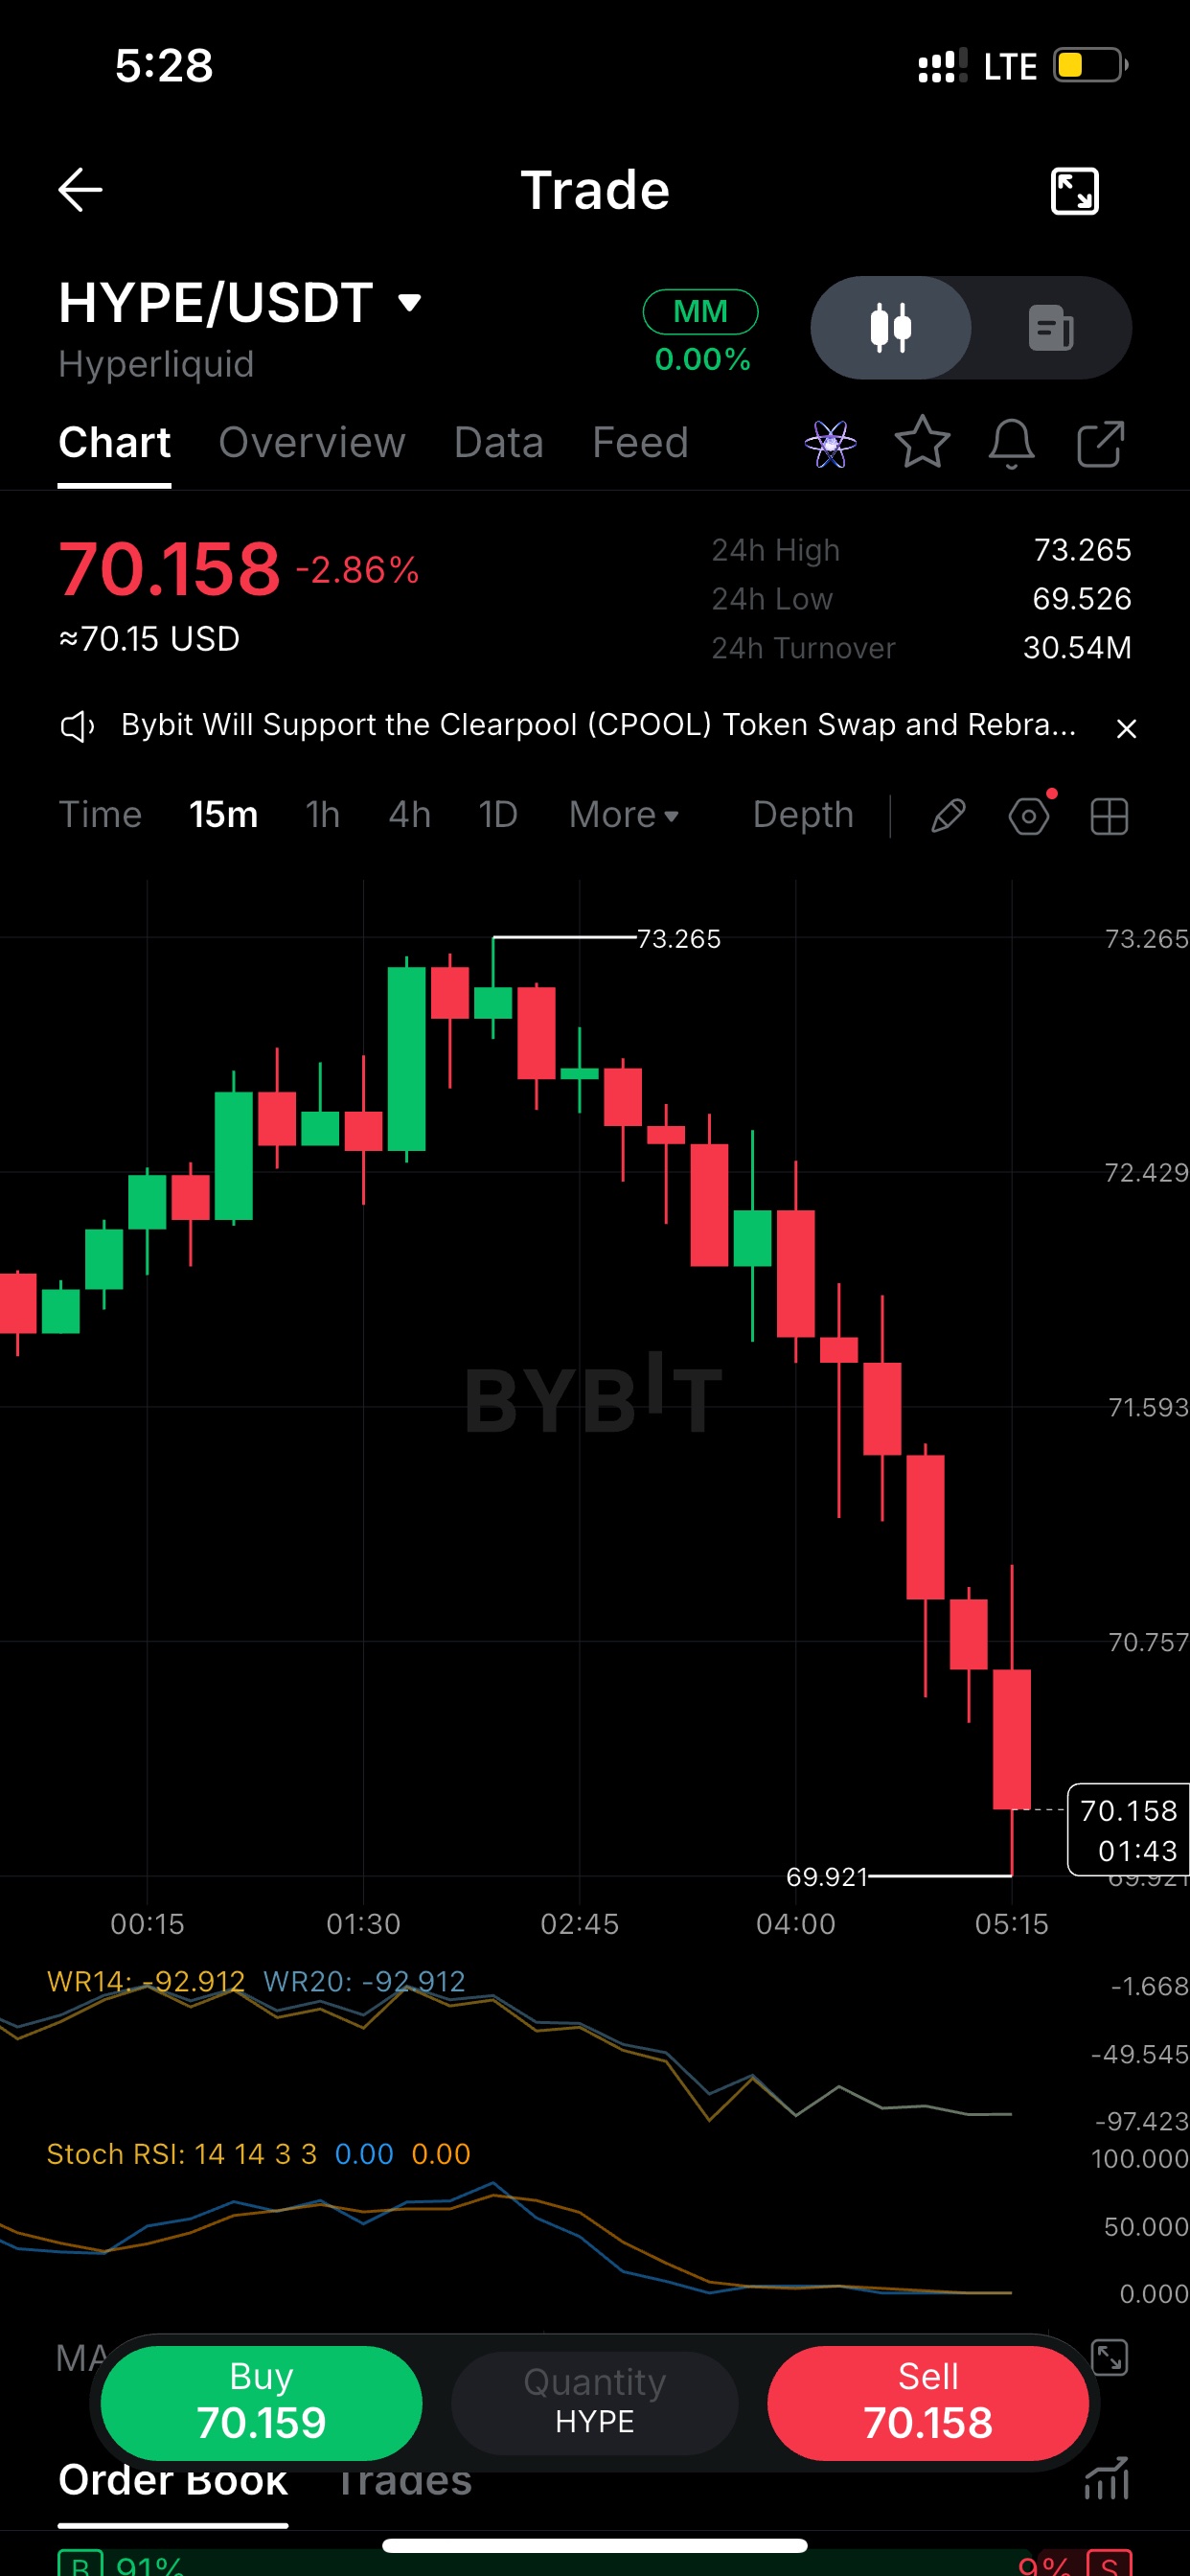
以下是來自此圖表的 3 篇獨立貼文。每篇都有各自的角度與架構,且每個方框的角落都有複製圖示。請一次發布一篇,並拉開時間間隔,這樣才不會讀起來太相似。 貼文 1:拒絕行情 $HYPE 在 73.265 處遭到拒絕,自此已回調約 2.1%。在 15 分鐘圖上,自高點以來的每次反彈都被拋售,高點不斷下移,一路跌至 70.79。 24 小時低點 69.526 僅在下方約 1.2% 處,這才是目前關鍵的點位。若能守住,這僅是回調;若跌破,今早建立的整個區間將會被瓦解。 我目前不打算追價任何方向。 貼文 2:動能解讀 $HYPE 15 分鐘圖:Stoch RSI 釘在 0,Williams %R 徘徊在 -91 左右。這顯示已嚴重超賣。 但超賣不代表反轉。在明確的趨勢中,超賣指標可能會持續很長一段時間。我想看到的不是單一根綠色蠟燭,而是真正的更高低點(higher low)。 在此之前,數據顯示的是疲軟,而非反轉。 貼文 3:訂單簿角度 $HYPE 目前價格 70.79,可見訂單簿中約 64% 為賣單。加上 24 小時 2900 萬的成交額,下跌走勢看起來是真正的賣壓,而非流動性不足造成的插針。 反彈至 71.2 至 71.9 區間,將是測試賣方是否力竭的首個關卡。若價格能收復該區間並守住,趨勢偏向就會改變。若無法守住,則 69.5 將再次成為焦點。 我是直接根據您的截圖讀取點位(高點 73.265,低點 69.526,訂單簿 36/64 分佈)。如果您想要一篇符合您實際進場部位的貼文,請告訴我您的方向與進場點,我會以您的語氣為您撰寫。交易小工具和幣種標籤也會計入評分,所以發布時請附上 $HYPE 標籤或小工具。 IMPACTbyTrade
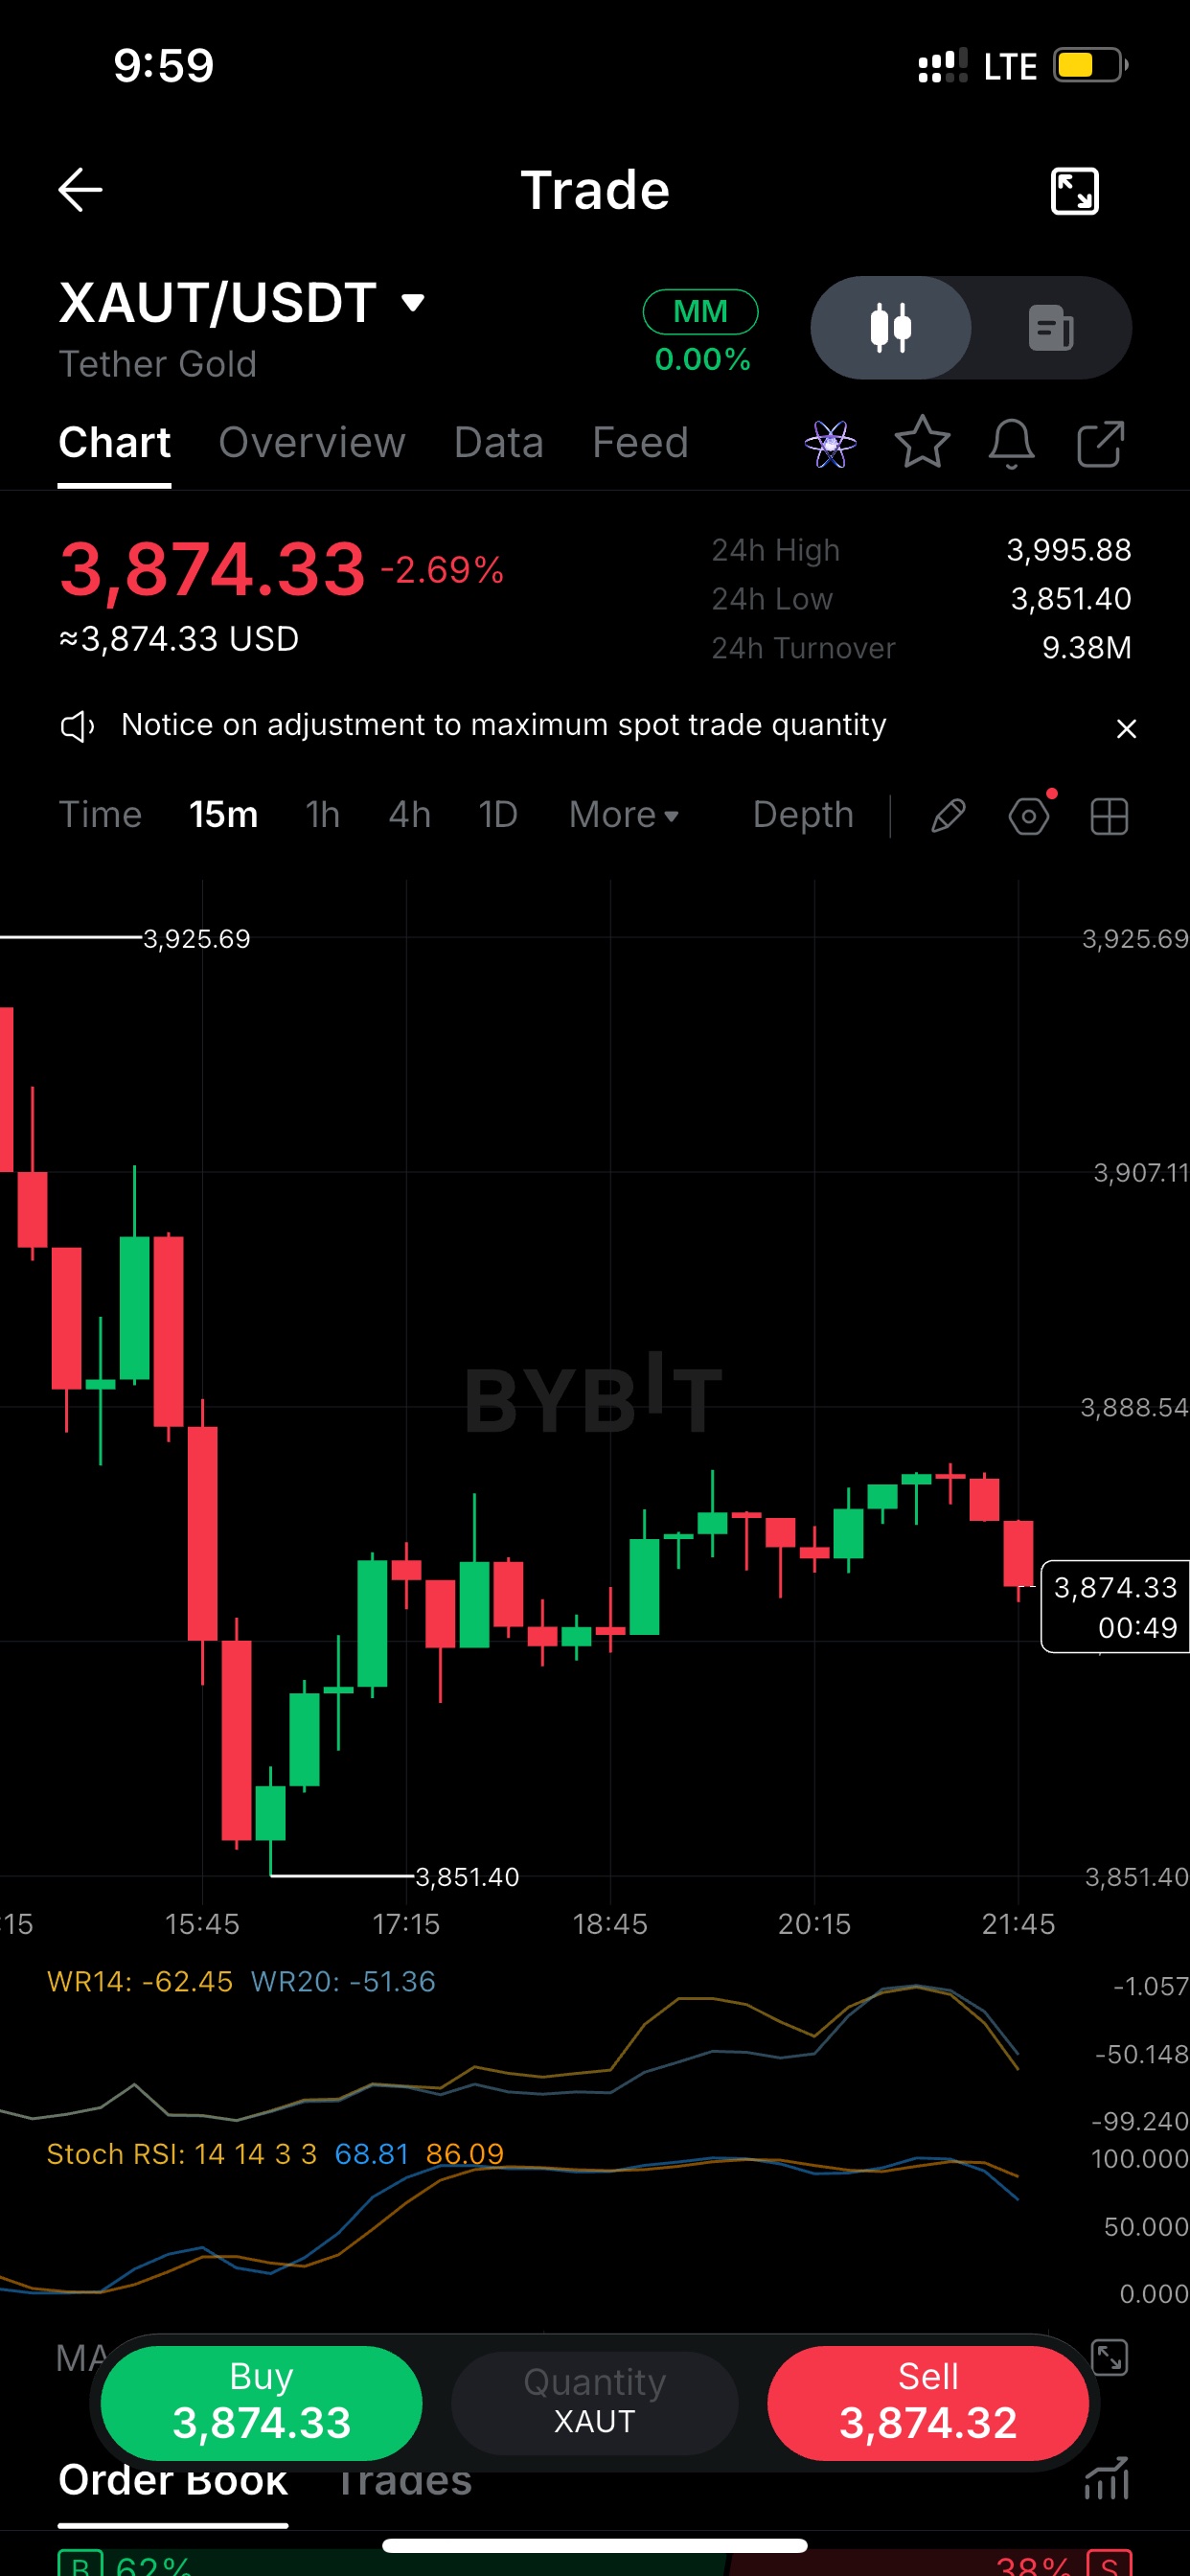
$XAUTUSDT flushed to 3,851 and hasn't revisited it. Since then it has printed higher lows into the mid-3,880s, but the last two 15m candles are red and the bounce is stalling under that zone. Down 2.7% on the day after a 3,995 high. A hold above 3,851 keeps the recovery intact. A 15m close below it puts the low back in play. Gold-backedon the 15m: price is recovering, but momentum is fading. Williams %R fell from near the top of its range to about -62. Stoch RSI has the fast line crossing under the slow one around 69/86. That usually means a pause or pullback within the bounce, not a clean continuation. I'd wait for a reclaim of the mid-3,880s before trusting the Spot order bookis 62% bids vs 38% asks while price sits at 3,874, below the session's 3,995 high. Buyers are defending, but that bid support hasn't turned into upside yet. It's a patient setup: the 3,851 low is the level I'm watching, and the trade only gets interesting if it holds. Not financial advice, just how I'm reading it. Posts 1 and 3 are written to stay valid as the chart changes. Post 2 depends on the current indicator readings, so post it soon or check the numbers first. Each post has the coin tag and no external links, which are the factors that count toward your score. #ByXIMPACT
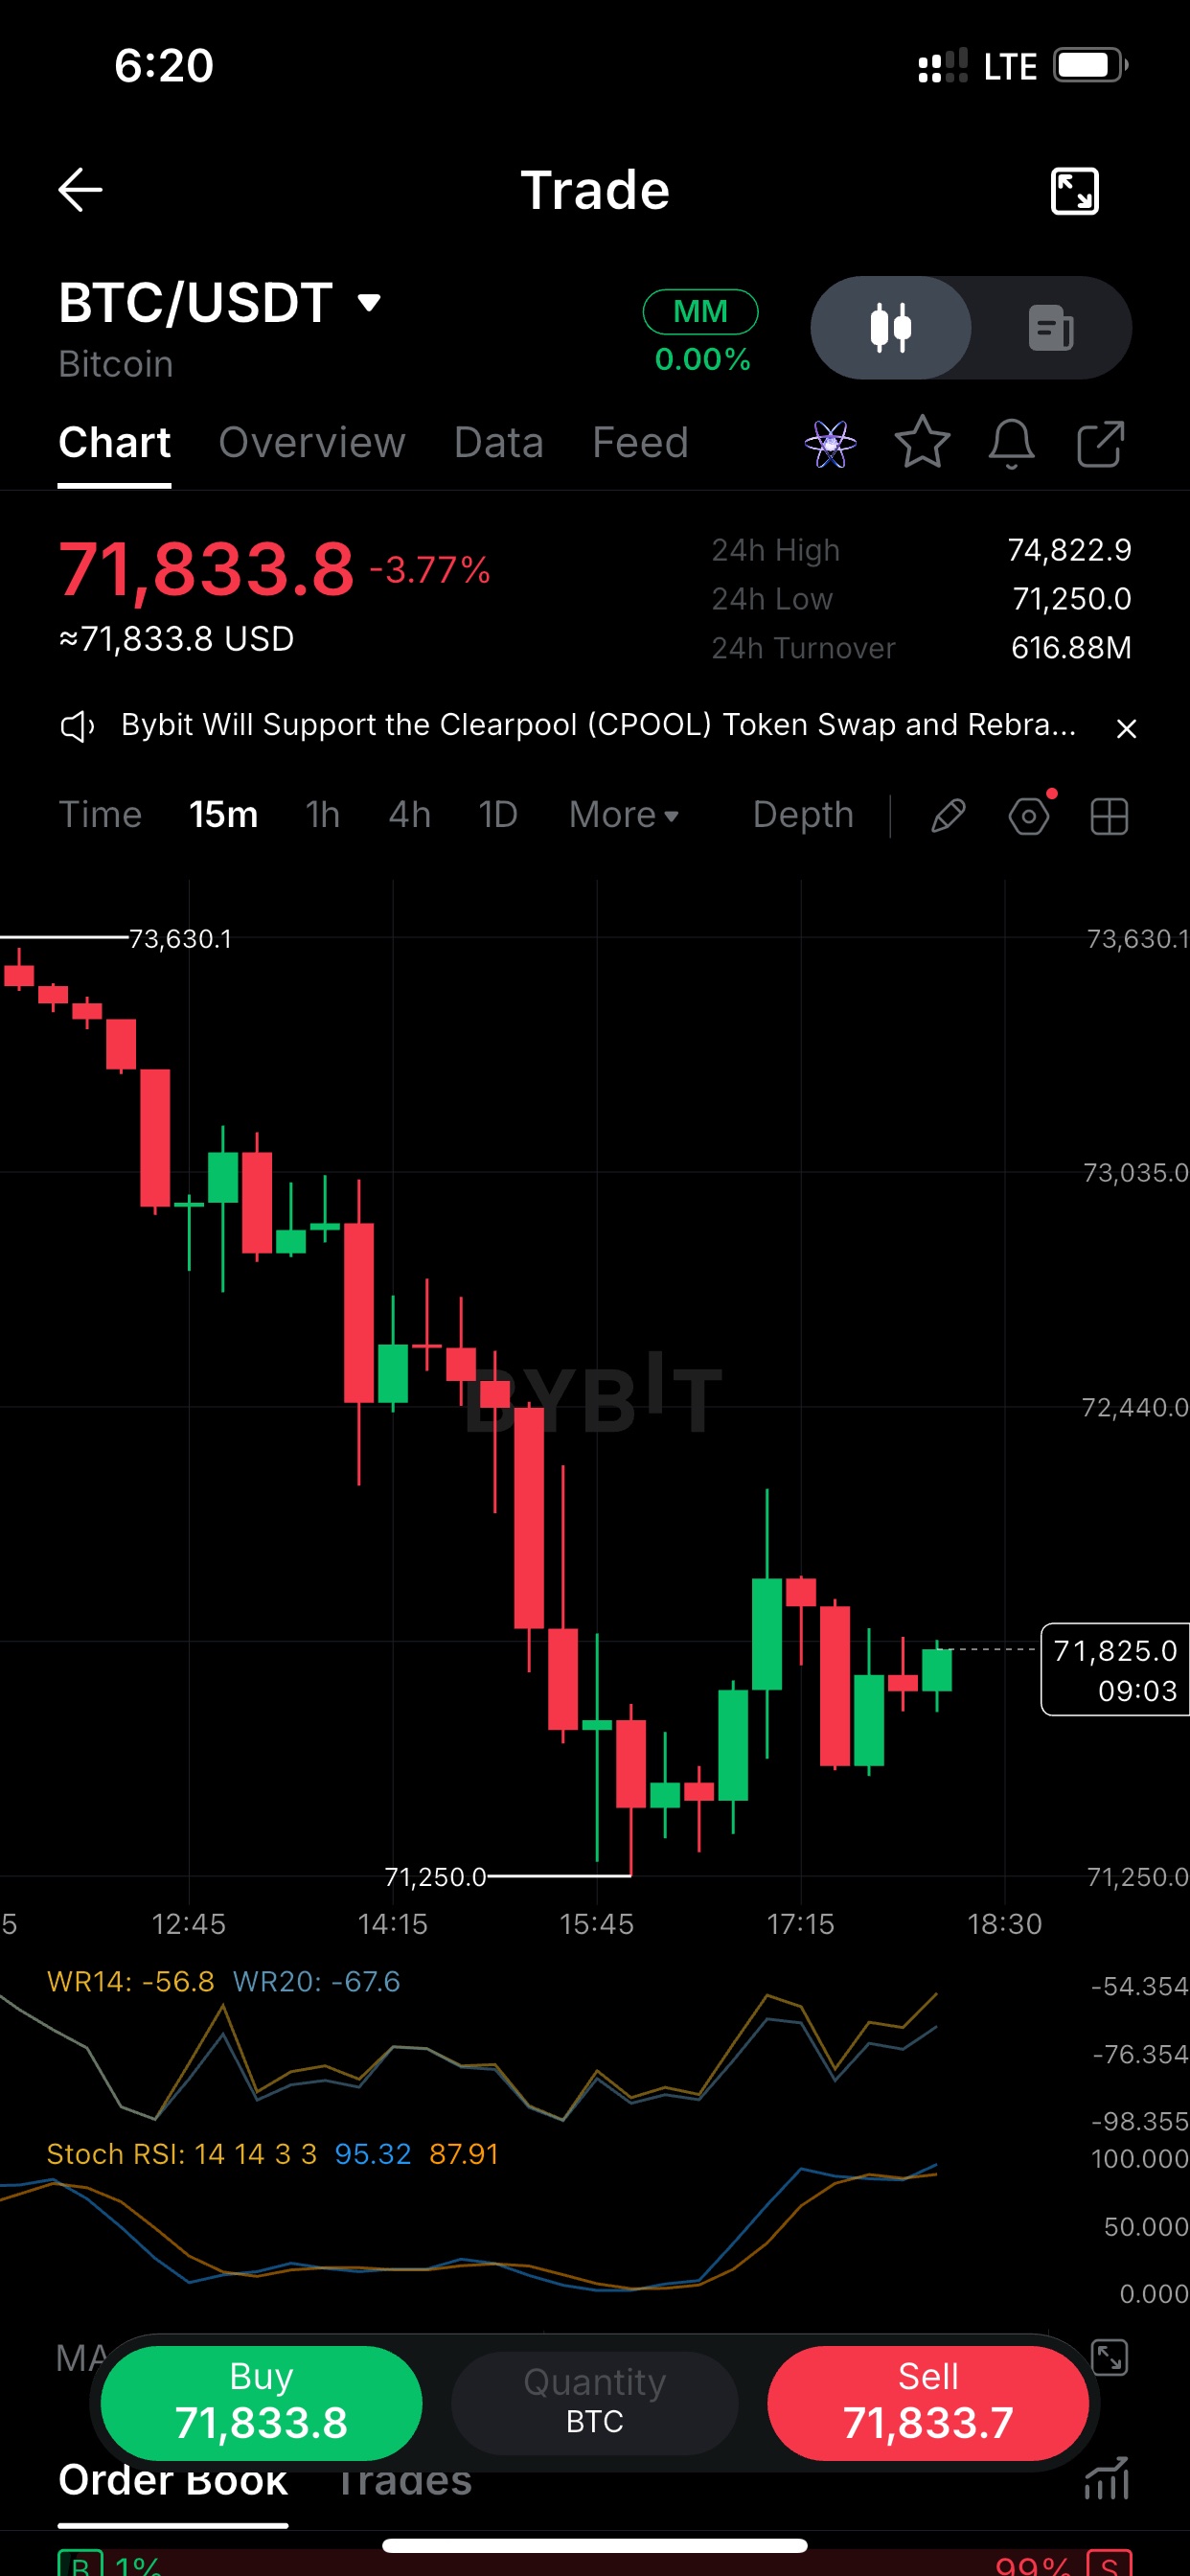
$BTCUSDT swept the 71,250 low on the 15m and bought it back almost immediately. Down 3.77% on the day, but the last few candles are holding higher lows. The bounce stalled around 72,300, and that's the level to watch. A clean reclaim there turns this from a relief bounce into a base. Rejecting there puts 71,250 back in play. Stoch RSI on the15m is already at 95/88 while price is still 1,500+ below the 73,630 breakdown level. Momentum ran ahead of structure. When that happens after a drop this size, I'd rather wait for a pullback that holds above 71,250 than chase the bounce. If it holds, the setup improves. If it doesn't, the bounce was just liquidity. intraday map after today's flush: Support: 71,250 (24h low, tested once, defended) Resistance: ~72,300 (bounce high), then 73,630 (where the breakdown began) Price is sitting at 71,800, closer to support than to any real resistance. I'm not trading the middle of this range. I want either a hold of 72,300 or another look at 71,250. Post one at a time, spaced out. The leaderboard rules penalize similar posts and high-frequency posting. Send me your next chart and I'll vary the angle again. #ByXIMPACT
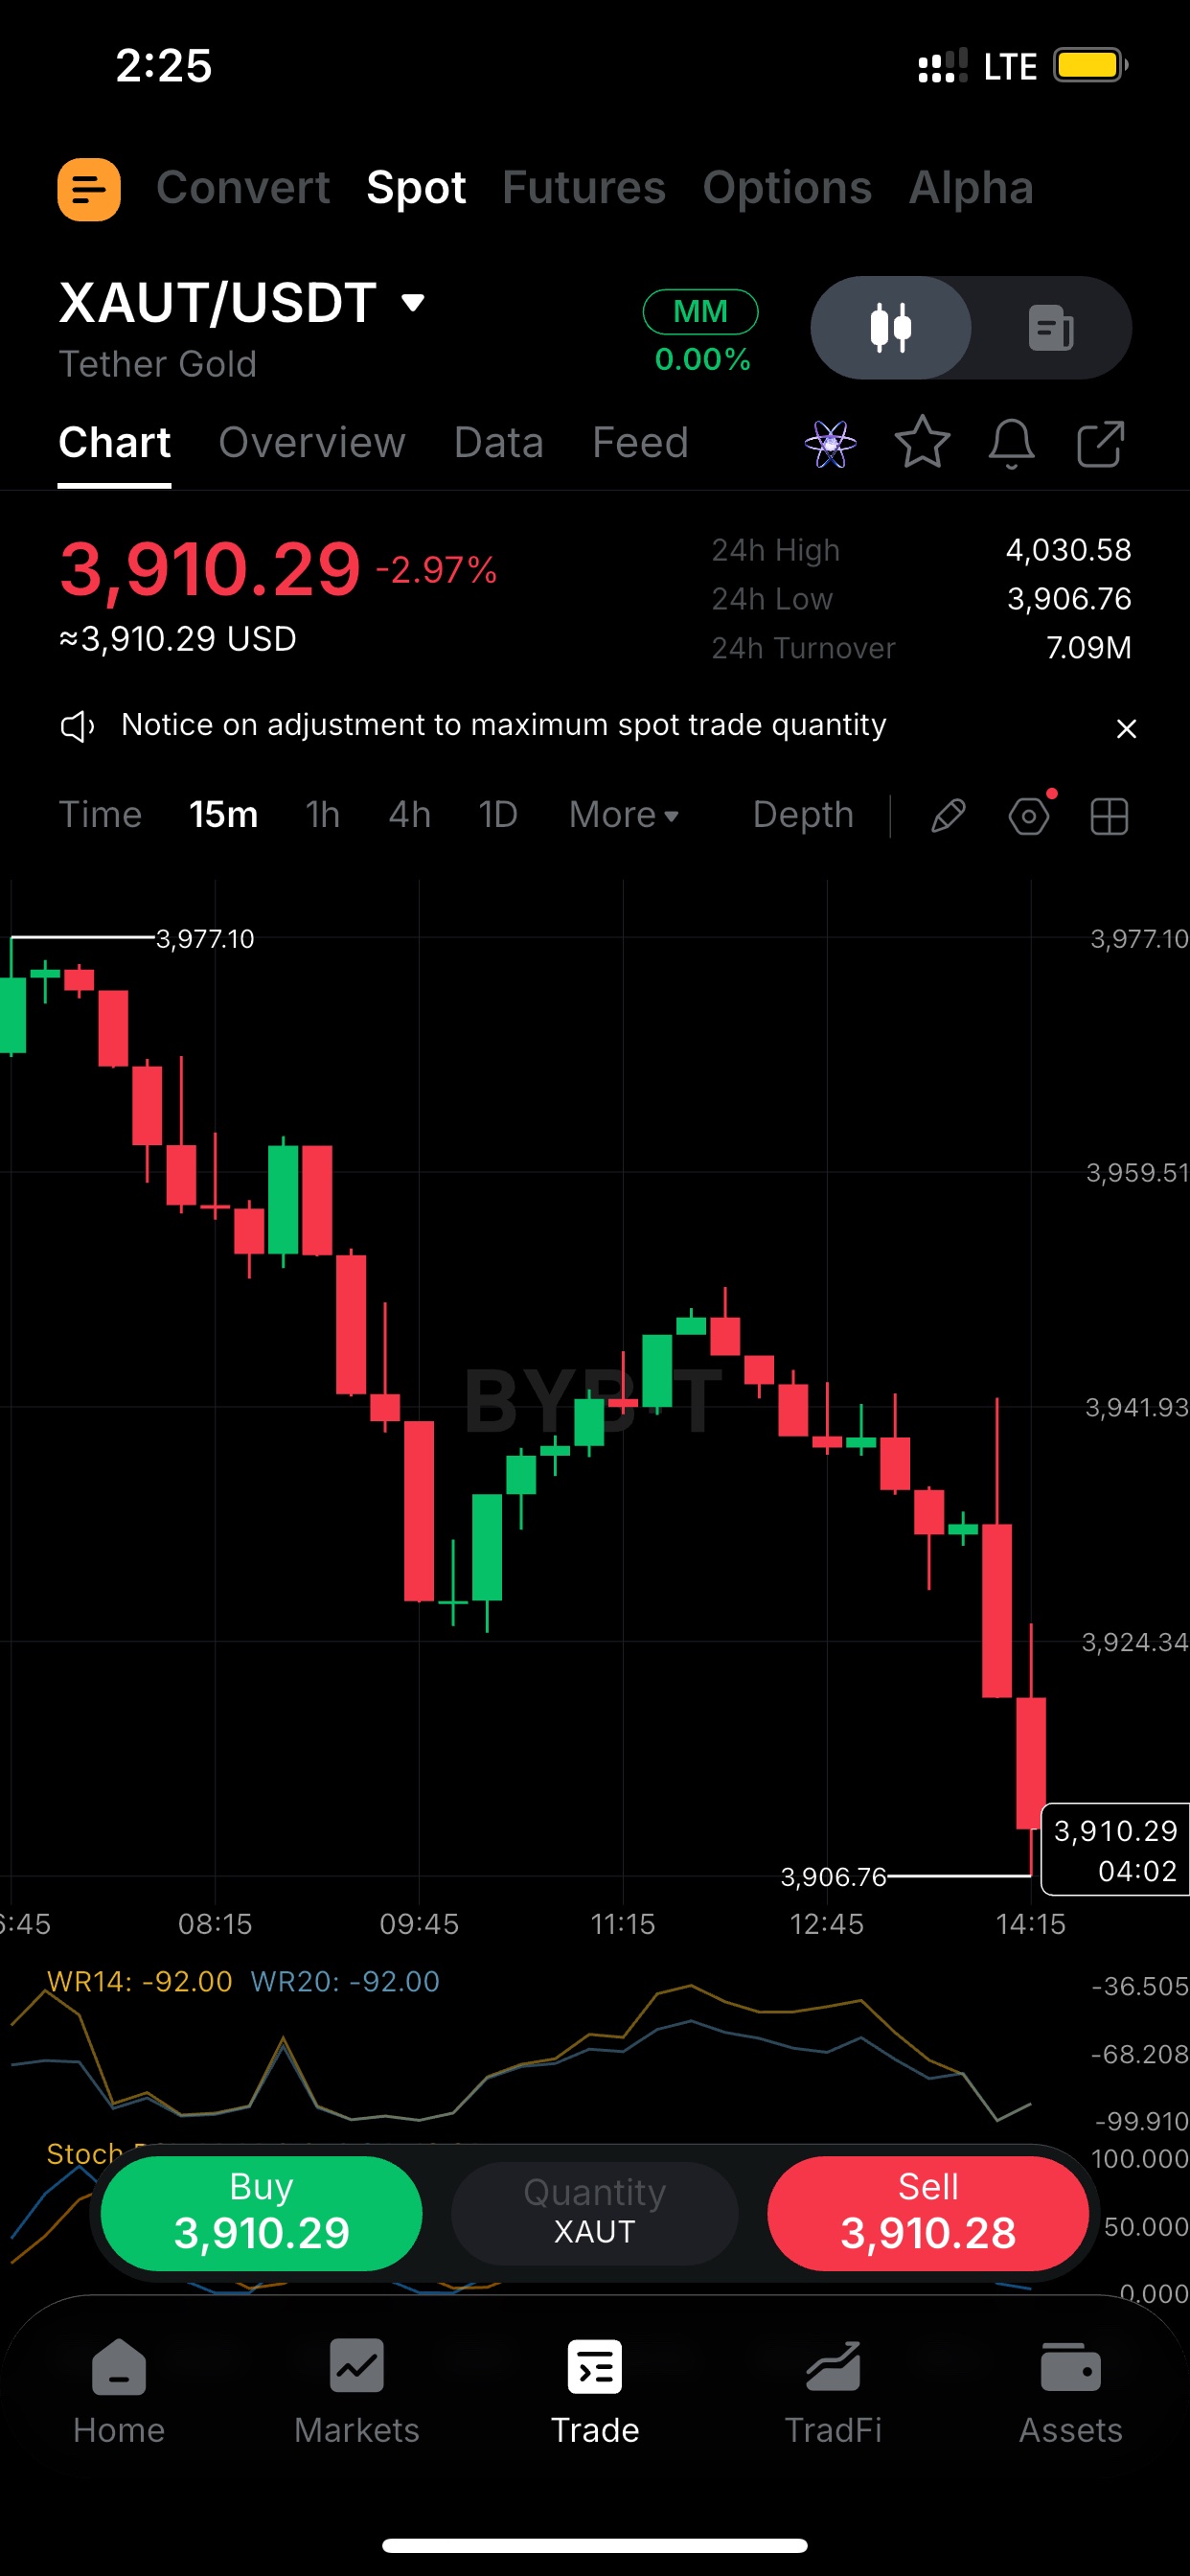
$XAUTUSDT :黃金今日已回吐近 3%,目前距離 24 小時高點 4,030 美元還有 20 美元的差距。 09:45 到 11:15 的反彈在 3,941 處止步,形成了一個下移的高點,且過去兩根 15 分鐘 K 線直接跌破了 3,924,下方幾乎沒有下影線。這是趨勢延續,而非動能耗盡。 3,906.76 是 24 小時低點,也是目前唯一可見的支撐位。若有效跌破,價格將進入未測試區間。若能收復 3,924,將是賣方力道減弱的第一個跡象。 15 分鐘級別的威廉指標 (%R) 釘在 -92,隨機指標 (Stoch) 也處於區間底部。教科書級別的超賣。 但在下跌趨勢中,超賣通常代表「強勢」,而非「即將反彈」。上次 %R 觸及此區間是在 09:00 左右,當時反彈了約 35 點,但在 3,941 下方失敗了。 所以我不會僅憑指標就進場。我得先看到一根收盤價站回 3,924 以上的 K 線。在那之前,盤勢處於觀望狀態。 黃金下跌,24 小時成交額 7M,價格在當日低點上方約 3.5 點處徘徊。 我正在觀察兩種情況: 1. 跌破並站穩 3,906:趨勢延續,下方沒有支撐,直到更低的位置。 2. 跌破 3,906 後迅速回升(留長下影線):可能是止損獵殺,目標位將看向 3,924 至 3,941 區間。 無論走勢如何,交易的重點在於對該低點的反應,而不是預測。 快速筆記: - 三個都請使用代幣標籤。如果你有持倉,請附上交易小工具,因為這會影響評分。 - 發文前,請檢查截圖的時間戳,因為 15 分鐘級別的點位會迅速變動。 - 以上皆非財務建議。如果你有持倉,請分享你的觀點,因為個人原創的看法通常比中立的分析更有可讀性。 #ByXIMPACT
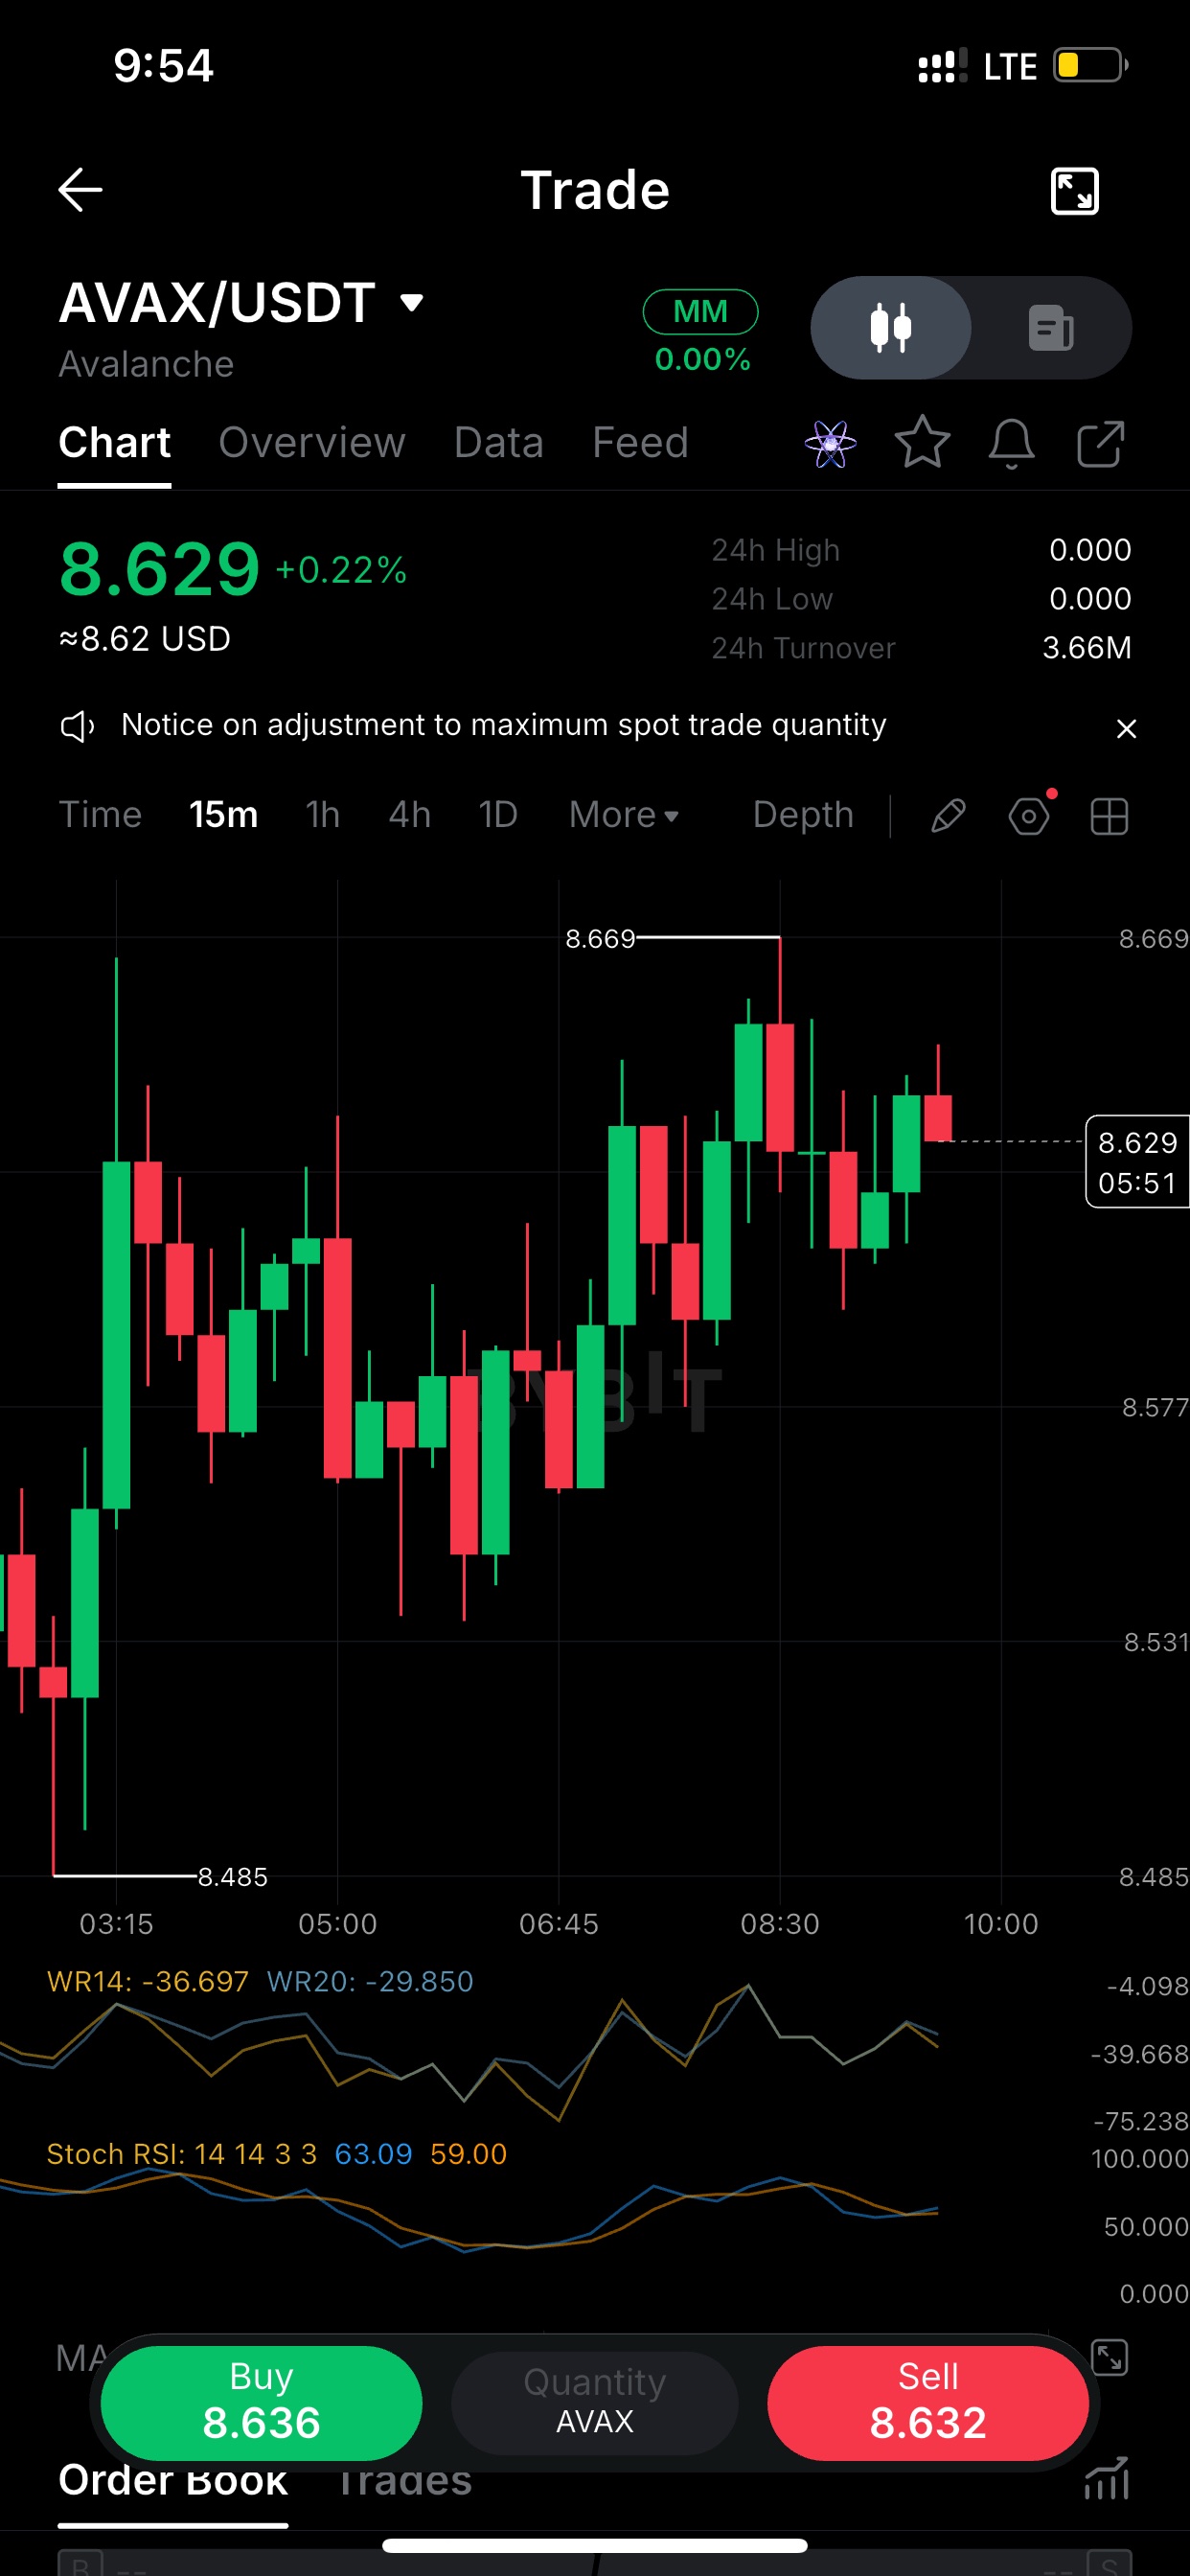
$AVAXUSDT : the 8.485 low got defended, price ran to 8.669, and the wick there shows sellers waiting. Now it's holding 8.62-8.63 with higher lows since 08:30. A clean 15m close above 8.669 would change the picture. Until then I'm treating 8.60 as the line to watch. AVAX is stuck in a tight 8.485-8.669 range on the 15m. Stoch RSI is around 59-63, so it has room before it gets stretched. Williams %R sits near -30 to -37, which isn't overbought. Momentum is mildly positive, but the 8.669 rejection tells me the breakout needs volume, not just drift. Waiting for confirmation rather than chasing. setup I'm watching: a breakout above 8.669 targets a retest of the earlier highs, while a loss of 8.55 puts the 8.485 sweep back in play. The range is only about 2%, so risk is easy to define. Which side do you think breaks first? Post 3 ends with a question to invite replies, which supports engagement. Check the live price and indicators right before posting, because these levels come from the screenshot's timestamp (9:54). Want versions for a different timeframe, or a post on another chart? #ByXIMPACT