Sajid Khan
1579點贊0分享47粉絲73關注
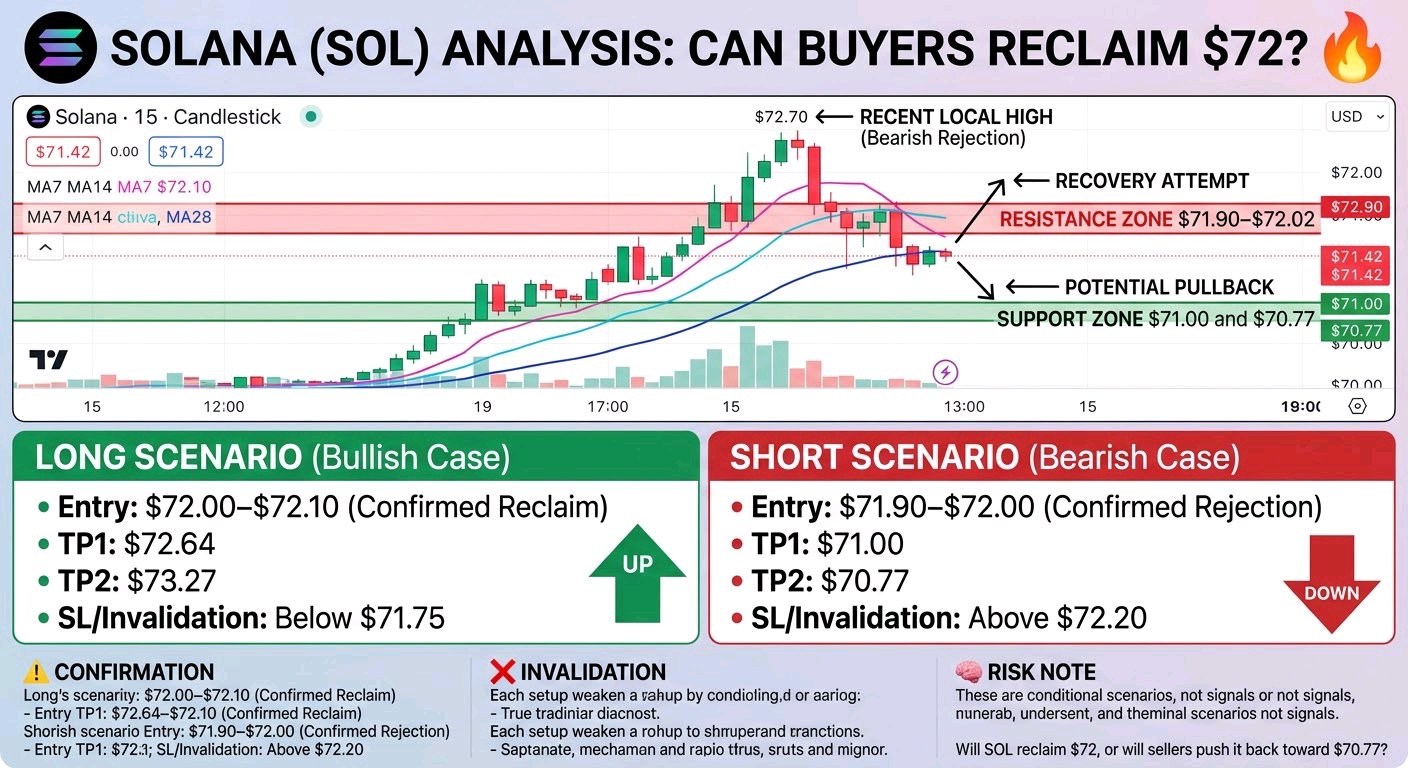
$SOLUSDT Faces a Critical Test: Can Buyers Reclaim $72? SOL is trading at $71.42, up 5.09% over 24 hours. However, the 15-minute chart shows a sharp pullback from the recent local high, followed by a small recovery. The next move around the moving-average resistance could determine short-term direction. Market Structure: Short-term structure looks bearish after the rejection near $72.6–$72.7. Price is currently below MA7 ($71.47), MA14 ($71.94), and MA28 ($71.90), showing that sellers still have an advantage. Key Support: $71.00 and $70.77 Key Resistance: $71.90–$72.02 and $72.64–$72.70 Potential Setup: LONG Scenario Entry: $72.00–$72.10 after a confirmed reclaim TP1: $72.64 TP2: $73.27 SL / Invalidation: Below $71.75 SHORT Scenario Entry: $71.90–$72.00 if price faces a confirmed rejection TP1: $71.00 TP2: $70.77 SL / Invalidation: Above $72.20 Confirmation: A strong 15-minute close above $72.00 could support a recovery attempt. Continued rejection around the moving averages may favor another move toward support. Invalidation: A sustained breakout above the resistance zone weakens the bearish scenario, while a decisive breakdown below $70.77 invalidates the current support-based recovery idea. Risk Note: These are conditional chart scenarios, not guaranteed signals. Wait for confirmation, manage position size, and always use appropriate stop-loss protection. Do you think SOL can reclaim $72, or will sellers push it back toward $70.77? #ByXIMPACT
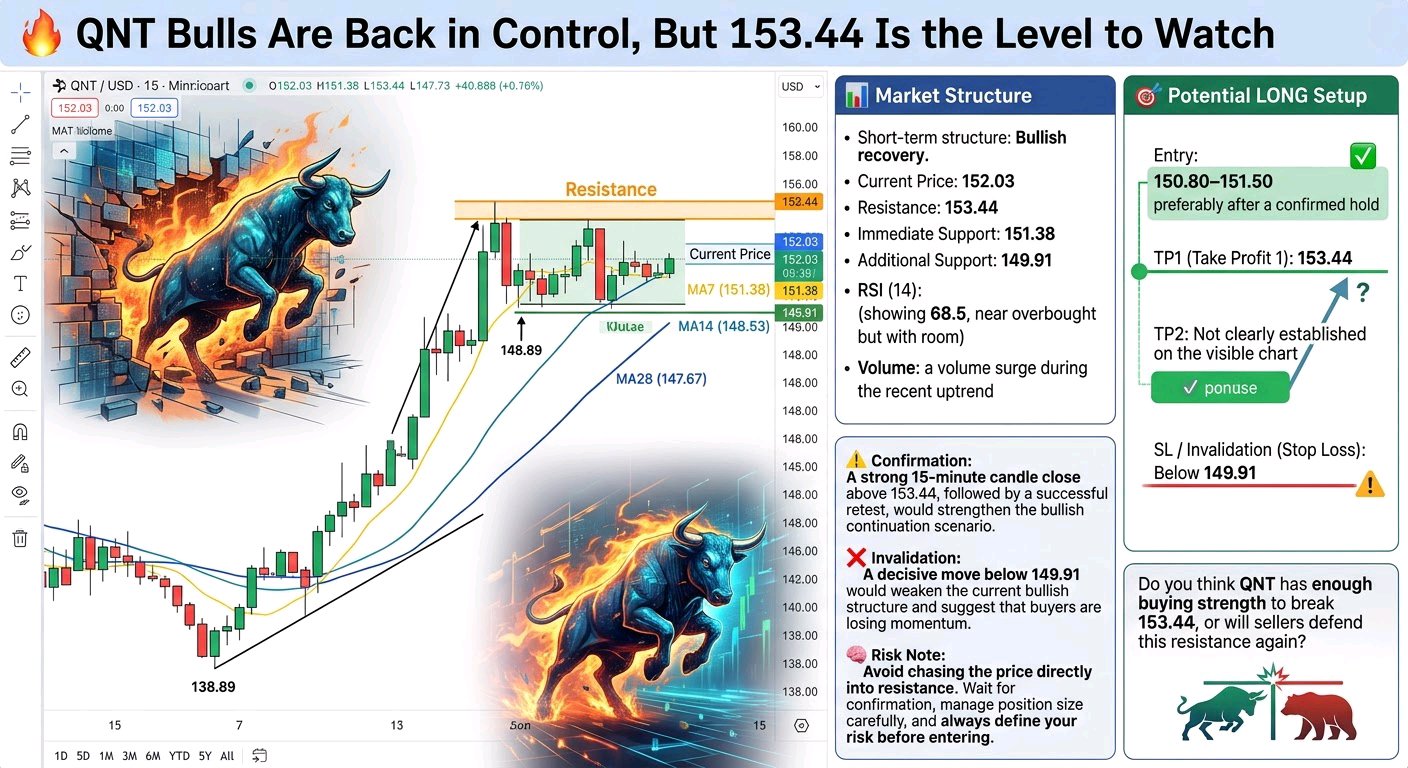
$QNTUSDT 多頭重掌局勢,但 153.44 是關鍵關注點 QNT 在 15 分鐘線圖上顯示出令人鼓舞的復甦跡象。在 138.89 附近觸底後,買方強勢將價格推升至 153.44。目前市場在 152.03 附近出現短暫停頓。圍繞阻力位的下一個走勢將決定這種復甦是否能持續。 市場結構: * 短期結構:看漲復甦。 * 當前價格:152.03 * 阻力位:153.44 * 即時支撐位:151.38 * 額外支撐位:149.91 * MA7:151.38 * MA14:148.53 * MA28:147.67 價格目前運行在所有三條移動平均線之上,顯示買方在短期內佔據優勢。然而,153.44 的阻力位仍然是一個重要的障礙。 潛在做多(LONG)設置: 進場點:150.80–151.50,最好在確認站穩後進場。 TP1(止盈目標 1):153.44 TP2(止盈目標 2):在目前的圖表上尚未明確標示。 SL / 失效點(止損):149.91 以下。 確認信號: 若出現強勁的 15 分鐘 K 線收盤站上 153.44,隨後成功回測,將加強看漲延續的劇本。 失效情形: 若價格明確跌破 149.91,將削弱當前的看漲結構,並暗示買方正在失去動能。 風險提示: 避免直接追高衝擊阻力位。請等待確認信號,謹慎管理倉位,並在進場前務必設定好風險範圍。 你認為 QNT 有足夠的買盤力道突破 153.44 嗎?還是賣方會再次捍衛這個阻力位? #ByXIMPACT
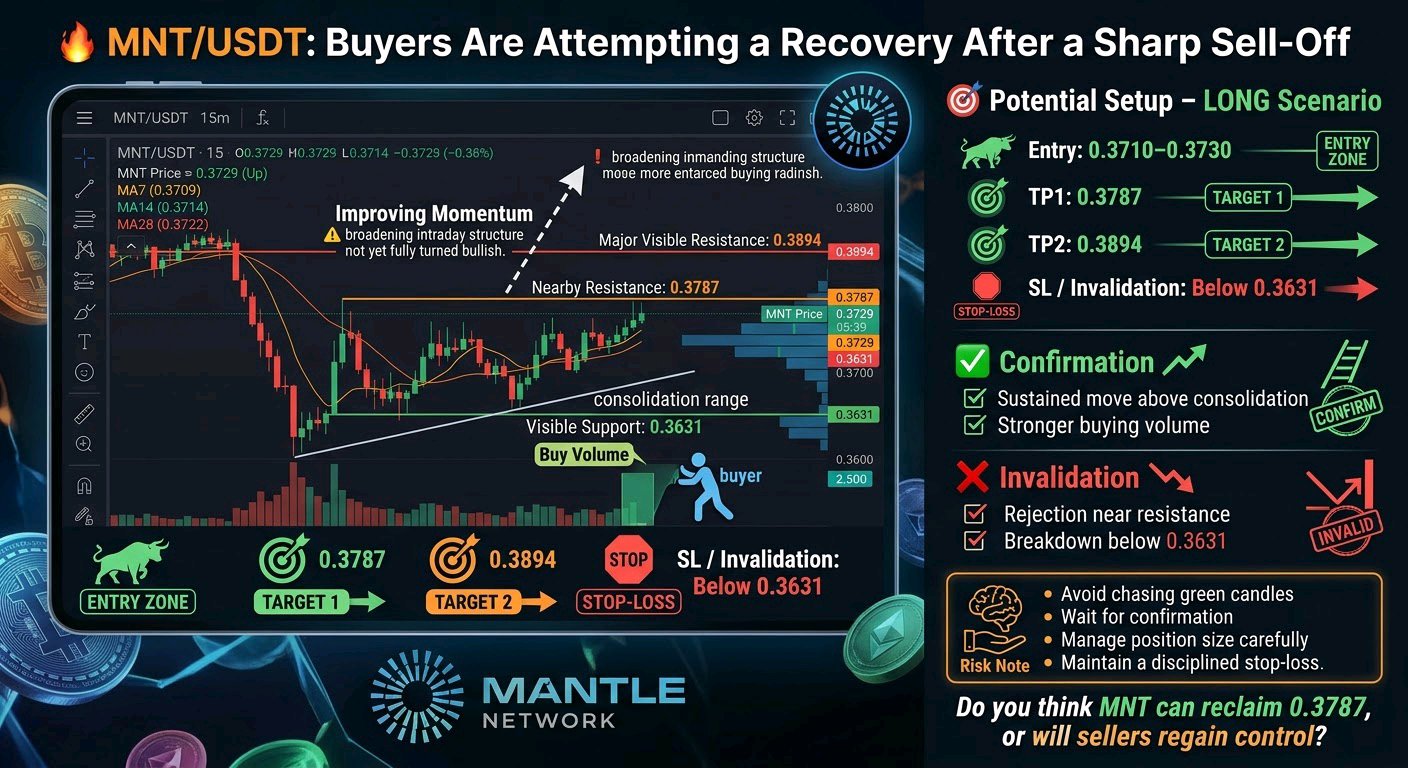
$MNTUSDT 買方正試圖在急劇拋售後展開反彈 MNT 在強勁下跌後出現了初步的復甦跡象。目前價格約為 0.3729,高於可見低點 0.3631,但買方仍需證明他們有能力突破附近的阻力位。 市場結構: 15 分鐘圖表顯示,價格從 0.3894 區域急劇下跌,隨後出現反彈並進入橫盤整理。目前價格在 MA7 (0.3709)、MA14 (0.3714) 和 MA28 (0.3722) 上方運行,顯示短期動能有所改善。然而,更廣泛的日內結構尚未完全轉為看漲。 可見支撐位:0.3631 附近阻力位:0.3787 主要可見阻力位:0.3894 潛在策略 – 做多 (LONG) 情境: 入場點:0.3710–0.3730 指標一 (TP1):0.3787 指標二 (TP2):0.3894 止損 / 失效點 (SL):0.3631 以下 確認訊號: 若價格能持續站穩在近期盤整區間上方,並伴隨更強的買盤量能,將有利於看漲情境。 失效條件: 若在阻力位附近遇阻回落,隨後跌破 0.3631,則該復甦設置將失效,看跌前景將增強。 風險提示: 避免追高。請等待確認訊號、謹慎管理倉位,並嚴格執行止損。 你認為 MNT 能否收復 0.3787,還是賣方會重新奪回主導權? #ByXIMPACT
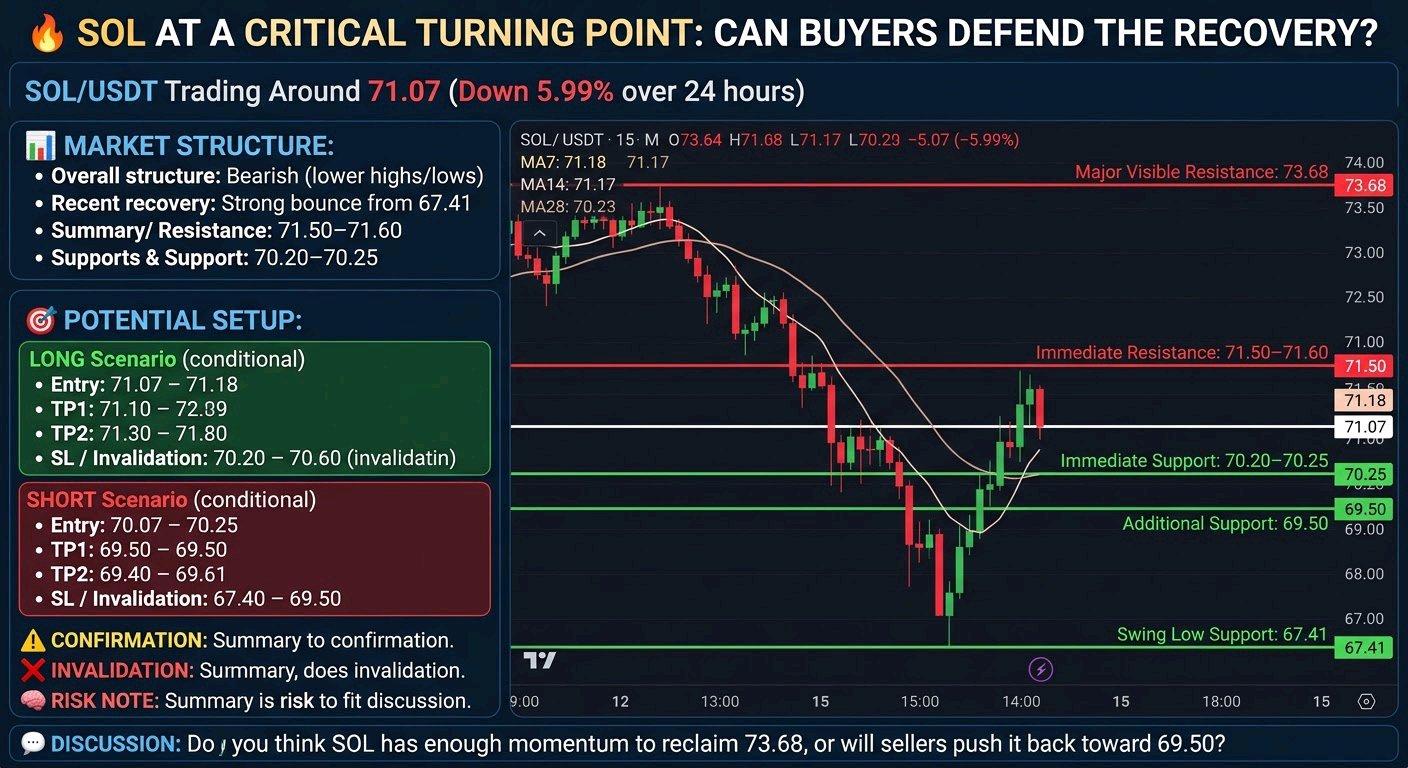
$SOLUSDT at a Critical Turning Point: Can Buyers Defend the Recovery? SOL/USDT is trading around 71.07, down 5.99% over 24 hours. The 15-minute chart shows a significant decline followed by a sharp recovery from 67.41. However, the latest candles suggest that bullish momentum is cooling near 71.50–71.60 resistance. Market Structure: * Overall structure: Bearish, with lower highs and lower lows. * Recent recovery: Strong bounce from 67.41. * Immediate resistance: 71.50–71.60. * Major visible resistance: 73.68. * Immediate support: Around 70.20–70.25. * Additional support: 69.50, followed by 67.41. MA7 (71.18) and MA14 (71.17) are slightly above the current price, while MA28 (70.23) remains below it. This suggests short-term hesitation after the rebound. Potential Setup: LONG Scenario (conditional) Entry: 71.20–71.60 after a confirmed breakout and successful retest. TP1: 71.60 TP2: 73.68 SL / Invalidation: Below 70.20 SHORT Scenario (conditional) Entry: 71.20–71.55 after clear rejection from resistance. TP1: 70.23 TP2: 69.50 SL / Invalidation: Above 71.75 Confirmation: For buyers, a strong 15-minute candle close above 71.60 would improve the recovery outlook. For sellers, rejection around resistance followed by a break below 70.20 would strengthen bearish continuation. Invalidation: A sustained breakout above resistance weakens the short scenario, while a breakdown below 70.20 weakens the immediate bullish recovery scenario. Risk Note: The market is sitting between short-term resistance and support. Avoid chasing candles. Wait for confirmation, use controlled position sizing, and always protect your capital with a defined stop-loss. Discussion: Do you think SOL has enough momentum to reclaim 73.68, or will sellers push it back toward 69.50? #ByXIMPACT
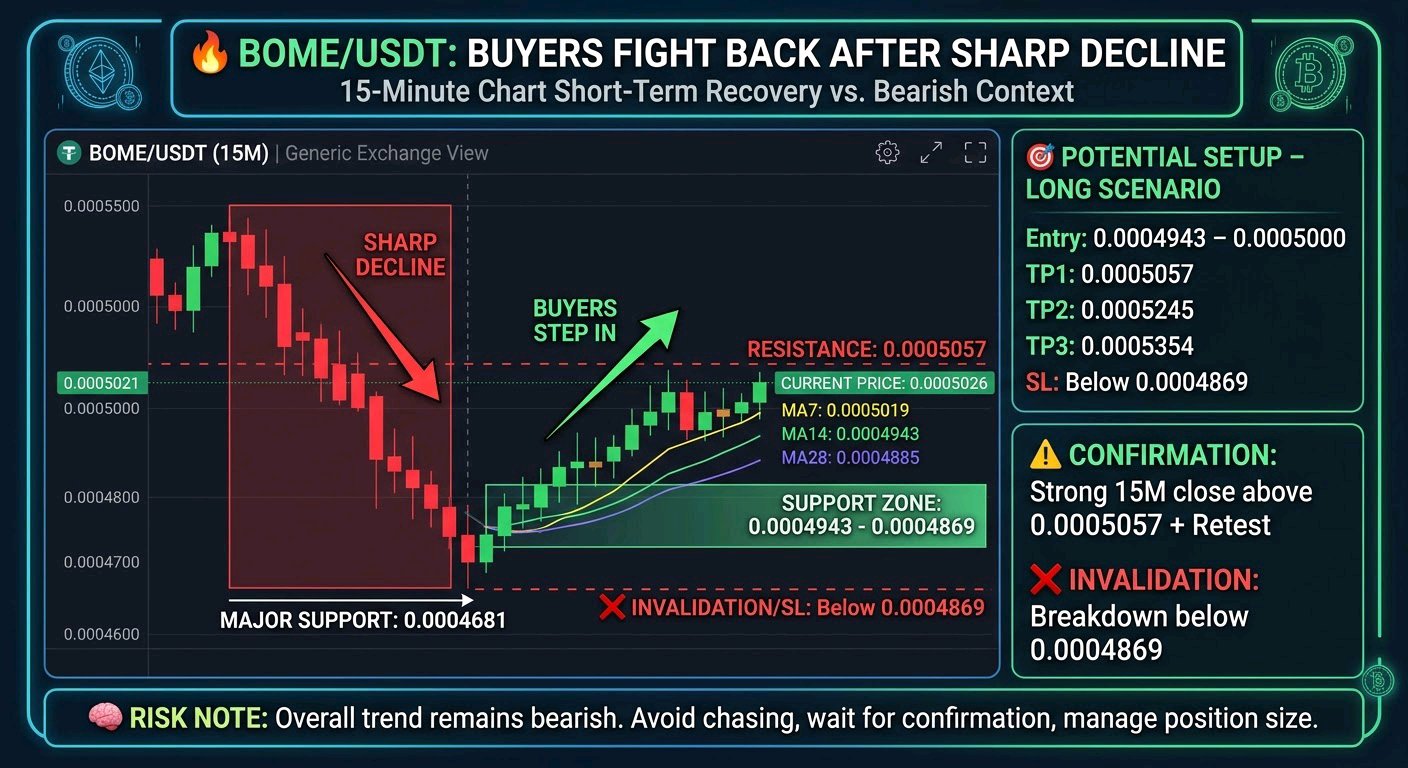
$BOMEUSDT 買方在急劇下跌後展開反擊 BOME 在 15 分鐘線圖上顯示出令人鼓舞的短期復甦跡象,但大局仍需謹慎。在跌至 0.0004681 附近後,買方進場並將價格推回 0.0005026。現在的問題是,這種復甦能否轉化為更強勁的反轉。 市場結構: 在經歷了之前的下跌走勢後,整體結構依然看跌。然而,短期動能已有所改善。 當前價格:0.0005026 MA7:0.0005019 MA14:0.0004943 MA28:0.0004885 價格目前位於三條移動平均線之上,顯示短期走勢有所增強。 支撐位:0.0004943 – 0.0004869 主要支撐位:0.0004681 阻力位:0.0005057 潛在設置 – 做多 (LONG) 場景: 進場點:0.0004943 – 0.0005000 止盈 1 (TP1):0.0005057 止盈 2 (TP2):0.0005245 止盈 3 (TP3):0.0005354 止損 / 失效點 (SL):低於 0.0004869 確認訊號: 若 15 分鐘 K 線強勢收於 0.0005057 上方,並成功完成回測,將增強看漲預期。 失效點: 若跌破 0.0004869,可能會削弱復甦力道,並考驗 0.0004681 附近的主要支撐位。 風險提示: 整體趨勢尚未完全反轉。避免追高,請審慎管理倉位大小,並在考慮進場前等待確認訊號。 你認為 BOME 能否突破 0.0005057 並持續復甦,還是賣方會再次奪回主導權? #ByXIMPACT
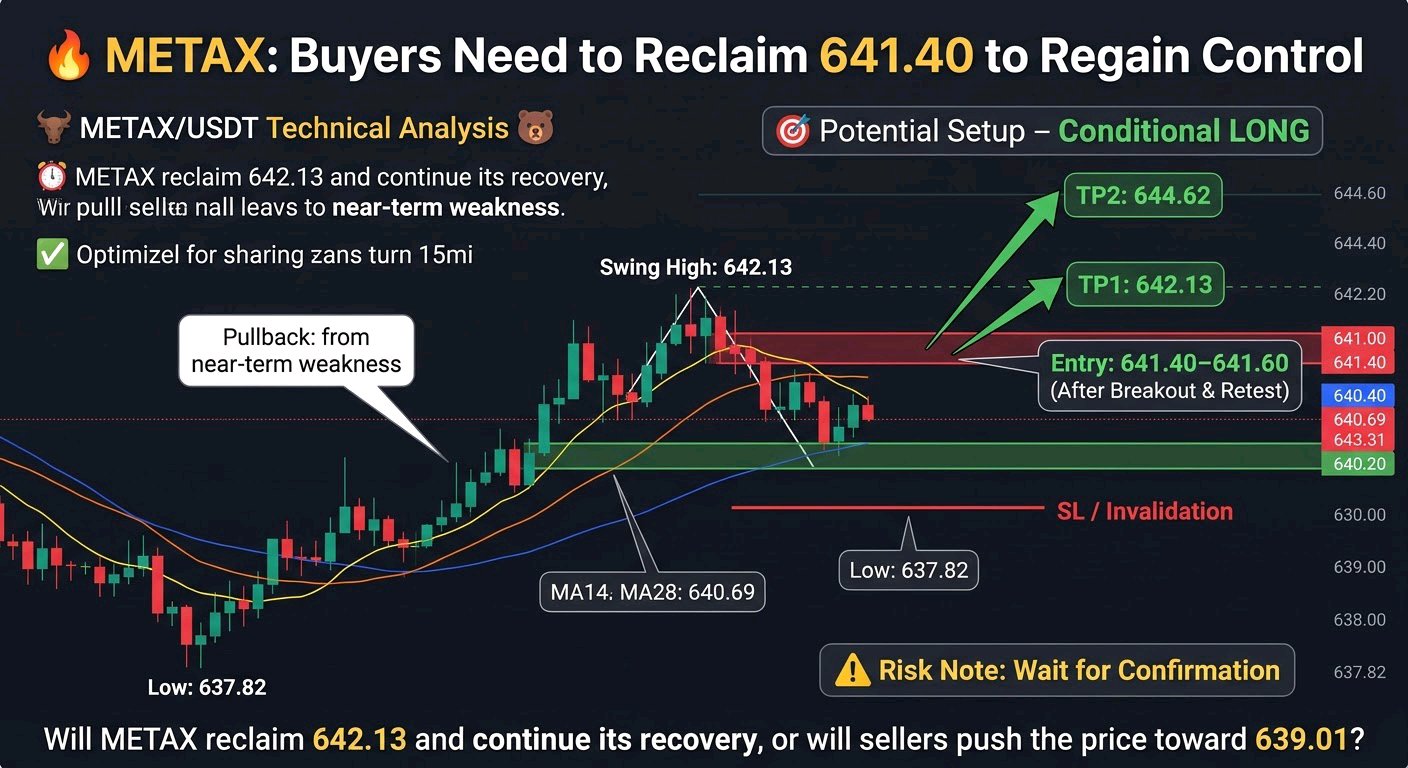
$METAXUSDT Buyers Need to Reclaim 641.40 to Regain Control METAX/USDT is showing an interesting recovery structure on the 15-minute chart, but the latest candles suggest that short-term buying momentum is cooling. Price is currently around 640.69, pulling back from the visible swing high of 642.13. Market Structure: The chart shows a recovery from 637.82 toward 642.13, followed by a short-term bearish pullback. Price is currently below MA7 (641.01), MA14 (641.39), and MA28 (641.09), suggesting near-term weakness. Support: 640.20, 639.01, and 637.82. Resistance: 641.00–641.40, followed by 642.13 and 644.62. Potential Setup – Conditional LONG: Entry: 641.40–641.60 after a confirmed breakout and retest. TP1: 642.13 TP2: 644.62 SL / Invalidation: Below 640.20. Confirmation: A strong 15-minute candle close above 641.40, followed by a successful retest, could strengthen the bullish continuation scenario. Invalidation: A sustained move below 640.20 would weaken this setup. A further decline toward 639.01 or 637.82 would indicate additional downside pressure. Risk Note: Avoid chasing candles. Wait for confirmation, manage position size carefully, and always define your risk before entering. Will METAX reclaim 642.13 and continue its recovery, or will sellers push the price toward 639.01? #ByXIMPACT
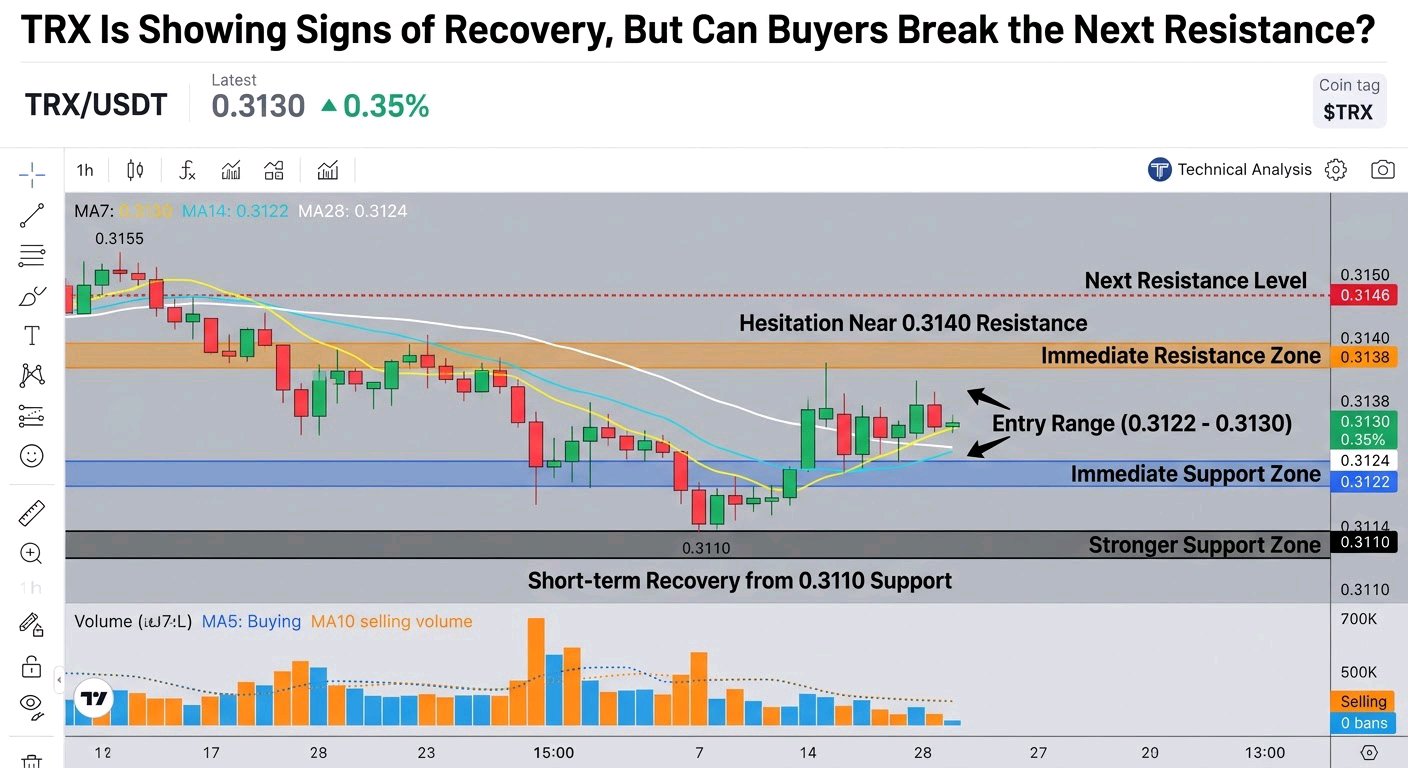
$TRXUSDT Is Showing Signs of Recovery, But Can Buyers Break the Next Resistance? TRX/USDT is trading around 0.3130, up 0.35% on the 1-hour chart. What catches my attention is the recovery from the recent 0.3110 area. Buyers have pushed price higher, although the latest red candle suggests some hesitation near the short-term resistance zone. Market Structure: The broader chart still reflects an earlier bearish move from approximately 0.3155. However, the latest recovery shows improving short-term momentum. - Immediate Support: 0.3122–0.3124 - Stronger Support: 0.3110–0.3114 - Immediate Resistance: 0.3138–0.3140 - Next Resistance: 0.3146 MA7 is at 0.3130, MA14 at 0.3122, and MA28 at 0.3124. Price is currently around these moving averages, showing a developing recovery structure. Potential Setup – LONG Scenario: Entry: 0.3122–0.3130 TP1: 0.3140 TP2: 0.3146 SL / Invalidation: Below 0.3109 Confirmation: A sustained move above 0.3135 followed by a breakout and hold above 0.3140 could strengthen the bullish scenario. Increasing buying volume would add confidence. Invalidation: A rejection near 0.3140 followed by a breakdown below 0.3122 would weaken the recovery. Losing the 0.3110 area would invalidate this bullish setup. Risk Note: The latest displayed volume is below its MA5 and MA10 volume averages. Avoid chasing candles, wait for confirmation, and use controlled position sizing with a predefined stop-loss. Do you think TRX has enough momentum to challenge 0.3140, or will sellers defend this resistance again? #ByXIMPACT
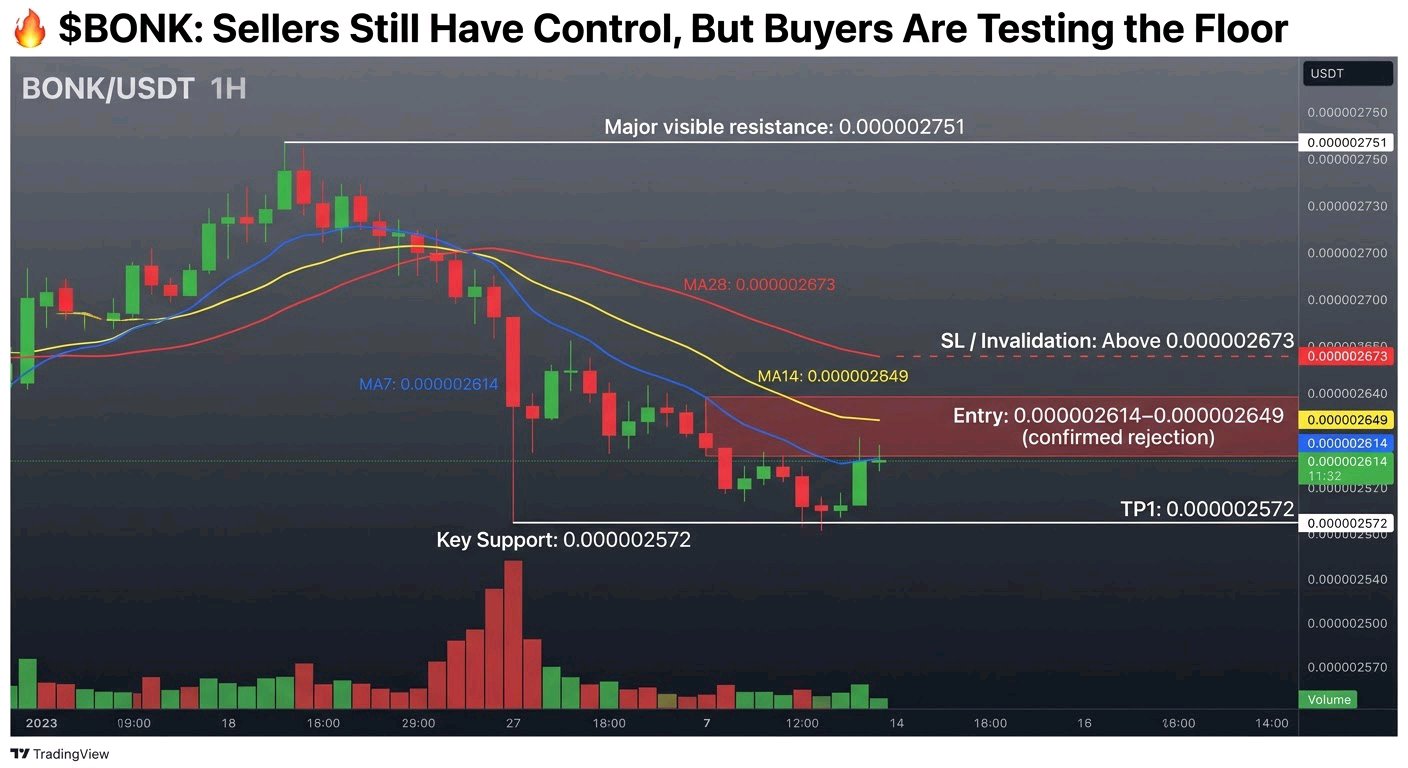
$BONKUSDT Sellers Still Have Control, But Buyers Are Testing the Floor BONK is showing clear weakness on the 1-hour chart, currently trading at 0.000002602, down 2.62%. After being rejected from the 0.000002751 high, price has moved lower and is now attempting a small recovery near the 0.000002572 support. Market Structure: The short-term structure remains bearish, with lower price movements and selling pressure visible on the chart. Price is trading below all three visible moving averages: - MA7: 0.000002614 - MA14: 0.000002649 - MA28: 0.000002673 Key Support: 0.000002572 Resistance Zones: - 0.000002614–0.000002649 - 0.000002673 - Major visible resistance: 0.000002751 Potential Setup – Conditional SHORT: Entry: 0.000002614–0.000002649 after a confirmed rejection TP1: 0.000002572 TP2: Not clearly identifiable from the visible chart SL / Invalidation: Above 0.000002673, depending on confirmation and risk tolerance. Confirmation: Sellers need to defend the moving-average resistance zone, while price should show renewed bearish momentum before considering this scenario. Invalidation: A sustained 1-hour move above 0.000002673 would weaken the bearish setup. A stronger recovery toward 0.000002751 would further challenge the current structure. Risk Note: The latest green candles suggest a possible short-term bounce, so chasing a short position here carries risk. Wait for confirmation, manage position size, and always define your risk before entering. Will BONK break below 0.000002572, or can buyers reclaim the moving averages and change the short-term structure? #ByXIMPACT
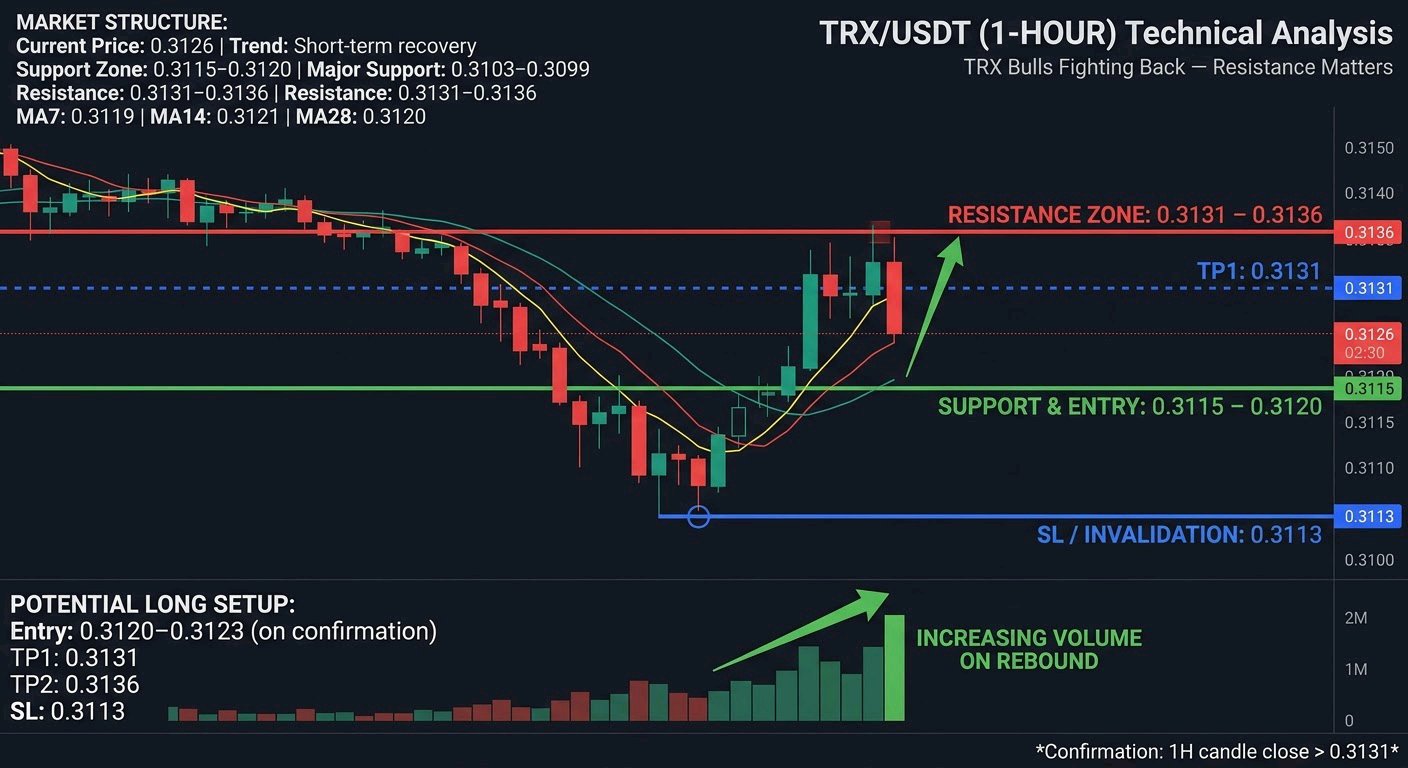
$TRXUSDT Bulls Are Fighting Back — But One Resistance Zone Still Matters TRX/USDT is showing signs of short-term recovery on the 1-hour chart after a sharp selling move. Buyers have pushed price back toward 0.3131, but the latest candle shows some hesitation near resistance. The next move depends on whether buyers can maintain this momentum. Market Structure: - Current Price: 0.3126 - Trend: Short-term recovery within a previously bearish structure. - Support Zone: 0.3115–0.3120 - Major Support: 0.3103–0.3099 - Resistance: 0.3131–0.3136 - MA7: 0.3119 | MA14: 0.3121 | MA28: 0.3120 Price is trading above the visible moving-average cluster, suggesting improving short-term momentum. Volume is also visible increasing around the recent rebound. Potential LONG Setup: Entry: 0.3120–0.3123 (only after support confirmation) TP1: 0.3131 TP2: 0.3136 SL / Invalidation: 0.3113 Confirmation: A convincing 1-hour candle close above 0.3131, followed by a successful retest, would strengthen the bullish scenario. Invalidation: A breakdown below 0.3115 would weaken the recovery setup and could expose the 0.3103 support area. Risk Note: Avoid chasing green candles. Wait for confirmation, manage position size carefully, and maintain a disciplined stop-loss. Do you think TRX can break above 0.3136, or will sellers defend this resistance again? #ByXIMPACT
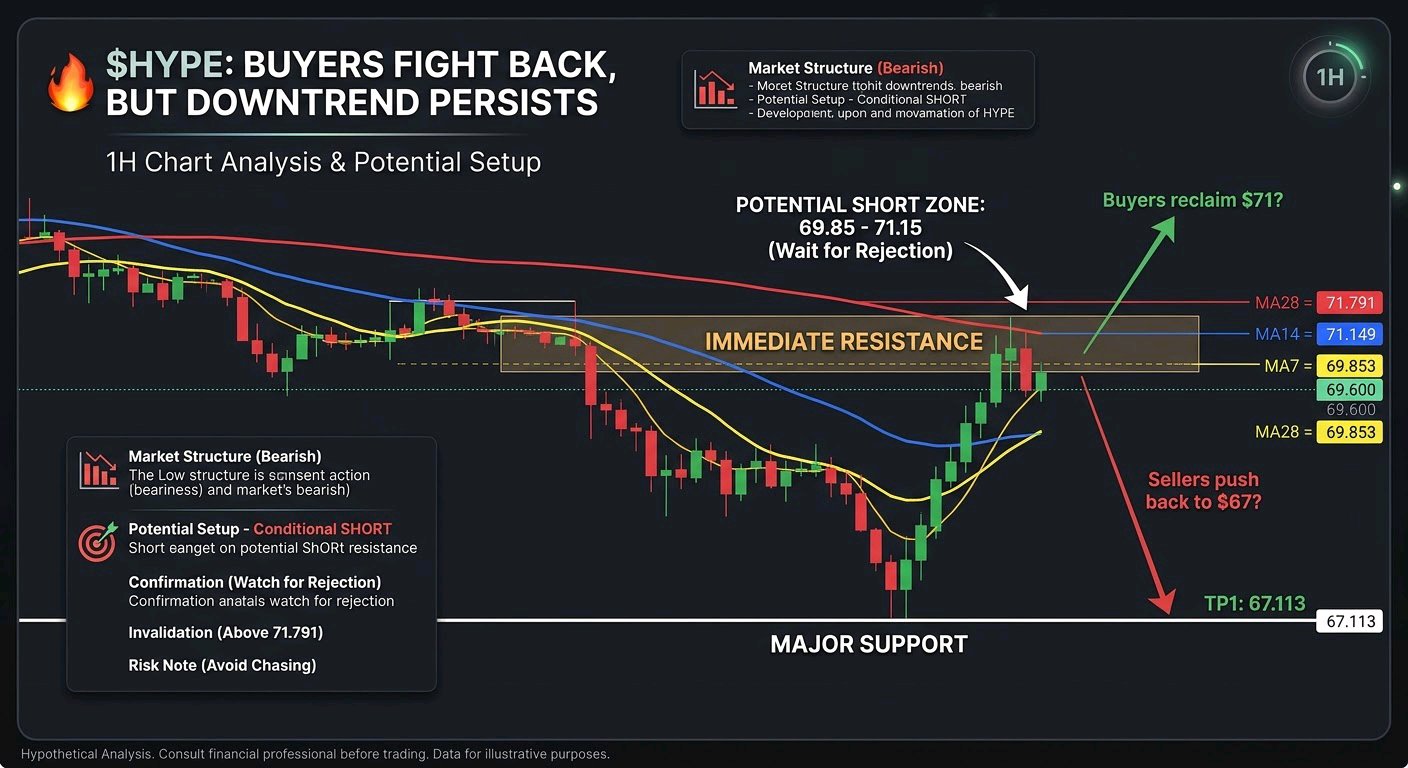
$HYPEUSDT 買方正在反擊,但下跌趨勢尚未結束 我一直在觀察 1 小時圖上的 HYPE,這次最新的反應值得關注。在急劇拋售後,價格從 $67.113 反彈並回升至 $69.600。然而,在考慮趨勢反轉之前,這次回升仍需要更強的確認。 市場結構: 整體 1 小時結構仍然看跌,價格交易在所有三條可見移動平均線下方: - MA7: $69.853 - MA14: $71.149 - MA28: $71.791 即時阻力位於 $69.85–$71.15 附近,而主要的可見支撐位為 $67.113。最新的綠色 K 線顯示了復甦嘗試,但在更廣泛的結構中,賣方仍佔優勢。 潛在設置 – 條件性做空 (SHORT): 進場點:$69.85–$71.15(僅在確認遭拒後) TP1 (止盈1):$67.113 TP2 (止盈2):從現有圖表看不清楚 SL / Invalidation (止損/失效):$71.791 以上 確認: 觀察移動平均線附近的拒絕跡象和重新出現的拋售壓力。跌破 $67.113 可能會增強看跌延續的情景。 失效: 若能持續回升至 $71.791 以上,將削弱此做空設置,並暗示買方正在重新獲得控制權。 風險提示: 避免追高。等待確認,使用合適的倉位大小,並始終透過預設的止損來管理風險。 你認為 HYPE 能否收復 $71,還是賣方會將其推回 $67 附近? #ByXIMPACT
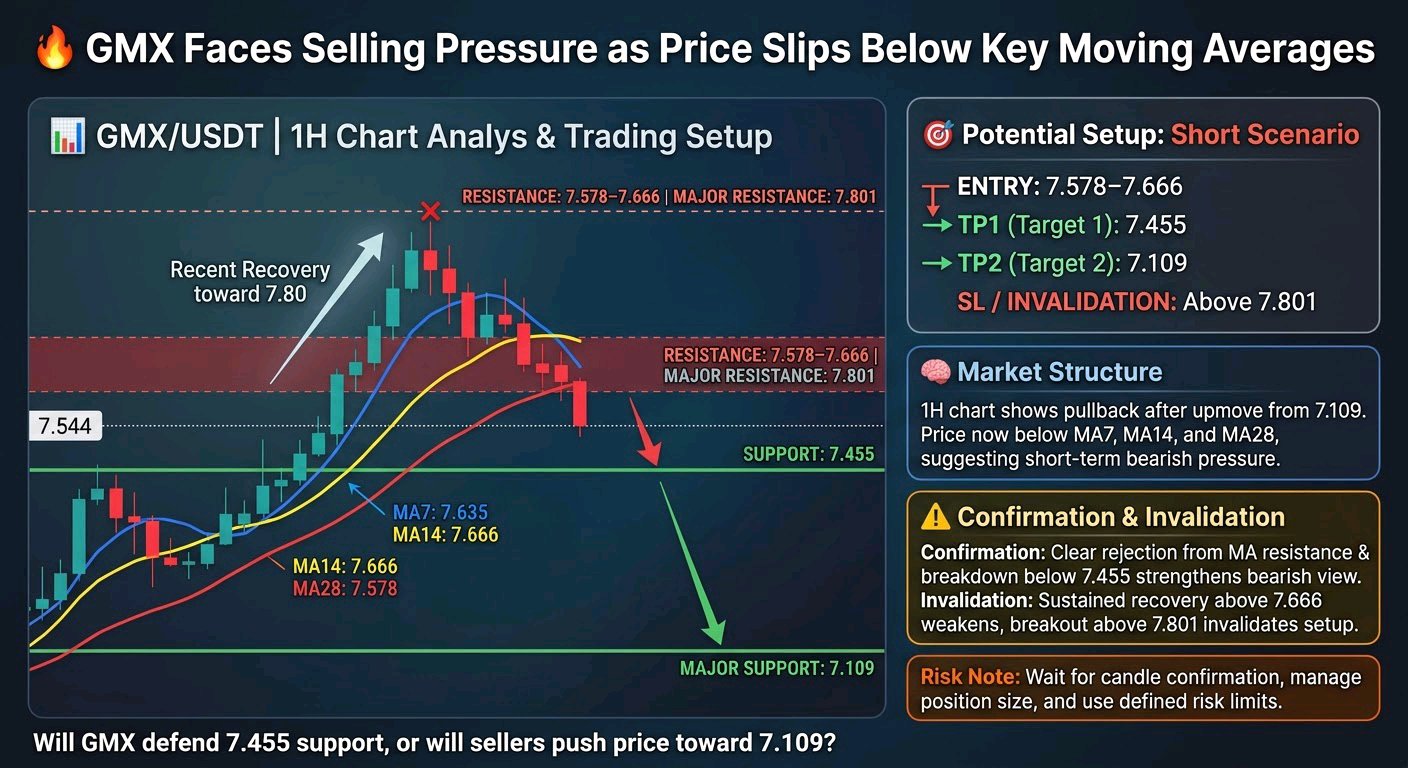
$GMXUSDT 面臨賣壓,價格跌破關鍵移動平均線 GMX/USDT 在近期回升至 7.80 附近後,顯示出短期疲軟跡象。目前價格為 7.544,賣方正推動價格走低。接下來在鄰近支撐位附近的反應,可能會決定下一波走勢的方向。 市場結構: 1 小時線圖顯示,在從 7.109 強勁上漲後出現回調。目前價格低於 MA7 (7.635)、MA14 (7.666) 和 MA28 (7.578),顯示短期內存在看跌壓力。 支撐位:7.455,其次是 7.109。 阻力位:7.578–7.666,主要阻力位在 7.801 附近。 潛在佈局: 做空情境(取決於反彈受阻): 進場點:在出現看跌拒絕訊號後,於 7.578–7.666 區間進場 止盈目標 1 (TP1):7.455 止盈目標 2 (TP2):7.109 止損/無效點:高於 7.801 確認訊號: 若能在移動平均線阻力區間出現明顯受阻,且價格跌破 7.455,將增強看跌情境。 無效點: 若能持續回升至 7.666 以上,看跌前景將會減弱。若突破 7.801,此做空情境則失效。 風險提示: 請等待K線確認訊號,謹慎控管倉位大小,切勿在未設定風險限額的情況下進行交易。 GMX 是否能守住 7.455 的支撐位,還是賣方會將價格推向 7.109? #ByXIMPACT
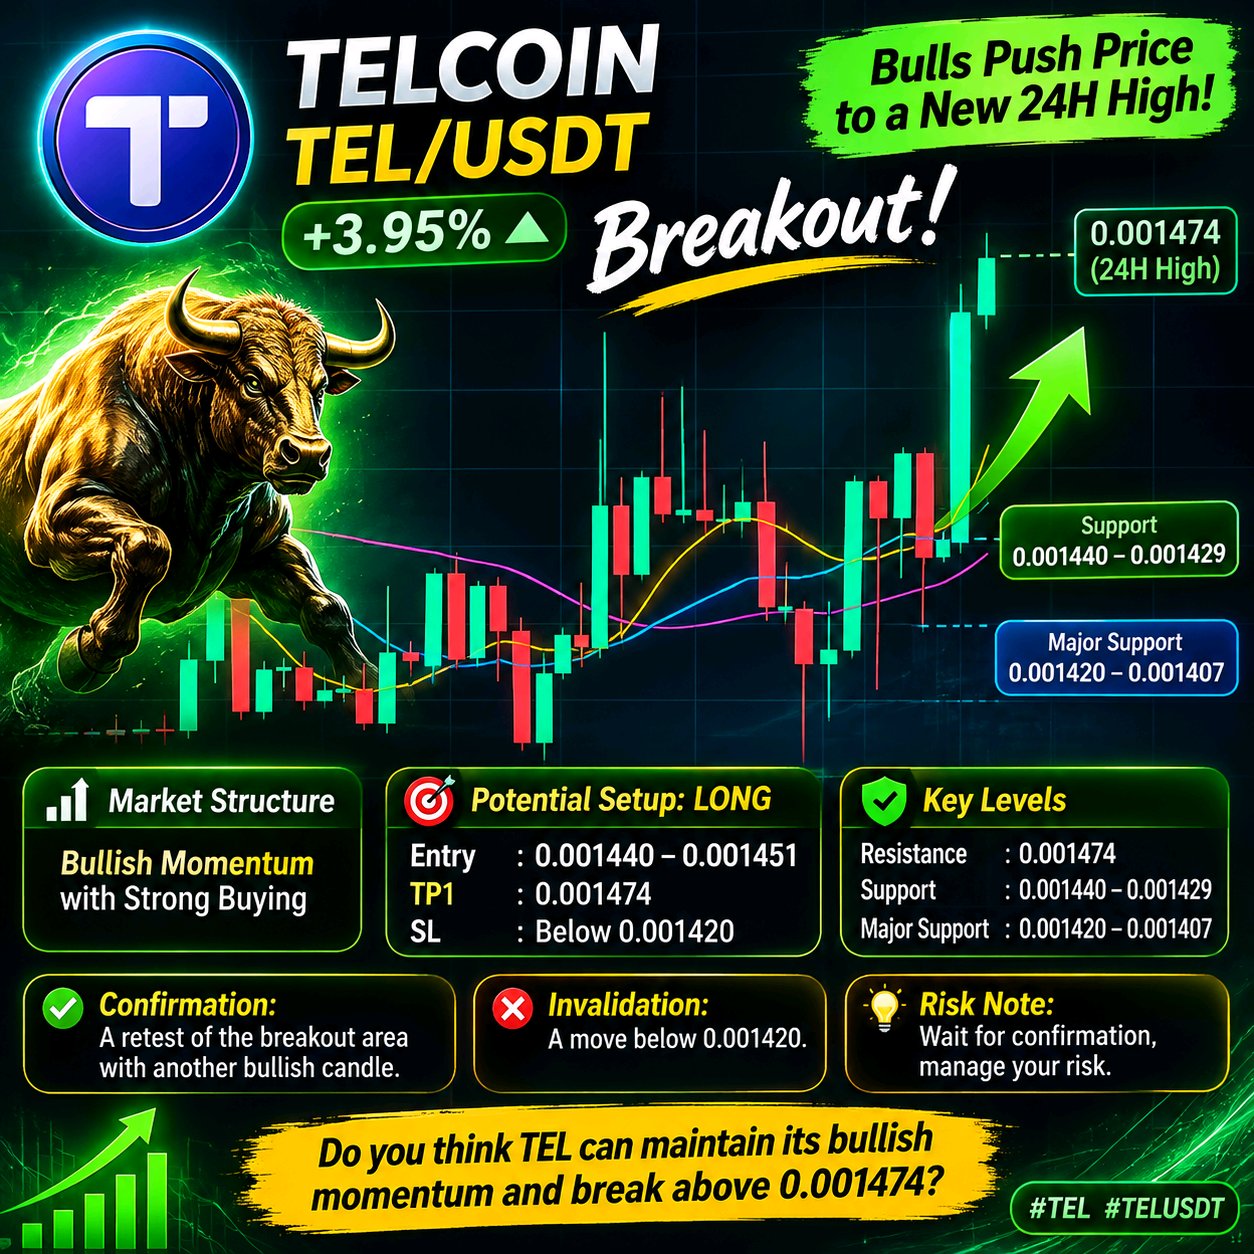
$TELUSDT BREAKOUT: Bulls Push Price to a New 24H High! TEL/USDT is showing strong bullish momentum on the 1-hour chart. Price has climbed to 0.001474 (+3.95%), reaching the visible 24-hour high. Buyers are currently controlling the move, but holding above the breakout area will be important. Market Structure: The short-term structure is bullish, with strong green candles pushing above previous consolidation. Price is trading above MA7 (0.001440), MA14 (0.001429), and MA28 (0.001420), supporting the bullish structure. Key Support: 0.001440 – 0.001429 Major Support: 0.001420 – 0.001407 Resistance: 0.001474 (24H High) Potential Setup: LONG Scenario Entry: 0.001440 – 0.001451 (potential pullback zone) TP1: 0.001474 TP2: Not clear from the visible chart. SL / Invalidation: Below 0.001420 Confirmation: A successful retest of the breakout area, followed by another bullish candle, could strengthen the continuation scenario. Invalidation: A sustained move below 0.001420 would weaken the current bullish structure and increase downside risk. Risk Note: Avoid chasing a sudden green candle. Wait for confirmation, manage position size, and always use a defined stop-loss. Do you think TEL can maintain its bullish momentum and break above 0.001474? #ByXIMPACT
$PEPEUSDT 買方正在捍衛反彈,但阻力依然存在 PEPE 在 1 小時圖表上出現反彈跡象,此前已在 0.000004293 附近找到支撐。目前價格約為 0.000004540,略高於 MA7、MA14 和 MA28。然而,下一次的阻力測試對於判斷買方能否延續漲勢至關重要。 市場結構: 圖表顯示先前的看跌走勢,隨後出現反彈和短期盤整。移動平均線聚集在當前價格附近,顯示市場正處於抉擇點。 支撐位:0.000004293 阻力位:0.000004683 主要阻力位:0.000004833 潛在佈局 – 做多 (LONG) 情境: 進場點:0.000004530–0.000004550 止盈 1 (TP1):0.000004683 止盈 2 (TP2):0.000004833 止損 / 失效點 (SL):0.000004293 下方 確認訊號: 若能以強勁的買盤成交量支撐,並在 1 小時 K 線收盤時有效突破 0.000004683,將有望增強看漲情境。 失效條件: 若價格跌破 0.000004293,將削弱反彈結構並使此佈局失效。 風險提示: 這是一個基於圖表的情境分析,而非保證獲利的交易訊號。請務必謹慎管理倉位,切勿投入無法承受損失的資金。 你認為 PEPE 有足夠的力道突破 0.000004683 嗎?還是賣方會再次捍衛這個阻力位? #ByXIMPACT

$HYPEUSDT 多頭反擊——新的上漲趨勢正在成形嗎? HYPE/USDT 在跌向 70.00 區域後,於 1 小時圖上呈現強勁復甦。買盤已將價格推回 72.00 附近,但下一個阻力區將至關重要。 市場結構: 圖表顯示從可見的 69.526 低點出現急劇反彈。目前價格在 71.953–72.068 之間交易,並位於顯示的 MA7、MA14 和 MA28 之上。短期動能正在改善,儘管仍需要確認。 關鍵支撐:71.480、70.503 和 69.526。 關鍵阻力:72.458 和 73.265。 潛在佈局 — 做多 (LONG) 情境: 進場:71.80–72.05(僅在支撐位守住時) 止盈 1 (TP1):72.458 止盈 2 (TP2):73.265 止損 / 無效點 (SL):低於 70.503 確認: 強勁的 1 小時線收盤價高於 72.458,隨後成功進行回測,可能會強化看漲情境。 無效條件: 跌破 71.480 將削弱復甦力道,而跌破 70.503 則會使此看漲佈局失效。 風險提示: 等待確認,謹慎管理倉位大小,且絕不要投入無法承受損失的資金。這些點位基於圖表分析,並非保證訊號。 HYPE 會突破 72.458 並挑戰 73.265,還是賣方會再次介入? #ByXIMPACT

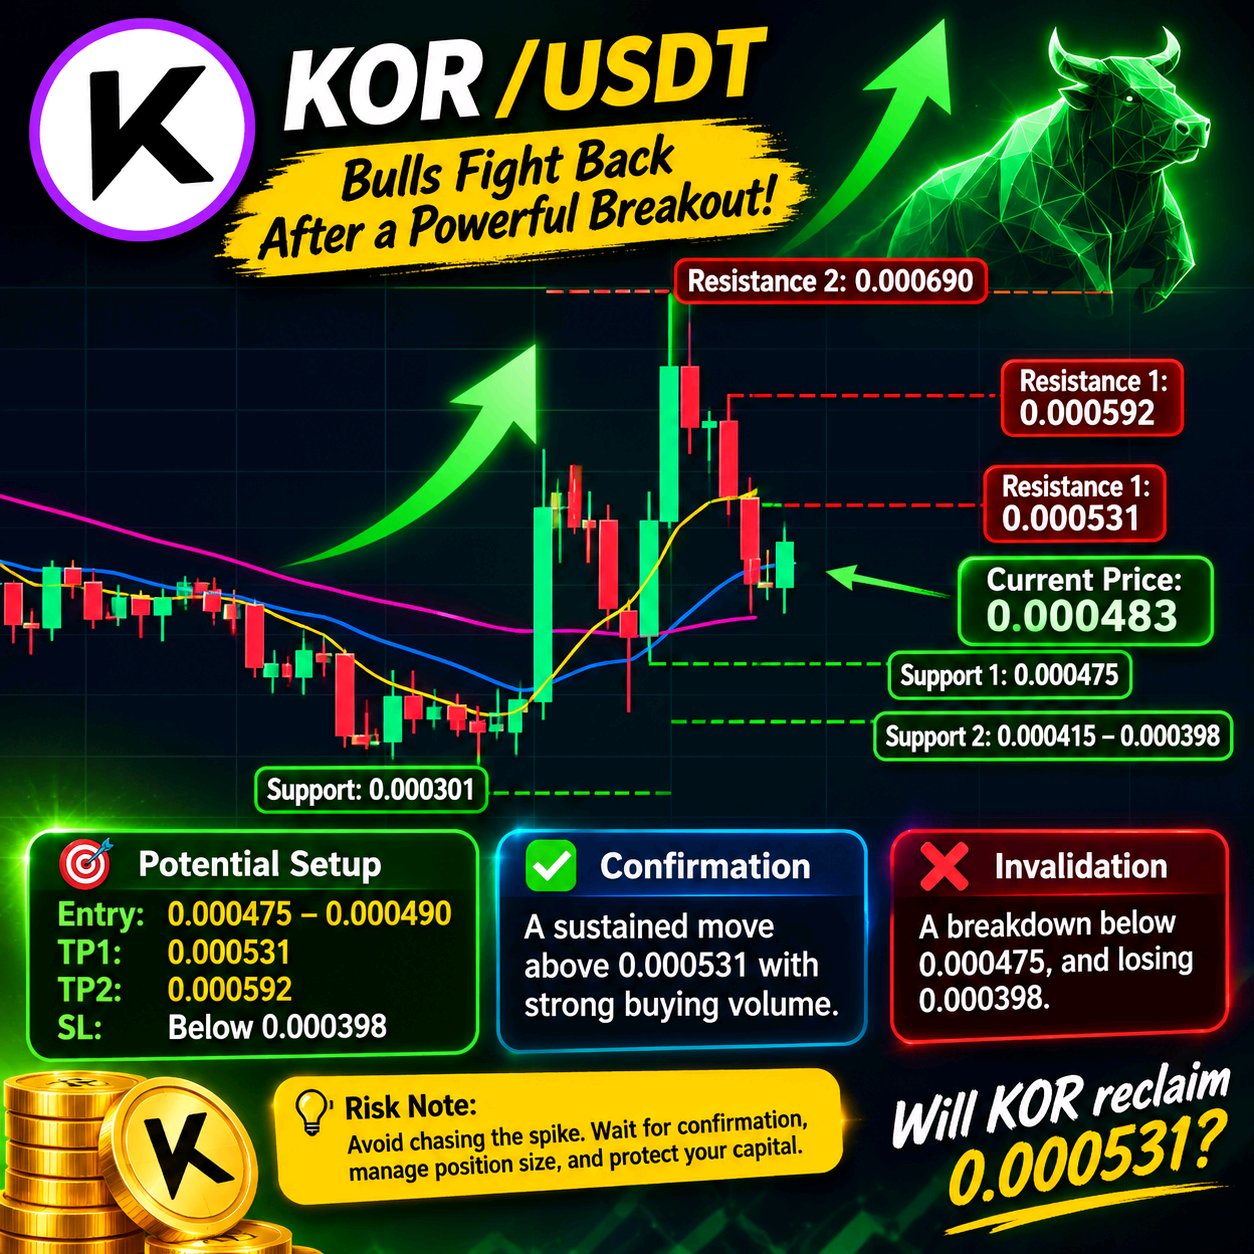
$KORUSDT 多頭強力反彈,強勢突破後展開回擊! KOR 在經歷了從 0.000301 到 0.000690 的急劇拉升後,目前在 1 小時圖表上呈現有趣的復甦跡象。價格目前位於 0.000483 左右,買方正試圖在近期回調後重拾動能。 市場結構: - 當前價格:0.000483 (+21.36%) - 趨勢:短期復甦,但波動性依然較高。 - 支撐位 1:0.000475 - 支撐位 2:0.000415–0.000398 - 阻力位 1:0.000531 - 阻力位 2:0.000592 - 主要阻力位:0.000690 潛在佈局: 情境:若支撐守住則做多 (LONG)。 進場:0.000475–0.000490 止盈 1 (TP1):0.000531 止盈 2 (TP2):0.000592 止損 / 失效點 (SL):0.000398 以下 確認訊號: 若價格能持續站穩 0.000531 之上,並伴隨更強的買盤成交量,將能強化看漲復甦的走勢。 失效條件: 若跌破 0.000475,將削弱此佈局。一旦失守 0.000398,該看漲情境即告失效。 風險提示: 避免追高。請等待確認信號,做好倉位管理,並始終保護好您的資本。 KOR 是否能重回 0.000531 並持續復甦,還是賣方將再度取得控制權? #ByXIMPACT
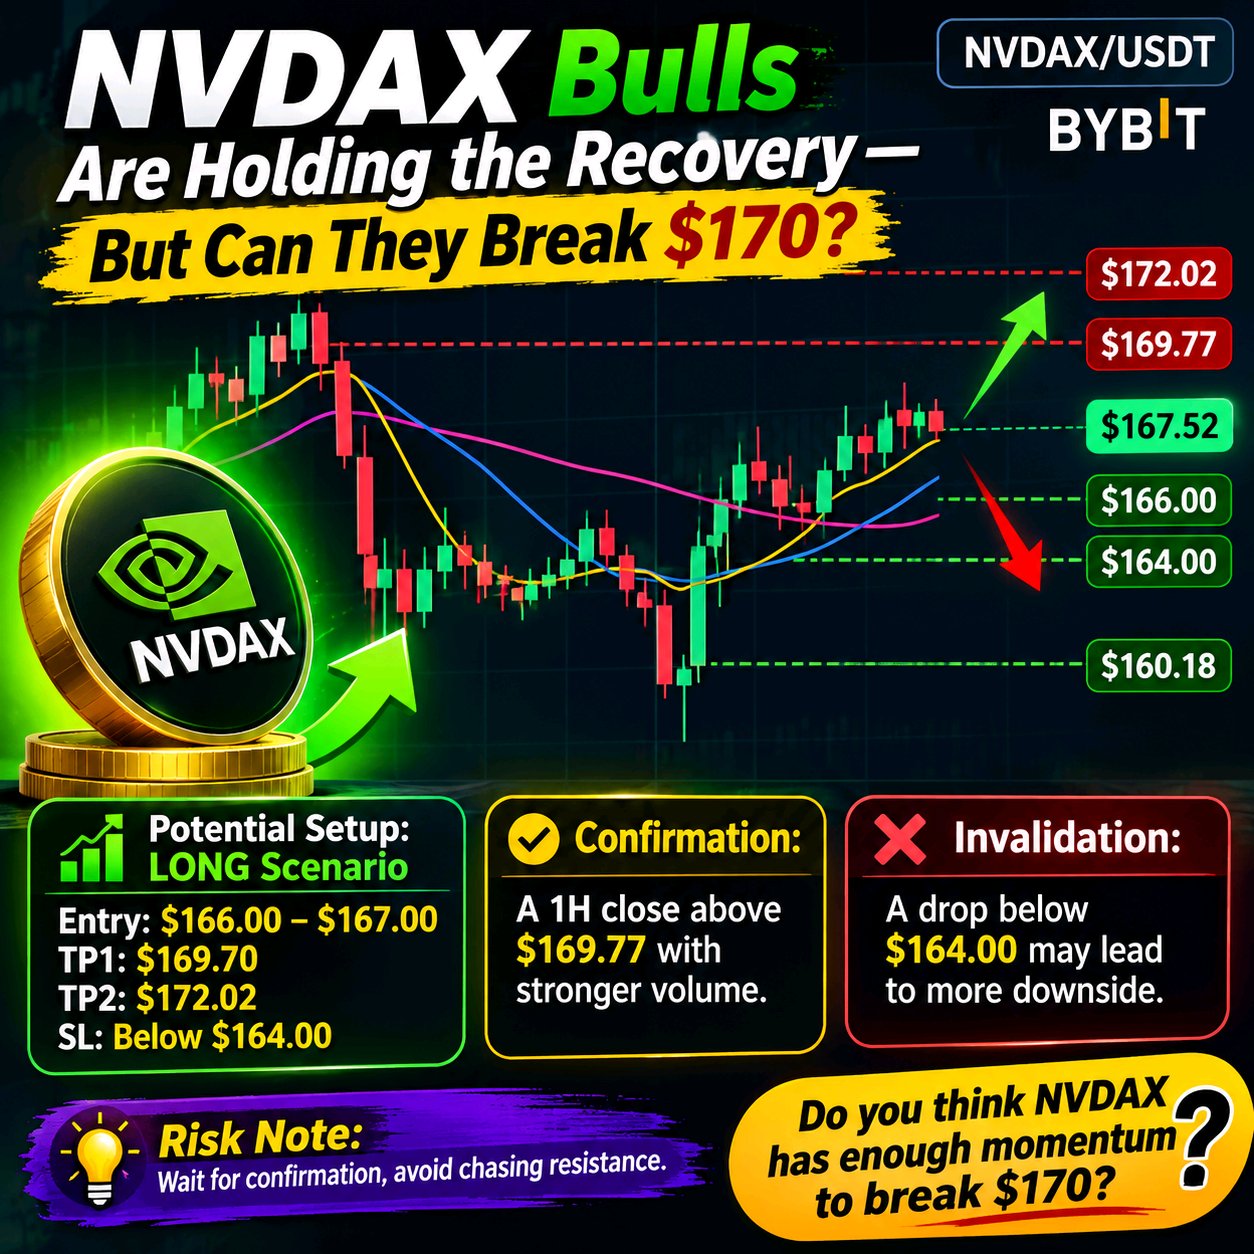
$NVDAXUSDT 多頭正支撐著復甦——但他們能突破 170 美元嗎? NVDAX 在急跌至 154.26 美元後展現了明顯的復甦。價格已回升至 167.52 美元,但最新的 K 線顯示,隨著買家接近 169–170 美元的阻力區,價格正在盤整。 市場結構: 1 小時線圖顯示了強勁的反彈,隨後進入橫向盤整。價格略低於 MA7(167.88 美元),但仍保持在 MA14(166.09 美元)和 MA28(164.05 美元)之上。這使得復甦結構依然有效,儘管短期動能仍需確認。 關鍵支撐位:166.00 美元、164.00 美元和 160.18 美元 關鍵阻力位:169.77 美元和 172.02 美元 潛在設置:做多 (LONG) 情境 進場:在確認支撐後於 166.00–167.00 美元進場 止盈 1 (TP1):169.70 美元 止盈 2 (TP2):172.02 美元 止損 (SL) / 無效點:164.00 美元下方 ⚠️ 確認: 若 1 小時線能有力收於 169.77 美元上方,且最好有更強的成交量支撐,將能增強看漲突破的情境。 無效點: 若價格持續跌破 164.00 美元,將削弱復甦結構,並增加進一步回調至 160.18 美元的可能性。 風險提示: 避免追逐阻力位。請等待確認,審慎管理倉位大小,並保持嚴格的止損紀律。 你認為 NVDAX 是否有足夠的動能突破 170 美元,還是賣方會再次捍衛此阻力位? #ByXIMPACT
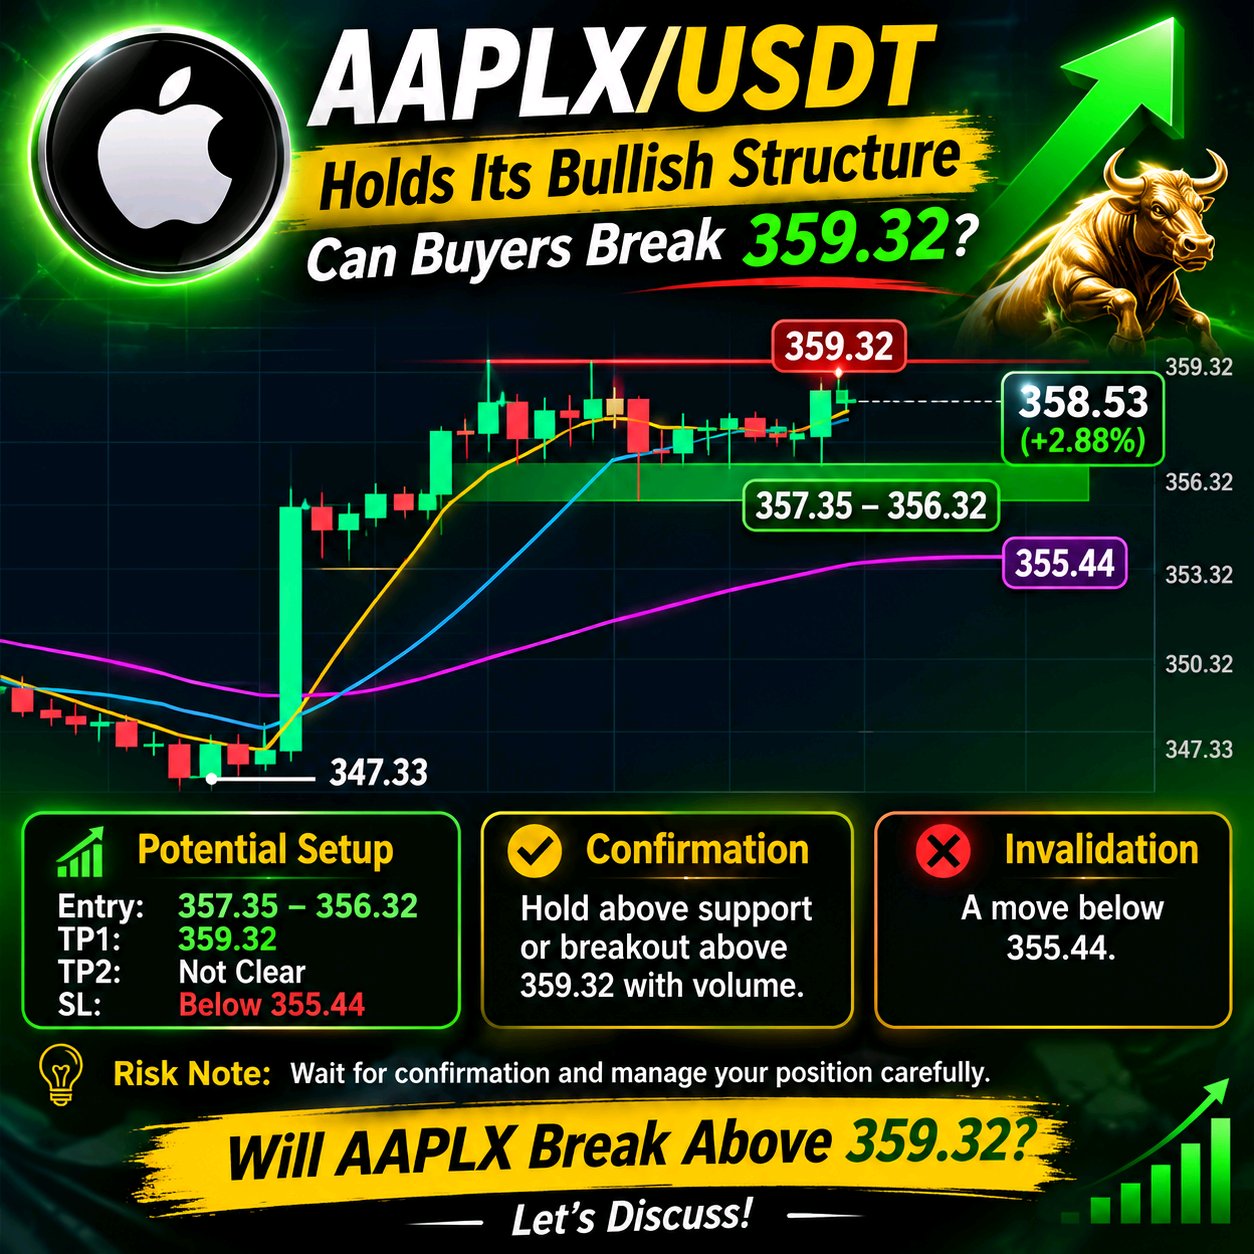
$AAPLXUSDT Holds Its Bullish Structure — Can Buyers Break 359.32? AAPLX/USDT is showing encouraging bullish momentum on the 1-hour chart. After a strong upward move from the 347.33 area, price is consolidating near 358.53, just below the visible resistance at 359.32. The next move around this level could be important. *Market Structure:** - Current Price: 358.53 (+2.88%) - Trend: Bullish - MA7: 357.62 - MA14: 357.35 - MA28: 355.44 - Resistance: 359.32 - Support Zone: 357.35–356.32 - Major Visible Support: 355.44 The moving averages are aligned bullishly, with price trading above all three. However, recent consolidation and relatively low latest volume suggest buyers still need to demonstrate strength. **Potential Setup:** - Entry: 357.35–356.32 (potential pullback zone) - TP1: 359.32 - TP2: Not clear from the visible chart - SL / Invalidation: Below 355.44 **Confirmation:** A successful hold above the support zone or a convincing breakout above 359.32 with stronger volume could strengthen the bullish scenario. **Invalidation:** A sustained move below 355.44 would weaken the current bullish structure. **Risk Note:** Wait for confirmation, manage position size carefully, and avoid chasing price near resistance. Will AAPLX break above 359.32, or will sellers defend this level again? #ByXIMPACT
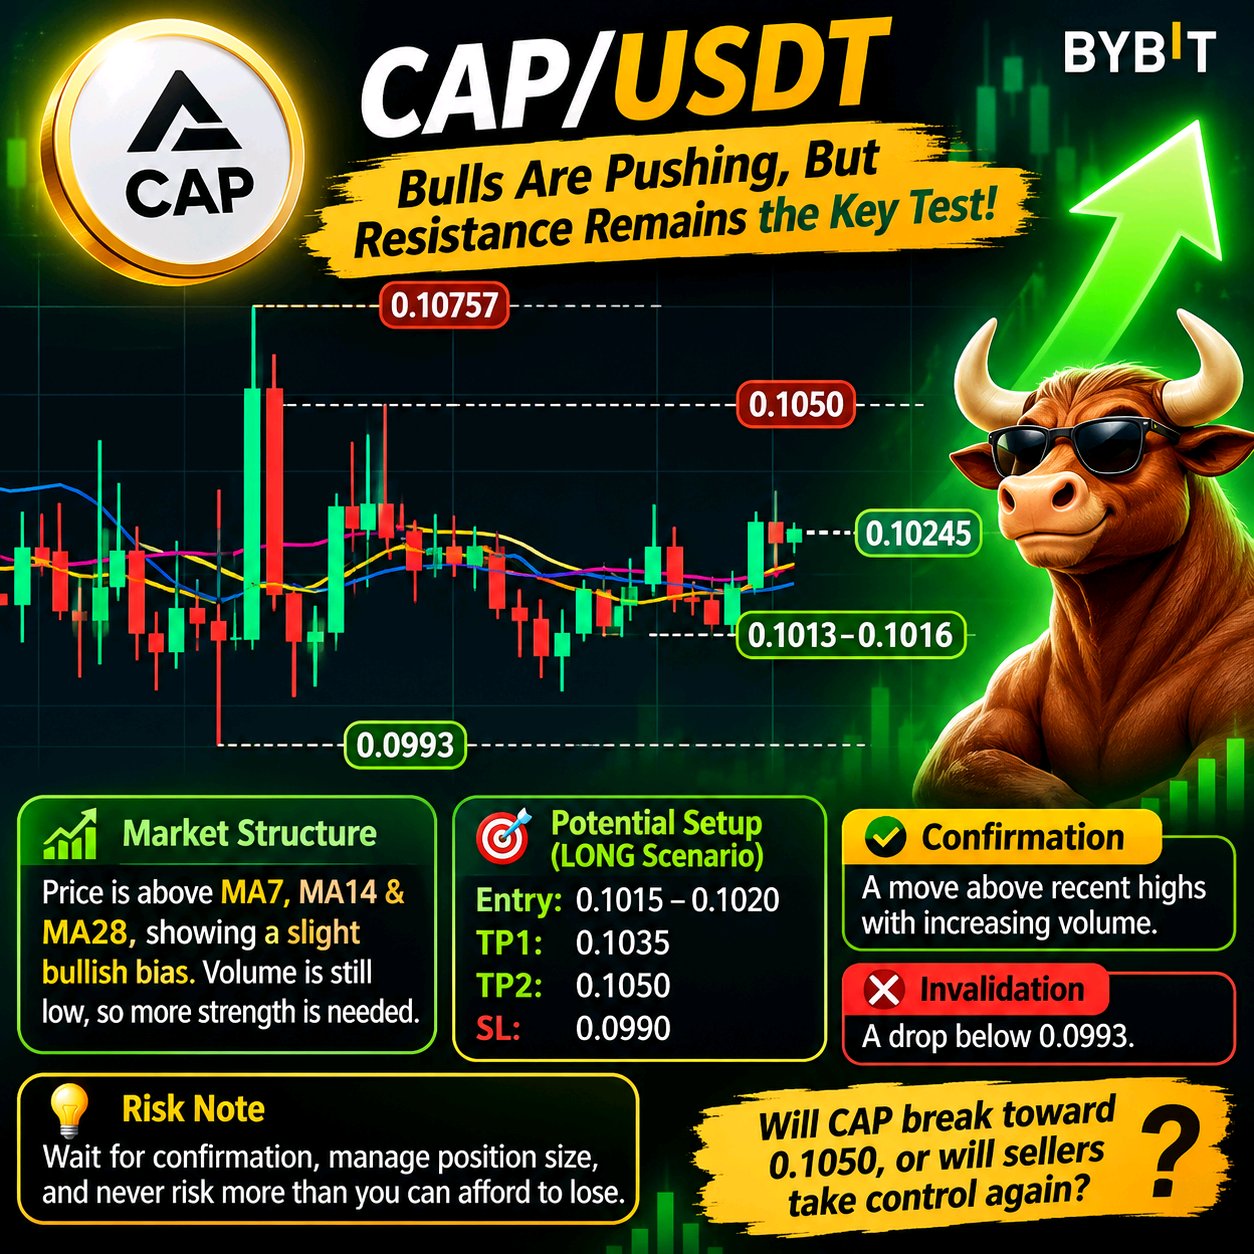
$CAPUSDT 多頭正在進攻,但壓力位仍是關鍵考驗! CAP 在 1 小時圖上顯示出溫和回升,現價約為 **0.10245 (+2.41%)**。近期的 K 線表明,在經歷了一段橫盤整理後,買方正試圖建立動能。 **市場結構:** 價格目前運行在 MA7 (0.10166)、MA14 (0.10133) 和 MA28 (0.10163) 之上,顯示出輕微的看漲傾向。然而,162.28K 的成交量仍低於 MA5 (276.02K) 和 MA10 (482.40K),因此需要更強的買盤參與。 關鍵支撐:0.1013–0.1016 主要支撐:0.0993 壓力位:0.1050 主要壓力位:0.10757 **潛在佈局 – 做多 (LONG) 情境:** 進場區間:0.1015–0.1020 止盈 1 (TP1):0.1035 止盈 2 (TP2):0.1050 止損 / 失效點 (SL):0.0990 **確認訊號:** 若價格能伴隨成交量放大,穩健突破近期的高點,將能增強看漲情境。 **失效條件:** 若 1 小時線決定性跌破均線集群,特別是跌破 0.0993,將會削弱當前的看漲結構。 **風險提示:** 請等待確認訊號,謹慎管理倉位,切勿投入超出您虧損承受能力的資金。 CAP 究竟會衝向 0.1050,還是賣方會再次奪回主導權? #ByXIMPACT
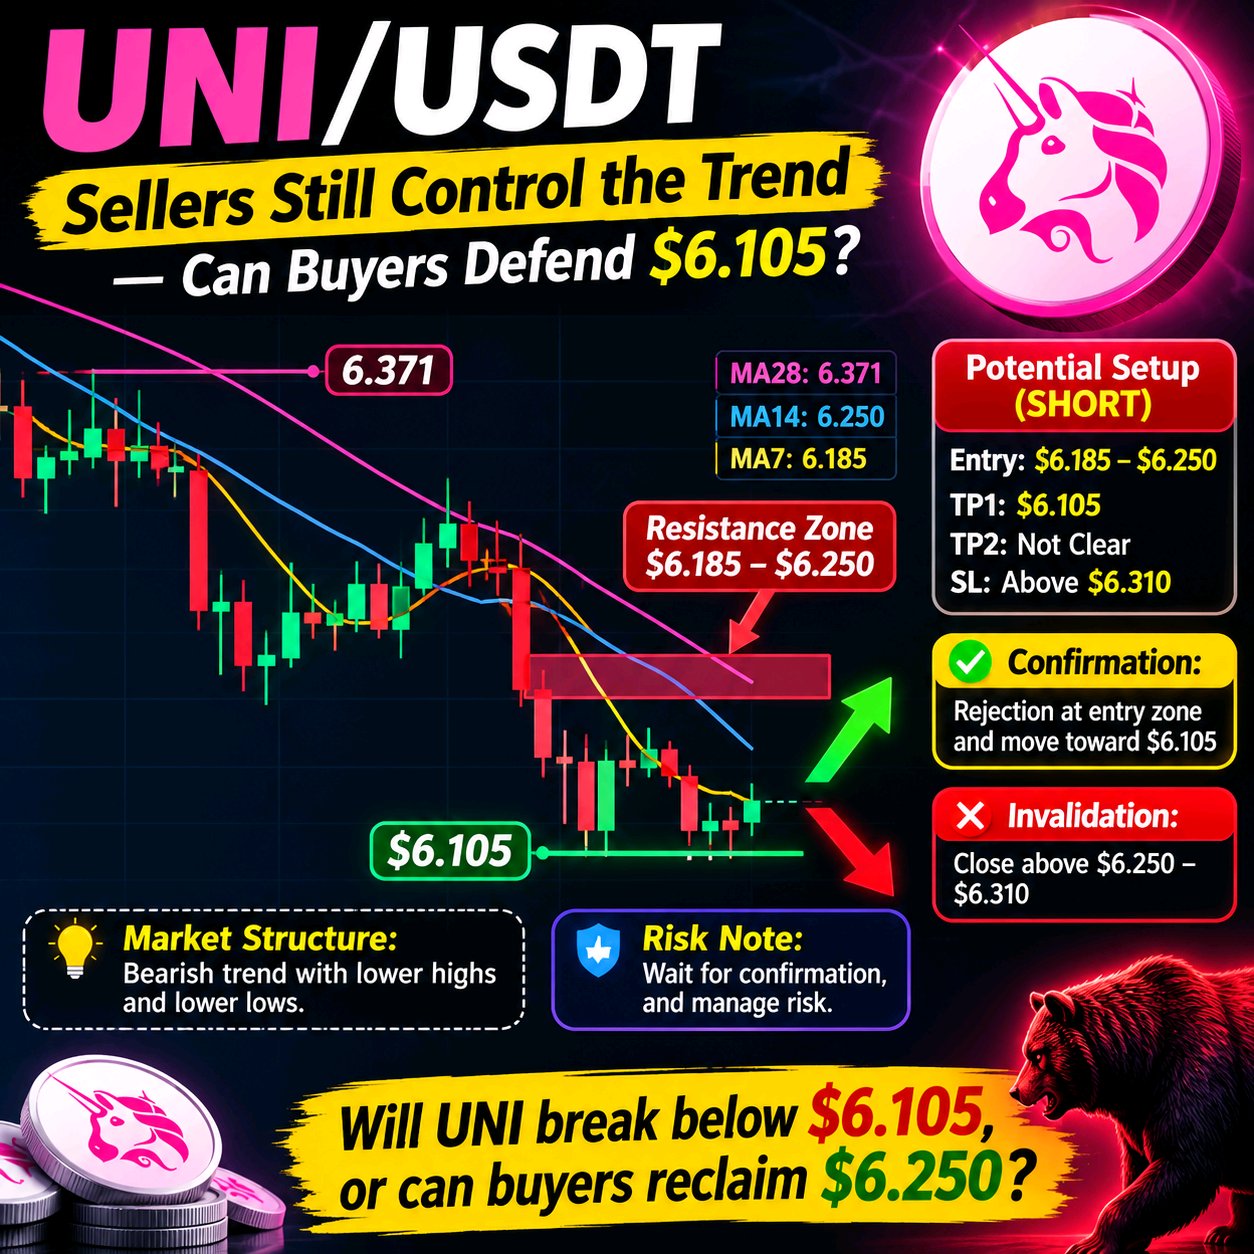
$UNIUSDT Sellers Still Control the Trend — Can Buyers Defend $6.105? UNI is trading at **$6.176**, down **3.11%**. The 1-hour chart shows continued bearish pressure, although price is attempting to stabilize near its recent low. **Market Structure:** UNI remains in a bearish structure with lower highs and lower lows. Price is trading below MA7 ($6.185), MA14 ($6.250), and MA28 ($6.371), keeping sellers in control. **Key Support:** $6.105 **Resistance Zones:** $6.185–$6.250, followed by $6.371. **Potential Setup – SHORT Scenario:** Entry: $6.185–$6.250 after bearish rejection TP1: $6.105 TP2: Not clear from the visible chart SL / Invalidation: Above $6.310 **Confirmation:** A rejection from the entry zone and a fresh move toward $6.105 would strengthen the bearish scenario. **Invalidation:** A sustained recovery above $6.250–$6.310 would weaken the short setup. **Risk Note:** Wait for confirmation, manage position size carefully, and avoid entering trades without a defined risk limit. Will UNI break below $6.105, or can buyers finally reclaim $6.250? #ByXIMPACT
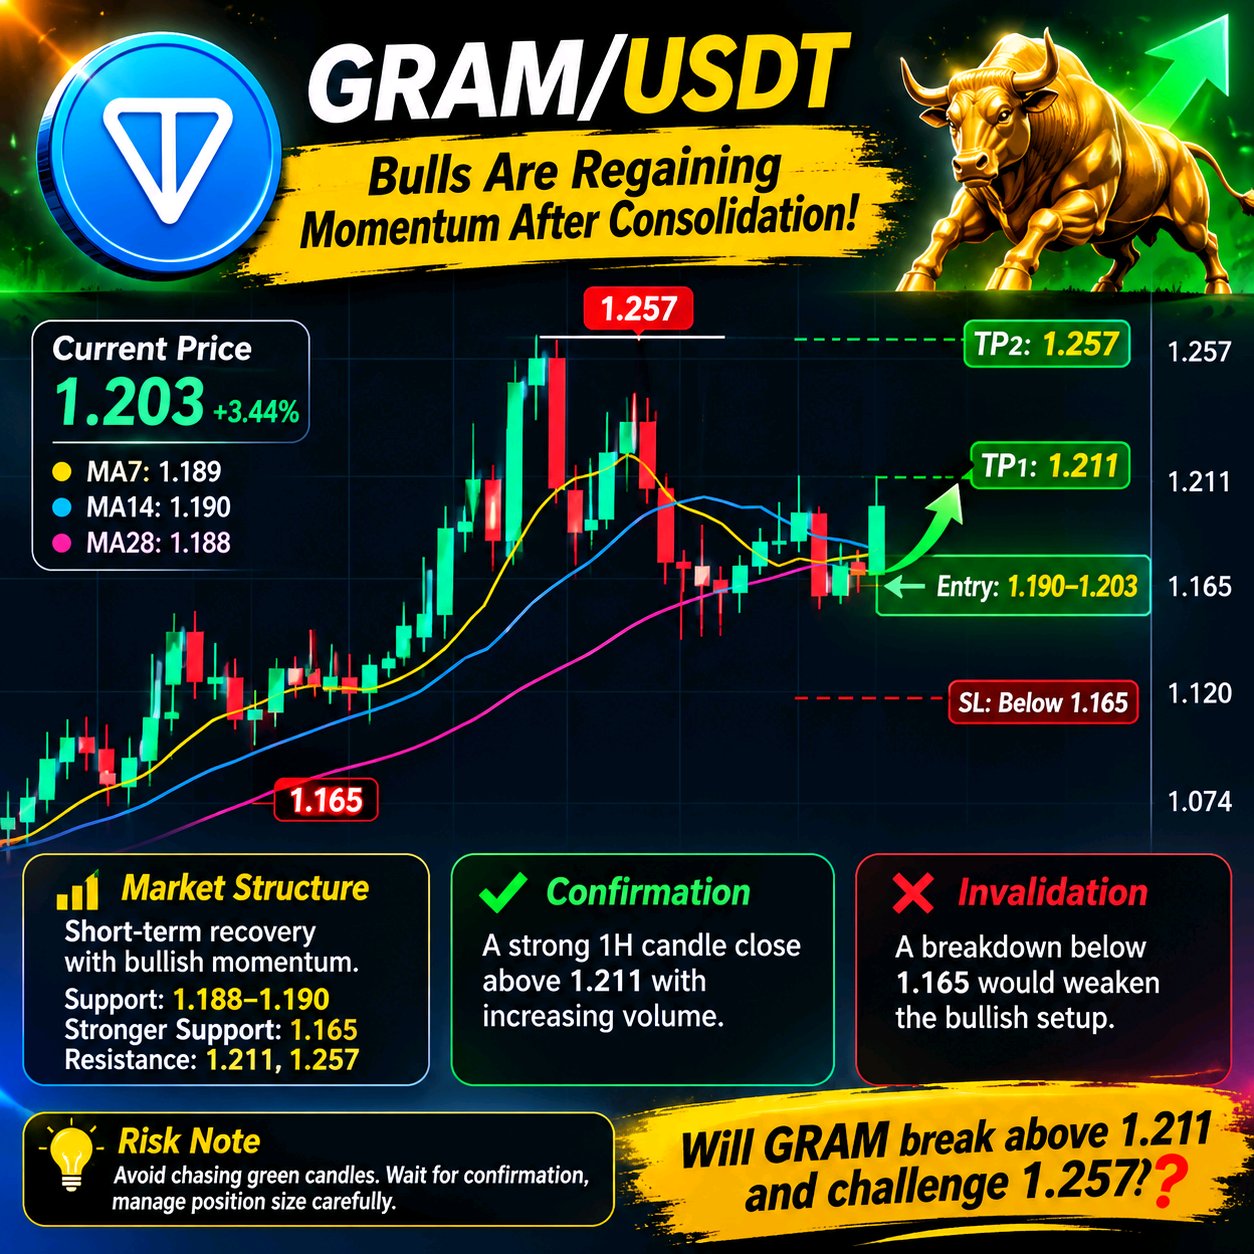
$GRAMUSDT Bulls Are Regaining Momentum After Consolidation! GRAM is showing encouraging strength on the 1-hour chart. After climbing toward 1.257, price experienced a pullback and entered a consolidation phase. The latest green candle suggests buyers are attempting to regain control. **Market Structure:** - Current Price: 1.203 (+3.44%) - Trend: Short-term recovery with bullish momentum. - Support Zone: 1.188–1.190 (MA cluster) - Stronger Support: 1.165 - Resistance: 1.211 - Major Resistance: 1.257 - MA7: 1.189 | MA14: 1.190 | MA28: 1.188 - Volume: 600.50K, above the displayed MA5 and MA10 volume averages. **Potential Setup – LONG Scenario:** Entry: 1.190–1.203, if support holds. TP1: 1.211 TP2: 1.257 SL / Invalidation: Below 1.165 ⚠️ **Confirmation:** A strong 1H candle close above 1.211, preferably supported by increasing volume, could strengthen the bullish scenario. **Invalidation:** A breakdown below 1.165 would weaken the recovery structure and invalidate this long setup. **Risk Note:** Avoid chasing green candles. Wait for confirmation, manage position size carefully, and maintain a disciplined stop-loss. Will GRAM break above 1.211 and challenge 1.257, or will sellers take control again? #ByXIMPACT