Fancy
15440點贊0分享285粉絲11關注
I'm following you
I'm following you
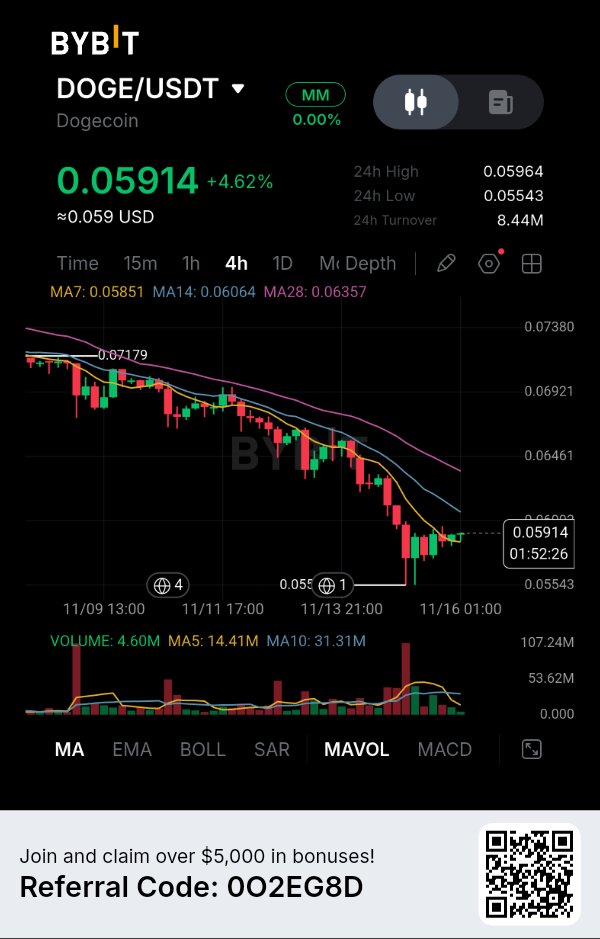
$DOGEUSDT — Dogecoin 正在回升,但大趨勢尚未改變。 Dogecoin 在您的 4 小時截圖中上漲了 4.62%,但我並不認為買方已經重新奪回控制權。有趣的是,DOGE 從近期低點反彈,但仍低於兩條重要的移動平均線。 同時,該項目背後正在發生變化:開發人員正致力於透過應用生態系統賦予 DOGE 更多實際用途。這在不斷提升的實用性與技術上疲軟的市場結構之間,形成了有趣的對比。 市場數據 — BYBIT 4 小時圖 根據您的圖表: * 價格:$0.05914 * 24 小時漲跌幅:+4.62% * 24 小時最高價:$0.05964 * 24 小時最低價:$0.05543 * 24 小時成交額:$844 萬 * MA7:$0.05851 * MA14:$0.06064 * MA28:$0.06357 在 11 月 16 日今日的獨立市場快照中,CoinMarketCap 顯示 DOGE 價格約為 $0.05895,市值約為 92.4 億美元,24 小時交易量為 11.5 億美元。流通供應量約為 1,567.6 億 DOGE,無固定最大供應量。 圖表顯示了什麼 DOGE 一直處於下跌結構中,從可見的 $0.07179 區域跌向 $0.05543。 買方近期守住了低位區域,並將價格推回 MA7($0.05851)上方。 然而,MA14($0.06064)和 MA28($0.06357)仍是上方阻力。 另一個細節值得關注:目前顯示的成交量為 460 萬,而 MA5 成交量為 1441 萬,MA10 成交量為 3131 萬。 這表明最近的反彈尚未吸引到與以往交易活動相當的參與度。 對我來說,$0.06064 是買方需要收復的第一個重要關卡。 大家應該關注的進展 Dogecoin 的生態系統正試圖超越單純的轉帳和支付功能。 11 月 11 日,DogeOS 宣佈其第一個版本已經開發完成並經過審計,據稱主網即將推出,但尚未提供確切的發布日期。 該項目旨在引入一個與以太坊兼容的應用層,支持 DeFi、交易、借貸和遊戲。據報導,有超過 100 名開發者正在開發相關應用。 最令人感興趣的是,DogeOS 打算使用 DOGE 來支付交易手續費,而不是引入另一個原生代幣。 然而,這有一個重要的限制:DogeOS 是一個獨立的應用層,並非 Dogecoin 基礎區塊鏈的直接升級。其當前的安全模型仍然依賴於選定的驗證節點,而針對原生零知識證明驗證的升級提案尚未獲得批准。 代幣價值問題 我一直在思考一個問題。 如果 DogeOS 成功吸引開發者和應用程序,DOGE 可能會透過交易手續費和應用活動獲得額外的實用性。 但開發完成並不保證用戶會採用。 真正的證據將來自實際的應用使用情況、交易需求以及透過這些新服務流通的 DOGE 數量。 Dogecoin 擁有成熟的網絡和充足的流動性,但其通膨性的供應結構也意味著需求需要長期維持相關性。 我的交易計劃 — 條件式做空 儘管近期有反彈,但更廣泛的 4 小時結構仍然有利於賣方。 觸發條件:在 $0.0600–$0.0606 附近出現拒絕,隨後 4 小時線收盤低於 $0.0585。 進場位:$0.0582–$0.0585。 止損位:$0.0600。 目標 1:$0.0565。 目標 2:$0.05543。 目標 3:$0.0535。 使用 $0.05835 的代表性進場位: 潛在下行空間至 TP3:8.32%。 設定風險:2.83%。 預估盈虧比:2.94:1。 此設置為條件式交易。如果沒有出現阻力位拒絕和隨後的跌破,我不會進場。 我的最終看法 Dogecoin 正進入一個有趣的發展階段。DogeOS 可能會為 DOGE 提供額外的金融應用,但市場仍需要證據證明開發者能將此基礎設施轉化為持續的用戶活動。 我認為最重要的問題不在於 Dogecoin 是否能吸引更多關注。 而是在於 Dogecoin 能否從一種人們主要用來持有和轉帳的資產,演變成一種人們有更多理由去主動使用的資產。 這種轉變對於 DOGE 的長期價值來說,可能比又一次短暫的價格回升更重要。$DOGEUSDT #ByXIMPACT

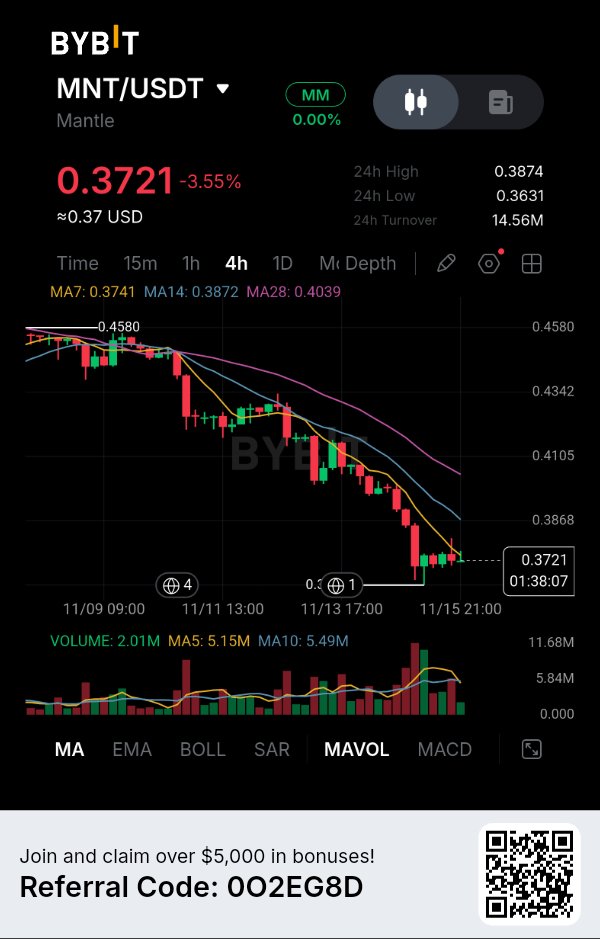
The Selling Pressure Has Not Disappeared — Another Resistance Test Could Create an Opportunity. Mantle is struggling to recover after an extended decline, and one detail on this 4-hour chart deserves attention: price is consolidating near its recent low while all three moving averages remain positioned above it. This suggests that buyers are attempting to stabilize the market, but sellers still have control over the broader structure. I am particularly interested in whether the next recovery toward resistance will attract buyers or simply give sellers another opportunity. MARKET STRUCTURE — THE DOWNTREND REMAINS IN CONTROL MNT is currently trading around $0.3721, down 3.55%, with a 24-hour high of $0.3874 and a low of $0.3631. Looking at the 4-hour chart, Mantle has declined from approximately $0.4580, creating a persistent sequence of lower highs and lower lows. The previous recovery attempts have repeatedly failed to establish a meaningful bullish reversal. More recently, sellers accelerated the decline toward $0.3631. Price has since started moving sideways around $0.37, but this consolidation has not yet produced a convincing structural recovery. For me, the important question is whether this sideways movement represents temporary stabilization or simply a pause within the existing downtrend. THE MOVING AVERAGES ARE STILL FAVORING SELLERS Three technical readings stand out: - MA7: $0.3741 - MA14: $0.3872 - MA28: $0.4039 All three moving averages are above the current price. Their positioning is also bearish, with MA7 below MA14 and MA14 below MA28. This arrangement reflects persistent weakness across the displayed moving-average periods. The first resistance area is around $0.3741, followed by $0.3872. Above these levels, MA28 near $0.4039 represents a much stronger recovery challenge. What interests me most is the gap between current price and MA28. Buyers have considerable technical resistance to overcome before the broader structure can improve. VOLUME — THE MARKET IS LOSING PARTICIPATION The volume data provides another useful perspective: - Current volume: 2.01M - MA5: 5.15M - MA10: 5.49M Current volume is significantly below both displayed averages. This suggests that recent trading participation has cooled compared with the preceding activity. I would not automatically interpret declining volume as accumulation or distribution. However, it tells me that the current consolidation is not yet supported by convincing buying participation. If MNT attempts another recovery, I want to see volume expand alongside price. Without that confirmation, a move toward resistance could struggle to attract sustained demand. THE IMPORTANT DETAIL — $0.3631 The recent low is becoming the most important reference point for this setup. Buyers have managed to prevent an immediate continuation below $0.3631, but they have not yet demonstrated the strength required to reclaim the moving-average resistance cluster. This creates an interesting market situation. Price is attempting to stabilize, but the broader structure remains bearish. If MNT recovers toward $0.3741–$0.3872 and sellers defend that region again, the market could revisit its recent low. A decisive breakdown below $0.3631 would create the possibility of another downside extension. On the other hand, reclaiming $0.3872 with stronger volume would weaken my current bearish interpretation. MY TRADING STRATEGY — SHORT My preferred direction is SHORT because the prevailing market structure and moving-average alignment continue to favor sellers. I would rather wait for a recovery into resistance than chase MNT near its current support. - Direction: SHORT - Entry Zone: $0.3790–$0.3860 - Confirmation: 4H bearish rejection from the entry zone. - Stop Loss: $0.3970 - TP1: $0.3631 - TP2: $0.3500 - TP3: $0.3380 Estimated Risk/Reward: Approximately 1:1.5 to 1:3.5, depending on entry and execution. TP1 is based on the visible chart low, while TP2 and TP3 are projected downside extensions rather than confirmed support levels shown in the screenshot. A sustained 4-hour move above $0.3970 would invalidate this setup. If MNT continues falling without offering the planned entry, I would avoid chasing the move. WHAT COULD CHANGE MY VIEW? A convincing recovery above $0.3872, followed by stronger buying volume and progress toward $0.4039, would make me reconsider the bearish outlook. That would indicate buyers are beginning to challenge the structure that has controlled the decline. FINAL THOUGHT Mantle is approaching an important decision point. The market has slowed its decline, but slowing down is not the same as reversing direction. The next resistance test could reveal whether buyers are finally gaining strength or whether sellers still have unfinished business. $MNTUSDT #ByXIMPACT

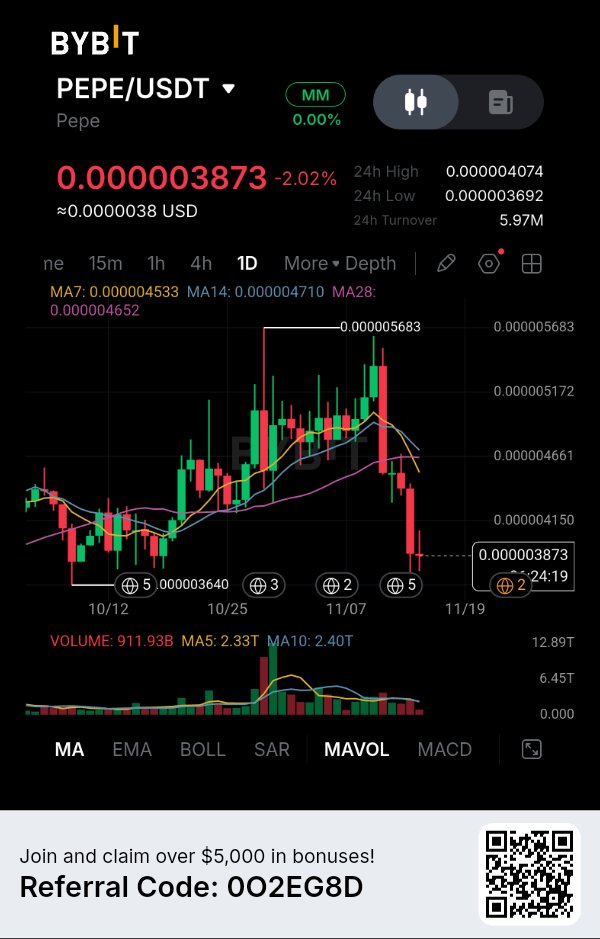
$PEPEUSDT — The rally toward $0.00000568 has completely changed character, and I'm watching whether sellers can turn the next recovery into another lower high. What makes this chart interesting to me is how quickly PEPE lost the ground it had gained during the previous rally. On the daily chart, PEPE climbed toward $0.000005683, but buyers failed to maintain that momentum. Price has since experienced a sharp rejection and is now trading around $0.000003873, down 2.02%. The important part isn't simply the size of the decline. It's where price is trading in relation to its moving averages. The MA7 is currently around $0.000004533, the MA14 around $0.000004710, and the MA28 around $0.000004652. All three are above the current price, suggesting that the recovery still has significant resistance to overcome. There is another level I don't want to ignore. PEPE recently approached the $0.000003692 area, while the previous visible support sits around $0.000003640. This is where I want to see how buyers respond. A bounce from this region is possible, but I wouldn't consider it a bullish reversal unless price starts reclaiming the moving averages and establishing higher lows. My preferred approach is to wait for a recovery toward $0.00000445–$0.00000465. If sellers reject that region on the daily chart, it could provide a more structured opportunity to follow the existing bearish momentum. I'm not interested in chasing the decline at current levels. I want the market to offer a better entry rather than selling after the move has already happened. My conditional trading plan: * Direction: SHORT * Entry Zone: $0.00000445–$0.00000465 * Stop Loss: $0.00000480 * TP1: $0.000003873 * TP2: $0.000003692 * TP3: $0.000003400 (projected extension) The setup requires a confirmed bearish rejection from the entry zone. A sustained daily recovery above $0.00000480 would invalidate this particular idea. I've seen meme coins recover sharply after aggressive sell-offs, so I don't want to assume that every breakdown will continue. If buyers reclaim the moving-average cluster, I'll reconsider the bearish outlook. For now, the question isn't how quickly PEPE can return to its previous high. It's whether buyers can defend the recent lows before sellers attempt another leg down. $PEPEUSDT #ByXIMPACT

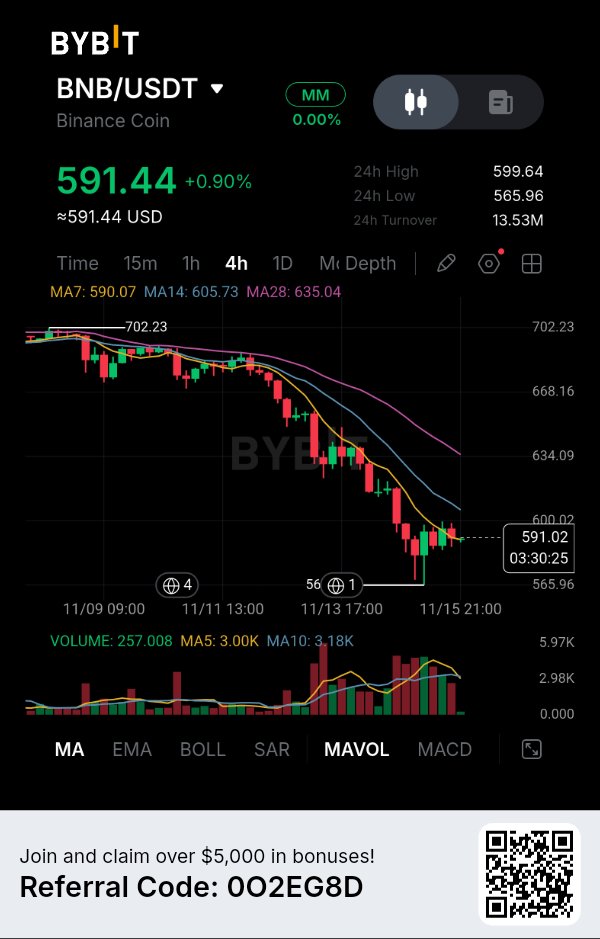
$BNBUSDT — Network Activity Remains High, But the Token Is Struggling to Recover. BNB is showing a small recovery on the 4H chart, but I don't think buyers have regained control yet. The interesting part is that BNB Chain continues processing millions of transactions while its native token is trading well below its recent price levels. This creates an important distinction between network activity and market demand. A busy blockchain does not automatically mean its native asset must appreciate. MARKET DATA — BYBIT 4H CHART According to your chart: Price: $591.44 24H change: +0.90% 24H high: $599.64 24H low: $565.96 24H turnover: $13.53M MA7: $590.07 MA14: $605.73 MA28: $635.04 For separate market context, the latest November 15 aggregated snapshot reports BNB around $598.52, with approximately $78.58B market capitalization and $1.48B futures volume. These figures are separate from your chart snapshot. WHAT THE CHART IS REVEALING BNB has experienced a sustained decline from the visible $702.23 region. The recent selling pushed price toward $565.96, where buyers attempted a recovery. Price has now moved slightly above MA7 at $590.07, but MA14 at $605.73 and MA28 at $635.04 remain overhead. This is an important distinction: the short-term bounce is visible, but the broader 4H structure remains weak. The $599–$606 region is the immediate resistance area I am watching. Meanwhile, $565.96 remains the important support. THE FUNDAMENTAL SIDE — BNB CHAIN IS STILL EXPANDING One development worth watching is the upcoming Jenner upgrade. On November 3, BNB Chain released version 1.8.2, scheduling the BSC mainnet Jenner hard fork for December 8, 2026. One important addition is Payment Lane, which reserves 5% of block gas capacity by default for eligible BNB transfers and approved payment transactions. This matters because BNB Chain is trying to make payment transactions more reliable during periods of network congestion. There is also measurable network activity. On November 14, BNB Smart Chain recorded approximately 17.42 million transactions, while network fees reached 713.21 BNB for that day. Its stablecoin supply stood around $11.56 billion. These figures suggest that BNB Chain has substantial usage beyond speculative trading. TOKEN ECONOMICS — THE BURN MECHANISM On October 19, BNB Chain completed its 37th quarterly burn, removing 1,646,196.44 BNB from circulation, worth approximately $1.197 billion at the time. The remaining supply was reported at approximately 131.51 million BNB. BNB also serves as the gas and governance asset across the BNB Chain ecosystem. What interests me is the combination of network utility and systematic supply reduction. However, burns do not guarantee price appreciation, particularly when broader market demand is weakening. MY INTERPRETATION I keep coming back to one contradiction: BNB Chain is processing substantial transaction activity, but BNB's chart still reflects considerable selling pressure. The network has a clear development roadmap, and the upcoming Payment Lane upgrade could strengthen its payment infrastructure. However, the market needs more than network activity to establish a sustainable recovery. Buyers must demonstrate that they are willing to absorb selling pressure around the current resistance zones. MY TRADING PLAN — CONDITIONAL SHORT The broader 4H structure currently favors downside continuation. Trigger: 4H candle closes below $565.96, followed by a failed retest. Entry: $563–$566. Stop-loss: $578. TP1: $552. TP2: $540. TP3: $525. Using a representative entry of $564.50: Potential downside to TP3: 7.00%. Defined risk: 2.39%. Estimated risk-to-reward: 2.93:1. This is a conditional setup, not an immediate entry. I would wait for the support breakdown and failed retest. MY FINAL VIEW BNB has something many tokens struggle to demonstrate: an established network with substantial transaction activity, payment infrastructure and a recurring supply-reduction mechanism. But the current chart highlights an important distinction between ecosystem strength and token performance. For me, the next test is whether BNB can turn its network activity into enough market demand to reclaim the $605–$635 resistance region. Until then, the recovery remains technically incomplete. $BNBUSDT #ByXIMPACT

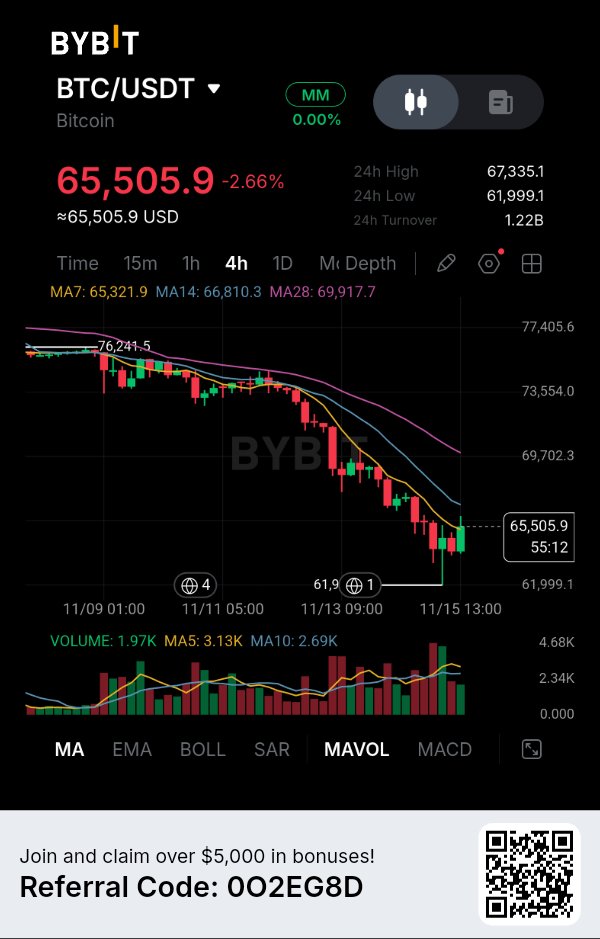
$BTCUSDT — 比特幣正試圖從 61,999 美元反彈,但更重要的問題是,買家能否將這波反彈轉化為市場結構的實質改變。 這張圖表最令我感興趣的是比特幣從前期高點以來的跌幅。在 4 小時圖上,BTC 從 76,241 美元區域一路下滑,不斷形成更低的高點和更低的低點。最近的拋售潮將價格推向 61,999 美元,隨後買家進場並帶來了明顯的反彈。 比特幣目前的交易價格約在 65,505.9 美元。這是一個令人鼓舞的反應,但我不想將反彈 K 線誤認為是確認的反轉訊號。 移動平均線給了我另一個保持謹慎的理由。MA7 約在 65,321.9 美元,而 MA14 位於 66,810.3 美元,MA28 則接近 69,917.7 美元。 價格雖然設法收復了短期的 MA7,但另外兩條移動平均線仍處於上方壓力位置。這對買家來說是一個重要的考驗:他們能否收復 66,810 美元並最終挑戰 69,900 美元區域?還是賣方會利用這次反彈建立另一個更低的高點? 我特別關注 66,800 至 67,335 美元這一區間。它結合了 MA14 和 24 小時可見高點,使其成為觀察潛在阻力回調的重要區域。 我傾向的方案是做空(SHORT),但前提是比特幣要反彈進入該區域,且賣方證明他們仍在防守阻力位。 🎯 我的下跌目標 TP1:64,000 美元 TP2:62,000 美元 TP3:60,000 美元(預估延伸位) 風險管理 我的條件式交易計畫: 進場區間:66,800–67,335 美元 止損:70,100 美元 確認訊號:4 小時圖在進場區間出現看跌回調。 失效條件:4 小時圖在 70,100 美元上方持續站穩。 最終目標是一個預測的延伸位,而非已確認的支撐位。這些點位描述的是潛在的交易設置,而非已執行的倉位。 如果比特幣收復 MA14 並開始構築更高的低點,我會重新評估我的看空觀點。如果市場開始證明我錯了,我不想死守著做空的念頭。 我學到的是,在長期的下跌之後,第一次反彈往往具有欺騙性。有時最重要的決定並非預測比特幣接下來的走向,而是等待觀察買家是否真的能守住他們剛收復的陣地。 目前,我正在觀察一個關鍵問題:比特幣是在為復甦打基礎,還是買家只是給了賣方另一個將市場推向更低點的機會?$BTCUSDT #ByXIMPACT

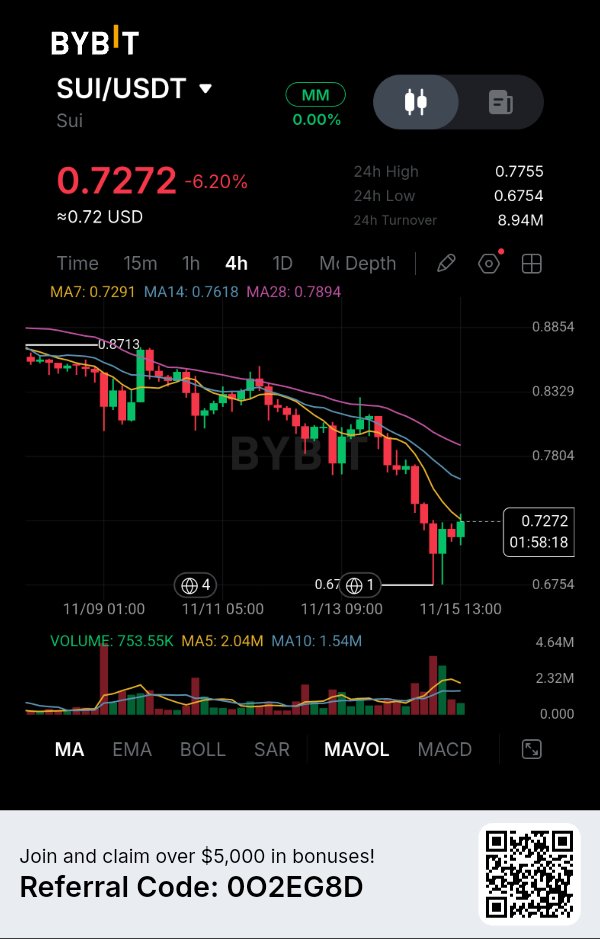
自 $0.6754 的反彈面臨一個更大的問題——賣方仍在掌控結構。 SUI 下跌了 6.20%,但我最感興趣的是它在近期急劇下跌後的表現。買方設法在 $0.6754 處實現了復甦,但價格仍在最快移動平均線附近掙扎。這引出了一個重要的問題:買方是在為真正的復甦做準備,還是這僅僅是既定下跌趨勢中的又一次暫時反彈? 在圖表提供更強有力的證據之前,我傾向於後一種可能性。 市場結構 — 下行壓力並未消失 SUI 目前交易價格約為 $0.7272,24 小時高點為 $0.7755,低點為 $0.6754。 觀察 4 小時圖,整體結構已較先前近 $0.8713 的高點顯著惡化。 價格持續形成更低的高點和更低的低點,反彈嘗試屢次未能收復先前的阻力位。 最近一波拋售將 SUI 推向了 $0.6754,買方終於在此介入。 隨後的綠色蠟燭顯示出一些買盤興趣,但相較於之前的下跌,復甦仍然相對微弱。 對我來說,重要的區別在於買方雖然守住了低點,但尚未改變更廣泛的市場結構。 移動平均線正形成上方阻力 三個指標值得特別關注: - MA7: $0.7291 - MA14: $0.7618 - MA28: $0.7894 SUI 目前的交易價格略低於 MA7,且遠低於 MA14 和 MA28。 排列方式也維持看跌,最快移動平均線低於中期平均線,且兩者均低於 MA28。 這形成了一個買方必須克服的阻力序列。 第一個挑戰是收復 $0.7291。在此之後,$0.7618 區域變得尤為重要。 我會更關注 $0.7894,因為收復這條長期移動平均線將代表 4 小時結構出現更有意義的改善。 在這些水平被收復之前,我將當前的反彈視為復甦嘗試,而非確認的趨勢反轉。 成交量 — 復甦缺少一個重要成分 這是我保持謹慎的原因。 顯示的成交量約為 753.55K,而: - MA5: 2.04M - MA10: 1.54M 當前成交量遠低於這兩個平均值。 這表明最近的復甦並未吸引近期交易活動中那樣的參與水平。 我不會單單將此解釋為分發籌碼的證據,但它確實讓當前的反彈顯得不那麼令人信服。 如果買方真心打算反轉趨勢,我希望看到在收復阻力位時伴隨著更強的參與度。 幾根沒有顯著成交量放大的綠色蠟燭不足以改變我的評估。 決定下一步走勢的水平 $0.6754 區域現在是一個重要的參考點。 買方捍衛了這個水平,但市場仍需證明它能夠建立更高的高點,並維持在移動平均線集群上方的復甦。 如果 SUI 反彈至 $0.7480–$0.7620 並再次遭遇拒絕,這可能會給賣方提供新的機會。 然而,若 4 小時圖強勢突破阻力結構,將會削弱看跌觀點。 這就是為什麼我對 SUI 在反彈期間的反應比追逐當前跌勢更感興趣。 我的交易策略 — 做空 (SHORT) 鑑於下跌的市場結構、看跌的移動平均線排列以及反彈期間相對疲軟的成交量,我偏好的方向仍然是「做空」。 - 方向: 做空 (SHORT) - 入場區間: $0.7480–$0.7620 - 確認: 4 小時圖在入場區間出現看跌拒絕。 - 止損: $0.7950 - TP1 (止盈1): $0.6754 - TP2 (止盈2): $0.6500 - TP3 (止盈3): $0.6250 預估盈虧比: 約 1:1.5 至 1:3.8,具體取決於入場和執行。 TP1 基於圖表可見的低點,而 TP2 和 TP3 是預測的下行延伸,而非截圖中顯示的已確認支撐位。 若 4 小時圖持續運行在 $0.7950 以上,將使此設置失效。如果價格在未提供預期入場點的情況下下跌,我會避免追漲殺跌。 什麼可能改變我的觀點? 若能令人信服地收復 $0.7618,隨後在更強的買盤成交量推動下突破 $0.7894,我將重新考慮看跌前景。 那將表明買方終於做到了不僅僅是捍衛低價。 總結 SUI 在 $0.6754 附近找到了買方,但找到支撐僅僅是個開始。真正的考驗是這些買方能否收復那些屢次阻礙反彈的阻力位。 $SUIUSDT #ByXIMPACT

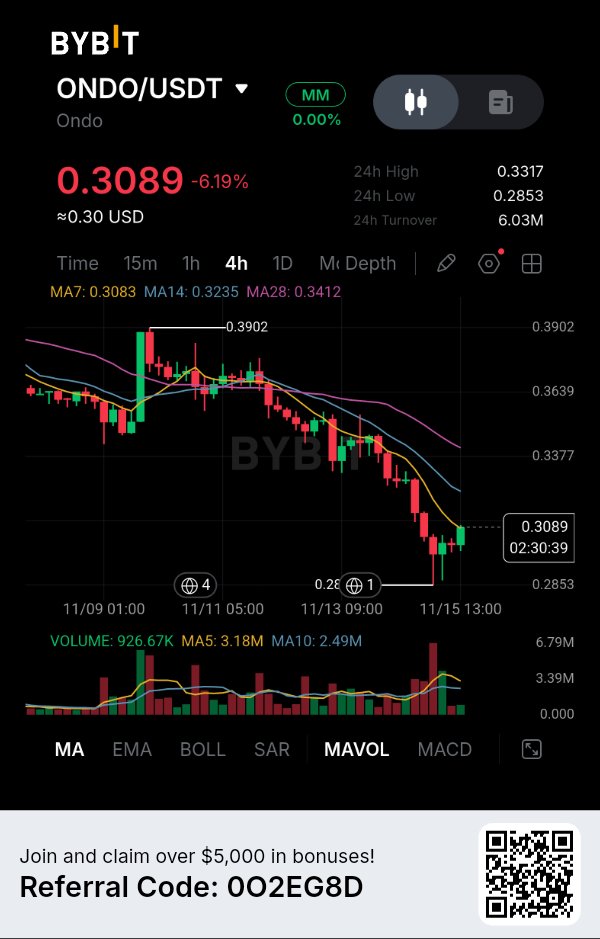
$ONDOUSDT — 真實世界資產 (RWA) 的採用率正在擴大,但代幣本身卻面臨著截然不同的現實。 儘管 RWA 領域持續發展,ONDO 目前卻承受著賣壓。這張圖表最引人注目的是,Ondo 不斷擴大的金融產品與其代幣價格目前顯現的疲軟之間存在著落差。 我特別關注即將到來的供應時間表。該專案正在開發新的金融應用場景,但市場也必須隨著時間推移消化額外釋出的代幣。 市場數據 — 4 小時圖 根據您的 Bybit 圖表: 當前價格:$0.3089 24 小時變動:-6.19% 24 小時最高價:$0.3317 24 小時最低價:$0.2853 24 小時成交額:$6.03M MA7:$0.3083 MA14:$0.3235 MA28:$0.3412 11 月 15 日的最新市場快照顯示,ONDO 價格約在 $0.30 左右,市值約為 14.7 億美元,全球 24 小時交易量為 1.84 億美元。流通供應量約為 48.7 億枚,最大供應量為 100 億枚代幣。 圖表揭示的訊號 在未能維持先前向 $0.3902 的回升後,ONDO 一直呈現下跌結構。 目前價格在 MA14 和 MA28 以下運行,而 MA7 則貼近現價。這顯示短期買家正試圖穩定市場,但整體的 4 小時圖結構仍然偏弱。 即時支撐位在 $0.2853。買家曾在此水平做出反應,帶動了向 $0.3089 的小幅回升。 然而,成交量揭示了故事的另一面。最新顯示的成交量為 92.667 萬,而 MA5 為 318 萬,MA10 為 249 萬。此波反彈尚未展現出令人信服的參與度。 基本面敘事 — ONDO 正在擴大其產品範圍 最近有一個發展引起了我的注意。 11 月 14 日,Spout Finance 宣布了在 Solana 上推出以代幣化美股作為擔保的 USDC 貸款計畫。Ondo 是 Spout 的投資者,該公告指出,當產品上線時,由 Ondo 支援的代幣化資產預計將被接受為擔保品。 這很有趣,因為代幣化金融資產最終可能不只是被持有而已。將其用作擔保品引入了另一種潛在的金融應用場景。 Ondo 的更廣泛平台也報告了約 9.6579 億美元的 TVL(總鎖倉價值),顯示其代幣化資產生態系統擁有龐大的相關資金。 代幣經濟學的矛盾 這是我變得更加謹慎的地方。 根據 DefiLlama 的解鎖時間表,約 9.1805 億枚 ONDO 代幣預定於 2027 年 1 月 17 日解鎖。以 11 月 15 日的參考價格計算,該分配額價值約 2.7464 億美元,相當於流通供應量的約 18.85%。 這並不代表每個解鎖的代幣都會立即被拋售。然而,這確實構成了一個需要考慮的重要供應因素。 目前,ONDO 最大供應量的約 48.7% 正在流通。在評估其估值時,未來的分配情況是一個重要的考量點。 我的解讀 我不斷回歸到一個區別:Ondo 的產品擴張與 ONDO 代幣的需求是兩回事。 代幣化股票、金融產品和擔保品應用可以增強生態系統,但投資者仍然需要了解這些發展如何直接轉化為原生代幣的價值。 即將到來的代幣解鎖為該方程式增加了另一個變數。 我的交易計畫 — 條件式做空 目前的 4 小時圖結構有利於下行延續的布局。 觸發條件:4 小時 K 線收於 $0.2853 以下,隨後反彈測試失敗。 進場點:$0.2830 – $0.2860。 止損點:$0.2960。 TP1 (止盈 1):$0.2750。 TP2 (止盈 2):$0.2650。 TP3 (止盈 3):$0.2550。 若以代表性的 $0.2845 進場點計算: 至 TP3 的潛在下跌空間:10.37%。 定義風險:4.04%。 預估盈虧比:2.57:1。 TP2 和 TP3 是圖表顯示支撐位下方的預估目標,而非已確定的支撐位。此設置在跌破且反彈測試失敗發生前均無效。 我的最終觀點 Ondo 正圍繞一個重要的金融趨勢進行建設:將傳統資產引入基於區塊鏈的金融系統。 但我認為僅靠生態系統的擴張並不能保證代幣價格的上漲。 下一個挑戰是證明新的金融產品在流通供應量持續增加的同時,能夠產生可持續的經濟需求。 對於 ONDO 而言,真實世界資產的採用、代幣實用性與未來供應之間的關係,可能比下一次的短期價格反彈更為重要。 $ONDOUSDT #ByXIMPACT

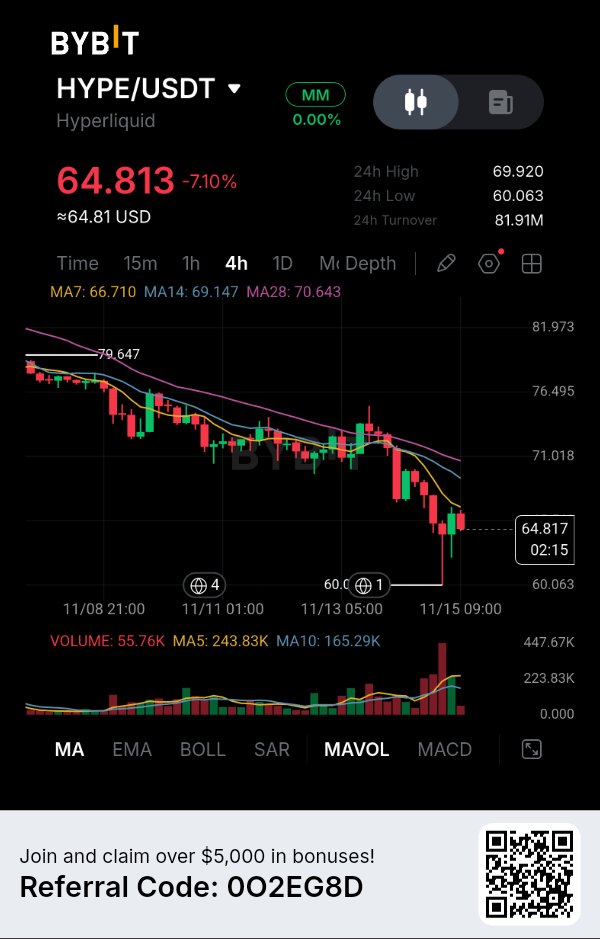
$HYPEUSDT — 從 $60.06 的反彈值得關注,但更廣泛的 4 小時線結構仍然對賣方有利。 引起我注意的是 HYPE 在 79.64 美元附近交易後跌勢有多猛。這次下跌不只是小幅回調。價格持續形成更低的高點,最近的一波拋售更將其推向 60.063 美元,買方才勉強做出反彈。 HYPE 目前交易價格約為 64.81 美元,跌幅為 7.10%。儘管反彈顯示出一些買盤興趣,但我尚未確信賣方已失去控制。 移動平均線解釋了我為何保持謹慎。MA7 位於 66.71 美元,MA14 位於 69.14 美元,而 MA28 則位於 70.64 美元。這三條均線仍高於當前價格,形成了一個買方需要克服的阻力區。 有一個細節我覺得特別有趣:在 60.06 美元附近的強勁拒絕伴隨著交易量的增加。買方做出了回應,但復甦尚未改變更低高點的序列。 我不希望將支撐位的反應誤認為是確認的趨勢反轉。 我偏好的做法是觀察是否能回升至 66.70–69.15 美元區間。如果 HYPE 到達該區域且賣方再次拒絕,我相信現有的看跌結構可能會提供更好的做空機會。 我首先看向 62 美元,隨後是 60.06 美元附近的近期低點。如果該水平在持續的拋售壓力下被跌破,則有可能進一步延伸至 57.50 美元。 風險管理 我的條件式交易計畫如下: 方向:做空 (SHORT) 入場區間:$66.70–$69.15 停損:$71.30 目標價 1 (TP1):$62.00 目標價 2 (TP2):$60.06 目標價 3 (TP3):$57.50 (預估延伸點) 我希望在入場區間內看到看跌確認訊號,而不是僅僅因為價格觸及就下單。如果 4 小時線持續收於 71.30 美元上方,將使此設定失效。 我看到的風險是從 60 美元支撐區再次出現強勁反彈。如果買方奪回移動平均線並開始建立更高的低點,我將不得不重新考慮我的看跌觀點。 我學到的是,在劇烈拋售後,耐心往往比試圖抓住下一根 K 線更有價值。 目前,我正在觀察 $HYPE 的下一次反彈是會變成另一個更低的高點,還是買方終於有足夠的力量挑戰更廣泛的下跌趨勢。$HYPEUSDT #ByXIMPACT

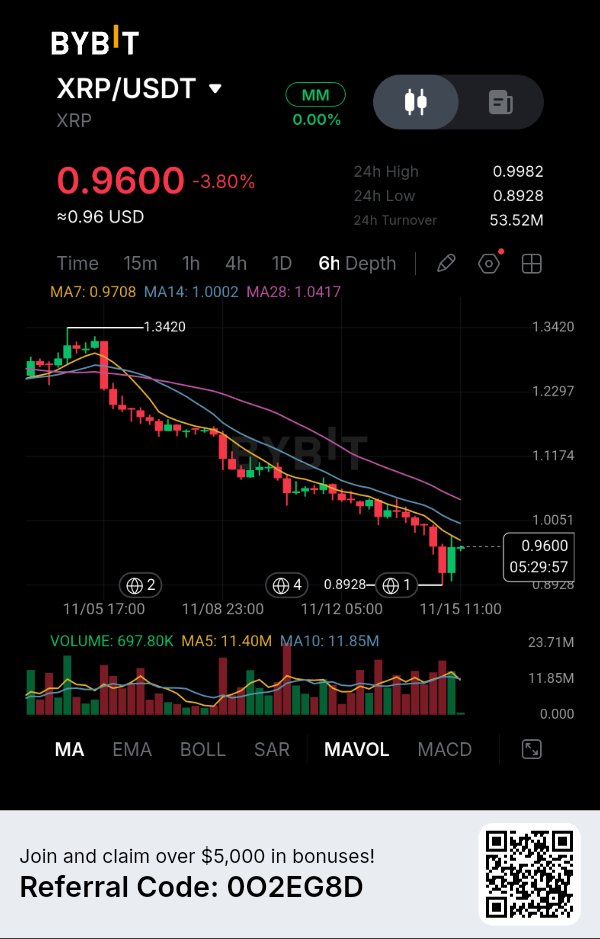
從 $0.8928 的反彈看起來很有趣,但賣方尚未失去控制權。XRP 已從近期低點回升,但我並未將此次反彈視為趨勢反轉的跡象。在 6 小時圖上,值得注意的是目前價格與三條移動平均線之間的距離。買方雖然設法中斷了跌勢,但在整體結構改變之前,他們仍有幾個阻力位需要克服。 有時,最重要的信號並非價格反彈的力度,而是反彈在何處開始失去動能。 市場結構 — 下行趨勢保持不變 XRP 目前交易價格約為 $0.9600,下跌 3.80%,24 小時高點為 $0.9982,低點為 $0.8928。 6 小時圖的整體結構顯示,價格從約 $1.3420 持續下跌。 低點不斷下移且高點不斷降低的情況主導了圖表,幾次嘗試復甦均未能確立有意義的看漲反轉。 最新的拋售潮將 XRP 推向 $0.8928,買方最終在那裡嘗試捍衛市場。 價格此後回升至 $0.9600 附近,但這只是在更大下跌結構中的短期反彈。 我想觀察這次復甦是能收復阻力位,還是賣方會將其視為另一個進場機會。 三條移動平均線,一個明確的訊息 顯示的移動平均線為: - MA7:$0.9708 - MA14:$1.0002 - MA28:$1.0417 這三條均線仍皆高於當前價格。 它們的看跌排列尤為重要,因為最快均線位於中期均線下方,而中期均線又位於長期均線下方。 這顯示賣壓並非僅限於單一孤立的 K 線。 第一個阻力區在 $0.9708 附近,其次是 $1.0002。在這些水準之上,$1.0417 附近的 MA28 代表另一個重大障礙。 對於買方而言,收復這些均線將是修復受損市場結構的重要一步。 在此之前,我對將此復甦稱為反轉持謹慎態度。 成交量 — 復甦仍需市場參與 有一個細節值得特別關注。 顯示的成交量約為 697.80K,而 MA5 為 11.40M,MA10 為 11.85M。 當前成交量遠低於這兩條均線。 這顯示最新的復甦目前並未伴隨著相對於均線的強勁成交量參與。 我不會自動將其解讀為賣方消失或買方正在累積。 相反地,我想觀察當 XRP 接近移動平均線阻力群時,交易活動是否會擴大。 若沒有更強的參與度,這次復甦可能難以發展成可持續的上漲行情。 $0.8928 的水準比看起來更重要 對我來說,這張圖表最有趣的部分是近期低點與上方阻力位之間的關係。 買方已經捍衛了 $0.8928,但尚未收復先前在下跌過程中充當支撐的水準。 這造成了一種重要的失衡。 市場展現出一些在低價買進的意願,但尚未展現出足夠的實力來挑戰更廣泛的看跌結構。 如果 XRP 接近 $0.98–$1.00 並再次遭遇拒絕,那可能會創造一個更具吸引力的下行機會。 然而,若帶量強勁突破 $1.0002,則會使看跌解讀的說服力下降。 我的交易策略 — 做空 基於目前的 6 小時趨勢和移動平均線的位置,我偏好的方向是做空 (SHORT)。 我寧願在反彈至阻力位時進場,也不願在已經大幅下跌後追空 XRP。 - 方向:做空 (SHORT) - 進場區間:$0.9850–$0.9980 - 確認條件:在進場區間內出現 6 小時看跌拒絕信號。 - 止損:$1.0250 - TP1 (目標價1):$0.8928 - TP2 (目標價2):$0.8600 - TP3 (目標價3):$0.8300 預估風險/回報比:約 1:2.6 到 1:5.0,取決於進場和執行情況。 TP1 是基於圖表上的可見低點,而 TP2 和 TP3 是預計的下行延伸空間,而非此截圖上已確認的支撐位。 若 6 小時線持續收在 $1.0250 上方,則此設置失效。如果價格在沒有提供計劃進場點的情況下下跌,我會選擇不追單。 什麼會改變我的觀點? 若能令人信服地收復 $1.0002,隨後伴隨更強的買盤參與,將會削弱我的看跌觀點。隨後若能站上 $1.0417,將提供進一步證據證明整體結構正在改善。 最終想法 XRP 已經表明買方願意捍衛 $0.8928。下一個挑戰是證明他們能夠收復賣方在整個下跌過程中一直控制的阻力水準。 反彈可以改變 K 線,但唯有結構性的復甦才能改變趨勢。$XRPUSDT #ByXIMPACT

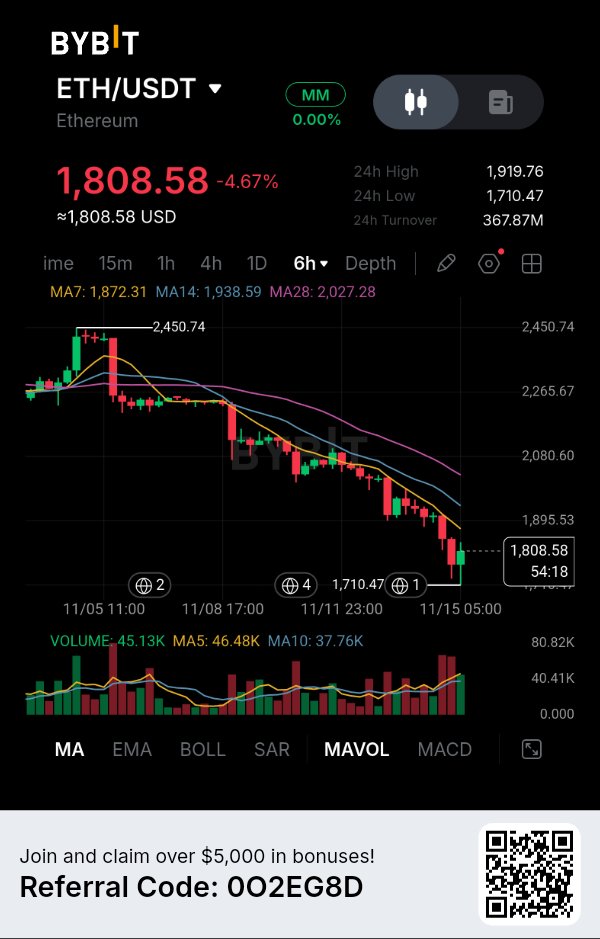
$ETHUSDT — The recovery from $1,710 is interesting, but I'm not convinced buyers have done enough to change the larger structure. Ethereum is trading around $1,808.58 on the 6H chart after an extended decline from the $2,450 area. What caught my attention is the latest reaction near $1,710.47. Buyers managed to push price away from that low, but the recovery is still facing several obstacles. The part I find most important is the position of the moving averages. The MA7 is sitting at $1,872.31, the MA14 at $1,938.59, and the MA28 at $2,027.28. All three remain above the current price and are pointing downward. To me, this suggests that the market has not yet established a convincing recovery structure. A bounce from support is worth watching, but I don't want to mistake it for a confirmed trend reversal. I'm particularly interested in what happens around $1,850–$1,872. If ETH returns to this region and buyers fail to reclaim the MA7, another rejection could give sellers an opportunity to continue the existing trend. My preferred scenario is a SHORT after confirmation of that rejection. I'm not interested in selling simply because price has already fallen. I'd rather let the market recover into resistance and show whether sellers are still willing to defend it. My downside objectives are $1,750 first, followed by the recent low around $1,710. If that support breaks with continued selling pressure, an extended move toward $1,650 becomes a possibility. Risk Management My conditional setup uses: Entry Zone: $1,850–$1,872 Stop Loss: $1,945 TP1: $1,750 TP2: $1,710 TP3: $1,650 (estimated extension) A sustained recovery above $1,945 would invalidate this particular bearish idea. These levels are a proposed setup, not an executed position. I also don't want to ignore the possibility of buyers defending $1,710 again. If ETH starts reclaiming its short-term moving averages, I'll have to reconsider my bearish outlook rather than remain attached to one direction. I've learned that the best entries don't always come when the market is moving fastest. Sometimes the more important opportunity appears when price returns to a level where both buyers and sellers have something to prove. For now, I'm watching whether ETH turns the next recovery attempt into another lower high, or finally gives buyers a reason to challenge the broader downtrend. $ETHUSDT #ByXIMPACT

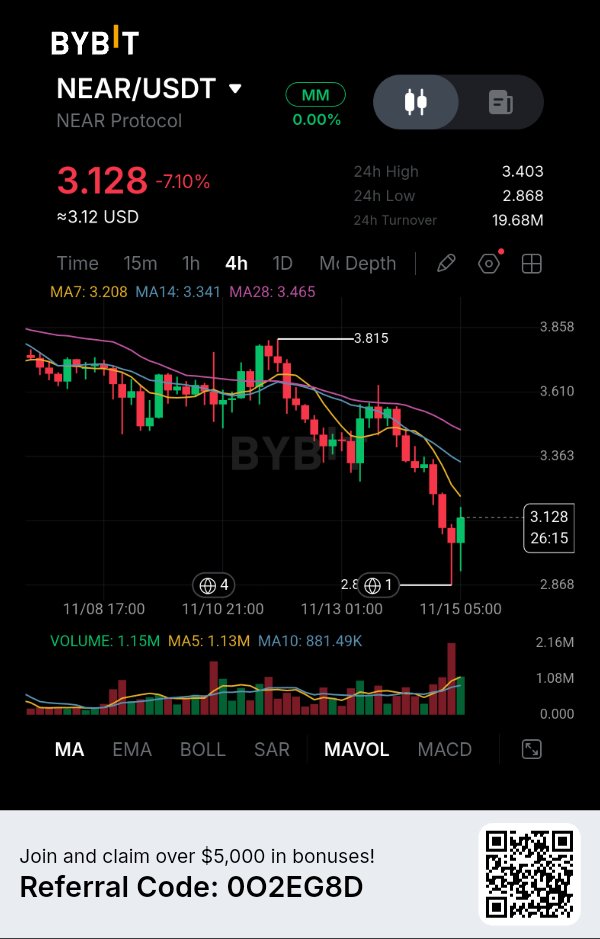
2.868 美元的價位已成為買方最重要的考驗。NEAR 在 4 小時圖上已下跌超過 7%,有趣的是賣方將價格壓低至三條移動平均線下方的速度之快。買方雖試圖從 2.868 美元處反彈,但我認為單一次的反彈不足以改變市場結構。 最引人注目的是價格下跌、交易活動增加以及 DeFi 流動性減弱這三者的結合。一個專案持續開發與其代幣是否具備真實需求之間存在差異。 市場數據 — 您的 BYBIT 圖表 價格:3.128 美元 24 小時跌幅:-7.10% 24 小時高點:3.403 美元 24 小時低點:2.868 美元 24 小時成交額:1,968 萬美元 MA7:3.208 美元 MA14:3.341 美元 MA28:3.465 美元 以上數據為您截圖中顯示的數值,並非即時交易所報價。 圖表揭示的內容 NEAR 在未能維持向 3.815 美元反彈的走勢後,已形成下跌結構。 最近的拋售潮將價格推至 MA7、MA14 和 MA28 以下。這些均線目前呈現看跌排列,長天期移動平均線位於最高處。 2.868 美元區域是需要關注的直接支撐位。價格曾在該水平產生反應,出現回升至 3.128 美元的陽線,但反彈仍低於 3.208 美元的 MA7。 交易量提供了另一個細節。顯示的交易量為 115 萬,略高於 MA5 的 113 萬,也高於 MA10 的 88.149 萬。這顯示在近期價格變動中市場參與度有所增加。 基本面的矛盾 NEAR 的基礎設施故事依然活躍,但其經濟數據值得更密切關注。 根據 DefiLlama 11 月 14 日的數據,NEAR 廣泛追蹤的生態系統鎖倉量 (TVL) 約為 2.6538 億美元,30 天手續費達到 638 萬美元,協議收入為 192 萬美元。然而,TVL 在過去 30 天內下降了約 23%。 NEAR 原生鏈分別記錄了約 1.4933 億美元的 DeFi TVL、1.3338 億美元的穩定幣價值以及 952 萬美元的日均 DEX 交易量。 這種區別很重要,因為生態系統層面的活動與原生鏈的流動性並非同一回事。 還有一個值得監控的風險:DefiLlama 記錄了 2026 年 10 月 1 日發生了一起 380 萬美元的跨鏈橋與跨鏈安全事件。隨著生態系統在多個網絡間擴張,跨鏈安全已成為 NEAR 基礎設施故事的重要一環。 關於更多市場背景,CoinGlass 報告顯示 11 月 15 日 NEAR 價格約為 2.94 美元,24 小時跌幅為 14.53%,期貨持倉量約為 6.59 億美元。這是另一個即時市場快照,並非您 Bybit 截圖中顯示的價格。 我的解讀 我不斷回頭思考網絡擴張與資本信心之間的差異。 NEAR 具有顯著的基礎設施活動,但 TVL 下降和代幣價格走跌顯示,生態系統的發展目前不足以抵銷更廣泛的拋售壓力。 我會特別留意 2.868 美元。如果買方無法守住該價位,反彈企圖可能會失去剩餘的動能。 我的交易計畫 — 條件式做空 我選擇做空,因為目前的 4 小時結構偏向賣方。 觸發條件:4 小時 K 線收盤價低於 2.868 美元,隨後出現失敗的重新測試 (failed retest)。 入場價:2.85–2.87 美元。 止損:2.98 美元。 止盈 1:2.78 美元。 止盈 2:2.68 美元。 止盈 3:2.55 美元。 以 2.86 美元的代表性入場價計算: 至止盈 3 的潛在下行空間:10.84%。 既定風險:4.20%。 預估風險回報比:2.58:1。 止盈 2 和止盈 3 為預測目標位,並非圖表中可見的既定支撐位。此設置仍為條件式交易;在跌破且回測失敗前,我不會入場。 我的最終看法 NEAR 正面臨兩項不同的挑戰:維持市場對其生態系統基礎設施的信心,以及恢復對其原生代幣的需求。 下一個重要信號不僅僅是出現另一根陽線,而是買方是否能在守住關鍵支撐的同時,證明更廣泛的生態系統活動正轉化為可持續的經濟價值。 $NEARUSDT #ByXIMPACT

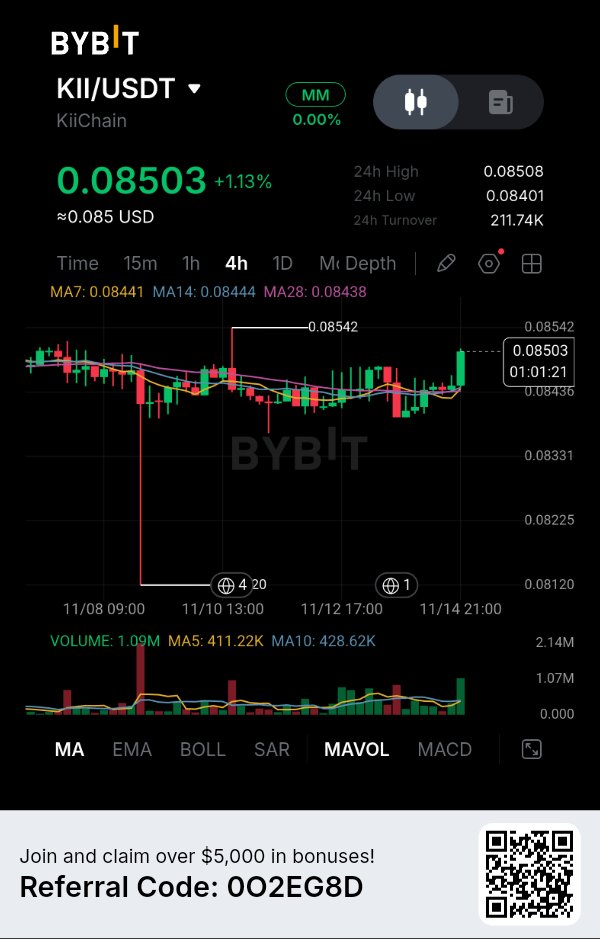
KiiChain 正在建構金融基礎設施,但其代幣供應量卻說明了另一回事。 KII 目前交易價格接近 0.085 美元,買方正試圖將價格推升至相對狹窄的盤整區間之上。我感興趣的是 KiiChain 不斷擴展的金融基礎設施,與尚未進入流通的代幣供應量之間的對比。 我認為這是一個重要的區別:區塊鏈可以吸引金融機構並處理真實交易,但其原生代幣仍需要一個可持續的經濟需求機制。 市場數據 — 4 小時線圖 根據您的 Bybit 圖表: 價格:0.08503 美元 24 小時漲跌幅:+1.13% 24 小時高點:0.08508 美元 24 小時低點:0.08401 美元 24 小時成交額:211,740 美元 MA7:0.08441 美元 MA14:0.08444 美元 MA28:0.08438 美元 截至 11 月 15 日的最新市場快照顯示,KII 價格約為 0.0844 美元,市值約 2,638 萬美元,日交易量為 581 萬美元。 圖表顯示了什麼 KII 一直在 0.0840 至 0.0850 美元之間橫盤整理,先前的下影線觸及約 0.08120 美元。 有趣的是,價格已經移動至所有三條移動平均線之上。MA7、MA14 和 MA28 均聚集在 0.0844 美元附近,顯示買方已獲得短期控制權。 即時阻力位為 0.08542 美元。如果能確認突破該水準,買方將有空間挑戰更高的價格。 成交量也值得關注。最新顯示的成交量為 109 萬,而 MA5 為 411,220,MA10 為 428,620。市場參與度有所增加,儘管仍需要持續的活躍度。 項目故事 — 真實的金融用例 KiiChain 正在開發用於跨境支付、外匯流動性和穩定幣結算的基礎設施。 9 月 9 日,KiiChain 宣佈與哥倫比亞的 Financiera Juriscoop 和 Banco Agrario 達成協議。其目標是將受監管的金融機構與其 24/7 全天候外匯和結算基礎設施連接起來。該公告還報告稱,已處理了超過 5 億美元的交易量,並擁有超過 200 家企業客戶。 另一個進展是在 10 月 22 日,Finoa Consensus Services 確認其在 KiiChain 主網上的驗證節點和預言機報價節點角色。這為網路增加了機構基礎設施的參與。 這些發展之所以重要,是因為 KiiChain 試圖解決的是實際的金融基礎設施問題,而不是僅僅依賴投機性的區塊鏈活動。 代幣經濟學的矛盾 這是我變得更加謹慎的地方。 KII 的最大供應量為 18 億枚代幣。市場數據提供商報告的流通供應量數據在 3.12 億至 3.54 億之間,突顯了他們在供應量計算上的差異。其完全稀釋估值 (FDV) 約為 1.52 億美元。 此外還有一個重要的供應事件。Tokenomics.com 列出 11 月 14 日解鎖了約 1,700 萬枚 KII,約佔最大供應量的 0.9%。預定日期已經過去,但實際的分配情況以及由此產生的市場影響仍需確認。 我的解讀是,KiiChain 的基礎設施擴張很有趣,但未來的代幣發行和解鎖可能會影響現有持有者所保留價值的多寡。 我的交易計畫 — 條件式做多 短期圖表結構有利於嘗試條件式突破。 觸發條件:4 小時 K 線收盤價高於 0.08542 美元,隨後成功回測。 進場位:0.08540–0.08555 美元。 止損位:0.08430 美元。 TP1:0.08620 美元。 TP2:0.08700 美元。 TP3:0.08800 美元。 使用 0.08545 美元的代表性進場價格: 至 TP3 的潛在上漲空間:2.99%。 設定風險:1.35%。 預估風險回報比:2.21:1。 在突破並回測發生之前,該交易設定保持無效。 我的最終看法 KiiChain 最有趣的機會在於它試圖將傳統金融工作流程與全天候區塊鏈結算相連接。 然而,我不認為僅憑機構整合就足以建立長期的代幣價值。 真正的考驗在於,隨著額外供應量持續進入流通,外匯活動的增加、金融合作夥伴關係和網路使用率能否為 KII 創造可持續的需求。 這是我會密切關注的關係。$KIIUSDT #ByXIMPACT

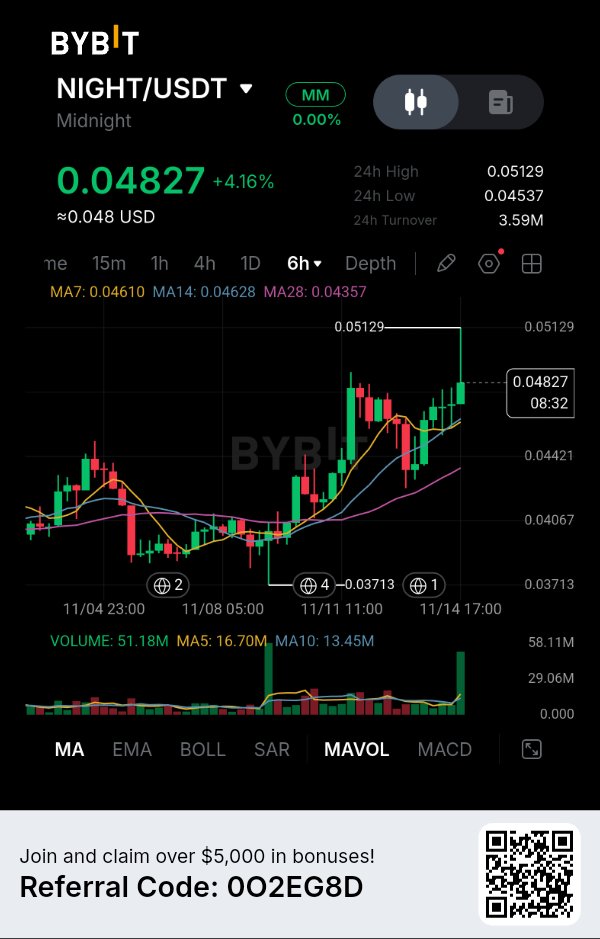
A Powerful Volume Expansion Is Changing the Short-Term Market Structure. NIGHT has gained 4.16%, but the most interesting development on this 6-hour chart is not the percentage increase. It is the combination of expanding volume, a strong recovery above all three moving averages, and a fresh attempt to challenge the $0.05129 resistance. What caught my attention is that this move looks different from the earlier sideways trading. Buyers are finally showing stronger participation, and the market is beginning to reflect that change. MARKET STRUCTURE — BUYERS HAVE TAKEN THE INITIATIVE NIGHT is currently trading around $0.04827, with a 24-hour high of $0.05129 and a low of $0.04537. Looking at the broader 6-hour structure, price previously spent considerable time consolidating around the $0.04000–$0.04200 region. The important change came when buyers pushed price above that range and accelerated the recovery. Since then, NIGHT has established stronger upward momentum, although the rejection near $0.05129 shows that sellers are still defending higher prices. I am particularly interested in whether the latest breakout can establish a higher support base rather than becoming another temporary upward spike. THE MOVING AVERAGES ARE SUPPORTING THE RECOVERY Three readings stand out: - MA7: $0.04610 - MA14: $0.04628 - MA28: $0.04357 Price is currently trading above all three moving averages. More importantly, the MA7 and MA14 are positioned above MA28, while price has moved considerably higher than the longer average. This suggests that short-term momentum has improved and the previous consolidation has developed into a stronger recovery structure. The $0.04610–$0.04628 region is particularly important because it contains both faster moving averages. If buyers defend this area during a pullback, it could become a useful foundation for another upward attempt. VOLUME — THIS IS THE SIGNAL I FIND MOST INTERESTING The volume data provides another important piece of evidence. - Current volume: 51.18M - MA5: 16.70M - MA10: 13.45M Current volume is substantially above both displayed averages. This is significant because the latest upward movement is accompanied by increased market participation. I would distinguish this from a low-volume price recovery, where a token rises without attracting meaningful trading activity. Here, the expansion in volume suggests that the latest move has attracted considerably more attention. However, high volume near resistance can also represent profit-taking. I want to see whether buyers can maintain participation rather than assuming every large volume candle represents accumulation. THE $0.05129 RESISTANCE BATTLE For me, this is where the next important decision will happen. NIGHT has already approached $0.05129, but the market has not yet established a convincing breakout above it. A successful 6-hour close above this level, supported by sustained volume, could open the door toward higher projected price areas. On the other hand, rejection followed by a breakdown below the moving-average support region would weaken the current bullish interpretation. The important distinction is that momentum has improved, but resistance still needs to be overcome. MY TRADING STRATEGY — LONG My preferred direction is LONG because the current price structure, moving-average positioning, and volume expansion favor buyers. I would prefer entering on a controlled pullback rather than chasing the latest green candle. - Direction: LONG - Entry Zone: $0.04650–$0.04720 - Confirmation: 6H support hold followed by renewed buying momentum. - Stop Loss: $0.04480 - TP1: $0.05129 - TP2: $0.05400 - TP3: $0.05700 Estimated Risk/Reward: Approximately 1:1.8 to 1:3.8, depending on entry and execution. TP1 is based on the visible resistance, while TP2 and TP3 are projected extensions rather than established resistance levels shown in the screenshot. A sustained 6-hour breakdown below $0.04480 would invalidate this setup. If price continues upward without offering the planned entry, I would avoid chasing it. WHAT COULD CHANGE MY VIEW? A rejection from $0.05129 followed by weakening volume and a loss of the moving-average support region would make me reconsider the bullish outlook. I want to see buyers defend the progress they have made, not simply create another temporary spike. FINAL THOUGHT NIGHT is showing something worth watching: price is rising alongside a substantial expansion in trading activity. The next challenge is turning that momentum into a sustainable breakout above resistance. $NIGHTUSDT #ByXIMPACT

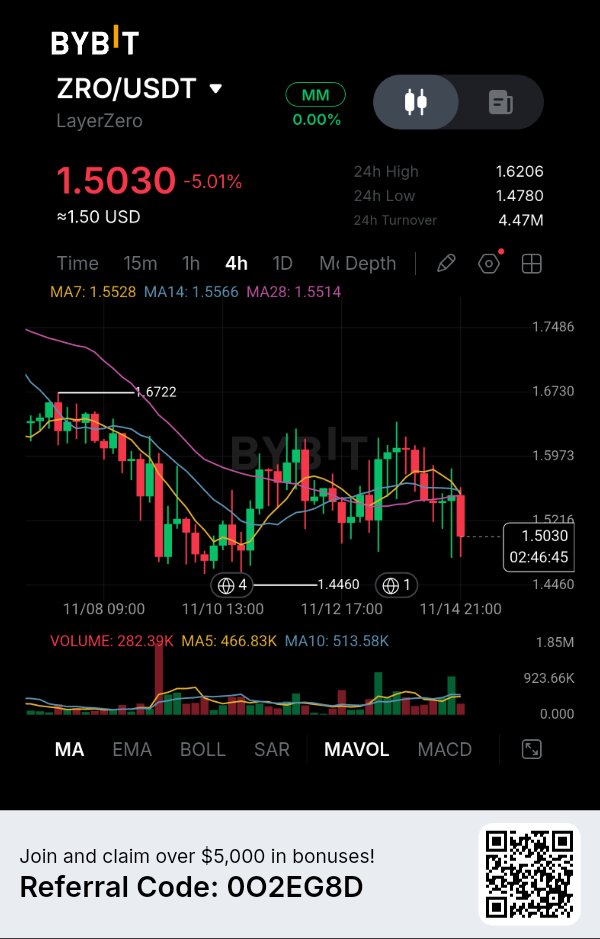
LayerZero Is Facing a Market Test as Selling Pressure Returns. ZRO is down 5.01% on the 4H chart, and what catches my attention is not just the decline. It's the fact that price has slipped below all three moving averages while approaching the $1.478 support area. For me, this creates an important question: is the market simply correcting after consolidation, or is demand weakening enough to push ZRO toward its previous swing low? MARKET DATA — 4H CHART Current price: $1.5030 24H change: -5.01% 24H high: $1.6206 24H low: $1.4780 24H turnover: $4.47M MA7: $1.5528 MA14: $1.5566 MA28: $1.5514 WHAT THE CHART IS REVEALING ZRO previously found support around $1.4460 and recovered toward the $1.60 region. However, buyers struggled to maintain that recovery. The latest decline has pushed price below MA7, MA14 and MA28. All three averages are clustered around $1.55, creating an overhead resistance zone. Another detail worth watching is volume. The latest displayed volume is 282.39K, below MA5 at 466.83K and MA10 at 513.58K. Selling pressure is visible, although the latest candle alone does not establish whether sellers are gaining sustained participation. The immediate support is $1.4780, followed by the previous swing low around $1.4460. THE FUNDAMENTAL STORY — A SUPPLY EVENT IS APPROACHING There is another reason I'm paying attention to ZRO right now. According to LayerZero's November 3 ecosystem update, holders of STG can continue converting their tokens into ZRO until December 15. The project is also updating ZRO's security configuration ahead of Zero mainnet, increasing the required DVN verification threshold to 4/4. The upcoming Zero mainnet launch, currently scheduled for November 30, is another important milestone. It could expand ZRO's role beyond governance into staking, gas payments and network security. But there's a supply consideration that deserves attention. DefiLlama's latest unlock schedule shows approximately 23.63 million ZRO tokens scheduled to unlock on November 19, worth around $35 million at the displayed valuation. This represents approximately 5.92% of the circulating float. That doesn't mean all unlocked tokens will immediately enter the market. However, it creates a potential supply overhang while traders are already dealing with weak technical structure. TOKEN ECONOMICS — AN IMPORTANT DISTINCTION LayerZero reports that its entities have deployed approximately $112.7 million into ZRO buybacks since September 2025. Stargate revenue has also been directed toward ZRO buybacks since April 2026. This creates an interesting economic structure: the project has mechanisms intended to connect ecosystem revenue with token demand, but upcoming unlocks introduce another variable. I think the market needs to evaluate both sides rather than focusing exclusively on buybacks or supply expansion. MY INTERPRETATION What stands out to me is the timing. Zero mainnet is approaching, LayerZero is strengthening its infrastructure, and the token has a scheduled unlock just days before the planned launch. The project has meaningful developments, but the token's immediate price behavior is showing hesitation. I would pay particular attention to whether the $1.478 support level survives. Losing it could expose the previous $1.446 low. MY TRADING PLAN — CONDITIONAL SHORT I'm selecting one direction because the current 4H structure favors downside continuation. Trigger: A confirmed 4H candle close below $1.478, followed by a failed retest. Entry: $1.465–$1.478. Stop-loss: $1.535. TP1: $1.446. TP2: $1.400. TP3: $1.350. Using a representative entry of $1.470: Potential downside to TP3: 8.16%. Defined risk: 4.42%. Estimated risk-to-reward: 1.85:1. This setup is conditional. I would not enter before the support breakdown and failed retest. MY FINAL VIEW LayerZero is approaching an important transition. Zero mainnet could introduce additional utility for ZRO, while the upcoming token unlock creates a near-term supply consideration. For me, the interesting question isn't simply whether LayerZero can expand its infrastructure. It's whether the upcoming network launch can create enough sustainable token demand to absorb new supply and strengthen the market structure. That relationship between network expansion, token economics and actual market demand is what makes ZRO worth watching. $ZROUSDT #ByXIMPACT

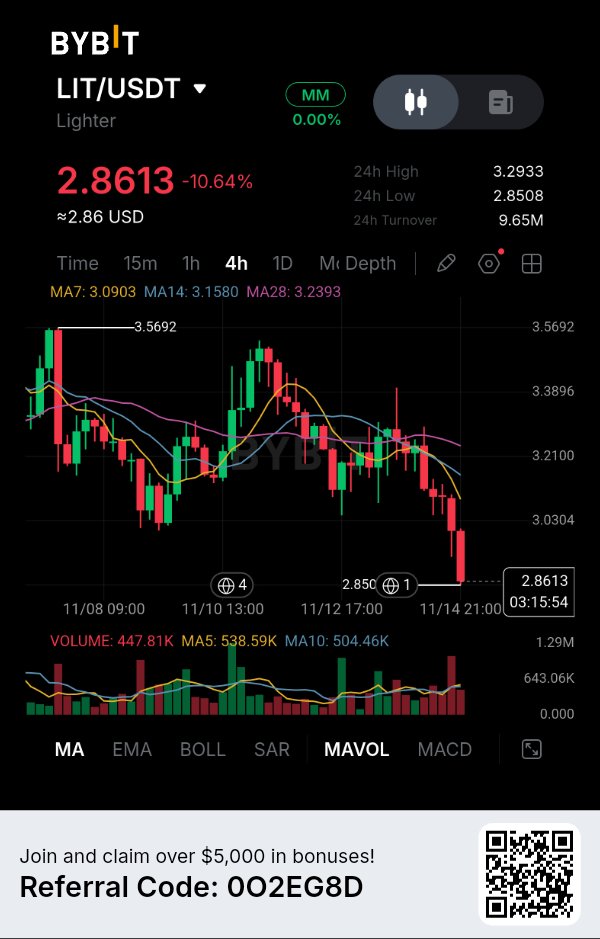
$LITUSDT — 下跌 10.64%,賣方目前正在測試最後可見支撐位! 這張圖表吸引我的不僅僅是劇烈下跌,而是 LIT 終於跌破了先前維持價格橫盤整理的區域。 LIT 目前交易價格約為 $2.8613,4 小時圖下跌 10.64%,此前曾測試近 $2.8508 的低點。 最新的 K 線顯示出強大的拋售壓力,且買方尚未展現出令人信服的復甦跡象。 技術面分析 移動平均線呈現明顯的看跌排列: MA7: $3.0903 MA14: $3.1580 MA28: $3.2393 價格低於這三條均線,短期 MA7 位於 MA14 和 MA28 下方。 另一個值得觀察的細節是成交量: 當前成交量:447.81K MA5 成交量:538.59K MA10 成交量:504.46K 跌幅顯著,但我想觀察若支撐再次跌破,賣方參與度是否會增加。 我的市場解讀 $2.8508 區域是我目前關注的直接點位。 如果 LIT 失守此支撐位且 4 小時 K 線確認跌破,可能會出現進一步的下行空間。 然而,經歷如此劇烈的下跌後,追漲當前價格對我來說並不具吸引力。若價格出現疲軟反彈至 $3.00–$3.09 區間,且遭到賣方拒絕,或許能提供更好的進場機會。 我的條件式交易計畫 — 做空 進場區間:$3.00–$3.09 止損:$3.17 止盈 1 (TP1):$2.8508 止盈 2 (TP2):$2.75 止盈 3 (TP3):$2.65 失效條件:若 4 小時 K 線持續回升至 $3.17 以上,此看跌設置將減弱。 TP2 和 TP3 為預測目標,並非目前圖表上已確認的支撐位。此做空設置需要確認反彈失敗後方可進場。 接下來的觀察重點 我不想假設一根大陰線就意味著肯定會繼續下跌。 真正的考驗在於買方能否守住 $2.8508,或者賣方是否會將此點位轉化為下一個阻力區。 若支撐失效,市場可能會開啟進一步下行的空間。 LIT 會守住 $2.85,還是賣方準備將其推向 $2.65?$LITUSDT #ByXIMPACT

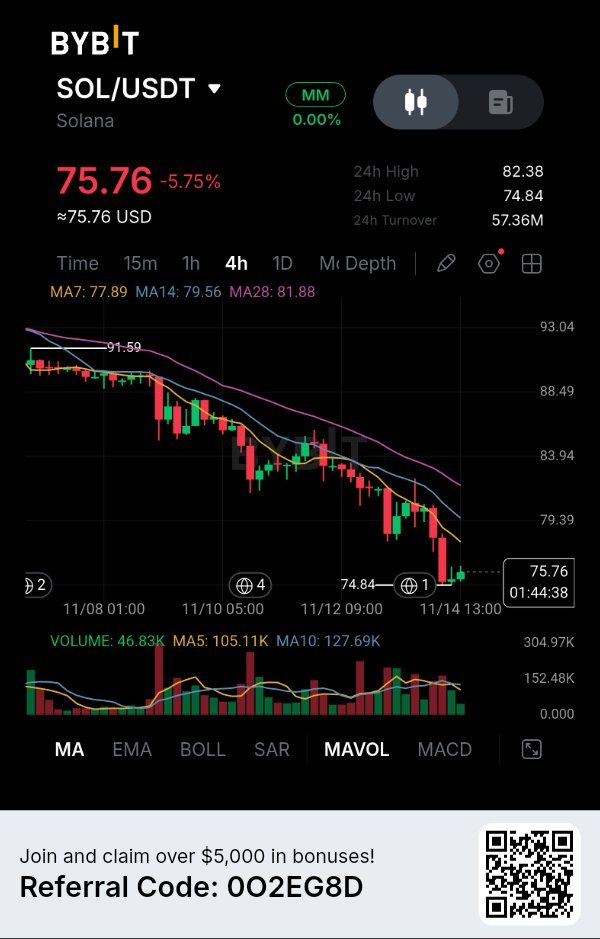
Solana Is Losing Support, and the Latest Bounce Isn't Convincing Yet. Solana has dropped 5.75%, but the most interesting detail on this 4-hour chart is not the size of the decline. It is how consistently sellers have defended the moving-average resistance zones. Every recovery attempt has struggled to change the broader structure, and the latest move toward $74.84 suggests buyers are still fighting an uphill battle. I am paying particular attention to whether this level becomes a temporary stopping point or simply another pause before the next downside move. MARKET STRUCTURE — THE SELLERS STILL CONTROL THE TREND SOL is currently trading around $75.76, with a 24-hour high of $82.38 and a low of $74.84. Looking at the 4-hour chart, the decline from approximately $91.59 has developed into a persistent sequence of lower highs and lower lows. What stands out is the absence of a meaningful structural recovery. Buyers have attempted several rebounds, but those moves have repeatedly encountered selling pressure before reclaiming previous swing levels. The latest decline has brought SOL close to its recent low of $74.84. This is an important area because a decisive breakdown could open the door to another downward extension. THE MOVING AVERAGES ARE REVEALING THE BIGGER PICTURE Three technical readings deserve attention: - MA7: $77.89 - MA14: $79.56 - MA28: $81.88 All three moving averages are above the current price, and their arrangement remains bearish. The fastest average is below the medium-term average, while both remain below MA28. This tells me that weakness is not limited to the latest candles. The broader 4-hour trend is also under pressure. The $77.89–$79.56 region is the first important recovery barrier. Above that, $81.88 represents another significant moving-average resistance. Until SOL starts reclaiming these levels, I would be cautious about interpreting short-lived green candles as a genuine reversal. VOLUME — A DETAIL THAT MAKES THE RECOVERY QUESTIONABLE The displayed volume is approximately 46.83K, compared with: - MA5: 105.11K - MA10: 127.69K Current volume is substantially below both volume averages. This suggests that the latest trading activity is relatively subdued compared with recent participation. I find this important because a sustainable recovery requires more than a temporary change in price direction. If buyers want to challenge the existing bearish structure, I would expect stronger participation during an upward move. Without that confirmation, any recovery toward the moving averages could attract renewed selling pressure. THE HIDDEN BATTLE AROUND $74.84 There is one level I believe deserves more attention than the daily percentage change: $74.84. This is the recent visible low, and SOL is trading relatively close to it. A successful defense could produce a short-term relief bounce toward $77.89. However, repeated pressure on the same support area can become dangerous for buyers, particularly when the broader structure continues producing lower highs. My interpretation is that sellers currently have the advantage, but I want to avoid entering directly into support. The more attractive opportunity would be a recovery toward overhead resistance followed by evidence that buyers cannot sustain the move. MY TRADING STRATEGY — SHORT I currently favor a SHORT setup because the 4-hour structure, moving-average alignment, and recent price behavior support continued downside pressure. - Direction: SHORT - Entry Zone: $77.80–$78.80 - Confirmation: Bearish rejection within the entry zone. - Stop Loss: $80.30 - TP1: $74.84 - TP2: $72.80 - TP3: $70.50 Estimated Risk/Reward: Approximately 1:1.2 to 1:3.3, depending on entry and execution. TP1 is based on the visible chart low, while TP2 and TP3 are projected downside extensions rather than confirmed support levels shown in the screenshot. A sustained 4-hour move above $80.30 would invalidate this setup. I would not chase the price if SOL continues falling without providing the planned entry. WHAT COULD CHANGE MY VIEW? A strong recovery above $79.56, followed by a successful reclaim of $81.88 with expanding volume, would make me reconsider the bearish outlook. That would suggest buyers are finally challenging the structure that has controlled this decline. FINAL THOUGHT Solana's next important move may depend less on how quickly it can bounce and more on whether buyers can reclaim the levels that sellers have repeatedly defended. For now, the trend deserves respect, and patience around resistance matters more than chasing every recovery candle. $SOLUSDT #ByXIMPACT

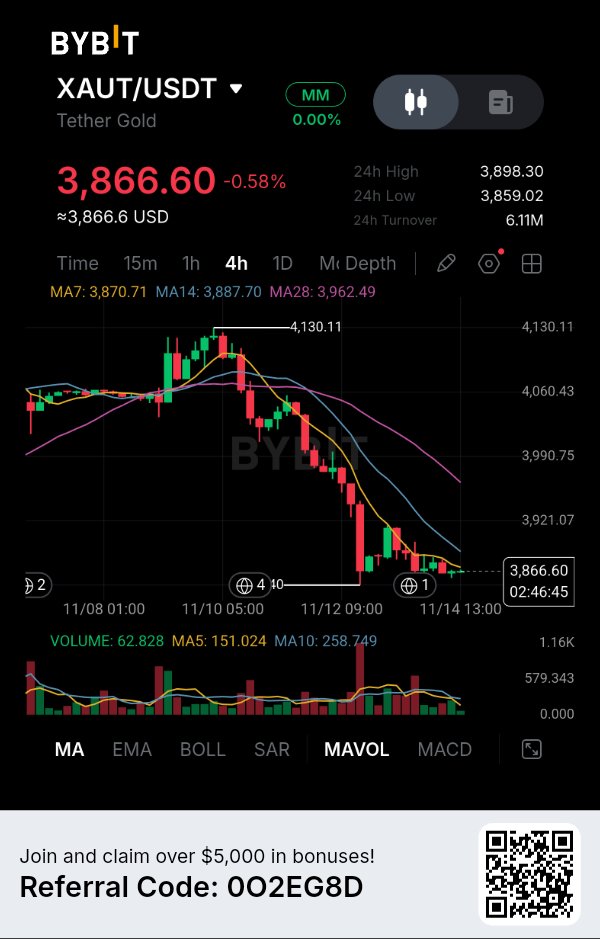
黃金維持價值,但 4 小時線圖卻呈現另一番景象。XAUT 目前有趣之處在於其作為黃金支持資產的角色與短期市場結構之間的差異。雖然黃金曝險可能仍具吸引力,但從線圖來看,買方在急跌後尚未奪回主導權。 我特別關注 $3,850–$3,870 區間,因為市場在從約 $4,130 下跌後,正試圖在此尋求支撐。 市場數據 — 4 小時線圖 現價:$3,866.60 24 小時漲跌幅:-0.58% 24 小時最高價:$3,898.30 24 小時最低價:$3,859.02 24 小時成交額:$6.11M MA7:$3,870.71 MA14:$3,887.70 MA28:$3,962.49 圖表揭示的內容 XAUT 從 $4,130 區域經歷了強勁下跌,隨後出現了一系列的高點下移與低點下移。 最近的 K 線顯示在 $3,860 附近有所穩定,但價格仍低於所有三條移動平均線。 MA7($3,870.71)是最近的阻力位,其次是 MA14($3,887.70)。更顯著的上方壓力位於 MA28($3,962.49)。 成交量也值得關注。顯示的最新成交量為 62.828,而 MA5 成交量為 151.024,MA10 成交量為 258.749。這表明近期的穩定尚未吸引到特別強勁的參與度。 基本面分析 — TETHER GOLD 的新信任里程碑 11 月 12 日有一項重要進展。 Tether 宣布,KPMG U.S.(美國畢馬威)完成了對 XAUT 發行方 TG Commodities 2025 年財務報表的獨立審計。該審計獲得了無保留意見,且 Tether 報告稱,支持代幣的實體金條已進行了物理檢查與清點。 對於黃金支持的數位資產而言,這一點至關重要,因為其價值主張不僅僅取決於市場需求。投資者還需要確信底層實體黃金真實存在。 另一個重要的數字。 根據 Tether 2026 年 9 月 30 日的儲備報告,XAUT 由 827,417.63 金衡盎司的實體黃金支持,相當於約 25.7 公噸。報告的儲備價值達到 34.4 億美元。每個 XAUT 代表擁有 1 金衡盎司的黃金。 這使得 XAUT 與傳統加密貨幣相比,擁有根本上不同的估值模型。 市場矛盾 儘管儲備透明度有所進步,市場仍經歷了明顯的回調。 CoinGecko 的 11 月 14 日歷史數據顯示,XAUT 的市值約為 31.3 億美元,24 小時交易量約為 1.93 億美元。11 月 13 日的收盤價約為 $3,872.86。 我所關注的是,儲備透明度的提高並不能自動防止短期的價格下跌。 XAUT 跟隨黃金底層市場。因此,即使其物理支持完好無損,價格仍可能下跌。 在評估此資產時,區分這一點很重要。 我的技術分析 4 小時線圖顯示,價格從約 $4,130 明顯跌至 $3,850–$3,860 區間。 目前 $3,866.60 的價格仍低於: MA7:$3,870.71 MA14:$3,887.70 MA28:$3,962.49 所有三條移動平均線皆位於市場上方,顯示復甦尚未改變短期結構。 即時阻力區為 $3,870–$3,900。 基於顯示的 24 小時低點,$3,859 區域是第一個重要的近期支撐位。 成交量與所顯示的移動平均值相比也相對有限,顯示買方尚未展現強勁的參與度。 我的交易計劃 — 條件式做空 我在等待 $3,859 支撐位被跌破,而不是僅僅因為線圖看起來疲軟就進場。 觸發條件:4 小時 K 線收於 $3,859 下方,隨後出現回測失敗。 進場:$3,855–$3,860。 止損:$3,898。 目標價 1:$3,840。 目標價 2:$3,815。 目標價 3:$3,785。 使用 $3,857.50 的代表性進場點: 至目標價 3 的潛在跌幅:1.88%。 設定風險:1.05%。 預估盈虧比:1.79:1。 下方目標為預測水位,而非已確認的歷史支撐區。在跌破與回測條件發生前,此設置保持無效。 我的最終觀點 我覺得 XAUT 很有趣,因為它將傳統黃金所有權與基於區塊鏈的資產轉移連結起來。 最近的 KPMG 審計增強了其透明度,而報告的實體儲備則為其價值主張提供了重要基礎。 然而,我將對其資產支持的信心與對短期價格走勢的信心區分開來。 目前,線圖仍承受壓力,$3,859 是我關注的水位。更宏大的議題在於,代幣化黃金是否能在持續擴張為金融工具的同時,維持使其具有價值的透明度與實體支持。$XAUTUSDT #ByXIMPACT

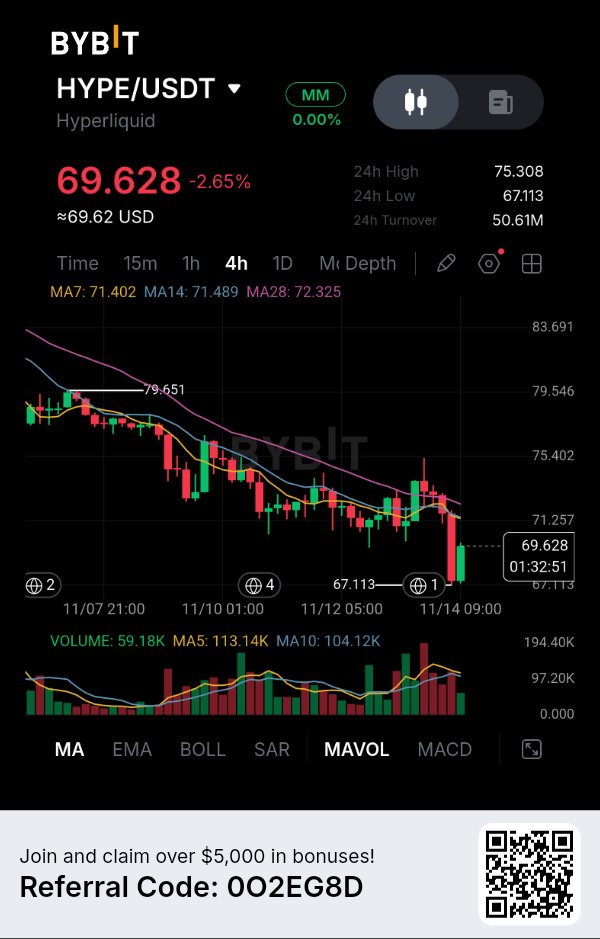
$HYPEUSDT —— 急跌至 $67.11,但反彈跡象尚不明顯! 我在 4 小時線圖上注意到,HYPE 在試圖反彈失敗後,其跌勢加劇的速度之快令人側目。 目前價格在 $69.628 左右,下跌了 2.65%。此前曾一度跌至 $67.113,隨後出現小幅回升。 雖然這次反彈值得關注,但我認為目前證據不足,還無法斷定趨勢已出現反轉。 技術面分析 移動平均線清晰地反映了目前的市場壓力: MA7: $71.402 MA14: $71.489 MA28: $72.325 這三條均線均位於現價上方,顯示 4 小時線的整體結構仍偏向看跌。 另一個值得留意的細節:當前顯示的成交量為 59.18K,而 MA5 和 MA10 的成交量均值分別為 113.14K 和 104.12K。 若要認定市場動能發生了實質性轉變,最近的反彈需要更強的成交量支撐。 關鍵點位 目前的即時阻力區位於 $71.40–$72.33 附近。 如果 HYPE 試圖回升至該區間但未能站穩,空方可能會有再次進場的機會。 $67.113 的低點仍是重要的下方參考點位。 我的條件式交易計畫 — 做空 我只會在價格反彈無力並確認遭到阻力拒絕時,才考慮做空。 進場區間:$71.40–$72.30 停損點:$73.30 目標價 1 (TP1):$67.15 目標價 2 (TP2):$65.80 目標價 3 (TP3):$64.50 失效條件:若 4 小時線強勢突破 $73.30 並站穩,則該做空策略失效。 TP2 和 TP3 為預測目標價,並非目前圖表上已確認的支撐位。 我的觀察重點 經歷了如此劇烈的下跌後,我不想盲目追空。 我更傾向於觀察價格是否會重新測試阻力區,若屆時無法在移動平均線上方站穩,那將是賣方進場的時機。 現在有趣的問題是:$67.11 僅是一個暫時的停頓點,還是更深層回調的開始? HYPE 能否重回 $72,還是賣方會利用下一次反彈的機會將價格進一步推低? $HYPEUSDT #ByXIMPACT

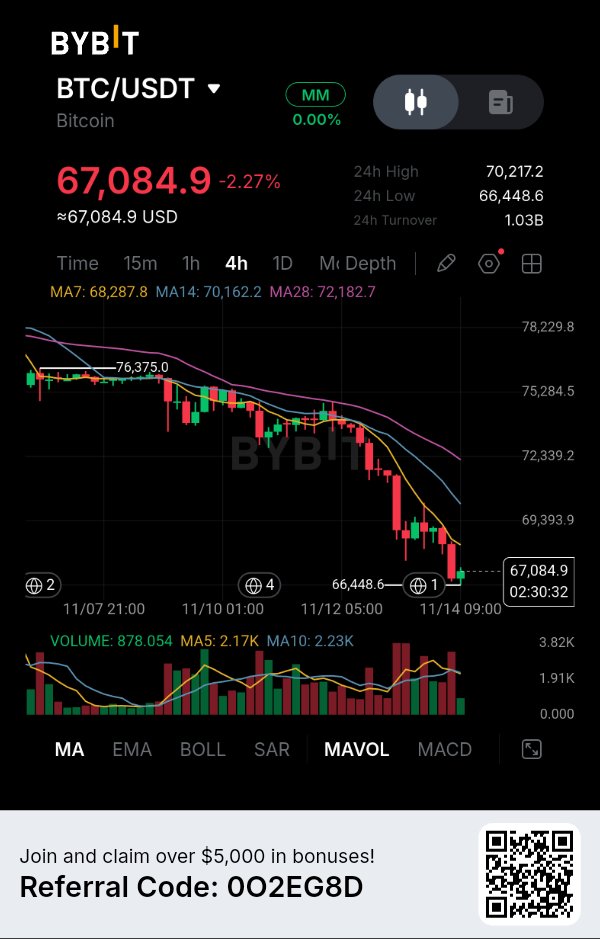
比特幣正逼近關鍵支撐位,但更大的問題在於抵達此處前發生了什麼。在經歷了又一輪顯著下跌後,比特幣現正於 67,084 美元附近交易,但我最擔心的不是那根最新的陰線,而是買方失去對 4 小時市場結構控制權的速度。每一次試圖反彈的嘗試都難以挑戰之前的阻力位,而移動平均線則持續指向下方。 我認為,目前的價格走勢值得我們投入更多關注,而不僅僅是將其簡單視為又一次的市場回調。 市場結構 — 賣方佔據優勢 BTC 目前交易價格約為 67,084.9 美元,下跌 2.27%,24 小時最高價為 70,217.2 美元,最低價為 66,448.6 美元。 觀察 4 小時線圖,比特幣已從約 76,375 美元下跌,形成了一系列更低的高點和更低的低點。 最近一波拋售潮將價格推向了 66,448.6 美元,在那裡出現了一些買盤興趣。我們現在可以看到 67,084 美元附近出現了一根小型的反彈陽線。 然而,我並不將這次反彈解讀為反轉。 整體結構依然看空,且比特幣尚未收復任何主要移動平均阻力位。在這種情況改變之前,賣方在技術面上佔據更強勢地位。 移動平均線揭示了真正的問題 三個數值引人注目: - MA7:68,287.8 美元 - MA14:70,162.2 美元 - MA28:72,182.7 美元 所有三條移動平均線皆位於現價上方。 更重要的是,它們呈現空頭排列,MA7 低於 MA14,而 MA14 低於 MA28。 這反映了在所顯示的移動平均週期內,持續的下行勢頭。 首次反彈挑戰位在 68,287 美元附近,隨後是 70,162 美元附近更強大的阻力區。 對我來說,這些點位代表的不僅僅是技術線。它們是反彈必須證明買方確實能重新掌控局面的區域。 成交量 — 反彈需要更多參與 另一個細節引起了我的注意。 顯示的成交量約為 878.054,而 MA5 為 2.17K,MA10 為 2.23K。 目前的成交量遠低於這兩條均線。 這表明最新的小型反彈陽線尚未顯示出強勁的買盤參與。 與此同時,之前的下跌過程中包含了幾根巨大的成交量柱,顯示拋售階段吸引了顯著的市場活動。 因此,我會對將當前反彈視為強勁累積的證據持謹慎態度。 反彈需要的是參與,而不僅僅是陽線顏色的改變。 許多交易者可能忽略的細節 比特幣正接近一個重要的心理決策點。 在從 76,000 美元上方跌落後,市場現在試圖在 67,000 美元左右企穩。 但找到臨時支撐與建立可持續的反彈之間是有區別的。 66,448 美元區域是我目前密切關注的即時水位。如果賣方有力地跌破該位置,市場可能會將回調延伸至更低的價格區域。 另一方面,若能以更強的成交量收復 68,287 美元,將是下行勢頭減弱的第一個跡象。 我擔心的是,交易者在看到小幅反彈後可能會過於樂觀,而忽略了廣泛的技術結構仍然承受著壓力。 我的交易策略 — 做空 我偏好的方向仍然是「做空」,理想情況是在暫時回調至阻力位後介入,而不是在比特幣接近近期低點時追空。 - 方向:做空 - 入場區間:69,200 – 69,800 美元 - 確認訊號:在入場區間內出現 4 小時級別的看空反轉訊號。 - 止損:70,500 美元 - 第一目標位 (TP1):66,450 美元 - 第二目標位 (TP2):65,500 美元 - 第三目標位 (TP3):64,500 美元 預估盈虧比:約 1:1.5 至 1:3.3,具體取決於入場和執行情況。 TP1 是基於可見的近期低點,而 TP2 和 TP3 是預測的下行延伸,而非此截圖上已確認的支撐位。 如果價格持續突破 70,500 美元,則該設置失效。如果比特幣繼續下跌而沒有提供計劃中的入場機會,我不會去追單。 什麼會改變我的觀點? 若出現強勁的 4 小時級別反彈並突破 70,162 美元,且伴隨著成交量放大,我會重新考慮看空觀點。收復該移動平均線將代表市場結構有了實質性的改善。 在此之前,我傾向於尊重當前趨勢,而不是預測反轉。 最後的想法 比特幣不需要另一次暫時性的反彈來改變市場敘事。它需要收復重要阻力位,並證明買方能夠持續掌控局面。在這種情況發生之前,這次反彈仍是值得懷疑而非慶祝的。$BTCUSDT #ByXIMPACT

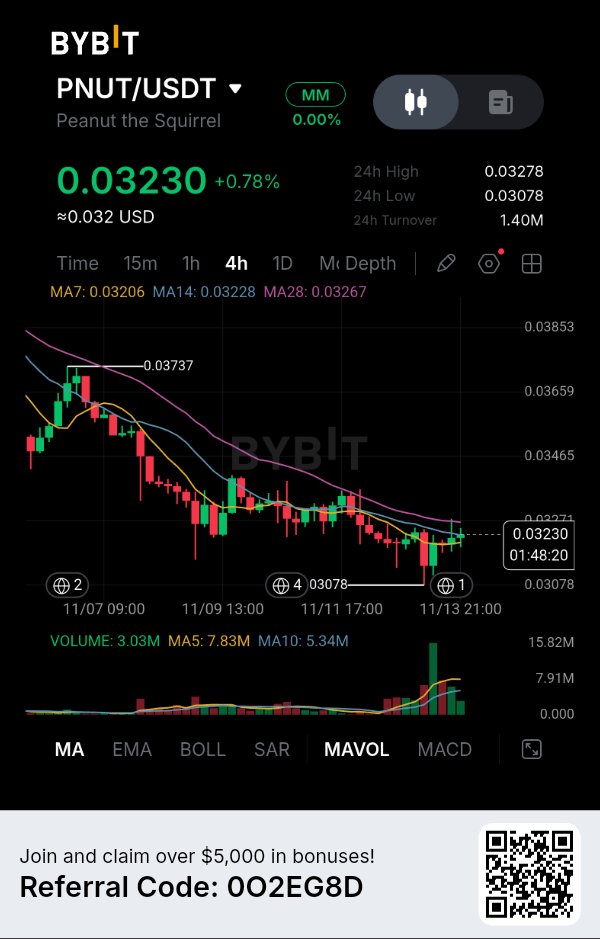
$PNUTUSDT Buyers Are Attempting a Recovery, But One Resistance Zone Could Decide the Next Move. PNUT has started showing signs of recovery after touching $0.03078, but I am not convinced that buyers have regained control. The interesting part of this chart is the difference between short-term momentum and the broader trend: price is recovering above its fastest moving average while remaining underneath the longer moving-average resistance. That creates a potentially important decision point for the next 4-hour candles. MARKET STRUCTURE — A RECOVERY INSIDE A DECLINING TREND PNUT is currently trading around $0.03230, up 0.78%, with a 24-hour high of $0.03278 and a low of $0.03078. Looking at the broader 4-hour structure, the token has declined from approximately $0.03737, establishing a sequence of lower highs and lower price levels. Recently, sellers pushed price toward $0.03078, where buyers appeared and attempted to stabilize the market. The latest candles show some recovery, but the larger descending structure remains intact. For me, this is an important distinction. A recovery from support can create a trading opportunity without necessarily confirming a complete trend reversal. THE MOVING AVERAGE BATTLE The displayed moving averages provide three important reference points: - MA7: $0.03206 - MA14: $0.03228 - MA28: $0.03267 Price has moved above MA7 and is trading around MA14, which suggests that immediate selling pressure has eased. However, MA28 remains overhead resistance. I am particularly interested in the $0.03260–$0.03278 region. This area combines the longer moving average with the recent 24-hour high. If buyers cannot reclaim this region, the current recovery could turn into another lower high. That would reinforce the existing bearish market structure. VOLUME — A RECOVERY THAT STILL NEEDS CONFIRMATION There is another detail worth examining. The displayed volume is approximately 3.03M, while MA5 stands at 7.83M and MA10 at 5.34M. Current volume is below both averages. The chart also shows a noticeable earlier green volume expansion during the recent recovery attempt. However, participation has subsequently cooled. This is where I become cautious. Price is recovering, but the latest volume reading does not demonstrate sustained buying strength. I would want to see stronger participation before treating this move as a genuine bullish breakout. A price increase without consistent volume expansion can struggle when it reaches established resistance. THE DETAIL OTHER TRADERS MIGHT MISS The most interesting part of PNUT's current structure is that buyers have managed to defend the $0.03078 region, but they have not yet changed the sequence of lower highs. This means the market is currently showing two different signals. Short-term stabilization is visible, while the broader trend still favors sellers. I believe the resistance region around $0.03267–$0.03278 deserves more attention than the current 0.78% gain. If sellers defend this area again, PNUT could revisit its recent support. MY TRADING STRATEGY — SHORT My preferred scenario is a conditional SHORT on a failed recovery into resistance. - Direction: SHORT - Entry Zone: $0.03255–$0.03275 - Trigger: Bearish rejection from the resistance zone on the 4H chart. - Stop Loss: $0.03305 - TP1: $0.03150 - TP2: $0.03078 - TP3: $0.03020 Estimated Risk/Reward: Approximately 1:2.3 to 1:4.9, depending on entry and execution. TP1 is an intermediate projected support, TP2 is the visible chart low, and TP3 is an estimated extension below the displayed structure. A sustained 4-hour reclaim above $0.03305 would invalidate this short setup. I would also avoid chasing the trade if price falls without offering the planned entry. WHAT COULD CHANGE MY VIEW? A strong 4-hour breakout above $0.03278, supported by expanding volume, would weaken my bearish interpretation. Reclaiming MA28 and establishing higher highs would provide stronger evidence that buyers are taking control. Until then, I see the current recovery as a test of resistance rather than proof of a new uptrend. FINAL THOUGHT PNUT has shown that buyers are willing to defend lower prices. Now the market needs to prove they can do more than defend support — they need to overcome the resistance that has controlled the broader trend. $PNUTUSDT #ByXIMPACT