MDFUNDS
3297點贊0分享88粉絲137關注
this user would provide you a more insightful about cryptocurrency with explicit trading analysis.
this user would provide you a more insightful about cryptocurrency with explicit trading analysis.
#Bitcoin #BTCUSDT #CryptoMarket #MDFUNDS
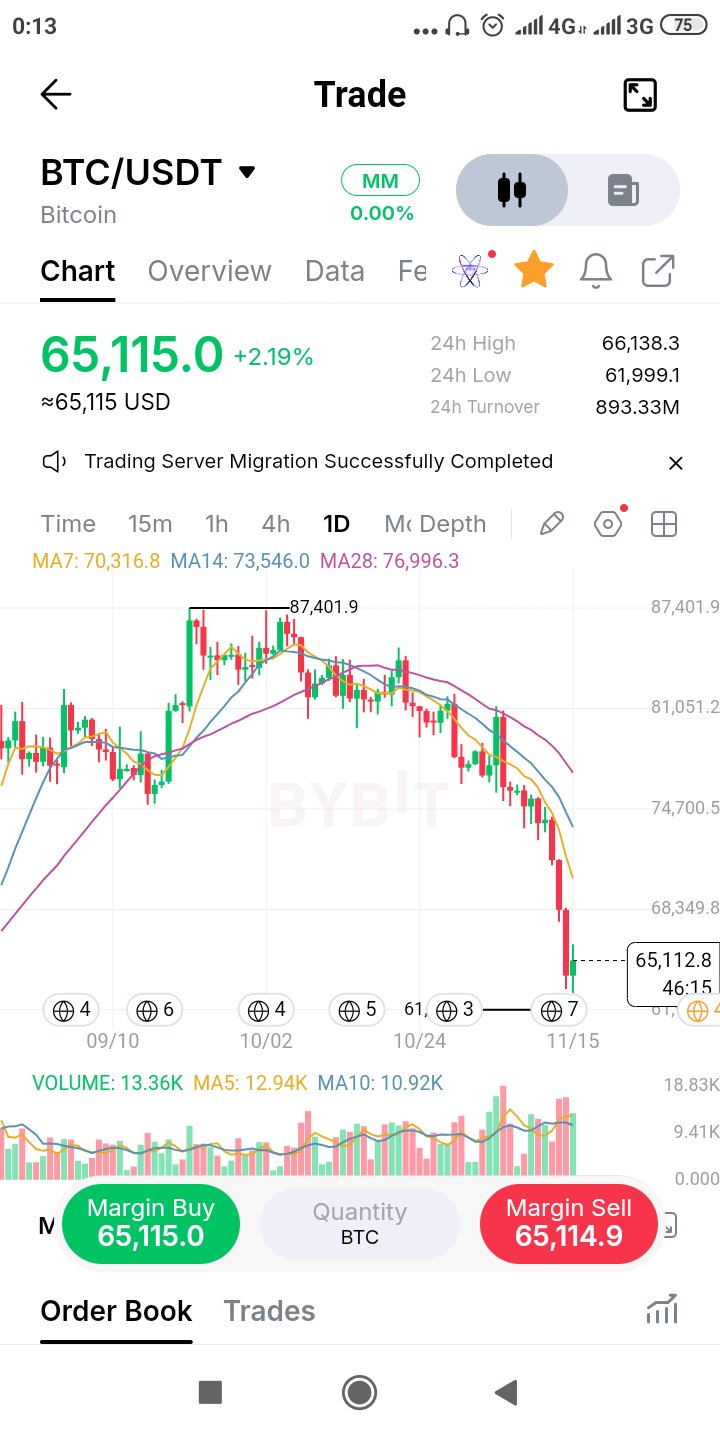
Bitcoin's $62K reaction: Is the market beginning to absorb selling pressure? Bitcoin's daily chart is showing something worth examining beyond the headline price decline. After failing to sustain its advance from the $87,401 peak, BTC entered a persistent sequence of lower highs and lower lows. The latest downside expansion pushed price towards $61,999, where buyers have started producing a visible response. BTC is now trading around $65,115, but the broader structure remains under considerable pressure. Here's the detail that interests me. Daily volume stands at 13.36K, above both its five-day average of 12.94K and ten-day average of 10.92K. That tells us participation has increased during this volatile phase. In Wyckoff terms, increased selling effort followed by a reaction from buyers can be worth monitoring. However, high volume alone does not confirm accumulation or a selling climax. The subsequent price behaviour must provide that evidence. The moving averages reinforce the caution: MA7: $70,316 MA14: $73,546 MA28: $76,996 All three remain above current price, reflecting the prevailing bearish alignment. The levels I'm watching: $61,999 — The immediate downside reference. A decisive loss could expose BTC to another leg lower. $68,350 — The first meaningful recovery hurdle visible on the chart. $70,316 — The daily MA7, which could become an important test of short-term trend recovery. What I want to see is whether BTC can establish a higher low, recover lost resistance and sustain that move with meaningful participation. Until then, calling this a confirmed bottom would be premature. My question to the market: Are we witnessing the early stages of selling-pressure exhaustion, or is this simply a temporary pause before another bearish expansion? #Bitcoin #BTCUSDT #CryptoMarket #MDFUNDS $BTCUSDT #ByXIMPACT
#QNT #Quant #加密貨幣分析 #MDFUNDS
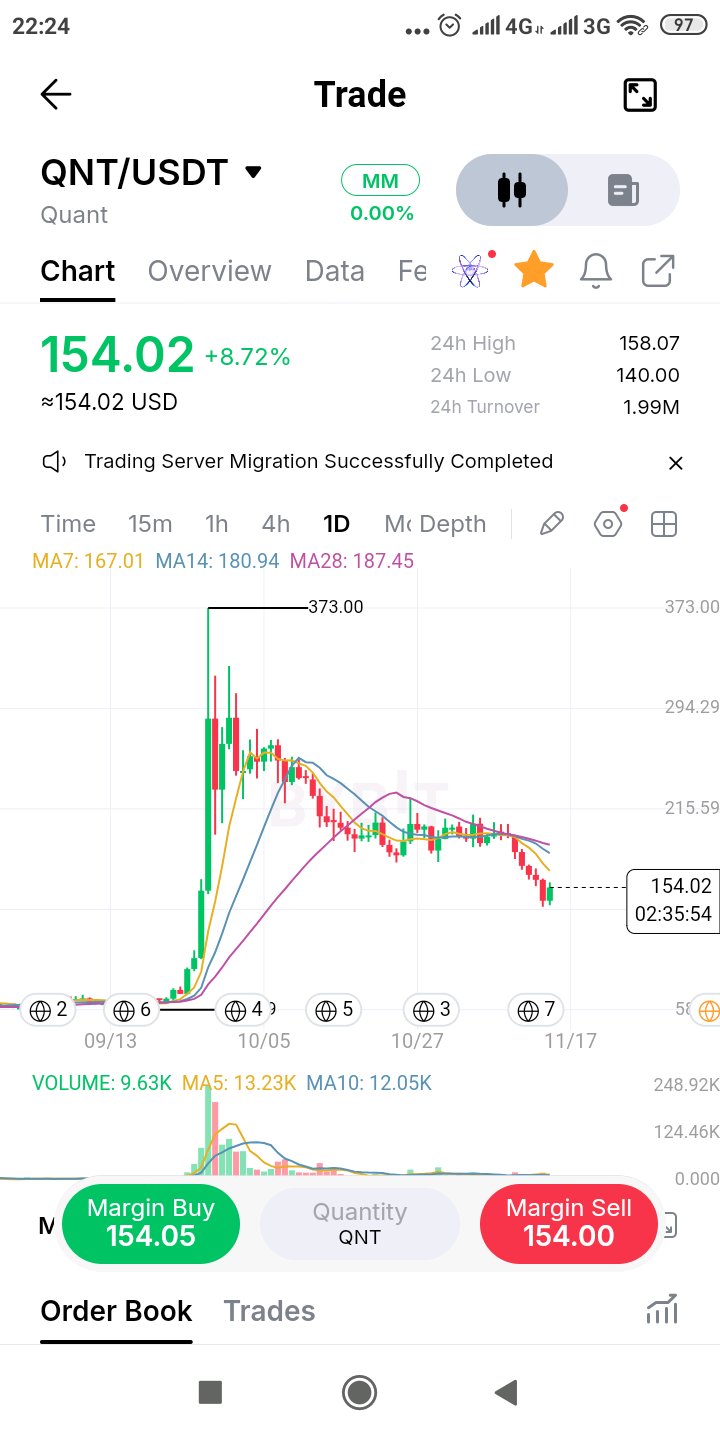
$QNTUSDT — 技術性反彈尚未構成趨勢反轉 QNT 已從 140 美元區域強勁反彈,上漲 8.72%,盤中最高觸及 158.07 美元。這一反應固然重要,但我不會急於將其解讀為看漲的結構性轉變。 放眼大局。 自從向 373 美元的爆發式擴張以來,QNT 已逐漸回吐其漲幅。市場經歷了長期的派發和下跌階段,曾試圖在 200 美元區域穩定下來,但隨後又經歷了新一輪的下探。 今天的反彈表明買家正在對低價做出反應。但不確定的是,這種需求是否足以扭轉當前的市場結構。 移動平均線提供了一個重要的視角: MA7:167.01 美元 MA14:180.94 美元 MA28:187.45 美元 價格仍低於這三條均線。這意味著當前的復甦仍發生在市場主要日線趨勢參考點之下。 我特別關注三個價格區間: 140 美元:由近期日線低點確立的直接下行參考點。 158–167 美元:首個復甦挑戰。若能守住該區域並重回 MA7 上方,將能改善短期行情。 180–187 美元:這是一個更實質性的復甦區,後兩條移動平均線在此匯聚。 成交量也值得關注。目前顯示的 9.63K 仍低於 MA5 和 MA10 成交量均線。在市場參與度改善之前,這次反彈還需時間證明其實力。 道氏理論給我們帶來了一課:有意義的反轉需要的遠不止一根強勁的陽線。市場必須開始建立起一套不同的高點和低點序列。 我的問題是:買家是否開始在 140 美元防守 QNT,還是我們只是在一個更大的看跌結構中見證了一次暫時的技術性反彈? $QNTUSDT #ByXIMPACT
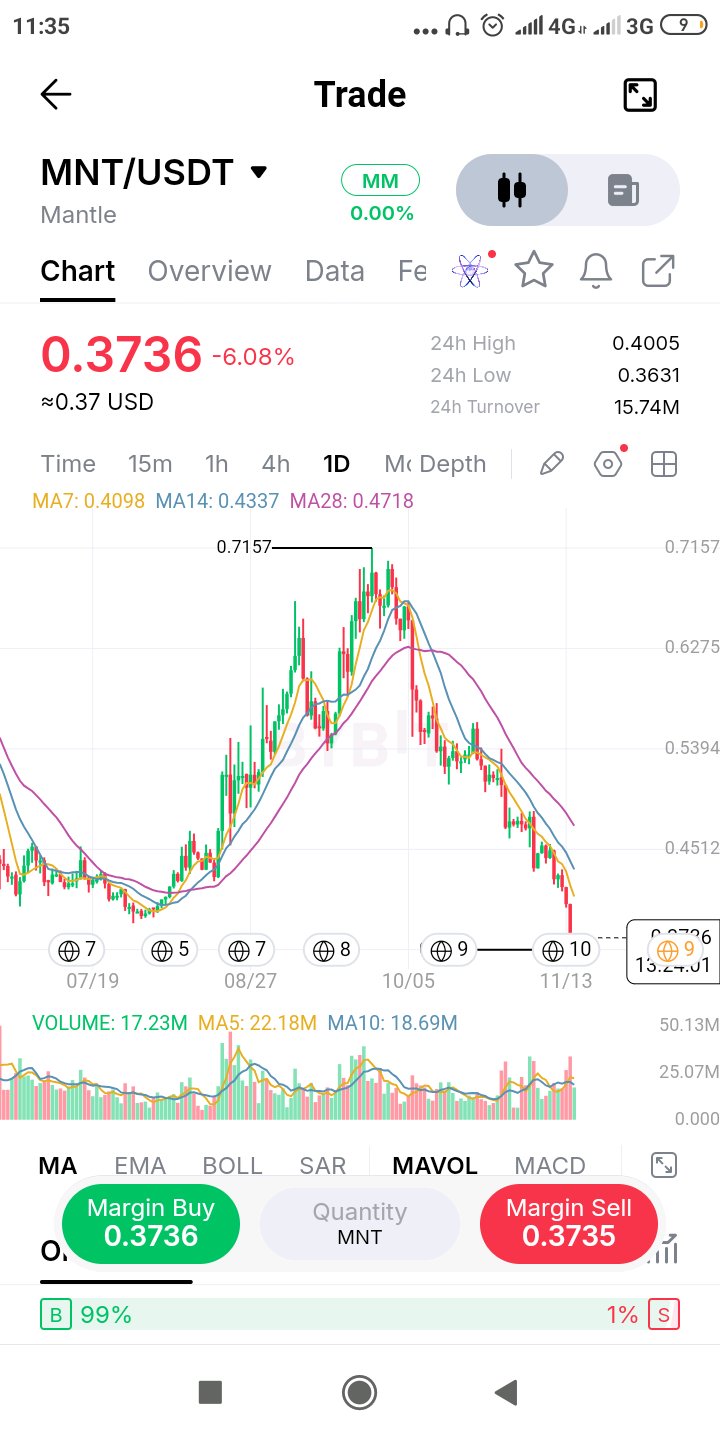
$MNTUSDT's daily candle is still open, and it's the most important one on the chart right now. Price is 0.3736, down 6%, and it has pushed under the July-August base, the floor the whole rally was built on. That's the entire run from the 0.7157 high erased, about 48%. But an intraday break isn't a breakdown. The close decides. A daily close back above roughly 0.385-0.39 turns this into a failed breakdown, the kind that traps late sellers. A close under it confirms the base is gone. If it is gone, the classic measuring rule from Edwards & Magee is the base's own height projected down from the break. That range ran roughly 0.39 to 0.45, which points to the low 0.33s. I'd treat that as a reference level, not a forecast. For bulls, even a bounce has work to do. 0.4005 is the 24h high, then the 7MA at 0.4098, with the 14 and 28 MAs (0.4337, 0.4718) stacked above and falling. Price sits 21% under the 28MA. $MNTUSDT #ByXIMPACT
#PIEVERSE #CryptoMarket #Altcoins #MDFUNDS
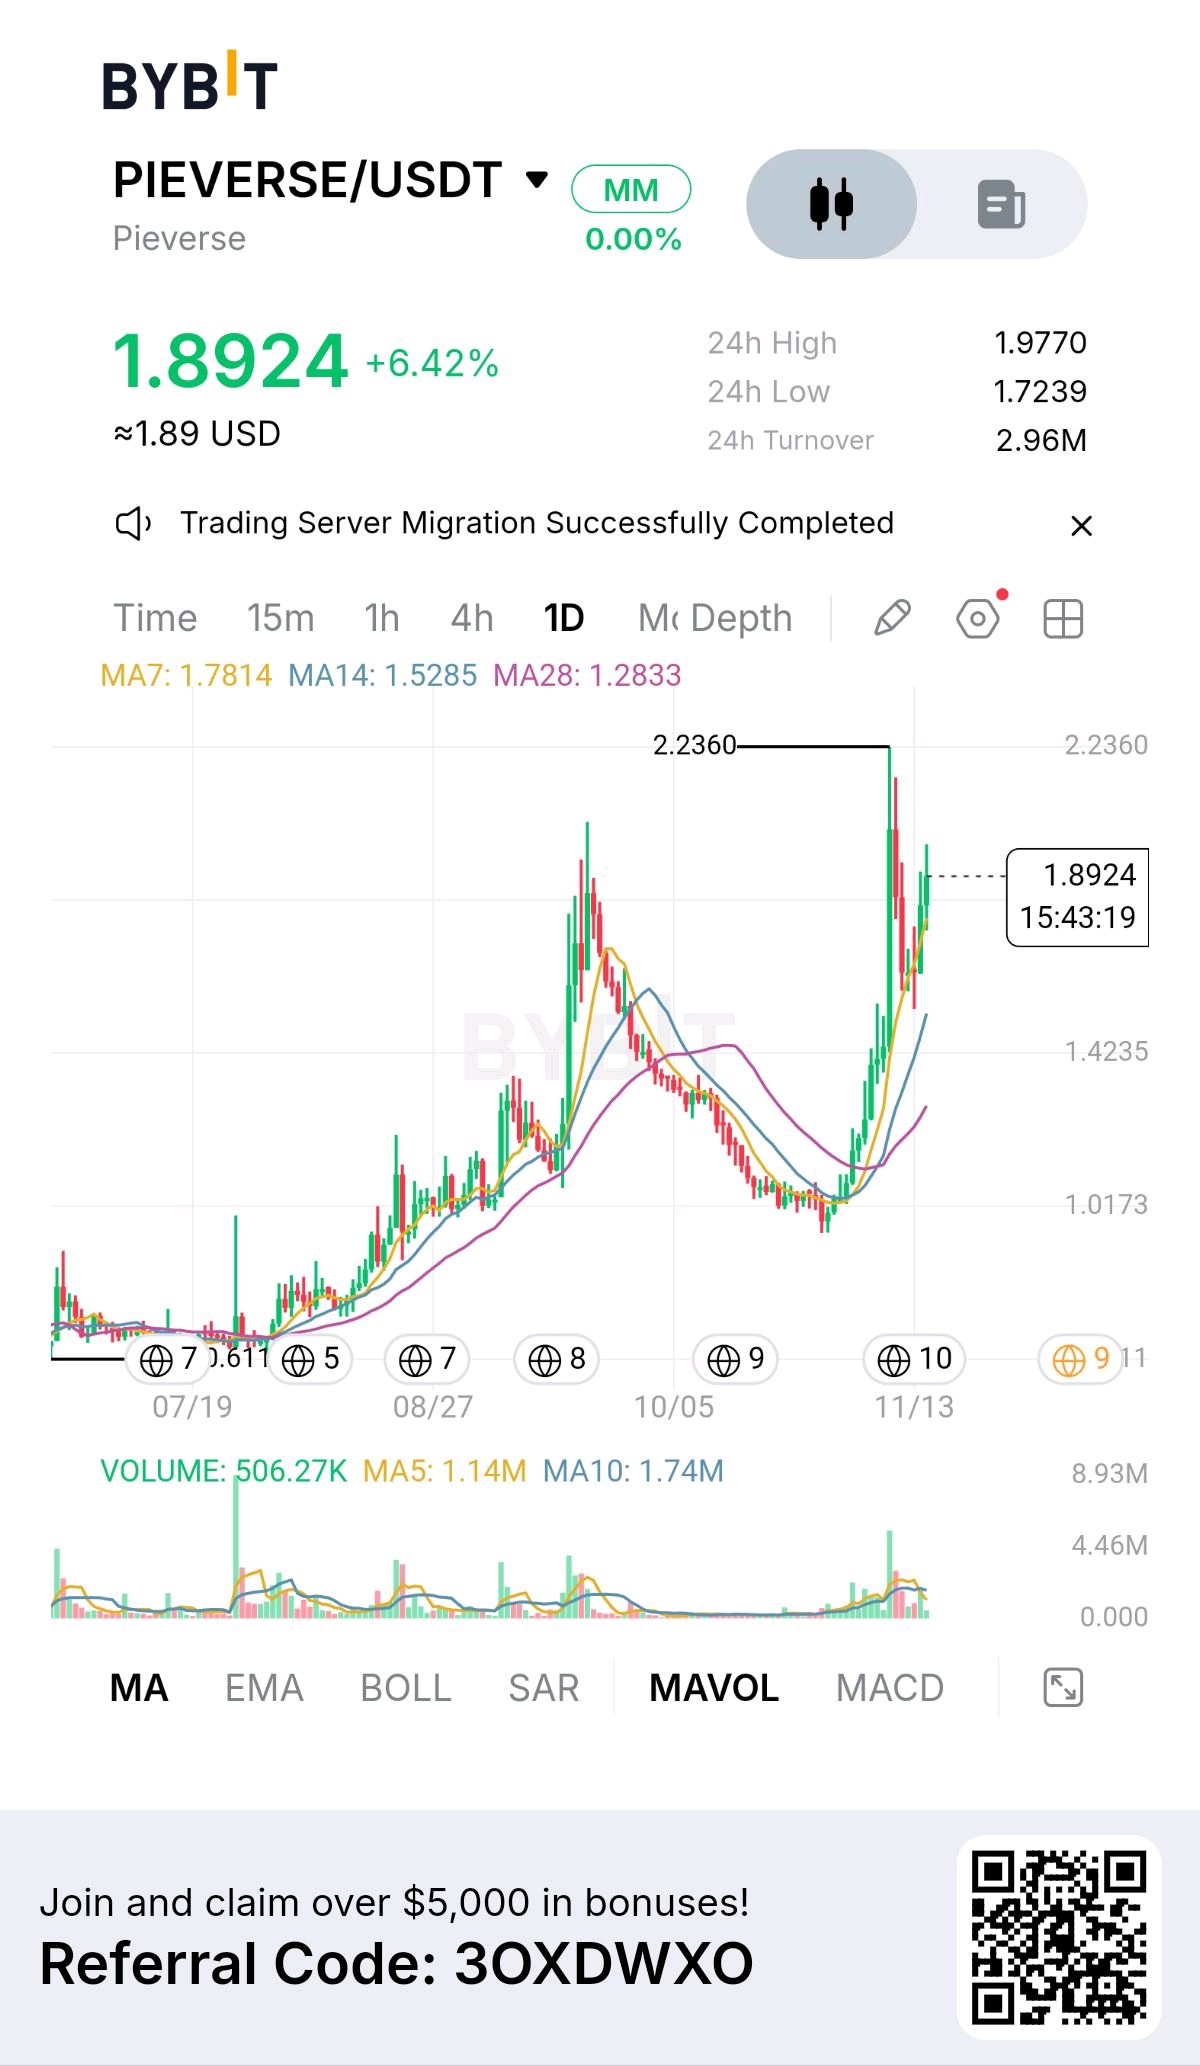
$PIEVERSEUSDT — Buyers are back, but can they sustain control? PIEVERSE has undergone a significant structural change on the daily chart. After spending an extended period declining towards the $1.00 region, the market produced an aggressive upside expansion, reaching approximately $2.236 before encountering selling pressure. What makes the current setup interesting is that the subsequent retracement hasn't erased the entire recovery. Price has rebounded to $1.8924 and is trading above all three moving averages: MA7: $1.7814 MA14: $1.5285 MA28: $1.2833 The bullish alignment suggests that the recovery has developed beyond a simple one-day price spike. However, I wouldn't confuse a strong recovery with an established continuation breakout. Here is where the next price reaction matters: The $1.977 area is the immediate resistance to watch, followed by the previous major swing high around $2.236. A convincing break and hold above these levels would strengthen the continuation argument. On the downside, $1.78 is an important near-term reference, close to the seven-day moving average. Losing that area would raise the possibility of another corrective phase, with $1.53 becoming a deeper reference point. There is also a volume question. The displayed volume is 506.27K, below its MA5 of 1.14M and MA10 of 1.74M. Since the daily candle may still be developing, the final volume reading matters. A breakout without stronger participation deserves caution. My interpretation: PIEVERSE has demonstrated a meaningful recovery, but the market still needs to prove that buyers can absorb supply around the recent highs. Would you rather see PIEVERSE consolidate above $1.78 before another attempt higher, or do you think buyers have enough momentum to challenge $2.23 directly? $PIEVERSEUSDT #ByXIMPACT
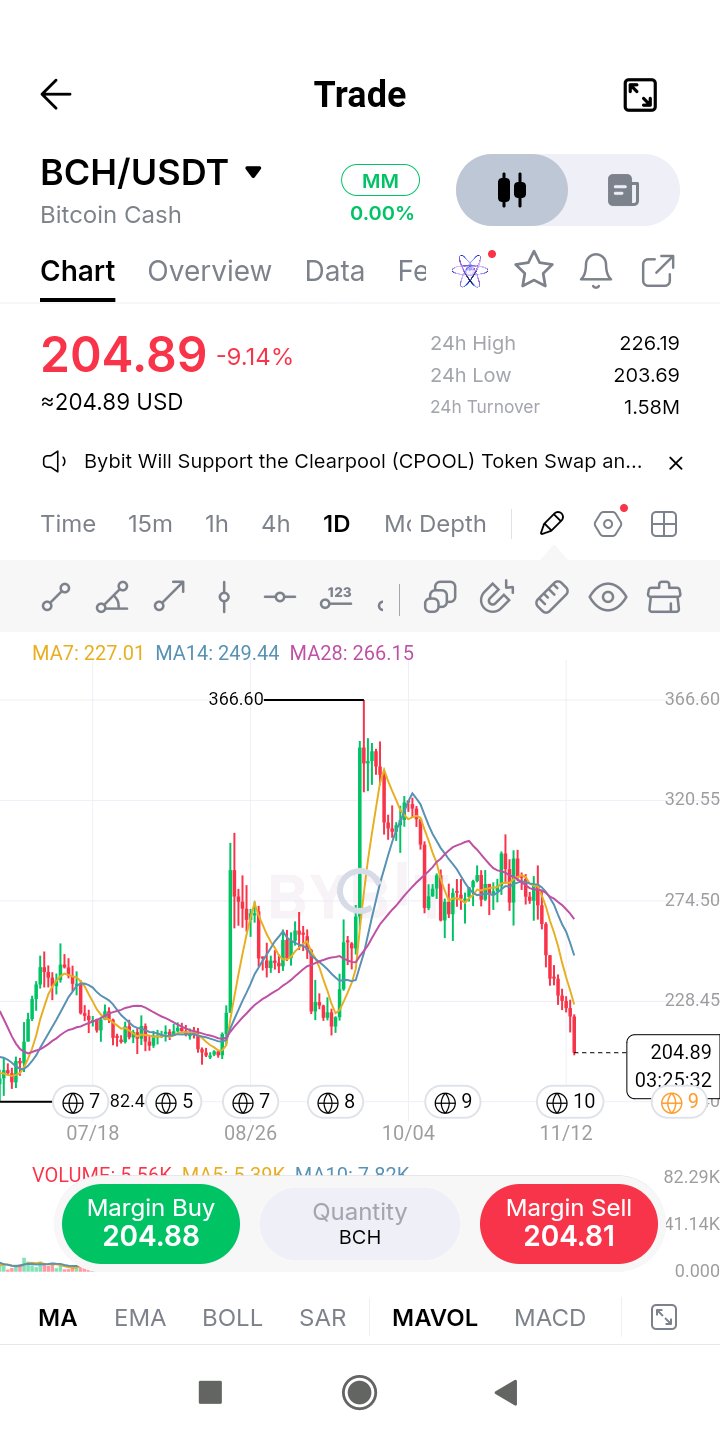
$BCHUSDT 回到了八月份突破點的起漲位置。現在唯一的問題是,是否還有人在意這個價位。 衝高至 366 的走勢已經完全回吐。價格較高點下跌了 44%,目前在 205 附近交易,正好是八月下旬那波行情啟動的底部。這類區間要麼會吸引那些錯過第一波行情的買家進場,要麼就會被直接跌穿。今天這裡正在經歷嚴峻的考驗:單日下跌 9%,在 226(即 7MA,227)處遇阻回落,且價格位於 28MA 下方 23% 的位置,所有均線都在向下翻轉。 根據史丹·溫斯坦(Stan Weinstein)的階段分析法,價格低於下行的均線屬於第四階段,這是唯一一個紀律上要求「不買入」的階段。單憑一個舊的起漲平台並不能改變這一點。它首先需要形成一個底部:一個收斂的價格區間、成交量萎縮,以及一個更高的低點。 若跌破今天的低點 203.7,我看到的下一個真正的支撐位是七月的低點 182 附近,大約還有 11% 的下跌空間。上方的話,必須先突破 227 以及 14MA(約 249),我才會稱之為復甦。 $BCHUSDT #ByXIMPACT
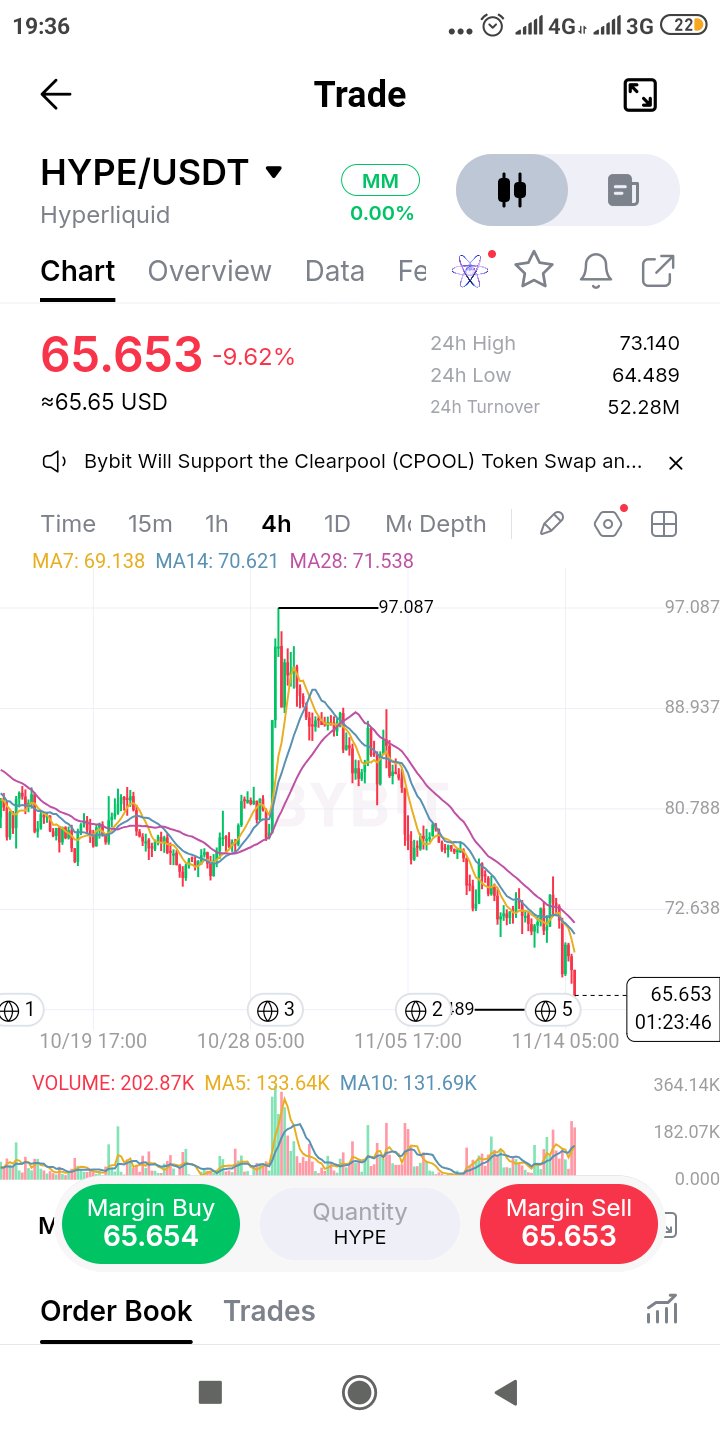
$HYPE 不僅淡化了十月的漲幅,甚至把漲幅全部抹去並持續下跌。價格來到 65.7,跌破了 97 漲勢發起的整個底部區域。 這點很重要,因為根據 Edwards & Magee 最古老的規則之一:被跌破的支撐位會變成阻力位。十月曾支撐住的 75-80 區間,現在成了上方的供應壓力。更近一點來看,70.6 到 73.1 的區間匯集了 14 日均線、28 日均線以及 24 小時高點,這個區間在過去 24 小時內已經拒絕了價格一次。 多頭不該忽視的是:這並非平靜的陰跌。隨著價格跌破,4 小時成交量比近期平均高出約 50%,說明這次下跌有真實的參與度。帶量的跌破通常需要回測確認後才會有後續動作。 目前的即時底部是今天的低點 64.49。若跌破此處,我看不到太多結構支撐,直到夏季底部 50 多美元區間,這還有一段很遠的距離。反彈至 69-73 區間是我預期供應出現的地方,而不是追價的理由。 如果 4 小時線收盤能回到 73 以上,才會改變我的看法。 $HYPEUSDT#ByXIMPACT
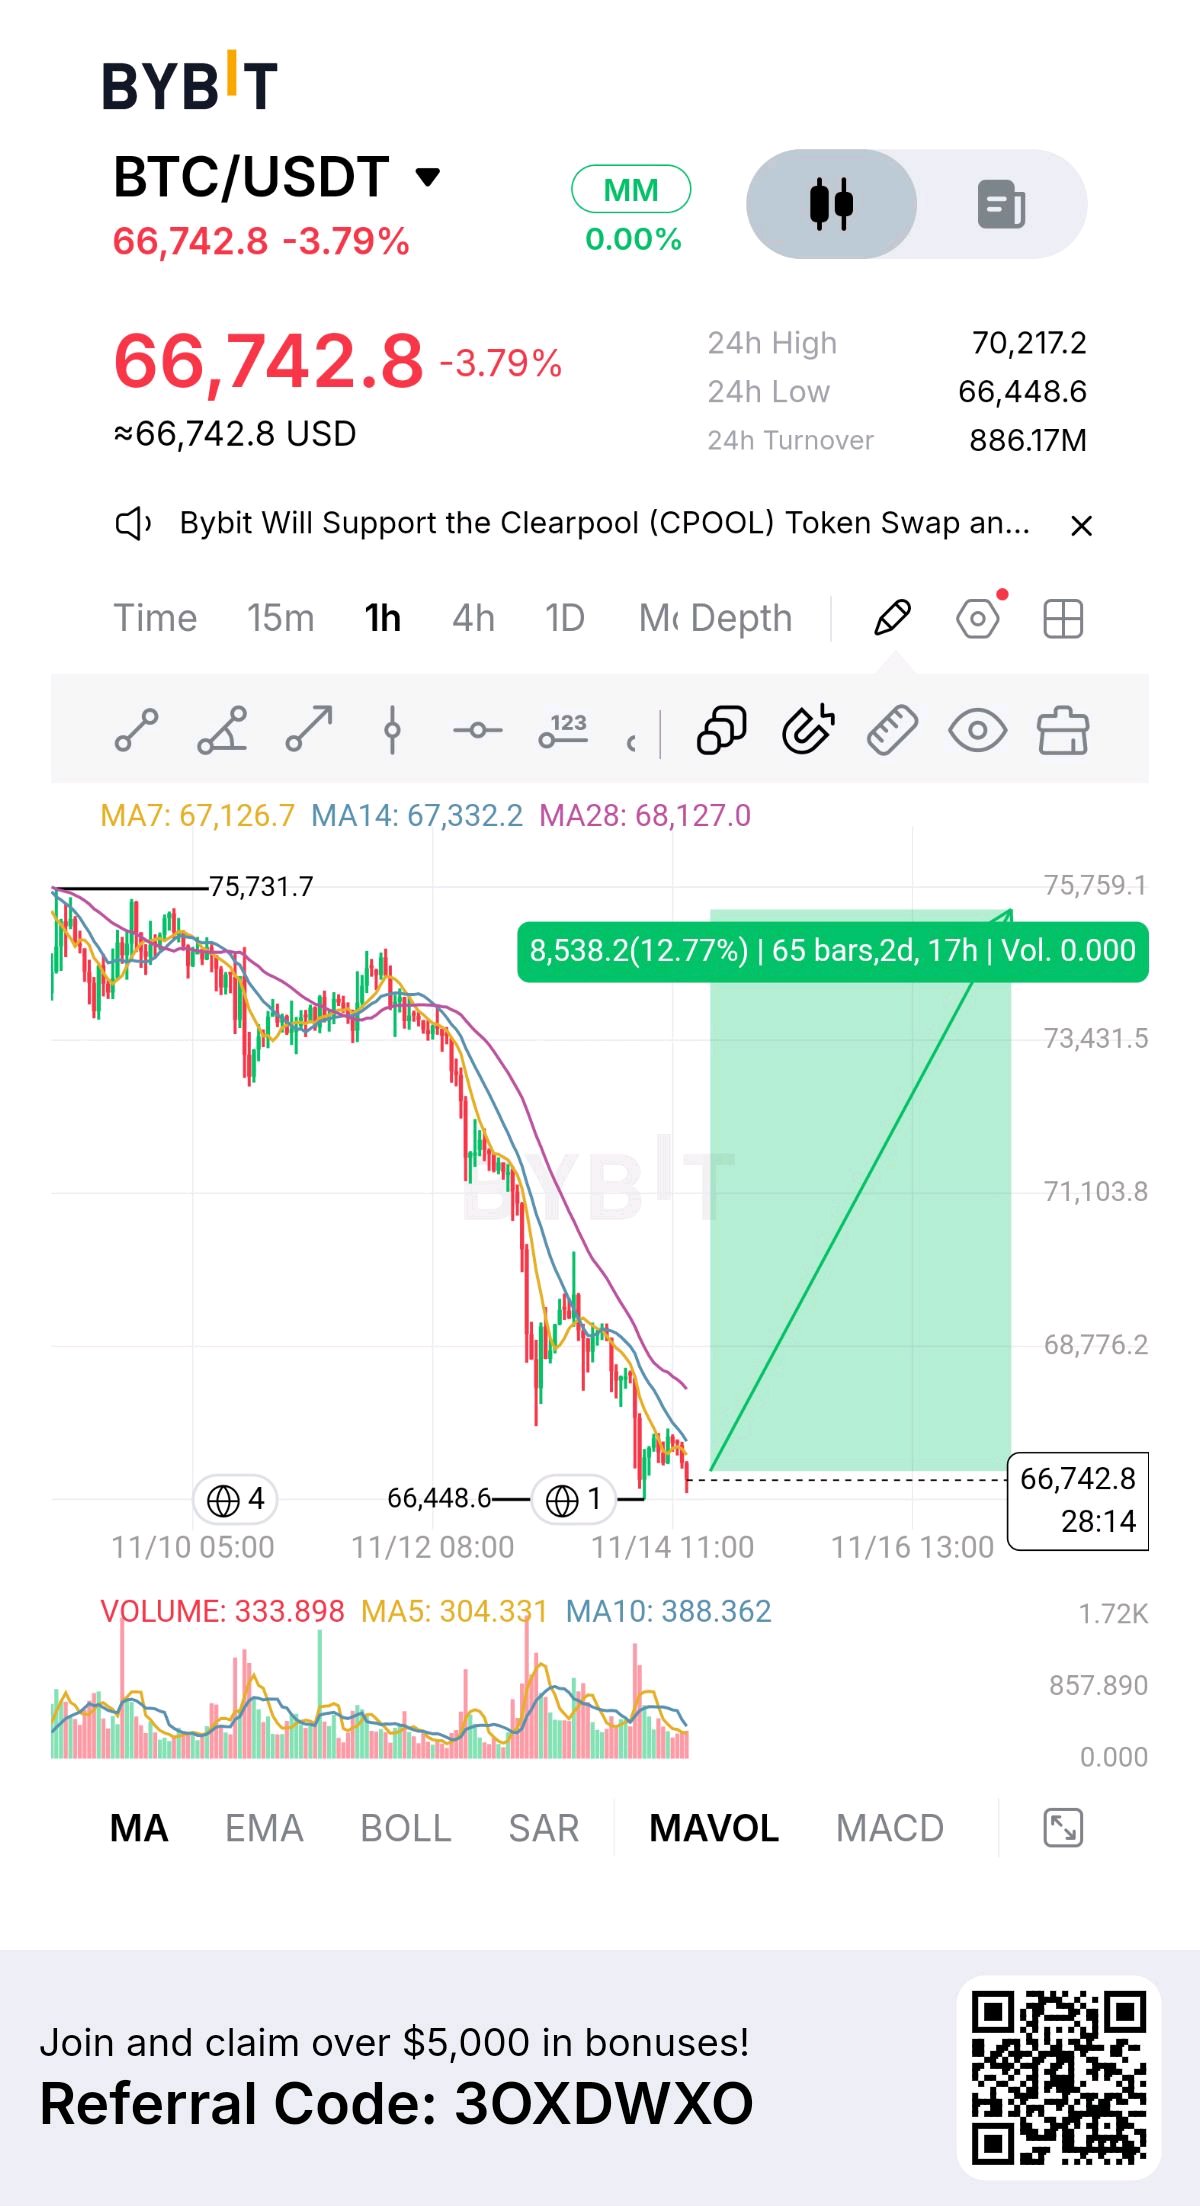
$BTCUSDT 回到了距離低點 0.4% 以內的範圍,這次測試將決定 66,449 究竟是殺盤還是僅僅是暫停。 從 75.7K 的下跌在不到六天內跌幅約 12%。低點伴隨著一波成交量出現。回測過程較為安靜,5 根 K 線成交量均線低於 10 根 K 線均線。如果買方是有理由地捍衛該水平,那麼縮量回測正是你所期望的。這還不是確認訊號,而是確認的先決條件。 低點後的反彈在 70.2K 停滯,大約是跌幅的 40%。這是正常回調較淺的一端,因此若能乾淨俐落地 V 型反轉回到 75K,意味著收復了整個波段。我會將 68.1K(28 日移動平均線)和 71.1K(50% 回撤位)視為真正的檢查點,而 67.3K(14 日移動平均線)則是第一個門檻。 若小時線收盤價低於 66,449,代表回測失敗,我就會離場觀望。正如馬克·道格拉斯在《紀律的交易者》(Trading in the Zone) 中所言:你不需要知道接下來會發生什麼,你需要的是知道當事情發生時你該怎麼做。 $BTCUSDT #ByXIMPACT
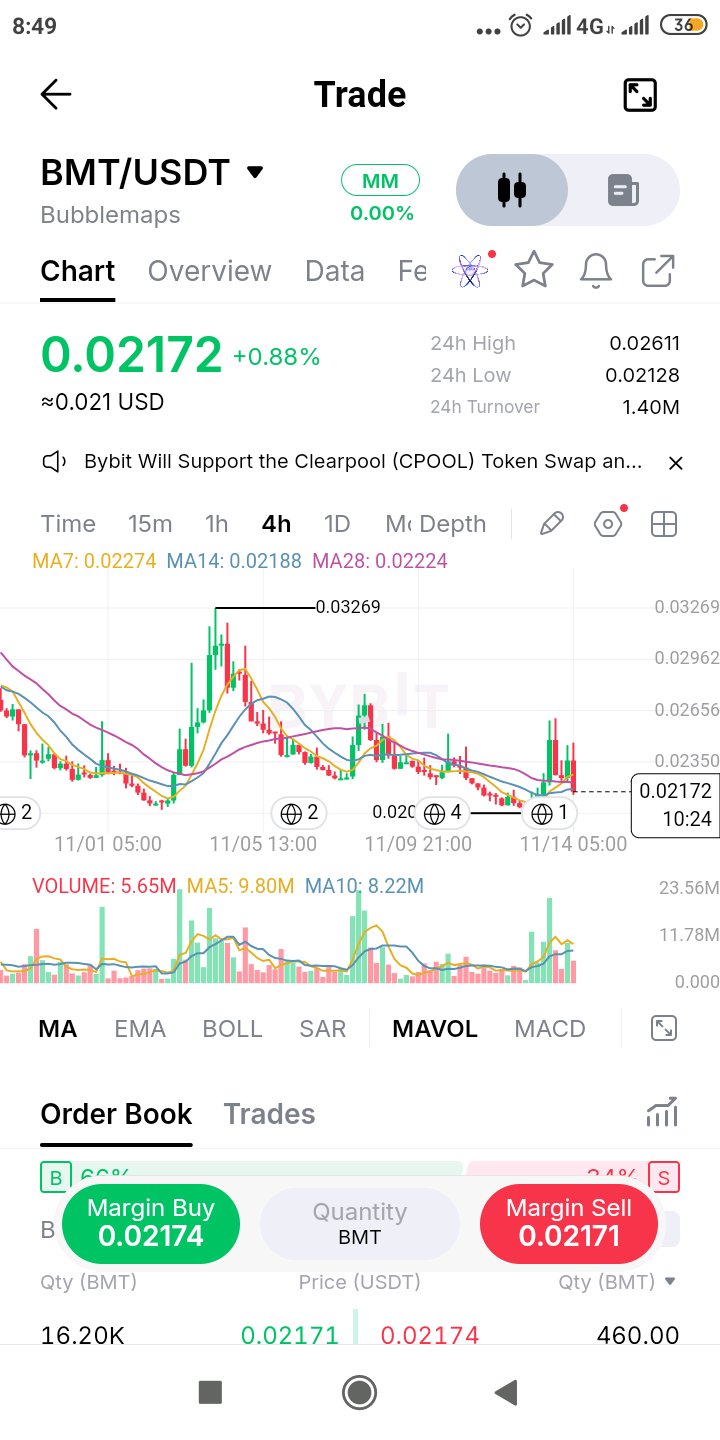
$BMTUSDT pumped 23% and handed back about 90% of it inside the same session. That's not a trend, that's a liquidity event. The surge came on volume well above average, then price dropped right back through the 7, 14 and 28 MAs, which are bunched between 0.0219 and 0.0227 and now sit overhead. Their tangled order tells you there's no trend here to lean on. It's also the second time this month: the early-November run to 0.0327 got sold all the way back too. Rallies keep getting faded, and with 24h turnover this thin, spikes are easy to fade. What keeps the structure intact is the low near 0.0201. While that holds, this is a range, not a breakdown, with the pump high at 0.0261 as the upper edge. Livermore's habit of waiting for the line of least resistance fits here. I'm not trading the middle of the range. A 4H close above 0.0261 or below 0.0201 gets my attention. Everything in between is noise. $BMTUSDT #ByXIMPACT
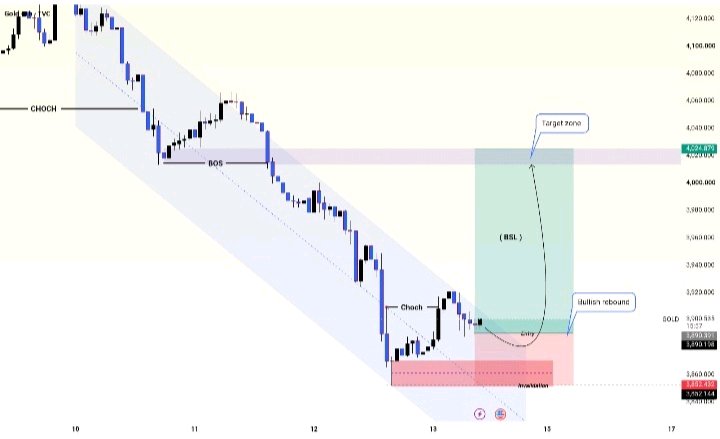
GOLD (XAUUSD) | Bullish Rebound - MDFUNDS
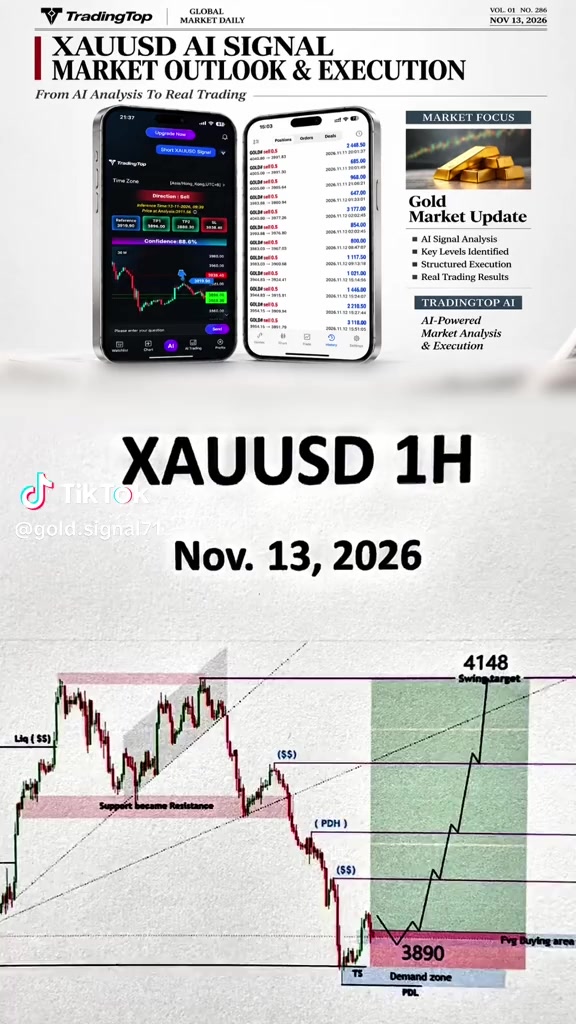
GOLD ($XAUTUSDT) | Bullish Rebound - MDFUNDS. Gold is showing signs of a potential bullish recovery after an extended bearish move within a descending channel. The recent price action has formed a bullish Change of Character (CHoCH), suggesting that selling pressure may be weakening and buyers could be attempting to regain control. Trade Setup – Potential Long - Market Bias: Bullish (Conditional) - Entry Area: Around 3,890 - Invalidation Level: 3,852 - Liquidity Target: Around 3,955 (Buy-Side Liquidity) - Final Target Zone: 4,020–4,025 Technical Outlook: The main focus is on how price reacts around the current entry area. If buyers maintain support and bullish momentum develops, Gold could attempt a recovery towards the previous liquidity area near 3,955. A sustained move above this level could open the possibility of further upside towards the 4,020–4,025 target zone. However, if price breaks below the marked invalidation level, the bullish scenario will no longer be valid. Risk Management & Disclaimer: This is a technical market analysis and a conditional trade scenario, not a guaranteed prediction or financial advice. Always manage risk carefully, use appropriate position sizing and make independent trading decisions. Wait for price confirmation before considering any entry. Follow the chart levels and respect the invalidation point. $XAUTUSDT #ByXIMPACT
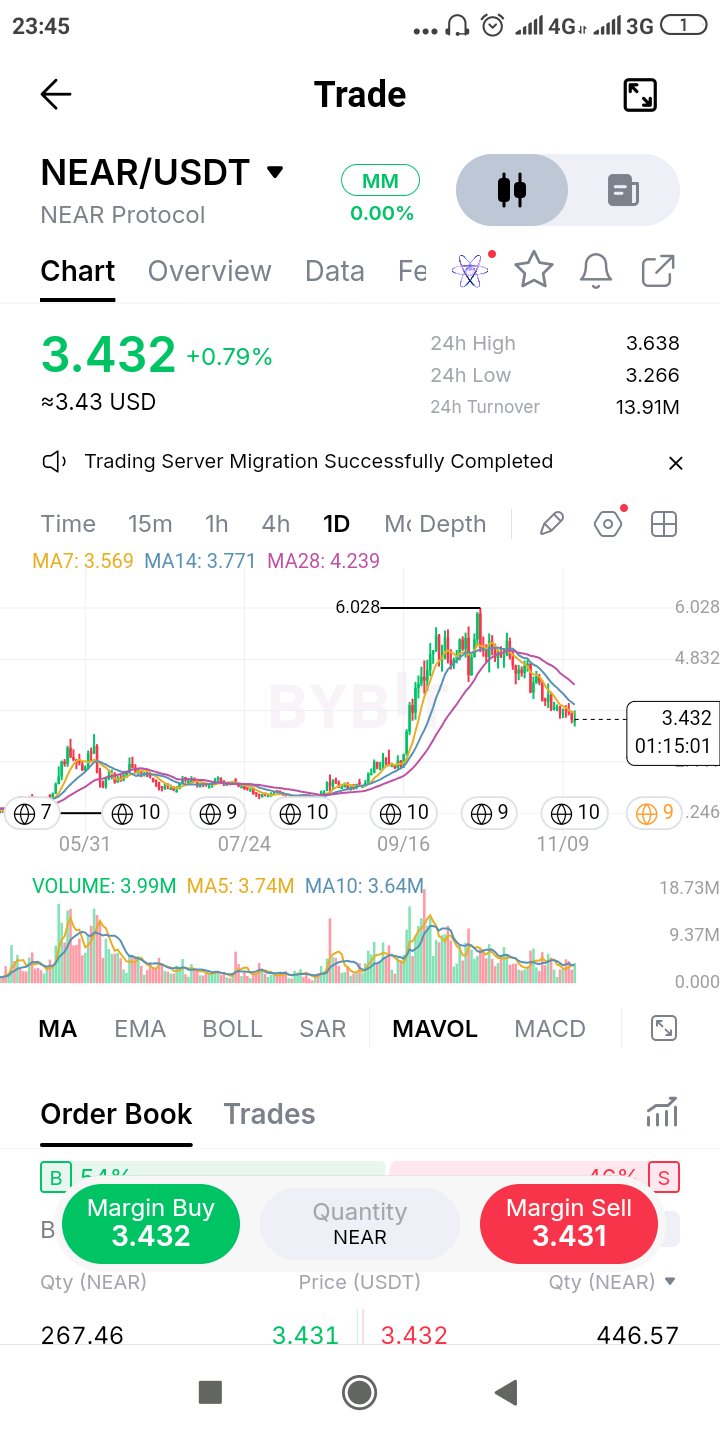
$NEARUSDT 剛剛在眾目睽睽之下跑完了一整個威科夫週期(Wyckoff cycle):夏季築底、暴力的拉升(markup)至 6.03、十月中旬見頂,現在則是下跌(markdown)。價格從高點下跌了 43%,且回吐了超過一半的漲幅。 為什麼我認為這是下跌趨勢而非底部:價格位於 7、14 和 28 日均線(分別為 3.57、3.77、4.24)下方,所有均線都在向下彎頭,且 28 日均線比目前的交易價格高出約 23%。這意味著上方有大量的套牢盤需要消化。這波行情的成交量徘徊在平均水準附近,完全不像當初推動反彈時那樣爆量,所以目前還沒看到標誌著底部結束的恐慌拋售(capitulation)。 過去 24 小時的波動區間在 3.27 到 3.64 之間,高點在 7 日均線上方稍作觸碰後就回落。我首先想看到的不是一根陽線,而是日線收盤價能站上 3.57,隨後出現一個更高的低點。 在 3.27 下方,幾乎沒有什麼圖表結構支撐,直到九月初的突破區間為止,所以我寧願等待市場自己表態,也不想去猜測底部在哪裡。 $NEARUSDT #ByXIMPACT
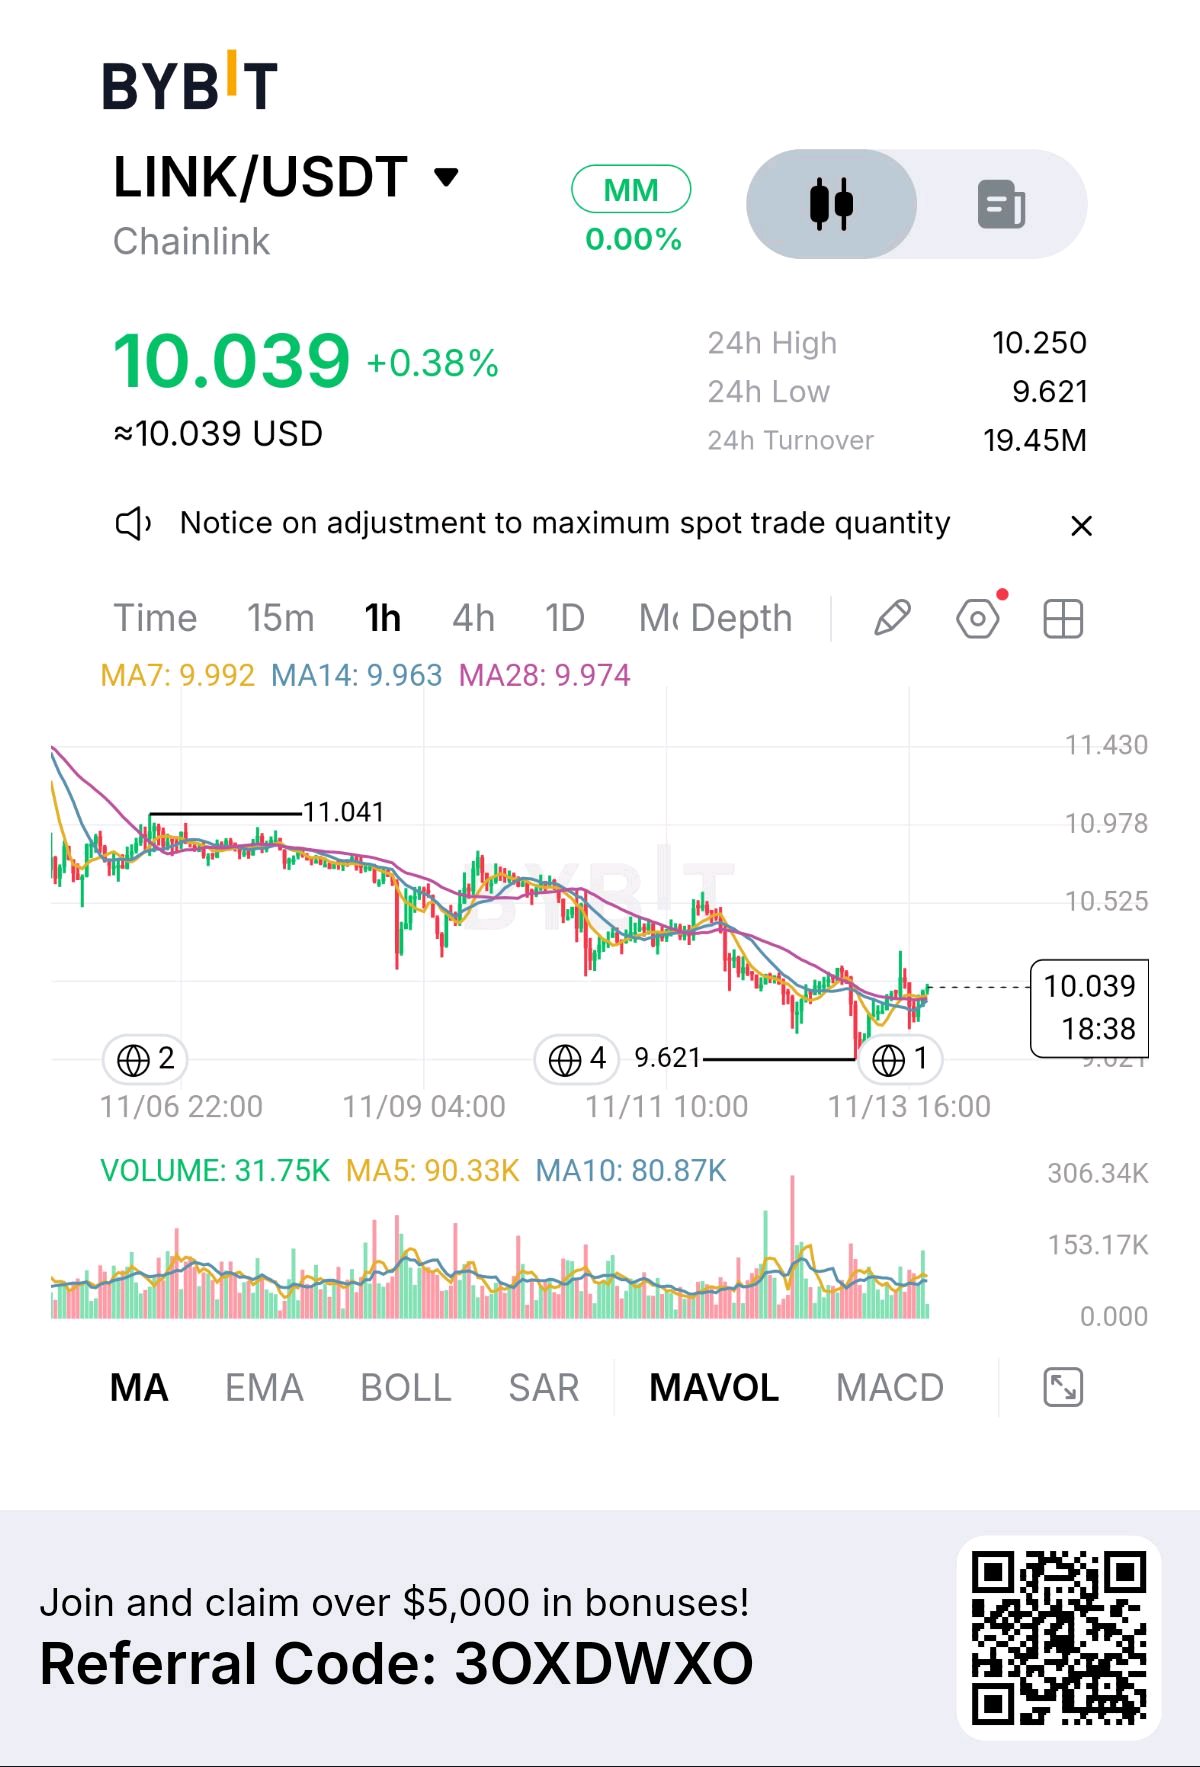
$LINKUSDT just ran the stops under its last low and couldn't stay there. The flush to 9.62 undercut the previous swing low, then price took back the whole move within hours and now sits above the 7, 14 and 28 MAs, which have flattened into one tight band around 9.96-9.99. Al Brooks' read on failed breakouts applies: the side that chased the breakdown is now trapped, and their exit becomes fuel for the move up. But keep it honest. On the hourly, every bounce has topped lower than the last, and 10.25 is the most recent of those lower highs. Until that breaks, this is a failed breakdown, not a trend change. Above 10.25 I'd look toward 10.5. Back under 9.96 and it's just another weak bounce. A close below 9.62 kills the idea outright. $LINKUSDT #ByXIMPACT
$XAUTUSDT 在三天內從 4,130 下跌了近 7%,隨後的反彈幾乎稱不上是反彈。 價格僅回升至 3,916 左右,跌幅回補不到四分之一。墨菲(Murphy)的經驗法則指出,健康的修正至少要回撤三分之一才算是一次真正的嘗試。這一波行情的升幅三分之一處接近 3,944,但價格甚至未曾接近該位。買方進場得太晚,離場得又太早。 目前價格正處於 3,851 低點上方,成交量清淡,且位於 3,878 至 3,887 之間的 7、14 和 28 日均線密集區下方。在壓力位下方、支撐位上方的壓縮走勢,意味著其中一個水平即將被突破。 若小時線收盤跌破 3,851 並伴隨成交量,則該低點將失守,並為下一波跌勢騰出空間。若能收復 3,887 並站穩,則反彈有望轉為築底,目標將再次看向 3,916,隨後是 3,944。 我不會去猜測結果。我會觀察誰先守住自己的防線。 $XAUTUSDT #ByXIMPACT
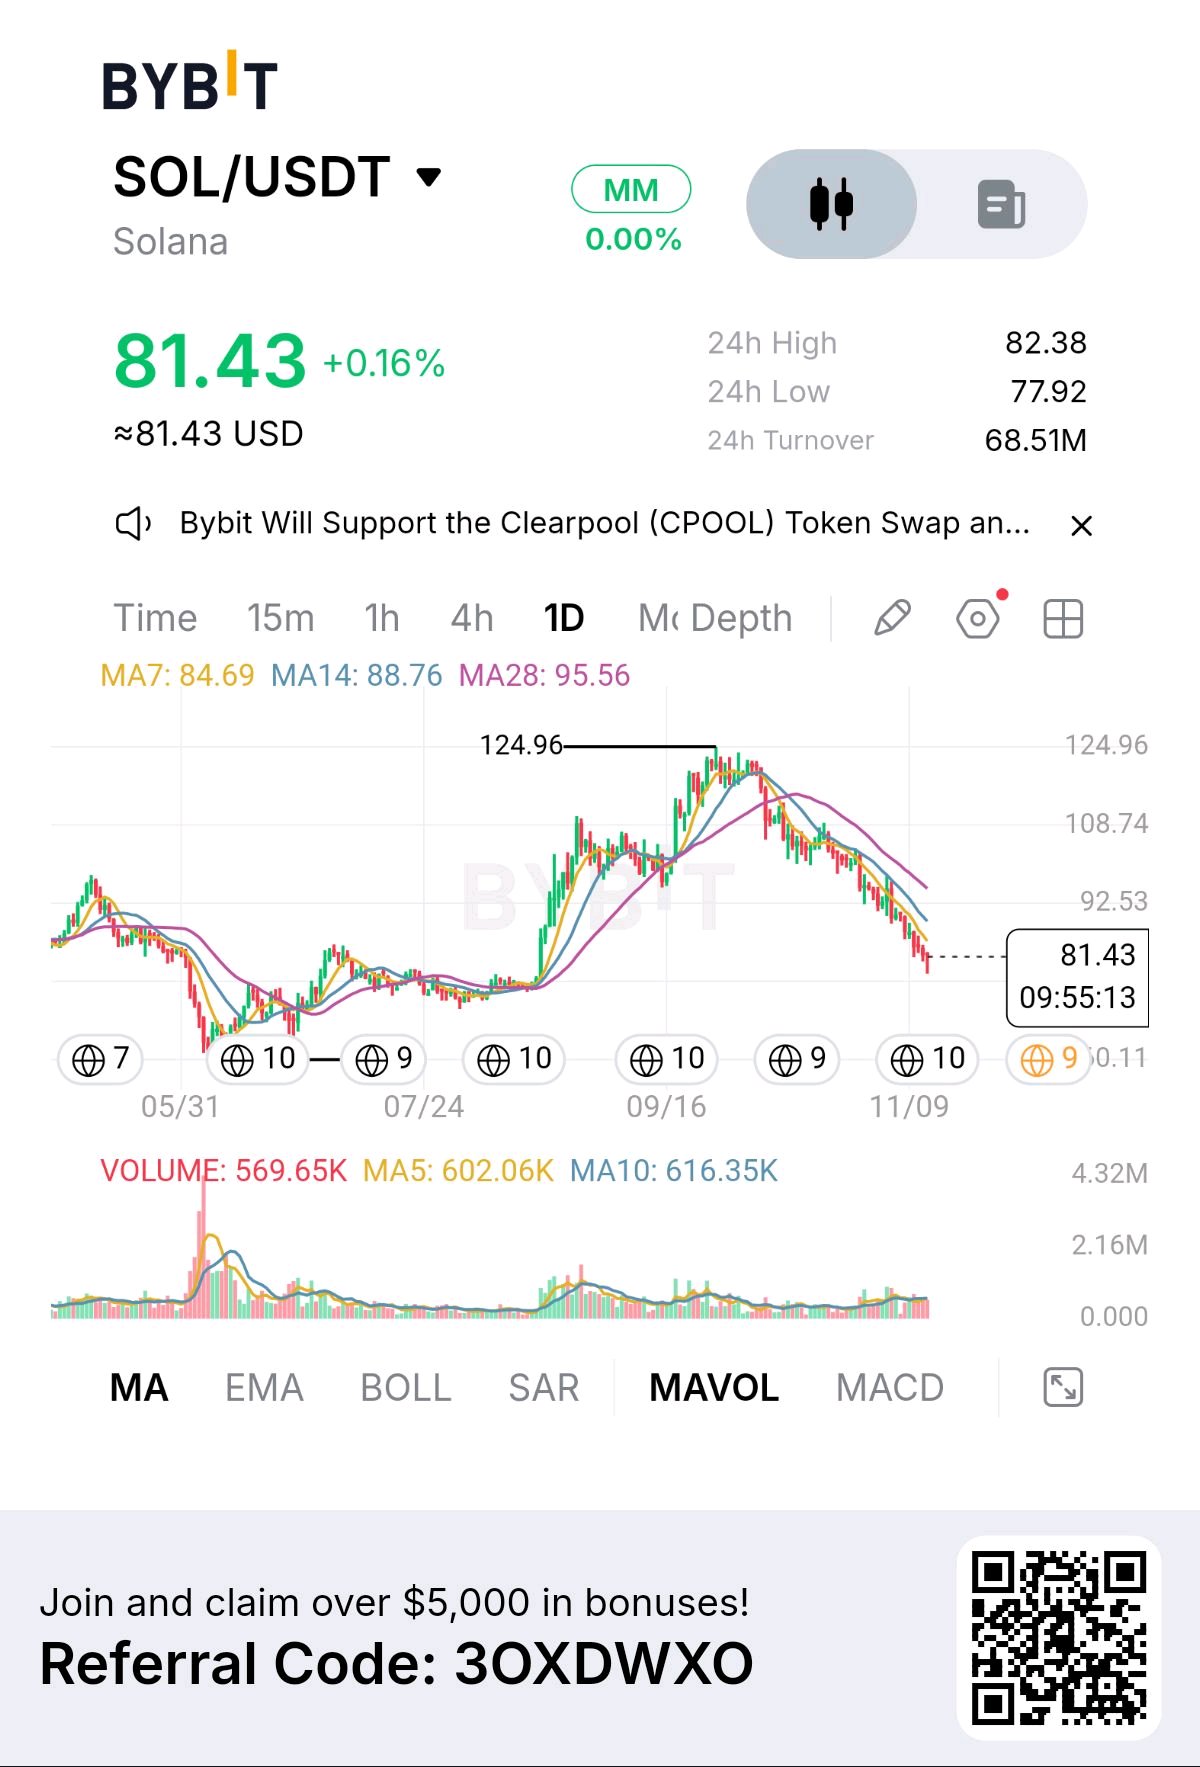
$SOLUSDT 自 125 點位已下跌約 35%,但圖表仍未出現真正底部所需的關鍵跡象。 看看上次大底部是如何形成的:伴隨著高於平均水平數倍的成交量出現劇烈下殺,然後才開始築底。這一段走勢恰恰相反。緩慢的陰跌,成交量平淡且萎縮,今天 57 萬的成交量甚至低於 5 日和 10 日均線。沒有人被迫砍倉離場。這是一種有序的價格下調,而有序的下調往往會持續進行,直到有人被迫平倉為止。 價格目前也比 28 日均線低了約 15%,所以隨時可能出現反彈至 85-89 區間的行情。我會把這視為橡皮筋彈跳,而非趨勢反轉。接近 84.7 的 7 日均線是第一個壓力位,接近 95.6 的 28 日均線才是真正的壓力位。 下方值得關注的關鍵點位是 78,即今天的低點。若是靜悄悄地跌破,那就沒什麼意義。我真正會留意的,是伴隨著成交量激增的跌破,然後在成交量減少的情況下進行回測。那才是恐慌拋售,而那種時刻才是佈局的起點。 $SOLUSDT $BTCUSDT #ByXIMPACT
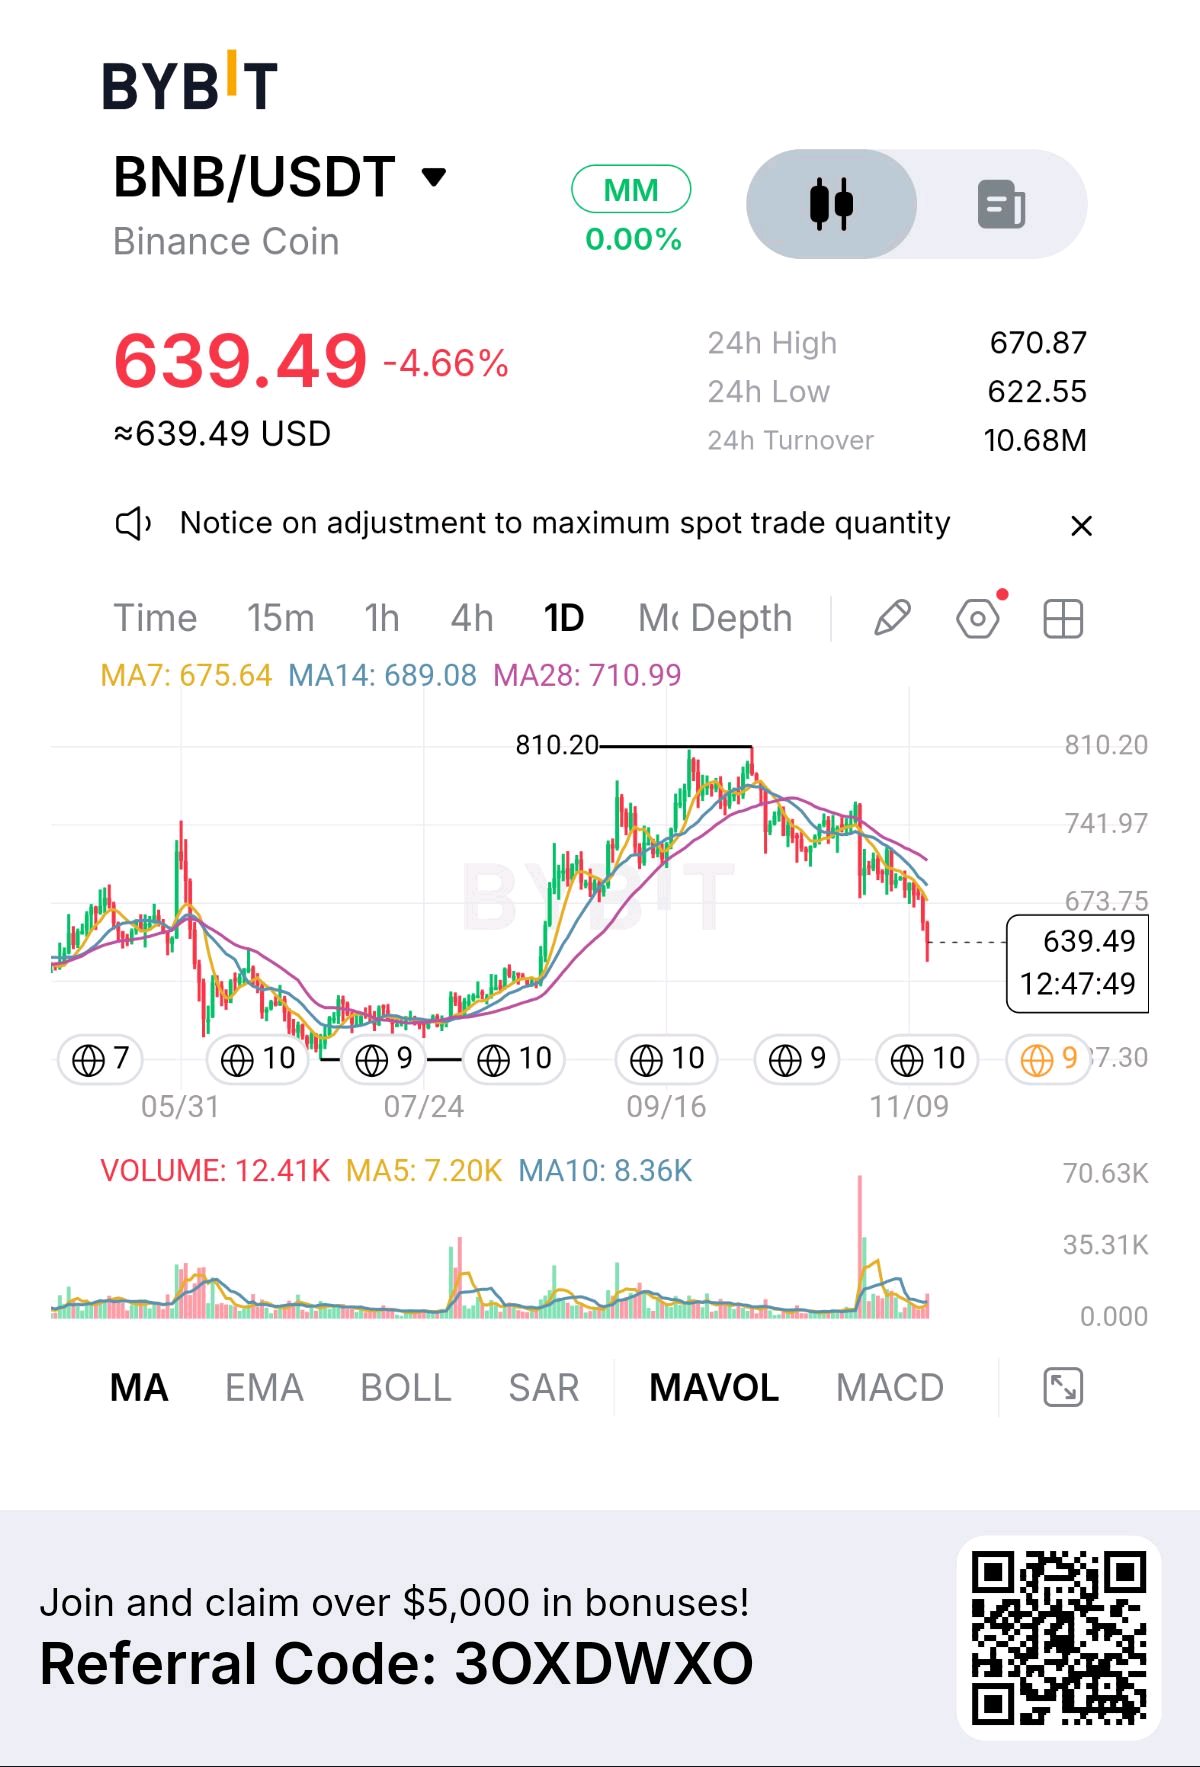
Is BNB at 640 a dip buy? Not yet, and the volume tells you why. The range gave way on a volume spike many times the normal daily average. A real selling climax gets an automatic rally and then a retest of the lows. BNB got neither. The only bounce stalled under the falling MAs and sellers stepped in at every lower high. That's a bear channel, and in Al Brooks' framework pullbacks inside one are sold, not bought, until the channel actually breaks. Today adds to it: down 4.7%, volume already running above its 5-day average, and price sitting under the 7, 14 and 28 MAs, all rolling over. Where it gets interesting: 670-676 is broken support stacked with the 7MA, so that's the first real test of any bounce. 622 is today's low. Lose it and the summer base around the mid-500s becomes the next magnet. What changes my mind is a daily close back above 676 that holds on volume. Until then, patience is the position. $BNBUSDT $ETHUSDT #ByXIMPACT
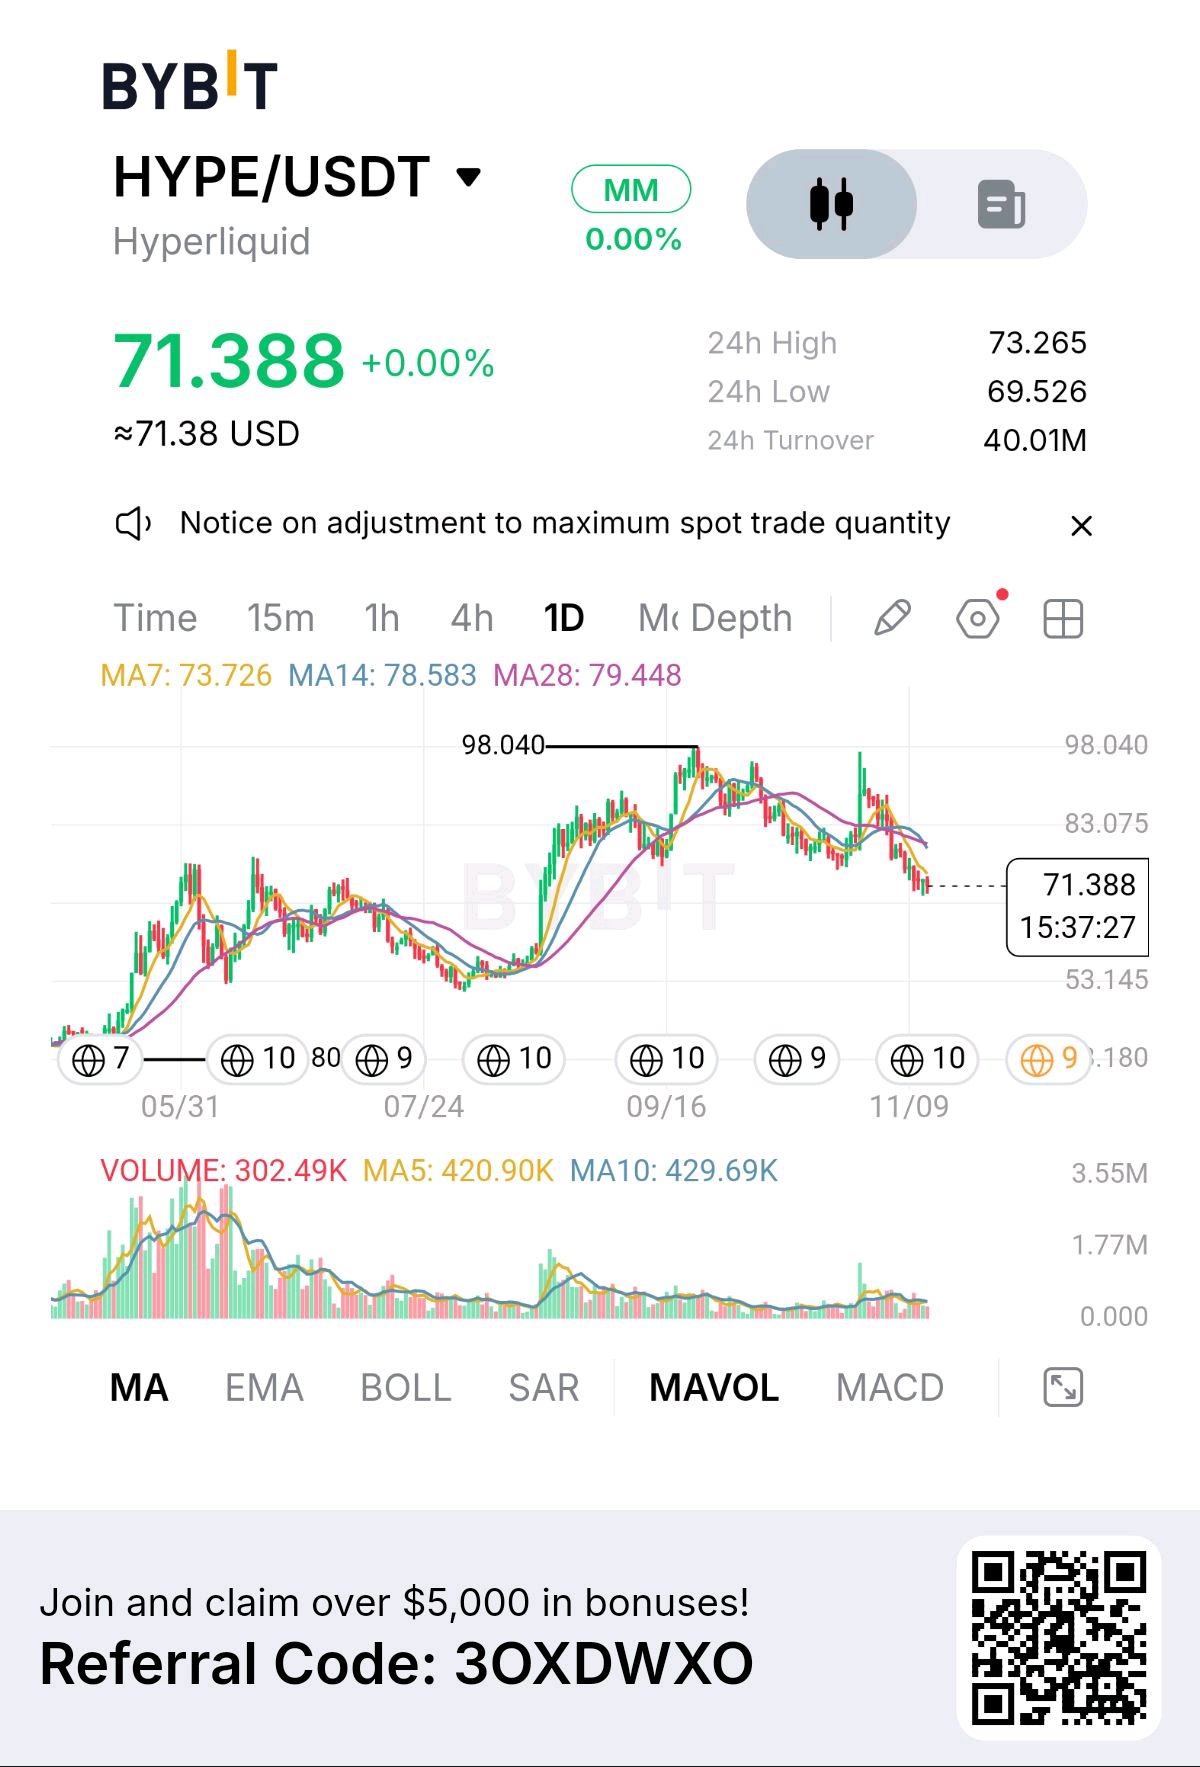
HYPE 一直在同一個天花板被拒絕。大約在 96-98 之間嘗試了三次,而最近這一次的 K 線才是關鍵:成交量巨大,價格推升至區間上方,隨後幾天內漲幅全數回吐。在威科夫(Wyckoff)理論中,這是一個「上衝(Upthrust)」。付出巨大的努力卻沒有結果,所有追高買入的人現在都被套在上面了。 從那之後,結構就很明顯了。日線均線排列為 7 日線在 14 日線下,14 日線在 28 日線下,全部向下彎頭,價格位於 71.4,低於所有均線。下跌過程中的成交量正在萎縮,所以這是一種陰跌,而非恐慌性拋售。陰跌通常會在某個價位結束,而不是在某個信號出現時結束。 我正在關注的點位: 73-74:7 日均線,多頭必須在日線收盤時收復的第一個目標 83:已跌破的支撐位,反彈時自然的賣出區 69.5:24 小時低點,目前的即時地板 53:如果 69.5 失守,則是七月份的底部支撐 我的解讀:在 83 以下的反彈都是用來賣出的,而不是追漲,除非日線能帶著真實成交量收在 7 日均線之上。若失守 69.5,我不會試圖去接盤,我會等待底部浮現。 $HYPEUSDT $BTCUSDT #ByXIMPACT
#BTC #比特幣 #BTCUSDT #MDFUNDS
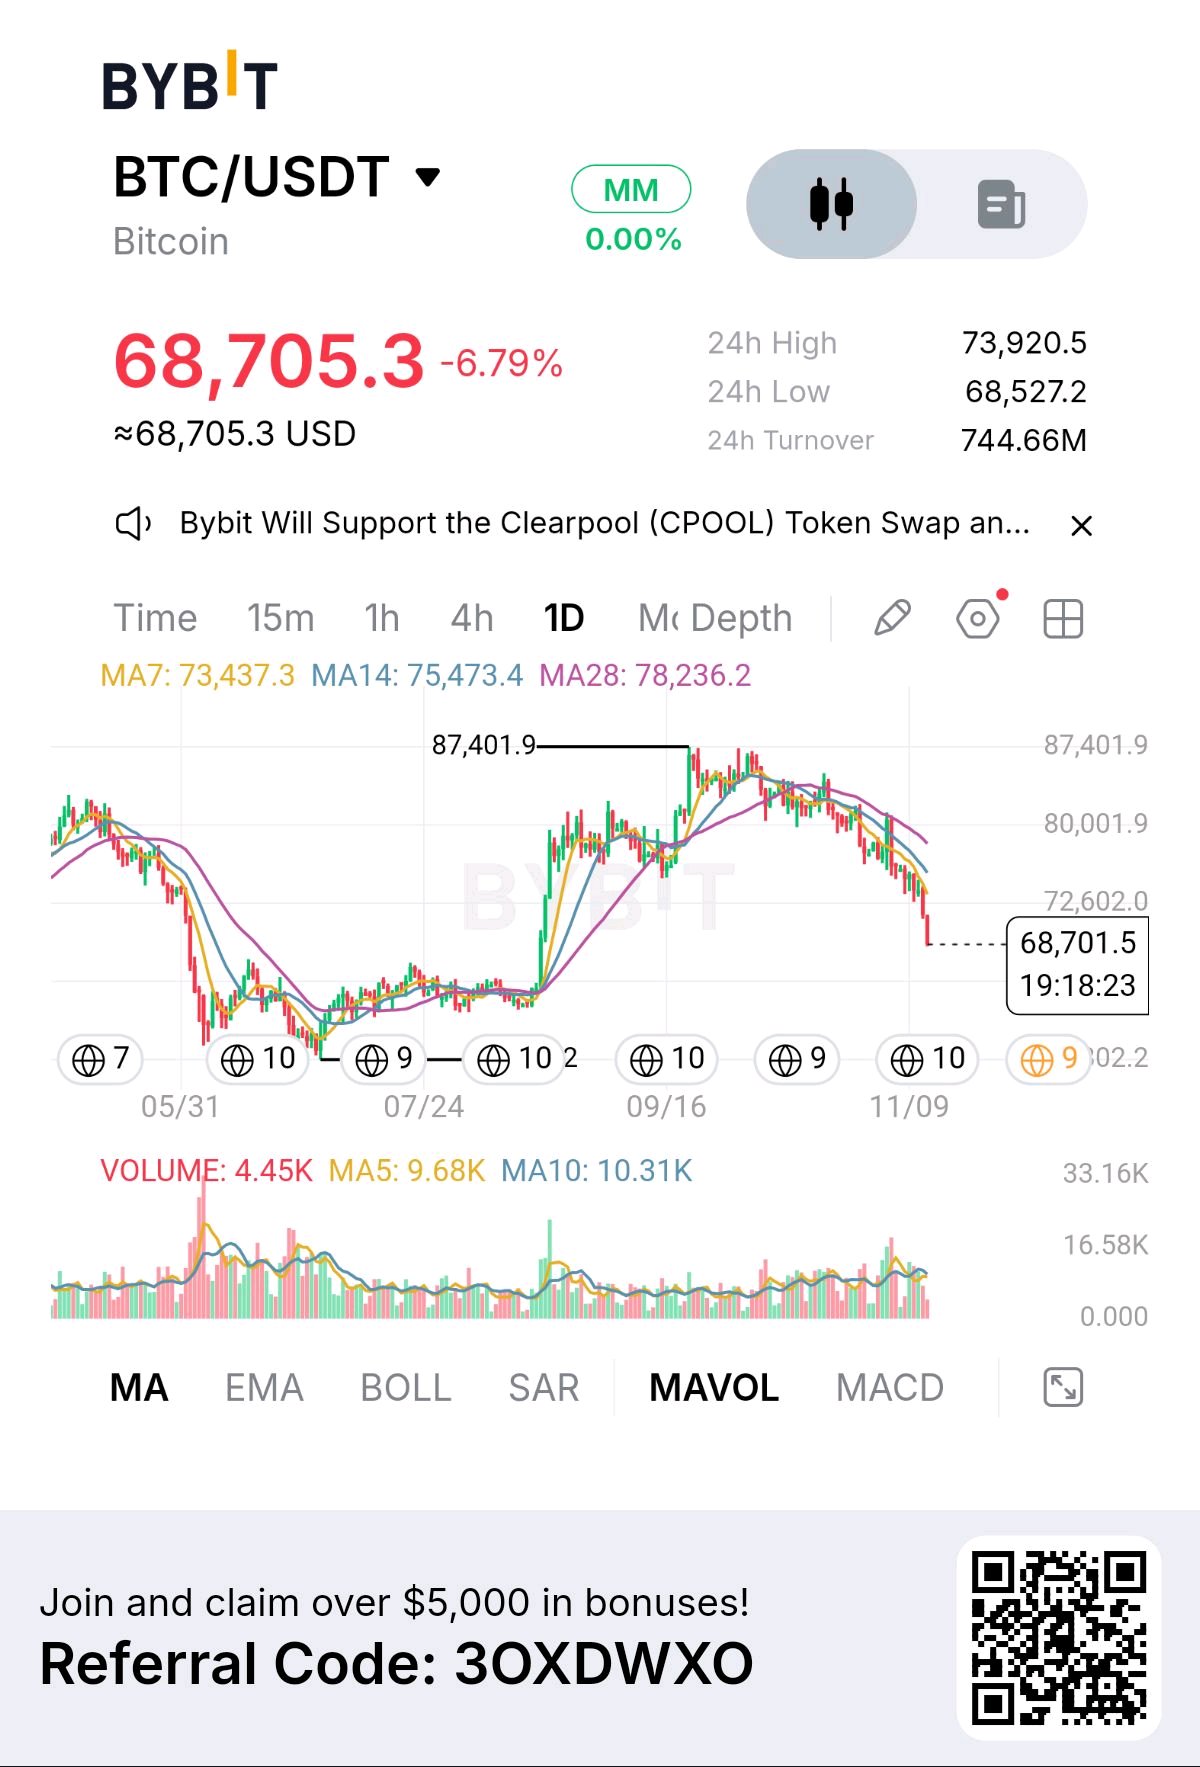
#BTCUSDT| 市場結構正在改變 比特幣最近的跌勢值得關注,但更具啟示性的發展是拋售發生之前的情況。 在觸及 87,401 美元區間後,BTC 難以維持其上漲勢頭。復甦階段動能逐漸減弱,高點逐漸降低,價格最終失守 72,600 美元區域。 目前交易價格在 68,705 美元左右,比特幣位於所有三條日線移動平均線之下: MA7: $73,437 MA14: $75,473 MA28: $78,236 這種排列反映出市場在多個時間跨度上仍由賣方掌控。 我不容忽視的一個細節是成交量。顯示的成交量為 4.45K,對比 MA5 的 9.68K 和 MA10 的 10.31K。由於當前日線可能尚未收盤,在得出關於拋售力道的結論之前,需要確認其最終成交量。 當前的即時考驗在 68,500 美元附近。持續的跌破可能會引向更低的價格區間,而回升至 72,600 美元以上則是嘗試重新建立結構的初步舉措。更強勁的復甦需要 BTC 去挑戰其正在下行的移動平均線。 這就是道氏理論(Dow Theory)原則特別相關的地方:在確認趨勢反轉之前,市場應該展現出高點和低點序列的真實變化。 問題不在於比特幣是否已經跌得夠多了。而是買方能否拿出證據證明賣方正在失去控制權。 你認為這是一個趨勢破位的發展過程,還是 BTC 正在接近一個可能開始顯著復甦的區域? #BTCUSDT$XAUTUSDT #ByXIMPACT

#QNT #Quant #加密貨幣交易
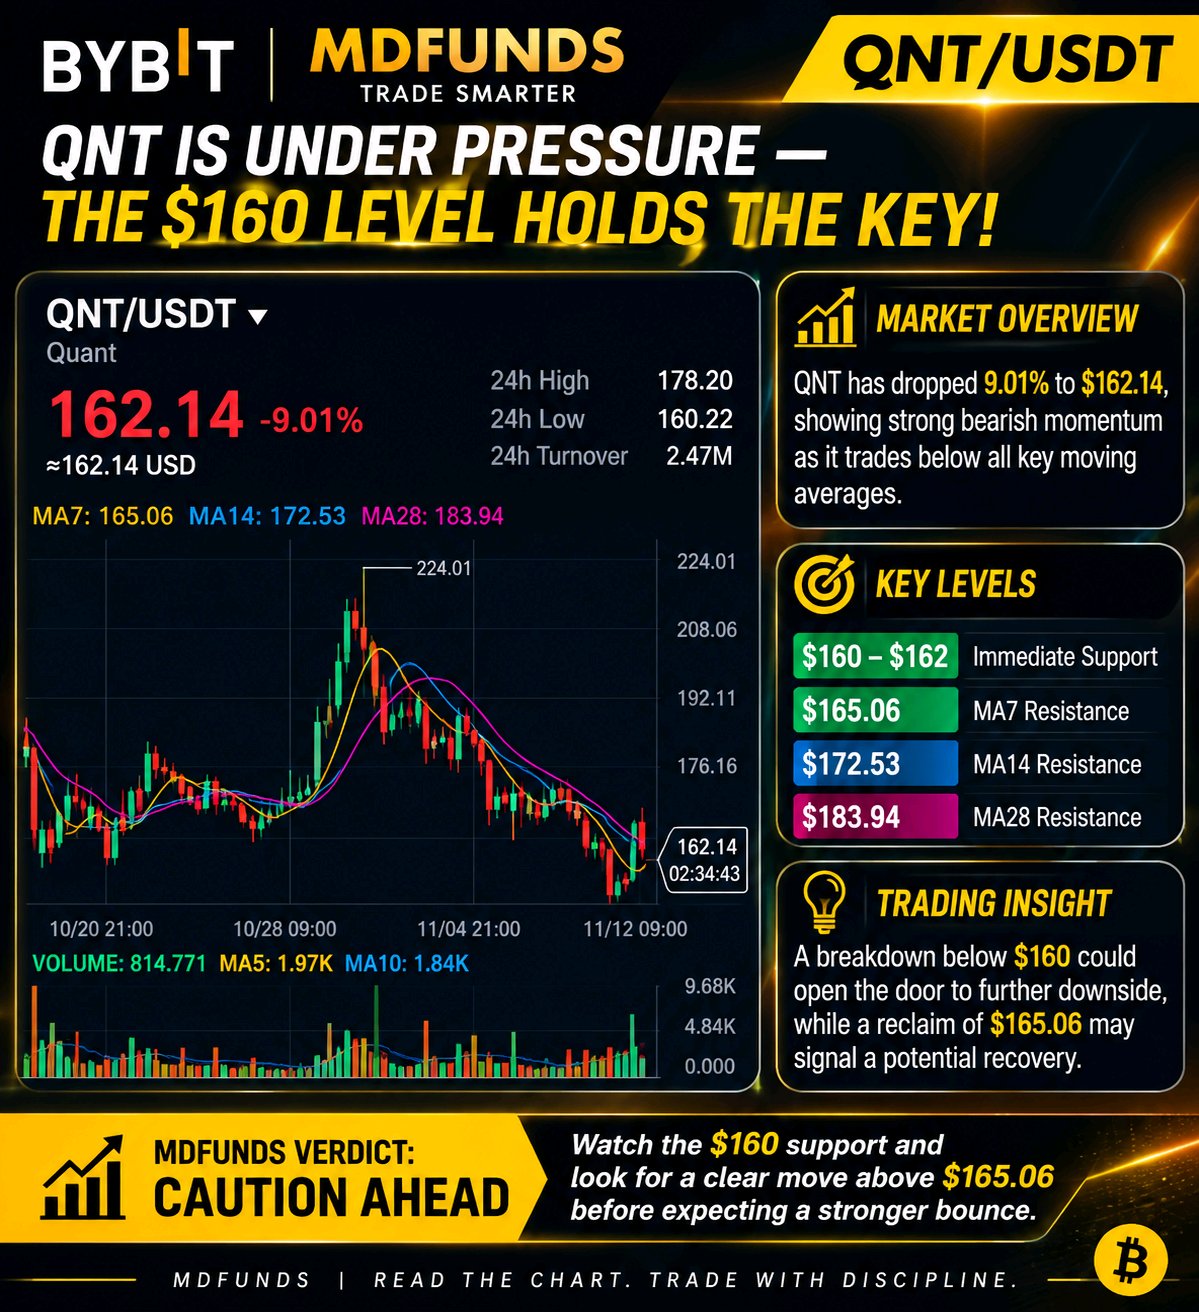
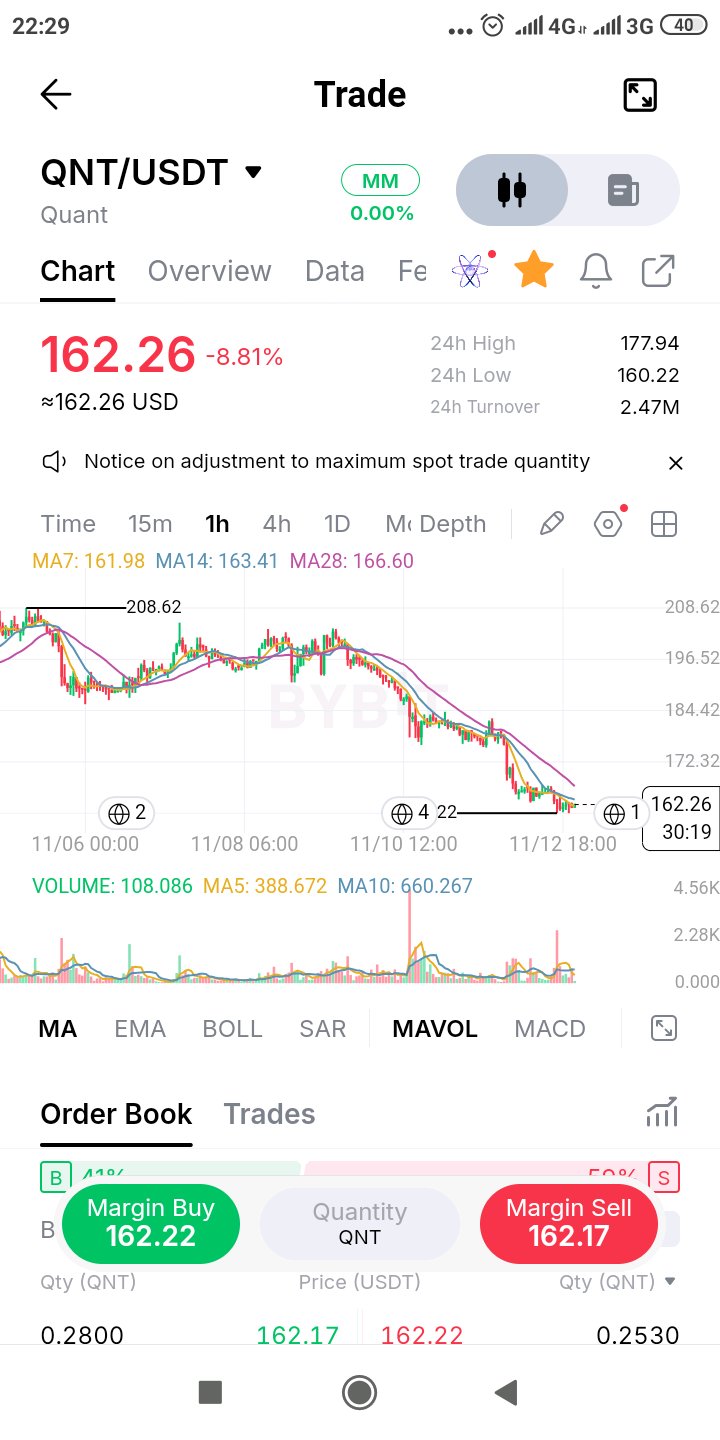
QNT/USDT — 支撐位測試 QNT 正接近一個關鍵水平,市場需要證明買方是否仍願意捍衛價格。 4 小時結構已經顯著惡化。價格目前在所有三條移動平均線下方交易,MA7 為 165.07,MA14 為 172.54,MA28 為 183.94。這種排列告訴我們,賣方目前在結構上佔據優勢。 但還有一個值得觀察的細節:價格目前徘徊在 162 左右,24 小時低點為 160.22。 這正是下一個有意義的反應可能產生的位置。 如果買方能捍衛 160–162 區域並收復 165,我們或許能開始看到試圖企穩的跡象。若能強勢回升至 172 以上,則更具參考價值。 然而,如果 4 小時線令人信服地跌破 160.22,那麼目前的支撐防禦就變得令人質疑了。我不會僅僅因為價格已經大幅下跌就急著去判斷底部。 我最感興趣的是買方能否在此水平做出有意義的反應,而不是又一次短暫的反彈。 QNT 是在接近需求機會,還是這個支撐位僅僅是賣方準備突破的下一個關卡? $QNTUSDT $CITYUSDT #ByXIMPACT
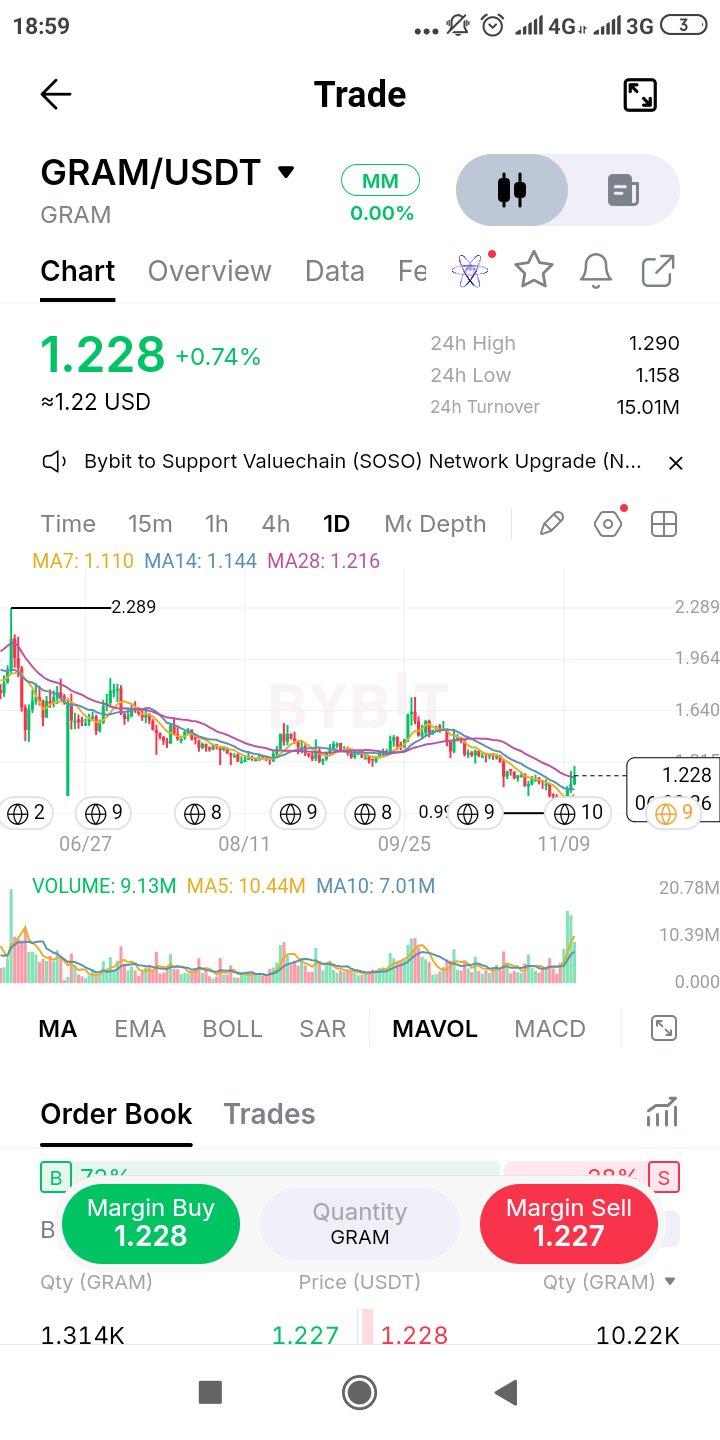
$GRAMUSDT| 看漲反應 GRAM 終於展現出一些反彈跡象——但這會是反轉的開端嗎? 經歷了一段長時間的下跌壓力後,GRAM 正試圖扭轉局勢。 目前報價 $1.228 (+0.74%),該代幣已從近期低點反彈,最新的日線蠟燭圖顯示交易活躍度明顯增加。 這次走勢引人注目的不僅僅是正向漲幅,而是反彈發生的位置。 技術面發展 GRAM 已收復圖表上顯示的所有三條移動平均線: • MA7:$1.110 • MA14:$1.144 • MA28:$1.216 價格目前運行在整個均線組合上方。這是一個令人鼓舞的短期發展,顯示買方正開始重新掌控局面。 然而,整體走勢圖仍留有從 $2.289 高位長期下跌的傷痕。一次反彈嘗試並不能自動抹除既有的結構。 我關注的關鍵點位 • $1.216 — MA28 及即時趨勢測試點 • $1.158 — 24 小時低點 / 下行參考點 • $1.290 — 即時阻力位 • $1.40–$1.50 — 若動能擴大,潛在的下一個反彈區域 成交量透露的訊息 當前成交量為 913 萬,相比之下 MA5 為 1044 萬,MA10 為 701 萬。 相較於 10 日均線,當前活躍度有所提升,支持了這次反彈正在吸引市場注意的觀點。 但持續的買盤參與度才是決定此次波動能否發展成更大幅度反彈的關鍵。 MDFUNDS 市場觀點 GRAM 正展現出有趣的初期復甦訊號。 關鍵考驗在於買方能否將價格維持在 $1.216 之上,並最終挑戰 $1.290。 若在阻力位附近受阻,可能會引發新一輪的盤整階段。若能獲得更強成交量的支持並實現有力的突破,將會使看漲復甦的觀點更具說服力。 最有趣的地方不在於 GRAM 今天上漲,而在於價格已開始挑戰那條壓制賣方數月的趨勢線。 密切關注後續走勢。 MDFUNDS 在群眾之前洞察轉折。依據證據進行交易。 分析基於所提供的 Bybit 日線圖。非財務建議。 $GRAMUSDT $BTCUSDT #ByXIMPACT

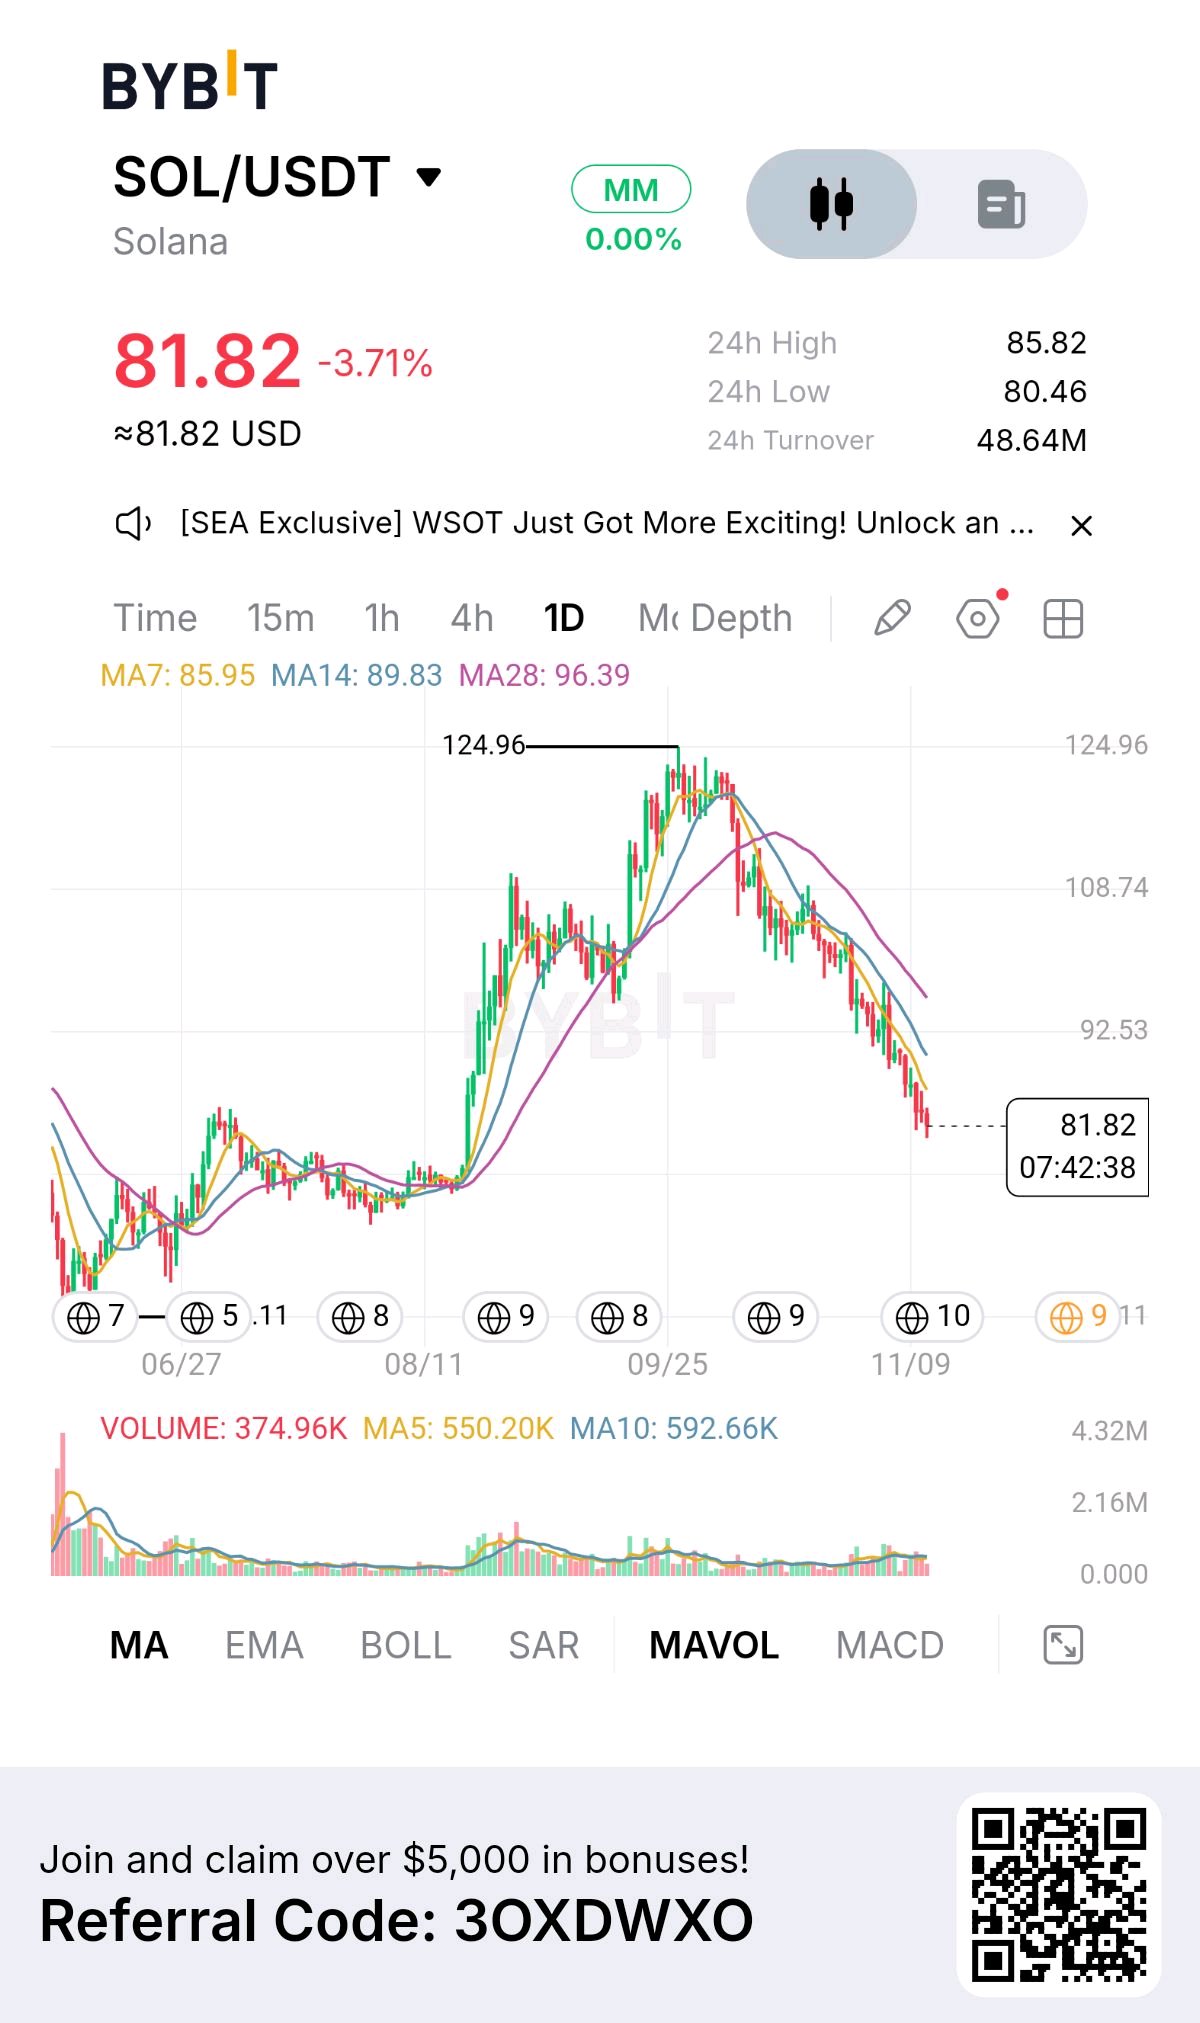
$SOLUSDT| 看跌動能 SOLANA 正面臨壓力——空方似乎還沒打算收手。 Solana 目前交易價格約為 $81.82,下跌 3.71%,日線圖顯示看漲結構持續流失。 但這裡有個比跌幅百分比更重要的問題:低點不斷降低的趨勢、疲軟的反彈嘗試,以及價格與移動平均線之間的距離不斷拉大。 技術面分析 SOL 已跌破圖中顯示的所有三條移動平均線: • MA7: $85.95 • MA14: $89.83 • MA28: $96.39 這種排列使得短期、中期和長期的動能都面臨沉重壓力。 先前向 $124.96 的漲勢現已被大幅回調所取代。買方尚未展現足夠的力量來扭轉這一趨勢。 可能定義下一步走勢的關鍵點位 • $80.46 — 即時支撐位 / 24小時低點 • $78–$80 — 潛在的下行反應區 • $85.95 — 第一個反彈阻力位 • $89.83–$96.39 — 主要移動平均線阻力區 值得關注的重點? 成交量目前為 374.96K,低於 MA5 (550.20K) 和 MA10 (592.66K)。 這點很重要。目前的下跌是在成交量未超過近期平均水平的情況下發生的,因此我們應該區分持續的看跌結構與加速拋售之間的區別。 MDFUNDS 市場觀點 對於將 SOL 當前的價格視為自動買入機會,我會保持謹慎。 若持續跌破 $80.46,可能會開啟下一波下跌空間。相反,若能守住該點位並重新站上 $85.95,將是買方試圖重新奪回控制權的第一個跡象。 SOL 面臨的更大挑戰不僅僅是反彈,而是重塑趨勢。 在此之前,對反彈應持審慎態度,而非盲目樂觀。 MDFUNDS 市場情報。結構重於投機。 基於所提供的 Bybit 日線圖。非財務建議。 $SOLUSDT $BTCUSDT #ByXIMPACT
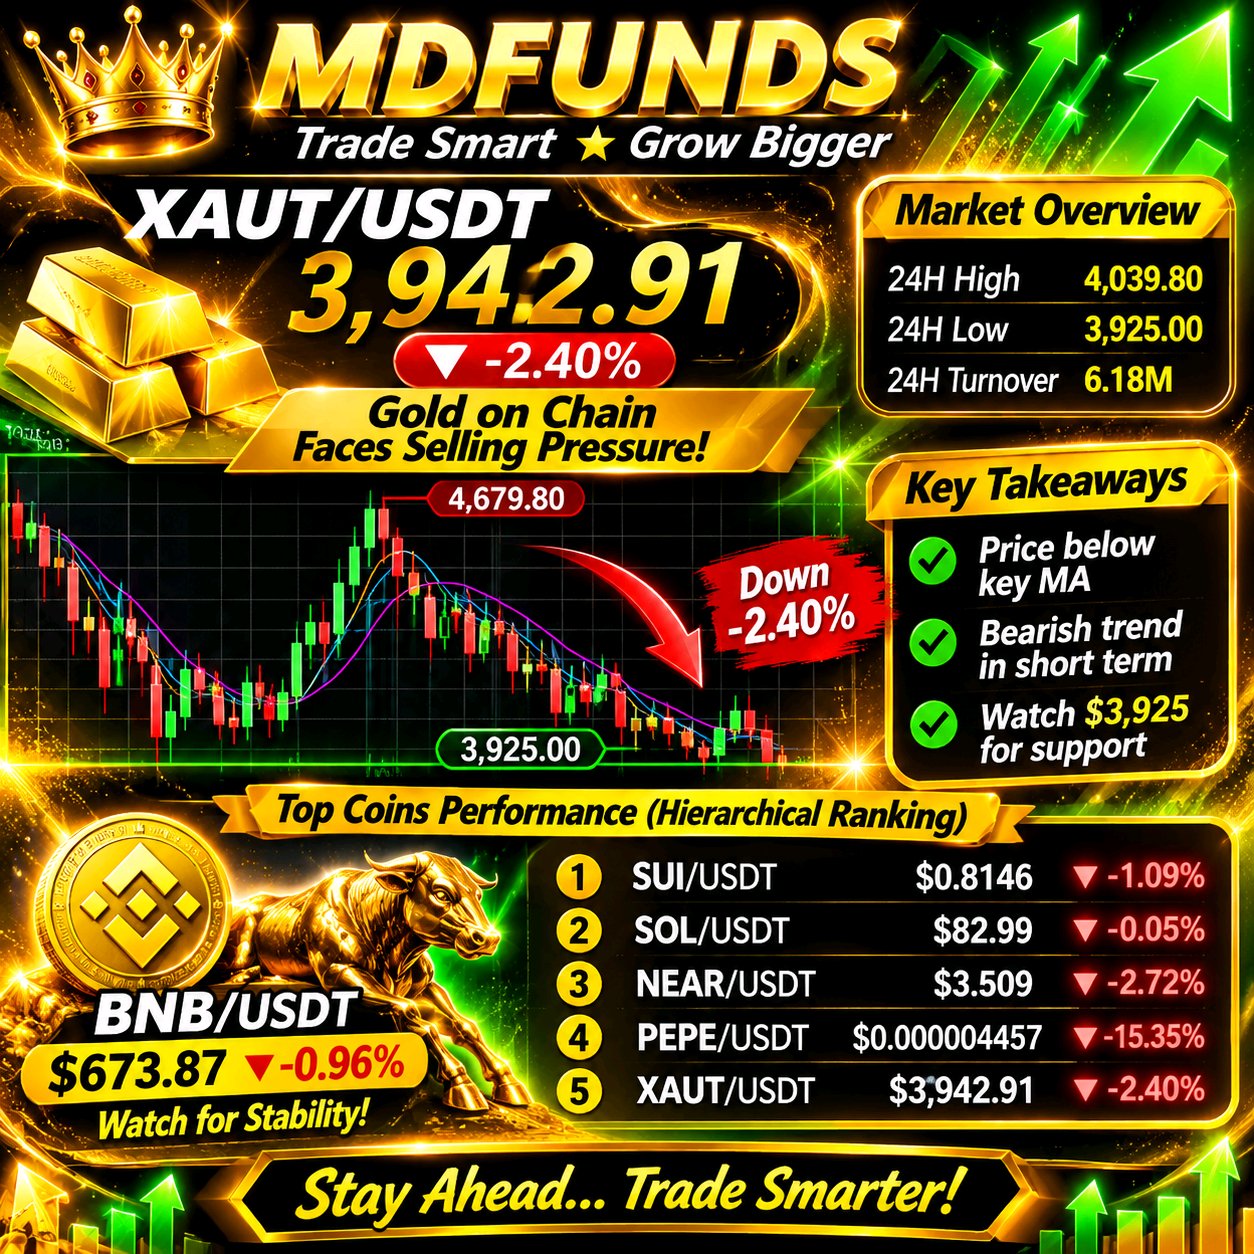
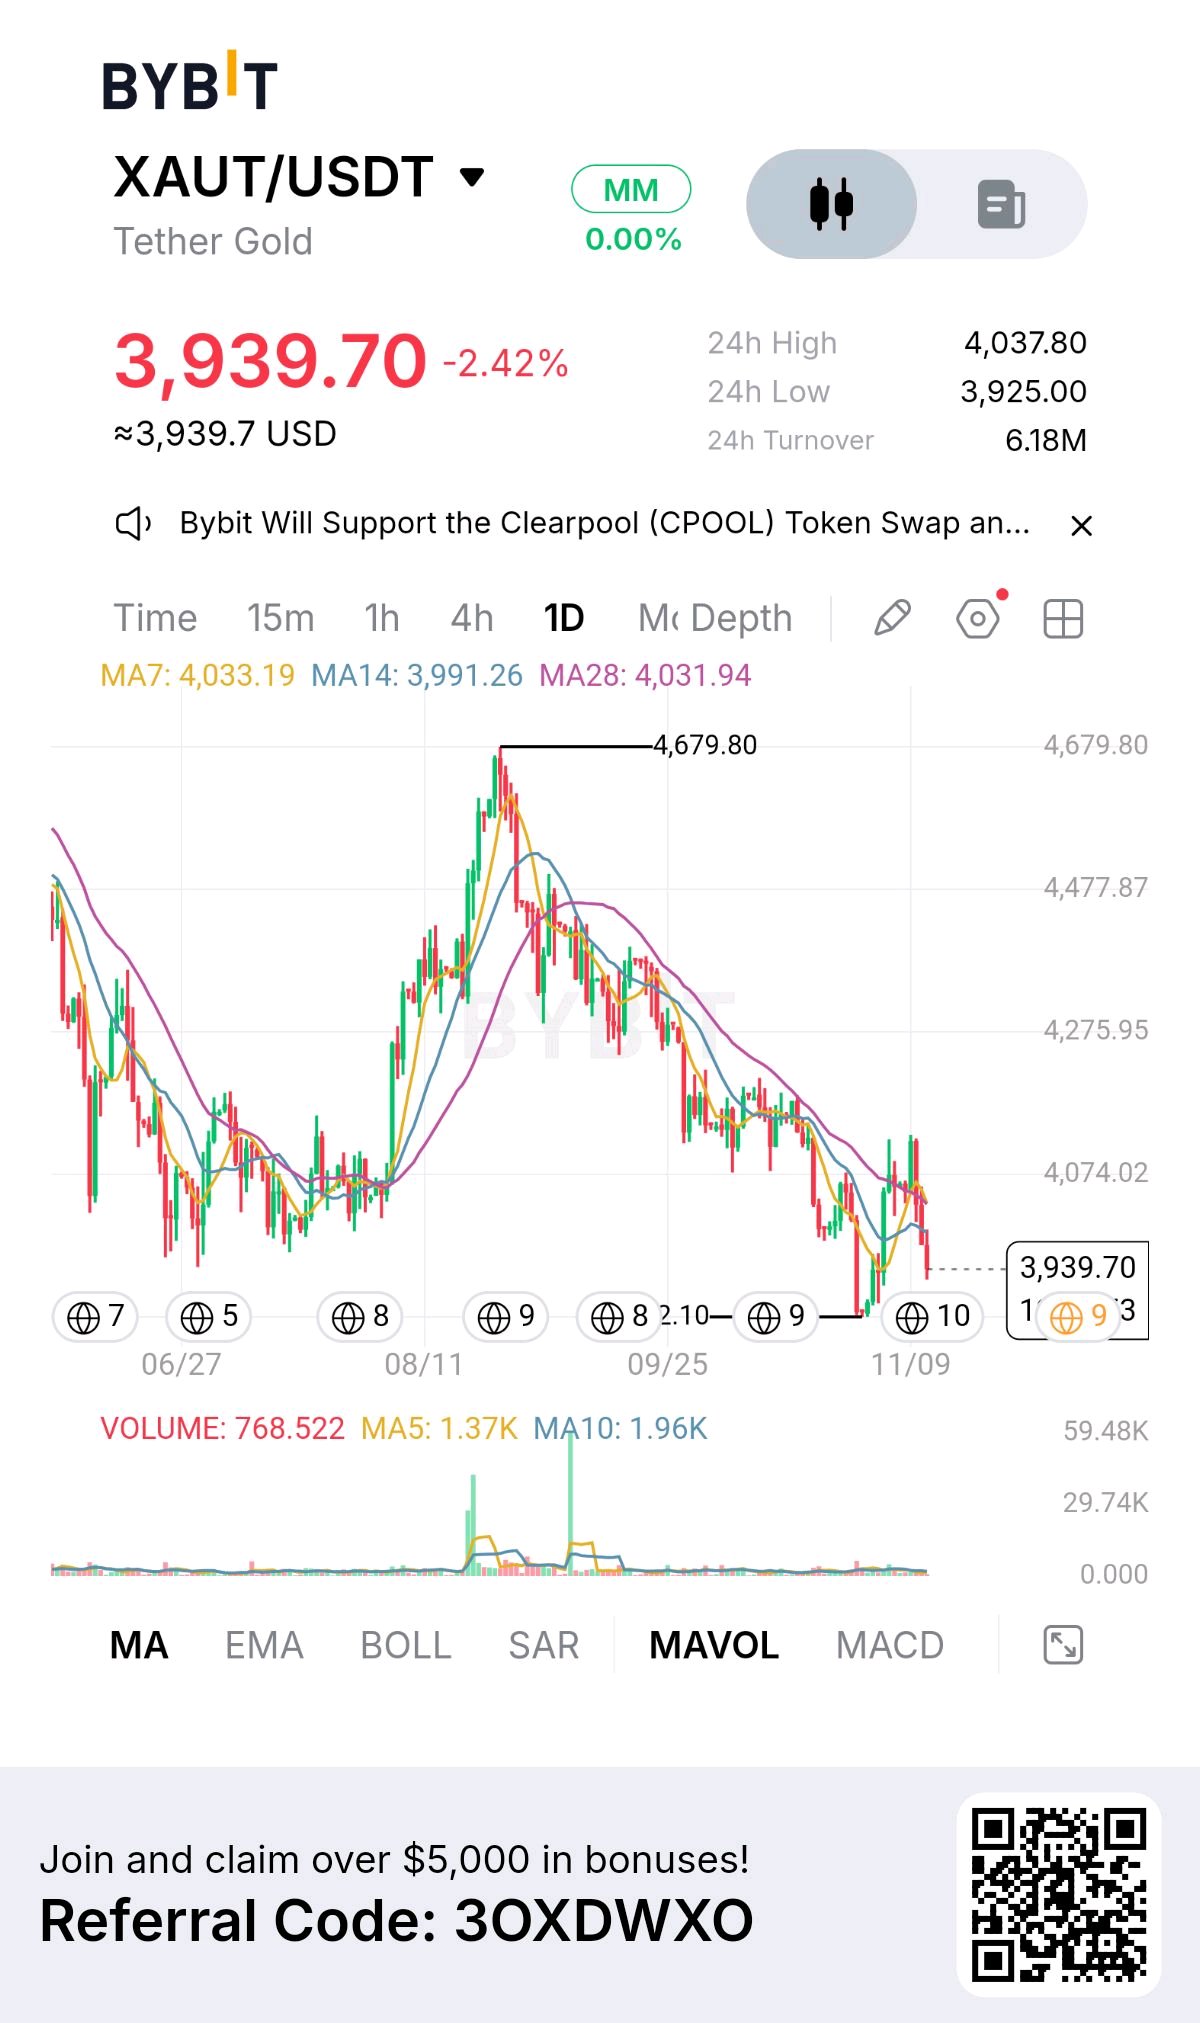
$XAUTUSDT — GOLD IS LOSING MOMENTUM. THE $3,925 LEVEL IS NOW IN FOCUS. Gold-backed crypto exposure is facing renewed selling pressure, and XAUT's daily structure is beginning to demand caution. Trading around $3,942.91 (-2.40%), Tether Gold has slipped beneath all three displayed moving averages. That is an important technical development, particularly after the rally that pushed price towards $4,679.80. WHAT THE CHART IS TELLING US This isn't simply a red candle. The broader structure shows a sequence of lower highs and weakening recovery attempts. Buyers have struggled to sustain upward momentum, while the latest decline has brought price close to its 24-hour low. THREE THINGS DESERVE ATTENTION: • $3,925 — Immediate support. A decisive breakdown could expose XAUT to further downside. • $3,991–$4,034 — Recovery barrier. Reclaiming this zone would be an important first step towards repairing the structure. • $4,039.80 — Near-term resistance. A sustained move above it would strengthen the recovery argument. THE VOLUME QUESTION Current displayed volume is 767, against MA5 at 1.37K and MA10 at 1.96K. Selling is occurring without a corresponding surge in volume. That leaves room for a stabilization attempt, but it does not yet establish buyer control. MY TRADING PERSPECTIVE I wouldn't rush to call a bottom here. If $3,925 gives way, watch for whether sellers can sustain the breakdown. If buyers defend the level and reclaim the $4,000–$4,034 region, the possibility of a short-term recovery becomes more credible. For now, XAUT needs to prove that it can attract buyers again. Patience is a position. Confirmation is an edge. Technical commentary based on the uploaded Bybit 1D chart. Not financial advice. $XAUTUSDT $BTCUSDT #ByXIMPACT