Gop Gop
4466點贊0分享268粉絲705關注
nawazsangi786s@gmail.com
nawazsangi786s@gmail.com
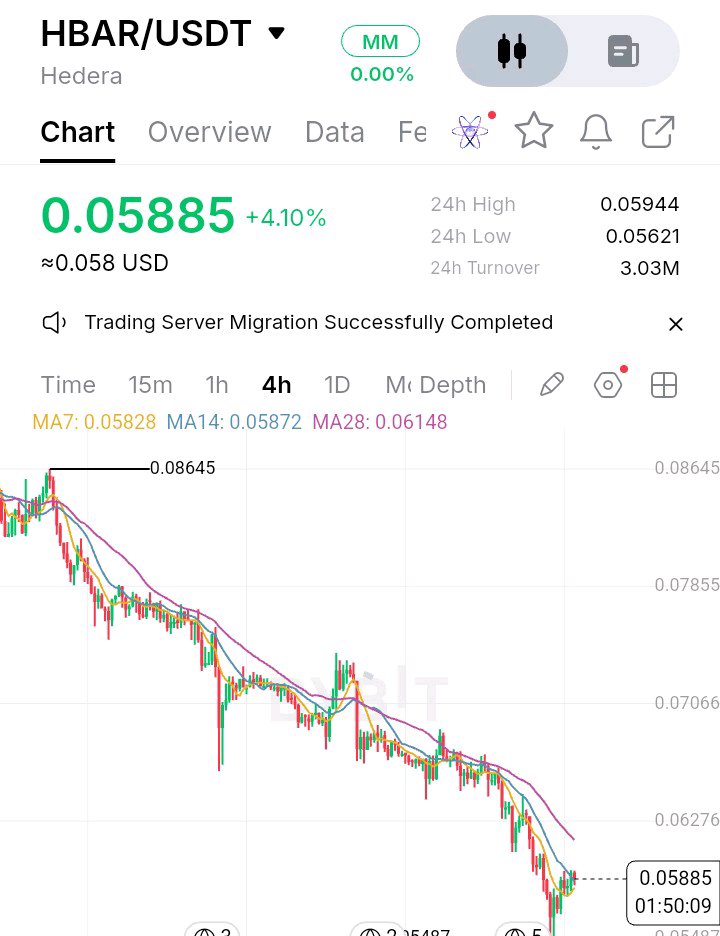
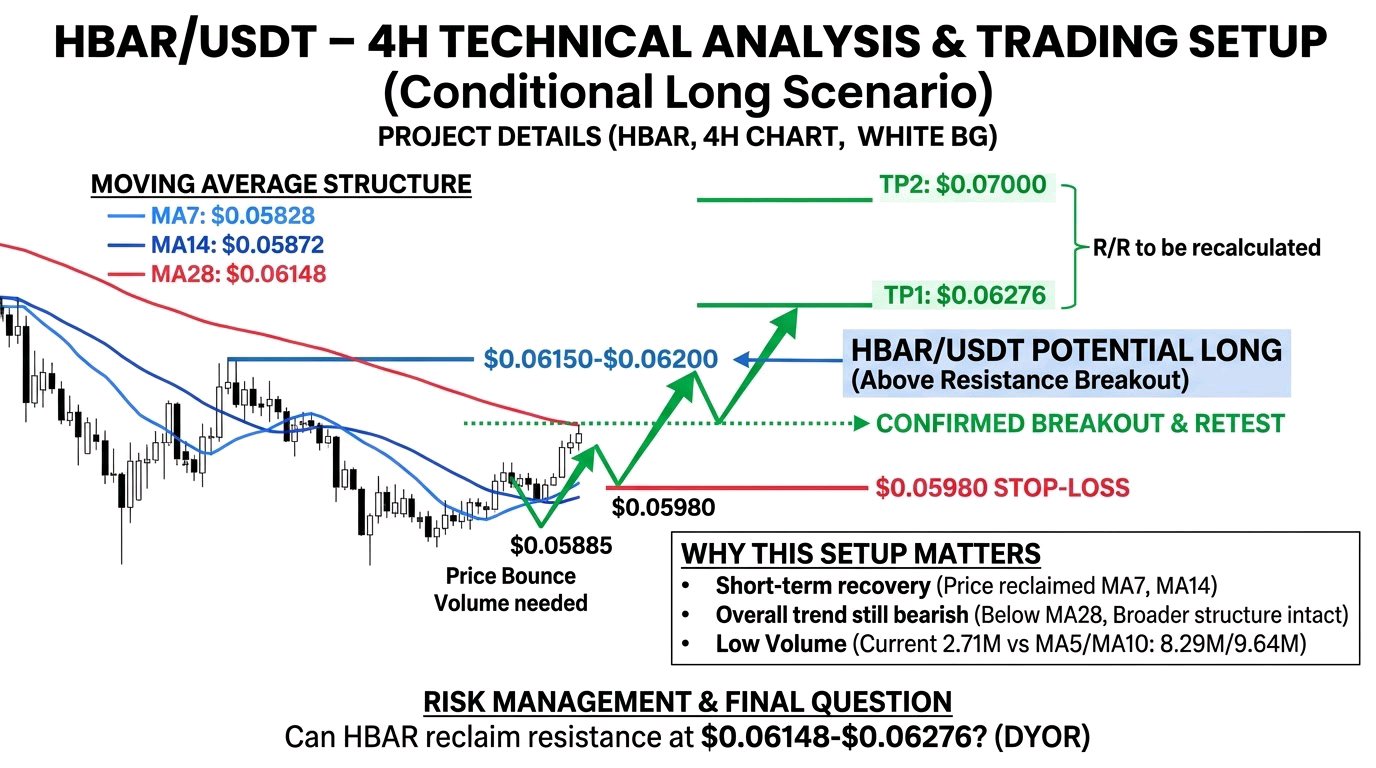
#ByXIMPACT $HBARUSDC /USDT 4H Technical Analysis and Trading Setup HBAR is showing signs of a short-term recovery after an extended bearish trend, but the latest bounce has not yet confirmed a full reversal. Buyers have stepped in near the recent lows, pushing price back toward $0.05885. The key question now is whether this recovery can overcome the next resistance zone or whether sellers will regain control. # Current Market Picture and Key Levels On the 4H chart, HBAR is trading around $0.05885, up 4.10%. The recent 24-hour range is $0.05621–$0.05944. The moving averages show improving short-term momentum: * MA7: $0.05828 * MA14: $0.05872 * MA28: $0.06148 Price has reclaimed MA7 and MA14, which is encouraging for buyers. However, it remains below MA28, indicating that the broader bearish structure is still intact. Important technical levels: * Immediate support: $0.0580–$0.0570 * Major support: $0.05487–$0.05621 * Immediate resistance: $0.05944–$0.06000 * Major resistance: $0.06148–$0.06276 * Bullish breakout: Above $0.06276 * Bearish breakdown: Below $0.05487# Trading Setup Trade direction: Potential Long – Confirmation Required Rather than chasing the current recovery, I would wait for buyers to establish strength above resistance. * Potential entry: $0.06150–$0.06200 after a confirmed breakout and successful retest. * Stop-loss: $0.05980 * TP1: $0.06276 * TP2: $0.07000 * Invalidation: A sustained move below $0.05980 after the breakout would weaken the bullish setup. This is a conditional scenario, not a confirmed entry signal. The risk-to-reward should be recalculated using the actual execution price. # Why This Setup Matters The most interesting detail is the difference between short-term recovery and the broader trend. Although HBAR has moved above its MA7 and MA14, the MA28 remains considerably higher at $0.06148. This means buyers are recovering momentum, but they still have an important technical barrier to overcome. Another detail worth watching is volume. The displayed current volume is 2.71M, compared with MA5 volume of 8.29M and MA10 volume of 9.64M. The rebound therefore needs stronger participation to support a convincing breakout. Entering after a sharp bounce can be risky because early buyers may take profits near resistance. A confirmed 4H breakout followed by a successful retest would provide stronger evidence of buyer control. # Rsk Management Avoid entering with excessive leverage or increasing position size after a losing trade. Define your stop-loss before execution and keep position sizing proportional to your account risk. If HBAR fails to break above $0.06148–$0.06276, the recovery could lose momentum and price may revisit lower support zones. Final Market Question Can HBAR reclaim the $0.06148–$0.06276 resistance zone and turn this recovery into a genuine trend reversal, or will sellers defend the moving-average resistance again? DYOR. This is market commentary, not financial advice. #WSOT2026 #JensenHuangExitTestsNvidiasAILeadership #WSOTShowYourAITradeToEarn10USDT #USInflationRunsHotAndRateHikeBetsRise $SOLUSDT
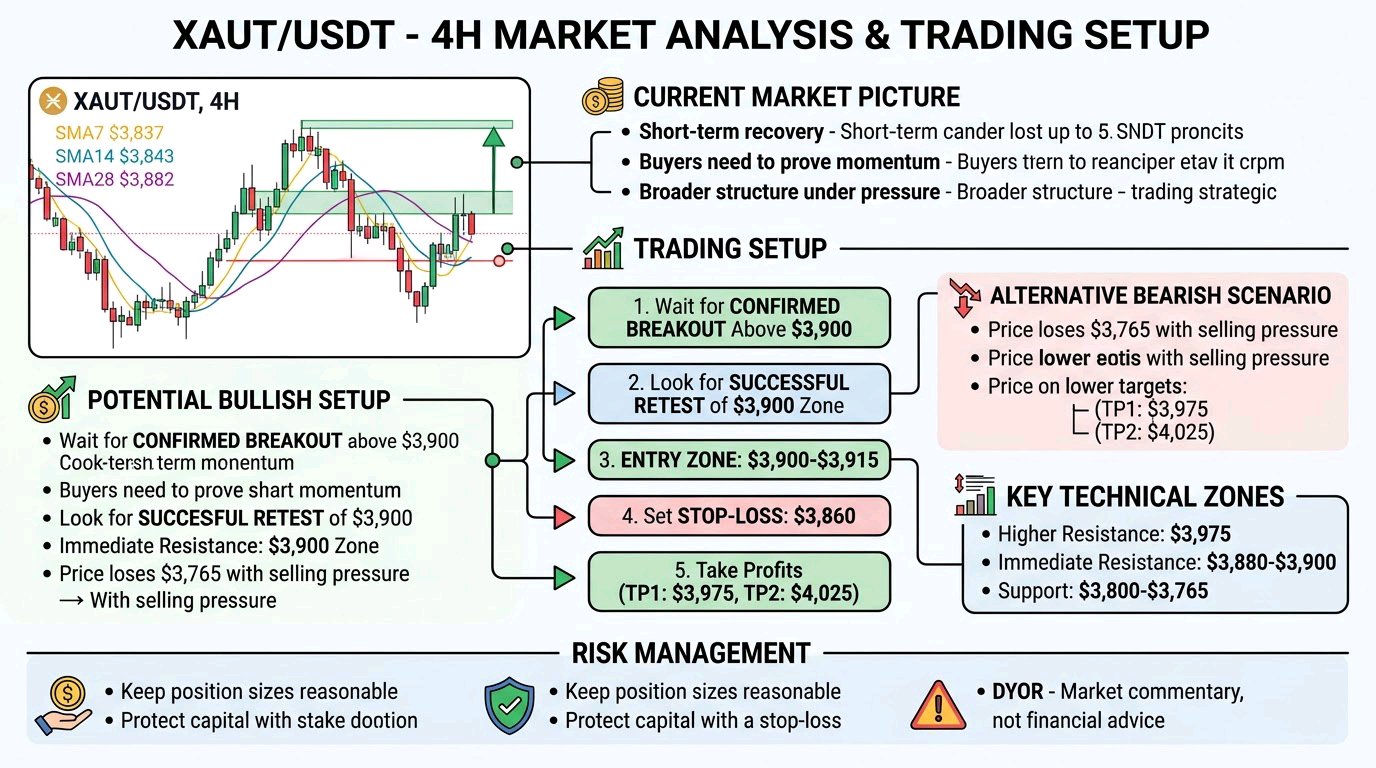
#ByXIMPACT $XAUTUSDT /USDT is showing a short-term recovery after a strong bearish move, but buyers still need to prove that this rebound is more than a temporary relief rally. On the 4H chart, Tether Gold is trading around $3,855.79, up 1.38%. Price has bounced from the recent support area near $3,765–$3,800. However, the broader structure remains under pressure after a series of lower highs and lower lows.# Current Market Picture and Key Levels The moving averages show an important battle: * MA7: $3,837.15 * MA14: $3,843.77 * MA28: $3,882.07 Price has moved above the short-term moving averages, suggesting improving buying momentum. However, the MA28 near $3,882 remains an important resistance. Key technical zones: * Support: $3,800–$3,765 * Immediate resistance: $3,880–$3,900 * Higher resistance: $3,975 * Bullish breakout level: Above $3,900 * Bearish breakdown level: Below $3,765 # Trading Setup Wait for confirmation The safer approach is to avoid chasing the current bounce and wait for a confirmed breakout or a fresh rejection. Potential bullish setup: * Entry zone: $3,900–$3,915 after a confirmed breakout and successful retest. * Stop-loss: $3,860 * TP1: $3,975 * TP2: $4,025 * Invalidation: A sustained 4H move back below $3,860 would weaken the bullish breakout scenario. The alternative bearish scenario becomes relevant if price loses $3,765 with strong selling pressure. These are conditional levels, not an active confirmed signal.# Why This Setup Matters The interesting detail is that XAUT has recovered above its MA7 and MA14, but remains below its MA28. This creates a short-term momentum improvement without confirming a complete trend reversal. Another important factor is the previous rejection around $4,080–$4,100. Sellers have already demonstrated strength in that region, making it important not to assume that one recovery candle will reverse the broader structure. Current market data also shows XAUT trading around the $3,860–$3,880 area, keeping the nearby resistance zone relevant. CoinGlass +1 Entering after a sharp recovery can expose traders to a sudden pullback. Waiting for a 4H candle close above resistance and a successful retest offers a more structured opportunity# Risk Management Keep position sizes reasonable and always define risk before entering a trade. Avoid excessive leverage, protect capital with a stop-loss, and do not move your invalidation level simply because the market moves against your position. If buyers cannot reclaim $3,900, patience may be more valuable than forcing a trade. Do you think XAUT can reclaim $3,900 and continue toward $3,975, or will sellers push the price back toward $3,800? DYOR. This is market commentary, not financial advice. #WSOTShowYourAITradeToEarn10USDT $LAVAUSDT
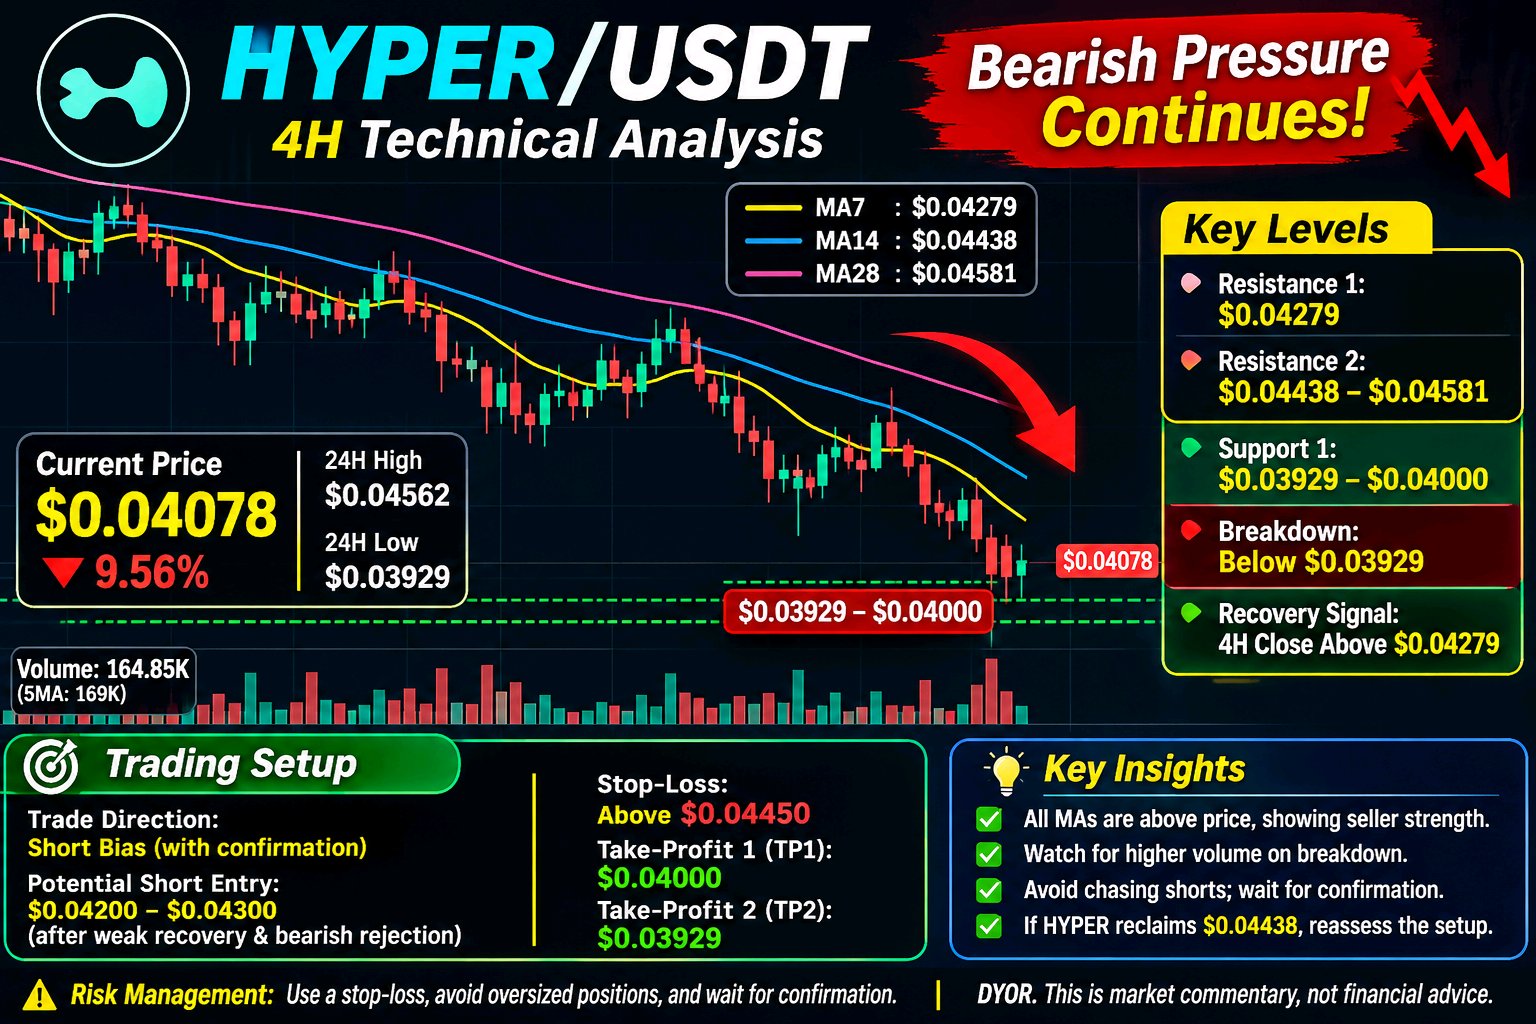
#ByXIMPACT $HYPERUSDT 在 4 小時圖上顯示出強勁的看跌壓力,隨著價格持續創下更低的高點和更低的低點,賣方維持著控制權。近期的下跌已將 HYPER 推低至 $0.04078,使市場接近一個重要的支撐區。儘管可能出現短期反彈,但買方尚未表現出令人信服的反轉跡象。 當前市場概況與關鍵水平 HYPER 目前交易價格約為 $0.04078,下跌 9.56%。24 小時高點為 $0.04562,低點為 $0.03929。 移動平均線強化了看跌結構: - MA7: $0.04279 - MA14: $0.04438 - MA28: $0.04581 值得關注的重要水平: - 即時支撐位: $0.03929–$0.04000 - 即時阻力位: $0.04279 - 強阻力位: $0.04438–$0.04581 - 看跌跌破點: 低於 $0.03929 - 潛在復甦信號: 4 小時收盤價持續高於 $0.04279。 交易設置 交易方向: 看跌傾向,但需要確認。 潛在空頭入場點: $0.04200–$0.04300(在弱勢反彈和看跌拒絕之後)。 止損: $0.04450 以上。 獲利目標 1 (TP1): $0.04000 獲利目標 2 (TP2): $0.03929 技術失效: 4 小時收盤價持續回升至 $0.04438 阻力區上方將削弱此空頭設置。 這些是條件性水平,而非確認的入場信號。當前價格已接近支撐位,因此在此處追空存在額外風險。 為什麼此設置很重要 一個重要的細節是所有三條移動平均線皆位於當前價格上方。這種排列表明賣方仍然擁有更強的技術優勢。 另一個值得觀察的細節是交易量。目前顯示的交易量約為 164.85K,而 5 週期平均成交量為 169K。賣壓明顯,但若在支撐位跌破時成交量顯著增加,將提供更強的確認信號。 在大幅下跌後入場可能很危險,因為空頭回補和抄底買盤可能會引發突然反彈。等待阻力位回測或確認支撐位跌破會是更紀律的做法。 風險管理 避免在高波動期間開設過大倉位。設定預先定義的止損,保持合理的倉位大小,並在執行前等待確認。如果 HYPER 收復阻力位,請重新評估看跌前景,而不是死守一個已失效的設置。 下一個重要的戰役在 $0.03929 附近。賣方會跌破該支撐位,還是買方能守住並觸發復甦? DYOR(自行研究)。這是市場評論,而非財務建議。 $HYPEUSDT
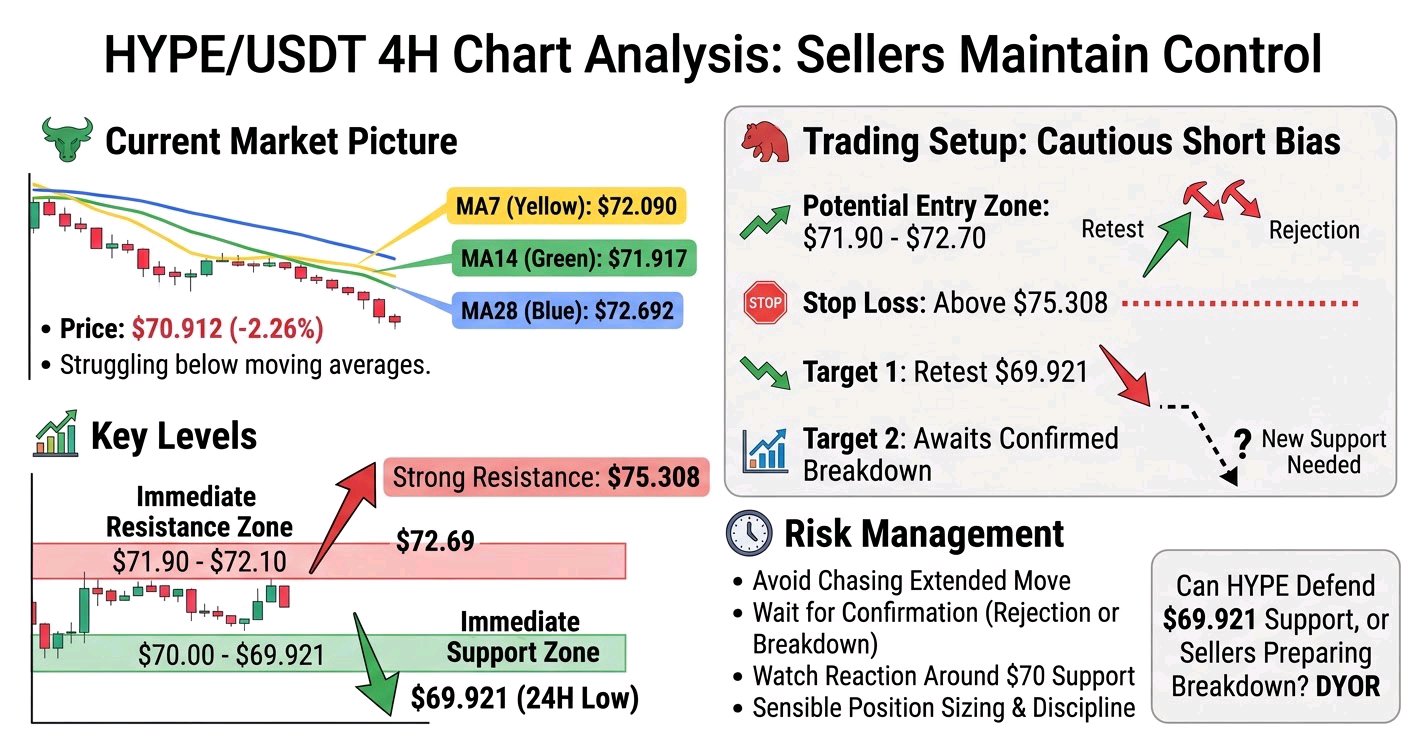
#ByXIMPACT $HYPERUSDT 正努力重拾多頭動能,且 4 小時線圖顯示賣方持續掌控局面。價格目前在 $70.912 附近震盪,跌幅達 2.26%,此前從 $97.087 的波段高點出現延伸下跌。買方正試圖穩定價格,但由於 HYPE 的交易價格低於關鍵移動平均線,反彈力道依然疲軟。 當前市場概況與關鍵價位 即時支撐位於 $70.00–$69.921 區間,其中 $69.921 為可見的 24 小時低點。若 4 小時線果斷跌破此區間,賣壓可能會加劇。上行方面,初步阻力位於 $71.90–$72.10,其次是 $72.69 以及更強勁的 $75.308 阻力區。 交易設置 目前的結構傾向於謹慎的「做空 (SHORT)」偏好,但確認信號至關重要。潛在的進場區間為 $71.90–$72.70,前提是價格回測此區間並顯示出明顯的拒絕訊號。保護性停損可設在 $75.308 之上。第一個下行目標是回測 $69.921。第二個目標應僅在確認跌破並揭示下一個支撐區後才設立。若買方奪回 $72.70 並維持上漲,則該看跌設置將減弱。 為何此設置很重要 交易者可能會忽略的一個重要細節是,所有三條顯示的移動平均線均高於當前價格:MA7 在 $72.090,MA14 在 $71.917,以及 MA28 在 $72.692。這種排列反映了持續的短期賣壓。 另一個隱憂是低點不斷降低與高點不斷走低的下降結構。然而,直接在 $69.921 附近的支撐位賣出可能存在風險。等待確認跌破或在阻力位附近出現拒絕訊號,會比追逐延伸的跌勢更具紀律性。 風險管理 避免僅因為圖表看起來看跌就建立空頭部位。觀察 $70 附近的反應並等待確認。保持合理的部位規模,尊重您的停損點,如果價格開始重回移動平均線之上,請重新評估該設置。 HYPE 能否守住 $69.921 的支撐區,還是賣方正準備迎接新一輪的跌破? DYOR (做好自己的研究)。此為市場評論,並非財務建議。 $HYPEUSDT #WSOT曬出你的AI交易即可贏取10USDT
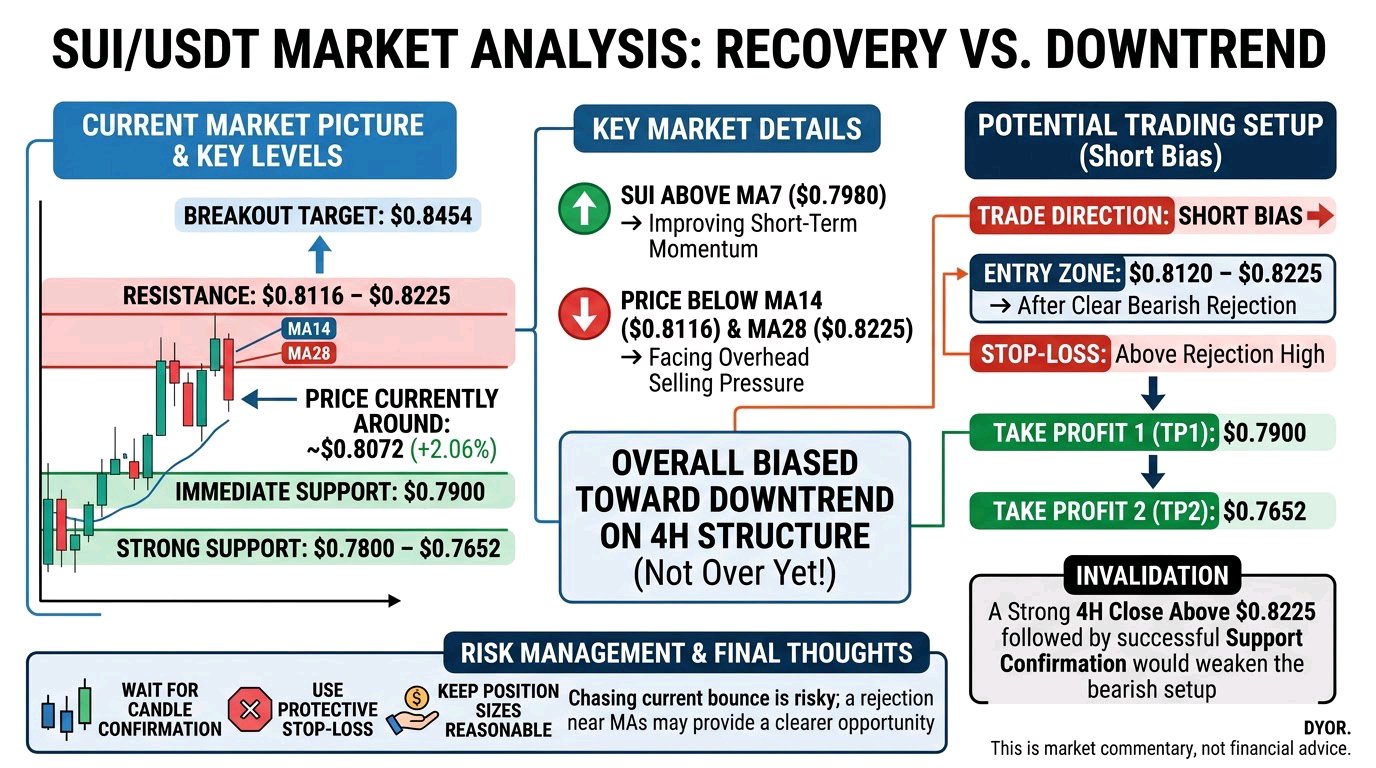
$SUIUSDT ut the 4H Downtrend Is Not Over Yet SUI is attempting a short-term recovery after dropping toward $0.7652. Price is currently trading around $0.8072, up 2.06%, but the bigger 4H structure still shows a bearish trend. Buyers are showing some strength, although a confirmed reversal is still missing. Current Market Picture and Key Levels Immediate support is forming around $0.7900, with stronger support near $0.7800–$0.7652. On the upside, resistance stands around $0.8116–$0.8225, where the MA14 and MA28 are positioned. A sustained breakout above $0.8225 could open the way toward $0.8454. Potential Trading Setup Trade direction: Short bias, subject to confirmation. Entry zone: $0.8120–$0.8225 after a clear bearish rejection. Stop-loss: Above the confirmed rejection high. TP1: $0.7900 TP2: $0.7652 Invalidation: A strong 4H close above $0.8225 followed by successful support confirmation would weaken the bearish setup. Why This Setup Matters One important detail is that SUI has moved above its MA7 at $0.7980, showing improving short-term momentum. However, price remains below MA14 at $0.8116 and MA28 at $0.8225. This means the recovery is still facing overhead selling pressure. Chasing the current bounce could be risky. A rejection near the moving averages may provide a clearer opportunity, while a confirmed breakout would require reassessing the bearish outlook. Risk Management Wait for candle confirmation before entering. Keep position sizes reasonable, use a protective stop-loss, and avoid trading directly into resistance without a clear signal. Protecting capital matters more than catching every price movement. Can SUI reclaim $0.8225 and reverse its 4H trend, or will sellers push it back toward $0.7652? DYOR. This is market commentary, not financial advice $BTCUSDT
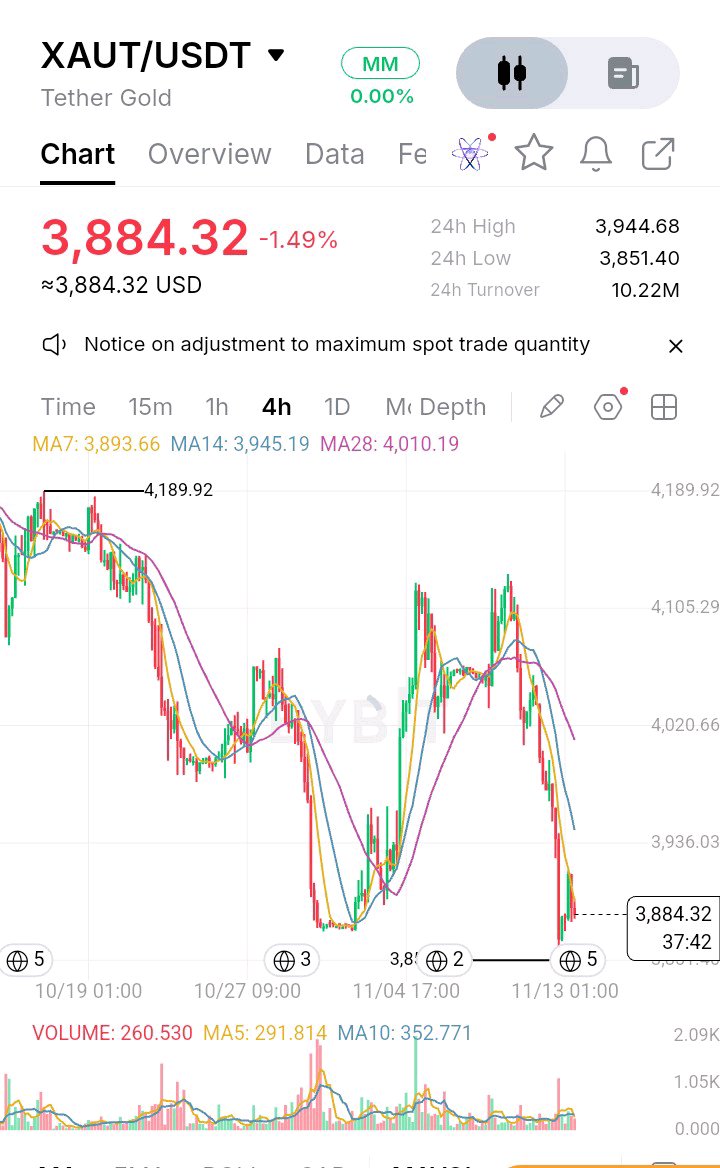
#ByXIMPACT $XAUTUSDT Sellers Remain in Control as Gold Tests Critical Support XAUT/USDT is showing strong bearish pressure on the 4H chart. Price is currently trading around 3,884.32, down 1.49%, following a sharp rejection from the 4,100–4,110 region. Although buyers have attempted a small recovery from the recent low, the broader market structure still favors sellers. Current Market Picture and Key Levels The immediate support zone is around 3,851–3,860, with 3,851.40 marking the visible 24H low. A decisive breakdown below this area could expose further downside. On the upside, immediate resistance stands around 3,893–3,900, followed by stronger resistance near 3,945. The 4H moving averages also indicate weakness: MA7 is at 3,893.66, MA14 at 3,945.19, and MA28 at 4,010.19. Price remains below all three averages. Trading Setup: Conditional SHORT Entry zone: 3,893–3,945, only after a confirmed bearish rejection. Stop-loss: Above 3,970. TP1: 3,851. TP2: No reliable lower target can be established from the visible chart; reassess after a confirmed support breakdown. Invalidation: A sustained 4H recovery above 3,945–3,970 would weaken the bearish setup. Why This Setup Matters The important detail is the alignment of all three moving averages above the current price. This suggests that sellers still have control over the broader 4H structure. However, price is already close to important support. Opening a short position after an extended decline could expose traders to a sudden relief bounce. A confirmed breakdown below 3,851 followed by a failed retest would provide stronger bearish evidence. Risk Management Avoid chasing the current move. Wait for confirmation, use a protective stop-loss, and calculate position size according to your risk tolerance. If support holds and buyers reclaim resistance, staying out may be the better decision. Will XAUT break below 3,851 and continue its decline, or can buyers defend this support and initiate a recovery? DYOR. This is market commentary, not financial advic #WSOT2026 #SanDiskAnnounces8For1StockSplit
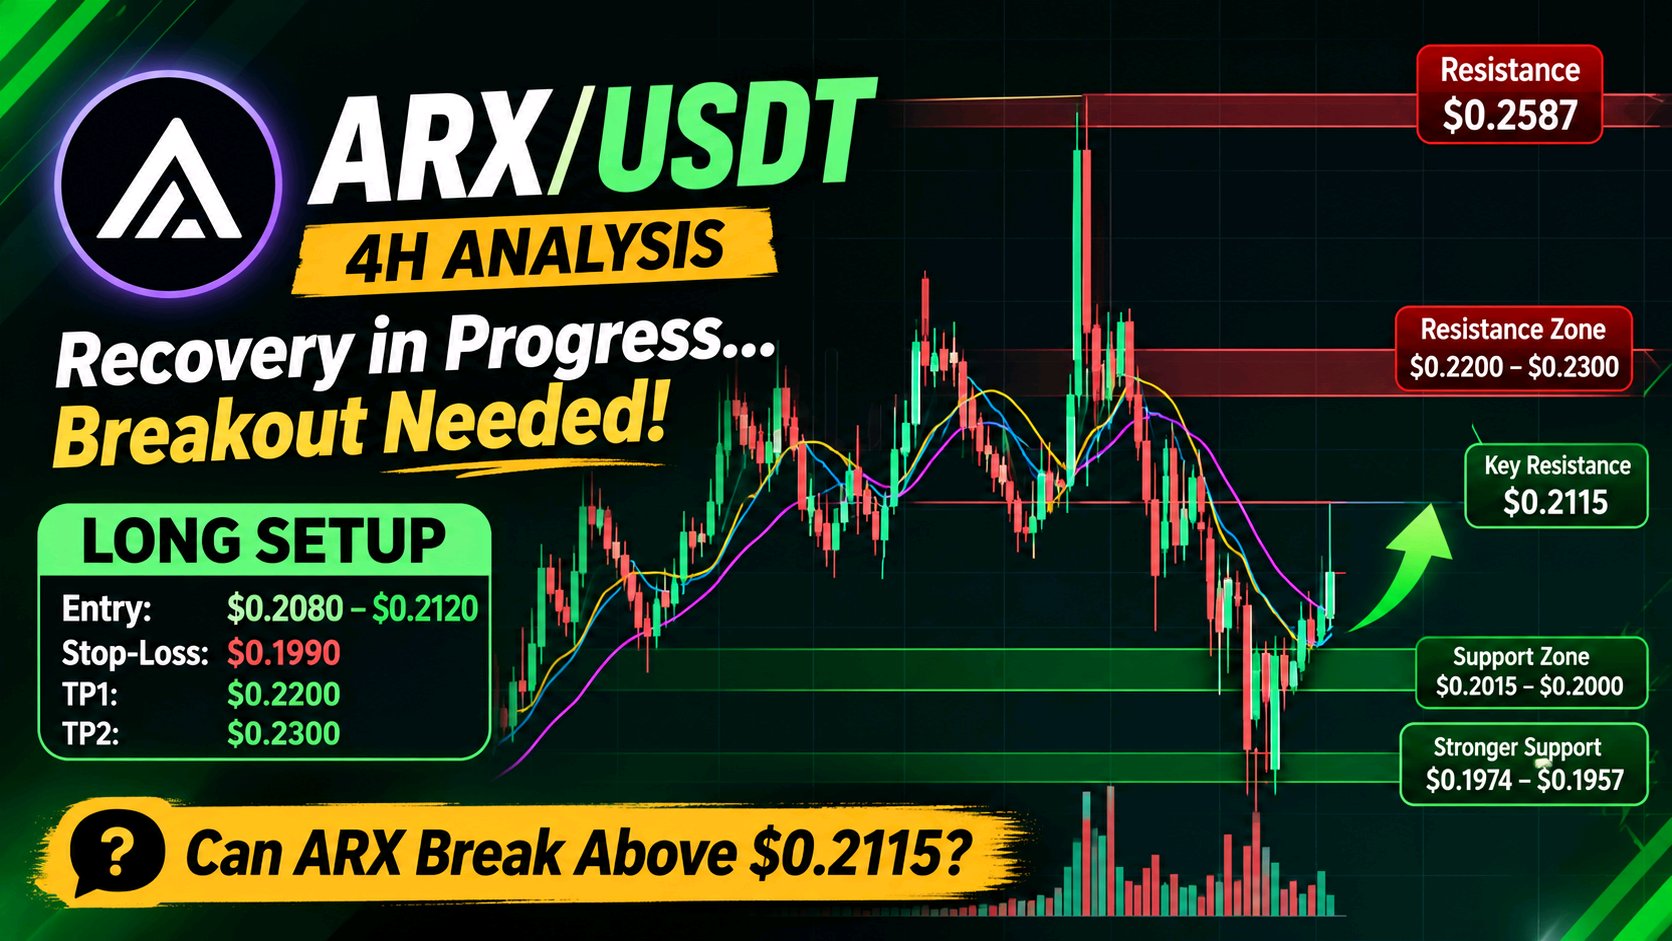
#ByXIMPACT $ARXUSDT s showing signs of a short-term recovery, but the next resistance zone will determine whether buyers can turn this bounce into a stronger bullish move. On the 4H chart, Arcium is trading around $0.2072, up 5.07%. Price has recovered from the recent lows and moved back above the three displayed moving averages, suggesting that buying momentum is gradually improving. However, the broader structure still needs confirmation before calling this a full trend reversal. Current Market Picture and Key Levels The important levels to watch are: - Immediate support: $0.2015–$0.2000 - Stronger support: $0.1974–$0.1957 - Immediate resistance: $0.2115 - Next resistance zone: $0.2200–$0.2300 - Major overhead resistance: Around $0.2587 The $0.2115 level is particularly important. A strong 4H candle close above it could strengthen the bullish recovery, while rejection may bring another retest of the support zone. Potential Trading Setup: LONG A bullish entry should only be considered after ARX breaks above $0.2115 and successfully retests that level. - Potential entry: $0.2080–$0.2120 after confirmation - Stop-loss: $0.1990 - TP1: $0.2200 - TP2: $0.2300 Invalidation: A sustained 4H move below $0.1990 would weaken the recovery setup and suggest that sellers are regaining control. Why This Setup Matters One detail worth watching is the relationship between price and the moving averages. MA7 is around $0.2015, MA14 around $0.1974, and MA28 around $0.2013. Price is currently trading above all three, which is an encouraging short-term development. However, the recent recovery is approaching the $0.2115 resistance. Traders should not confuse a moving-average reclaim with a confirmed breakout. Another important factor is volume. The chart shows previous periods of significant trading activity, but the latest breakout attempt still needs stronger volume confirmation to establish buyer conviction. Chasing the current green candle could expose traders to a rejection near resistance. Waiting for a confirmed breakout and retest offers a more disciplined approach. Risk Management Keep position sizing reasonable and define your maximum acceptable loss before entering. A stop-loss is essential, particularly because ARX has shown considerable volatility on the 4H chart. If buyers fail to reclaim $0.2115, staying patient may be better than forcing a trade. Final Question: Can ARX break above $0.2115 and build a stronger bullish structure, or will sellers push the price back toward $0.2000? DYOR. This is market commentary, not financial advice #PiecesOf8
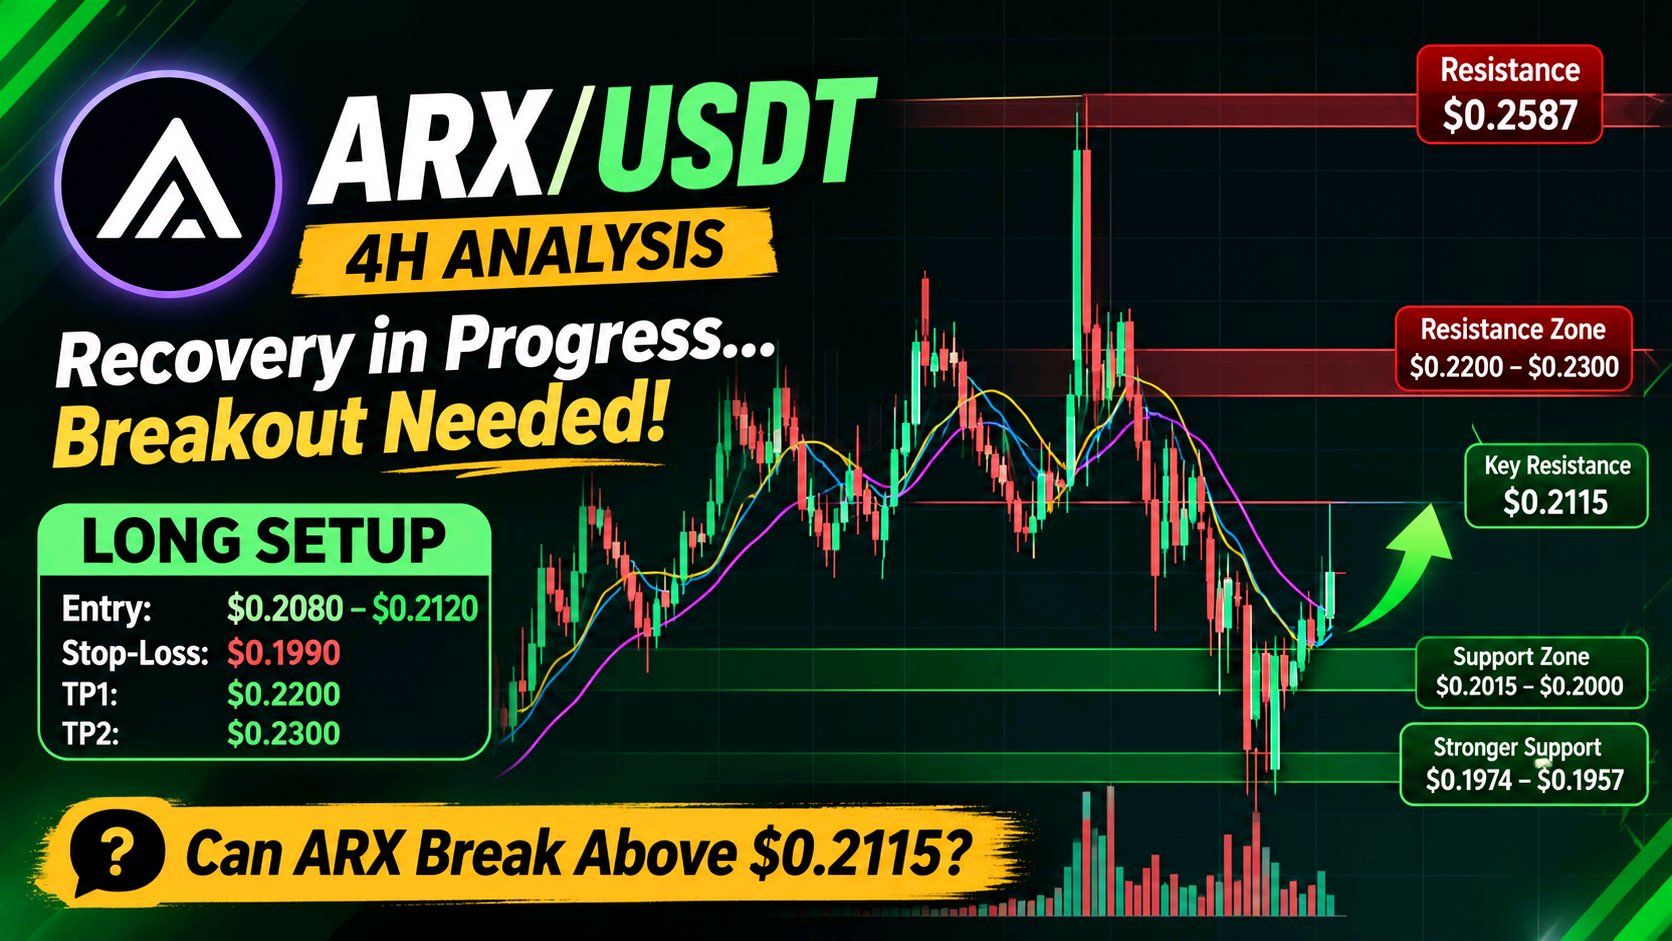
#ByXIMPACT $ARXUSDT 正顯示出短期復甦的跡象,但下一個阻力區間將決定買方能否將此反彈轉化為更強勁的看漲走勢。 在 4 小時圖上,Arcium 的交易價格約為 $0.2072,上漲了 5.07%。價格已從近期低點回升,並回到三個顯示的移動平均線上方,這顯示買盤動能正逐漸改善。然而,在宣佈全面趨勢反轉之前,整體結構仍需進一步確認。 目前市場概況與關鍵價位 值得關注的重要價位為: - 即時支撐位:$0.2015–$0.2000 - 強力支撐位:$0.1974–$0.1957 - 即時阻力位:$0.2115 - 下一個阻力區間:$0.2200–$0.2300 - 主要上方阻力:約 $0.2587 $0.2115 的價位尤為重要。強勁的 4 小時 K 線收盤價若能站上該位,可能會加強看漲復甦,而若遭到拒絕,則可能會再次測試支撐區。 潛在交易設置:做多 (LONG) 僅應在 ARX 突破 $0.2115 並成功回測該水平後,才考慮看漲入場。 - 潛在入場位:確認後 $0.2080–$0.2120 - 止損位:$0.1990 - 第一目標價 (TP1):$0.2200 - 第二目標價 (TP2):$0.2300 失效條件:價格持續在 4 小時線收低於 $0.1990 將削弱復甦設置,並暗示賣方正重新取得控制權。 此設置的重要性 值得觀察的一個細節是價格與移動平均線之間的關係。MA7 約在 $0.2015,MA14 約在 $0.1974,MA28 約在 $0.2013。目前價格高於這三條均線,這是一個令人鼓舞的短期發展。 然而,近期的復甦正接近 $0.2115 的阻力位。交易者不應將收復移動平均線與確認突破混為一談。 另一個重要因素是成交量。圖表顯示了之前有顯著交易活動的時期,但最新的突破嘗試仍需要更強的成交量確認,以確立買方的信心。 追逐當前的綠色 K 線可能會使交易者面臨在阻力位附近被拒絕的風險。等待確認突破並回測提供了一種更具紀律性的方法。 風險管理 保持合理的倉位規模,並在入場前定義您的最大可接受虧損。止損至關重要,特別是因為 ARX 在 4 小時圖上表現出相當大的波動性。 如果買方未能收復 $0.2115,保持耐心可能會比強行交易更好。 最終問題:ARX 能否突破 $0.2115 並建立更強勁的看漲結構,還是賣方會將價格推回至 $0.2000? 請自行做好研究 (DYOR)。這是市場評論,而非財務建議 #Bybit 8 週年
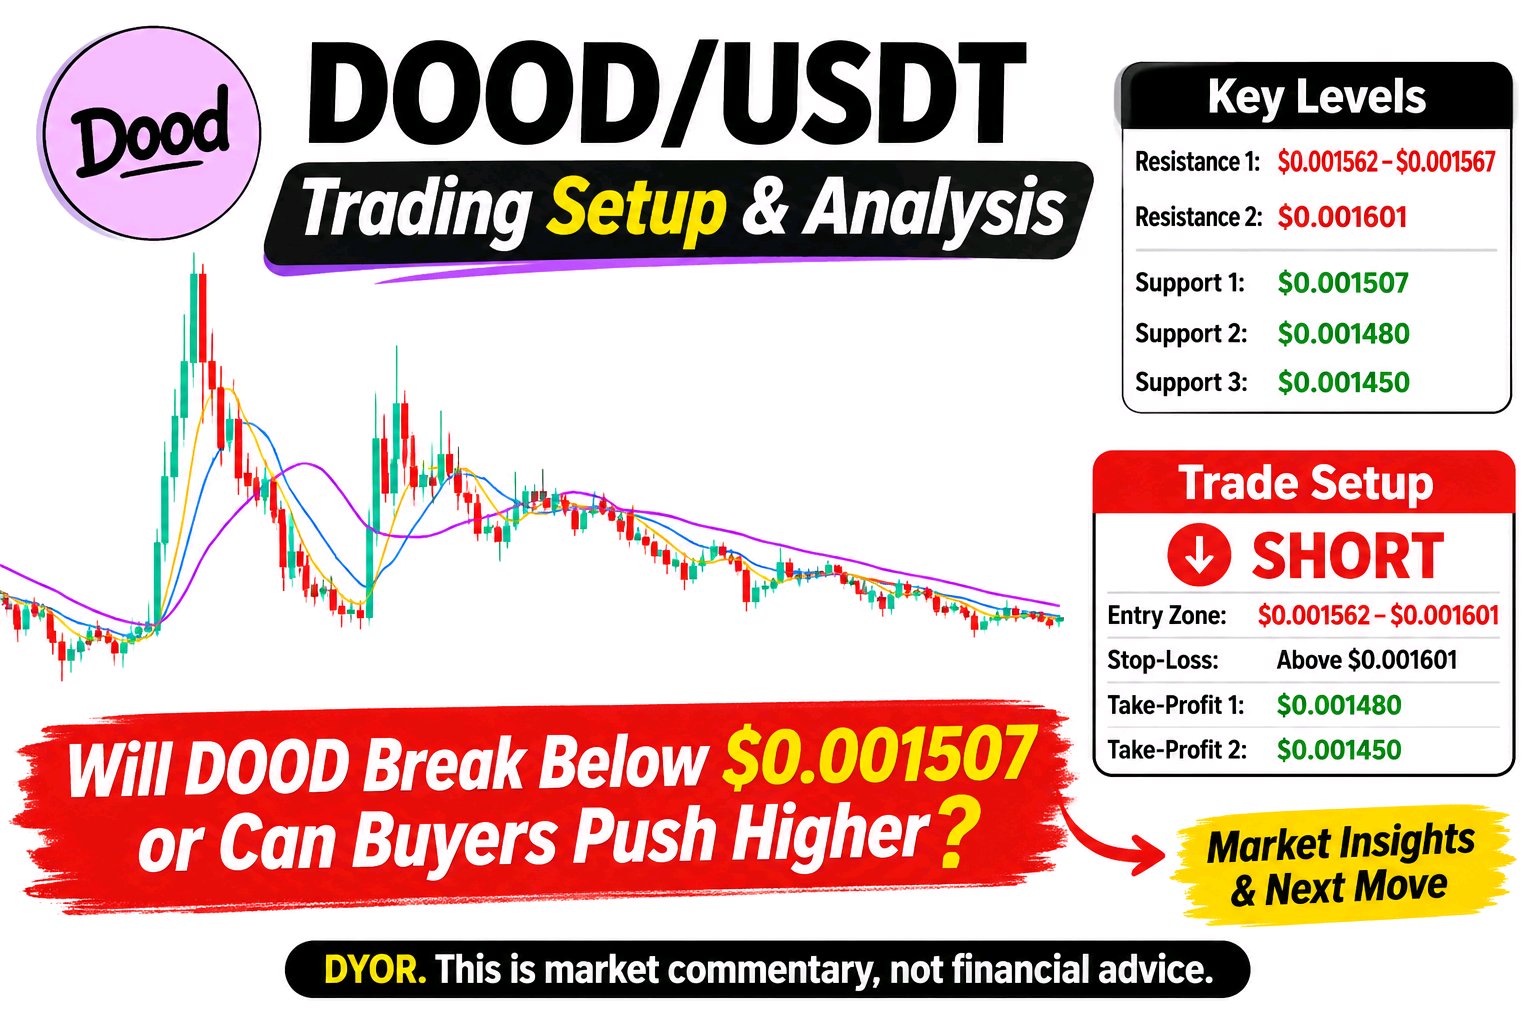
ByXIMPACT $DOODUSDT 正顯示出疲軟的反彈嘗試,但更廣泛的 4 小時結構仍然看跌。目前價格在 $0.001545 附近波動,難以突破短期移動平均線。圖表持續呈現低點不斷下移且賣壓漸增,顯示買方尚未奪回控制權。 當前市場狀況:直接支撐位在 $0.001507 附近,與可見的 24 小時低點一致。若跌破此水平,可能會導致 DOOD 進一步下跌。上行方面,初步阻力位於 $0.001562–$0.001567 區間,隨後是 $0.001601 附近的強阻力。移動平均線(MA7: $0.001541, MA14: $0.001562, MA28: $0.001601)顯示更廣泛的短期趨勢仍承受壓力。 交易設置:首選偏向為「做空」(SHORT),但確認信號至關重要。在 $0.001562–$0.001601 附近遇阻回落可能提供做空機會。若確認跌破 $0.001507 後回測失敗,將提供額外的看跌確認。止損應設置在確認的阻力高點上方。若賣壓持續,潛在下行目標為 $0.001480 和 $0.001450。在沒有確認入場點和止損位的情況下,無法建立可靠的盈虧比。 為何此設置很重要:一個重要的細節是交易活躍度正在下降。顯示的成交量為 3.91M,低於 MA5(11.79M)和 MA10(13.87M)。這顯示參與度已減弱,在沒有新增成交量的情況下,強勁的方向性走勢較難令人信服。另一個常被忽略的因素是當前價格與 MA28 之間的距離,後者持續充當上方阻力。在經歷長期下跌後追空可能存在風險;等待阻力確認遇阻或支撐位確認跌破是更嚴謹的做法。 風險管理:避免僅僅因為圖表看起來看跌就盲目進場。請使用合理的倉位規模,設置預定義的止損,並觀察 4 小時 K 線收盤情況後再確認是否跌破。若價格持續站上 $0.001601,將削弱看跌前景並需要重新評估。 你怎麼看?DOOD 會跌破 $0.001507,還是買方能將價格推回 $0.001567 上方? DYOR(自行研究)。此為市場評論,並非財務建議。 比特幣在美國中期選舉後跌至兩個月低點
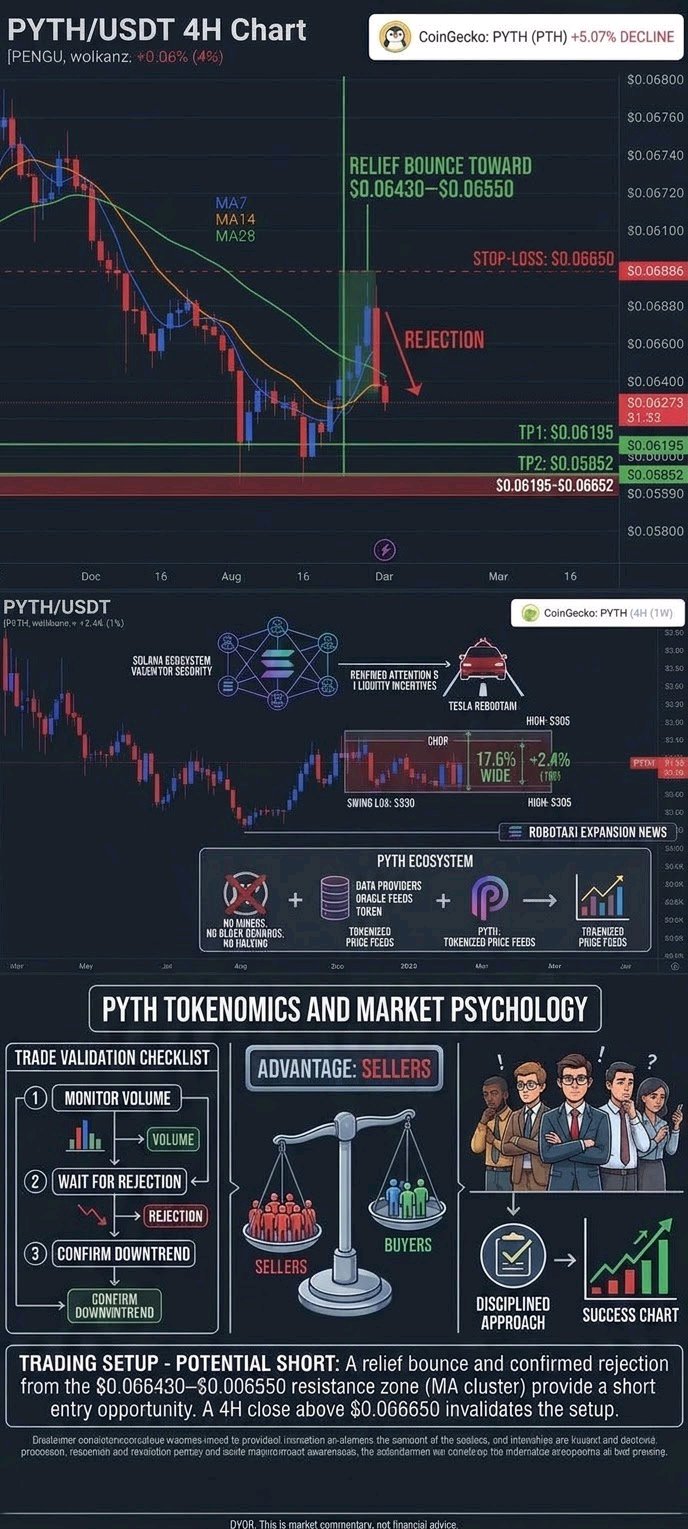
#ByXIMPACT $PYTHUSDT 賣方掌控市場,價格難以突破關鍵移動平均線 PYTH 在 4 小時圖上正面臨新的拋售壓力,價格目前在 $0.06273 左右徘徊,跌幅約為 6.90%。近期在 $0.06886 附近的拒絕走勢削弱了復甦的企圖,賣方正再次將價格推向盤整區間的下緣。短期結構維持看跌,價格仍低於 MA7、MA14 和 MA28。 當前市場狀況與關鍵點位: 即時支撐位正在 $0.06195 附近形成,而更重要的歷史支撐位則位於 $0.05852 附近。在上行方面,第一個阻力區間為 $0.06430–$0.06475,隨後是 $0.06558 附近的更強阻力。若能持續突破該區域,可能會改善復甦前景;反之,若跌破 $0.06195,可能會引發進一步的下跌支撐測試。 潛在交易策略 – 做空 (SHORT): 進場區間:$0.06430–$0.06550,建議在確認看跌拒絕訊號後進場。 止損位 (Stop-Loss):$0.06650。 目標價 1 (TP1):$0.06195。 目標價 2 (TP2):$0.05852。 若 PYTH 收復移動平均線阻力區間,並在該區間上方持續收於 4 小時線,則該看跌策略將失效。 為何此策略重要: 重點在於這三條移動平均線目前均位於市價上方,暗示賣方仍擁有短期優勢。然而,PYTH 目前已極接近即時支撐位。在當前水平盲目追空可能會讓交易者面臨突如其來的反彈風險。 較為嚴謹的做法是等待價格反彈至阻力位,觀察買方是否能支撐住該走勢,或是賣方是否再次介入。若放量跌破 $0.06195,將能提供額外的看跌確認訊號。 風險管理: 避免因價格下跌就貿然進場。請等待確認訊號,使用合理的倉位大小,並嚴格執行止損。如果支撐位守住且買方收復阻力位,請重新評估看跌觀點,切勿強行交易。 你怎麼看:PYTH 會跌破 $0.06195 並走向 $0.05852,還是買方能夠守住此支撐並觸發復甦? DYOR(自行研究)。本文僅為市場評論,不構成財務建議。 #比特幣在美國中期選舉後跌至兩個月低點
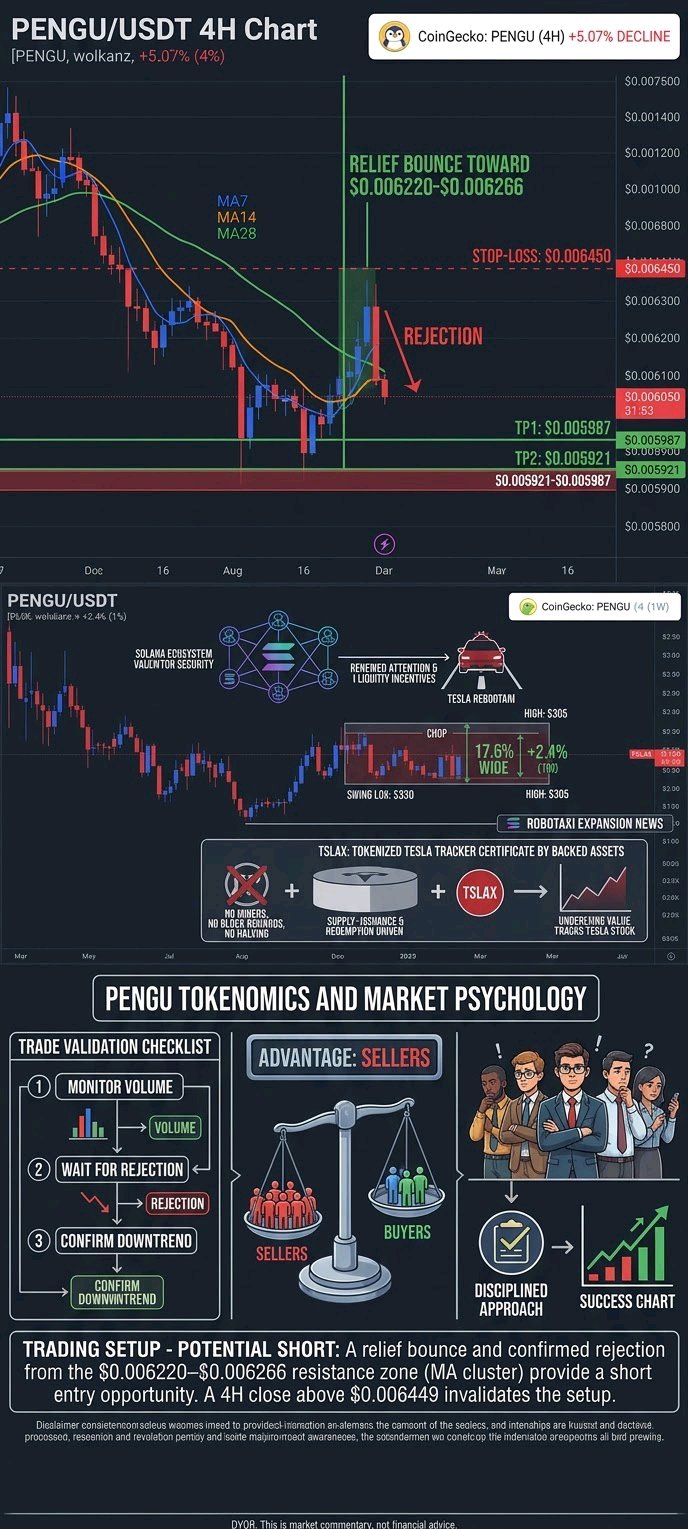
#ByXIMPACT $PENGUUSDT 在 4 小時線圖上仍面臨看跌壓力,價格在下跌 5.07% 後徘徊於 $0.006050 附近。整體結構持續呈現低點不斷降低與高點不斷降低的趨勢,且買方難以建立有效的反彈。目前看來,賣方佔據優勢。 當前市場狀況:近期支撐位位於 $0.005987–$0.005921 區間。若價格決定性跌破 $0.005921,PENGU 可能面臨進一步的下行風險。上行方面,阻力位位於 $0.006220–$0.006266 區間,MA7、MA14 和 MA28 皆在此匯集。更強的阻力區則在 $0.006449 附近。 交易策略 – 潛在空單 (SHORT):與其追逐當前的跌勢,我會觀察是否出現回彈至 $0.006220–$0.006266 區間,隨後再確認是否有看跌拒絕訊號。確認出現拒絕訊號可提供一個放空切入點,止損位設在 $0.006450 上方。第一目標價 (TP1) 為 $0.005987,第二目標價 (TP2) 為 $0.005921。若 4 小時線收盤價能穩定維持在 $0.006449 上方,將會削弱此看跌結構並使該短期空單想法失效。 為何此策略重要:所有三條移動平均線均高於當前價格,進一步強化了看跌結構。另一個重要的細節是,PENGU 目前的交易價格已接近近期支撐位。直接在此水位建立新的空頭部位有在回彈前進場的風險。等待回測並確認受阻提供了一種更自律的策略。同時應監控成交量,以判斷跌破支撐時賣方力道是否增強。 風險管理:避免過度槓桿,切勿僅因價格下跌就盲目進場。請等待確認訊號、設定嚴格的止損,並根據個人風險承受能力調整部位大小。若買方重新收復移動平均線,請重新評估看跌觀點,而非強行交易。 PENGU 是否會跌破 $0.005921 並擴大跌幅,還是買方能守住此支撐並引發反彈呢? DYOR(自行研究)。此為市場評論,並非財務建議 #比特幣在美國中期選舉後跌至兩個月低點 alb
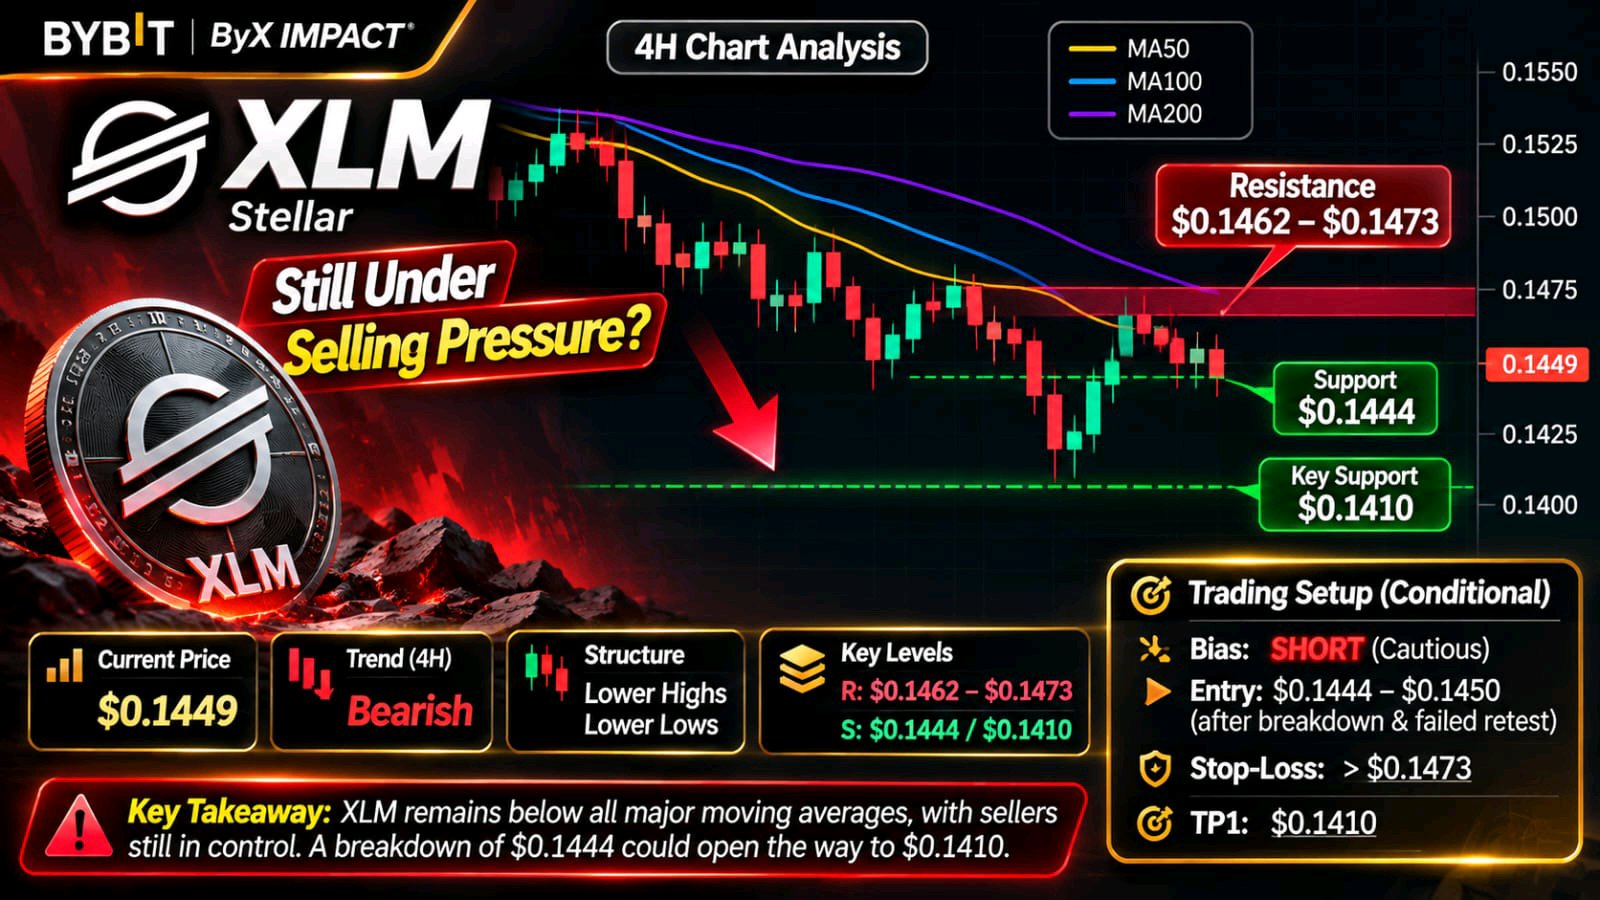
#ByXIMPACT is still under selling pressure, and the 4H chart shows little evidence of a meaningful trend reversal. Stellar is trading around $0.1449, with price remaining below all three moving averages, suggesting sellers continue to control the short-term structure. Current Market Picture: Immediate support sits around $0.1444, while stronger structural support is near $0.1410. Resistance is concentrated around $0.1462–$0.1473, where the moving averages are positioned. A sustained recovery above $0.1473 could improve the short-term outlook, while a confirmed breakdown below $0.1444 would increase downside risk. Trading Setup: The current structure favors a cautious SHORT bias, but entering directly into support carries additional risk. A 4H candle close below $0.1444, followed by a failed retest, could offer a potential short entry around $0.1444–$0.1450. Stop-loss: above $0.1473. TP1: $0.1410. TP2: No reliable lower target is established by the visible chart, so further targets require fresh price confirmation. Why This Setup Matters: XLM has been forming lower highs and lower lows, while price remains below its moving averages. One detail worth watching is the recent reaction around $0.1410: buyers managed to defend this level, meaning another immediate short entry could become vulnerable to a bounce. Volume confirmation on a breakdown would make the bearish scenario more convincing. Risk Management: Avoid chasing the decline near support. Wait for a confirmed breakdown and retest, keep position size controlled, and respect the stop-loss. A sustained move above $0.1473 would weaken the bearish setup and require reassessment. Will XLM finally break below $0.1410, or can buyers reclaim $0.1473 and trigger a recovery? DYOR. This is market commentary, not financial advice $XLMUSDT
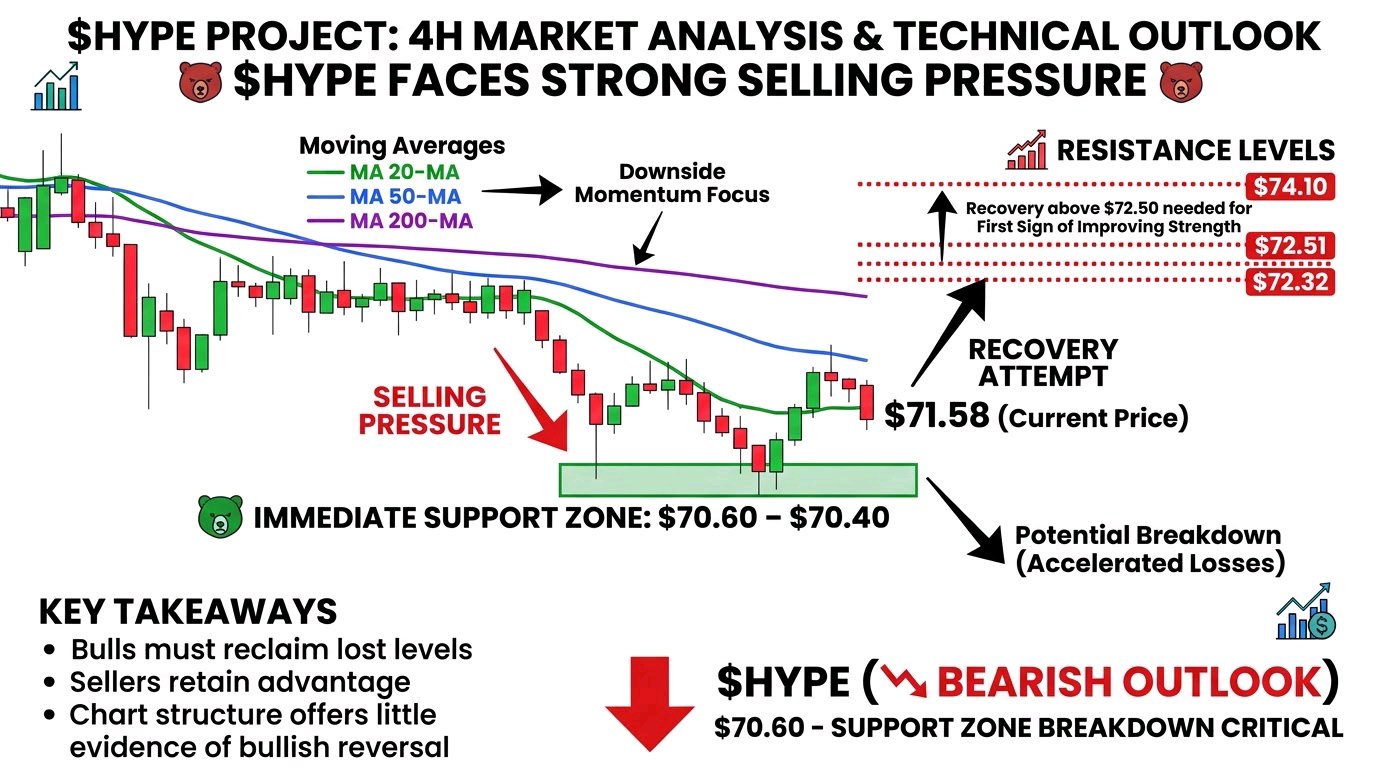
$HYPEUSDT HYPE 仍面臨強大的賣壓,且 4 小時線結構並無明顯跡象顯示多頭反轉。 目前交易價格約在 71.58 美元,價格仍維持在三條移動平均線下方,下跌動能依然是市場焦點。70.60 美元至 70.40 美元的區間為即時支撐區。若明確跌破該區間,跌幅可能會加速;而回升至 72.50 美元上方,則是強勢回升的第一個訊號。 阻力位:72.32 – 72.51 – 74.10 支撐位:70.60 – 70.40 多頭需要先收復失土,才有可能期待出現有意義的反彈。在此之前,賣方仍佔優勢。 $DOGEUSDT
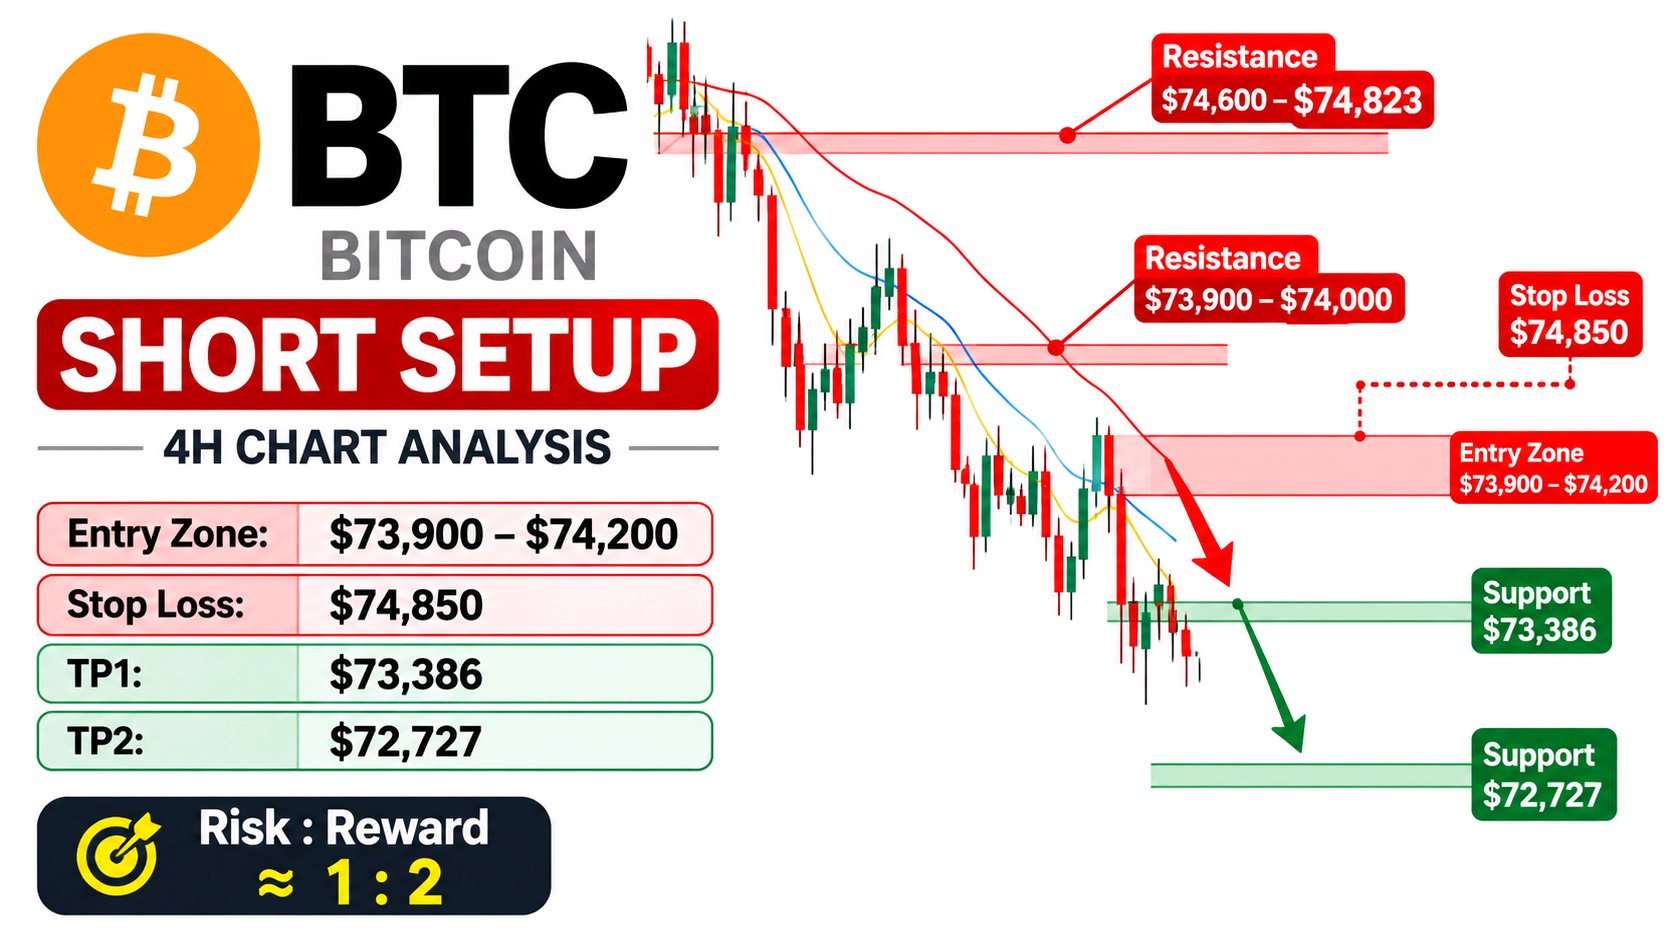
$SUPRAUSDT 仍在掙扎中復甦,4 小時線圖持續偏向賣方。價格在 $73,618 附近交易,低於三條關鍵移動平均線,顯示買方尚未奪回主導權。 當前市場狀況:即時支撐區間為 $73,386–$72,727。若跌破 $72,727,可能會開啟進一步的下跌空間。阻力位在 $73,900–$74,000 左右,隨後是 $74,600–$74,823 附近的更強阻力。 交易策略:做空 (SHORT) 潛在進場點:在看跌拒絕後 $73,900–$74,200。 止損 (Stop Loss):$74,850。 目標 1 (TP1):$73,386 目標 2 (TP2):$72,727 失效條件:若 4 小時線收盤價持續高於 $74,823,此看跌策略將失效。 為何此策略重要:BTC 正在形成低點更低 (lower lows) 和高點降低 (lower highs) 的型態,且價格仍維持在 MA7 ($73,929)、MA14 ($73,937) 和 MA28 ($74,612) 下方。這種排列反映了持續的拋售壓力。值得注意的一個細節是近期低點附近的窄幅盤整。賣方的即時動能可能正在減弱,因此在當前支撐位追空具有額外風險。若出現阻力位拒絕或確認跌破支撐,將提供更強的證據。 風險管理:避免盲目進場。等待確認信號,利用止損保護您的資本,並使用合理的倉位規模。如果 BTC 重回阻力位上方,請重新評估,不要強行交易。 你認為 BTC 下一步會跌破 $72,727,還是買方最終會守住這個支撐位? DYOR (做好您的研究)。這僅為市場評論,並非財務建議。 $BTCUSDT #美國通膨升溫,升息押注升高 #WSOT2026 #AI科技股拋售使納斯達克100指數蒸發2.5兆美元 #比特幣在美國中期選舉後跌至兩個月低點 #NovUSCPIWatch
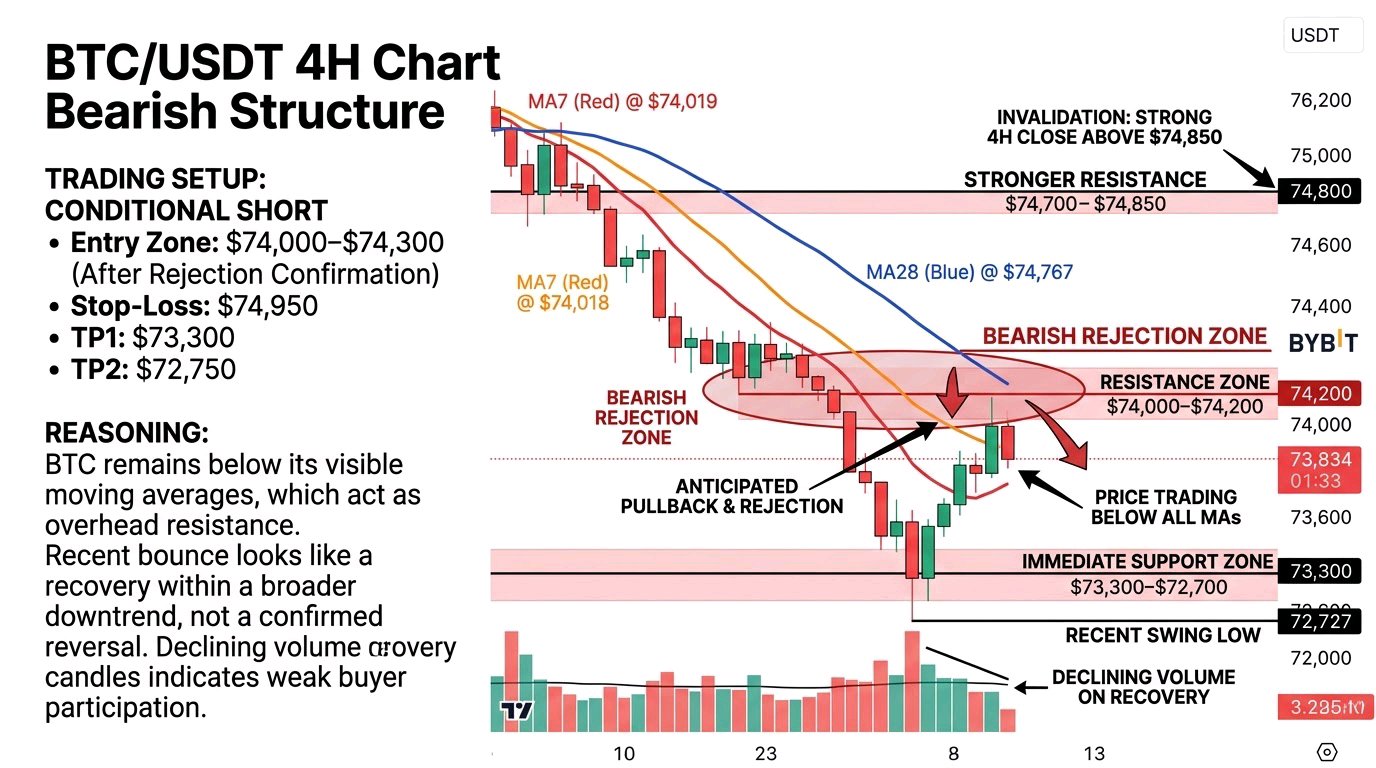
BTC 在 4 小時線圖上仍呈現看跌結構,近期的反彈尚未提供令人信服的趨勢反轉證據。價格目前約在 73,834 美元,交易價格低於所有三條可見的移動平均線:MA7 為 74,019 美元,MA14 為 74,128 美元,MA28 為 74,767 美元。 即時支撐區間在 73,300–72,700 美元,其中 72,727 美元標記了近期可見的波段低點。阻力位位於 74,000–74,200 美元附近,隨後是更強的 74,700–74,850 美元區間。若 4 小時線能持續收於上方阻力位之上,可能會改善看漲前景;反之,若跌破 72,700 美元,BTC 將面臨進一步下行的風險。 交易設置:條件式做空 (Conditional SHORT) 我會避免在當前水平追漲 BTC。比較合理的設置是等待回調至 74,000–74,300 美元,並在 4 小時時間框架上尋找看跌拒絕信號。 * 入場區間:確認拒絕信號後在 74,000–74,300 美元入場。 * 止損:74,950 美元。 * TP1 (目標價 1):73,300 美元。 * TP2 (目標價 2):72,750 美元。 * 無效化條件:若 4 小時線強勢收於 74,850 美元上方,將削弱此看跌設置。 理由很簡單:BTC 仍低於其可見移動平均線,這些均線正充當上方阻力。近期的反彈看起來更像是廣泛下跌趨勢中的修復,而非確認的反轉。一個值得關注的細節是最近反彈 K 線的成交量正在萎縮。買方需要更強的參與度才能建立可持續的向上走勢。 實時市場快照也顯示 BTC 在 73,600–74,100 美元區域附近交易,因此執行價格應根據 Bybit 的實際價格進行調整。CoinGlass +1 風險管理在此很重要。不要僅因為價格接近阻力位就進場。等待拒絕信號,設置止損以保護倉位,並根據您的風險承受能力調整倉位大小。如果 BTC 強勢突破阻力位,請放棄做空的想法,不要與市場作對。 BTC 是會再次拒絕 74,000–74,300 美元的阻力區,還是買方最終能收復 74,850 美元並改變 4 小時結構? DYOR (請自行研究)。這是市場評論,非財務建議。 $BTCUSDT
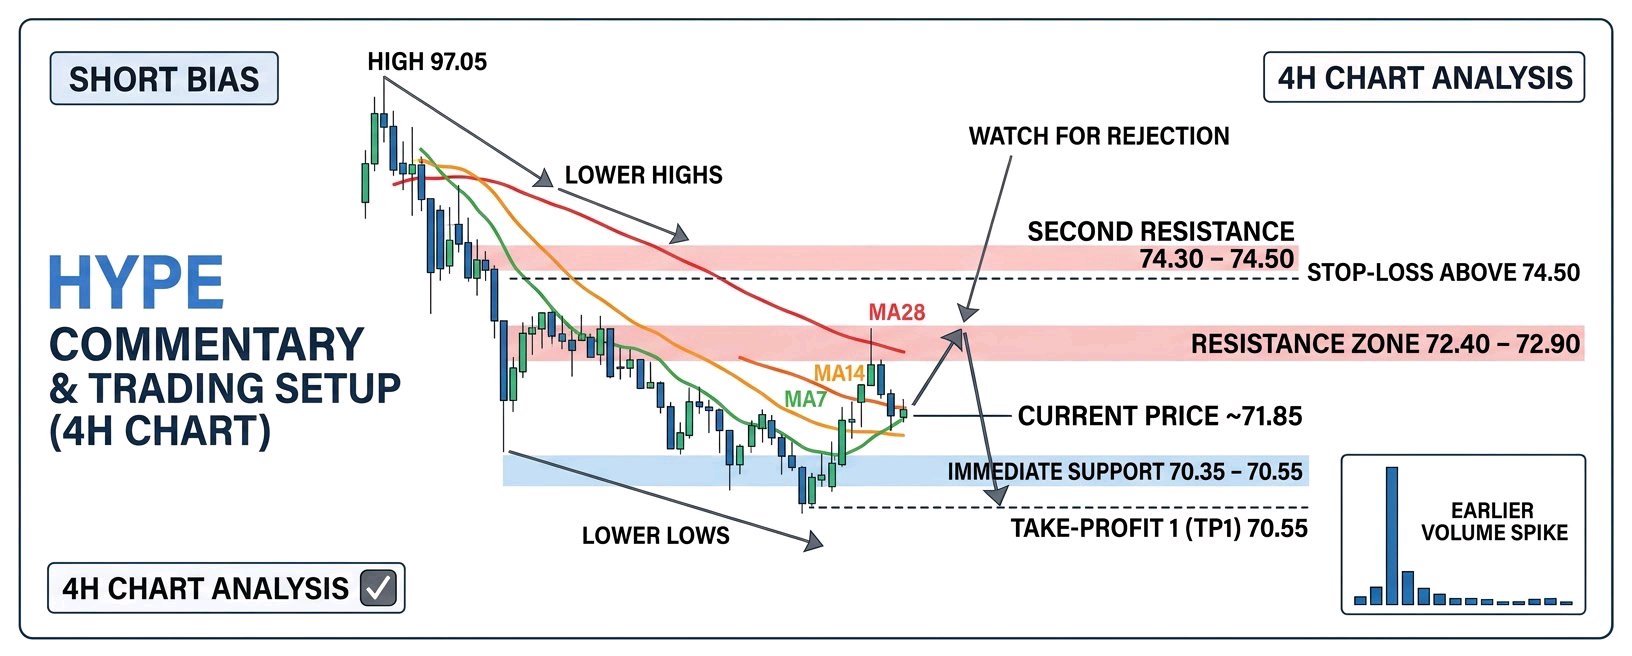
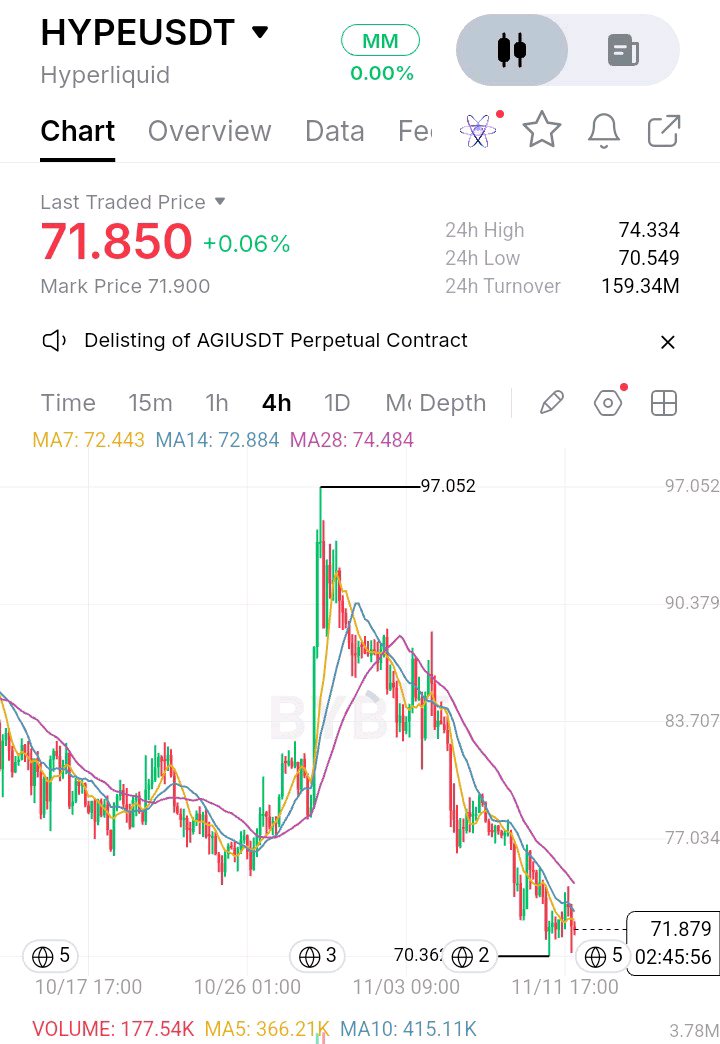
HYPE 在從 97.05 高點急劇下跌後,仍難以重拾看漲動能。在 4 小時線圖上,價格在 71.85 附近波動,持續出現的高低點下移顯示賣方仍掌握主導權。 值得關注的關鍵價位:近期支撐位在 70.35–70.55 左右。若 4 小時線收盤價跌破該區間,可能會進一步下探。阻力位位於 72.40–72.90,其次是 74.30–74.50。買方需先收復這些均線價位,才有望迎來更有力的反彈。 交易策略:看空(SHORT),但需確認訊號。可觀察在 72.40–72.90 附近的拒絕訊號作為潛在的放空入場點。將止損設在 74.50 上方可防範強勁反彈的風險。目標價一(TP1)為 70.55;目標價二(TP2)應在確認跌破並回測後再行決定,因為目前截圖中並未顯示可靠的下方目標。若價格持續站穩 74.50 上方,則該看空策略失效。 值得注意的是,所有三條移動平均線(MA7、MA14 和 MA28)皆位於現價上方,呈現空頭排列。另一個常被忽略的細節是,先前在 97.05 高點附近的成交量激增,並未轉化為持續的買入動能。在 70.35 附近追空風險較高,因為下方即是支撐位。等待反彈或確認跌破才是更紀律的做法。 風險管理:避免過度槓桿,務必使用止損,並等待確認的 4 小時K線收盤。若無合適的風險報酬比,不值得貿然追單。 HYPE 能守住 70.35 支撐區,還是賣方正準備再次下殺? DYOR(請自行研究)。此為市場評論,非財務建議。 $HYPEUSDT #WSOT2026 #比特幣在美國中期選舉後跌至兩個月低點 #美國通膨升溫,升息押注升高 #AI科技股拋售使納斯達克100指數蒸發2.5兆美元 #德意志銀行推出數位資產託管服務 $DOGEUSDT
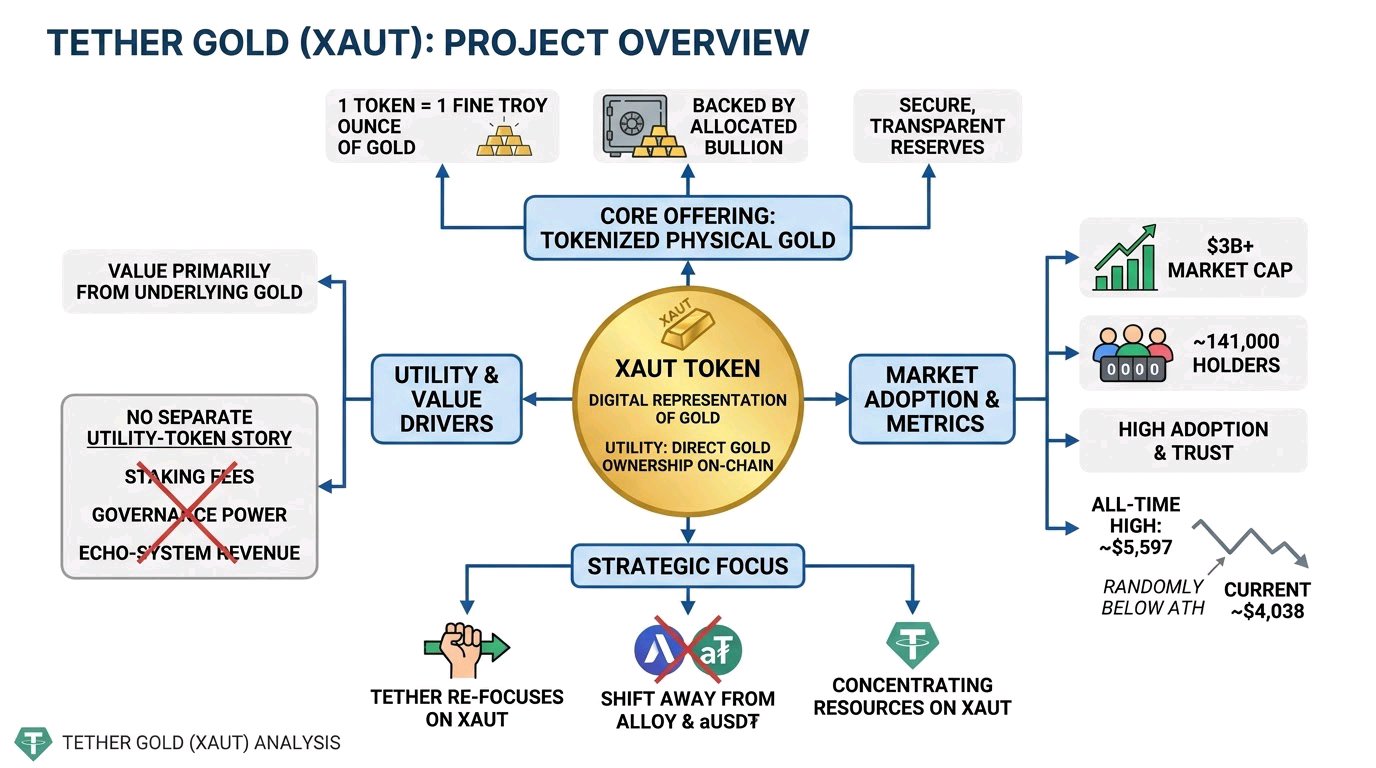
Tether Gold 悄然建立起超過 30 億美元的市值,持有者約 14 萬人,然而 XAUT 的交易價格仍在 4,038 美元附近徘徊,較其 5,597 美元的歷史高點低了約 28%。 該產品的概念非常直觀:代幣化的實體黃金,由實體金條擔保,旨在將黃金所有權引入區塊鏈軌道。Tether 也已將重點從 Alloy 及其 aUSD₮ 抵押產品轉移,選擇將資源集中於 XAUT 及其核心的黃金擔保產品上。 然而,這裡缺少的是一個獨立的功能型代幣敘事。XAUT 並未透過質押或治理來獲取協議費用。其價值主要來自於底層的黃金,而非源自區塊鏈活動的增長。 採用率是真實存在的。但 XAUT 歸根結底只是黃金的數位化代表,而非其價值會隨生態系統使用量而增長的代幣。 $XAUTUSDT #WSOTPicktoEarn10U #WSOT2026 #美國就業數據與利率決策主導本週宏觀市場 #石油波動追蹤伊朗和平談判 #英國央行利率決策 $DOGEUSDT
$BTCUSDT Ondo 的代幣化資產規模已悄然突破 40 億美元,擁有超過 565,000 名持有者,平台上涵蓋 484 種現實世界資產(RWA)。然而,ONDO 的交易價格仍在 0.3688 美元左右徘徊,較其 2.14 美元的歷史高點(ATH)下跌了約 83%。 該業務早已超越了早期專注於代幣化美國國債的範疇。Ondo 目前正在圍繞代幣化股票、ETF 和機構資產構建更廣泛的金融基礎設施。Ondo Stocks 已擴展至以太坊、Solana 和 BNB Chain,同時它與 Binance、MetaMask 和 Bitget 的整合也使其分發管道超出了自身生態系統。 但代幣價格卻沒有跟上腳步。 ONDO 目前主要仍是一種治理資產。平台的採用率、資產成長和交易活躍度並不會自動轉化為代幣需求或直接的收入分配。費用轉換機制(fee switch)仍處於關閉狀態,沒有實施任何主動的回購或分紅機制。 平台的採用是真實的。基礎設施也在擴張。但所創造的價值目前仍無法直接流向持有該資產的投資者。

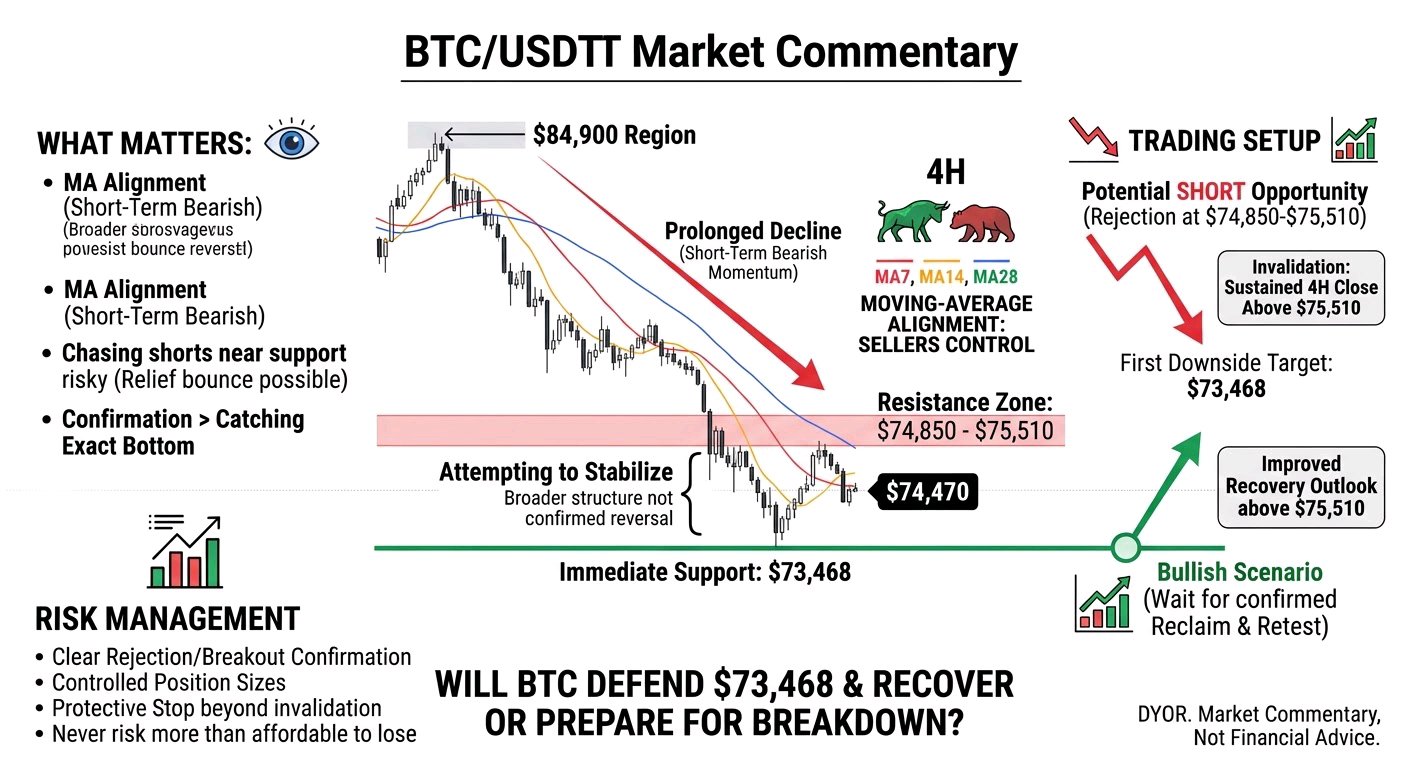
$BTCUSDT is still showing weakness on the 4H chart, with price trading around $74,470 after a prolonged decline from the $84,900 region. Buyers are attempting to stabilize, but the broader structure has not confirmed a reversal yet. Current Market Picture: Immediate support sits around $73,468, while resistance is concentrated between $74,850 and $75,510. BTC is trading below the MA7, MA14, and MA28, keeping short-term momentum bearish. A sustained move above $75,510 would improve the recovery outlook, while losing $73,468 could expose further downside. Trading Setup: No confirmed entry yet. A rejection around $74,850–$75,510 could create a potential SHORT opportunity, with $73,468 as the first downside target. A sustained 4H close above $75,510 would weaken this bearish setup. For a bullish scenario, wait for a confirmed reclaim and retest before considering LONG exposure. What Matters: One detail worth watching is the moving-average alignment. All three averages remain above price, suggesting sellers still control the broader short-term structure. Chasing a short near support is also risky because a relief bounce could develop. Confirmation matters more than catching the exact bottom. Risk Management: Avoid entering without a clear rejection or breakout confirmation. Keep position sizes controlled, use a protective stop beyond the invalidation level, and never risk more than you can afford to lose. Do you think BTC will defend $73,468 and attempt a recovery, or are sellers preparing for another breakdown? DYOR. This is market commentary, not financial advice. #WSOT2026 #USPayrollsAndRateDecisionsDriveMacroWeek #NovUSCPIWatch #OilVolatilityTracksIranPeaceTalks #WSOTPicktoEarn10U $MNTUSDT
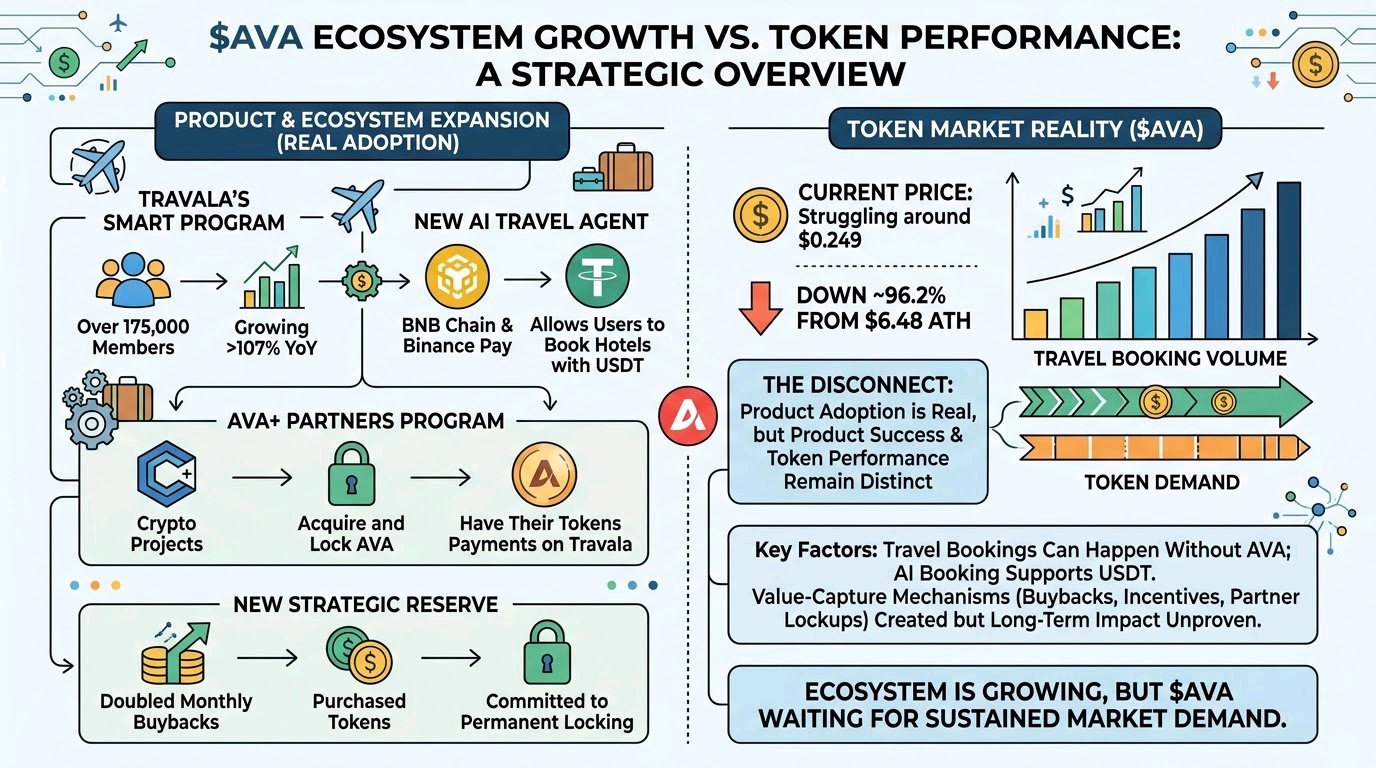
$AVAUSDT AVA’s ecosystem is quietly expanding, but its price is still struggling around $0.249, down approximately 96.2% from its $6.48 ATH. Travala’s Smart Program has surpassed 175,000 members, growing over 107% year over year. The product is evolving beyond its traditional crypto travel-booking model. Travala has introduced an AI travel agent through BNB Chain and Binance Pay, allowing users to book hotels with USDT. It has also launched AVA+ Partners, where crypto projects must acquire and lock AVA to have their tokens accepted for payments on Travala. The new strategic reserve also doubles monthly buybacks, with purchased tokens committed to permanent locking. What hasn’t fully followed is the token’s market performance. Travel bookings can happen without requiring AVA, and the AI booking experience supports USDT. Buybacks, loyalty incentives and partner lockups create direct value-capture mechanisms, but their long-term impact remains unproven. The ecosystem is growing. The token is still waiting for that growth to translate into sustained market demand. Product adoption is real, but product success and token performance remain two different things #BybitAIEvolving i