ICaty
6749點贊0分享109粉絲11關注
Crypto Trader 📈 | Market Researcher 🔍 Trading market structure, liquidity & narratives. No hype — just charts, data & real setups. 🎯
Crypto Trader 📈 | Market Researcher 🔍 Trading market structure, liquidity & narratives. No hype — just charts, data & real setups. 🎯
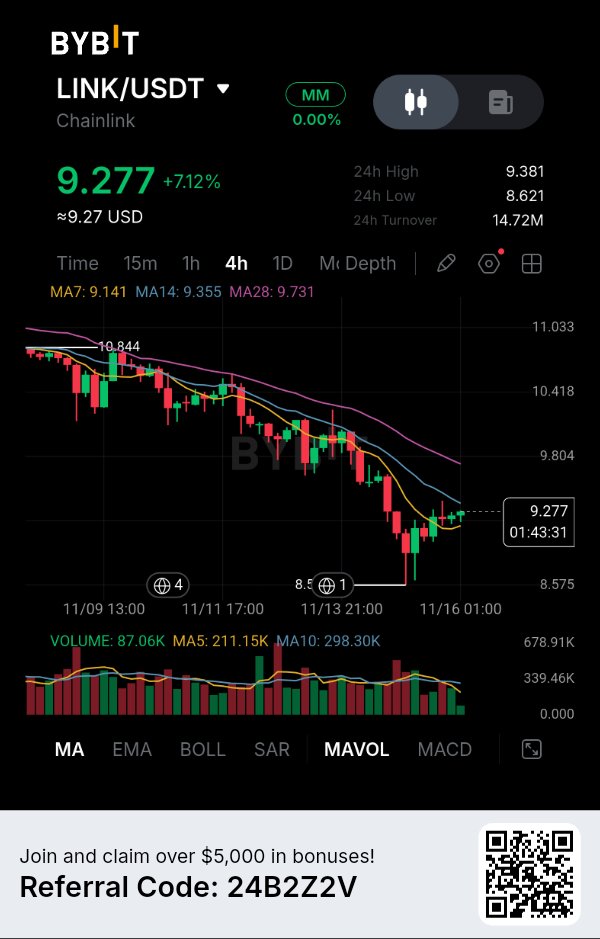
7% 的反彈看起來很有趣,但買方仍面臨關鍵的阻力區。 Chainlink 正顯示出強勁的短期反彈,LINK 上漲了 7.12%,並重回 4 小時 MA7 之上。然而,引起我注意的是,這次反彈是在一個更廣泛的下跌結構中進行的。 有趣的是,買方已成功將價格推離近期 8.62 美元的低點,但他們現在正在接近一個多條移動平均線可能挑戰反彈的區域。我想了解這是一次真正趨勢反轉的開始,還是僅僅是賣方回歸前的超跌反彈。 市場概況 LINK 目前交易價格約為 9.277 美元,此前從近期跌向 8.621 美元區域的走勢中反彈。 4 小時圖顯示,先前的下跌結構尚未完全消失。儘管價格已回升至 MA7 之上,但仍低於 MA14 和 MA28。 這創造了一個有趣的技術局勢。 買方表現出重拾的強勢,但他們仍需要克服 9.35–9.73 美元的阻力區,我才會認為這次更廣泛的反彈令人信服。 對我來說,該區域附近的下一步反應比目前的 7% 漲幅更重要。 數據與證據 以下是所附 Bybit 截圖中的重要數據: 當前價格:9.277 美元 24 小時變化:+7.12% 24 小時高點:9.381 美元 24 小時低點:8.621 美元 24 小時成交額:1,472 萬美元 先前可見高點:10.844 美元 移動平均線揭示了短期動能與更廣泛趨勢之間的重要差異: MA7:9.141 美元 MA14:9.355 美元 MA28:9.731 美元 LINK 已收復 MA7,這表明短期買盤壓力正在改善。 然而,MA14 和 MA28 仍高於當前價格。這意味著更廣泛的 4 小時結構在建立看漲反轉之前仍需確認。 交易量提供了另一個重要細節: 當前成交量:87.06K 成交量 MA5:211.15K 成交量 MA10:298.30K 儘管價格上漲了 7.12%,但當前顯示的成交量仍低於這兩條平均線。 這是我不會忽略的一點。價格正在反彈,但參與度尚未達到近期的平均水平。更強勁的成交量擴張將使反彈更具說服力。 我的看法 我在 LINK 當前的結構中看到了兩個重要水平。 第一個是 9.355 美元,這是 MA14 的位置。第二個是 9.731 美元,這是 MA28 形成另一個潛在阻力的地方。 如果買方收復這兩個水平並將價格維持在其上方,目前的復甦可能會發展成更廣泛的趨勢反轉。 然而,如果 LINK 在此阻力區掙扎並出現確認的 4 小時看跌拒絕訊號,則有可能再次跌向 9.14 美元,甚至可能跌至 8.62 美元。 我的偏好是在 7% 的漲幅後避免追高。在決定方向之前,我寧願觀察價格在移動平均線附近的表現。 交易設置 LINK — 空頭方案 (SHORT) 看跌觸發:在 9.35–9.73 美元的阻力區遭到拒絕,隨後出現確認的 4 小時看跌 K 線。 進場區間:9.40–9.65 美元 止損:9.85 美元 TP1:9.14 美元 TP2:8.85 美元 TP3:8.62 美元 看漲失效:4 小時線持續站穩在 9.85 美元上方,削弱了看跌延續的設置。 下行目標是根據可見圖表結構的估計,TP3 位於先前 8.621 美元的低點附近。 潛在下行至 TP3:約 8%–10%。 估計盈虧比:約 2.5:1,具體取決於進場和執行情況。 此設置是有條件的。在考慮啟動空頭部位之前,我會等待實際的拒絕訊號。 最終觀點 Chainlink 目前的有趣之處在於短期動能改善與尚未恢復的廣泛趨勢之間的對比。 7.12% 的漲幅表明買方已經回歸,但移動平均線顯示他們仍有重要的阻力需要克服。 對我來說,9.35–9.73 美元的區域將決定這次反彈是否有足夠的實力來挑戰現有的看跌結構。 如果買方以令人信服的成交量收復該區域,前景就會改變。如果賣方守住該區域,近期的反彈可能會成為更廣泛下跌趨勢中的另一個更低高點。 下一個重要訊號將來自 LINK 在遇到此阻力區時的反應。 $LINKUSDT #ByXIMPACT

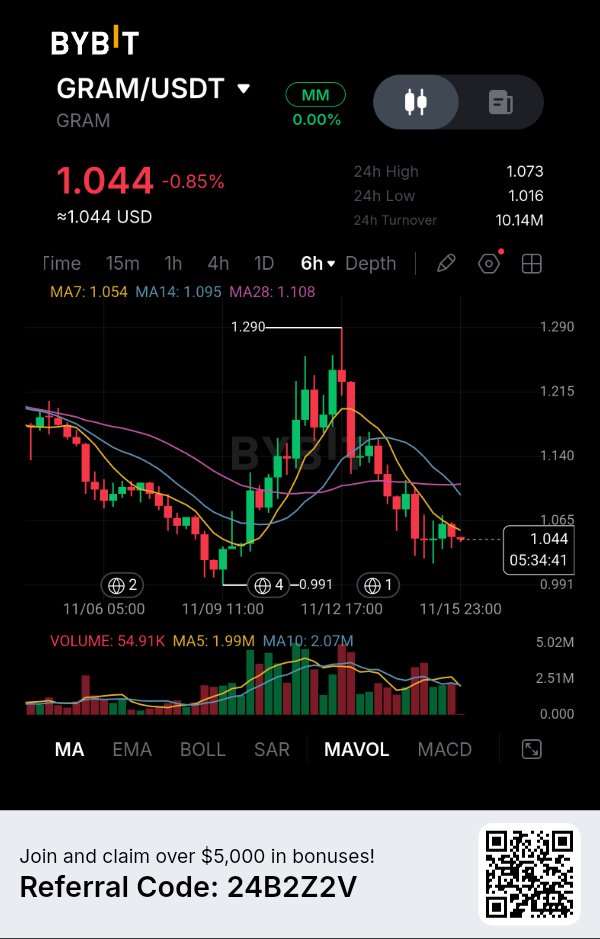
$GRAMUSDT — The recovery toward $1.29 has completely lost momentum, and the 6H chart is showing why sellers still have an advantage. GRAM is trading around $1.044, down 0.85%. What interests me is not the latest small decline, but the inability of buyers to maintain the recovery after the previous explosive rally. The market has moved from a strong upward expansion into a sequence of lower highs, suggesting that sellers are gradually regaining control. What the 6H Structure Is Revealing The moving averages are providing an important confirmation: MA7: $1.054 MA14: $1.095 MA28: $1.108 Price is trading below all three moving averages, while MA7 remains beneath MA14 and MA28. This alignment suggests that the broader short-term momentum is still bearish. Another detail deserves attention. After reaching $1.29, GRAM failed to sustain its upward momentum and gradually returned toward the $1.016 support area. The recent recovery attempts have also struggled to reclaim the moving-average cluster. For me, this suggests that buyers haven't yet demonstrated enough strength to establish a genuine trend reversal. My Market Outlook I'm leaning toward bearish continuation, particularly if price attempts another recovery toward the $1.095–$1.108 resistance zone. If sellers defend this region, another downside move could develop. My downside roadmap: $1.016 — First major support. $0.991 — Previous structural low. $0.970 — Extended projected downside objective. The $0.991 level is particularly important because it represents the previous visible swing low. My Trading Signal Direction: SHORT (conditional) Entry: $1.095–$1.108 after confirmed bearish rejection. Stop Loss: $1.130 TP1: $1.016 TP2: $0.991 TP3: $0.970 Reference Entry: $1.100 Potential downside to TP3: Approximately 11.82%. Defined risk: Approximately 2.73%. Risk-to-Reward: Approximately 4.33:1. I want to see price revisit the moving-average resistance zone and show a clear rejection before considering this setup. I won't chase the market lower at current support. What Could Invalidate My View? A sustained 6H recovery above $1.108 would be the first warning against my bearish thesis. A stronger move above $1.130 would invalidate the proposed short setup and suggest that buyers are beginning to regain control. On the other hand, a decisive breakdown below $1.016 could strengthen the bearish continuation scenario. Risk Management GRAM has already experienced significant volatility, especially during its previous rally toward $1.29. That's why I don't want to mistake a temporary bounce for a confirmed reversal. My preference is to wait for a recovery into resistance and let sellers demonstrate whether they still control the market. For now, the moving averages and lower-high structure favor sellers. The important question is whether GRAM can reclaim $1.10 or whether another failed recovery will send price back toward the $0.991 structural low. $GRAMUSDT #ByXIMPACT

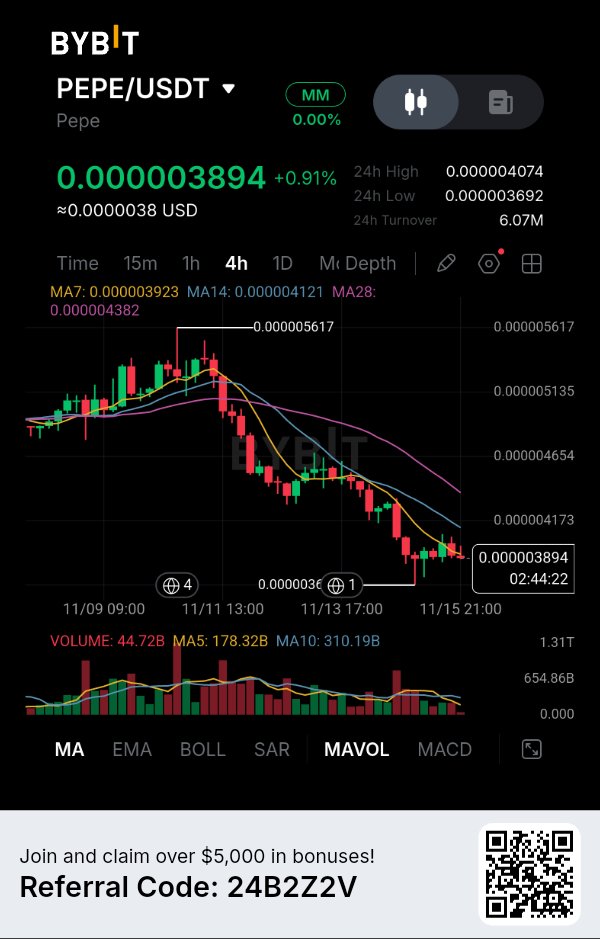
The Recovery Is Losing Momentum While Sellers Continue Controlling the 4H Structure. PEPE is showing a small positive 24H change, but the bigger picture tells a different story. What catches my attention is that despite the latest stabilization around $0.000003894, price remains below all three moving averages, and buyers have not yet demonstrated enough strength to reverse the existing downtrend. The interesting part is that PEPE is attempting to establish a floor near its recent lows, but trading activity has weakened considerably. This creates an important situation: are buyers quietly building support, or is the market simply pausing before another downward move? THE MARKET STORY PEPE is currently trading around $0.000003894, with a 24H gain of 0.91%. However, I would not interpret this small recovery as a bullish reversal. The 4H chart shows a clear sequence of lower highs and lower lows after the rejection near $0.000005617. Since then, recovery attempts have consistently struggled to regain previous resistance levels. What interests me most is the current position of price relative to the moving averages. PEPE is trading slightly below MA7 and significantly below MA14 and MA28. This suggests that the recent stabilization has not yet changed the broader bearish structure. DATA & EVIDENCE Here are the important figures from the supplied Bybit chart: Current price: $0.000003894 24H change: +0.91% 24H high: $0.000004074 24H low: $0.000003692 24H turnover: $6.07M Previous visible high: $0.000005617 The moving averages reveal the current market structure: MA7: $0.000003923 MA14: $0.000004121 MA28: $0.000004382 All three moving averages are positioned above the current price. More importantly, MA7 remains below MA14, while MA14 remains below MA28. This bearish alignment suggests that sellers continue to have the advantage on the 4H timeframe. Volume provides another important observation: Current volume: 44.72B Volume MA5: 178.32B Volume MA10: 310.19B Current displayed volume is considerably below both averages. This indicates that the latest price stabilization is happening with relatively weak trading participation. I would like to see stronger volume before considering the recovery a meaningful change in market direction. MY READ: I believe PEPE is approaching an important decision point around $0.000003692. If buyers successfully defend this level, another recovery toward $0.000003923 and potentially $0.000004121 becomes possible. However, reclaiming MA7 alone would not convince me that the trend has reversed. The more interesting scenario is a confirmed 4H breakdown below $0.000003692, followed by a failed retest. That would suggest buyers are losing their grip on the current support area and could open the door to another downward extension. I am not interested in chasing the existing decline. I want confirmation that sellers can turn the recent low into resistance. TRADING SETUP PEPE — SHORT Scenario: Bearish trigger: Confirmed 4H candle close below $0.000003692, followed by a failed retest. Entry Zone: $0.00000366–$0.00000369 Stop Loss: $0.00000388 TP1: $0.00000355 TP2: $0.00000342 TP3: $0.00000328 Bullish invalidation: PEPE reclaims $0.000004121 and establishes sustained 4H strength above this resistance. The downside targets are estimated extension levels because lower support zones are not clearly established in the supplied screenshot. Potential downside to TP3: Approximately 10%–11%. Defined risk: Approximately 5%–6%. Estimated risk-to-reward: Around 2:1. This setup remains conditional. I would not activate the SHORT position unless the $0.000003692 support breakdown is confirmed. FINAL THESIS: What makes PEPE interesting right now is the difference between its slightly positive 24H performance and its still-bearish 4H structure. A small green daily change does not necessarily mean buyers are regaining control. The moving averages, declining recovery attempts, and weaker recent volume all suggest that the market still needs stronger evidence before a trend reversal can be considered. For me, $0.000003692 is the level that deserves the most attention. A confirmed breakdown could expose lower price levels, while a successful defense followed by a reclaim of $0.000004121 would challenge the bearish thesis. The next important move will depend on whether buyers can turn this stabilization into genuine demand or whether sellers continue controlling the market structure. $PEPEUSDT #ByXIMPACT

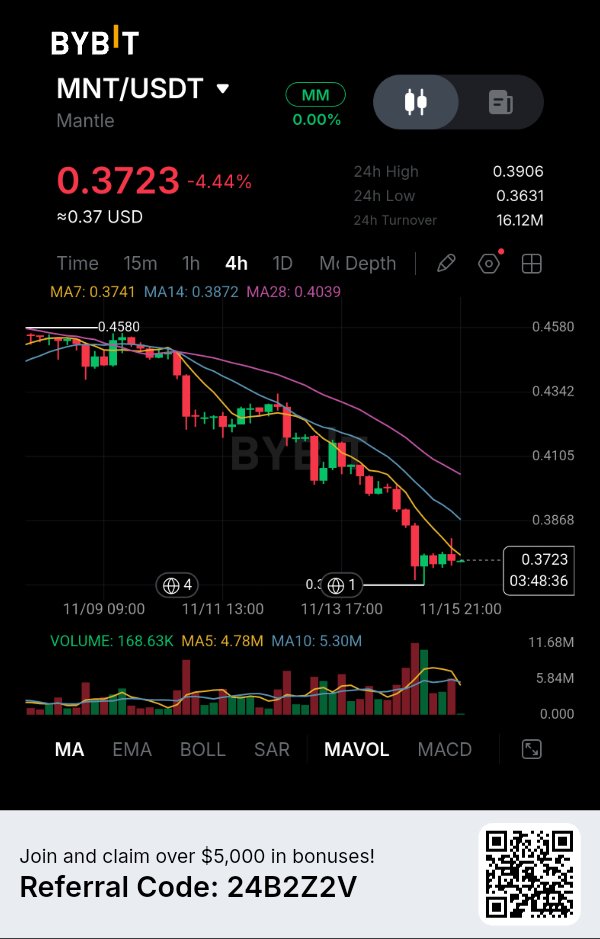
$MNTUSDT — 最新的跌破走勢已使平衡進一步向賣方傾斜,我正在觀察下一次的反彈嘗試是否會成為繼續下行的又一個契機。 Mantle 目前交易價格在 $0.3723 附近,下跌 4.44%,4 小時圖顯示出持續的低點降低和高點降低的態勢。 引起我注意的是,即使價格觸及附近的支撐區域,買方也難以實現反彈。與之前的拋售壓力相比,最近的反彈依然相對疲軟。 4 小時結構揭示了什麼 移動平均線顯示出明顯的看跌排列: MA7: $0.3741 MA14: $0.3872 MA28: $0.4039 價格在所有三條均線下方運行,且 MA7 位於 MA14 和 MA28 下方。 這表明更廣泛的短期動能依然看跌。 另一個重要的觀察點是來自 $0.4100 區域的拒絕。自那次拒絕後,賣方已逐步將 MNT 推低,最終將價格帶至 $0.3631 區域。 對我而言,MA14 在 $0.3872 附近的價位尤為重要。除非買方能奪回該區域,否則目前的復甦嘗試依然脆弱。 我的市場展望 我傾向於看跌延續,但我不想追逐目前的跌勢。 我首選的方案是反彈至 $0.3820–$0.3870 的阻力區,隨後出現確認的拒絕信號。 如果賣方能守住該區域,可能會出現另一波下行走勢。 我的下行路線圖: $0.3631 — 即時支撐與第一目標。 $0.3550 — 下一個預測下行位。 $0.3450 — 擴展下行目標。 下方的兩個位階是預估的目標,而非圖表上已確認的支撐位。 我的交易信號 方向:做空(條件式) 入場:$0.3820–$0.3870(在確認看跌拒絕後) 止損:$0.4050 TP1 (止盈1): $0.3631 TP2 (止盈2): $0.3550 TP3 (止盈3): $0.3450 參考入場:$0.3850 至 TP3 的潛在下行空間:約 10.39%。 預設風險:約 5.19%。 盈虧比:約 2.00:1。 在考慮建倉前,我希望看到賣方在入場區間展現力量。如果 MNT 在沒有回測的情況下繼續下跌,我不會追空。 什麼可能使我的觀點失效? 4 小時線持續回升至 $0.3872 上方,將是對我看跌論點的第一個警示。 若能更強勁地奪回 $0.4039 的 MA28,將挑戰目前的廣泛下行結構,並暗示買方開始重新掌握控制權。 另一方面,若果斷跌破 $0.3631,可能會加強看跌延續的情境。 風險管理 MNT 正接近一個重要的支撐區域,這正是入場時機至關重要的原因。 直接在支撐位做空可能會使倉位暴露於意外反彈的風險中。我寧願等待價格回升至阻力位,並讓賣方確認他們的存在。 目前,移動平均線和市場結構對賣方有利。 下一個重要的戰役是在 $0.3870 附近。買方能否奪回失去的趨勢位,還是下一次的反彈嘗試又會給賣方機會,將 Mantle 推向更低的價格?$MNTUSDT #ByXIMPACT

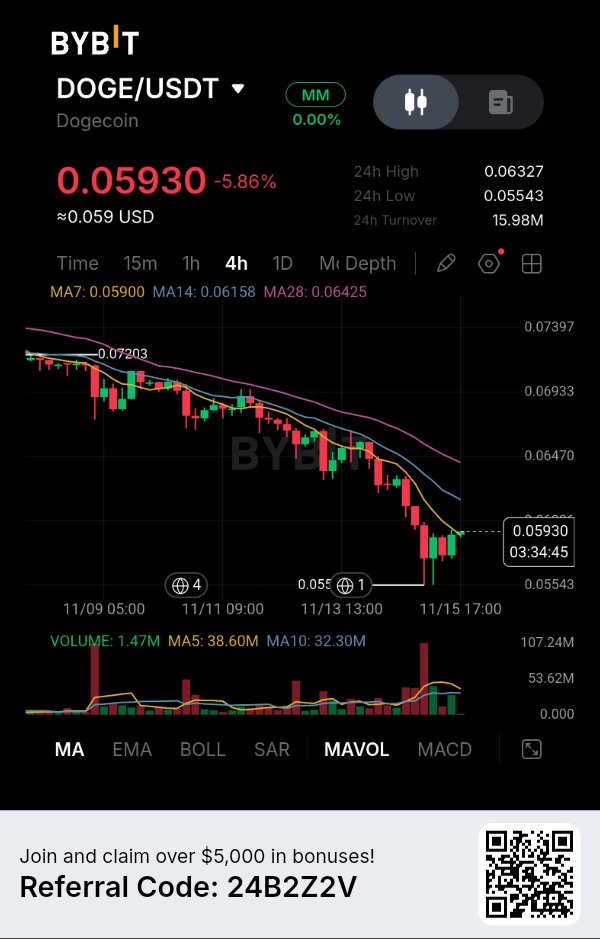
The Bounce Is Back, But Buyers Still Have Something to Prove. Dogecoin has recovered slightly from its recent low, but the interesting part is that this bounce has not yet changed the broader 4H market structure. DOGE is trading around $0.05930 after an 5.86% decline, while its two higher moving averages continue to act as overhead resistance. What catches my attention is the reaction around $0.05543. Buyers stepped in near this level, but the recovery is still relatively limited compared with the preceding decline. This creates an interesting situation: is DOGE building a temporary floor, or are sellers preparing for another attempt at the recent low? THE MARKET STORY: DOGE is currently trading near $0.05930, after declining from the visible $0.07203 region. The 4H chart shows a persistent sequence of lower highs and lower lows. However, the latest candles indicate that buyers are attempting to stabilize price after the sharp move toward $0.05543. I am particularly interested in the position of the moving averages. DOGE has managed to move slightly above MA7, but MA14 and MA28 remain considerably higher. This suggests that short-term buying interest has appeared without confirming a broader trend reversal. For me, the next important battle is around $0.06158. DATA & EVIDENCE Here are the important figures from the supplied Bybit chart: * Current price: $0.05930 * 24H change: -5.86% * 24H high: $0.06327 * 24H low: $0.05543 * 24H turnover: $15.98M * Previous visible high: $0.07203 The moving averages reveal the current market structure: * MA7: $0.05900 * MA14: $0.06158 * MA28: $0.06425 DOGE is slightly above MA7 but remains below MA14 and MA28. The positioning of these averages is still bearish, with MA7 below MA14 and MA14 below MA28. This suggests that the broader selling structure remains intact. Volume provides another interesting detail: Current volume: 1.47M Volume MA5: 38.60M Volume MA10: 32.30M The latest displayed volume is considerably below both averages. This indicates that the current recovery is not accompanied by the same level of trading activity seen during previous periods. I would like to see stronger participation before treating this bounce as a meaningful change in market direction. MY READ: I believe DOGE is approaching an important resistance test. The $0.06158 region is particularly important because it aligns with MA14. If buyers manage to reclaim this level and sustain price above it, the current bearish interpretation will begin to weaken. However, if DOGE approaches this region and sellers reject the recovery, another move toward $0.05800 and potentially $0.05543 becomes possible. I am not interested in shorting simply because DOGE has already declined. I want to see buyers lose momentum near resistance and sellers confirm their return through a bearish 4H reaction. That would provide a much more interesting trading opportunity. TRADING SETUP DOGE/USDT — SHORT Scenario Bearish trigger: Rejection from the $0.06100–$0.06158 resistance zone, confirmed by a bearish 4H candle. Entry Zone: $0.06100–$0.06150 Stop Loss: $0.06350 TP1: $0.05800 TP2: $0.05650 TP3: $0.05550 Bullish invalidation: Sustained 4H acceptance above $0.06350. The downside targets are based on estimated price projections and the visible support structure. The final target is positioned close to the previous $0.05543 low. Potential downside to TP3: Approximately 9%. Defined risk: Approximately 3.3%–4.1%. Estimated risk-to-reward: Around 2:1 or better, depending on execution. This setup remains conditional. I would wait for the resistance rejection rather than chase an entry at the current price. FINAL THESIS: What makes DOGE interesting right now is the difference between short-term stabilization and an actual recovery in market structure. Buyers have defended the recent low, but they still need to overcome the moving-average resistance before I would consider the trend meaningfully improved. For me, $0.06158 is the level that deserves the most attention. A successful reclaim could change the current outlook, while another rejection could bring $0.05543 back into focus. The next move will depend on whether buyers can turn this small recovery into sustained demand or whether sellers continue controlling the broader structure. $DOGEUSDT #ByXIMPACT

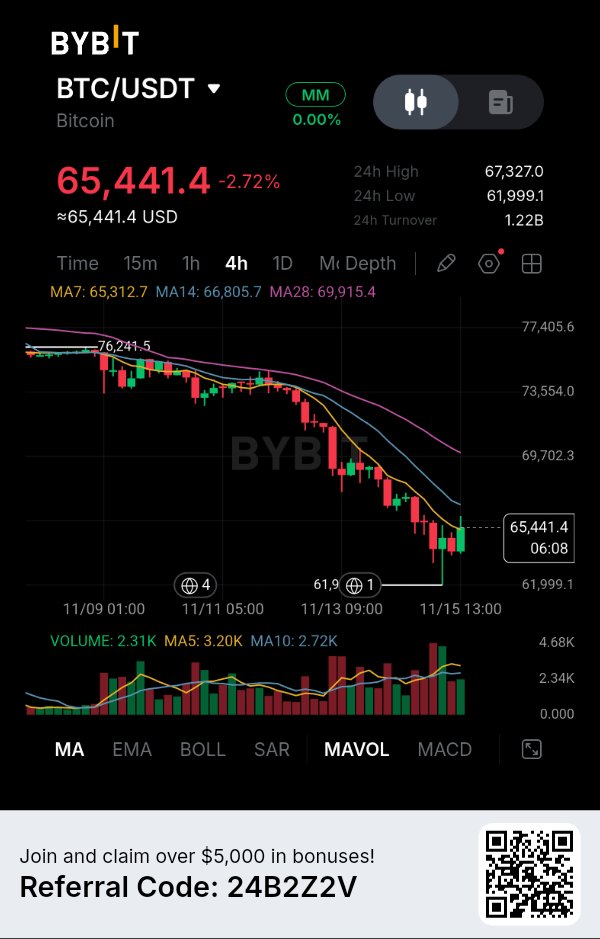
$BTCUSDT — Bitcoin's latest bounce is interesting, but I'm not convinced the market has found its bottom yet. The 4H structure still favors sellers, and the next resistance test could reveal whether this recovery has real strength. Bitcoin is trading around $65,441, down 2.72%. After falling from the $76,241 region toward $61,999, buyers have finally produced a noticeable reaction. But there's an important distinction between a relief bounce and an actual trend reversal. What the 4H Chart Is Revealing The moving averages are showing where the current pressure remains: MA7: $65,312.7 MA14: $66,805.7 MA28: $69,915.4 Price has managed to move slightly above MA7, which suggests short-term stabilization. However, BTC remains below MA14 and MA28. The wider structure is still bearish, with a clear sequence of lower highs and lower lows. What interests me most is the $66,800 region. This is where the MA14 sits, making it an important resistance area for the next recovery attempt. If buyers fail to reclaim this level, the recent bounce could become another opportunity for sellers. My Market Outlook I'm leaning toward bearish continuation unless Bitcoin can establish a stronger structure above the moving-average resistance. My downside roadmap: $61,999 — Previous major low and first downside objective. $60,500 — Next projected downside target. $58,500 — Extended downside objective. The lower two levels are projected extensions, not confirmed support levels on the visible chart. My Trading Signal Direction: SHORT (conditional) Entry: $66,000–$66,800 after confirmed bearish rejection. Stop Loss: $68,000 TP1: $61,999 TP2: $60,500 TP3: $58,500 Reference Entry: $66,400 Potential downside to TP3: Approximately 11.90%. Defined risk: Approximately 2.41%. Risk-to-Reward: Approximately 4.94:1 to TP3. I want to see sellers defend the MA14 resistance zone before considering this trade. If Bitcoin breaks above resistance with convincing momentum, I won't force a short position. What Could Invalidate My View? A sustained 4H recovery above $66,805 would be the first warning against my bearish thesis. A stronger reclaim of the $69,915 MA28 would suggest that buyers are beginning to challenge the broader downward structure. On the other hand, a rejection from $66,800 followed by a breakdown toward $61,999 would strengthen the bearish continuation scenario. Risk Management Bitcoin has already experienced a significant decline, so chasing the current move lower isn't my preferred approach. I'd rather wait for a recovery into resistance and let the market show whether sellers are still in control. For now, MA7 is providing short-term support, but MA14 and MA28 remain overhead obstacles. The next important battle is around $66,800. Bitcoin has shown that buyers can produce a bounce. Now they need to prove they can turn that bounce into a genuine change in market structure. $BTCUSDT #ByXIMPACT


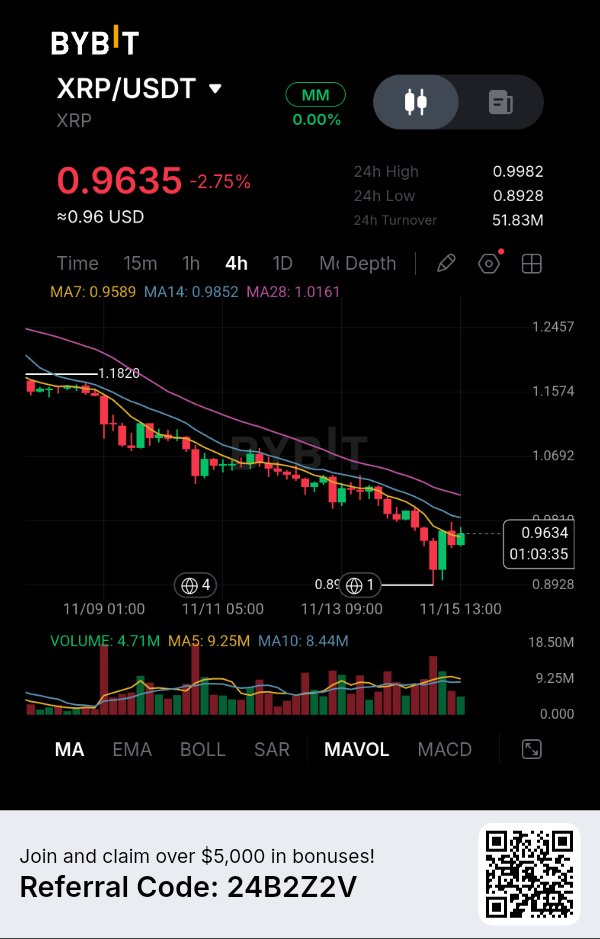
A Small Recovery Is Emerging, But the Bigger Trend Still Favors Sellers. XRP is attempting to stabilize after a prolonged 4H decline, but what catches my attention is the difference between the latest bounce and the broader market structure. Price has recovered from the $0.8928 low, yet it is still struggling to regain its major moving averages. The interesting part is that buyers have managed to push XRP back above its short-term MA7, but the MA14 and MA28 remain overhead. This creates an important question: is this the beginning of a meaningful recovery, or simply a temporary bounce inside a bearish trend? THE MARKET STORY XRP is currently trading around $0.9635, down 2.75% over 24 hours. The 4H chart shows a consistent sequence of lower highs and lower lows, indicating that sellers have maintained control throughout the recent decline. However, the latest reaction from $0.8928 deserves attention. Buyers stepped in near that level and managed to produce a recovery toward $0.9635. I am not treating this bounce as a confirmed reversal. What matters now is whether buyers can reclaim the $0.9852 resistance area or whether sellers use that region to resume the downward move. DATA & EVIDENCE Here are the important figures from the supplied Bybit screenshot: Current price: $0.9635 24H change: -2.75% 24H high: $0.9982 24H low: $0.8928 24H turnover: $51.83M Previous visible high: $1.1820 The moving averages reveal an interesting situation: MA7: $0.9589 MA14: $0.9852 MA28: $1.0161 XRP has recovered above MA7, which suggests some short-term buying interest. However, MA14 and MA28 remain above the current price, with the averages still arranged bearishly. This means the broader 4H structure has not yet changed. Volume provides another important detail: Current volume: 4.71M Volume MA5: 9.25M Volume MA10: 8.44M Current volume remains below both averages. This suggests that the latest recovery has not yet attracted participation comparable to recent trading activity. For me, this makes the current bounce less convincing as a trend reversal. MY READ I believe $0.9852 is the next important level for XRP. If buyers manage to reclaim this resistance and establish sustained 4H strength above it, the bearish interpretation will begin to weaken. But if price approaches this region and sellers reject another recovery attempt, the market could revisit the $0.9300 area before testing the previous low at $0.8928. I am particularly cautious about entering during the current bounce. A declining market can produce temporary recoveries without changing its overall direction. I want to see how XRP reacts around MA14 before considering a bearish continuation position. TRADING SETUP XRP — SHORT Scenario: Bearish trigger: Rejection around $0.9750–$0.9852, followed by a confirmed 4H bearish candle. Entry Zone: $0.9750–$0.9850 Stop Loss: $1.0050 TP1: $0.9400 TP2: $0.9150 TP3: $0.8930 Bullish invalidation: Sustained 4H acceptance above $1.0050, weakening the bearish continuation setup. The lower targets are estimated from the visible chart structure, with TP3 positioned near the previous $0.8928 low. Potential downside to TP3: Approximately 8.4%–9.3%. Defined risk: Approximately 2.0%–3.1%. Estimated risk-to-reward: Around 3:1, depending on entry and execution. This setup is conditional. I would not activate it without a confirmed rejection from the proposed entry region. FINAL THESIS: What makes XRP interesting right now is that the first signs of short-term buying interest are appearing while the broader 4H structure remains bearish. The recovery above MA7 is encouraging, but it is not enough to establish a trend reversal. For me, the next important battle is around $0.9852. If buyers reclaim that level, the bearish thesis will need reconsideration. If sellers defend it, XRP could revisit its recent lows. I am watching whether this recovery develops into genuine buying strength or becomes another lower high in the existing downtrend. $XRPUSDT #ByXIMPACT

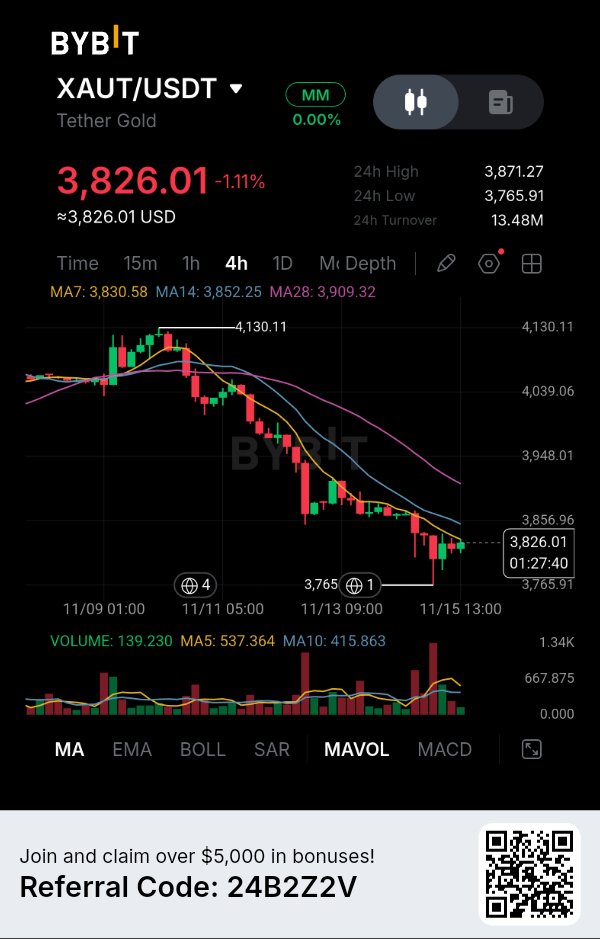
$XAUTUSDT — 從 $3,765 的反彈引起了我的注意,但更廣泛的 4 小時線結構仍顯示賣方掌控著市場。 Tether Gold 目前交易價格約為 $3,826.01,下跌 1.11%。在從 $4,130 區域下跌後,價格試圖趨穩,但與之前的賣壓相比,復甦力道相對疲軟。 我最感興趣的是價格位於移動平均線阻力區下方的走勢。 4 小時線圖表揭示了什麼 目前的移動平均線數據為: MA7:$3,830.58 MA14:$3,852.25 MA28:$3,909.32 價格仍低於這三條移動平均線。儘管最近的 K 線顯示出小幅反彈,但整體結構持續呈現更低的高點和更低的低點。 還有另一個重要細節:近期跌向 $3,765.91 時吸引了一些買盤活動,但買方尚未展現足夠的力道來收復 MA14。 對我而言,這看起來更像是大趨勢下跌過程中的嘗試性趨穩,而非確認的反轉。 我接下來關注的重點 $3,830–$3,852 區域是我目前的直接阻力區。 如果價格回測此區域且賣方再次展現拒絕力道,我相信市場可能會恢復下跌趨勢。 我的下跌路徑圖: $3,765.91 — 前波低點,也是第一個主要支撐位。 $3,735 — 下一個預測的下跌目標。 $3,700 — 延伸下跌目標。 後兩個點位為預估值,並非圖表上已確認的支撐位。 我的交易訊號 方向:空單 (條件式) 進場:在確認看跌拒絕後 $3,835–$3,855 止損:$3,890 TP1 (止盈1):$3,765.91 TP2 (止盈2):$3,735 TP3 (止盈3):$3,700 參考進場價:$3,845 至 TP3 的潛在跌幅:約 3.77%。 定義風險:約 1.17%。 盈虧比:約 3.22:1。 在考慮此設置之前,我想看到賣方防守該阻力區。如果價格伴隨強勁的買入動能突破阻力位,我將不會強行進場做空。 什麼會使我的觀點失效? 若 4 小時線持續回升至 $3,852 以上,將是對我看跌觀點的第一個警告。 若能更強勢地收復 $3,909 以上,將挑戰更廣泛的下跌結構,並暗示買方正在獲取控制權。 另一方面,若果斷跌破 $3,765.91,可能會增強看跌延續的情境。 風險管理 我對直接在前低位置做空沒興趣。在經歷長時間下跌後,支撐位可能會產生劇烈反應。 我的偏好是讓價格回升至阻力區,並等待賣方確認其存在感。 目前,移動平均線持續偏向空方,但接下來的阻力測試將至關重要。 真正的問題是,這次反彈是真正復甦的開始,還是僅僅給了賣方另一次將 Tether Gold 推低的機會。 $XAUTUSDT #ByXIMPACT

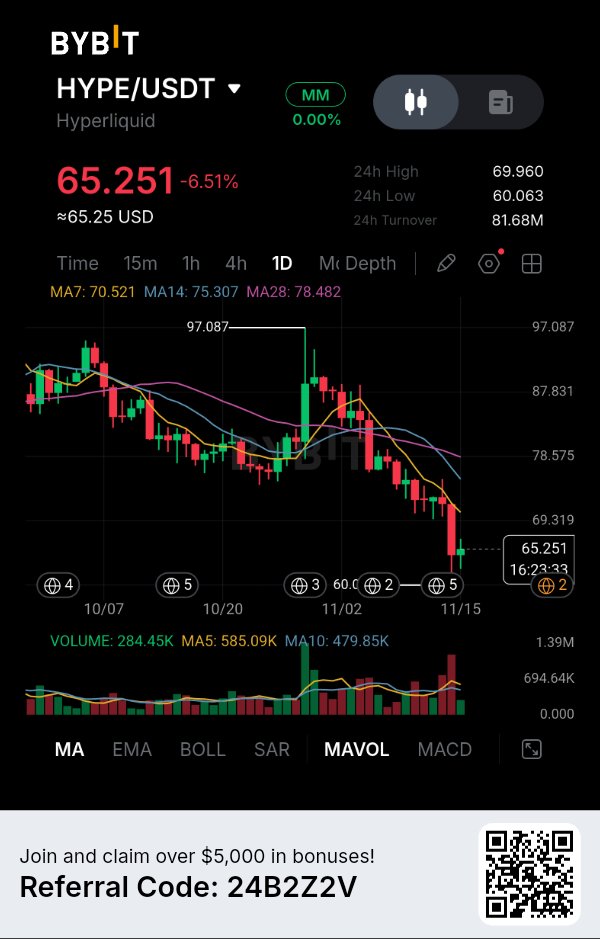
復甦正面臨更大的問題——賣方仍掌控著每日趨勢。 Hyperliquid 下跌了 6.51%,但引起我注意的是當前價格與其主要日線移動平均線之間的距離。HYPE 在急劇跌向 60 美元後試圖企穩,然而最近的復甦力道不足以改變更宏觀的市場結構。 有趣的是,買方確實設法在近期低點製造了反彈,但價格仍低於所有三條移動平均線。這造成了一個關鍵局面:這到底是復甦的開始,還僅僅是更大規模下跌趨勢中的暫時停頓? 市場概況 HYPE 目前交易價格約為 65.251 美元,此前已從 97.087 美元的高點大幅回落。 與普通的回調不同,日線圖顯示出「高點降低、低點降低」的序列。最近的跌勢在加速跌向 60.063 美元後,買方才嘗試進行復甦。 我特別關注接下來會發生什麼,因為反彈尚未收復重要的移動平均阻力位。 對我而言,臨時復甦與真正趨勢反轉之間的差別,取決於買方能否重新奪回這些水平。 數據與證據 以下是從所提供的 Bybit 截圖中得出的重要數據: 當前價格:65.251 美元 24 小時變化:-6.51% 24 小時高點:69.960 美元 24 小時低點:60.063 美元 24 小時成交額:81.68M 前一可見高點:97.087 美元 日線移動平均線顯示出看跌結構: MA7:70.521 美元 MA14:75.307 美元 MA28:78.482 美元 這三條均線均位於當前價格上方,且 MA7 低於 MA14,MA14 低於 MA28。 這種排列顯示賣方仍掌控著更宏觀的日線趨勢。 成交量提供了另一個重要細節: 當前成交量:284.45K 成交量 MA5:585.09K 成交量 MA10:479.85K 目前顯示的成交量低於上述兩條均線。這表明最近的復甦尚未吸引到與近期平均交易活動相當的參與度。 在將此次反彈視為可持續反轉的證據之前,我希望能看到更強勁的成交量。 我的解讀 我認為 HYPE 正接近一個重要的技術決策點。 60.063 美元是該圖表上最重要的可見支撐位。 如果買方能成功守住該區域,HYPE 可能會嘗試再次向 70.521 美元復甦,隨後是 75.307 美元。 然而,要收復這些水平,需要的不仅仅是幾根綠色 K 線。 我擔憂的是價格仍顯著低於移動平均線,這意味著整體結構仍有利於賣方。 比起追逐當前的下跌,我寧願等待確認後的跌破。 交易設置 HYPE — 做空 (SHORT) 場景 看跌觸發點:日線收盤價確認低於 60.063 美元,隨後回測失敗。 進場區間:59.50–60.00 美元 止損:62.20 美元 TP1:57.50 美元 TP2:55.00 美元 TP3:52.50 美元 看漲失效:HYPE 收復 70.521 美元並在此水平上方建立持續的日線強勢。 下行目標是根據延伸位預估的,因為所提供的截圖中無法看見更低的支撐位。 潛在下行空間至 TP3:約 11.8%–12.5%。 定義風險:約 3.7%–4.5%。 預估風險回報比:約 2.7:1,具體視執行情況而定。 此設置仍具備條件限制。除非 60.063 美元確實跌破,否則我不會認為做空策略已啟動。 最終結論 HYPE 目前有趣的地方在於其短期復甦與其宏觀日線結構之間的差異。 買方在 60 美元附近展現出了一些需求,但他們尚未收復重要的移動平均線。這使得市場極易受到另一波拋售嘗試的影響。 對我而言,下一個主要信號將來自 60.063 美元的支撐位。若確認跌破,可能會暴露出進一步的下行空間;而若強勁復甦至 70.521 美元以上,則將挑戰現有的看跌論點。 我正在觀察 Hyperliquid 是否能將這種暫時的企穩轉化為真正的日線趨勢復甦,而不是假設最近的反彈就標誌著底部。$HYPEUSDT #ByXIMPACT

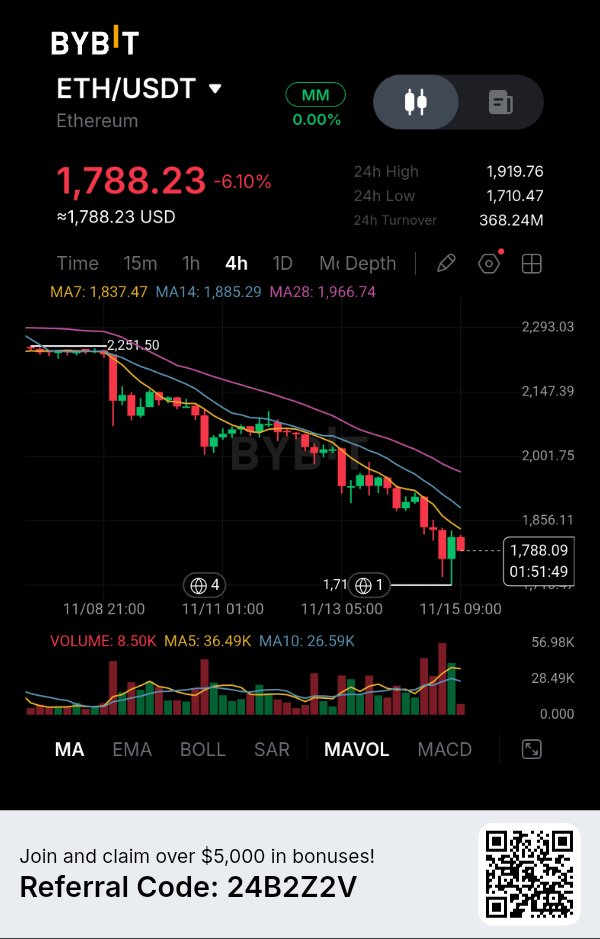
$ETHUSDT — 以太幣(Ethereum)最近的跌勢已將價格推向關鍵支撐區,但目前的復甦力道還不足以讓我改變看跌的觀點。 ETH 目前交易價格約為 $1,788.23,下跌了 6.10%,在此前 4 小時圖上出現了一波激進的拋售潮。 引起我注意的是這次下跌背後的結構。買方屢次嘗試穩定市場,但每次反彈都在試圖收復前一個阻力位時顯得力不從心。 市場結構仍然疲軟 以太幣已從 $2,251 區域轉向一連串的高點降低(lower highs)和低點降低(lower lows)。 目前的移動平均線數據使疲軟跡象更加明顯: MA7: $1,837.47 MA14: $1,885.29 MA28: $1,966.74 價格目前運行在三條均線下方,且均線呈現看跌排列。 這告訴我,近期的反彈仍處於更廣泛的下跌結構中,而非確認反轉。 我密切關注的另一個價位是 $1,710.47,這是可見的 24 小時低點。 如果賣方帶著強勁動能跌破該區域,以太幣可能會面臨進一步的下跌空間。 我看到的下一個機會 我特別關注 $1,837–$1,885 的阻力區域。 此區域包含了 MA7 和 MA14,使其成為下一次反彈嘗試的重要地帶。 如果 ETH 反彈至此區域且賣方拒絕該走勢(rejected the move),我相信看跌持續(bearish continuation)的可能性會更大。 我的下行路線圖: $1,710 — 即時支撐位。 $1,680 — 第一個預測的下行延伸位。 $1,640 — 更深層的下行目標。 較低的目標僅為預測,並非截圖中可見的已確認支撐位。 我的交易訊號 方向:做空(條件性) 進場:確認看跌拒絕後在 $1,840–$1,885 進場。 止損:$1,925 TP1 (止盈1): $1,710 TP2 (止盈2): $1,680 TP3 (止盈3): $1,640 參考進場價:$1,855 至 TP3 的潛在跌幅:約 11.59%。 設定風險:約 3.77%。 風險報酬比(Risk-to-Reward):約 3.07:1。 我希望看到反彈至阻力位後出現明確的拒絕訊號,才會考慮這個倉位。我不會在已經大幅下跌後再去追空 ETH。 什麼會使我的觀點失效? 若 4 小時級別持續反彈至 $1,885 以上,將會是對我看跌觀點的第一個警示。 如果買方收復了 MA14 並隨後挑戰 $1,925 區域,目前的拋售結構可能會開始失去力道。 另一方面,若跌破 $1,710,則會強化看跌持續的情境。 風險管理 以太幣正接近重要的支撐區域,出現暫時的反彈並不會讓我感到意外。 這正是為什麼我傾向於等待阻力位的回測,而不是直接在支撐位做空的原因。 我的焦點仍然鎖定在 $1,837–$1,885 區域,以及當價格觸及該區時賣方的反應。 目前而言,移動平均線和市場結構都對賣方有利。 真正的問題在於,以太幣能否將最近的這波反彈轉化為真正的復甦,或者下一次阻力測試是否會成為賣方的另一個機會。$ETHUSDT #ByXIMPACT

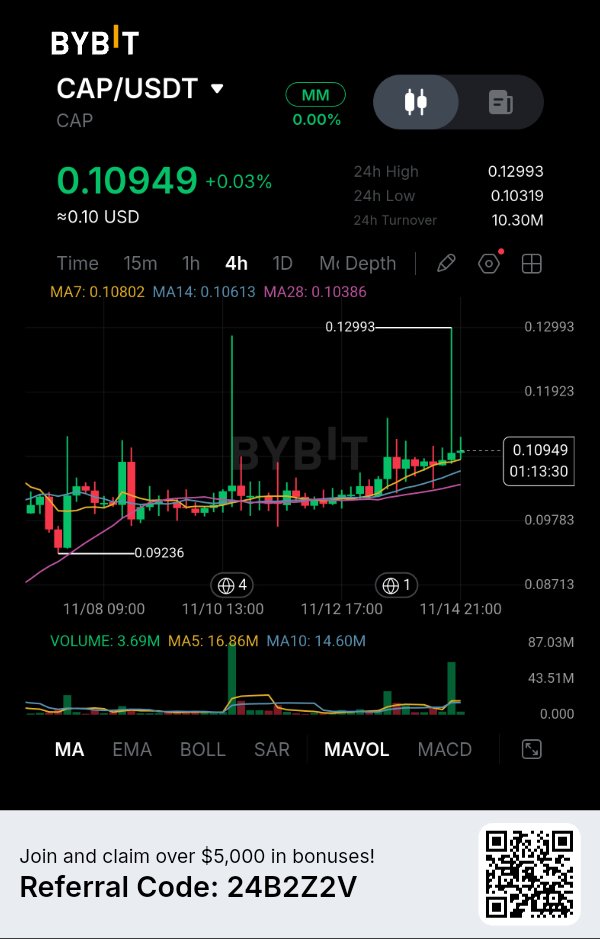
Buyers Are Slowly Regaining Control, But One Resistance Could Change the Entire Setup. CAP is showing a different market structure compared with several other declining altcoins. What catches my attention is that despite the recent volatility, price has managed to recover above all three visible moving averages and is now consolidating near $0.10949. The interesting part is that buyers are gradually improving the short-term structure, but trading activity has not yet confirmed a strong breakout. This creates an important question: is CAP preparing for another upward move, or is the current recovery simply losing momentum beneath resistance? THE MARKET STORY CAP is currently trading at $0.10949, with a nearly unchanged 24H performance of +0.03%. Unlike a market experiencing continuous lower lows, the latest 4H candles show a relatively stable consolidation followed by a gradual recovery. What interests me most is the positioning of the moving averages. The price is now trading above MA7, MA14, and MA28, suggesting that short-term buyers have started gaining an advantage. However, the chart also shows a previous sharp upward wick toward $0.12993. That move indicates significant volatility around higher prices and makes the previous high an important reference for evaluating future upside potential. DATA & EVIDENCE Here are the important figures from the supplied Bybit chart: Current price: $0.10949 24H change: +0.03% 24H high: $0.12993 24H low: $0.10319 24H turnover: $10.30M Previous visible low: $0.09236 The moving averages show a developing bullish alignment: MA7: $0.10802 MA14: $0.10613 MA28: $0.10386 All three averages are below the current price, with MA7 above MA14 and MA14 above MA28. This is an encouraging technical development because it suggests that the shorter-term trend is improving. However, volume tells a slightly different story: Current volume: 3.69M Volume MA5: 16.86M Volume MA10: 14.60M Current displayed volume remains considerably below both averages. This is important because a price recovery without strong participation may struggle to develop into a sustained breakout. MY READ: I see a potentially interesting setup developing in CAP. The strongest argument for buyers is the bullish moving-average alignment and the ability of price to remain above the $0.106–$0.108 region. However, I do not consider the recovery fully confirmed. The next important resistance is around $0.11293, based on the visible chart scale and recent price action. If buyers secure a 4H close above this region with improving volume, I would become more interested in a continuation toward higher levels. On the other hand, failure to reclaim resistance could keep CAP trapped in its current consolidation range. I would rather wait for a confirmed breakout than enter simply because the moving averages look positive. TRADING SETUP CAP — LONG Scenario: Bullish trigger: Confirmed 4H candle close above $0.11293 with stronger buying volume. Entry Zone: $0.1130–$0.1140 Stop Loss: $0.1080 TP1: $0.11923 TP2: $0.12400 TP3: $0.12993 Bearish invalidation: Failure to hold $0.1080 after the breakout attempt, weakening the bullish setup. The higher targets are estimated projections based on the visible chart structure, with $0.12993 representing the previous visible spike high. Potential upside to TP3: Approximately 14.0%–15.0%. Defined risk: Approximately 4.4%–5.3%. Estimated risk-to-reward: Around 2.7:1, depending on execution. This setup is conditional. I would not consider the LONG active until resistance is successfully reclaimed. FINAL THESIS: What makes CAP interesting is the gradual improvement in its 4H structure while price remains relatively stable. The bullish moving-average alignment provides an encouraging signal, but the lack of strong volume participation is something I would not ignore. For me, the next important development is whether buyers can turn $0.11293 into support after a confirmed breakout. If that happens, the previous $0.12993 high becomes an important upside reference. Until then, CAP remains a developing recovery setup rather than a confirmed breakout. $CAPUSDT #ByXIMPACT

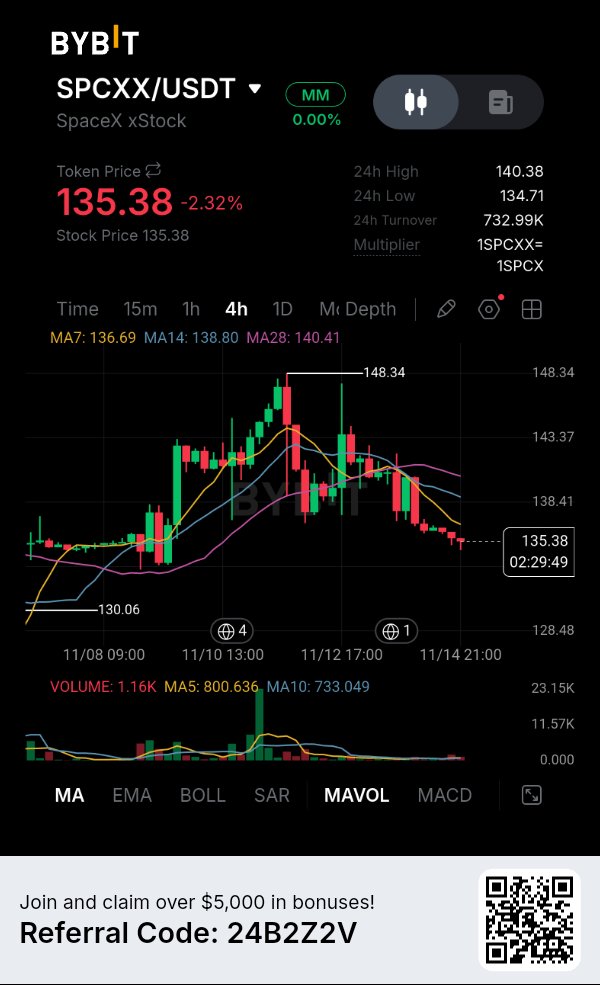
$SPCXXUSDT — The recovery has lost momentum, and sellers are gradually pushing SpaceX xStock back toward an important demand area. What caught my attention on the 4H chart is that price is no longer holding its previous recovery structure. After reaching $148.34, SPCX started forming lower highs, and the latest candles show buyers struggling to defend higher levels. Currently trading around $135.38, the token is down 2.32%, with the $134.71 area acting as immediate support. What the 4H Structure Is Revealing The moving averages are showing a clear shift in momentum: MA7: $136.69 MA14: $138.80 MA28: $140.41 Price is trading below all three moving averages, and their positioning reflects increasing short-term weakness. Another important detail is the rejection from the $143–$148 region. Buyers previously managed to push price higher, but they couldn't sustain that recovery. Now the market is approaching a critical area where another decision could emerge. My Market Outlook I'm leaning toward bearish continuation, but I don't want to chase price directly into support. The $136.69–$140.41 region is the resistance zone I'm watching. If SPCX attempts a recovery into this area and sellers reject it, another downside move becomes possible. My downside roadmap: $134.71 — Immediate support. $132.50 — Next projected downside target. $130.06 — Major structural support and final objective. The $130.06 level is particularly important because it represents the previous visible chart low. My Trading Signal Direction: SHORT (conditional) Entry: $137.00–$138.50 after confirmed bearish rejection. Stop Loss: $141.00 TP1: $134.71 TP2: $132.50 TP3: $130.06 Reference Entry: $137.75 Potential downside to TP3: Approximately 5.58%. Defined risk: Approximately 2.36%. Risk-to-Reward: Approximately 2.36:1. I want sellers to confirm their presence around the entry zone before considering this trade. If price continues falling without a retest, I won't chase the move. What Could Invalidate My View? A strong 4H recovery above $140.41 would be the first warning against my bearish thesis. If buyers reclaim the moving-average cluster and establish higher highs, the current weakness could turn into another recovery attempt. On the downside, a decisive breakdown below $134.71 could strengthen the bearish continuation scenario. Risk Management I'm not ignoring the possibility of a bounce from the current support area. The market has already experienced a meaningful decline, and short positions opened too late can face sudden reversals. My preference is to wait for a recovery toward resistance and let sellers confirm the next move. For now, the moving averages favor sellers, but the $134.71 support remains an important level to monitor. The bigger question is whether SPCX can recover its lost momentum or whether sellers will push price toward the $130 demand region again. $SPCXXUSDT #ByXIMPACT

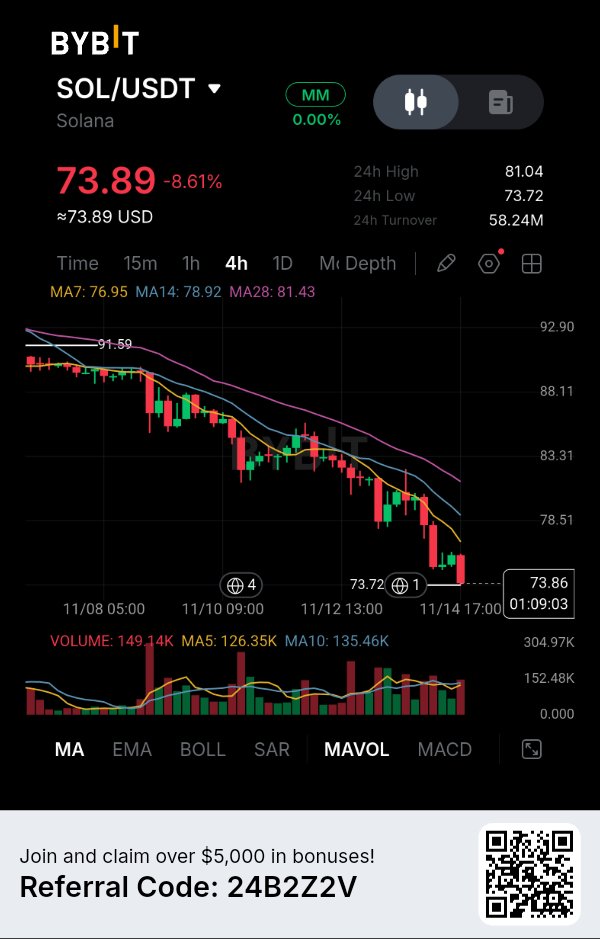
賣方正推動 Solana 跌向關鍵的支撐位。 Solana 下跌了 8.61%,但我注意到的是,賣方在 4 小時結構中的控制力始終如一。每一次反彈嘗試都難以獲得動力,而最近的跌勢已將 SOL 推向危險邊緣,逼近其可見的 73.72 美元支撐位。 有趣的是,價格目前低於所有三條主要移動平均線,同時賣壓依然高漲。這形成了一個重要的局面:買方需要守住當前支撐位,否則可能會出現進一步的下跌延伸。 市場行情 在從 91.59 美元的可見區域下跌後,SOL 目前交易價格約為 73.89 美元。 這張圖表有趣之處在於其「高點更低」結構的一致性。每次反彈都在買方建立有意義的趨勢反轉之前就遇到了阻力。 我特別關注 73.72 美元這一水平,因為它代表了 24 小時可見低點以及最近的重要支撐位。 如果賣方以令人信服的 4 小時 K 線收盤跌破該水平,現有的看跌結構可能會進一步增強動力。 然而,如果買方能守住該區域,仍有可能出現向移動平均線的反彈。 數據與證據 以下是所提供 Bybit 截圖中的重要數據: * 當前價格:73.89 美元 * 24 小時變化:-8.61% * 24 小時高點:81.04 美元 * 24 小時低點:73.72 美元 * 24 小時成交額:5824 萬美元 * 前次可見高點:91.59 美元 移動平均線顯示出明確的看跌排列: * MA7:76.95 美元 * MA14:78.92 美元 * MA28:81.43 美元 三條平均線均高於當前價格。 更重要的是,MA7 低於 MA14,而 MA14 低於 MA28。這種位置表明短期市場結構繼續有利於賣方。 成交量提供了另一個重要的觀察點: * 當前成交量:14.914 萬 * 成交量 MA5:12.635 萬 * 成交量 MA10:13.546 萬 當前顯示的成交量高於這兩條平均線。這表明在下跌過程中,交易活動依然高漲。 我不會自動將其解讀為持續的激進拋售,但結合看跌的價格結構,它值得注意。 我的解讀 我認為 SOL 正在接近一個關鍵的技術決策點。 73.72 美元的支撐位是我最密切關注的水平。 如果買方守住該區域,SOL 可能會嘗試反彈至 76.95 美元,隨後是 78.92 美元。然而,在任何反彈過程中,這些移動平均線可能會形成阻力。 另一方面,若 4 小時線確認跌破 73.72 美元,隨後回測失敗,將加強看跌延續的情境。 我對在當前價格追空不感興趣。我需要確認賣方確實能將現有的支撐位轉化為阻力位。 交易設置 SOL — 做空情境 看跌觸發條件:確認 4 小時 K 線收於 73.72 美元下方,並隨後回測失敗。 進場區間:73.40 美元 – 73.70 美元 止損:76.20 美元 TP1:72.00 美元 TP2:70.00 美元 TP3:68.00 美元 看漲失效:SOL 收復 78.92 美元,並在此阻力位上方建立持續的 4 小時強勢。 下行目標為預估值,因為這些較低的支撐位在所提供的截圖中不可見。 至 TP3 的潛在下行空間:約 7.4% – 7.7%。 設定風險:約 3.4% – 3.8%。 預估盈虧比:約 2:1。 該設置仍是有條件的,僅在支撐位跌破確認後才具有參考意義。 最終觀點:Solana 目前有趣之處在於「高點更低」持續出現、移動平均線看跌排列以及下跌期間交易活動增加的綜合影響。 下一個重要的發展將來自於 73.72 美元附近的市場反應。 如果買方成功守住該水平,反彈嘗試可能會挑戰附近的移動平均線。但如果賣方確立了確認性的跌破,市場可能會打開進一步下跌的大門。 目前,我正在觀察 SOL 能否維持其支撐位,還是賣方將建立一個新的更低交易區間。下一次 4 小時確認可能會提供關於哪一方正在獲得控制權的最明確跡象。$SOLUSDT #ByXIMPACT

$BBSOLUSDT — 賣方已將價格推至關鍵支撐區,但我更感興趣的是接下來反彈嘗試期間會發生什麼。 BybitSOL 的交易價格約為 88.42 美元,在從 107 美元區間大幅下跌後,跌幅達 8.60%。4 小時圖顯示持續的拋售壓力,買方難以實現有效的反彈。 最引人注目的是價格與移動平均線之間的背離。市場交易價格遠低於其趨勢指標,這表明賣方仍掌控局面。 4 小時圖結構揭示了什麼 目前的移動平均線數值為: MA7:90.79 美元 MA14:92.94 美元 MA28:95.75 美元 這三條均線均位於現價上方,呈現看跌排列。 另一個重要的觀察點是近期下跌過程中成交量的擴大。這表明隨著 BBSOL 下跌,交易活動有所增加。 價格目前正在逼近 88.14 美元區域,這代表了可見的 24 小時低點。 對我而言,這是一個重要的決策區。可能會出現暫時的反彈,但整體結構尚未顯示出令人信服的反轉確認信號。 我的市場展望 我傾向於看跌延續,特別是如果價格反彈至移動平均線阻力區且賣方再次進行防守的話。 92.94 美元至 95.75 美元的區域特別重要,因為它包含了 MA14 和 MA28 的阻力位。 我的下行路線圖: 88.14 美元 — 即時支撐位。 86.50 美元 — 第一個預測下行延伸位。 84.50 美元 — 擴展下行目標位。 下方的目標是預估值,而非圖表中已確認的支撐位。 我的交易訊號 方向:做空(條件式) 進場:在確認看跌拒絕後,於 92.80–94.00 美元區間進場。 止損:96.90 美元 TP1(止盈 1):88.14 美元 TP2(止盈 2):86.50 美元 TP3(止盈 3):84.50 美元 參考進場價:93.40 美元 至 TP3 的潛在下行空間:約 9.53%。 已定義風險:約 3.75%。 風險報酬比:約 2.54:1。 我希望看到價格回升至進場區間,並證明賣方仍在防守阻力位。如果價格繼續下跌而沒有進行回測,我不會追高。 什麼會使我的觀點失效? 若價格持續回升至 95.75 美元上方,這將是對我看跌觀點的重要警示。 如果買方奪回 MA28 並在 4 小時圖上創出更高的高點,目前的下行結構可能會開始減弱。 另一方面,若明確跌破 88.14 美元,可能會加強看跌延續的情境。 風險管理 BBSOL 已經經歷了大幅下跌,因此在當前價格追空帶有額外風險。 比起在重要支撐位上方直接進場,我更願意等待向阻力位回調的時機。 我的重點在於 92.80–94.00 美元的區域,以及價格到達該處時的表現。 目前,移動平均線對賣方有利,但下一次反彈嘗試將揭示買方是否有足夠的實力來挑戰當前的趨勢。 重要的問題不再是 BBSOL 下跌了多少,而是買方最終能否阻止賣方掌控每一次的反彈嘗試。$BBSOLUSDT #ByXIMPACT
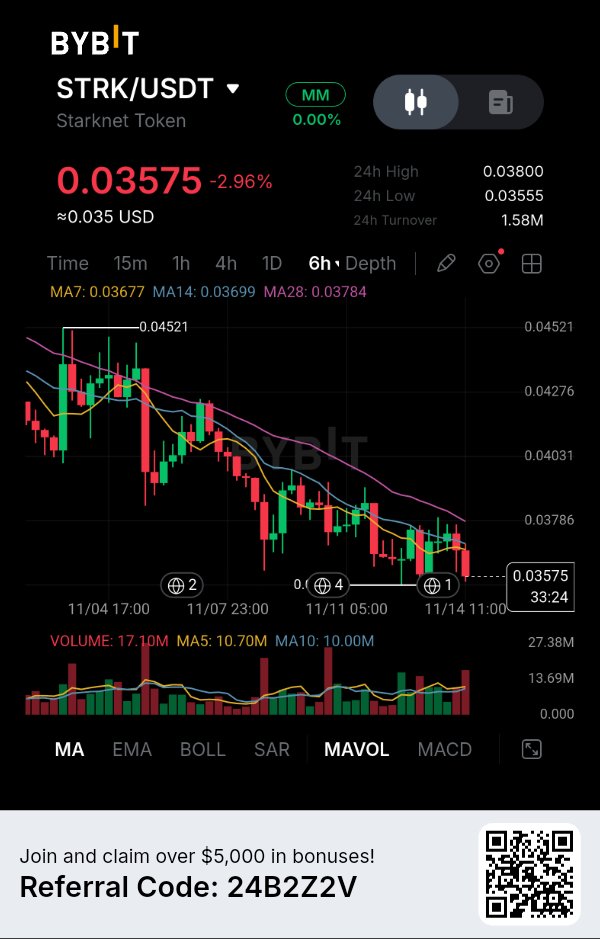
$STRKUSDT — Sellers are maintaining control, and the latest 6H candles suggest the recovery attempts are still struggling to gain traction. Starknet is trading around $0.03575, down 2.96%, and what concerns me most is the consistent sequence of lower highs forming across the chart. This isn't just a single red candle. The broader structure is showing persistent selling pressure. What the Chart Is Revealing Looking at the 6H timeframe, STRK has continued to lose ground after its rejection near the $0.04521 region. The moving averages are providing another important clue: MA7: $0.03677 MA14: $0.03699 MA28: $0.03784 Price is trading below all three averages, with MA7 beneath MA14 and MA28. This alignment suggests that sellers still have control over the current trend. Another detail worth watching is the $0.03555 area, which is close to the current price and represents the visible 24-hour low. If sellers break this support convincingly, another downside expansion could follow. My Market Outlook I'm leaning toward bearish continuation rather than an immediate reversal. However, I don't want to chase STRK at current support. My preferred opportunity would be a recovery into the moving-average resistance zone followed by a clear rejection. My downside roadmap: $0.03555 — First support target. $0.03480 — Next projected downside level. $0.03400 — Extended downside objective. The lower two targets are projections rather than confirmed support levels visible on the screenshot. My Trading Signal Direction: SHORT (conditional) Entry: $0.03690–$0.03740 after bearish rejection. Stop Loss: $0.03820 TP1: $0.03555 TP2: $0.03480 TP3: $0.03400 Reference Entry: $0.03715 Potential downside to TP3: Approximately 8.48%. Defined risk: Approximately 2.83%. Risk-to-Reward: Approximately 3.00:1. I want to see sellers defend the resistance zone before considering an entry. If price continues falling without a retest, I won't chase the move. What Could Invalidate My View? A sustained recovery above $0.03784 would be the first meaningful warning against my bearish thesis. If buyers reclaim the MA28 and establish higher highs, the current downward structure could begin losing strength. On the other hand, a decisive breakdown below $0.03555 would strengthen the continuation scenario. Risk Management STRK is approaching an important support area, so timing matters. Selling directly into support could expose a position to an unexpected rebound. I'd rather wait for a recovery and let the market confirm whether sellers are still defending the trend. For now, the moving averages and lower-high structure favor sellers. The important question is whether buyers can finally reclaim $0.03784 or whether another failed recovery will open the door to lower prices. $STRKUSDT #ByXIMPACT

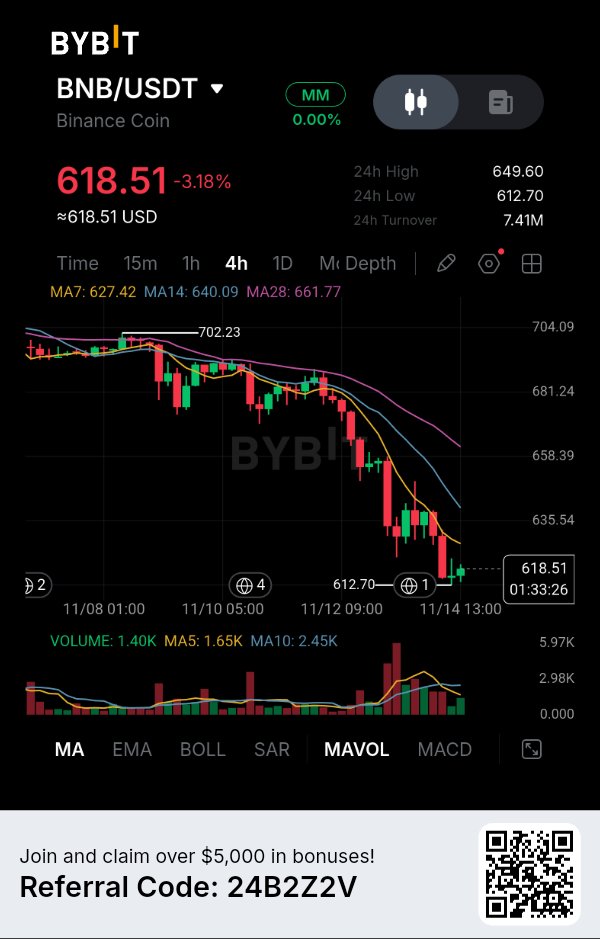
The $612 Support Is Becoming the Most Important Level on the Chart. BNB is down 3.18%, but what catches my attention is how consistently sellers have maintained control throughout the latest 4H decline. Every recovery attempt has struggled to regain momentum, while the moving averages continue pointing toward a weaker market structure. The interesting part is that BNB is now trading close to $612.70, its visible 24H low. This puts the market near an important decision point: either buyers defend this area or sellers gain another opportunity to extend the decline. THE MARKET STORY BNB is currently trading at $618.51, considerably below its three visible moving averages. What makes this situation interesting is the distance between the current price and the MA28 at $661.77. This shows how far price has moved away from its longer-term moving average on the displayed timeframe. I am particularly interested in whether the $612.70 support can survive another selling attempt. If it breaks, the market could enter another downward expansion. If buyers defend it, a temporary recovery toward the moving averages becomes possible. DATA & EVIDENCE Here are the important figures from the supplied Bybit chart: Current price: $618.51 24H change: -3.18% 24H high: $649.60 24H low: $612.70 24H turnover: $7.41M Previous visible high: $702.23 The moving averages reveal the current trend structure: MA7: $627.42 MA14: $640.09 MA28: $661.77 All three averages are positioned above the current price, with MA7 below MA14 and MA14 below MA28. This bearish alignment suggests that buyers have not yet established enough strength to reverse the prevailing 4H structure. Volume adds another detail: Current volume: 1.40K Volume MA5: 1.65K Volume MA10: 2.45K Current volume is below both averages. This means I would like to see stronger participation before treating a potential support breakdown as a convincing continuation signal. MY READ: I believe the most important level to watch is $612.70. BNB has already experienced a substantial decline from the visible $702.23 region, but the current chart does not yet show a convincing reversal structure. My concern for buyers is that price remains below all three moving averages. Even if BNB produces a short-term bounce, the $627–$640 region could become an important resistance area. I would not enter a SHORT position simply because the market is falling. I want to see a confirmed 4H breakdown below $612.70, followed by a failed attempt to reclaim that level. That would provide a more structured opportunity. TRADING SETUP BNB — SHORT Scenario: Bearish trigger: Confirmed 4H candle close below $612.70, followed by a failed retest. Entry Zone: $610–$613 Stop Loss: $628 TP1: $600 TP2: $588 TP3: $575 Bullish invalidation: BNB reclaims $640.09 and establishes sustained strength above this resistance. The downside targets are estimated projections because these support levels are not established on the visible portion of the chart. Potential downside to TP3: Approximately 5.7%–6.2%. Defined risk: Approximately 2.5%–2.9%. Estimated risk-to-reward: Around 2:1, depending on entry and execution. This setup remains conditional. If BNB holds $612.70, I would avoid chasing the downside. FINAL THESIS: What makes BNB interesting right now is the combination of bearish moving-average alignment and an approaching support test. The next meaningful signal will come from the reaction around $612.70. A confirmed breakdown could expose lower price levels, while a successful defense could force sellers to reconsider their positions. For now, I am more interested in whether sellers can convert this support into resistance than in predicting how low BNB might eventually go. $BNBUSDT #ByXIMPACT

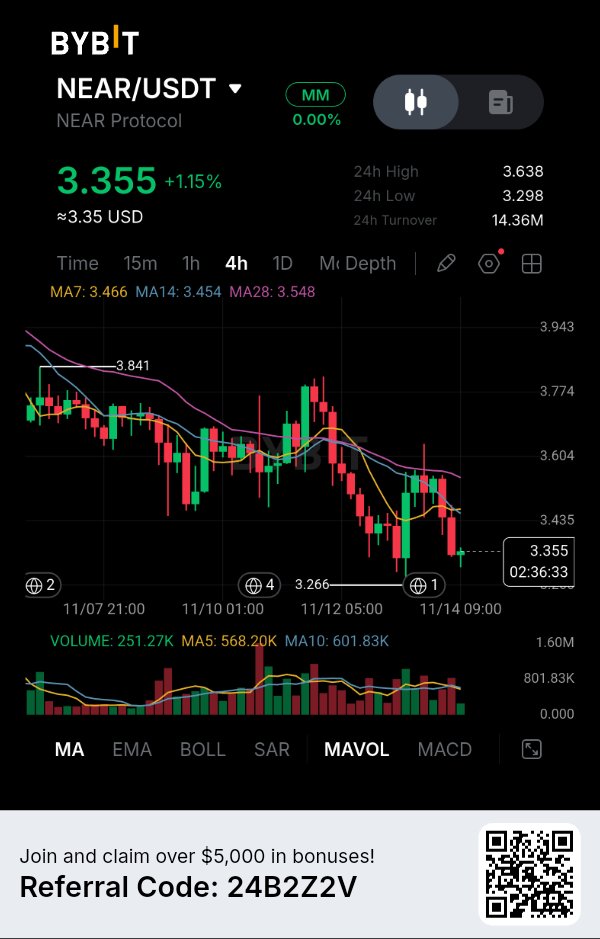
$NEARUSDT — Buyers are attempting to stabilize the price, but the 4H structure still shows sellers controlling the bigger picture. NEAR Protocol is trading around $3.355, up 1.15%, yet this small recovery hasn't changed the underlying technical structure. What interests me is the repeated failure to sustain moves above the moving-average cluster. The Market Structure I'm Watching NEAR has been forming lower highs after reaching the $3.84 region. Each recovery attempt has struggled to establish a stronger upward structure. The latest rejection near $3.60 has pushed price back toward the $3.35 area. Current moving-average readings: MA7: $3.466 MA14: $3.454 MA28: $3.548 Price is trading below all three averages. More importantly, the MA28 remains above the shorter averages, suggesting that the broader 4H momentum is still under pressure. There are two nearby support levels worth watching: $3.298 — Immediate support. $3.266 — Recent structural low. For me, the important detail is that buyers haven't yet demonstrated enough strength to reclaim the $3.45–$3.55 resistance region. My Market Outlook I'm leaning toward another downside test, provided sellers defend the moving-average resistance zone. A recovery into $3.45–$3.55 followed by a clear rejection could create an opportunity for bearish continuation. My downside roadmap: $3.298 — First support target. $3.266 — Previous structural low. $3.180 — Extended projected downside target. The $3.266 level is particularly important. If sellers break it convincingly, the market could start exploring lower prices. My Trading Signal Direction: SHORT (conditional) Entry: $3.46–$3.54 after bearish rejection. Stop Loss: $3.65 TP1: $3.298 TP2: $3.266 TP3: $3.180 Reference Entry: $3.50 Potential downside to TP3: Approximately 9.14%. Defined risk: Approximately 4.29%. Risk-to-Reward: Approximately 2.13:1. The entry requires a confirmed rejection from resistance. I don't want to chase the current price while it is already approaching support. What Could Invalidate My View? A strong 4H recovery above $3.548 would be the first warning against my bearish outlook. If buyers reclaim $3.60 and establish higher highs, the current selling structure could begin to weaken. On the other hand, a decisive breakdown below $3.266 would strengthen the bearish continuation scenario. Risk Management I'm watching NEAR carefully because the distance between current price and nearby support is relatively small. Selling directly into support would not offer the same opportunity as waiting for a resistance retest. My preference is to let price recover, watch how sellers respond, and execute only if the rejection is confirmed. For now, NEAR needs to prove that buyers can reclaim the moving-average cluster before I reconsider the broader bearish structure. The next important battle is around $3.45–$3.55. Will buyers finally reclaim control, or will another recovery attempt become an opportunity for sellers? $NEARUSDT #ByXIMPACT

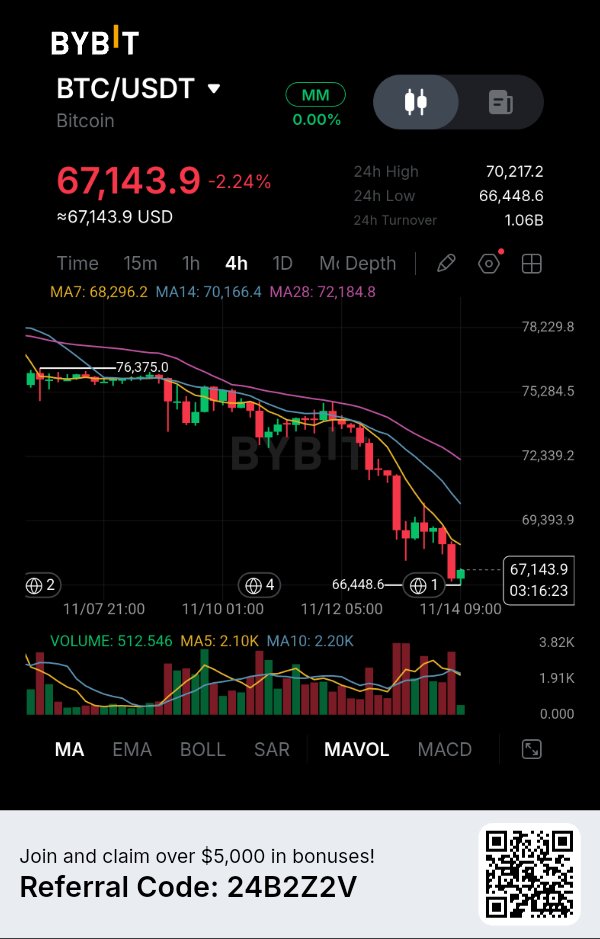
比特幣正接近關鍵支撐區,但買方尚未證明其實力。比特幣最新的 4 小時走勢顯示了一些我不容忽視的跡象:價格持續創下更低的高點和更低的低點,而每一次反彈嘗試都難以重新奪回有意義的阻力位。 有趣的是,BTC 目前的交易價格接近其 24 小時最低點 $66,448。買方雖嘗試小幅反彈,但整體技術結構仍面臨沉重壓力。 對我來說,這還不是一個令人信服的築底形態。這是一個正接近重要決策點的市場。# 為何重要 BTC 目前交易價格為 $67,143.9,下跌 2.24%。 有趣的是當前價格與其移動平均線之間的距離。比特幣的交易價格低於所有三條顯示的均線,這表明賣方繼續控制著 4 小時線的結構。 當價格在連續出現更低高點的過程中持續低於多條移動平均線時,我對於將小綠K棒視為真正的反轉趨勢會持謹慎態度。 因此,$66,448.6 區域顯得尤為重要。如果賣方跌破此支撐位並成功將其轉化為阻力位,可能會引發新一輪的向下擴張。 數據與證據 以下是 Bybit 截圖中可見的重要數據: 當前價格:$67,143.9 24 小時漲跌幅:-2.24% 24 小時最高價:$70,217.2 24 小時最低價:$66,448.6 24 小時成交額:$1.06B 移動平均線結構: MA7:$68,296.2 MA14:$70,166.4 MA28:$72,184.8 所有三條移動平均線均位於當前價格上方。 同時存在明顯的看跌排列:MA7 低於 MA14,而 MA14 低於 MA28。 這種排列反映出的是持續的下跌動能,而非已確立的復甦。 成交量面板提供了另一個細節: 顯示成交量:512.546 成交量 MA5:2.10K 成交量 MA10:2.20K 最新顯示的成交量低於這兩條均線。這意味著最新K棒中出現的小幅反彈,相較於近期的成交量均值,尚未展現出強勁的參與度。# 我的解讀 我將重點關注 $66,448.6,因為這是截圖中可見的最接近的重要支撐位。 若 4 小時線明確跌破該水平,隨後出現失敗的回測,這將提供更強有力的證據,表明賣方正在醞釀下一波下跌行情。 不過,我不會盲目地直接在支撐位做空(SHORT)。 如果買方成功守住 $66,448 並收復 $68,296,那麼看跌佈局的吸引力就會降低。 我傾向於等待確認,而不是預判尚未發生的跌破。 交易策略 BTC — 條件式做空(SHORT): 看跌觸發條件:確認 4 小時K棒收盤跌破 $66,448.6,隨後回測失敗。 入場區間:$66,300–$66,400 止損(Stop Loss):$67,250 止盈(TP)1:$65,500 止盈(TP)2:$64,500 止盈(TP)3:$63,500 無效條件:BTC 收復 $67,250 並在該水平上方建立持續的 4 小時強勢。 TP2 和 TP3 是估計的下行延伸目標,而非已確認的圖表支撐位。至 TP3 的盈虧比約為 2.9:1,具體取決於執行情況。此做空設置為條件式觸發,當前價格下尚未啟動。 最終觀點:比特幣目前的結構告訴我,市場尚未消化完賣壓。 移動平均線依然看跌,反彈嘗試相對疲軟,$66,448.6 現已成為一個重要的監測點。 我對追逐每一根紅K棒不感興趣。我想看看賣方是否能將此支撐位轉化為阻力位。 如果發生這種情況,BTC 可能會開啟通往更低價位的大門。如果買方守住該區域並收復短期移動平均線,那麼看跌觀點就需要重新評估。 就目前而言,最重要的發展是比特幣能否守住其最近的可見支撐位,或者賣方是否會強勢推動另一次跌破。$BTCUSDT #ByXIMPACT

$LITUSDT — The recovery is losing momentum near a critical moving-average cluster, and I'm watching whether sellers can turn this area into another rejection point. Lighter is trading around $3.2271, up 1.56%, but the latest 4H structure tells a more interesting story than the daily percentage gain. Price previously recovered from the $3.0031 low and rallied toward the $3.40 region. However, buyers have struggled to maintain that momentum, and the latest candles suggest the recovery is facing resistance. What the 4H Chart Is Revealing The current moving-average readings are: MA7: $3.2305 MA14: $3.2429 MA28: $3.2614 Price is currently trading below all three moving averages, with the shorter average also positioned beneath the longer ones. This alignment suggests that short-term momentum is still under pressure. Another important detail is the recent rejection near $3.40. Buyers attempted to push higher, but the market failed to sustain that move. I'm particularly interested in the $3.24–$3.27 region. If price revisits this area and sellers defend it, another downside move becomes possible. My Market Outlook The immediate support is around $3.1440. A breakdown below this level could expose the $3.0800 area, followed by the previous structural low near $3.0031. My downside roadmap: $3.1440 — First support target. $3.0800 — Second downside target. $3.0031 — Major structural low. For me, the key question is whether buyers can reclaim the moving-average cluster or whether sellers will use the next recovery attempt to regain control. My Trading Signal Direction: SHORT (conditional) Entry: $3.2400–$3.2600 after confirmed bearish rejection. Stop Loss: $3.4100 TP1: $3.1440 TP2: $3.0800 TP3: $3.0031 Reference entry: $3.2500 Potential downside to TP3: Approximately 7.60%. Defined risk: Approximately 4.92%. Risk-to-Reward: Approximately 1.55:1. I want to see sellers confirm their presence around the entry zone before considering this setup. I won't chase price if it drops directly into support. What Could Invalidate My View? A strong 4H recovery above $3.2614 would be the first warning against my bearish outlook. If buyers reclaim the $3.28–$3.40 region and establish higher highs, the current short-term weakness could turn into another recovery attempt. On the downside, a decisive break below $3.1440 would strengthen the bearish continuation scenario. Risk Management LIT is trading near an important decision area, so I don't want to confuse a temporary bounce with a confirmed trend reversal. My preference is to wait for a resistance retest and a clear rejection before entering. For now, the moving averages favor sellers, but the next reaction will matter more than the current price movement. The real battle is taking place around $3.25. Can buyers reclaim this zone, or will sellers turn another recovery attempt into a lower move? $LITUSDT #ByXIMPACT
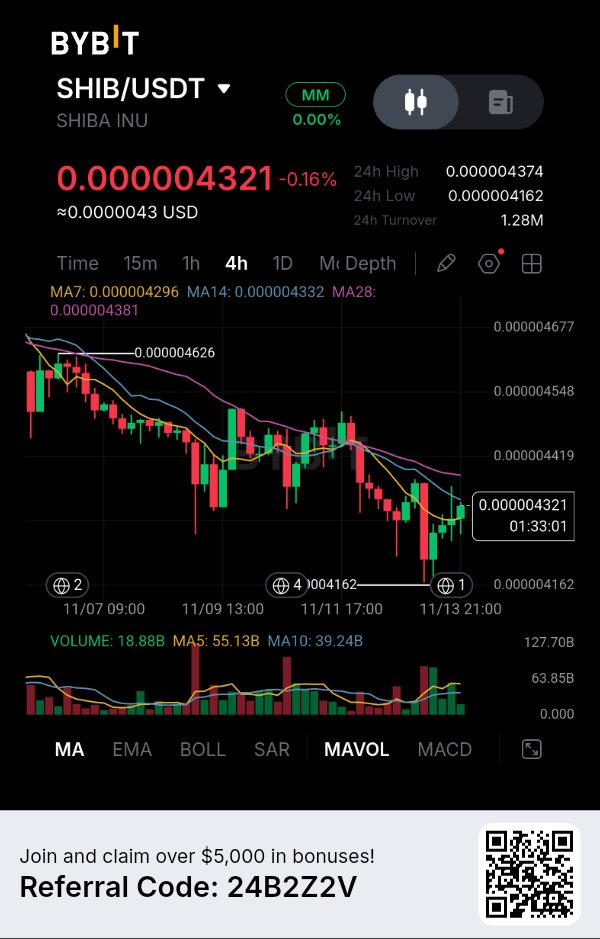
$SHIBUSDT: Is This Recovery the Beginning of a Reversal or Just Another Temporary Bounce? SHIB has managed to recover from its recent low, but the bigger picture is still presenting a challenge for buyers. What makes this setup interesting is that price has climbed back above the 7-period moving average while remaining below the 14-period and 28-period averages. I see an early attempt at stabilization, but not yet a confirmed change in trend. WHY THIS MOVE MATTERS The 4H chart shows that SHIB has been struggling with persistent selling pressure. Several recovery attempts have failed to establish a sustained upward structure. Now buyers are defending the $0.000004162 area and pushing price toward $0.000004374. The important question is whether this recovery can attract enough buying pressure to overcome the moving-average resistance above the current price. If it does, the market could begin developing a stronger recovery structure. If it fails, the recent bounce could become another lower high. MARKET DATA & EVIDENCE Here is what I can confirm from the supplied chart: * Current price: $0.000004321 * 24H change: -0.16% * 24H high: $0.000004374 * 24H low: $0.000004162 * 24H turnover: $1.28M * Volume: 18.88B Moving average structure: * MA7: $0.000004296 * MA14: $0.000004332 * MA28: $0.000004381 There are two details I find particularly important. First, SHIB has recovered above MA7, indicating some improvement in short-term price positioning. Second, MA14 and MA28 are still overhead. This means buyers have not yet reclaimed the resistance structure needed to establish a convincing reversal. Volume also requires attention. The displayed volume of 18.88B is below MA5 at 55.13B and MA10 at 39.24B. Therefore, the recovery has not yet demonstrated strong participation relative to those averages. MY READ I am focusing on the $0.000004381 resistance area. A successful 4H breakout above this region, followed by a defended retest, would give buyers a better opportunity to challenge the next visible resistance levels. However, I would not consider the current price sufficient confirmation for a LONG position. On the downside, $0.000004162 remains the critical support reference. Losing that level could expose SHIB to another downward expansion. My approach is to let the market confirm its direction before committing to a trade. TRADING SETUP SHIB — Conditional LONG Bullish trigger: A confirmed 4H close above $0.000004381, followed by a successful retest. Entry: $0.000004385–$0.000004405 Stop Loss: $0.000004330 TP1: $0.000004548 TP2: $0.000004626 TP3: $0.000004677 Bearish trigger: A confirmed 4H breakdown below $0.000004162. Bullish invalidation: Failure to hold the reclaimed $0.000004381 region. Targets are based on visible chart resistance levels. Approximate risk-to-reward to TP3 is around 2.7:1, depending on entry and execution. The setup is conditional and is not active at the current price. FINAL THESIS: I believe SHIB is approaching an important decision point. The recovery above MA7 shows that buyers are attempting to regain short-term control, but the remaining moving-average resistance makes this an incomplete recovery. For me, the real signal will come when SHIB can reclaim $0.000004381 with convincing buying participation. Until then, I would treat this movement as an early recovery attempt rather than a confirmed bullish reversal. The next 4H reaction around resistance could determine whether SHIB has enough strength to change its current market structure. $SHIBUSDT #ByXIMPACT