
KAZ_0
4047點贊0分享65粉絲31關注
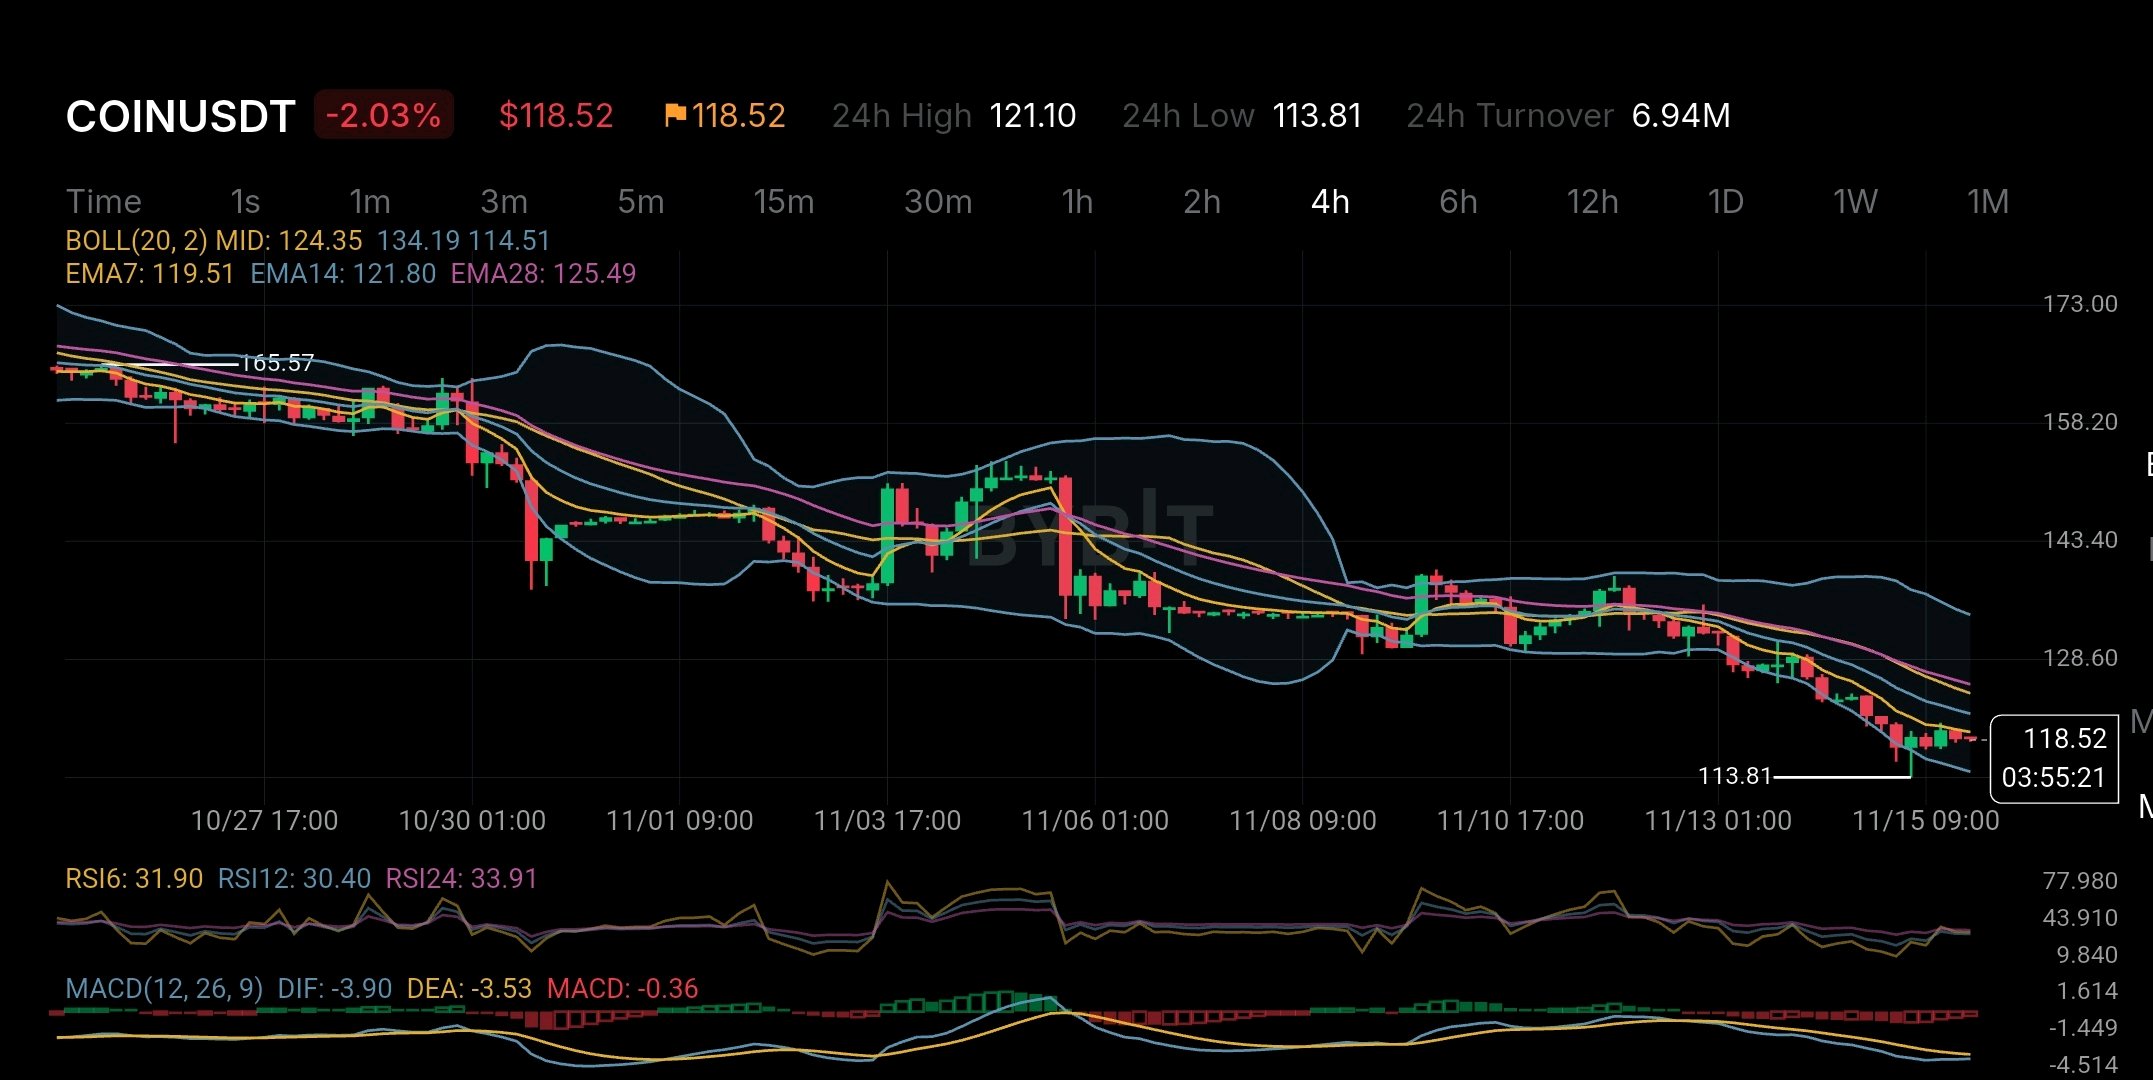
Coinbase 報告 2026 年第三季的淨利為 7.187 億美元。但這份獲利背後有一個投資人不該忽視的細節。 其調整後淨利僅為 7,770 萬美元。 其中的差異主要來自於持有以供投資的加密資產產生了 7.15 億美元的收益。這意味著帳面利潤看起來比該公司的調整後營運績效強勁得多。 還有另一個重要的細節。 Coinbase 在第三季創造了 12.2 億美元的營收,與去年同期相比下降了 35%。交易收入下降了 44%,至 5.902 億美元。 這顯示出即便 Coinbase 正擴展至其他業務,其對加密貨幣市場活躍度的依賴程度依然很高。 不過也有正面的一面。 訂閱與服務收入達到 5.702 億美元,約佔總淨收入的 49%。預測市場的年化收入也突破了 2 億美元。 這種多元化發展或許能讓 Coinbase 在加密貨幣交易活動放緩時更具韌性。 但股市並沒有忽視這些風險。 觀察 COINUSDT 的 4 小時圖表,價格在從 165 美元區域穩步下跌後,目前處於 118.52 美元左右。 價格正在 EMA7 (119.51 美元)、EMA14 (121.80 美元) 和 EMA28 (125.49 美元) 之下交易。 這三條移動平均線都指向賣壓。 RSI 讀數接近 30,顯示賣方已將市場推入超賣區域。然而,超賣並不自動意味著反轉即將到來。 MACD 指標也依然為負,意味著看跌動能並未明顯消退。 113.81 美元區域是一個需要關注的重要鄰近支撐位。如果買方能守住該區域,且價格重回 121.80 美元上方,市場可能開始出現復甦跡象。 另一方面,若明確跌破 113.81 美元,可能會開啟進一步下跌的大門。 交易者還需了解一件事:Bybit 上的 COINUSDT 是一種追蹤 Coinbase 股票的永續合約。它不提供實際的股票所有權、投票權或股息。 對我來說,最大的重點在於: Coinbase 正在建立加密交易以外的新收入來源,但其最新的財報顯示,帳面利潤仍可能受到加密市場收益的嚴重影響。 真正的問題在於,當加密市場不再提供助力時,其不斷增長的經常性業務是否足以支撐該公司。 #WSOT曬出你的AI交易即可贏取10USDT #ByXIMPACT
One thing about SUI that many investors may be missing is that more network activity doesn't always mean more value for the token. And this is something worth looking at. According to the latest available data Sui handled around 73.39 million transactions in 24 hours with nearly 70,268 active addresses. Its DeFi ecosystem also had around $363–375 million in TVL. These numbers look good but there is another side to the story. Daily network fees were reported at around $4,511 while applications on Sui generated about $55,000 in revenue. These are two different things but they raise an important question: If people are using the Sui network so much how much of that activity actually creates value for SUI holders? Sui has some strong technology behind it. It uses the Move programming language a unique object-based system and the Mysticeti consensus protocol to make transactions faster and more efficient. That's a clear advantage. But good technology alone doesn't guarantee a higher token value. For SUI holders the important thing is whether more network users will create more demand for the token through transaction fees staking and ecosystem growth. There is also the supply issue. SUI has a maximum supply of 10 billion tokens but not all of them are currently in circulation. More tokens will enter the market over time which could create selling pressure if demand doesn't grow enough. Looking at the 4-hour chart the situation is still weak. SUI is trading below EMA7 EMA14 and EMA28. MACD is also negative while RSI is around 35. This shows that sellers still have control. A recovery is possible but the chart has not confirmed a trend reversal yet. For me the biggest question about SUI is not how fast its network can process transactions. It's whether that growing activity can create real and lasting demand for the SUI token. A network can become popular but the real test is whether its token benefits from that popularity. $SUIUSDT #IMPACTbyTrade

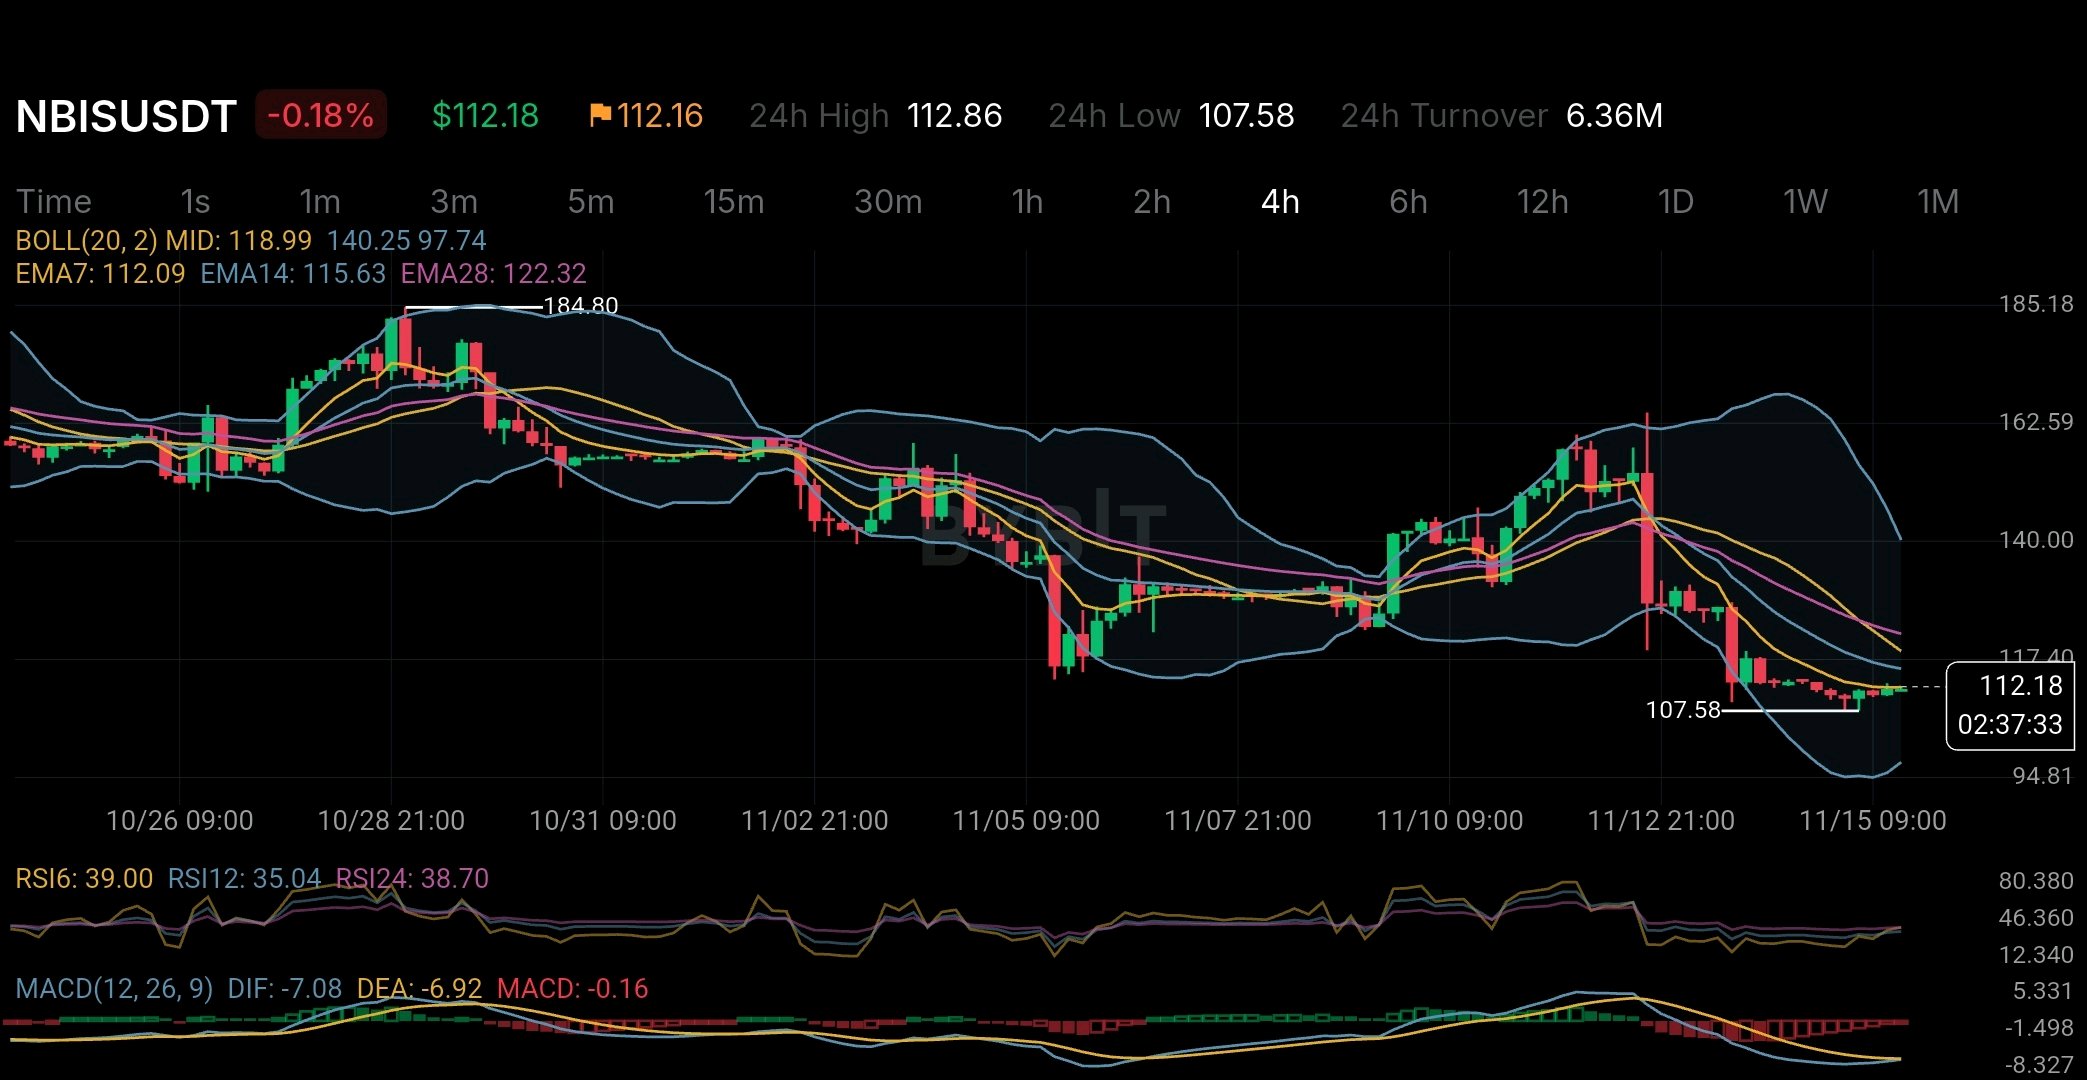
Nebius 剛公佈了 571% 的年營收增長。但其最新財報中的一個細節,比標題更值得關注。 並非所有增長都來自其傳統的 AI 雲端業務。 Nebius 報告 2026 年第三季營收為 9.808 億美元。其中約 3.25 億美元為來自其「輕資產」基礎設施合作夥伴模式初步推出的非經常性收入。 這就是為何此事至關重要。 在這種模式下,合作夥伴自行融資、擁有並營運資料中心。Nebius 則提供其基礎設施架構、軟體堆疊、硬體專業知識以及客戶關係。 這是一個有趣的戰略轉變。 Nebius 不再需要為每一台 GPU 和每一個資料中心提供資金,而是可以利用外部合作夥伴資助的基礎設施來擴展其全球 AI 雲端版圖。 潛在優勢相當巨大:在無需承擔全部資本負擔的情況下,獲得更多的計算能力。 但這個方程式還有另一面。 僅在第三季,Nebius 在物業、設備和無形資產上的支出就高達約 73 億美元。其九個月對這些資產的投資總額已達到約 154 億美元。 與此同時,第三季持續經營業務產生的營運現金流為負 2.73 億美元。 這在營收增長與財務可持續性增長之間劃下了一個重要的區別。 輕資產模式或許能隨著時間推移提高資本效率,但投資者仍需觀察它能產生多少經常性收入、這些合作夥伴關係能帶來多少獲利,以及客戶需求是否足以支撐所部署的基礎設施。 此外還有競爭挑戰。Nebius 與成熟的雲端巨頭以及 CoreWeave 等專業 AI 基礎設施供應商競爭。能否取得 GPU、電力、資料中心容量和融資,將決定誰能抓住下一階段的 AI 需求。 市場圖表增加了另一個維度。 在 11 月 15 日的快照中,NBISUSDT 在四小時時間框架內交易價格約為 112.18 美元。價格仍低於 14 和 28 EMA,且 RSI 讀數在 35 左右,顯示動能疲軟。MACD 也略顯負值。 這並未形成反轉訊號。它顯示市場情緒尚未跟上該公司報告的增長幅度。 一個重要的澄清:Bybit 上的 NBISUSDT 是追蹤 Nebius Group 股票的 USDT 本位永續合約,而非具有獨立區塊鏈代幣經濟學的傳統加密貨幣代幣。 圍繞 Nebius 的真正問題不在於 AI 基礎設施需求是否存在。 而在於該公司能否在擴張成本成為比增長本身更大的問題之前,將巨大的需求和投資轉化為持久且可獲利的現金流。 ByXIMPACT
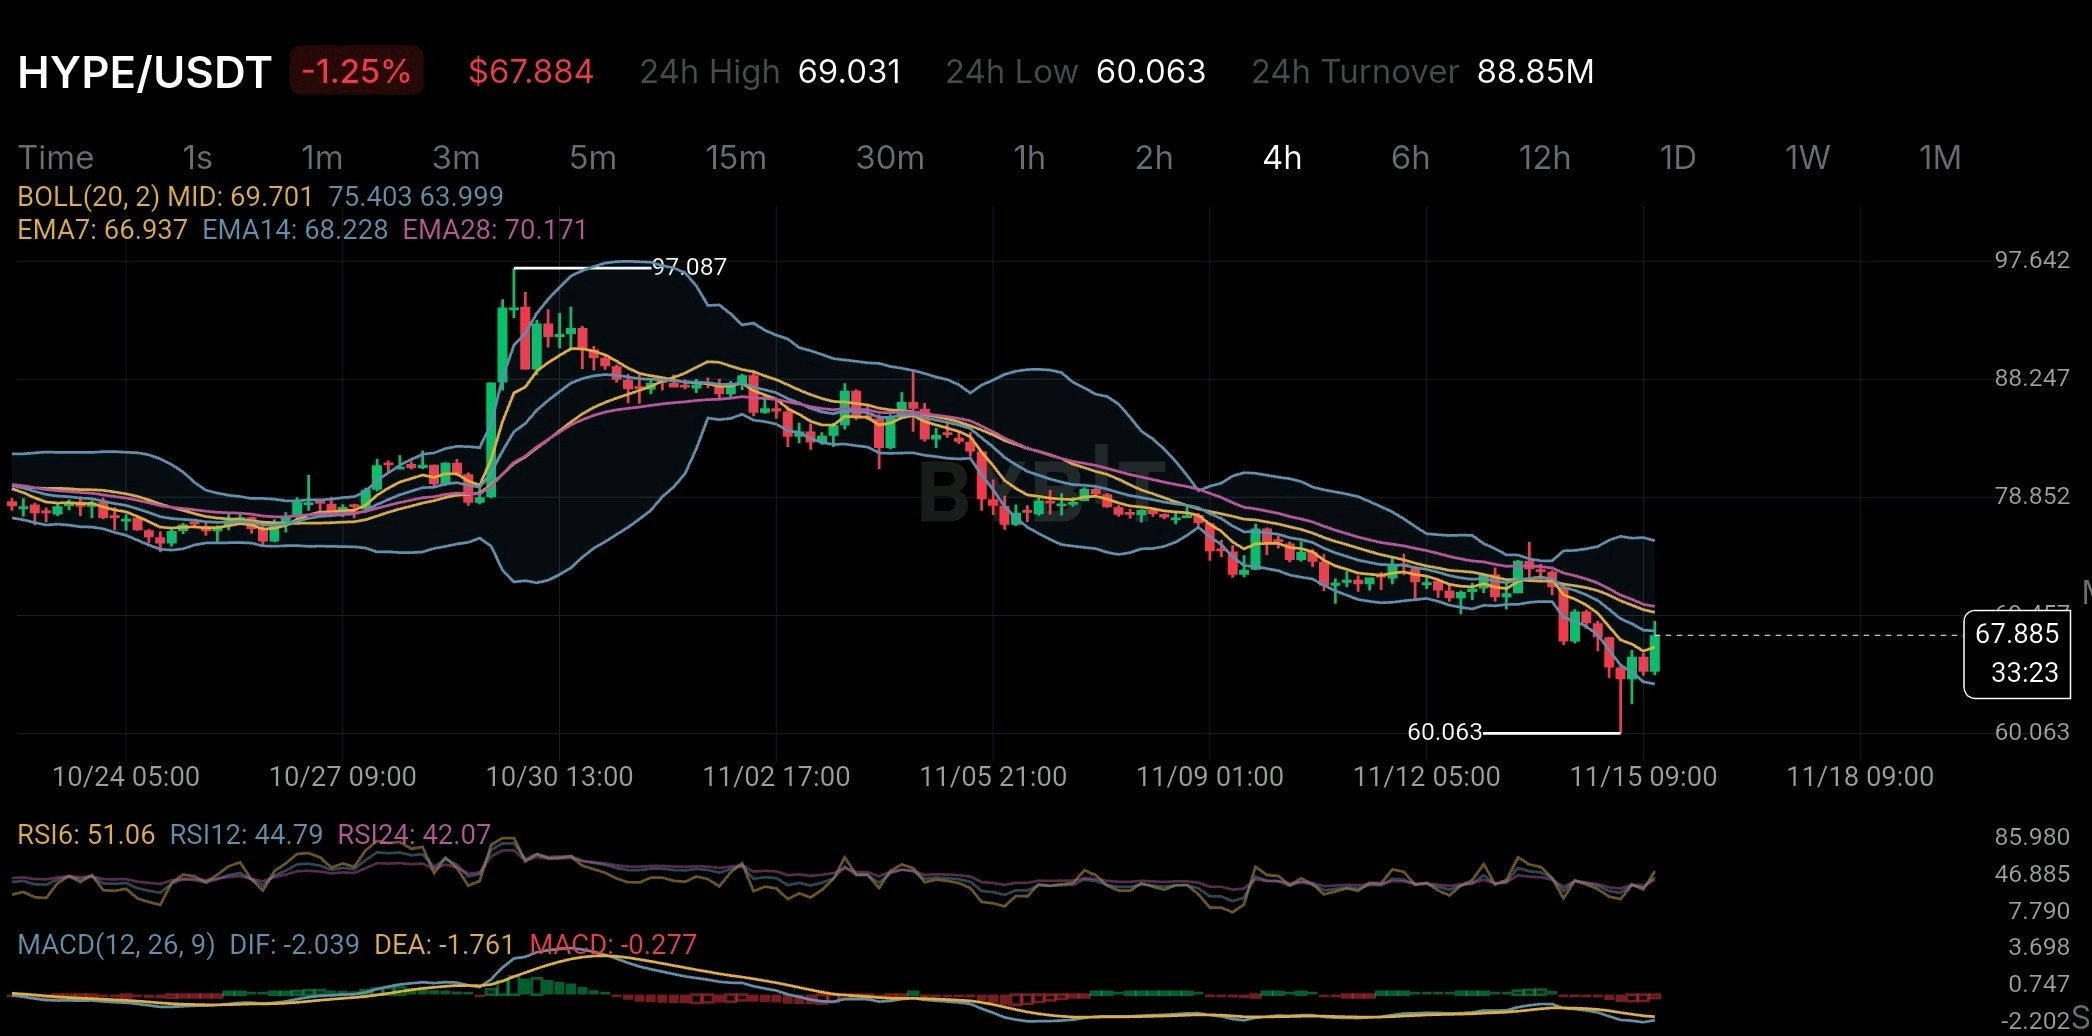
HYPE has something that many crypto tokens don't: a system that uses trading fees to buy HYPE tokens and burn them permanently. But despite this system the price has still dropped from around $97 to $60 on the 4-hour chart. This is something worth looking at more closely. One of the most interesting parts of Hyperliquid is its Assistance Fund. According to its official documents trading fees are used to buy HYPE tokens through this fund. The tokens collected are then permanently burned. The numbers are important. A September 2026 SEC filing reported that 99% of protocol fees went to the Assistance Fund. By September 8 around 47.1 million HYPE tokens had been bought and permanently removed from circulation. That's equal to 4.7% of the original supply. This connects the platform's trading activity directly to HYPE demand. More trading can generate more fees. More fees can mean more HYPE purchases and fewer tokens in circulation. But there is one important thing to understand: Token burns do not guarantee a higher price. They create buying demand but they cannot stop the price from falling. If investors sell more HYPE than the fund buys the price can still go down. Market conditions liquidity and investor sentiment also play a major role. The chart shows this clearly. HYPE recently dropped to $60.063 before recovering to around $67.884. However the price is still below EMA14 at $68.228 and EMA28 at $70.171 on the 4-hour chart. MACD is also still negative which means the overall downward trend has not clearly ended. The recent recovery is a positive sign but it is too early to call it a trend reversal. For investors the most important thing is not just how many HYPE tokens are burned. What matters is whether the demand created by real platform activity can become stronger than the selling pressure. HYPE has an interesting advantage because its token demand is connected to actual platform activity rather than depending only on hype. But even a strong token-burning system cannot guarantee a higher market price. The real challenge for HYPE is simple: Can actual platform demand become stronger than the pressure from people selling their tokens? $HYPEUSDT #ByXIMPACT

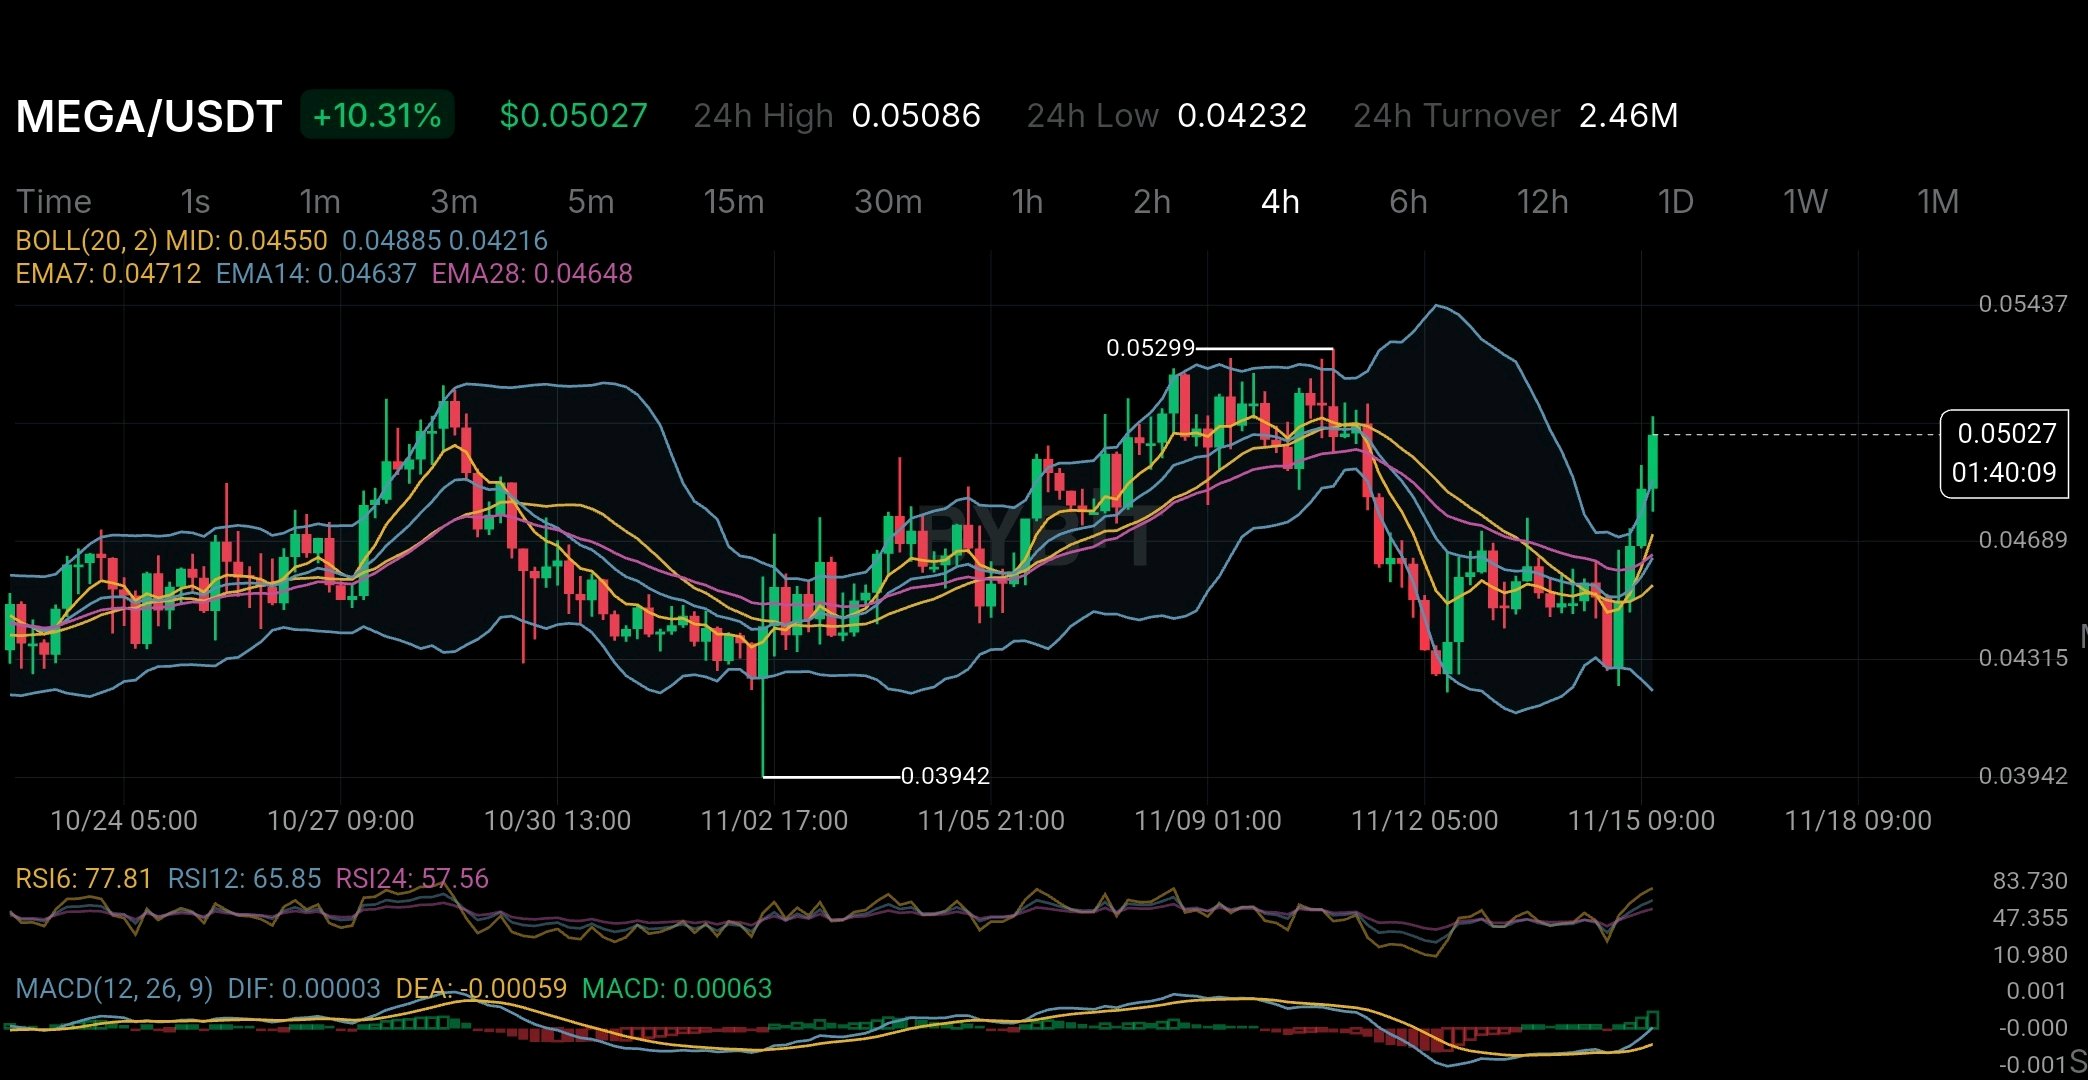
MEGA 上漲了 10.31%,但幕後發生的事情比價格上漲更值得關注。 MegaETH 似乎正在改變其計畫。 11 月 10 日,團隊宣佈投資 3000 萬美元的國庫資金用於開發新產品。第一個大型項目是一個去中心化 AI 市場,預計將於 12 月推出。 這個概念很簡單。開發者不再只能使用單一 AI 提供商,而是可以在不同的提供商之間進行選擇,並比較它們的價格、速度和效能。 但這裡有一個值得玩味的地方。 MegaETH 最初的主要目標是建立一個快速的以太坊 Layer 2 網路。現在,團隊想要做的不僅僅是構建區塊鏈技術,還希望在該網路之上創造有用的產品。 那麼,為什麼會發生這種變化呢? 有一些數據值得關注。 根據 CoinDesk 11 月 14 日的報導,MegaETH 的 DeFi TVL(總鎖倉價值)已從之前超過 2.45 億美元的高點跌至約 880 萬美元。 這是一個巨大的跌幅。這顯示該項目仍需吸引更多的用戶和資金進入其生態系統。 另一個重要的更新是在 11 月 13 日,當時 MEGA 宣佈裁員 20%。這些變動影響了致力於區塊鏈開發、錢包和生態系統支援的團隊。 這並不意味著該項目正在失敗,但確實表明團隊正在調整其優先事項。 MEGA 的代幣供應量也值得觀察。 根據其官方代幣分配資訊,約 53% 的總供應量被預留用於基於 KPI 的獎勵。 簡單來說,代幣的分發是基於網路實現特定目標的情況,而不是僅僅遵循固定的發放時間表。 這種方法將代幣獎勵與生態系統的成長掛鉤。 然而,投資者應該理解一點。 一個成長中的項目並不總是意味著代幣會更有價值。 HODL MEGA 並不直接賦予投資者公司所有權,也不保證他們能分享公司營收。 考慮到團隊正在轉向 AI 領域,這一點變得更加重要。 現在讓我們看看 4 小時圖。 MEGA 目前交易價格在 0.05027 美元左右,漲幅為 10.31%。價格已突破 0.04885 美元的布林通道上軌,而 RSI6 指數為 77.81。 MACD 也已轉為正值,顯示買盤動能正在增強。 但有一點需要小心。RSI 已經處於高位,因此在經歷這波強勁走勢後,價格可能會面臨回調。 對我來說,真正的故事不僅僅是 AI 概念或今天的價格上漲。 而是 MegaETH 是否能將其新計畫轉化為實際的用戶和活動。 AI 市場可能會為該項目開啟新的成長機會。但真正的考驗將是這種成長是否也能為 MEGA 持有者創造真正的價值。 一個強大的項目需要的遠不止是一個好點子,它需要人們真正看得見的成果。 $MEGAUSDT #IMPACTbyTrade
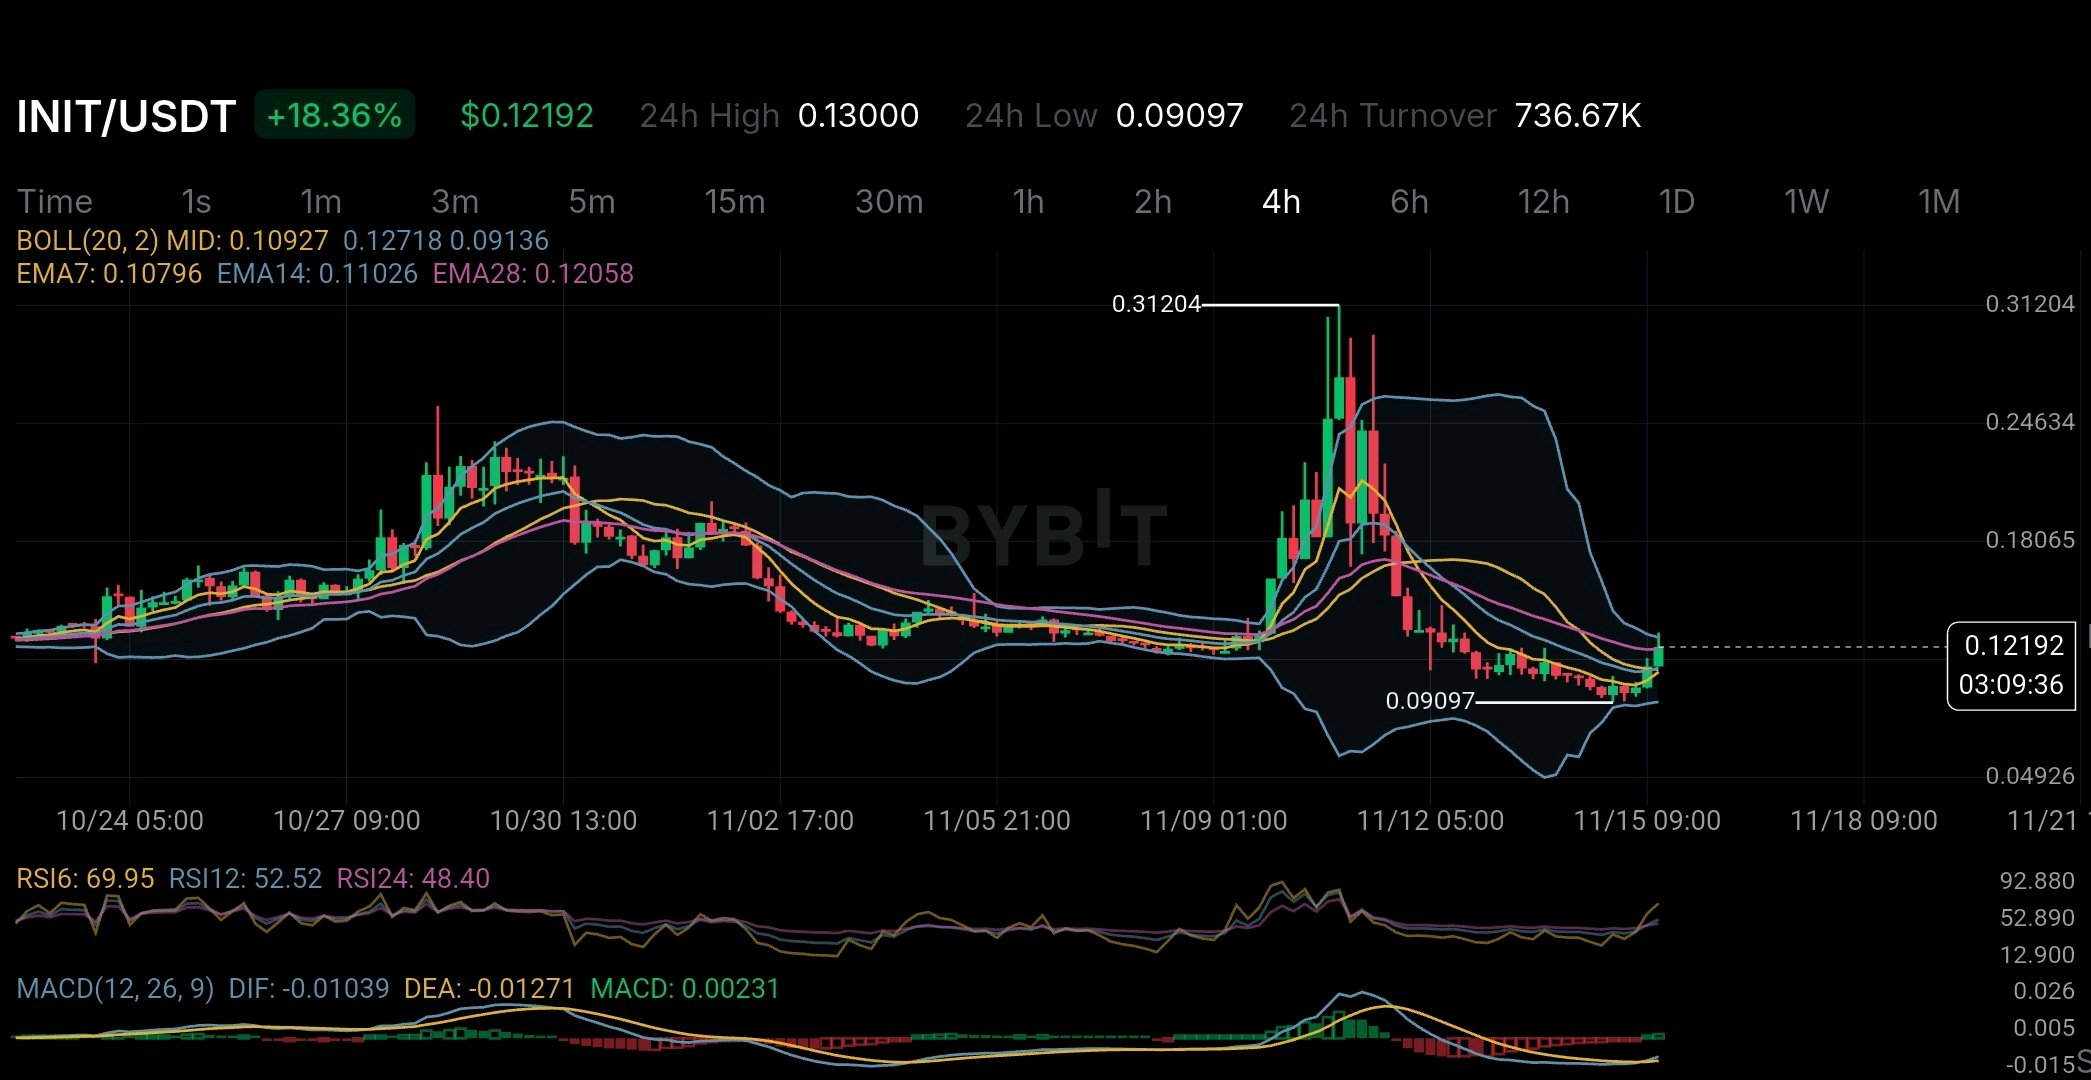
INIT is up 18.36% on the 4H chart but there is something important happening with its token supply. The main thing to understand is that unlocked tokens and tokens actually available in the market are not always the same. Here is the bigger concern. According to DefiLlama's November 10 analysis around 96 million INIT tokens were already vested but were not included in the circulating supply. It also reported an annual inflation rate of 57.28%. There is another thing worth watching. DefiLlama's market data showed average futures trading volume of around $90.5M compared to only $19.9M in spot volume. Open interest was also close to 77% of market cap. Funding was negative which means short traders were paying long traders. This makes the current rally interesting. The price could be rising partly because short traders are closing their positions rather than because of strong buying in the spot market. On the 4H chart INIT has moved above its EMA levels and MACD has turned positive. But RSI6 is already close to 70 which means the short-term move may be getting overheated. I would like to see stronger spot buying before trusting this recovery. A price pump is one thing. Keeping that price strong while more tokens enter the market is a completely different challenge. The big question is whether INIT can maintain this momentum when supply pressure increases. $INITUSDT #IMPACTbyTrade
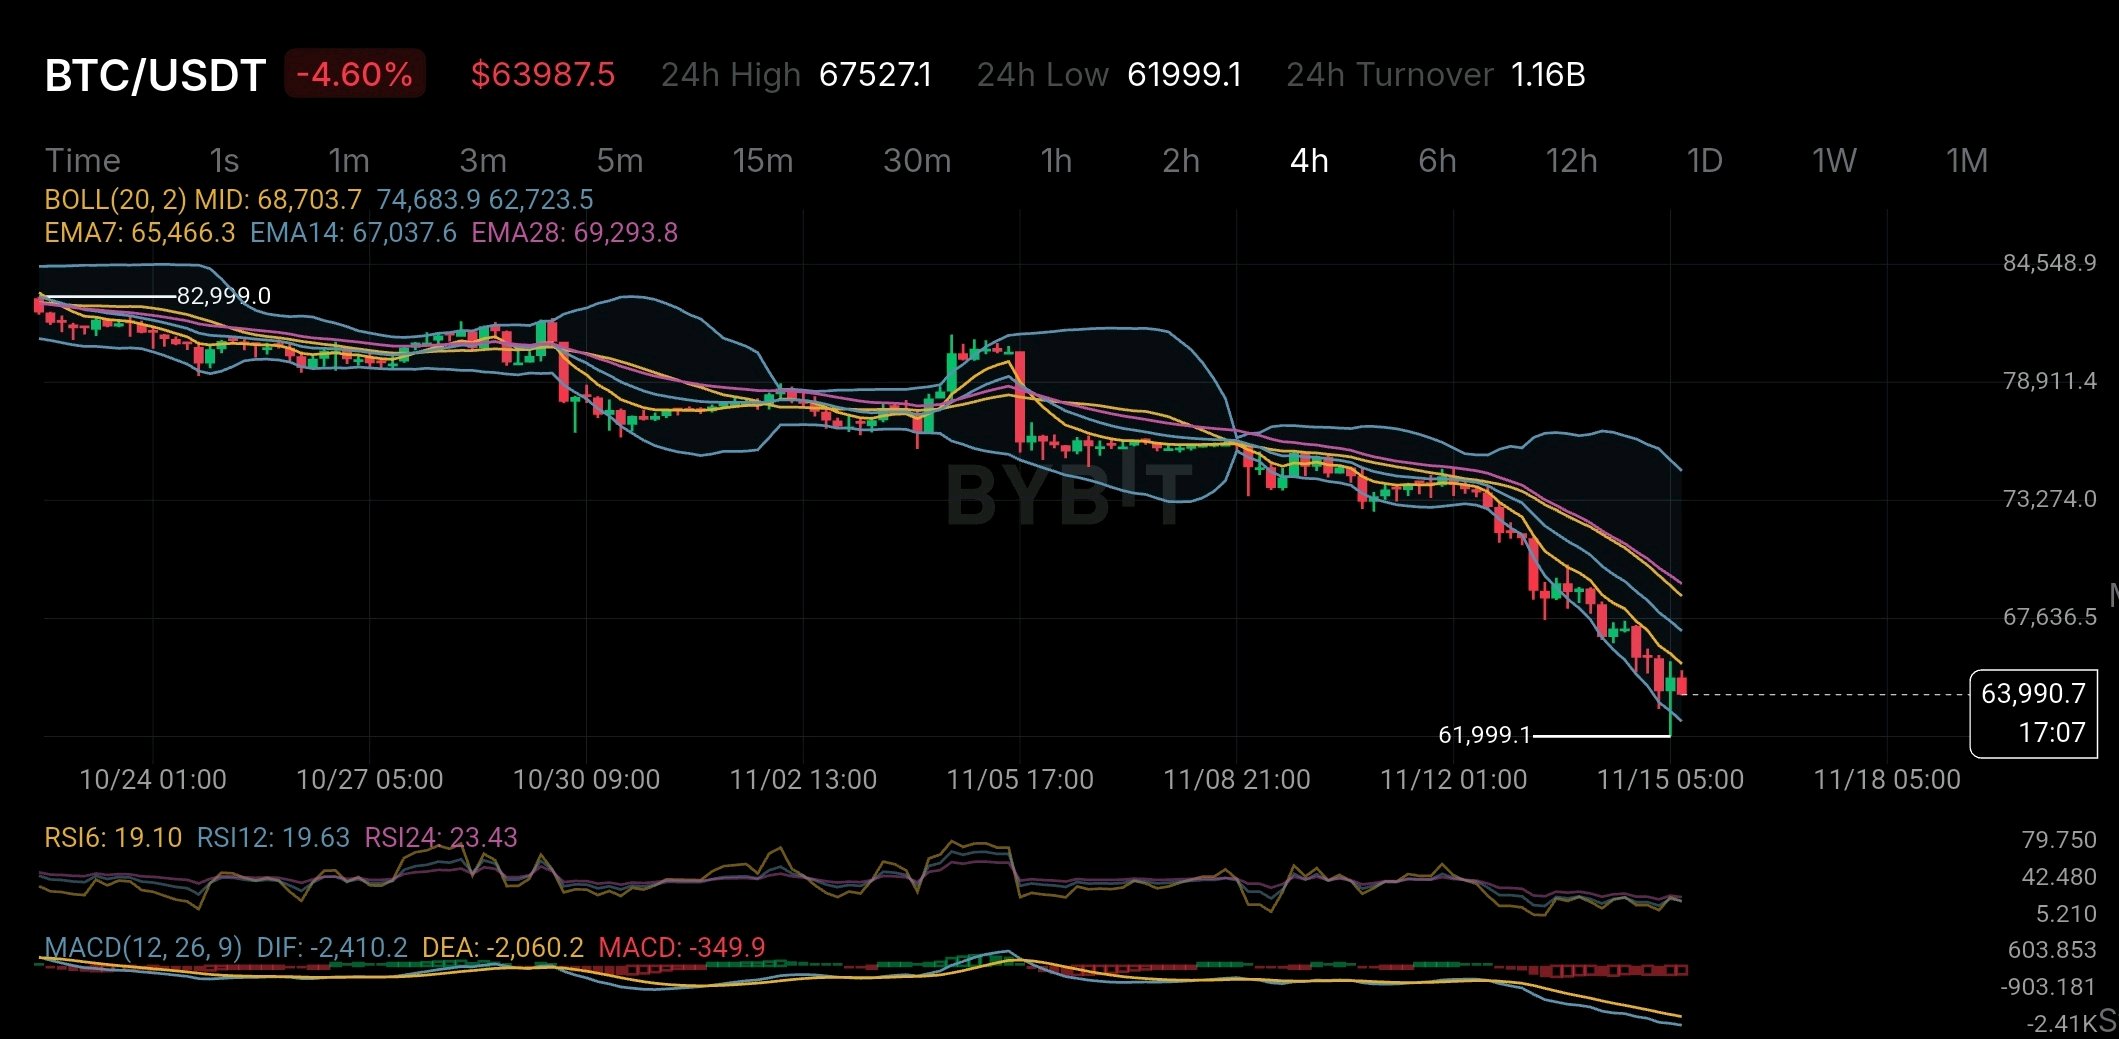
Bitcoin is showing more weakness than a normal price drop. What worries me is how quickly buyers have lost control on the 4-hour chart. BTC is trading around $63,987 after dropping nearly 4.6%. It also recently touched $61,999. One thing I noticed is that all the momentum indicators are looking weak. RSI is around 19–23 and BTC is trading below the 7 14 and 28 EMAs. MACD is also showing negative momentum. This tells me that sellers are still in control. But the very low RSI also makes me think about one thing. Are sellers getting tired or is another drop coming? For me the bigger concern is not just the chart. It is the demand from big investors. US spot Bitcoin ETFs have seen around $2.3 billion in money flowing out during November so far. Nine out of the first ten trading sessions were negative. Another important detail is that the crypto market saw around $1.64 billion in liquidations within 24 hours on November 13. Most of these losses came from traders who were using leverage to bet on higher prices. So this drop is not only about weak chart signals. A stronger US dollar and expectations of higher interest rates are also putting pressure on risky assets like Bitcoin. The main level I am watching is $61,999. If BTC breaks below this support with strong selling pressure then we could see another move down. But if buyers defend this level and BTC starts moving back above the short-term EMAs then a recovery bounce could happen. I also think the low RSI is worth watching. It could lead to a quick bounce but it does not mean the bottom is confirmed. Bitcoin still has a maximum supply of 21 million coins. Its block reward is also 3.125 BTC after the 2024 halving. But there is one important thing to understand. Limited supply does not guarantee higher prices when buyers are not coming into the market. That is what I am watching right now. Bitcoin's long-term supply has not changed but demand in the short term is getting weaker. The big question is whether buyers will step in around $62K or whether Bitcoin needs another drop before finding a stable bottom. $BTCUSDT #IMPACTbyTrade
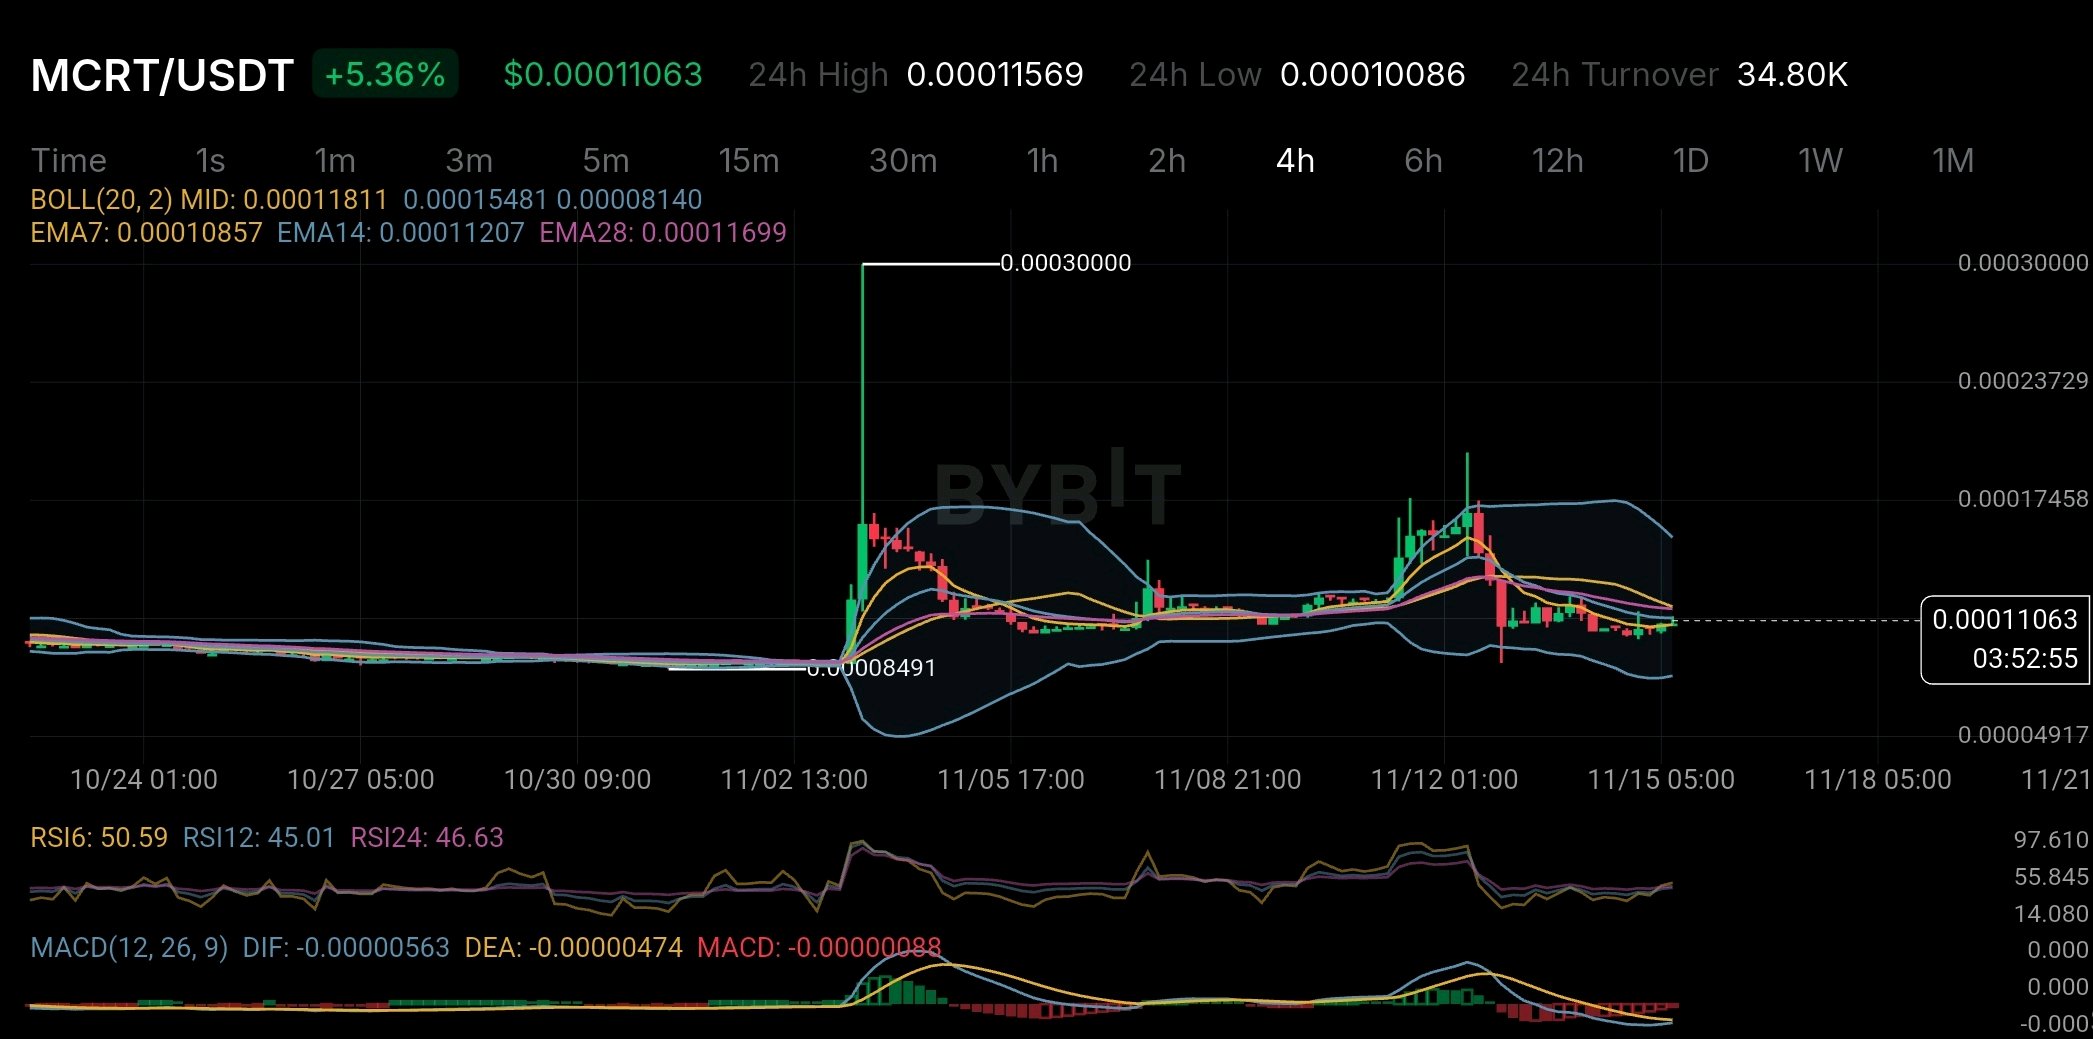
MCRT 在 4 小時圖上顯示出一些復甦跡象,但我仍不確定買家是否已完全掌控局面。 目前價格在 5.36% 的漲幅後約為 $0.00011063。但在我變得過於看漲之前,還有幾件事想觀察。 有一點引起了我的注意,那就是代幣供應量。 MagicCraft 的最大供應量為 100 億枚 MCRT。根據其官方代幣經濟學,並沒有代幣銷毀機制。 約 43.5% 的供應量預留給了遊戲和生態系統增長,另外 12% 則分配給了質押獎勵。 這意味著未來代幣的釋放和實際需求值得密切關注。 我還注意到流通供應數據存在巨大差異。官網預計到 2026 年 10 月流通量約為 84 億枚 MCRT,而 CoinGecko 顯示流通代幣約為 50.38 億枚,總供應量為 72 億枚。 這些數據可能來自不同的報告方法,但這個差異仍然值得關注。 現在看圖表,MCRT 仍低於 EMA14 和 EMA28。布林通道中軌約在 $0.00011811。 RSI 處於中性附近,MACD 仍為負值。目前這看起來更像是價格試圖穩定下來,而非明顯的趨勢反轉。 我正在關注 $0.000112-$0.000118 的區間。MCRT 需要移動到該區域上方才能展現出更好的強勢。 在下行方面,$0.000100 是值得關注的重要支撐位。 就我個人而言,我希望看到買家將價格推升至移動平均線上方,然後才會變得更有信心。 出現綠色蠟燭固然是好事,但更大的問題是來自遊戲的實際需求能否長期支撐代幣。 $MCRTUSDT #IMPACTbyTrade
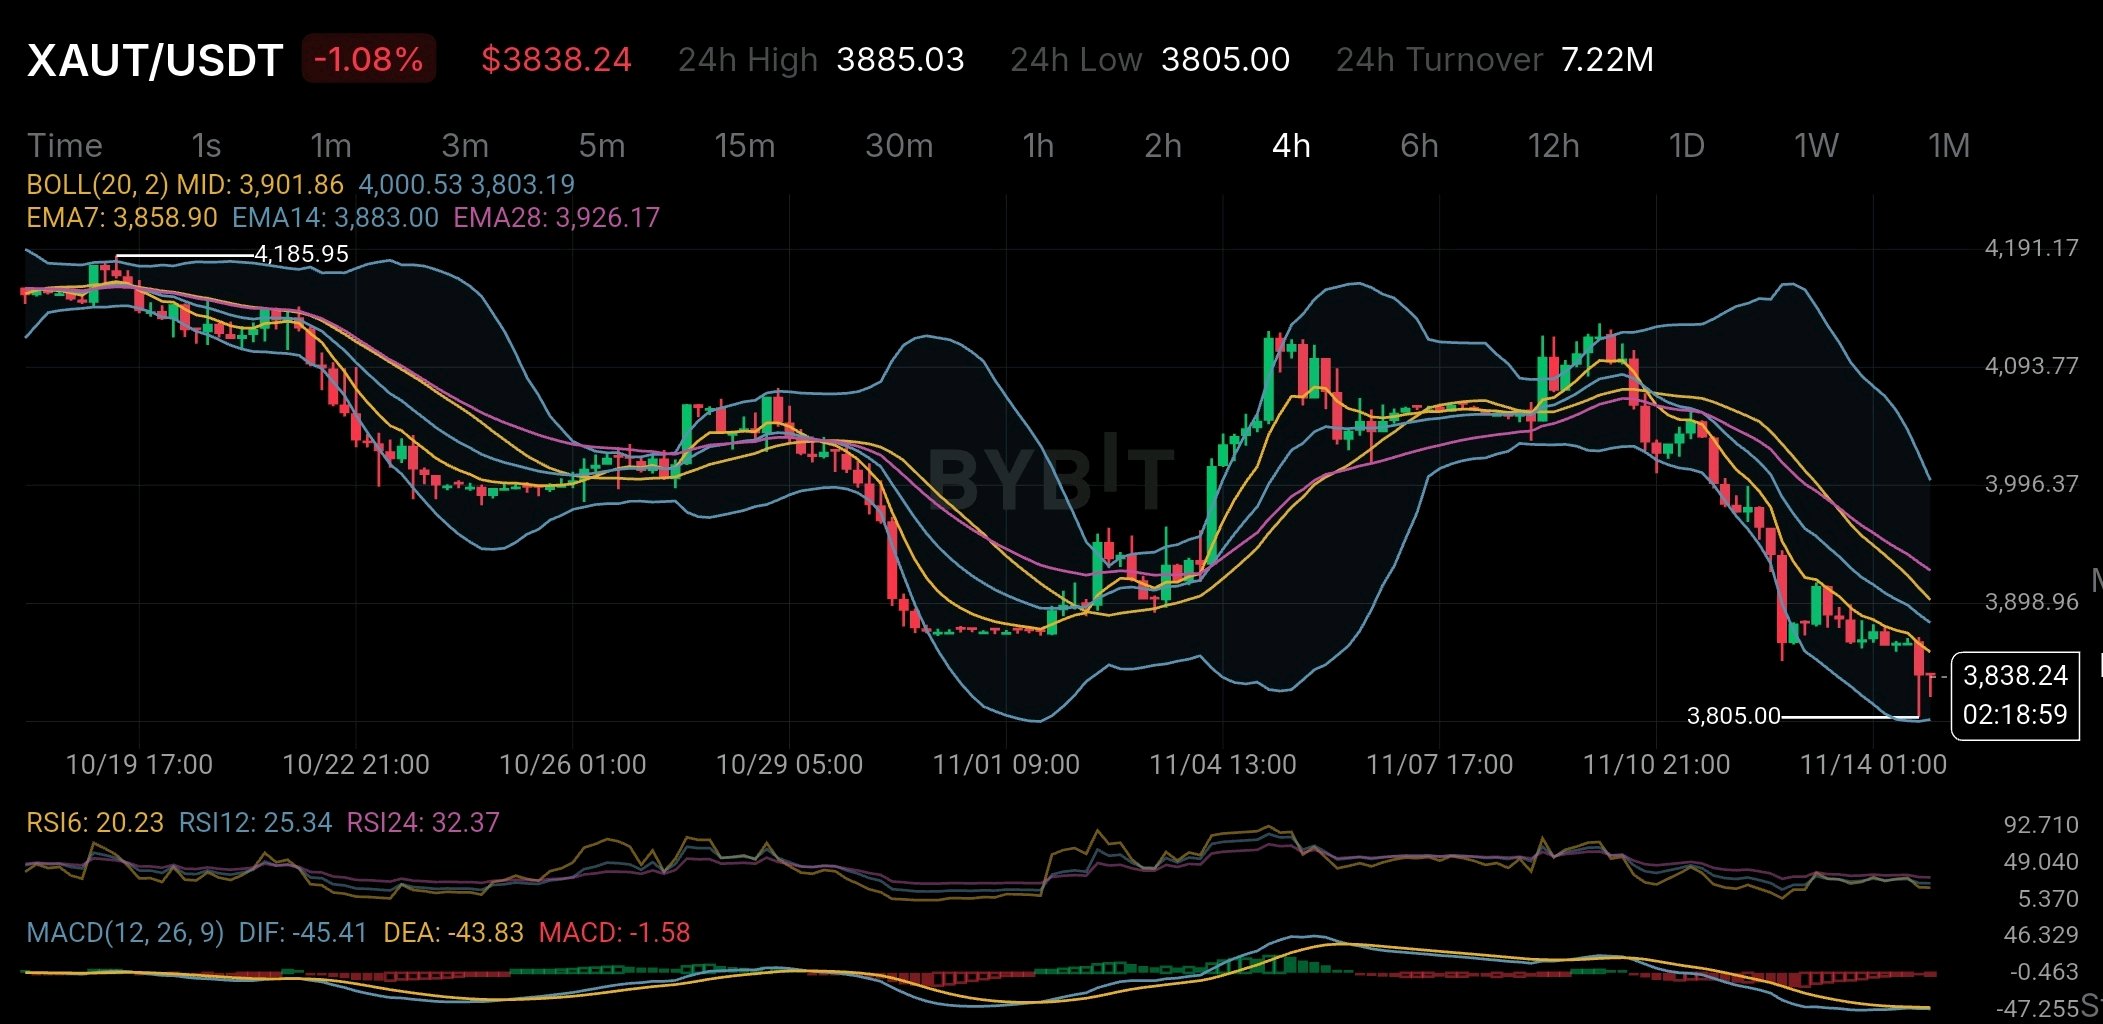
One thing I find interesting about XAUT is that its gold backing isn't the only thing investors should be looking at. I've been studying Tether Gold and there's a detail in its reserve figures that caught my attention. According to the September 30 2026 reserve report Tether had minted 827417.63 XAUT backed by the same amount of physical gold in fine troy ounces. But here's something worth looking at. Out of those tokens 709323.66 had already been sold while 118093.97 were held by a related entity and listed as available for sale. That's roughly 14.3% of the minted supply. I don't see this as an immediate red flag because those tokens are also covered by the reported gold reserves. Still I think it's important to understand the difference between total minted supply and the amount already circulating in buyers' hands. There's also something else people don't always consider. Owning XAUT doesn't mean you can easily walk in and collect physical gold whenever you want. Redemption comes with KYC requirements fees and delivery arrangements in Switzerland. So there's a bit more to owning tokenized gold than simply holding a token in your wallet. Now looking at the 4H chart XAUT is trading around $3,838.24 and the short-term picture isn't looking very strong. Price is sitting below EMA7 at $3,858.90 EMA14 at $3,883 and EMA28 at $3,926.17. RSI6 is around 20.23 which shows heavy selling pressure while MACD is still negative. The $3,805 level is the support I'm keeping an eye on. If buyers step in around this area we could see some recovery. But I don't want to call it a trend reversal until price starts moving back above the EMAs. Personally I still find XAUT an interesting way to get gold exposure through blockchain. But I wouldn't look at gold backing alone when evaluating it. Supply liquidity and the actual process of redeeming physical gold matter just as much. That's the part I think investors should pay more attention to. $XAUTUSDT #ByXIMPACT

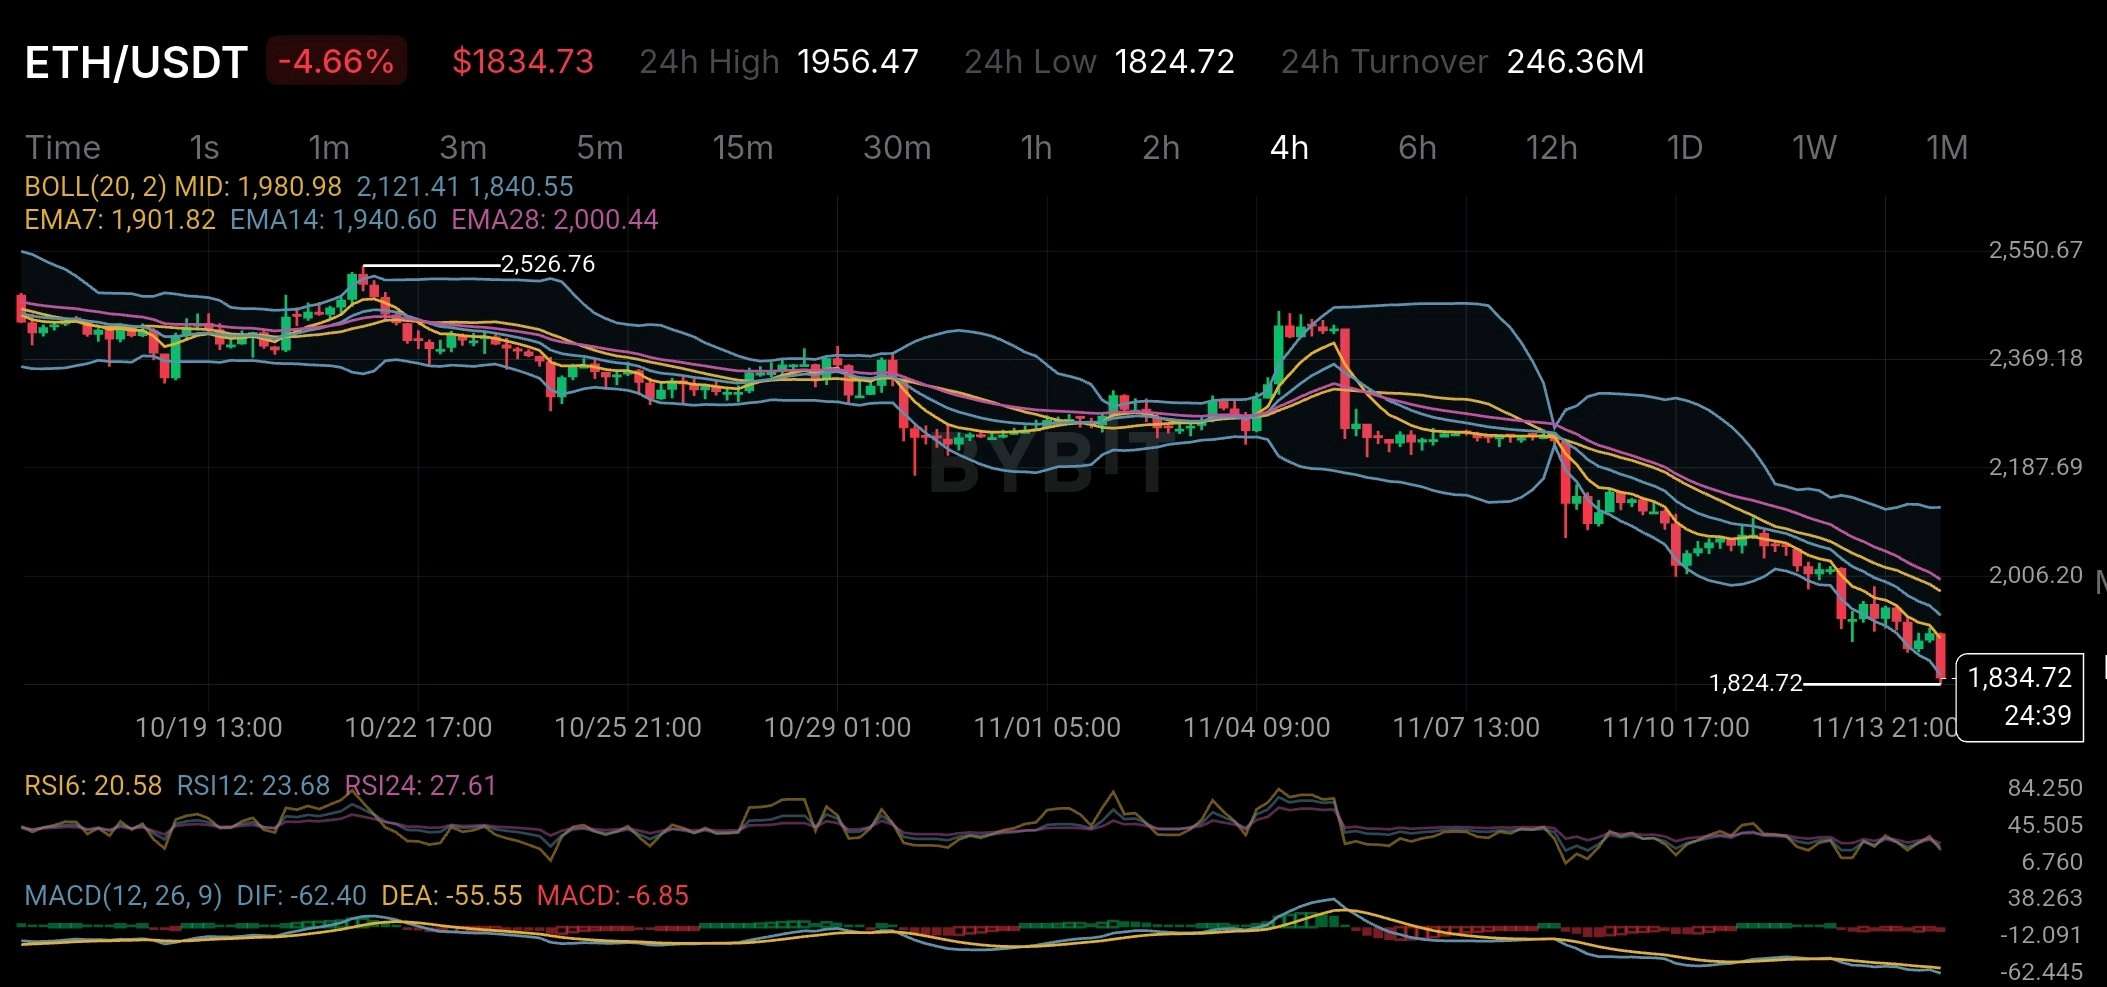
以太坊 (Ethereum) 在 4 小時圖上看起來嚴重超賣,但在確認觸底之前,交易者仍需謹慎。 ETH 目前交易價格約為 1,834 美元,整體趨勢仍指向下跌。 觀察移動平均線:EMA 7 為 1,901 美元,EMA 14 為 1,940 美元,EMA 28 約為 2,000 美元。價格目前低於這三條線。 這顯示賣方仍掌控市場,且市場尚未出現明確的趨勢反轉訊號。 但圖表中有一個有趣的面向。 RSI 6 已降至 20.58,RSI 12 為 23.68,RSI 24 為 27.61。這三者皆低於 30。 這告訴我們賣壓相當猛烈。在這些水準下,出現短期反彈並不令人意外。然而,超賣並不代表價格一定會立即反轉。 MACD 指標也仍為負值。DIF 為 -62.40,DEA 為 -55.55。因此目前動能依然疲弱。 以太坊還有另一個值得關注的面向。 ETH 常被描述為通縮資產,因為交易手續費會透過 EIP-1559 機制銷毀。但這並不代表其供應量總是在減少。 根據 11 月 14 日最新的可用數據,過去 30 天內發行了約 89,721 枚 ETH,但僅銷毀了 2,934 枚 ETH。這導致淨發行量約為 86,787 枚 ETH。 這是一個重要的差異。 當使用者支付基本費用時,以太坊會銷毀 ETH。但當網路活動低迷時,銷毀的費用減少,而驗證者獎勵卻持續增加流通中的新 ETH。 這意味著以太坊的通縮故事在很大程度上取決於網路需求。生態系統的增長並不自動使 ETH 變為通縮。 回頭看圖表,ETH 目前的交易價格也接近下布林通道(Bollinger Band)約 1,840 美元的位置。近期低點 1,824.72 美元是另一個值得關注的價位。 若能站上 1,901 美元,可能是動能改善的第一個訊號。在此之上,1,940 至 2,000 美元仍是重要的阻力區。 目前,我正在觀察價格走勢與供應動態。 ETH 可能處於超賣狀態,但更大的問題是,買盤需求是否能強勁回升以扭轉趨勢。 $ETHUSDT #ByXIMPACT

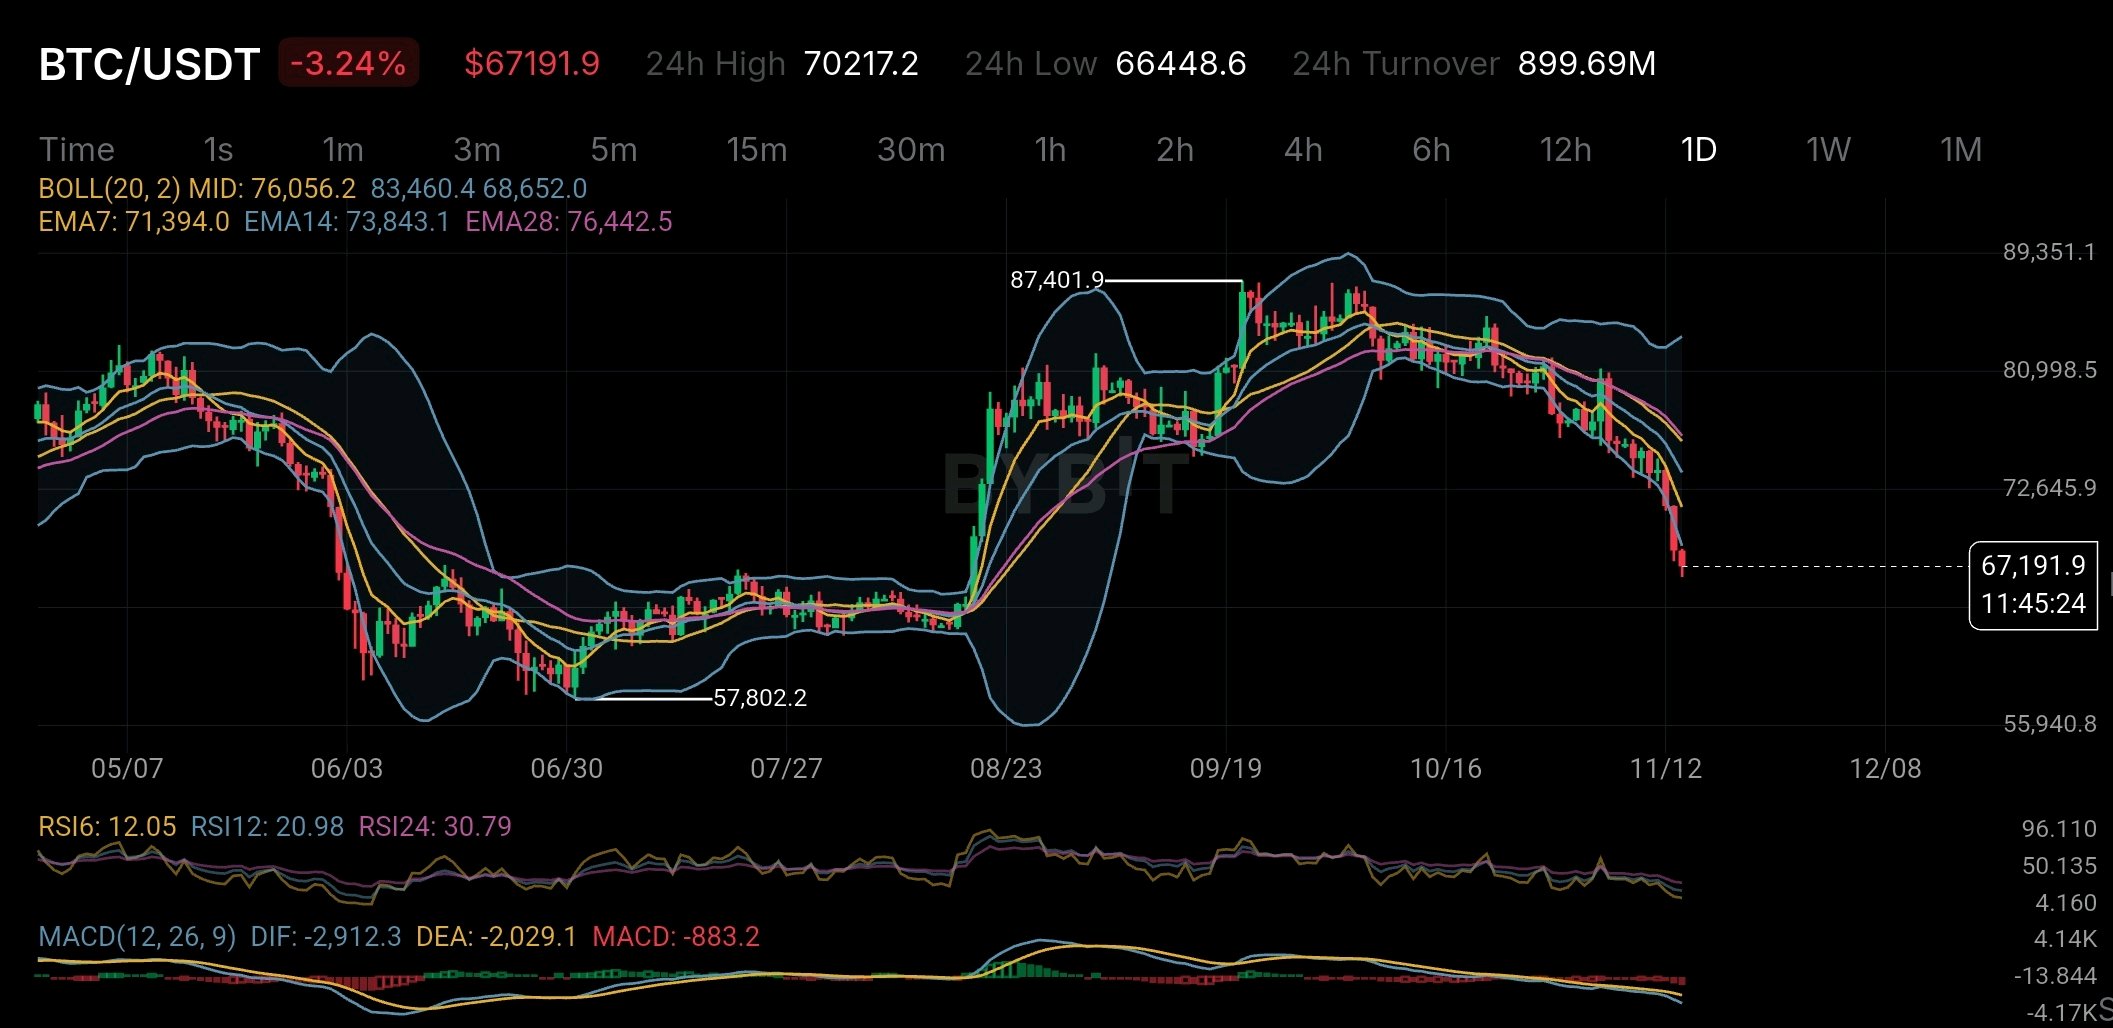
比特幣目前處於深度超賣狀態,但這並不一定意味著底部已經形成。 BTC 的交易價格約為 67,191 美元,單日跌幅超過 3%。引起我注意的不僅僅是價格下跌,而是日線指標變得有多疲軟。 RSI 讀數異常偏低。RSI(6) 處於 12.05,RSI(12) 為 20.98,RSI(24) 為 30.79。 這些水平顯示賣方已經主導市場很長一段時間了。 但有趣的地方來了。 許多交易者看到超賣的 RSI 後,會立即開始尋找買入機會。問題在於,當整體趨勢仍指向下跌時,超賣狀態可能會持續比預期更久。 比特幣目前的圖表並沒有顯示出太多強勢。 價格低於所有三條指數移動平均線(EMA): EMA7:71,394 美元 EMA14:73,843 美元 EMA28:76,442 美元 這告訴我們,短期、中期和長期的動能都承受著壓力。 MACD 也沒帶來什麼安慰。DIF 和 DEA 均維持在負值區域,柱狀圖也為負值。 另一個值得關注的重要水平是布林通道中軌,約在 76,056 美元左右。BTC 的交易價格遠低於此水平,顯示價格已大幅偏離近期平均值。 儘管如此,我不會排除反彈的可能。 當拋售變得如此激進時,短期反彈是有可能的。但僅憑反彈並不意味著趨勢已經改變。 值得關注近期低點約 66,448 美元。如果買方設法守住這個區域,BTC 可能會嘗試復甦。如果該支撐位失守,進一步的下行壓力將不容忽視。 就目前而言,我更感興趣的是看到買方進場,而不是試圖預測精確的底部。 有一點很清楚:比特幣處於深度超賣,但整體趨勢依然疲軟。 有時候,交易中最困難的部分不是找到一個好的切入點,而是分清楚市場是在下跌,還是終於準備好要回升。 $BTCUSDT #ByXIMPACT #WSOT曬出你的AI交易即可贏取10USDT #WSOT2026

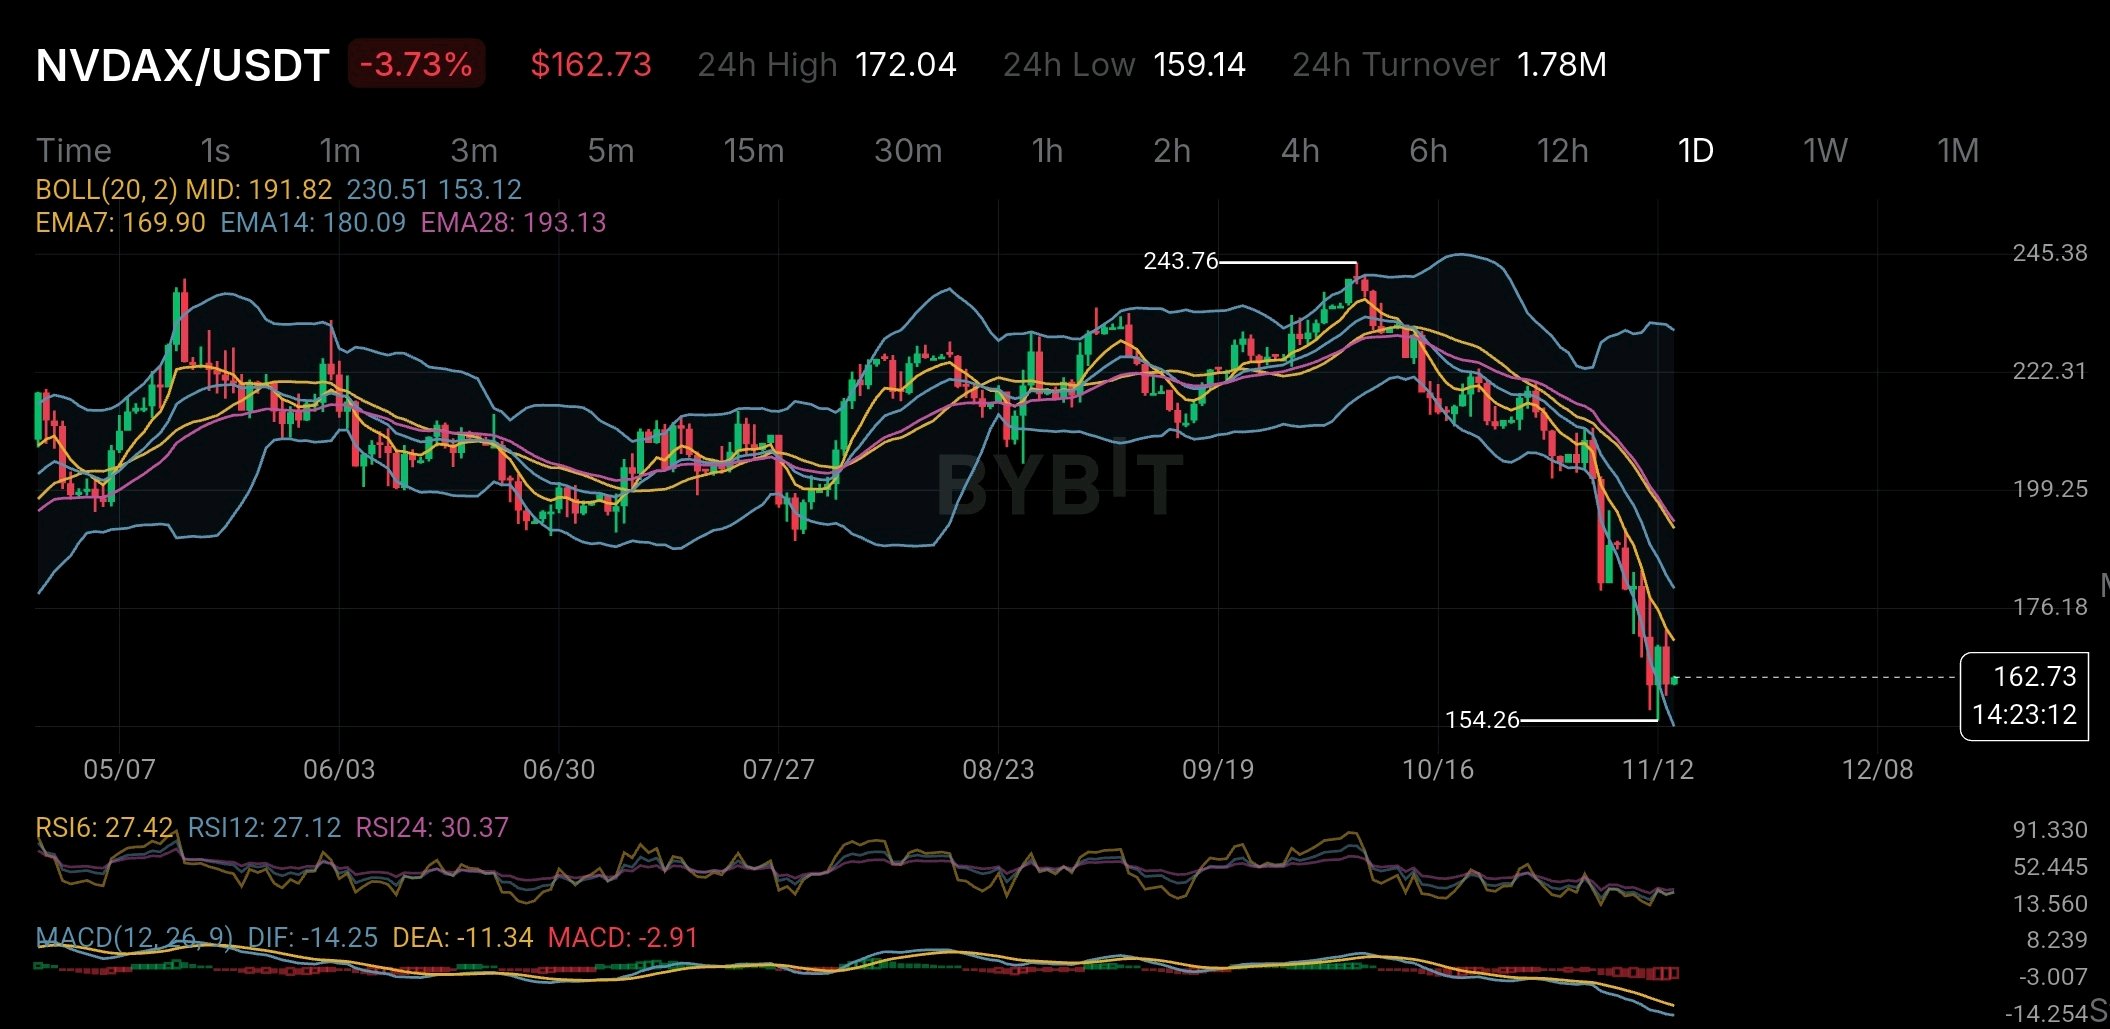
NVDAX is falling sharply but there is something about this token that many traders may not fully understand. At $162.73 NVDAX is down 3.73% on the daily chart. RSI6 is at 27.42 while RSI12 is at 27.12. Both readings show strong selling pressure. Price is also below all three major EMAs. EMA7 is at $169.90 EMA14 at $180.09 and EMA28 at $193.13. The chart looks weak. But the bigger story is not just about the price. NVDAX is a tokenized version of NVIDIA stock issued through Backed Finance. It is designed to follow NVIDIA's share price and is intended to be backed 1:1 by actual NVIDIA shares held in custody. Sounds simple. But there is an important difference. Buying NVDAX does not mean you own NVIDIA shares. According to Bybit's official xStocks terms holders do not receive shareholder voting rights or direct ownership of the company. They also do not receive dividends directly. Any dividend value may instead be reflected through an adjustment to the token's multiplier. There is another detail worth understanding. Bybit provides the trading platform but it does not issue or hold the underlying shares. The tokens are issued and redeemed by Backed Finance. Bybit also clearly states that it does not guarantee redemption liquidity or fair market pricing. It also says it does not independently verify or monitor the underlying collateral. This creates an important difference between owning a traditional NVIDIA share and holding NVDAX. You get exposure to NVIDIA's price through a blockchain-based token but you also take on issuer and custody risks. Now look at the chart again. NVDAX has fallen close to its recent low of $154.26. The price is also near the lower Bollinger Band at $153.12. A short-term bounce is possible but the negative MACD and downward EMA structure suggest that sellers are still in control. The $154 area is worth watching. A break below it could bring more selling pressure while a recovery above $170 would be an early sign of improving momentum. NVDAX offers an interesting way to access traditional stocks through crypto markets. But investors should remember one thing: Getting exposure to a company's share price and actually owning its shares are two very different things. $NVDAXUSDT #ByXIMPACT

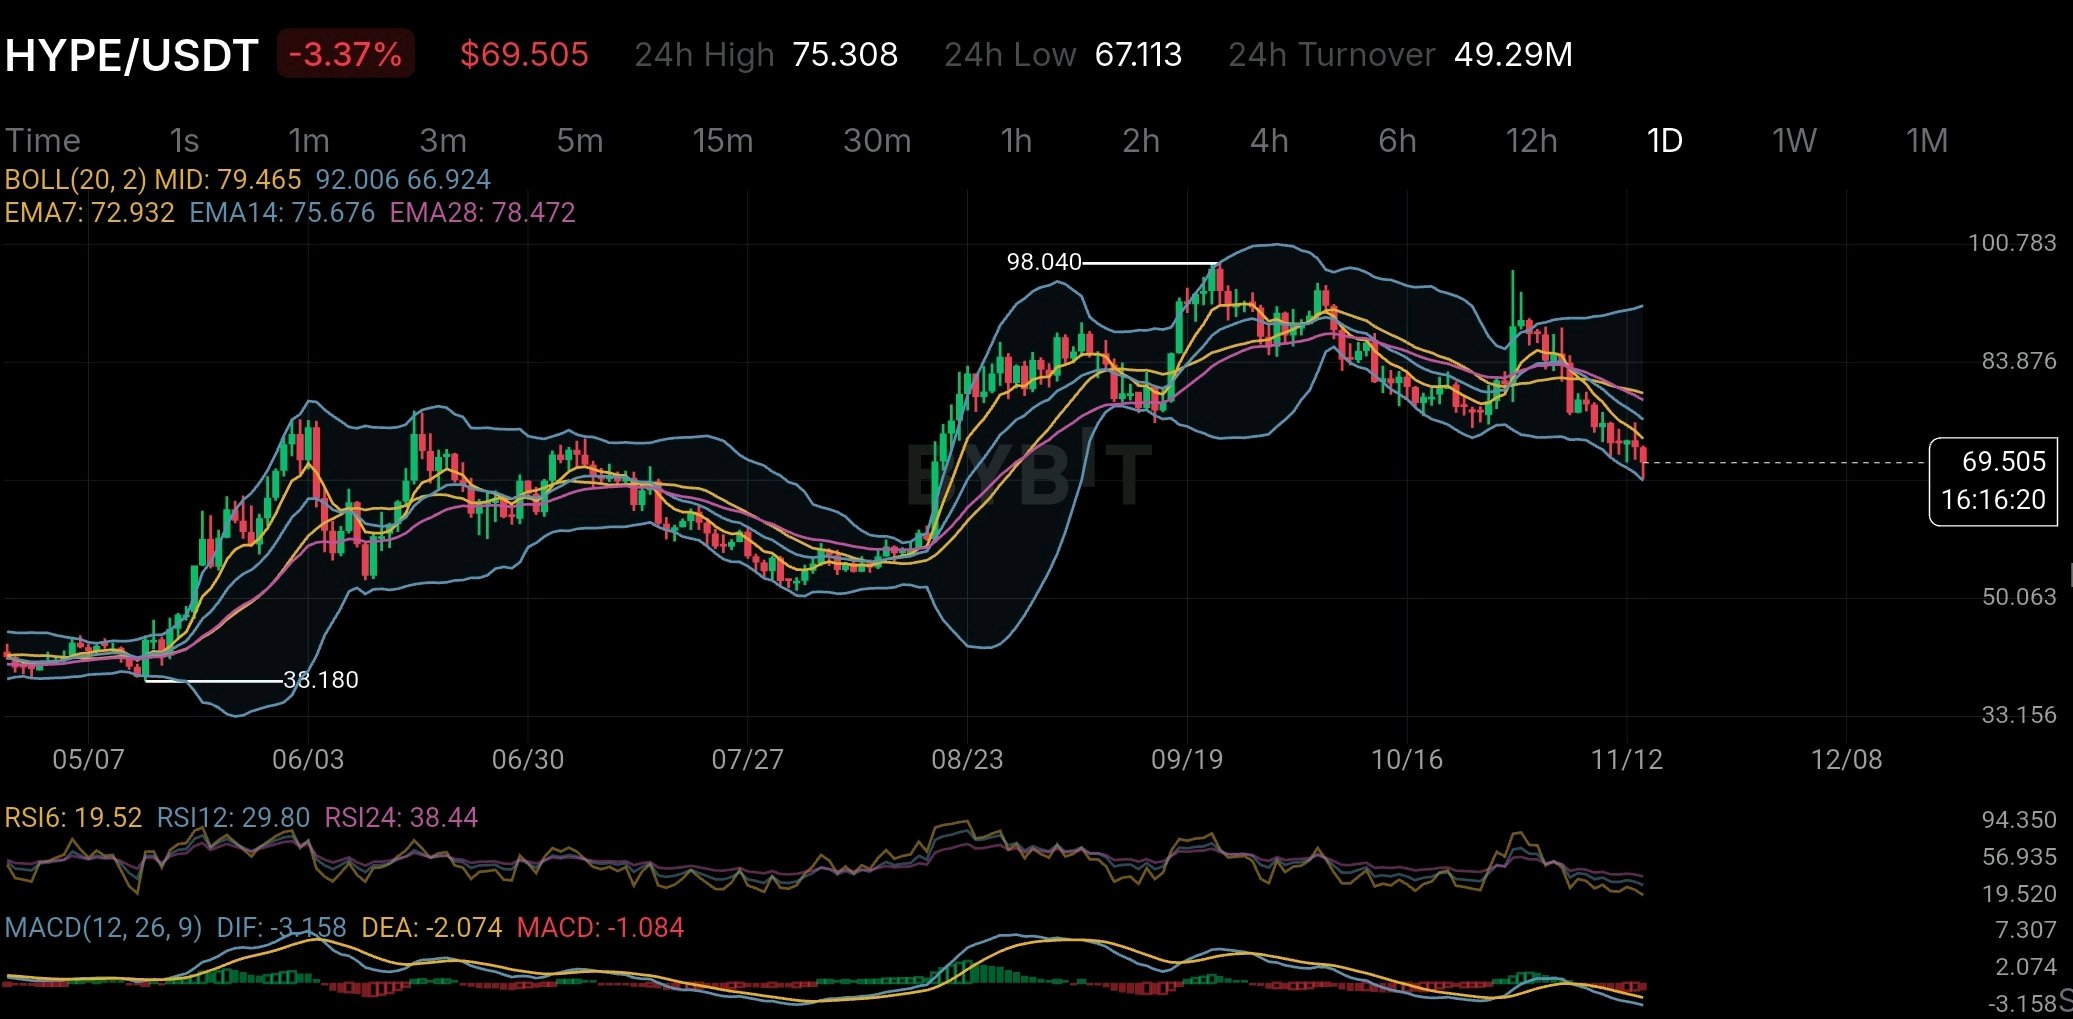
HYPE 已經透過其回購機制從流通中移除了近 5,000 萬枚代幣。然而,還有另一個投資者不應忽視的供應因素。 真正的問題在於,HYPE 的代幣銷毀速度是否能跟上尚未進入市場的供應量。 Hyperliquid 擁有加密貨幣市場中較為有趣的代幣經濟模型之一。 根據其 2026 年 11 月的投資者揭露資訊,大約 99% 的協議費用被導向「援助基金」(Assistance Fund)。該基金直接從公開市場購買 HYPE,並永久移除所收購的流通代幣。 截至 2026 年 10 月 28 日,已揭露的回購量已達到約 4,830 萬枚 HYPE。 這是一個相當可觀的數字。 它在交易活動與代幣需求之間建立了直接的聯繫。當交易所產生更多費用時,該機制就有更多的資本可用於購買 HYPE。 但接下來這部分值得更多關注。 HYPE 最初的最大供應量為 10 億枚代幣。即使考慮到透過回購和網路費用銷毀所移除的約 5,000 萬枚代幣,其剩餘的供應結構中仍然包含大量的未來分配份額。 11 月的揭露資訊顯示,約有 4.1 億枚 HYPE 分配給了未來的代幣釋放 (emissions) 和社群獎勵,另有 6,100 萬枚分配給了 Hyper Foundation。 此外,還有 2.38 億枚代幣分配給了核心貢獻者。 這造成了一個有趣的矛盾。 HYPE 確實有一個能創造持續市場需求並減少可用供應的真實機制。然而,僅看銷毀量是無法理解其長期供應前景的。 未來代幣釋放的速度同樣重要。 如果協議收入持續成長,回購機制可能會成為一項重要的結構性優勢。但如果釋放和解鎖的份額成長速度超過了實際需求,這些購買行為帶來的正面影響可能會變得不那麼顯著。 圖表也顯示了故事的另一面。 HYPE 在日線圖上的交易價格約為 69.50 美元,此前從 9 月接近 98 美元的高點回落。價格目前低於 EMA 7 (72.93 美元)、EMA 14 (75.67 美元) 和 EMA 28 (78.47 美元)。 日線 RSI 6 指數接近 19.52,顯示短期動能處於嚴重超賣狀態。 這使得目前的疲軟態勢引人注目,但並不能確認反轉。賣方目前仍掌控著可見的趨勢。 對我來說,最值得觀察的指標不僅僅是燒毀了多少 HYPE 代幣。 而是真實的協議收入能否持續吸收進入流通的供應量。 強大的回購機制可以支撐代幣的經濟模型,但永續的需求最終必須做到不僅僅是抵消新增的供應。 這才是 HYPE 面臨的真正考驗。 資料來源:Hyperliquid Strategies 2026 年 11 月 5 日揭露資訊及提供的 HYPE 日線圖。 $HYPEUSDT #ByXIMPACT

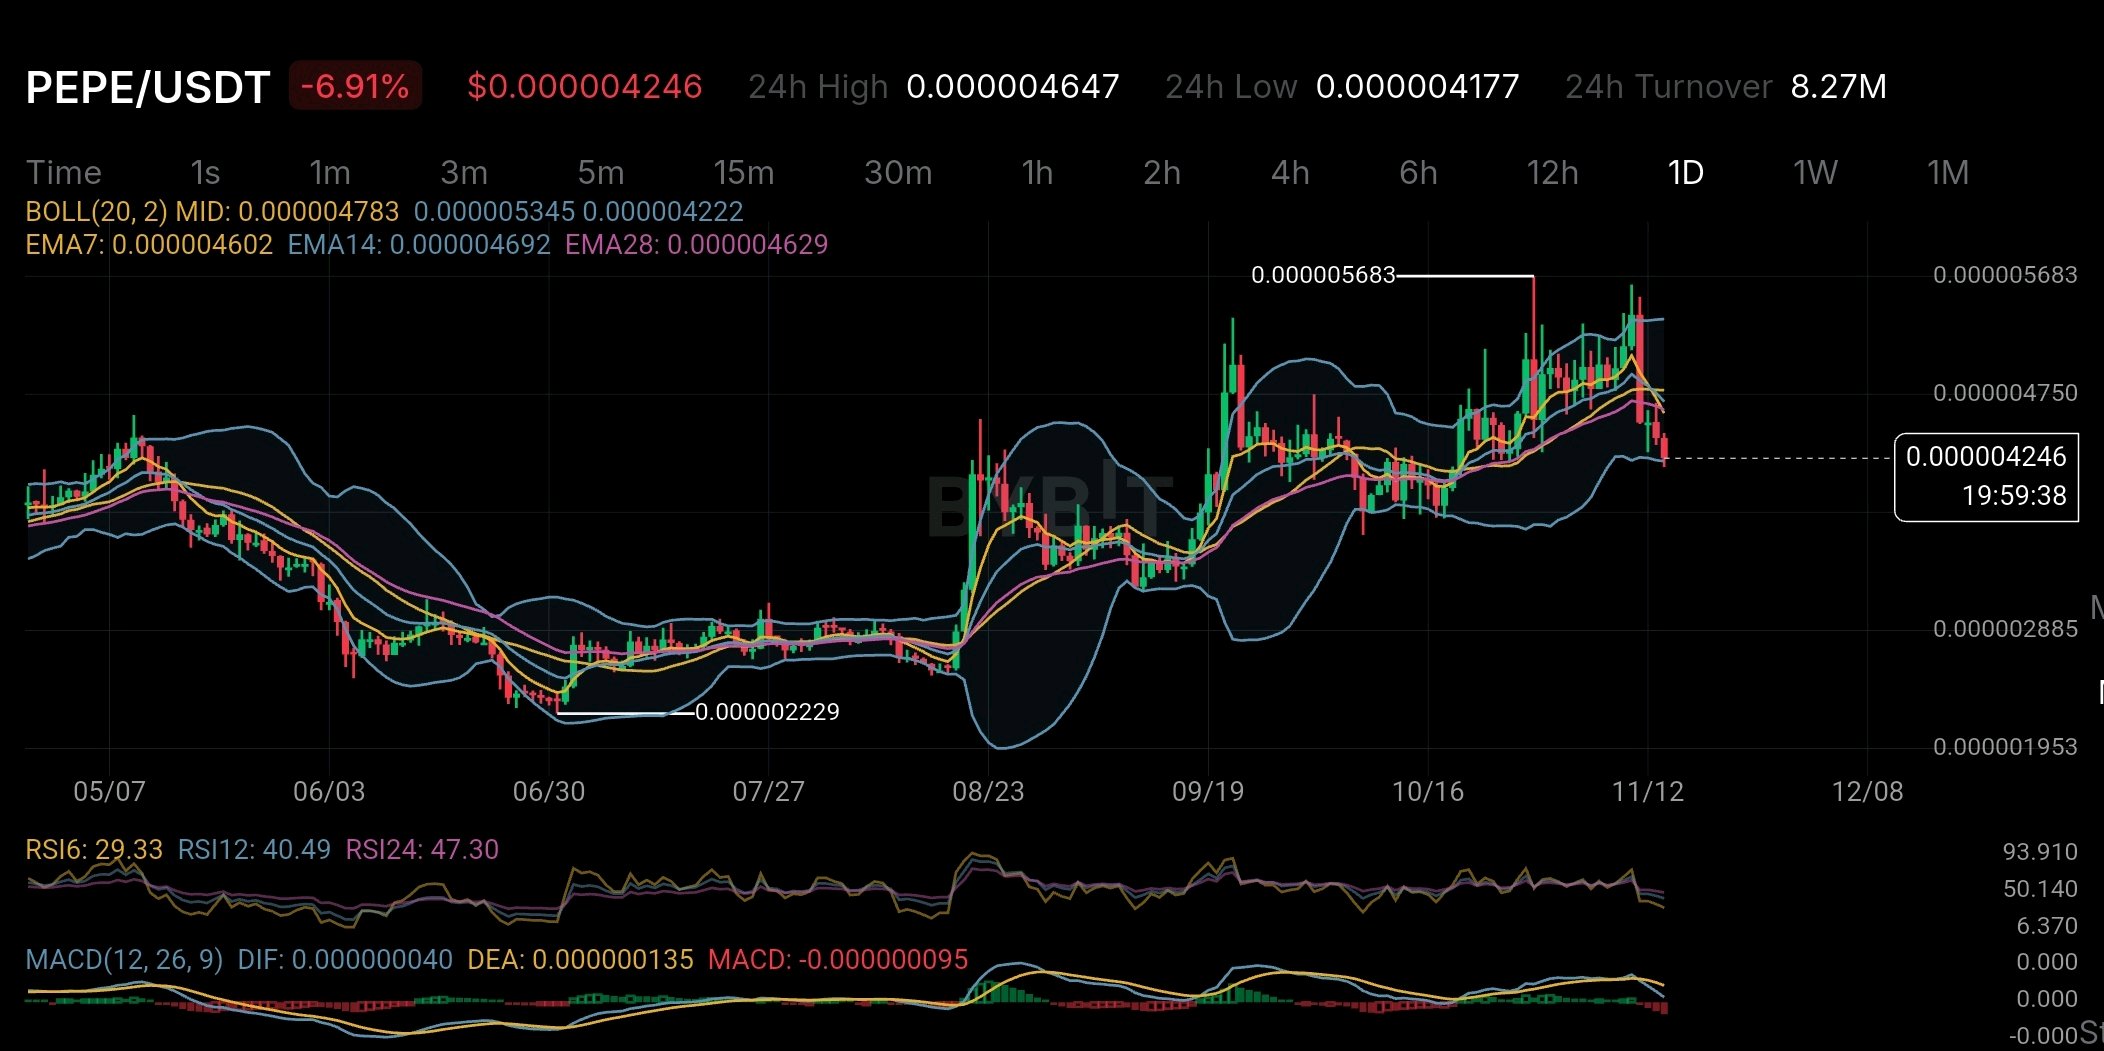
PEPE 幾乎沒有剩餘的預定解鎖壓力,但這並不代表其供應量完全沒有拋售風險。 其分發歷史中隱藏了一個值得更多關注的重要細節。 根據 Canary Capital 於 2026 年 4 月提交給美國證券交易委員會 (SEC) 的文件,PEPE 沒有正式的歸屬或解鎖時間表,截至 2026 年 1 月,其原始供應量中約有 98.4% 已經在流通。 聽起來很正面,對吧? 但有趣的部分來了:同一份文件顯示,前 10 大錢包地址持有約 41% 的流通供應量。有趣的是,前 15 大地址中有 11 個屬於交易所,這意味著原始錢包的集中度並不一定代表由 15 個巨鯨持有。 儘管如此,多個錢包之間未知的持有人仍然是一個真正的風險。 現在看看日線圖。 PEPE 的交易價格約為 $0.000004246,下跌了 6.91%。價格已跌破 EMA7、EMA14 和 EMA28,而 RSI6 處於 29.33 附近。MACD 也轉為負值。 這表明賣壓目前較強,儘管低 RSI 為短期反彈留下了空間。 關鍵區別在於,PEPE 並不面臨傳統的歸屬解鎖日曆,但集中的持倉和情緒驅動的需求仍可能造成嚴重的拋售壓力。 對於 PEPE 來說,更大的問題不僅僅是有多少代幣被解鎖,而是誰控制了那些真正能進入市場的供應量。 $PEPEUSDT #ByXIMPACT

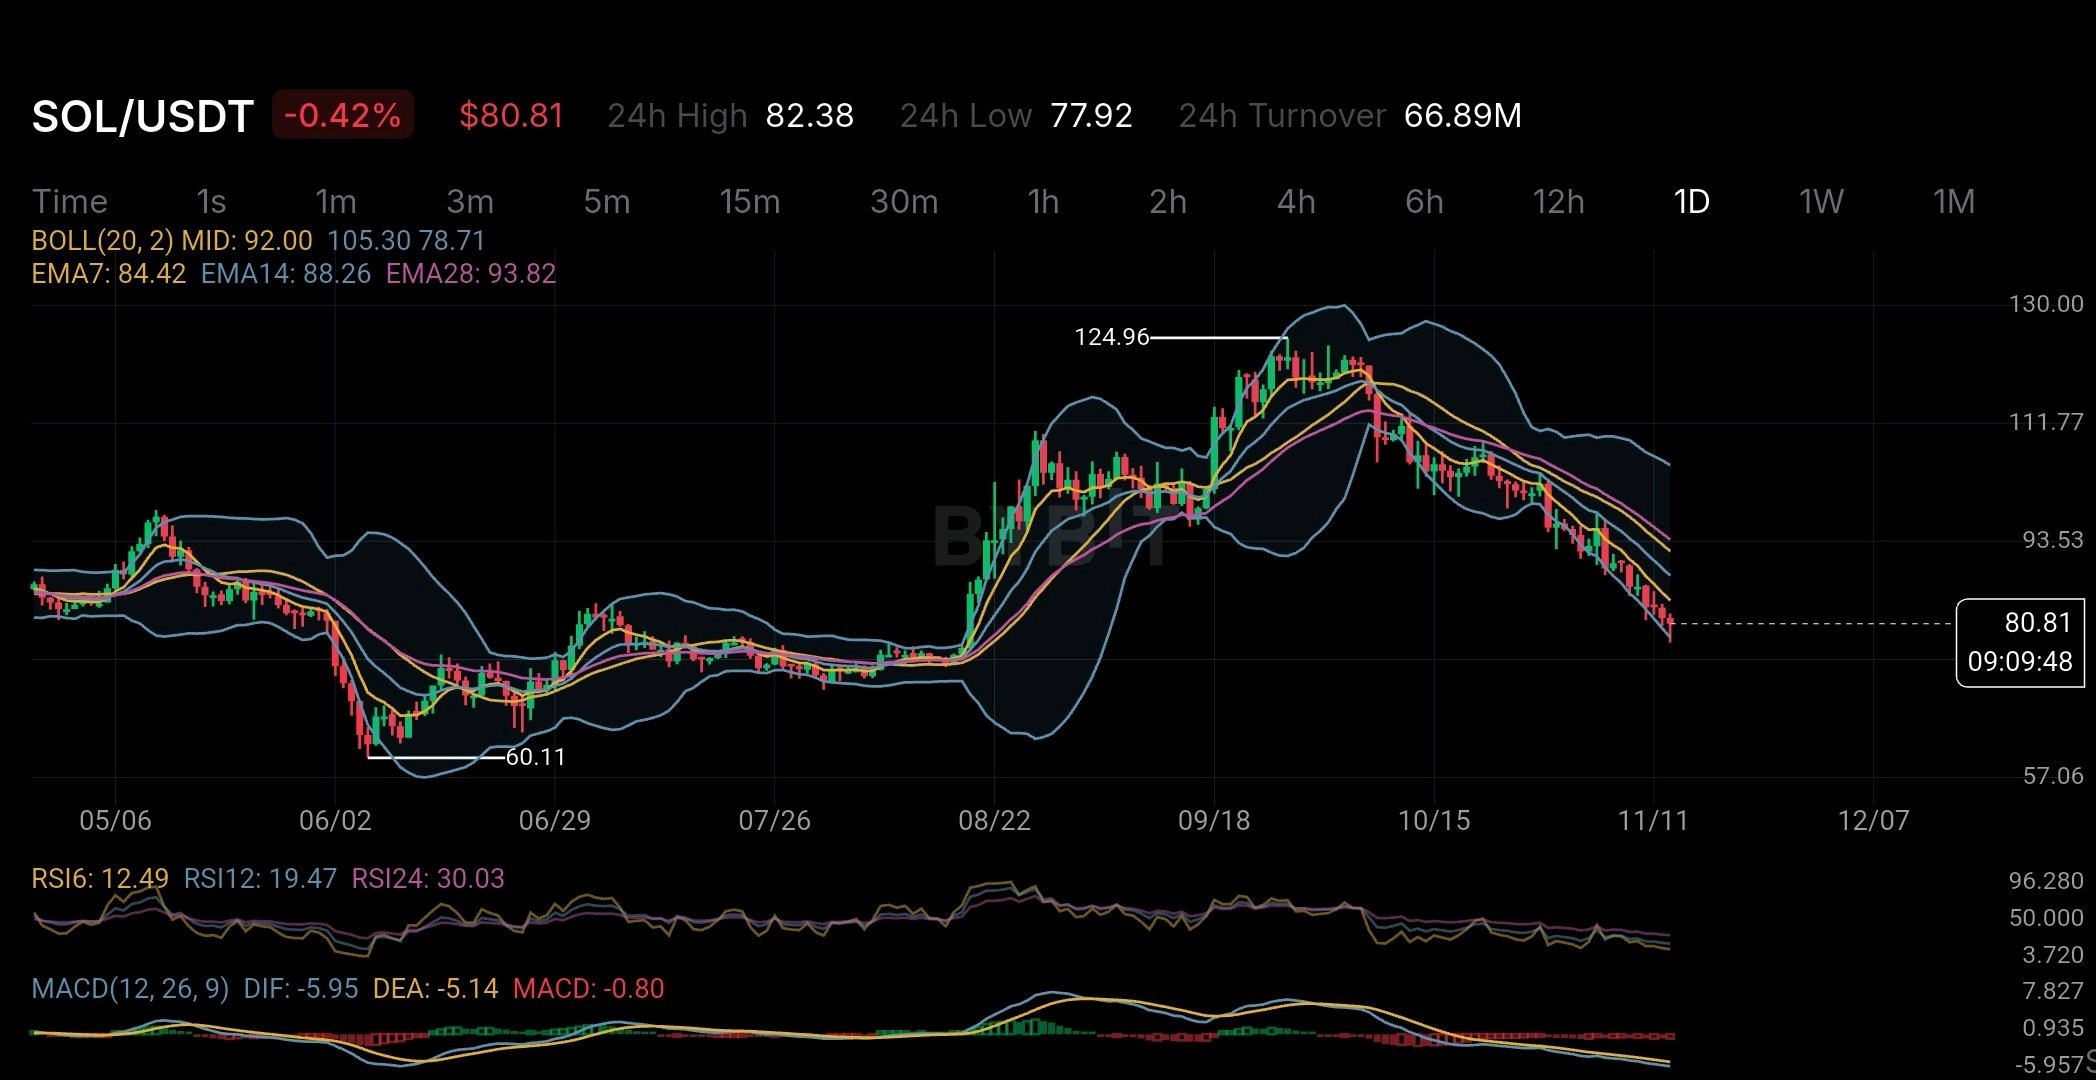
SOL 目前看起來超賣,但其價格背後正發生一些投資者應該了解的更重大事件。 在 80.81 美元左右,SOL 的日線 RSI 已跌至 12.49。這是一個非常低的水平。價格也低於所有三條主要 EMA:EMA7 為 84.42 美元,EMA14 為 88.26 美元,EMA28 為 93.82 美元。 價格可能會很快反彈。但超賣並不代表底部已經確認。 Solana 有趣的一點在於其代幣供應機制。 與那些在特定時間釋放大量代幣的項目不同,SOL 透過質押獎勵定期增加新代幣。這些獎勵有助於驗證者維持網路的運行與安全。 Solana 最初的年通膨率為 8%。該比率計劃每年降低 15%,直到達到 1.5%。 但發生了一些重要的變化。 2026 年 8 月,Solana 通過了 SGP-0002。這一變更將年度通膨削減幅度從 15% 提高到了 30%。目標是將 1.5% 的通膨目標達成時間從 2032 年提前到 2029 年左右。 對於長期持有者來說,這是好消息,因為隨著時間推移,進入市場的新 SOL 代幣將會減少。 但這件事還有另一面。 根據 Blockworks 2026 年第三季的研究報告,約有 4.413 億枚 SOL 處於質押狀態。該季度的質押獎勵價值約為 4.95 億美元。這些獎勵幾乎全部來自新創造的代幣,而非交易費用。 這是投資者應該注意的事項。 質押獎勵看起來像是免費資金,但其實不然。當新的 SOL 進入市場時,如果現有持有者沒有參與質押,這可能會稀釋他們持有的份額價值。即使是參與質押的人,也需要了解他們的獎勵有多少僅僅是為了抵銷這種稀釋效應。 現在讓我們再看看圖表。 SOL 正接近 78-80 美元的區域。其布林通道下軌約在 78.71 美元。RSI 顯示賣壓非常沉重。然而,下行的 EMA 和負值的 MACD 顯示整體趨勢依然疲軟。 反彈是有可能的,但指標尚未確認趨勢反轉。 對於 Solana 來說,降低通膨是正確的一步。但真正的挑戰在於引進更多用戶並產生更多手續費收入,這樣網路就不需要那麼依賴新代幣的創造。 區塊鏈只有在人們使用它並提供實質價值時才會變得更強大,而不僅僅是因為它提供了獎勵。 $SOLUSDT #ByXIMPACT

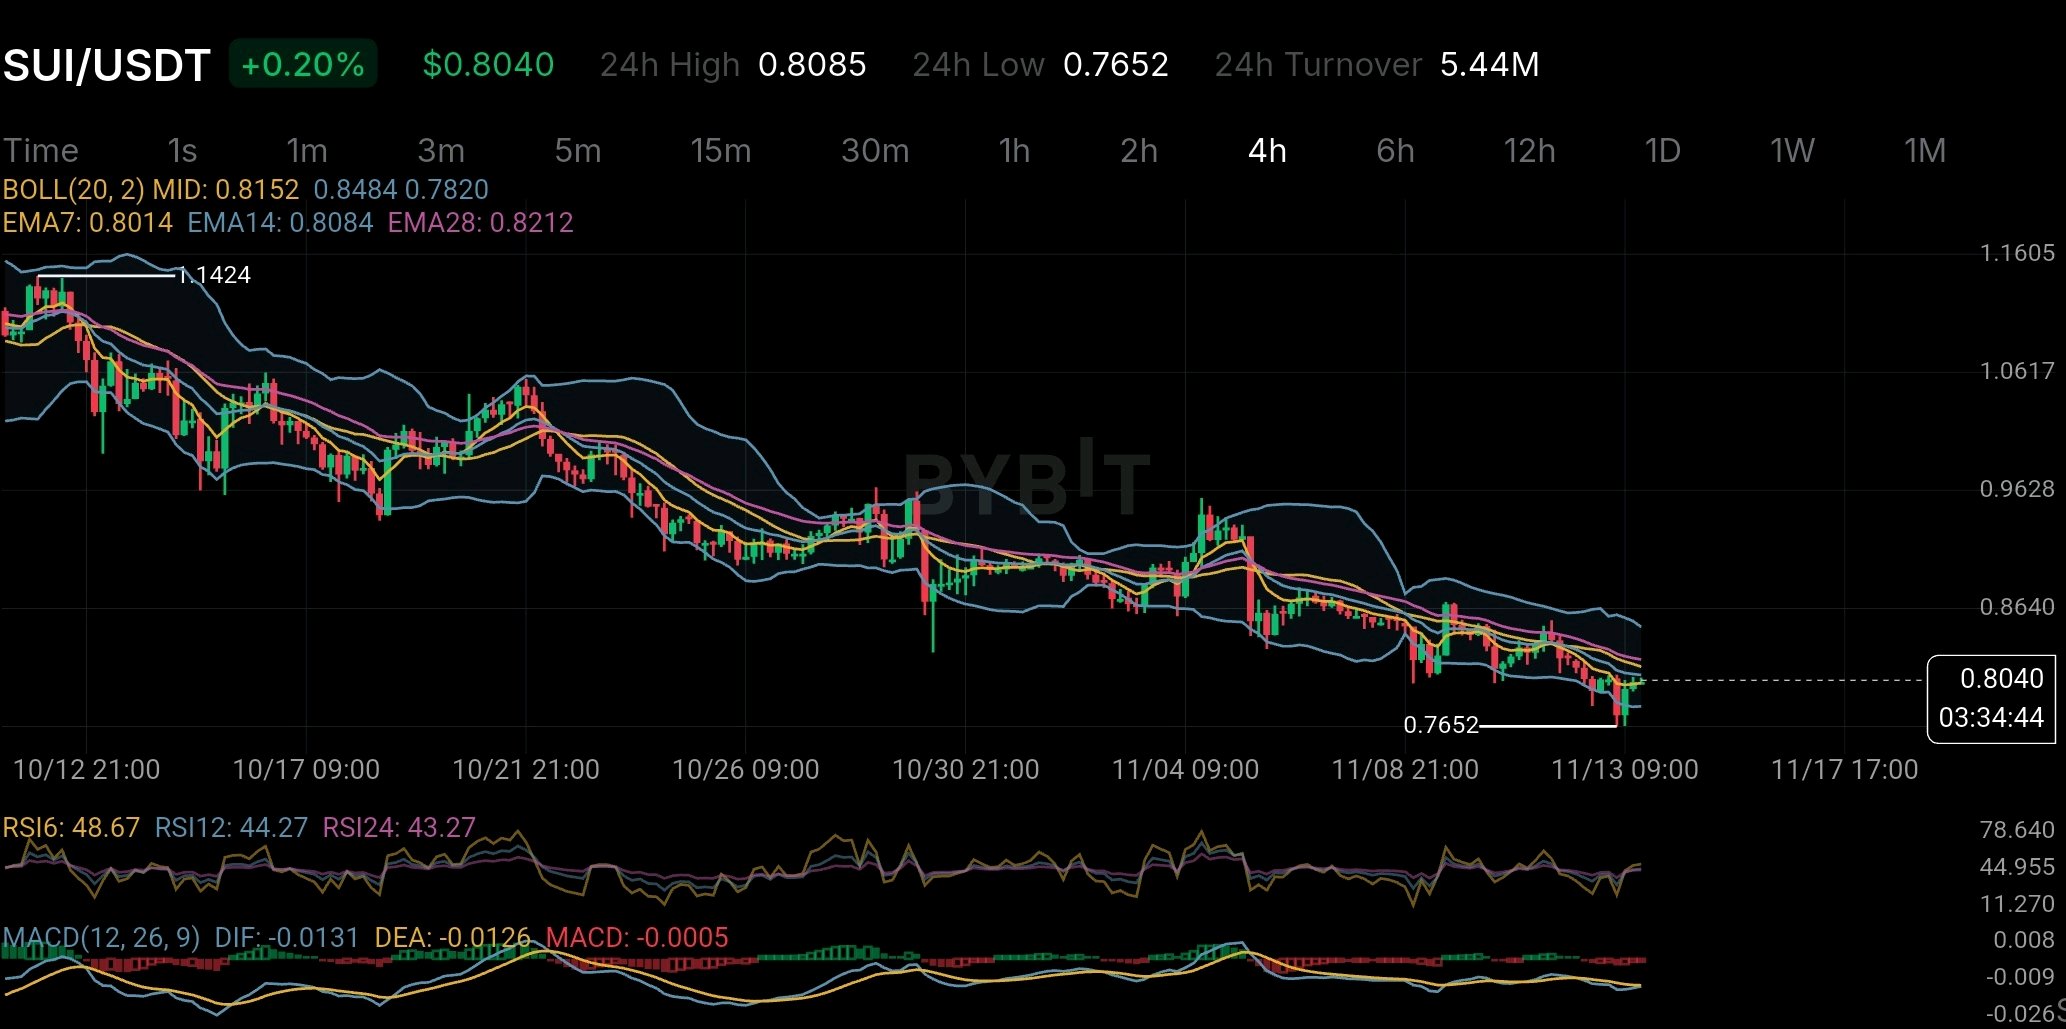
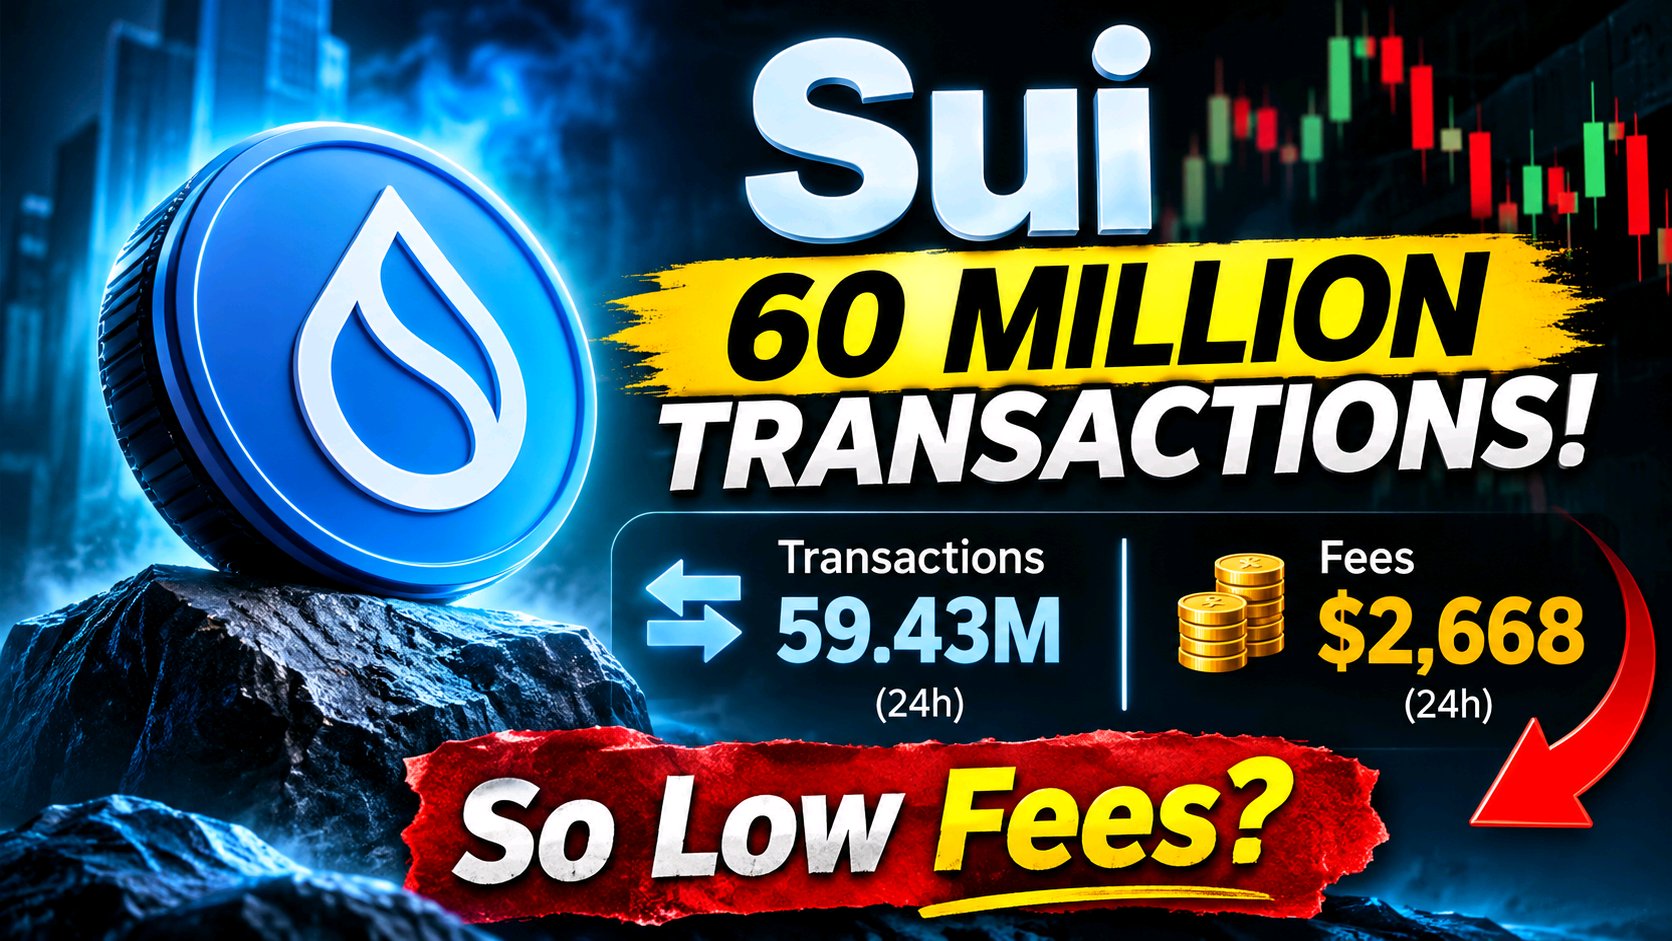
Sui is processing nearly 60 million transactions a day yet its network fees tell a surprisingly different story. That contrast deserves more attention than another discussion about SUI's price. According to DefiLlama's November 13 data Sui recorded approximately 59.43 million transactions in 24 hours while generating just $2,668 in chain fees. Meanwhile applications across the ecosystem generated around $142,283 in fees. The distinction matters. Sui's architecture is designed for high-throughput low-cost transactions. That is a genuine competitive advantage for applications requiring frequent on-chain activity. But transaction volume alone doesn't establish economic value. The bigger question is how much of that activity creates sustainable demand for SUI itself. The token is required for gas staking and governance but network usage does not automatically translate into proportional token value capture. The chart adds another concern. At $0.8040 SUI remains below its 14-period and 28-period EMAs on the 4H timeframe. RSI is recovering toward neutral but MACD remains slightly negative. So there are two separate things to watch: whether network activity becomes economically meaningful and whether buyers can reclaim the declining moving averages. Sui may be winning the throughput argument. The longer-term test is whether that success translates into stronger economic demand for its native token. $SUIUSDT #IMPACTbyTrade
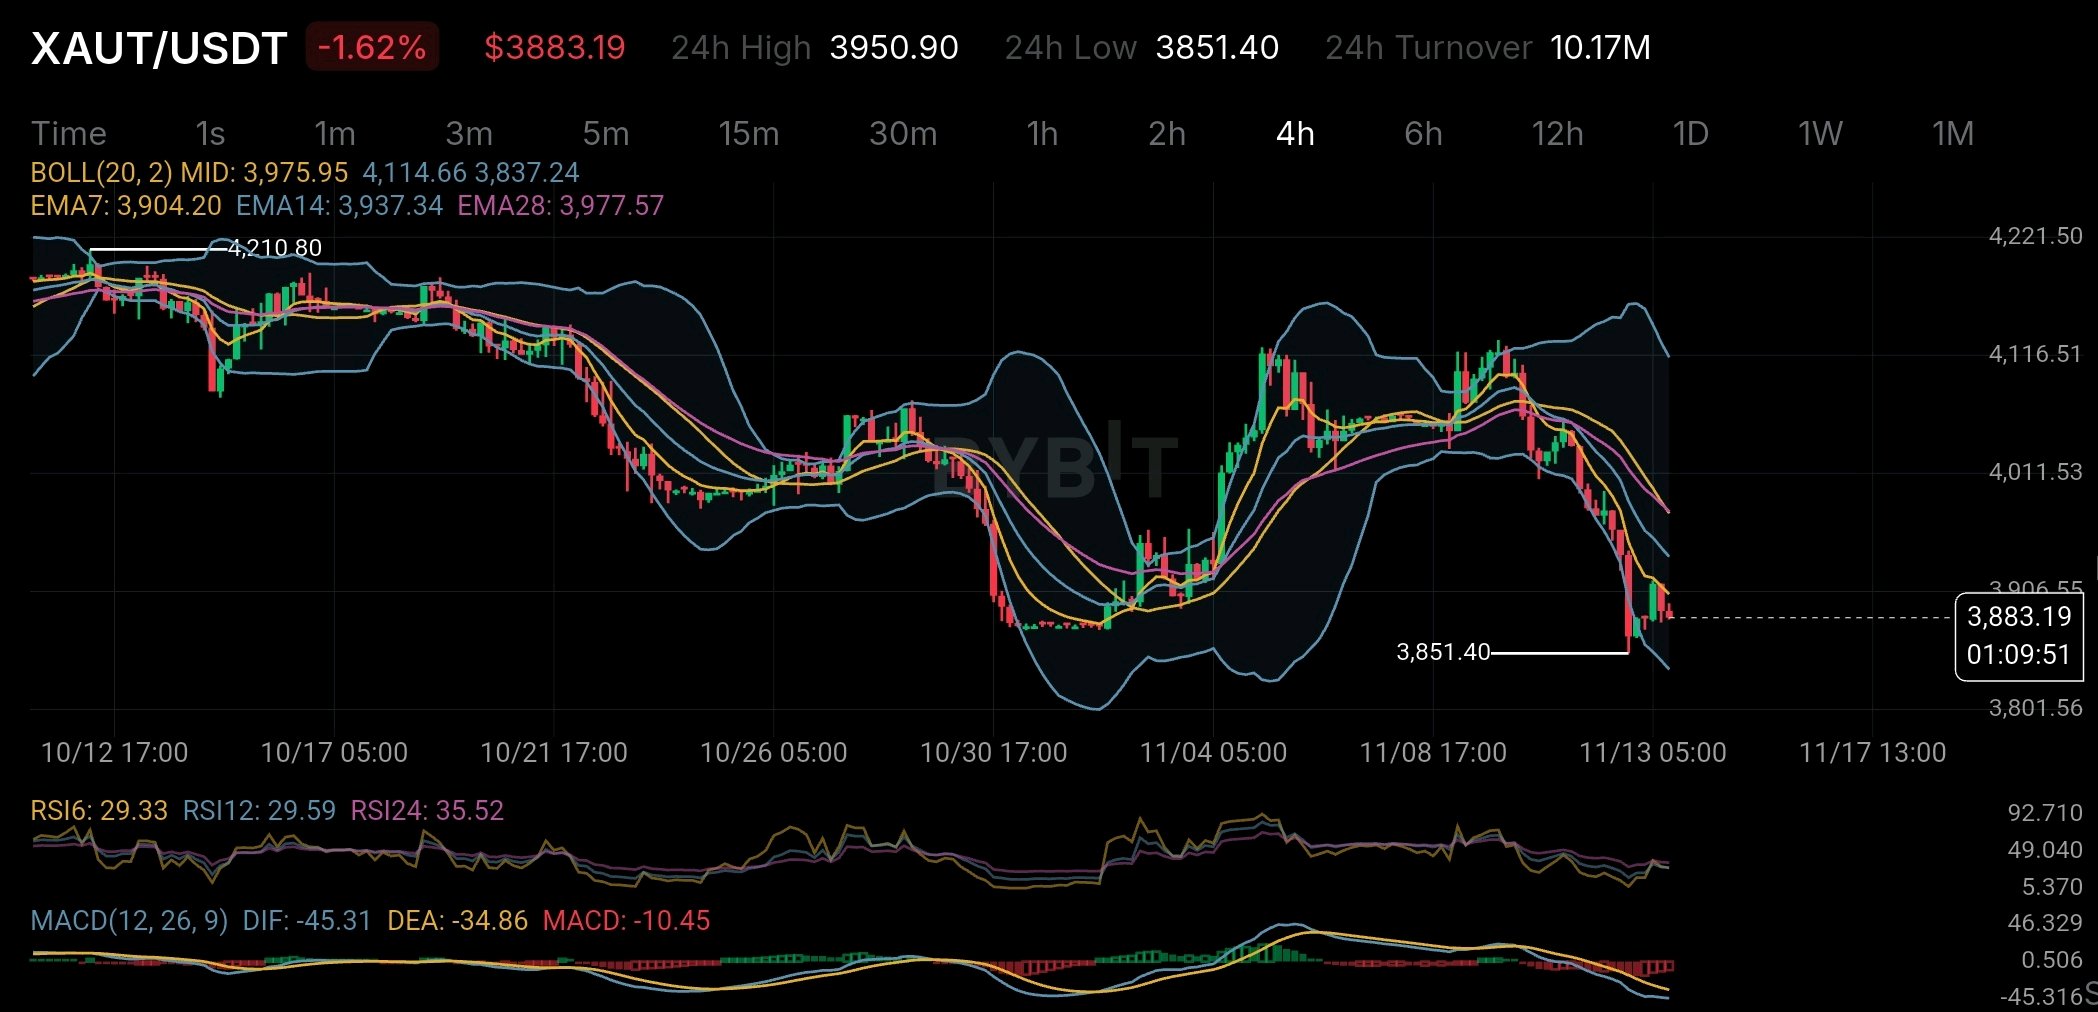
我一直在關注 XAUT,除了近期的價格走勢外,有一點引起了我的注意。 Tether Gold 在 2026 年 9 月 30 日的儲備報告顯示,共有 827,417.63 枚 XAUT,由 827,417.63 金衡盎司的實體黃金足額支持。 這看起來很直觀,但還有另一個細節值得留意。 在總鑄造供應量中,已售出 709,323.66 枚 XAUT,而仍有 118,093.97 枚代幣可通過關聯實體 Alpha Group Commodities 進行銷售。 這大約佔了總鑄造供應量的 14.3%。 我並不是說這意味著即將面臨拋售壓力,但我認為持有者應該將此納入考量。可流通供應量非常重要,尤其是在需求開始變動的時候。 在驗證方面,KPMG 最近完成了發行商 2025 年財務報表的獨立審計,而 BDO 在 2026 年 9 月的儲備保證報告也確認了該報告日期的黃金儲備支持情況。 現在,觀察 4 小時線圖,目前的走勢並不強勁。 XAUT 的交易價格在 3,883 美元左右,低於 EMA7、EMA14 和 EMA28 這三條指數移動平均線。RSI 指標在 29 附近徘徊,MACD 也保持負值。 目前的市場動能顯然偏空。RSI 雖然顯示處於超賣狀態,但僅憑這一點還不足以斷定反轉。 就我個人而言,我會關注兩件事:黃金需求的發展,以及可流通的 XAUT 供應量是否會成為影響因素。 代幣背後有實體黃金是一回事,理解其背後的供應動態則是另一回事。 這才是我認為值得更多關注的地方。 $XAUTUSDT #IMPACTbyTrade

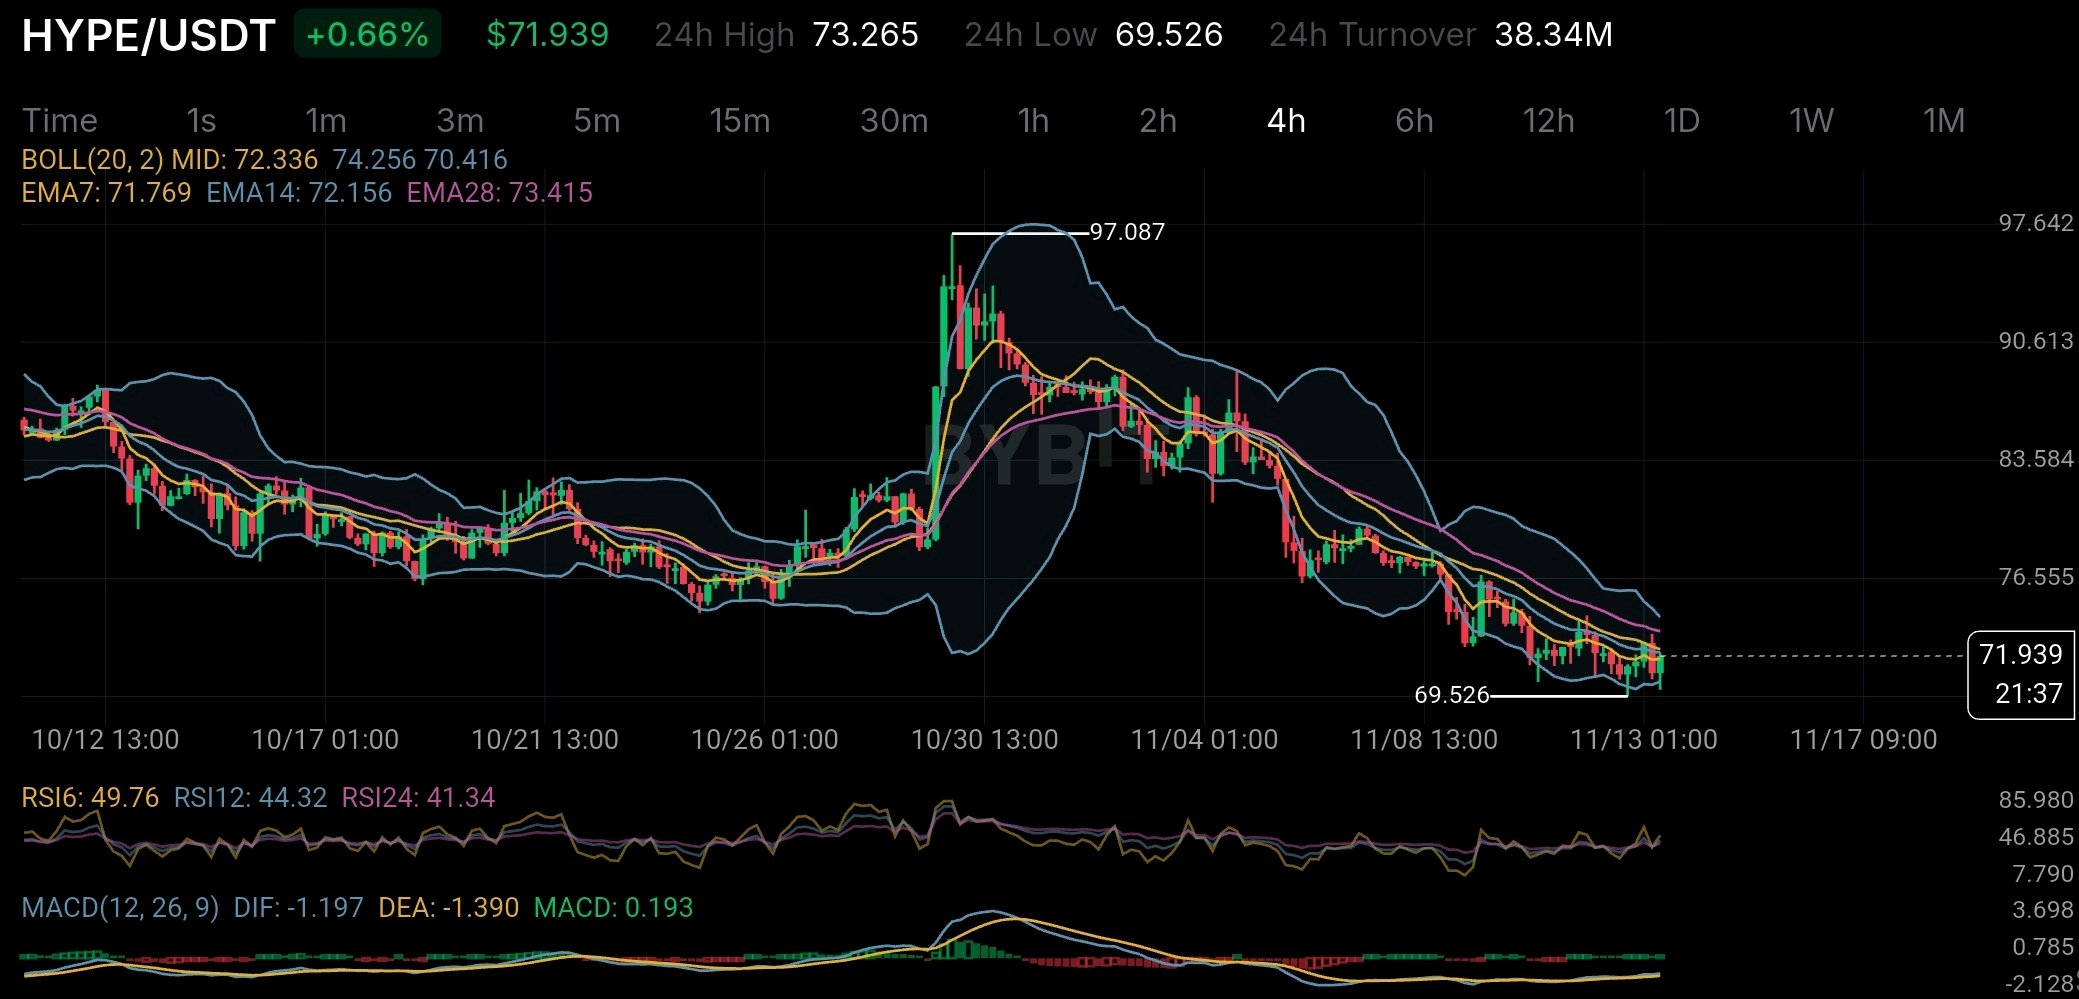
HYPE 有一點讓我蠻感興趣的,就是它的回購與銷毀機制實際上與 Hyperliquid 上的活動掛鉤。但這個故事還有另一面,我認為交易者不該忽略。 根據 Hyperliquid 2026 年 9 月的 SEC 備案文件,99% 的協議費用會進入援助基金(Assistance Fund),該基金使用這些資金從公開市場回購 HYPE。 截至 9 月 8 日,大約有 4710 萬枚 HYPE 被永久銷毀。這大約是初始 10 億供應量的 4.7%。 這是一個相當可觀的數量,它在平台活動與代幣需求之間建立了直接聯繫。更多的交易活動意味著更多的費用,進而可能帶來更多的 HYPE 回購與銷毀。 聽起來不錯對吧?但有一件事值得記在心上。 HYPE 的最大供應量為 10 億枚代幣。大約 38.9% 分配給未來的社群釋放與獎勵,另外 23.8% 分配給核心貢獻者。 因此,雖然銷毀機制有助於減少供應,但並不意味著拋壓會直接消失。新的代幣與未來的釋放量仍然很重要。 觀察 4 小時線圖,HYPE 目前在 71.94 美元附近交易,仍低於 72.16 美元的 EMA14 和 73.42 美元的 EMA28。布林通道中軌也位於 72.34 美元附近。 我正在關注近期低點 69.526 美元作為支撐位。 有幾個令人鼓舞的跡象。RSI 開始回升,MACD 直方圖也略微轉正。拋壓可能正在減輕,但我還沒準備好稱這為趨勢反轉。 我的交易策略: 我正在觀察 72.3 美元至 73.4 美元區間,尋求可能的看漲突破。在考慮做多之前,我更傾向於看到一根紮實的 4 小時 K 線收在該區域上方。 如果突破站穩,且價格成功回測該區域,那麼 76.55 美元是我關注的第一個上漲目標位,其次是 83.58 美元。 另一方面,69.526 美元是關鍵支撐位。跌破該水平將使我的看漲復甦策略失效,並讓我重新考慮這筆交易。 我不想在這裡追逐紅 K 線。確認訊號比試圖抓到絕對底部更重要。 從長遠來看,我認為真正的問題很簡單:Hyperliquid 能否產生足夠的經濟活動,讓回購需求保持在新增供應進入市場的速度之上? 因為銷毀代幣是一回事。在代幣持續釋放的同時維持需求,是完全不同的挑戰。 這就是我對於 HYPE 會持續觀察的重點。不僅僅是銷毀數字,而是實際的商業活動是否能長期支撐這個代幣。 $HYPEUSDT #IMPACTbyTrade

比特幣目前面臨的情況比「RSI超賣」更值得關注:激進的多頭清算和減弱的機構需求。 觀察 BTC/USDT 4 小時線圖,賣壓難以忽視。BTC 目前交易價格約為 68,823 美元,下跌 6.66%,盤中一度觸及 67,563 美元。價格已跌破布林通道下軌 69,738 美元,而 EMA 7、EMA 14 和 EMA 28 均位於當前市場價格上方。 但技術面只是故事的一半。 根據現有的衍生品數據,比特幣在 24 小時內發生了約 3.52 億美元的清算,其中約 3.46 億美元來自多頭部位。這是一個巨大的失衡,顯示槓桿買家被困在錯誤的一方,強制拋售可能加速了跌勢。 還有另一個值得觀察的細節:機構資金流向。 截至 11 月 12 日,美國比特幣現貨 ETF 錄得連續六個交易日的淨流出,總額約為 14.9 億美元。當槓桿交易者被迫出場,而 ETF 投資者又在撤資時,市場同時失去了兩個潛在的買盤支撐來源。 這就是為什麼我不認為極低的 RSI 是一個自動買入的訊號。 4 小時 RSI 讀數尤其處於極端狀態:RSI 6 為 5.54,RSI 12 為 15.01,RSI 24 為 24.78。出現反彈並不令人意外,但在強勁的下跌趨勢中,超賣狀況可能會持續存在。 對我來說,67,563 美元是需要關注的直接關鍵位。若持續跌破,可能會導致 BTC 出現下一波拋售。在復甦方面,70,900 美元和 72,100 美元是重要的 EMA 阻力區。若能收復這些點位,將是賣方失去控制的初步跡象。 更大的問題是,在這波清算浪潮後,現貨需求是否會回升。 比特幣現在不一定需要更多的槓桿買家,它需要的是願意吸收實際賣壓的買家。 超賣市場可能會產生反彈,但唯有持續的需求才能建立真正的復甦。 $BTCUSDT #IMPACTbyTrade

ONDO 即將迎來一個我認為市場需要更關注的供應事件。下一次主要的代幣解鎖定於 2027 年 1 月 18 日,涉及的數量相當可觀。 根據 Tokenomics.com 的數據,預計當天將有約 17.1 億枚 ONDO 代幣進入流通。這佔最大供應量的 17.1%,估計佔當前市值的 35.1%。 引起我注意的是:ONDO 100 億枚最大供應量中,目前僅有約 48.7% 在流通,其餘部分仍受歸屬期限制。 但這不僅僅是又一次代幣解鎖那麼簡單。即將到來的分配中,約 46.3% 歸社群所有,38.6% 歸基金會,15.1% 歸私人投資者。這種細分很重要,因為代幣解鎖並不自動意味著拋售壓力。有些可能會用於生態系統發展,而其他代幣最終可能會進入交易所。 我還認為投資者應該了解 ONDO 本身的一些情況。根據其官方文件,ONDO 主要作為 Ondo DAO 和 Flux Finance 的治理代幣。身處不斷增長的現實世界資產 (RWA) 領域,並不自動意味著代幣持有者擁有相關的代幣化資產或能獲得其收益。 現在觀察圖表,ONDO 在提供的 4 小時時間框架內交易價格約為 0.3327 美元,下跌了 6.75%。價格低於 EMA7、EMA14 和 EMA28,而 RSI6 約為 16.72。這在短期內屬於嚴重超賣,但不一定意味著反轉即將到來。整體結構仍呈現低點不斷降低的趨勢。 還有另一點值得關注:衍生品活動明顯高於現貨活動。CoinGlass 報導稱,11 月 13 日期貨交易量約為現貨交易量的 3.8 倍,同時伴隨著大量的多單清算。 我擔心的不是 ONDO 缺乏強大的 RWA 敘事,而是當市場已經面臨壓力時,對代幣的需求能否跟上不斷增長的流通供應量。 超賣的 RSI 可能會導致反彈,但無法解決供應失衡的問題。 對我來說,真正的考驗不僅在於買家能否守住 0.33 美元,而在於真正的需求能否跟上進入流通的代幣供應。 $ONDOUSDT #IMPACTbyTrade