BNB Insight
9248點贊0分享195粉絲203關注
$BTCUSDT is attempting to stabilize after a sharp sell-off, but the recovery is facing a more important test than simply holding above $64,000: can spot demand absorb selling pressure, or is this rebound being driven mainly by short-term derivatives activity? Bitcoin is trading near $64,804 in the supplied Bybit snapshot, up 3.42% over 24 hours. However, the broader move remains weak. BTC has fallen roughly 12.6% over seven days, while the recent decline pushed price toward $61,999 before buyers stepped in. Market Structure: The 4H chart remains bearish. BTC is below MA7 at $64,862, MA14 at $65,655 and MA28 at $68,633. On the 1H chart, price is also below MA7 ($65,058) and MA14 ($64,992), while the 15M structure shows sellers defending the $65,000 area. The immediate recovery therefore needs confirmation, not just green candles. The Derivatives Contradiction: CoinGlass data shows futures volume around $78.5B against spot volume of $7.56B — more than 10 times higher. Open interest is down 4.68% to approximately $41.6B, while 24H liquidations reached $335M. This combination points to significant leverage being removed rather than clear evidence of fresh, sustained accumulation. Funding remains close to neutral. Institutional demand is another concern: US spot Bitcoin ETFs recorded approximately $185.4M in net outflows on November 13. The November 10–13 period saw roughly $864M in cumulative outflows. Key Figures - Bybit price: $64,804.5 - 24H change: +3.42% - 24H high/low: $66,138 / $61,999 - Bybit turnover: $825.80M - Market cap: approximately $1.31T - Circulating supply: approximately 20.11M BTC - 7D performance: approximately -12.6% What Changes the Outlook? A sustained 4H reclaim of $65,655 would be the first meaningful improvement, followed by $68,633. Failure to hold $61,999 would put the recent recovery at risk. The key signal is not whether BTC can bounce, but whether spot buyers return strongly enough to support the move. Are we seeing early accumulation, or simply a relief rally during a broader deleveraging phase? NFA. DYOR. #ByXIMPACT

$ROBOUSDT is showing a small recovery, but the important detail is that price has not yet reclaimed the resistance structure that triggered the latest decline. Fabric Protocol is trading near $0.00397 in the supplied Bybit snapshot, up 1.28% over 24 hours, while the broader 4H structure remains under pressure. The immediate range is $0.00360–$0.00404, with turnover around $303.35K on Bybit. On the 4H chart, ROBO is above MA7 at $0.00392 but remains below MA14 at $0.00408 and MA28 at $0.00419. The 1H structure is more constructive: price is close to MA7 at $0.00398 and above MA14 at $0.00396 and MA28 at $0.00393. However, the 15M chart shows resistance around $0.00398–$0.00400. A short-term bounce is developing, but confirmation is still missing. The fundamental question is whether Fabric can turn its robotics and AI infrastructure vision into real network activity. Its whitepaper describes ROBO as a utility token for network fees and operational bonds, including refundable bonds posted by robot operators. This creates a potential usage-based demand mechanism, but actual adoption and network throughput remain the evidence to watch. Token supply is another important factor. Approximately 2.23B ROBO are circulating against a maximum supply of 10B, meaning only about 22.3% is currently in circulation. The gap between circulating supply and maximum supply deserves attention as future distribution can affect market pressure. Key figures Price: ~$0.00397 (Bybit snapshot) 24H change: +1.28% 24H range: $0.00360–$0.00404 Market cap: ~$8.85M 7D change: -9.19% Circulating supply: ~2.23B Maximum supply: 10B Open interest: ~$4.18M 24H liquidations: ~$92.43K Bullish confirmation: A sustained move above $0.00404, followed by a reclaim of $0.00408–$0.00419, would strengthen the recovery case. Bearish confirmation: Losing $0.00360 would put the recent low back under pressure. Fabric’s long-term proposition depends on real robotics and AI workload demand—not simply the AI narrative. Will actual network usage become strong enough to support ROBO demand? NFA. DYOR. #ByXIMPACT

KSMUSDT 正試圖在急劇下跌後於 2.73 美元附近企穩,但反彈尚未改變整體看跌結構。關鍵問題在於 2.606 美元的支撐區間能否維持足夠長的時間,讓買方重新建立動能。 根據 Bybit 快照,Kusama 目前交易價格約為 2.738 美元,24 小時內下跌 3.79%。日內波動區間為 2.606 美元至 2.849 美元,Bybit 上的成交額接近 2.975 萬美元。4 小時線圖依然疲軟:價格僅略高於 2.730 美元的 MA7,而 2.849 美元的 MA14 和 2.960 美元的 MA28 均位於上方構成壓力。在 1 小時線圖上,價格高於 MA7 (2.734 美元) 和 MA14 (2.717 美元),但仍低於 MA28 (2.739 美元)。這顯示在更大的下跌趨勢中,市場正嘗試進行短期修復。 整體市場環境也面臨壓力。Kusama 的市值約為 5245 萬美元,流通量約為 1915 萬 KSM,未報告固定的最大供應量。作為 Polkadot 的實驗網路,它為開發者提供了一個實時環境來測試升級、治理和與平行鏈相關的構想。然而,單純的網路效用並不能保證 KSM 的即時需求。 衍生品數據顯示,未平倉合約接近 407 萬美元,資金費率約為 -0.0303%,24 小時清算額約為 4.947 萬美元。負資金費率表明市場持倉偏向看跌,但這並不代表已經見底。 關鍵數據 價格:2.738 美元 | 24小時:-3.79% 24小時高/低:2.849 美元 / 2.606 美元 市值:約 5245 萬美元 流通供應量:約 1915 萬 KSM 未平倉合約:約 407 萬美元 資金費率:-0.0303% 24小時清算額:約 4.947 萬美元 看漲確認:守住 2.606 美元並收復 2.849 美元將改善復甦前景,2.960 美元是下一個主要的移動平均線阻力位。 看跌確認:若果斷跌破 2.606 美元,KSM 將面臨進一步下行風險。 Kusama 需要持續的現貨需求,而不僅僅是短暫的緩解性反彈。買方會保衛 2.606 美元並收復 2.849 美元,還是說這次復甦只是下跌趨勢中的短暫停頓? 非財務建議 (NFA)。請自行研究 (DYOR)。 #ByXIMPACT

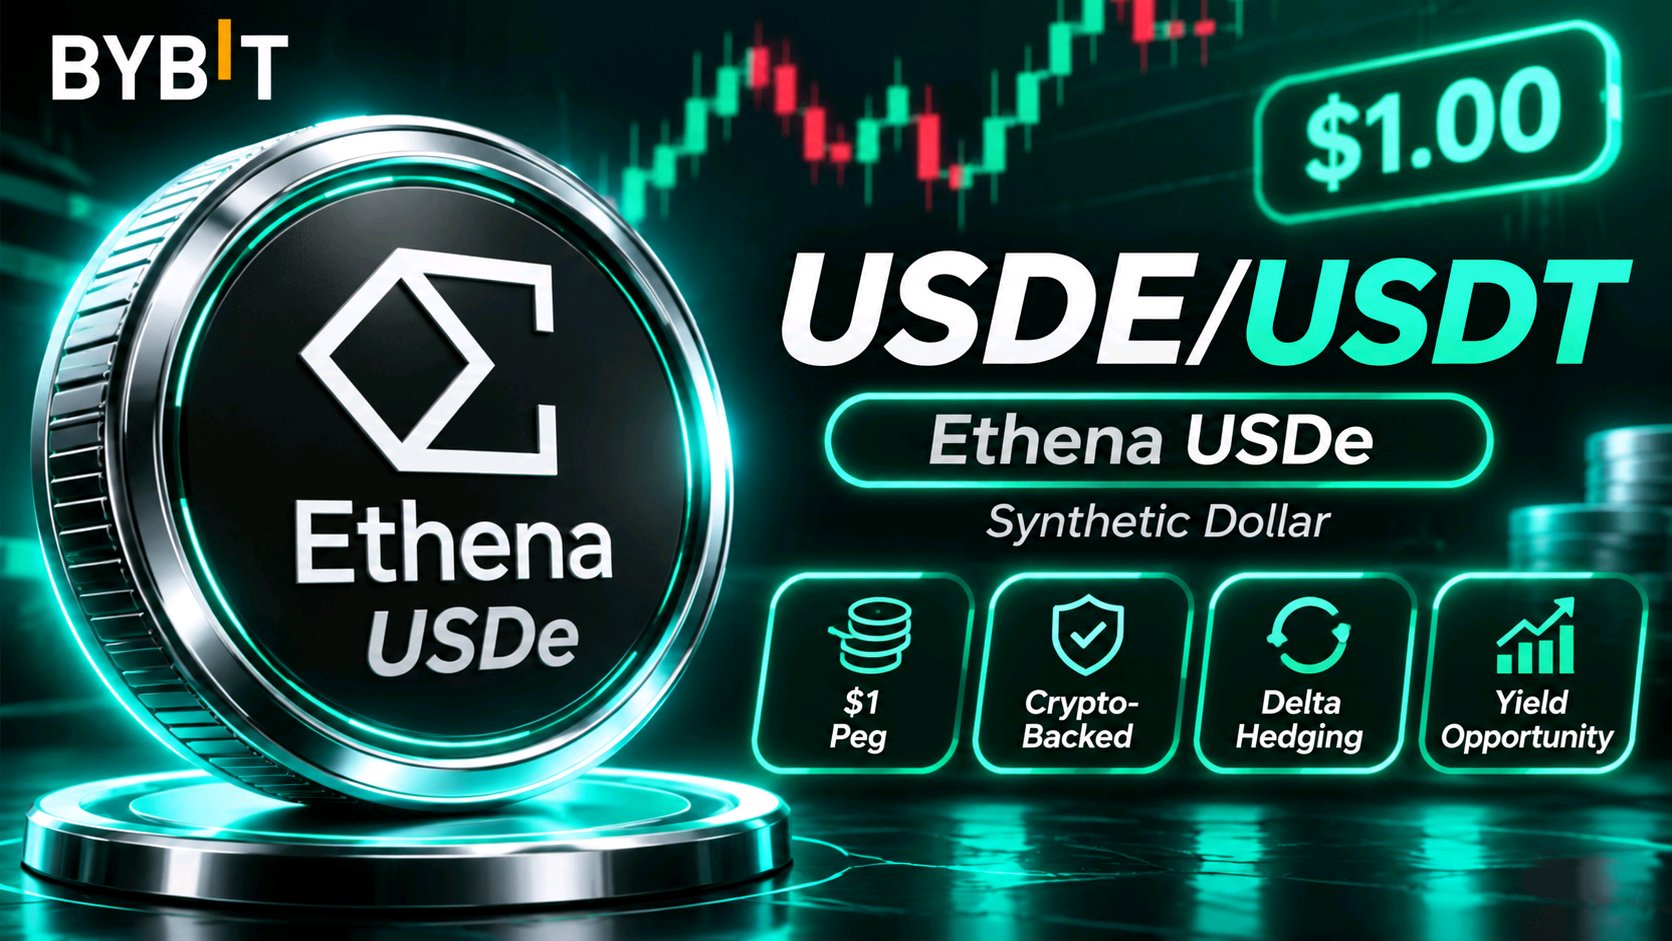
USDEUSDT 目前維持在接近 1 美元的錨定匯率,但更重要的問題是,隨著其供應量和市場使用率的演變,支撐這種合成美元的結構是否依然穩健。 根據 Bybit 圖表快照,USDe 的交易價格接近 1.0003 美元,24 小時跌幅約為 -0.01%。盤中區間為 0.9999 美元至 1.0006 美元,Bybit 交易量約為 3,088 萬美元。在 4 小時圖上,價格位於 MA7(1.0003 美元)附近,但仍略低於 MA14 和 MA28(1.0004 美元)。1 小時圖結構正在短期均線上方復甦,而 15 分鐘圖顯示出小幅反彈。然而,1.0006 美元區域仍然是一個即時的阻力參考點。 基本機制是讓 USDe 與傳統法幣支持的穩定幣區別開來的地方。Ethena 使用加密抵押品和 delta 對沖部位來維持美元曝險,其回報受到質押獎勵和衍生品資金費率條件的影響。這創造了一種不同的風險狀況:抵押品品質、交易所交易對手、對沖執行和流動性都至關重要。 規模相當顯著。USDe 的供應量和市值約為 49 億美元,而 DeFiLlama 報告的 USDe TVL 約為 49.1 億美元。然而,僅靠規模並不能消除風險。Ethena 自身的風險披露和治理更新使得抵押品構成、準備金覆蓋率和交易對手風險敞口成為需要監控的重要領域。 關鍵數據 Bybit 價格:約 1.0003 美元 24 小時漲跌幅:-0.01% 24 小時高點/低點:1.0006 美元 / 0.9999 美元 Bybit 交易量:約 3,088 萬美元 市值:約 48.9 億美元 流通供應量:約 48.9 億 USDe Ethena USDe TVL:約 49.1 億美元 7 日表現:約 +0.06% 看漲確認:維持 1 美元錨定匯率並回升至 1.0006 美元上方,將有助於增強對短期價格穩定性的信心。 看跌確認:如果持續跌破 0.9999 美元,則值得關注,特別是如果伴隨著流動性下降或抵押品信心減弱的情況。 USDe 真正的實力不在於暫時的價格溢價,而在於在不斷變化的市場條件下維持可靠美元曝險的能力。對你來說,什麼更重要:錨定匯率的穩定性,還是其背後抵押品和對沖系統的品質? 非財務建議(NFA)。請自行研究(DYOR)。 #ByXIMPACT
$MEGAUSDT is showing a sharp recovery, but the important question is whether this breakout is supported by growing network activity or mainly short-term trading momentum. MEGA is trading around $0.05028, up 11.49% in the Bybit chart snapshot. The 24-hour range is $0.04232–$0.05103, with turnover near $2.62M. Price has reclaimed all three moving averages on the 4H chart: MA7 at $0.04632, MA14 at $0.04576 and MA28 at $0.04595. The 1H structure is also bullish, while the 15M chart shows price consolidating just below its short-term MA7. The fundamental picture deserves attention. MegaETH is designed as a high-performance Ethereum Layer 2 focused on low-latency execution. Its official token model connects MEGA to sequencer access, staking and ecosystem economics. The foundation also says yield generated through its native stablecoin, USDm, is intended to fund MEGA buybacks. However, adoption must translate into measurable economic activity. DeFiLlama reports approximately $8.8M in TVL, $22.91M in stablecoin supply and around $1,594 in 24-hour chain fees. These figures show an operating ecosystem, but they also highlight how much growth is still needed to justify a sustained valuation expansion. Key Figures Price: ~$0.05028 24H change: +11.49% 24H high/low: $0.05103 / $0.04232 Bybit turnover: ~$2.62M MegaETH TVL: ~$8.8M Stablecoin supply: ~$22.91M 24H chain fees: ~$1,594 Maximum supply: 10B MEGA Bullish confirmation: A decisive break above $0.05103, supported by stronger volume, could open the way toward the previous chart resistance near $0.05299. Bearish confirmation: Failure to hold the $0.048 area would weaken the breakout. A deeper pullback could retest the $0.045–$0.046 moving-average zone. The key issue is whether network adoption and token value capture can grow alongside price. Can MegaETH turn this recovery into a sustainable trend? NFA. DYOR. #ByXIMPACT

$SPCXXUSDT is attempting to recover after its recent decline, but the important question is whether this move reflects sustained demand or simply a short-term rebound in a relatively thin tokenized-equity market. On Bybit, SPCXX is trading near $137.90, up 1.36% over 24 hours. The session range is $133.51–$138.12, placing price close to its daily high. The 4H chart shows improvement: price has reclaimed MA7 at $136.31 and MA14 at $137.36, but remains below MA28 at $139.72. On the 1H chart, price is above all three moving averages, while the 15M structure is also positive. However, 4H volume remains below its MA5 and MA10 averages, suggesting that participation has not yet confirmed the recovery. The fundamental distinction is important. SPCXX is a tokenized tracker certificate issued by Backed Assets (JE) Limited, designed to follow SpaceX's share-price performance. It is not direct ownership of SpaceX shares and does not provide shareholder voting rights. The issuer's product information lists Ethereum and Solana-compatible token formats. It currently charges no management fee, although issuance and redemption fees of up to 0.50% may apply. This creates a different risk profile from an ordinary cryptocurrency: price exposure depends on the underlying private-company equity, while token liquidity, market access and issuer arrangements add separate considerations. The token's market price can also diverge from the underlying reference value during periods of thin liquidity. Key figures Price: ~$137.90 24H change: +1.36% 24H range: $133.51–$138.12 24H Bybit turnover: ~$845.60K 4H MA7: $136.31 4H MA14: $137.36 4H MA28: $139.72 Recent chart support: $133.51 Immediate resistance: $138.12 Bullish confirmation: A sustained break above $138.12, followed by a reclaim of $139.72–$140.38 with stronger volume, would strengthen the recovery case. Bearish confirmation: Failure near $138.12 and a move back below $136.31 could weaken momentum. A break below $133.51 would put the recent recovery at risk. The key issue is not simply whether SPCXX can rise with the SpaceX narrative, but whether its market liquidity can support that move. Would you trust this recovery before volume confirms it? NFA. DYOR. #ByXIMPACT

$SHIBUSDT 在又一波急劇下跌後,SHIB 正試圖尋找底部支撐,而衍生品數據顯示這不僅僅是現貨市場的回調。主要的擔憂在於,槓桿倉位正在被清理,但真正的現貨需求依然疲軟。 在 Bybit 圖表上,SHIB 的交易價格接近 $0.000003866,24 小時內下跌了 6.55%。日內波動區間為 $0.000003698–$0.000004174,目前的支撐位在近期低點。4 小時線結構仍然看跌:價格低於 MA7($0.000003944)、MA14($0.000004094)和 MA28($0.000004237)。1 小時線顯示價格在 MA14 上方出現小幅反彈,但仍低於 MA28,因此還不能確認趨勢反轉。 市場整體數據顯示,SHIB 在過去七天內下跌了約 10.16%,市值約為 23 億美元,流通供應量約為 589.24 兆枚代幣。這意味著幾乎 590 兆的最大供應量已經全部在流通。代幣銷毀或許能支撐長期敘事,但若要對如此龐大的流通基數產生實質影響,需要達到一定規模的持續銷毀。 衍生品數據揭示了更重要的矛盾。期貨未平倉合約(Open Interest)約為 2367 萬美元,24 小時內下降了 13.16%。資金費率為負值,約為 -0.0244%,同時約有 47.1 萬美元的倉位遭到清算,其中約 92% 為多單。期貨交易量約為現貨交易量的 2.2 倍。因此,現貨需求仍然是目前缺失的關鍵確認信號。 關鍵數據 價格:~$0.000003866 (Bybit 截圖) 24 小時變化:-6.55% 24 小時波動區間:$0.000003698–$0.000004174 7 天變化:-10.16% 市值:~$23 億美元 流通供應量:~589.24 兆 SHIB 未平倉合約:~$2367 萬美元 未平倉合約變化:-13.16% 資金費率:-0.0244% 24 小時清算額:~$47.1 萬美元 看漲確認:守住 $0.000003698 並收復 $0.000004174 將是第一個復甦信號。更強的現貨買盤和穩定的未平倉合約將有助於推動價格向 4 小時均線靠攏。 看跌確認:若果斷跌破 $0.000003698,SHIB 將面臨進一步下行風險,特別是在現貨拋售持續的情況下。 槓桿重置的情況顯而易見,但僅僅依靠未平倉合約的減少並不能構成底部。SHIB 需要持續的現貨需求來證明買家正在回歸。 在經歷了這次多頭清算後,SHIB 能否吸引真正的現貨積累?還是說下一個支撐位的跌破會進一步擴大跌幅? 不構成財務建議 (NFA)。請自行研究 (DYOR)。 #ByXIMPACT

$ETHUSDT 已經急劇下跌,現在重要的問題是,從 1,710 美元處的反彈究竟是代表真正的現貨需求,還是僅僅是槓桿拋售後的暫時停歇。 以太幣目前的交易價格在 1,793 美元附近,過去 24 小時下跌約 5.86%。Bybit 最新的價格區間為 1,710.47 美元至 1,919.76 美元,價格遠低於盤中高點。4 小時線結構仍呈看跌:ETH 低於 MA7 (1,838.18 美元)、MA14 (1,885.64 美元) 和 MA28 (1,966.92 美元)。在 1 小時圖上,價格接近 MA7 (1,787.45 美元) 和 MA14 (1,792.41 美元),但仍低於 MA28 (1,840.39 美元)。 衍生品數據顯示了此次槓桿重置的規模。在各大交易所,未平倉合約總額約為 220.4 億美元,24 小時內下降了 4.36%。約有 4.6527 億美元的 ETH 持倉被清算,其中約 85% 來自多頭倉位。資金費率略微為負,報 -0.0002%,而期貨交易量約為現貨交易量的 14.5 倍。這表明衍生品活動頻繁,但尚不能證明有持續的現貨積累。 機構資金流向釋放出混合信號。在經歷了本週早些時候的大幅撤資後,美國現貨 ETH ETF 在 11 月 13 日初步錄得 230 萬美元的淨流入,主要由富達 (Fidelity) 引領。最新的 30 天資金流向圖景仍然為負,流出額約為 22.8 億美元。 關鍵數據 - 價格:~1,793 美元 - 24 小時跌幅:-5.86% - 24 小時區間:1,710.47 美元–1,919.76 美元 - 市值:~2,219.1 億美元 - 流通供應量:~1.2222 億 ETH - 期貨未平倉合約:~220.4 億美元 - 24 小時清算額:~4.6527 億美元 - 資金費率:-0.0002% - 期貨/現貨交易量:~14.5 倍 看漲確認:守住 1,710.47 美元並收復 1,919.76 美元將是第一個有意義的復甦信號。若現貨需求增強且未平倉合約趨於穩定,將提升形成持久底部的可能性。 看跌確認:若跌破 1,710.47 美元,可能會開啟新一輪下跌,特別是如果 ETF 贖回和現貨拋售潮重現的話。 以太幣在數位資產經濟中的長期角色依然重要,但在確認這就是底部之前,市場結構必須先修復。現貨買家會進場嗎?還是說槓桿重置尚未完成? 非投資建議 (NFA)。請自行做好研究 (DYOR)。 #ByXIMPACT

$BOMEUSDT is losing ground after another failed recovery attempt, and the latest decline is exposing a weakness that matters more for a meme asset: falling price is being accompanied by a significant reduction in leveraged exposure, while there is no clear fundamental cash-flow mechanism to establish a valuation floor. BOME is trading near $0.0004994 on the supplied Bybit chart, down 9.40% over 24 hours. The displayed daily range is $0.0004681–$0.0005568. Price is approaching the session low, making $0.0004681 the immediate support to watch. The broader market snapshot shows a seven-day decline of approximately 17.02%, a market capitalization near $33.75M and circulating supply around 68.87B BOME. The token is approximately 98.3% below its March 2024 all-time high of $0.02805. Derivatives indicate an aggressive positioning reset. Futures open interest stands near $10.63M, down 13.42% over 24 hours. Approximately $264.68K in liquidations were recorded, with 96% coming from longs. Funding is negative at roughly -0.0062%, while futures volume is approximately $24.63M against $2.80M in spot volume. Futures activity is therefore almost nine times spot volume, suggesting leveraged trading still dominates participation. BOME's original concept was to create a blockchain-based archive of meme culture on Solana. However, its market value remains largely dependent on community attention, liquidity and speculative demand rather than a clearly established recurring revenue model. One important distinction: approximately 99.9% of its 69B maximum supply is already circulating, so future dilution is less of a concern than demand deterioration. Key Figures Price: ~$0.0004994 (Bybit screenshot) Market cap: ~$33.75M 24H change: -9.40% (Bybit screenshot) 7D change: -17.02% 24H range: $0.0004681–$0.0005568 Open interest: ~$10.63M (-13.42%) 24H liquidations: ~$264.68K (96% longs) Funding rate: -0.0062% Circulating supply: ~68.87B BOME Bullish confirmation: Defending $0.0004681 and reclaiming $0.0005125 would be an initial recovery signal. Stronger spot buying and stabilizing open interest would improve confidence. Bearish confirmation: A decisive break below $0.0004681 would expose BOME to further downside. Continued weak spot demand would make a sustainable reversal harder to establish. BOME has an established place in Solana's meme culture, but community recognition alone cannot guarantee demand. I would want to see buyers defend support and spot participation improve before calling this a confirmed bottom. NFA. DYOR. #ByXIMPACT

$PIEVERSEUSDT 正展現強勁的上漲動能,但關鍵問題在於這波漲勢能否克服因流通比例相對較低而帶來的供給壓力。價格已推升至近期高點,同時三個圖表時間週期均顯示買方目前掌握著短期結構。 市場結構:PIEVERSE 目前交易價格約為 1.9096 美元,根據提供的 Bybit 截圖顯示,漲幅為 13.55%。顯示的 24 小時價格區間為 1.6696 美元至 1.9379 美元,成交額近 352 萬美元。 在 4 小時線圖上,價格高於 MA7 (1.7855 美元)、MA14 (1.7190 美元) 和 MA28 (1.7126 美元)。1 小時線圖確認了看漲排列,所有均線皆位於價格下方。在 15 分鐘線圖上,價格也保持在 MA7 (1.8933 美元)、MA14 (1.8431 美元) 和 MA28 (1.8203 美元) 之上。然而,最新走勢正逼近 1.9379 美元附近的阻力位。 基本面背景:Pieverse 正在為 Web3 企業和 AI 代理商務開發支付基礎設施。其系統專注於可驗證的時間戳記、收據和交易記錄,而其 x402b 支付擴充功能旨在支援機器對機器 (machine-to-machine) 的交易。 PIEVERSE 已提出在治理、質押、平台支付、手續費折扣以及生態系統功能存取方面的應用。重要的區別在於,這些使用案例需要持續的實際採用,才能轉化為持久的代幣需求。 供給風險:白皮書將最大供應量定為 10 億枚代幣,其中 20% 分配給團隊和顧問,15% 分配給投資者,27.6% 用於社群成長,27.4% 用於生態系統和行銷。相當大一部分代幣尚未進入流通,使得代幣歸屬 (vesting) 和解鎖成為重要的變數。 關鍵數據 - Bybit 價格:1.9096 美元 - 24 小時漲跌幅:+13.55% - 24 小時高點/低點:1.9379 美元 / 1.6696 美元 - 市值:約 4.98 億美元 - 流通供應量:約 2.7475 億枚 - 最大供應量:10 億 PIEVERSE - 即時阻力位:1.9379 美元 若能持續突破 1.9379 美元,則可能支撐進一步的上漲空間。若遭拒絕,可能會回測 1.89 美元,隨後是 1.78 美元區域。 Pieverse 能否在未來供應釋出成為更強大的市場阻力之前,將其 AI 支付基礎設施轉化為真實的代幣需求? NFA (非財務建議)。DYOR (做好自己的研究)。 #ByXIMPACT

$HYPEUSDT 展現出有趣的背離:大趨勢仍偏向看空,但在向 $60.063 的急劇流動性掃蕩(liquidity sweep)後,短期買方已開始反擊。關鍵問題在於,這次反彈能否發展成真正的復甦,還是僅僅是另一個賣出良機。 市場結構:根據 Bybit 截圖,HYPE 現價約為 $65.93,下跌 6.16%。24 小時價格區間為 $60.063–$70.737,成交額接近 8411 萬美元。 4 小時線圖依然疲軟:價格低於 MA7 ($67.043)、MA14 ($69.695) 和 MA28 ($70.885)。不過,1 小時線圖有所改善,價格已高於 MA7 ($63.526) 和 MA14 ($64.998),但仍低於 MA28 ($67.340)。在 15 分鐘線上,價格已收復了所有三條均線。這是一個早期的復甦訊號,尚非大週期反轉的確認訊號。 基本面背景:Hyperliquid 具有獨特的價值獲取機制。其協助基金(Assistance Fund)接收 99% 的協議費用,並將其用於從公開市場購買 HYPE。2026 年 9 月的 SEC 文件顯示,已有 4710 萬枚 HYPE 被收購並永久從流通中移除。 另一個重要發展是 HIP-3:截至 2026 年 9 月 8 日,其市場佔據了 Hyperliquid 近 30 天交易量的約 30%,自推出以來累計交易量超過 5481 億美元。HYPE 是 HIP-3 市場部署所需的抵押品,這在產品擴展與代幣需求之間建立了潛在聯繫。 關鍵數據 - Bybit 價格:$65.929 - 24 小時漲跌幅:-6.16% - 24 小時高/低點:$70.737 / $60.063 - 即時阻力位:$67.04–$67.34 - 更高阻力位:$69.69–$70.88 - 反彈支撐位:$63.50–$64.10 - 主要下行參考點:$60.063 若能持續站穩 $67.34,將增強復甦的論點。若在該處遇阻,市場焦點可能會回歸 $63.50,甚至可能再次測試 $60.063。 Hyperliquid 不斷增長的 HIP-3 活動以及以費用資助的 HYPE 回購,能否提供足夠的支撐來克服當前的看空圖表結構? 不構成財務建議 (NFA)。請自行研究 (DYOR)。 #ByXIMPACT

$SOLUSDT is facing a serious market-structure breakdown, and the latest sell-off is raising a bigger question: is this simply a leveraged flush, or is the market repricing Solana's near-term risk? Market Structure: SOL is trading around $67.89 on the supplied Bybit chart, down approximately 12.28% over 24 hours. The displayed 24H range is $67.41–$77.39, with turnover near $82.60M. The 4H chart shows a clear bearish alignment: price is below MA7 ($72.93), MA14 ($76.39) and MA28 ($79.78). The 1H chart is equally weak, with all averages overhead at $69.91, $71.85 and $74.04. On 15M, price remains below MA7 ($68.91), MA14 ($69.28) and MA28 ($70.17). This is not yet a confirmed reversal. Derivatives Warning: A recent CoinGlass snapshot showed approximately $67.73M in 24H SOL liquidations, with 97% coming from longs. Open interest fell 10.83% to around $4.23B, while funding turned negative. This points to substantial long-position unwinding rather than a simple spot-market decline. Fundamental Context: Solana's October ecosystem developments included the Alpenglow mainnet upgrade, targeting approximately 150ms finality, and record RWA value of $5B. Institutional activity also expanded through tokenized funds and payment integrations. These developments strengthen the network's longer-term case, but they do not automatically prevent short-term price weakness. Key Figures - Bybit screenshot price: $67.89 - 24H change: -12.28% - 24H high/low: $77.39 / $67.41 - Immediate support: $67.41 - First resistance: $68.91–$70.17 - Derivatives OI snapshot: $4.23B, down 10.83% - 24H liquidations snapshot: $67.73M, 97% longs A sustained hold above $67.41 could create room for a relief bounce. A breakdown would keep downside risk elevated. Reclaiming $70.17 is an early recovery signal; the 4H averages remain the larger resistance zone. Will Solana's growing institutional adoption be strong enough to counter the current leverage-driven selling pressure? NFA. DYOR. #ByXIMPACT

$DATAUSDT is approaching a critical support area after another leg of selling. The price is down 3.03% on the Bybit screenshot, but the bigger concern is the alignment of the moving averages: sellers still control the 4H and 1H structure, while the latest 15M bounce has not yet reclaimed its full resistance band. Market Structure: DATA is trading around $0.0927, with a 24H high of $0.1002, low of $0.0915 and Bybit turnover of approximately $1.65M. On 4H, price remains below MA7 ($0.0959), MA14 ($0.0961) and MA28 ($0.0978). The 1H chart is similarly weak, with all three averages above price. On 15M, price has recovered above MA7 ($0.0923), but remains below MA14 ($0.0929) and MA28 ($0.0936). This looks more like an early relief bounce than a confirmed trend reversal. Fundamental Context: Data Network has repositioned around AI data infrastructure, focusing on sourcing, consent, provenance and quality verification for human-contributed training data. Its Trace and Poseidon components aim to make data records verifiable and usable by AI developers. The key question is whether this infrastructure can attract sustained customers and real economic activity. Supply Risk: Approximately 361.38M DATA are circulating against roughly 1.035B total supply. Data is also released continuously, with estimated weekly emissions of around 4.02M tokens. That continuing supply can add pressure when market demand is weak. Key Figures - Bybit price: $0.0927 - 24H change: -3.03% - 24H high/low: $0.1002 / $0.0915 - 4H resistance: $0.0959–$0.0978 - Market cap: approximately $33.1M - Circulating supply: approximately 361.38M DATA - 7D performance: approximately -18% A sustained hold above $0.0915 followed by a reclaim of $0.0936 would improve the short-term picture. Losing $0.0915 could extend the decline. Can Data Network turn its AI data infrastructure into enough real demand to overcome continuous token emissions? NFA. DYOR. #ByXIMPACT

NIGHTUSDT 正在蓄勢待發,但最重要的訊號不僅僅是每日 12% 的漲幅。價格已突破近期的盤整區間,且成交量放大,顯示買方正變得更加活躍。現在的挑戰在於,這波走勢能否守住突破區域。 市場結構:NIGHT 目前交易價格約為 $0.05002,根據 Bybit 截圖顯示上漲了 12.13%。24 小時價格區間為 $0.04419–$0.05095,成交額接近 269 萬美元。 4 小時線圖看漲:價格高於 MA7 ($0.04671)、MA14 ($0.04591) 和 MA28 ($0.04495)。1 小時線圖呈現相同的排列,三條均線皆位於價格下方。在 15 分鐘線圖上,價格也高於 MA7 ($0.04971)、MA14 ($0.04927) 和 MA28 ($0.04823)。然而,近期在 $0.05095 附近的拒絕走勢,使得該價位成為需要密切關注的關鍵水平。 基本面背景:Midnight 正在建立一個使用零知識技術、以隱私為中心的區塊鏈。其經濟模型將 NIGHT 與 DUST 區隔開來:持有 NIGHT 可產生 DUST,而 DUST 是用於交易和執行智能合約的可再生資源。這種區別很重要,因為 NIGHT 本身不會直接作為交易 Gas 被消耗。 代幣經濟:Midnight 的官方代幣經濟學規定 NIGHT 的最大供應量為 240 億枚。長期的關鍵問題在於,真實的網路使用量能否為 NIGHT 及其產生 DUST 的實用性創造持續的需求。 關鍵數據 - Bybit 價格:$0.05002 - 24 小時漲跌幅:+12.13% - 24 小時高點/低點:$0.05095 / $0.04419 - 4 小時支撐:$0.04671–$0.04591 - 即時阻力:$0.05095 - 最大供應量:24B NIGHT 若能確認突破 $0.05095,可能會延續看漲走勢。跌破 $0.04671 則會削弱短期結構。 Midnight 能否將其隱私技術轉化為支撐 NIGHT 超越投機動能的真實網路需求? 以上非投資建議 (NFA),請自行做好研究 (DYOR)。 #ByXIMPACT

$CAPUSDT 正顯示出強勁的突破跡象,但從 $0.12993 的急劇回調是一個重要的警告:動能雖然有所改善,但買方仍需證明他們能夠守住這個新的價格區間。 市場結構:CAP 目前交易價格約為 $0.11497,Bybit 截圖顯示上漲 9.45%,24 小時價格區間為 $0.10251–$0.12993,成交額為 10.33M。在 4 小時線圖上,價格位於 MA7 ($0.10843)、MA14 ($0.10599) 和 MA28 ($0.10373) 之上,確認了看漲的均線結構。1 小時線圖同樣保持在三條均線之上,儘管大陽線後的回調顯示出獲利了結的跡象。在 15 分鐘線圖上,價格已跌破 MA7 ($0.11559),但仍高於 MA14 ($0.11214) 和 MA28 ($0.10991)。 項目背景:Cap 是一個結合了數位美元、信貸平台和金融擔保市場的 DeFi 信貸協議。CAP 的設計旨在用於治理以及參與協議收入資助的回購。這在協議活動與代幣價值之間創造了潛在的連結,但實際的收入和回購執行比單純的敘事更重要。 供應風險:目前 CAP 的流通量約為 15.6 億,而最大供應量為 100 億。這意味著目前僅有約 15.6% 在流通,未來仍有巨大的稀釋潛力。因此,在評估強勁的價格走勢時,必須同時考慮採用率和代幣解鎖情況。 關鍵數據 - Bybit 價格:$0.11497 - 24 小時漲跌幅:+9.45% - 24 小時高點/低點:$0.12993 / $0.10251 - 4 小時 MA7/14/28:$0.10843 / $0.10599 / $0.10373 - 市值:約 $1.69 億 - 流通供應量:約 15.6 億 CAP 若能持續站穩 $0.12993 之上,將強化突破的論點。若無法守住 $0.109–$0.112 的區間,可能會引發更深度的回測。 儘管剩餘的解鎖供應量很大,CAP 能否將這次突破轉化為持續增長? 非投資建議。請自行研究。 #ByXIMPACT

$LUNCUSDT is testing the lower edge of its recent trading range, but the three-timeframe structure still favours sellers. At $0.00003664, LUNC is down 2.29% on the Bybit chart, sitting just above the 24H low of $0.00003644. The important question is whether this area attracts genuine buyers or simply becomes another pause before further downside. Market Structure: The 4H chart remains clearly bearish. Price is below MA7 at $0.00003713, MA14 at $0.00003749 and MA28 at $0.00003842. The 1H structure is also weak, with price below all three averages. On 15M, the averages are tightly clustered around $0.00003666–$0.00003679, showing short-term compression rather than a confirmed reversal. Key Levels: Immediate support is $0.00003644. A decisive breakdown could expose lower price discovery. On the upside, $0.00003679 is the first short-term hurdle, followed by $0.00003713–$0.00003749. Reclaiming $0.00003842 would be a more meaningful improvement in the 4H structure. Fundamental and Derivatives Context: LUNC’s circulating supply remains enormous at roughly 5.52 trillion tokens, while its market capitalization is around $200 million. Recent market data also shows negative futures funding and open interest near $13.8 million, suggesting bearish positioning is present. However, negative funding alone does not guarantee a price rebound; sustained spot demand is still needed. Key Figures - Bybit price: $0.00003664 - 24H change: -2.29% - 24H high/low: $0.00003800 / $0.00003644 - 4H resistance: $0.00003713–$0.00003842 - Market cap: approximately $200M - Circulating supply: approximately 5.52T LUNC A hold above $0.00003644 followed by a reclaim of the short-term averages could create room for a relief bounce. Losing support, however, would keep downside pressure dominant. Can LUNC attract enough spot buying to reverse this structure, or will sellers force another breakdown? NFA. DYOR. #ByXIMPACT

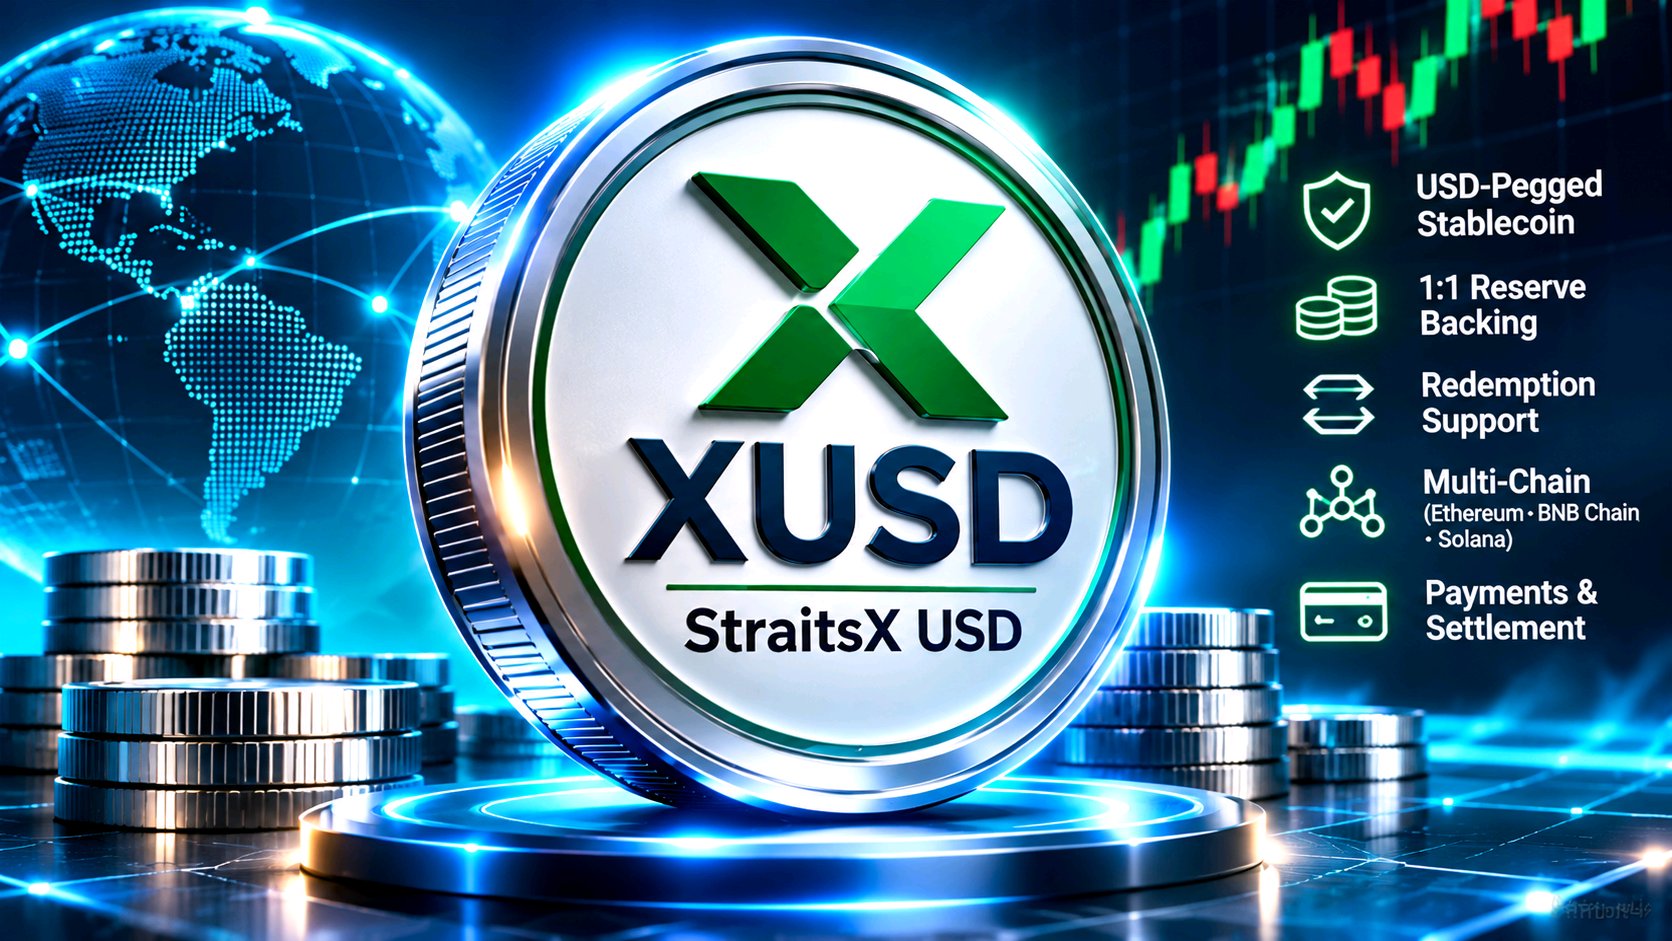
$XUSDUSDT is holding close to its $1.00 peg, but the real test for StraitsX is whether reserve transparency, redemption reliability and growing payment adoption can strengthen confidence in its stablecoin ecosystem. In the supplied Bybit chart, XUSD trades near $1.0007, down approximately 0.04% over 24 hours. Its 24H range is $1.0004–$1.0013, with turnover around $27.83K. The narrow range indicates relative peg stability rather than a conventional bullish or bearish trend. Fundamental Research: Reserve Backing and Real Utility StraitsX states that XUSD is backed by reserve assets equivalent to at least 100% of outstanding tokens. These assets are held in segregated trust accounts for token holders. Eligible users can mint and redeem XUSD through the StraitsX platform at a 1:1 USD reference rate, subject to account verification and applicable conditions. The important distinction is that reserve backing is not the same as guaranteed instant redemption under every circumstance. Reserve quality, banking arrangements and operational access remain essential risks to monitor. XUSD is designed for digital payments, cross-border transfers and business settlement. Its presence across Ethereum and BNB Smart Chain expands its potential reach, but network availability alone does not prove strong payment adoption or deep liquidity. Key Figures - Bybit price: ~$1.0007 - 24H change: ~-0.04% - 24H range: $1.0004–$1.0013 - Bybit turnover: ~$27.83K - Market capitalization: ~$41.13M - 24H market volume: ~$14.24M - Circulating supply: ~41.13M XUSD - Reserve backing requirement: At least 100% - Redemption reference: 1 XUSD = 1 USD - 7D movement: Approximately -0.02% in the latest external snapshot CoinGecko's latest market data also places XUSD close to its dollar peg, reinforcing the importance of stability rather than speculative price appreciation. Bullish Confirmation: Maintaining the $1.00 peg, increasing circulating supply, stronger trading liquidity and consistent reserve reporting would support wider adoption. Bearish Confirmation: A sustained deviation below $1.00, declining liquidity or concerns about reserve accessibility could weaken market confidence. XUSD's long-term success depends on converting stablecoin infrastructure into trusted, recurring payment usage. The real achievement is not a price rally, but reliable dollar access. Can StraitsX turn its multi-chain presence into stronger real-world payment adoption while maintaining confidence in its $1.00 peg? NFA. DYOR. #ByXIMPACT
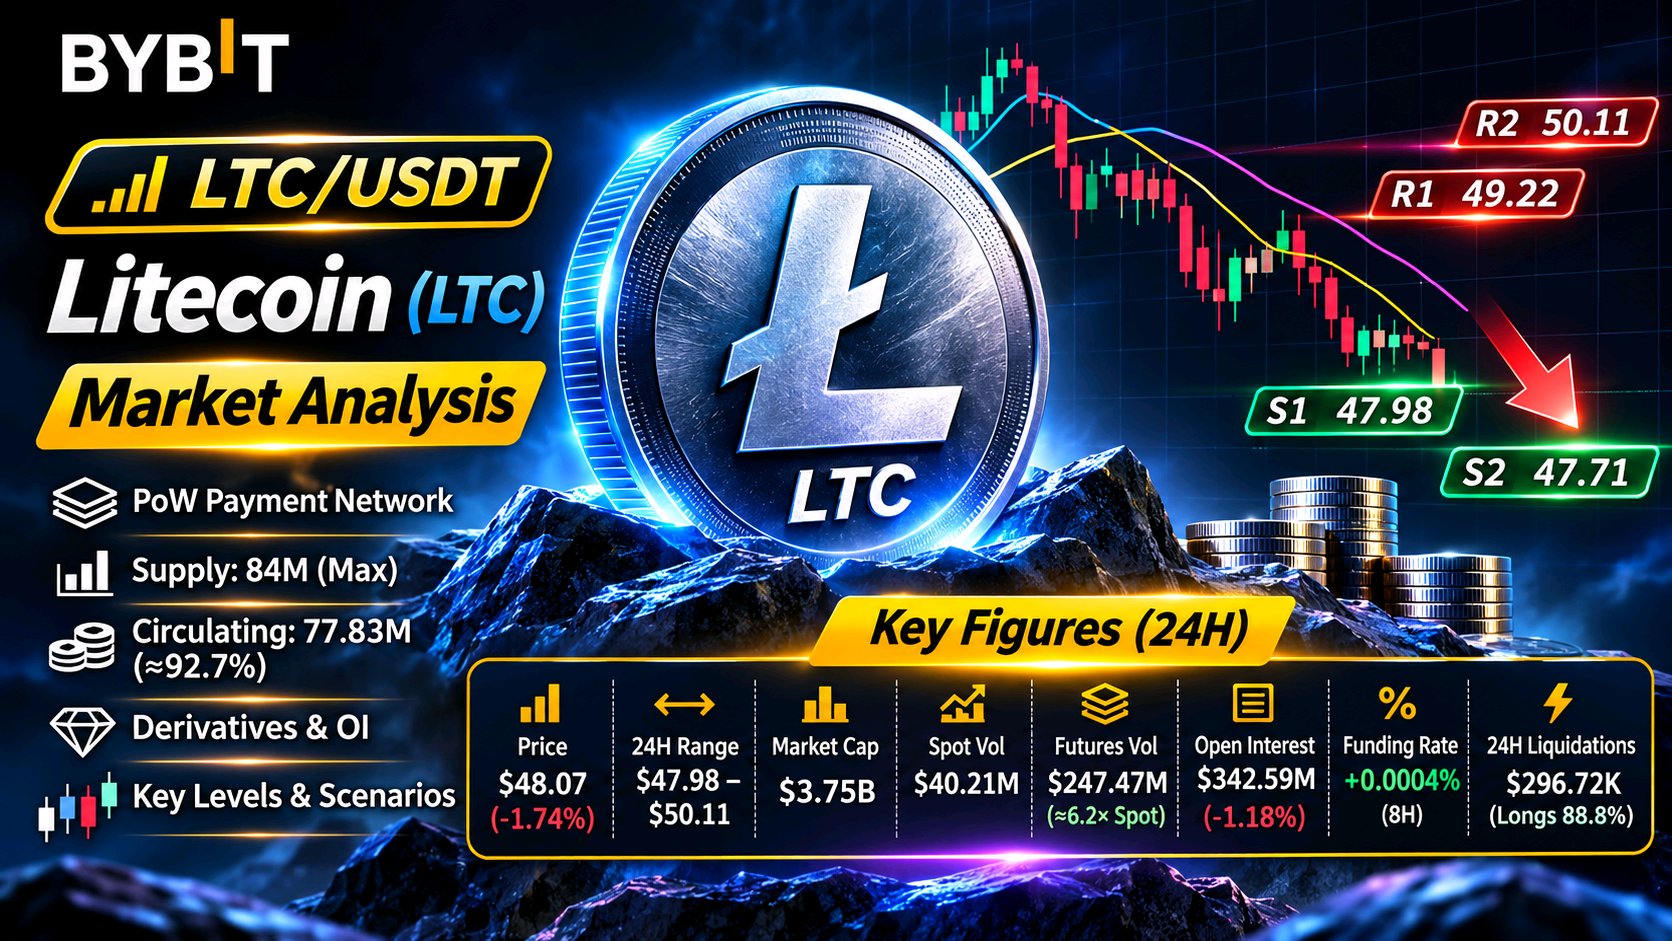
$LTCUSDT is approaching a critical support test: Litecoin has slipped below all three moving averages across the 15M, 1H and 4H charts, while derivatives positioning shows that leveraged activity remains substantially larger than spot trading. The question is whether buyers can defend $47.98 before another downside leg develops. Key Figures — 24H Market Snapshot In the supplied Bybit chart, LTC trades at $48.07, down 1.74%. The displayed 24H high is $50.11, low $47.98, and turnover approximately $3.85M. A separate market-wide snapshot from November 14 reports: - Price: $48.17 - Market capitalization: $3.75B - 24H spot volume: $40.21M - 24H futures volume: $247.47M - 7D performance: -7.55% - Circulating supply: 77.83M LTC - Maximum supply: 84M LTC - All-time high: $412.96, approximately 88.3% above the current price Derivatives Research — Leverage Versus Spot Demand The latest CoinGlass snapshot reports: - Open Interest: $342.59M, down 1.18% over 24H - OI/Market Cap: 9.13% - Weighted Funding Rate: +0.0004% per 8 hours - 24H Liquidations: $296.72K - Long Liquidations: $263.61K - Short Liquidations: $33.10K - Futures/Spot Volume Ratio: approximately 6.2x The important contradiction is that futures volume dominates spot activity while OI is declining. This suggests some existing positions are being reduced rather than a clear expansion of fresh leverage. Long liquidations account for roughly 88.8% of reported liquidations, showing that bullish positions absorbed most of the forced exits. Funding remains close to neutral, so the market is not displaying an extreme funding imbalance. Fundamental Context — Scarcity and Network Utility Litecoin remains a proof-of-work payment network with a fixed maximum supply of 84 million LTC. Approximately 92.7% of that supply is already circulating. Its established payment utility and long operating history support its relevance, but limited supply alone does not guarantee price appreciation. Sustainable demand and actual network usage remain essential. Technical Structure — Three-Timeframe Weakness On 4H, LTC is below MA7 ($48.93), MA14 ($49.11) and MA28 ($49.99). The 1H chart is also bearish, with all averages above price: $48.58, $49.03 and $49.11. On 15M, price remains below MA7 ($48.21), MA14 ($48.48) and MA28 ($48.61). Key Levels and Conditional Scenarios - Immediate support: $47.98–$47.71 - Resistance: $48.38, $48.61 - Stronger resistance: $49.03–$49.22 - Major recovery barrier: $49.99–$50.11 A sustained 1H recovery above $48.61 could open a move toward $49.03 and $49.22. A break above $50.11 would improve the broader recovery case. Conversely, losing $47.71 would expose LTC to further downside. Will Litecoin defend its $47.71–$47.98 support zone, or does declining open interest and heavy long liquidations suggest that the market needs another round of position cleansing? NFA. DYOR. #ByXIMPACT
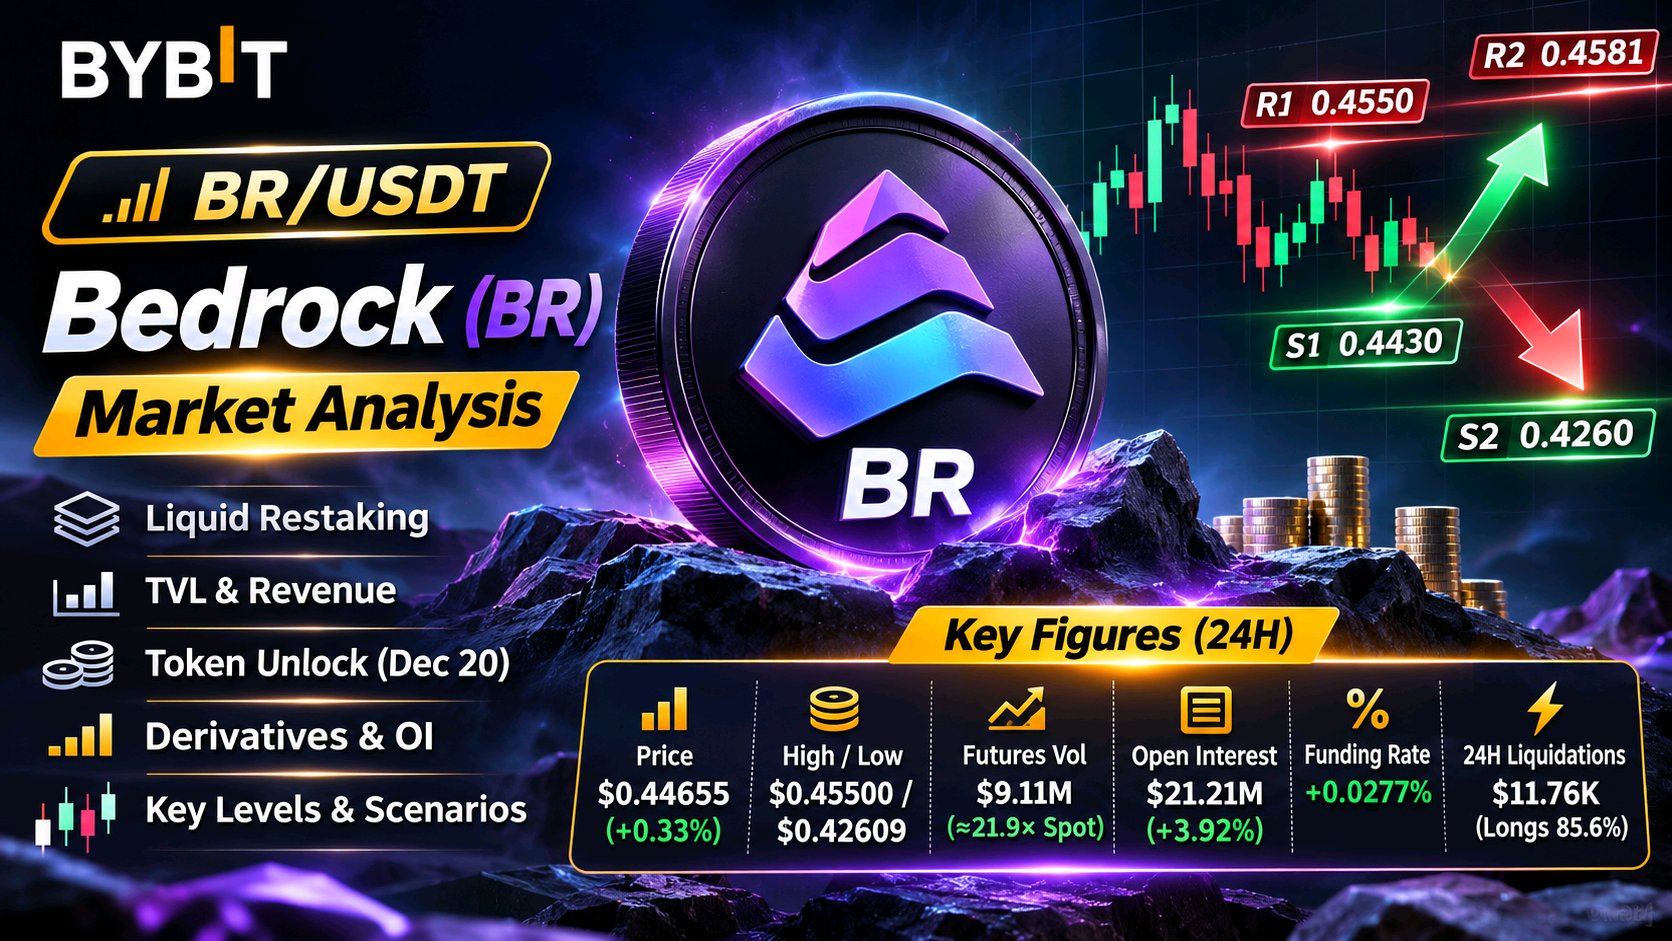
$BRUSDT 正試圖復甦,但衍生品市場發出了警告:期貨交易量幾乎是現貨交易量的 22 倍。真正的考驗在於,這種槓桿活動能否在下一次重大代幣解鎖之前,轉化為持續的現貨需求。 24 小時市場快照:價格與參與度 在提供的 Bybit 圖表中,BR 的交易價格約為 $0.44655,24 小時漲幅約為 0.28%–0.33%。盤中波動範圍為 $0.42609–$0.45500,成交額約為 $138.95K。 同步更新的 CoinGlass 市場快照顯示,其市值接近 $132.14M,24 小時期貨交易量為 $9.11M,現貨交易量為 $415.54K。期貨活動約為現貨交易量的 21.9 倍。 衍生品:部位佈局的重要性 最新數據顯示: - 未平倉合約 (OI):$21.21M,24 小時內上漲 3.92%。 - OI/市值:16.05%。 - 加權資金費率:+0.0277%。 - 24 小時強制平倉:$11.76K — 其中多頭 $10.06K,空頭 $1.71K。 - 現貨淨流量:-$88.5K。 - 期貨淨流量:+$38.6K。 這種組合值得關注。OI 上升伴隨正向資金費率,表明槓桿參與度正在增加,且維持多頭部位需要成本。然而,現貨淨流出與期貨淨流入並存,顯示現貨與衍生品需求並未相互印證。現有的快照未提供可靠的數值化多空比,因此不應臆測該數據。 基本面研究:採用率與代幣價值 Bedrock 的生態系統包括 uniBTC、uniETH 和 uniIOTX,旨在跨多個網路進行流動性再質押。DeFiLlama 報告其 TVL 約為 $281.27M,但在 30 天內下降了 27.4%。同期,協議費用為 $63,041,而協議收入僅為 $6,913。這一差距至關重要:生態系統的活動並不自動轉化為 BR 持有者的同等價值。 供應量是另一個主要考量因素。代幣經濟學追蹤顯示,12 月 20 日將解鎖約 7,080 萬枚 BR,按目前報價計算價值約 $30.9M,相當於最大供應量的 7.1%。如果需求持續疲軟,這可能會造成額外的拋售壓力。 技術結構:三個時間週期 在 4 小時圖上,價格位於 MA7 ($0.44318) 和 MA14 ($0.44414) 之上,但低於 MA28 ($0.45815)。在 1 小時圖上,價格位於 MA7 ($0.44151)、MA14 ($0.44072) 和 MA28 ($0.44277) 之上。15 分鐘結構也呈正面,價格高於 MA7 ($0.44562)、MA14 ($0.44474) 和 MA28 ($0.43959)。 關鍵點位與條件情境 即時阻力位為 $0.44904,其次是 $0.45500 和接近 $0.45815 的 4 小時 MA28。支撐位位於 $0.4430–$0.4410 附近,隨後是 $0.4395、$0.4333 以及圖表的主要低點 $0.42609。 若 1 小時圖出現放量突破 $0.44904,將增強復甦預期。未能守住 $0.4410 將削弱動能,而跌破 $0.42609 則會使此復甦架構失效。 Bedrock 能否在 12 月解鎖增加可用供應量之前,將其槓桿交易活動轉化為真實的現貨需求? 非財務建議。請自行研究。 #ByXIMPACT
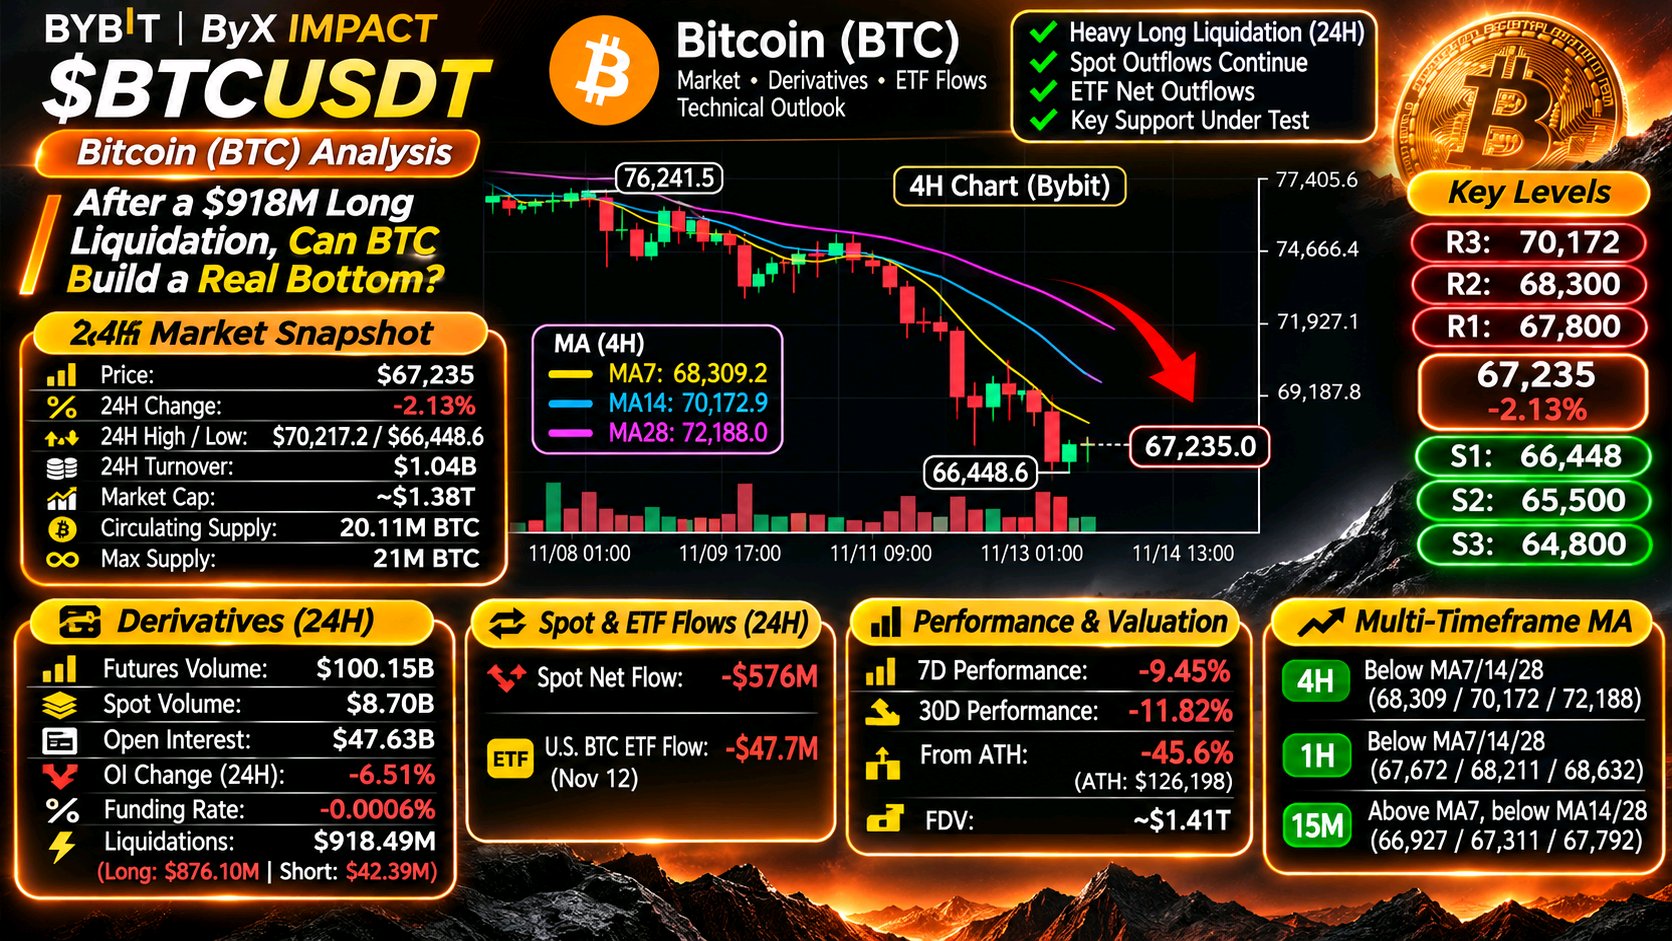
$BTCUSDT 顯示短期買盤與整體市場趨勢之間存在危險的差距。比特幣已從 66,448.6 美元反彈,但復甦力道仍難以突破其關鍵移動平均線。重要的問題在於,這究竟是真正的積累,還是槓桿交易者被迫出場後的暫時停歇。 24 小時市場快照 — 關鍵數據 - 價格:$67,235 - 24 小時跌幅:-2.13% - 24 小時高點:$70,217.2 - 24 小時低點:$66,448.6 - Bybit 截圖成交額:約 10.4 億美元 - 市值:約 1.38 兆美元 - 流通供應量:約 2,011 萬 BTC - 最大供應量:2,100 萬 BTC - 7 日表現:約 -9.45% 衍生品:槓桿失衡 報告顯示 24 小時衍生品數據中,BTC 期貨未平倉合約約為 476.3 億美元,下降了 6.51%。期貨交易量達到約 1,001.5 億美元,相比之下現貨交易量為 87 億美元。 加權資金費率略微為負,報 -0.0006%。比特幣總清算額據報接近 9.1849 億美元,其中約 8.761 億美元來自多頭部位。 這是一個被忽視的細節:多頭交易者承擔了大部分的清算壓力,但市場尚未建立令人信服的反轉。強制拋售可以減少過度槓桿,但僅憑這一點無法創造持久的需求。 現貨需求與機構倉位 24 小時現貨資金流向報告顯示,BTC 淨流出約 5.76 億美元。美國現貨比特幣 ETF 在 11 月 12 日也記錄了約 4,770 萬美元的淨流出。這些數據表明,在復甦趨勢值得信任之前,機構和現貨需求仍需改善。 技術結構 — 三個時間框架 4 小時圖維持看跌:BTC 位於 MA7 ($68,309)、MA14 ($70,172) 和 MA28 ($72,188) 下方。 1 小時圖也顯示價格低於 MA7 ($67,672)、MA14 ($68,211) 和 MA28 ($68,632)。在 15 分鐘圖上,價格已回升至 MA7 ($66,927) 之上,但這僅是短期改善。 關鍵點位 — 條件式交易計畫 - 支撐位 S1: $66,448 - 支撐位 S2: $65,500 - 支撐位 S3: $64,800 - 壓力位 R1: $67,800 - 壓力位 R2: $68,300 - 壓力位 R3: $70,172 - 看漲確認:4 小時線收於 $68,300 上方,且伴隨更強成交量 - 看跌確認:持續跌破 $66,448 若反彈得到確認,可能會開啟邁向 $69,187 和 $70,172 的路徑。若失守 $66,448,下行壓力將持續存在。這些是條件性場景,而非保證目標。 真正的問題是:在經歷如此大規模的多頭清算事件後,現貨買家最終會進場嗎?還是比特幣仍容易受到另一波下行走勢的影響? 非投資建議 (NFA)。請自行研究 (DYOR)。 #ByXIMPACT